quality - ulisboa · the concept of cost of quality –coq –is simple yet central to ... toyota...
TRANSCRIPT

Quality
Costs of Quality-CoQ
DEG/FHC 1

DEG/FHC 2
Cost of Quality-CoQ
The concept of Cost of Quality – CoQ – is simple yet central to
Quality. It attaches a monetary value to quality activities.
Therefore, the organization can direct its efforts to where it
matters most.
Feigenbaum introduced this theme in 1957 with the
Prevention+Appraisal+Failure model (PAF)
(early studies started in 1943).
Philip Crosby popularized the use of CoQ in his book Quality is
Free in 1979.
Several current quality system standards, ISO 9000, QS-9000,
AS-9000, reference the use of CoQ for quality improvement.
Other models include ABC approach (Activity Based Costing)
and the Process Approach

DEG/FHC 3
Cost of Quality-CoQ

DEG/FHC 4
Internal Failure Costs (also known as Costs of Poor Quality-CoPQ)
Internal failure costs are costs that are caused by products orservices not conforming to requirements or customer/user needsand are found before delivery of products and services to externalcustomers.They would have otherwise led to the customer not beingsatisfied. Deficiencies are caused both by errors in products andinefficiencies in processes. Examples include the costs for:
Rework
Delays
Re-designing
Shortages
Failure analysis
Re-testing
Downgrading
Downtime

DEG/FHC 5
External Failure Costs(also known as Costs of Poor Quality-CoPQ)
External failure costs are costs that are caused by deficiencies
found after delivery of products and services to external
customers, which lead to customer dissatisfaction. Examples
include the costs for:
Complaints
Repairing goods and redoing services
Warranties
Customers’ bad will
Losses due to sales reductions
Environmental costs
Fines
Recent cases: Toyota recalls, GM car model ignition switch,…

DEG/FHC 6
Prevention Costs
Prevention costs are costs of all activities that are designed to
prevent poor quality from arising in products or services.
Examples include the costs for:
Quality planning (including product and process
design)
Supplier evaluation
New product review
Error proofing
Capability evaluations
Quality improvement team meetings
Quality improvement projects
Quality education and training
…

DEG/FHC 7
Appraisal Costs
Appraisal costs are costs that occur because of the need to
control products and services to ensure a high quality level in all
stages, conformance to quality standards and performance
requirements. Examples include the costs for:
Checking and testing purchased goods and services
In-process and final inspection/testing
Field testing
Product, process or service audits
Calibration of measuring and test equipment

DEG/FHC 8
CoQ-The total quality costs
The Total Quality Costs are then the sum of these costs.They represent the difference between the actual cost of aproduct or service and the potential (reduced) cost given nosubstandard service or no defective products.
Many of the costs of quality are hidden and difficult to identify by
formal measurement systems. The iceberg model is very often
used to illustrate this matter: only a minority of the costs of poor
and good quality are obvious – appear above the surface of the
water. But there is a huge potential for reducing costs under the
water. Identifying and improving these costs will significantly
reduce the costs of doing business.

DEG/FHC 9
The Iceberg Model of Cost of Quality
Figure 2: The Iceberg Model of Cost of Quality

DEG/FHC 10
CoQ-Traditional View

CoQ (contemporary view)
DEG/FHC 11

Generic CoQ models and cost categories (A literature survey of Cost of Quality models-Vaxevanidis, Petropoulos-Journal of
Engineering Annals-2008 )
PAF models: Prevention + Appraisal + Failure
Crosby’s model : Prevention + Appraisal + Failure + Opportunity
Opportunity or intangible cost models:
Conformance + Non-conformance ;
Conformance + Non-conformance + Opportunity
Tangibles + Intangibles
PAF (failure cost includes opportunity cost)
Process cost models: Conformance + Non-conformance
Activity Based Costing (ABC) models:
Value-added + Non-value-added
DEG/FHC 12

Examples of detailed metrics for CoQInternational Journal of Quality and Reliability Management, Vol.23, No.4, 2006
Cost of assets and materials
Cost of preventive labour
Cost of appraisal labour
Cost of defects per 100 pieces
Cost of late deliveries
% of repeat sales
Time between service calls
Number of non-conforming calls
Number of complaints received
DEG/FHC 13

Global metrics for CoQ
International Journal of Quality and Reliability Management, Vol.23, No.4, 2006
RoQ = increase in profit / cost of quality improvement program
Quality rate = input – (quality defects + startup defects + rework) / input
Process quality = (available time – rework time) / available time
First time quality (% product with no rework)
-----------------------------------------------------------------------------------
Total CoQ/Sales
CoPQ/Sales
CoQ/Sales
CoPQ/Total CoQ
Other relevant (e.g., individual proportion of a CoQ or a CoPQ )
DEG/FHC 14
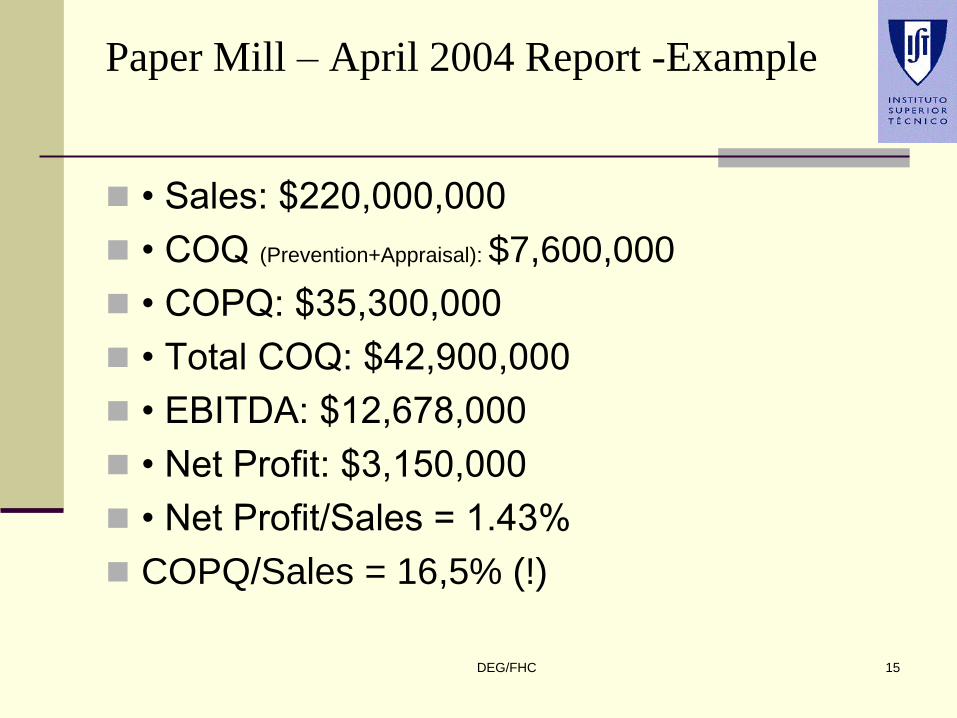
Paper Mill – April 2004 Report -Example
• Sales: $220,000,000
• COQ (Prevention+Appraisal): $7,600,000
• COPQ: $35,300,000
• Total COQ: $42,900,000
• EBITDA: $12,678,000
• Net Profit: $3,150,000
• Net Profit/Sales = 1.43%
COPQ/Sales = 16,5% (!)
DEG/FHC 15

COPQ Estimate (% of sales)
• 20-30% for manufacturing firms
• 30-50% for service firms Baatz, E.D. “What is Return on Quality, and Why You Should Care,”
Electronic Business, Oct. 1992,p. 61.
• 25% for U.S. companies
• 5% for Japanese companies Band, William. “Marketers Need to Understand the High Cost of Poor
Quality.” Sales and Marketing Management in Canada. Nov. 1989: 56-59.
DEG/FHC 16

Main references
The Certified Manager of Quality Handbook-
Westcott (Introd,Ch. 13)
Quality Mgt-Goetsch/Davies (Ch. 2)
Juran´s Quality Handbook-Juran/De Feo
DEG/FHC 17