quantal release of serotonin
TRANSCRIPT
Neuron, Vol. 28, 205–220, October, 2000, Copyright 2000 by Cell Press
Quantal Release of Serotonin
Major advances in the understanding of presynapticDieter Bruns,*‡ Dietmar Riedel,*mechanisms are hampered by the necessity to recordJurgen Klingauf,† and Reinhard Jahn*postsynaptic responses in order to infer presynapticMax-Planck Institute for Biophysical Chemistryevents. To overcome this limitation, we used carbon*Department of Neurobiology andfibers as electrochemical detectors that allow us to mea-†Department of Membrane Biophysicssure the amount of neurotransmitter released by a vesi-Am Fassberg 11cle directly. As a model system, we have chosen RetziusD-37077 Gottingencells that represent large serotonergic neurons and thatGermanycan be readily isolated from the CNS of the leech (Hirudomedicinalis). These neurons retain their capability tosynthesize, store, and release 5-HT when they are grownin isolation (Henderson, 1983). In a previous study (Bruns
Summary and Jahn, 1995), we adapted amperometric recordingsto monitor serotonin release from individual Retzius neu-
We have studied the origin of quantal variability for rons in culture. We characterized distinct classes ofsmall synaptic vesicles (SSVs) and large dense-cored amperometric signals that are due to exocytosis of SSVsvesicles (LDCVs). As a model, we used serotonergic and LDCVs present in these neurons.Retzius neurons of leech that allow for combined amp- Here, we have explored the question to what extenterometrical and morphological analyses of quantal variations in quantal transmitter release from both the
SSVs and the LDCVs are related to the size variabilitytransmitter release. We find that the transmitterof the corresponding secretory organelle. For this, weamount released by a SSV varies proportionally to theused a combination of electron microscopy and carbonvolume of the vesicle, suggesting that serotonin isfiber amperometry. It will be shown that SSVs andstored at a constant intravesicular concentration andLDCVs exhibit a differential subcellular distribution be-is completely discharged during exocytosis. Transmit-tween the axon and the soma. In close correlation, weter discharge from LDCVs shows a higher degree ofobserve a distinct pattern of amperometric signals atvariability than is expected from their size distribution,axonal and somatic recording sites that parallels theand bulk release from LDCVs is slower than releasesubcellular distribution of SSVs and LDCVs betweenfrom SSVs. On average, differences in the transmitterthese cellular regions. On average, the differences inamount released from SSVs and LDCVs are propor-quantal size observed for SSV and LDCV exocytosis
tional to the size differences of the organelles, sug- correlate well with the size differences of the secretorygesting that transmitter is stored at similar concentra- organelles. The amount of transmitter released from ations in SSVs and LDCVs. SSV varies proportionally to the volume of the vesicle,
whereas transmitter discharge from LDCVs shows aIntroduction higher degree of variability than expected from its size
distribution.The vesicle hypothesis of chemical transmission pro-poses that neurotransmitter is discharged in multimo- Resultslecular packets from synaptic vesicles. In most centralneurons, the postsynaptic response to such a single SSVs and LDCVs Are Differentially Distributedpacket of neurotransmitter shows wide variations in am- between Axon and Somaplitude (Bekkers et al., 1990; Raastad et al., 1992; Liu The typical ultrastructural features of a cultured Retziuset al., 1999). Despite intensive research, the origin of cell are shown in Figure 1. A survey of the axon and thequantal variability has remained controversial (Redman, soma reveals that clusters of SSVs (arrowheads) are1990; Korn and Faber, 1991; Stevens, 1993; Frerking exclusively found in the axon, whereas LDCVs are pres-and Wilson, 1996). Evidence has been presented that ent at both cellular regions (compare Figures 1A andquantal response is limited by the availability of postsyn- 1E). It should be noted that the axon stump consists ofaptic receptors (Edwards et al., 1990; Tang et al., 1994; a central cylinder that sends out lateral arborizationsTong and Jahr, 1994; Auger and Marty, 1997), sug- forming a condensed network of axonal endings (datagesting that transmitter concentrations in the synaptic not shown). Many axonal extensions that contain clus-cleft are generally sufficient to produce saturation of the ters of SSVs are found on the surface of the axon stump,affected receptor population. Other studies suggested, making them directly accessible to carbon fiber ampero-rather, that quantal variability is due to variations in the metry (Figures 1A–1D). Within such terminal regions,amount of released transmitter producing nonsaturating SSVs are clustered directly opposing the plasma mem-concentrations of transmitter in the synaptic cleft (Frerk- brane. LDCVs often surround those clusters but are alsoing et al., 1995; Silver et al., 1996; Liu et al., 1999). found scattered throughout the cytoplasm. Morphologi-Thus, quantal variability at synapses in the CNS can be cal structures that resemble closely these putative re-dominated either by pre- or postsynaptic mechanisms, lease sites have been seen in junctions formed betweendepending on the preparation under study. presynaptic Retzius cells and postsynaptic P cells (Kuf-
fler et al., 1987). Occasionally, axon terminals exhibitactive zone–like thickenings (electron-dense bars) to‡ To whom correspondence should be addressed (e-mail: dbruns@
mpibpc.gwdg.de). which rows of SSVs in direct contact with the plasma

Neuron206
Figure 1. Subcellular Distribution of SSVs and LDCVs in Retzius Cells
(A) Electron micrograph depicting several clusters of SSVs located at superficial and underlying structures (arrowheads) at the tip of the axon.Note the less tightly clustered distribution of LDCVs (arrow). LDCVs often surround SSV clusters in a capped arrangement. Scale, 1 mm.(B) Sample cluster of SSVs at high magnification. SSVs outnumber LDCVs within an axon terminal. Some SSVs (arrow) are immediately adjacentto the plasma membrane. It should be noted that several SSV profiles can be seen to be partially filled with electron-dense material followingsequential glutaraldehyde-osmium fixation. The osmiophilic product likely results from a direct oxidation of 5-HT or its aminergic analogswithin their storage sites (Tranzer and Thoenen, 1967; Hokfelt, 1968; Arluison and de la Manche; 1980; Fried et al., 1981). Further experimentswill address this finding in more detail (see below). Scale, 250 nm.(C and D) Two consecutive sections (thickness, 80 nm). SSVs are found in direct contact with the plasma membrane (arrowheads) and inclose apposition with a presynaptic dense bar indicating an active zone ([D], flanked by arrowheads). Scale, 250 nm.(E) Survey of the soma of a Retzius cell. LDCVs are concentrated in perinuclear regions (left side) that are enriched with Golgi complexes andlysosomes (L). The concentric orientation of LDCVs around the nucleus and their sparse distribution at the somatic periphery agrees with thedistribution pattern of LDCVs in vivo (Rude et al., 1969). Scale, 1 mm.(F) Only a few LDCVs are observed in the vicinity of the somatic plasma membrane. Scale, 500 nm.
membrane are aligned (see consecutive sections in Fig- clear regions enriched with prominent Golgi complexesand endoplasmic reticulum (Figure 1E). The density ofures 1C and 1D). Evidently, morphological specializa-
tions characteristic of mature release sites are main- the LDCVs decreases toward the plasma membrane,and only a few granules were observed in its directtained when Retzius cells grow in isolation. In general,
the spatial organization of SSVs and LDCVs provides a vicinity (Figure 1F). A similar distribution pattern ofLDCVs has been observed in these neurons in situ (Rudepicture that is strikingly similar to those seen at seroton-et al., 1969).ergic synapses in the vertebrate CNS (Beaudet and De-
scarries, 1981; Chazal and Ralston, 1987; Moukhles etal., 1997). While both LDCVs and SSVs are found at Morphometric Analysis of Secretory Organellesaxonal sites, the somata of the neurons contain only On electron micrographs, obtained with a carefully cali-
brated microscope, we determined the cross-sectionalLDCVs. Here, these vesicles are concentrated in perinu-

Quantal Characteristics of Serotonin Release207
Figure 2. Sizes of SSVs and LDCVs in RetziusCells
Distribution of SSV diameters ([A], n 5 404)and LDCV diameters at axonal ([C], n 5 494)and somatic ([D], n 5 276) sites. (B) Size distri-bution of SSVs entirely contained within an80 nm section (as judged from serial sections,n 5 270; 2 cells, 8 section series). The redcurve fitted to each of the distributions (A–D)is a Gaussian with the parameters indicatedin Table 1. Data of (A), (C), and (D) collectedfrom 4 cells.
diameters of the different vesicle types (see Experimen- accurate estimate of vesicle size in our experiments.The size variability of the secretory organelles is reason-tal Procedures). The SSV profiles have a mean diameterably well approximated with Gaussian distributions,of 40.9 6 5.5 nm (Figure 2A). The size distribution of SSVsagreeing with reports in other preparations (Bekkers etclosely resembles that observed in other preparationsal., 1990; Lagnado et al., 1996; Lenzi et al., 1999; Plattner(Palay and Chan-Palay, 1974; Bekkers et al., 1990;et al., 1997).Zhang et al., 1998). The average diameter of LDCVs in
the axon is 76.0 6 13.3 nm, about two times larger thanSSVs Serve as Aminergic Storage Organellesthat of SSVs. LDCVs in the soma have a mean diameterA large number of different experimental approachesof 88.7 6 15.8 nm and are significantly larger than theirhave firmly established the aminergic character of Ret-axonal counterparts (Student’s t test, p , 0.001; Figureszius cells (Rude et al., 1969; McAdoo and Coggeshall,2C and 2D). The different diameters of somatic and axo-1976; Lent et al., 1979; Henderson, 1983). These studiesnal LDCVs calculate to a nearly 1.6-fold larger volumesuggested that serotonin is the major, if not the only,of somatic LDCVs. The mean diameters corrected for aclassical transmitter contained in these neurons. Immu-section thickness of 50 nm (Parsons et al., 1995) arenoelectron microscopy demonstrated that serotonin isgiven in Table 1. We also determined the mean outerpresent in dense-cored vesicles (Kuffler et al., 1987).diameter of SSVs that are entirely contained within anThe fixation protocol used to preserve antigenecity did80 nm section, as judged from examination of serialnot allow for preservation of SSVs. Here, we employedsections (Figure 2B). The latter approach revealed apermanganate as a fixative to show that SSVs serveslightly narrower size distribution of SSV profiles. Theiras aminergic storage organelles. Permanganate reactsaverage (46.3 6 4.9 nm) agrees with the calculated diam-specifically with biogenic amines, forming an electron-eter, showing that the correction procedure renders andense precipitate within aminergic but not within othertypes of storage organelles (e.g., cholinergic; Hokfeltand Jonsson, 1968; Klein et al., 1982; Thureson-Klein,Table 1. Diameters of SSVs and LDCVs in Serotonergic Retzius
Cells 1983).In fact, an electron-dense precipitate is frequently ob-Number of Corrected
served in SSVs when Retzius cells are fixed with perman-Vesicle Type Profiles Diameter (nm) Diameter (nm)ganate (Figure 3A). A similar reaction product is seen
SSV 404 40.9 6 5.5 45.6 when en bloc staining with uranyl acetate is omitted,SSV2 270 46.3 6 4.95 — indicating that the precipitate depends on permanga-LDCV-Axon 494 76.0 6 13.3 88.1
nate (data not shown). Cholinergic AE motoneronsLDCV-Soma 276 88.7 6 15.8 103.7(Sargent, 1977), isolated from the CNS of the leech, were
Measurements are given as mean 6 SD. Diameters are obtained cultured and processed in parallel to serve as controls.from the Gaussian fits shown in Figure 2 and are corrected for As expected, all SSV profiles seen in these neuronssection thickness (50 nm) according to Parsons et al. (1995). SSV2, remain electronlucent (Figure 3B). These results suggestmean diameter of SSVs that are entirely contained within an 80 nm that electron opacity of SSVs in Retzius cells is relatedsection.
to their amine content.

Neuron208
Figure 3. SSVs Serve as Aminergic StorageOrganelles in Retzius Cells
(A) SSVs in Retzius cells contain electron-dense cores of varying size after fixation inpermanganate. A few LDCVs (arrow) are alsopresent.(B) SSVs found in the axon of cholinergic AEmotoneurons remain translucent when fixedwith permanganate. m, multivesicular body.Scale (A and B), 500 nm. Insets, double mag-nification of the indicated regions (arrow-heads) in (A) and (B).(C–E) Electron-dense cores frequently seenin SSVs of control Retzius cells (C) are absentin SSV profiles of reserpine-treated Retziuscells (D) or AE motoneurons (E). Electron den-sity of LDCVs (arrows) is unchanged after re-serpine treatment. Scale (C–E), 250 nm.(F–H) Effects of reserpine on the serotonincontent of Retzius cells shown by fluores-cence micrographs of cells processed in par-allel to our electron microscopy shown in (C)–(E). Staining of control Retzius cells (F) byglyoxylic acid technique produced a 5-HT-specific fluorescence in the soma and thestump of the Retzius cell that is strongly re-duced in reserpine-treated Retzius cells (G)and absent from AE motoneurons ([H], 2 mo-toneurons shown). Staining with glyoxylicacid was performed using the technique de-scribed by Dietzel and Gottmann (1988). Fluo-rescence was viewed with filter combinationBP 400, FT 460, LP 470 under a Zeiss fluores-cence microscope using a mercury vaporlamp. Scale (F–H), 60 mm.(I) Percentage of electrondense SSV profilesper vesicle cluster observed in Retzius cells(control: 3 cells, 32 clusters, 680 vesicles; re-serpine treated: 3 cells, 34 clusters, 660 vesi-cles) and AE motoneurons (3 cells, 17 clus-ters, 590 vesicles).
To verify this observation, Retzius cells were cultured Fried et al., 1981). Taken together, the results indicatethat in Retzius neurons SSVs serve, in addition to LDCVsfor 2 days in the presence of 1 mM reserpine, an inhibitor
of vesicular monoamine uptake. This treatment reduces (Kuffler et al., 1987), as aminergic storage organelles.greatly the occurrence of electron-dense precipitates inSSVs (compare Figures 3C and 3D). On average, theproportion of electron-dense SSV profiles per cluster Quantal Release at Axonal Sites
Exocytosis of SSVs occurs more frequently and moredecreases about 15-fold from 84% in control cells to5% in reserpine-treated neurons (Figure 3I). Transmitter rapidly than exocytosis of LDCVs when Retzius cells are
stimulated with single action potentials (Bruns and Jahn,depletion is verified by staining Retzius cells with theglyoxylic acid technique (Torre and Surgeon, 1976), 1995). This observation may be a consequence of the
different spatial organization of the vesicle types withinwhich revealed less serotonin-specific fluorescence inreserpine-treated Retzius cells than in untreated cells the axon terminal, as shown in Figure 1. To facilitate
the stimulation of both SSV and LDCV exocytosis, we(Figures 3F and 3G). These results are consistent withour previous observation showing that reserpine treat- applied the Ca21 ionophore ionomycin, which should
cause a long-lasting and spatially uniform intracellularment abolishes synaptic signaling between Retzius andP cells (Bruns et al., 1993). In contrast to SSVs, LDCVs Ca21 rise. Viability of the neurons, as judged from a
normal resting potential (50–60 mV) and action potentialmaintained their electron-dense content after reserpinetreatment. This result agrees with reports of similar stud- wave forms, was verified in all experiments by recording
the actual membrane potential with an additional micro-ies on sympathetic nerve cells, suggesting that factorsother than amine transmitter content are responsible for electrode. In the first set of our experiments, the tip of
a carbon fiber was manipulated to the distal end of thethe electron density of LDCVs (Till and Banks, 1976;

Quantal Characteristics of Serotonin Release209
Figure 4. Amperometric Events Evoked byIonomycin at the Axon of a Retzius Cell
(A) Superfusion of the cell with ionomycin (2.5mM; bar) triggers a strong increase in the fre-quency of amperometric spikes that progres-sively returns to baseline levels (0.02–0.05 Hz)upon superfusion with Ringer’s solution(wash). The mean frequency of events isabout 4.3 Hz between 15 and 150 s after onsetof ionomycin application. The extended timescale shows that amperometric signals areresolved as discrete spikes. Application ofthe ionophore did not change the restingmembrane potential (data not shown) mea-sured with an additional microelectrode.(B) Transient oxidation currents taken fromthe recording in (A) as indicated with corre-sponding numbering in the extended trace.Traces (2) and (3) show small and rapid cur-rent transients that comprise the majority ofexocytotic events in this recording and thatare due to transmitter release from singleSSVs. LDCV fusion events (as judged fromtheir large quantal size, traces [1] and [4]–[7])are often preceded by a “foot” signal thatarises presumably from leakage of transmit-ter through a slowly dilating fusion pore.
axon stump of a single Retzius cell. The carbon fiber was well as significantly larger events with a more variabletime course that are likely due to transmitter release frombrought into direct contact with the plasma membrane in
order to minimize diffusional loss of released transmitter SSVs and LDCVs, respectively. The charge distribution,derived from the integral of the oxidative current spikesand temporal distortion of the transmitter signal. Su-
perfusion of the neuron with Ringer’s solution containing in 12 cells, shows a strong peak at small values of about3 fC and a significant fraction of larger responses (Figure2.5 mM ionomycin causes, after variable delays of 2–10
s, a strong increase in the frequency of amperometric 5A). Consistent with our previous observations (Brunsand Jahn, 1995), charge values are broadly spread inspikes (Figure 4A). In the presence of the ionophore,
exocytosis proceeds at a rather constant rate (3.1 6 1.9 a skewed, non-Gaussian distribution. If the molecularmechanism for loading of transmitter into the vesiclesevents/s, n 5 12) and slowly declines to baseline levels
when ionomycin is removed by continuous washing with operates until a limiting concentration is achieved, thenthe amount of transmitter stored in a vesicle shouldRinger’s solution. As shown in Figure 4, oxidative current
transients can be resolved as discrete events even at vary with the cube of the vesicle diameter. A cubic roottransformation of the charges reveals an obvious bi-times of high activity. In agreement with our morphologi-
cal observations, the evoked response is comprised of modal distribution (Figure 5B) that is well approximatedwith two Gaussian distributions, as expected for trans-exocytotic events that differ with respect to their charge
and amplitude. We observed small and rapid events as mitter release from differentially sized vesicle popula-

Neuron210
Figure 5. Characteristics of Amperometric Signals at Axonal Recording Sites
(A) Charge distribution derived from the time integral of transient oxidation currents stimulated by ionomycin. The bimodal distribution hasits peak between 2 and 4 fC and shows a significant “tail” of large event responses ranging up to 150 fC. Data were collected from 12 cells(4738 events; bin width, 1.0 fC). Inset, charge distribution of the small events (0.2–8.0 fC) shown at a bin width of 0.5 fC.(B) Frequency distribution of the cube-rooted amperometric spike charge of the data shown in (A). The distribution is well approximated bythe sum of two Gaussian distributions (continuous red curve) with the following parameters: Nsmall 5 2472 events, meansmall 5 1.36 fC1/3, CVsmall 5
0.15; Nlarge 5 2244, meanlarge 5 2.82 fC1/3, CVlarge 5 0.29. The Gaussian fit provides an adequate description of the data over the entire rangeof charges as judged from the relative residuals plotted on top of (B). Dashed red curve: extrapolation of the right-hand Gaussian fit showingthe presumptive contribution of the larger event type to the data range ,8 fC.(C) Distribution of latency times (Dt) between successive events (measured as shown in the inset; scaling: 25 ms, 5 pA). The solid line representsan exponential probability density function: f(t) 5 t21e2t/t multiplied with the total number of observations (n 5 607) and the bin width (50 ms).(D) Plot of the mean frequency of small events (,8.0 fC) against the mean frequency of large events (.8.0 fC) measured between 40 and 80s after the onset of ionomycin application. Data are collected from 12 cells. A linear regression is fitted to the data (dashed line).
tions. The cube-rooted quantal size of the larger events Using the fitted time constant (t 5 0.24 s) we calculatedthe probability of observing two small events within a(2.82 6 0.81 fC1/3) is, on average, about 2-fold largertime period that equals the mean half-width of a largethan that of the smaller event type (1.36 6 0.2 fC1/3).event (t 5 3110 ms) as 0.01. This will not change theAn alternative interpretation of these signals, althoughmajor characteristics of the frequency distribution andunlikely, could be that events with a larger charge areagrees with the visual inspection of the current trace,made up of several small events fusing simultaneouslysuggesting that the great majority of the exocytoticwith the plasma membrane. To examine this possibility,events are recorded as discrete signals (Figure 4A). Thewe calculated the probability of observing overlappingprobability that several vesicles (z7 small events arefusion events from our records. For this, the latencyneeded to mimic the average charge integral of a largetimes between consecutive fusion events during theevent) would fuse so close together is extraordinarilyconstant phase of exocytotic activity (between 15 andlow [P(t) 5 4.8 · 10212], suggesting that large events150 s of the recording in Figure 4A; mean rate: 4.29reflect an entity different from small events. As judgedevents/s) is constructed. The resulting histogram is wellfrom the inflection point (8 fC) in the charge distributiondescribed with a single exponential fit, suggesting that(Figure 5B), we defined small (,8 fC) and large eventsthe release process is a Poisson process (Figure 5C).(.8 fC) as different exocytotic event types reflectingThe probability of finding two events within a singlethe exocytosis of SSVs and LDCVs, respectively. Thismeasurement period (Colquhoun and Sigworth, 1995) isdistinction holds with a limited accuracy as estimatedgiven by:from the relative areas of the single Gaussian curves(6.5: 1) below 8 fC (Figure 5B, dashed line). The frequen-P(time interval # t) 5 1 2 e2t/t.

Quantal Characteristics of Serotonin Release211
Figure 6. Properties of Amperometric Signals Triggered by Ionomycin Application at Somatic Membranes
(A) Application of ionomycin (2.5 mM, bar) stimulates only the larger event type at somatic membranes. Numbers denote representative eventsthat are shown in (B) on an extended time scale.(B) The quantal size and the kinetic properties of somatic events (see also Figure 7) suggest that release signals are due to transmitterdischarge from LDCVs.(C) Charge distribution of amperometric signals is unimodal and lacks the peak observed between 2 fC and 4 fC at axonal recording sites(compare Figure 5A). Data were collected from 12 cells (1084 events, 9 cells with two applications of ionomycin).(D) The distribution of the cube root of amperometric spike charges is approximated with a single Gaussian curve (red curve, mean 5 3.3fC1/3, CV 5 0.27); relative residuals are plotted on top.
cies of small and large events observed in ionomycin- for somatic events, 12 cells). This suggests that intrinsicproperties of the LDCV-mediated signaling, rather thanstimulated neurons show no correlation with each other
(r 5 0.01, p , 0.05, n 5 12). This is in line with our proposal experimental inconsistencies, are responsible for theobserved variability. Taken together, we observe a dis-that transmitter release occurring from independent
vesicle populations, rather than from a common source, tinct pattern of exocytotic signals at axonal and somaticrecording sites that parallels the subcellular distributionis responsible for the different quantal sizes of the exo-
cytotic signals (Figure 5D). of SSVs and LDCVs in our neurons.
Kinetic Properties of Transmitter ReleaseQuantal Release at Somatic SitesA direct test of the hypothesis about the distinct nature from SSVs and LDCVs
For each spike, the 50%–90% rise time, the width atof the characterized signal classes is provided by themorphological observation that only LDCVs are found half-height, and the peak amplitude were determined.
A comparison of the histograms of these parametersin the somata of our neurons. In fact, application ofionomycin stimulates only the large event type at so- (Figure 7) indicates a strong similarity between the
shapes of the large spikes observed at axonal sites andmatic recording sites (Figures 6A and 6B). The chargedistribution lacks the peak at about 3 fC seen at axonal those of somatic events. This result, together with the
finding that somatic recordings lack small events, count-recording sites (Figure 6C, n 5 12; compare with Figure5A). The cubic root transformation of the integrated cur- ers the possibility that partial transmitter discharge from
LDCVs contributes significantly to the origin of smallrent transients reveals a single peak distribution thatcan be well described with a single Gaussian probability events. It should be noted that the frequency distribution
of small events shows no contribution of events thatdensity function (Figure 6D). The mean cubic root chargeof somatic events, as deduced from the fit, has a value exhibit particularly slow kinetics that would be expected
if this data range (,8 fC) were significantly “contami-of 3.32 6 0.9 fC1/3. The larger quantal size of somaticevents compared with their axonal counterparts corre- nated” by charge contribution from fusion events at dis-
tant release sites. This result is likely the consequencesponds well with the 1.6-fold larger volume of somaticvesicles. Furthermore, the observed scatter of the event of a high collection efficiency of the carbon fiber in direct
contact with the releasing cell surface, together with thecharges is very similar. A similar variation of chargesis observed in recordings from individual cells (mean imposed amplitude threshold of 1.5 pA that excludes
distant, low-amplitude events from the analysis. Thecharge: 3.36 6 0.26 fC1/3, mean SD: 0.925 6 0.11 fC1/3

Neuron212
Figure 7. Comparison of Histograms for the Rise Time, Half-Width, and Amplitude of SSV and LDCV Events
(A) Axonal recordings: SSV events (upper row, unfilled bars, 0.2–8.0 fC) differ from LDCV events (lower row, filled bars, 8.0–200 fC) with respectto their rise time, half-width, and peak amplitude (columns 1–3).(B) Somatic recordings: frequency distribution of the properties of somatic LDCV release signals plotted for the indicated parameters (filledbars, 0.2–300 fC, columns 1–3). The bin width of the histograms is 40 ms, 100 ms, 1 pA for the 50%–90% rise time, half-width, and amplitude,respectively.(C) Properties of SSV and LDCV release signals, displayed as cumulative frequency distributions for the indicated parameters. SSV events(dashed curve), LDCV (axonal, continuous curve), LDCV (somatic, dotted curve). Note the kinetic properties of LDCV-related events at axonaland somatic recording sites are very similar. Histograms have been normalized. Mean and median values are given in Table 2.
mean values of the parameters for SSV and LDCV exo- 5B and 6D) against the mean inner vesicle diameterof the corresponding secretory organelle, assuming ancytosis are given in Table 2. A comparison of the kinetic
properties suggests a 5-fold faster transmitter discharge average membrane thickness of 5 nm. When comparedon a log/log scale, the combined set of data is fittedfrom SSVs than from LDCVs. However, due to the differ-
ent signal-to-noise ratios, transmitter signals from with a linear regression that has a slope of 2.8. When“close” events (, 340 ms) are selected, the averageLDCVs are detectable over further separation distances
between the sensor and the exocytotic location than cubic root charges obtained from the Gaussian fits ofthe resulting histograms (data not shown) increase fromthose from SSVs. Thus, it is reasonable to assume that
LDCV signals are more susceptible to diffusional distor- 2.82 6 0.81 fC1/3 to 3.0 6 0.9 fC1/3 and from 3.31 6 0.9fC1/3 to 3.49 6 1.0 fC1/3 for LDCV exocytosis at axonaltion. To measure the kinetic properties of release from
both vesicle types with similar fidelity, we selected and somatic sites, respectively. No change is seen forSSV signals (values are given in Table 2). A correlationevents with rise times faster than 340 ms, comprising
about 97% and 53% of the total number of small and of these data with the vesicle diameters is well describedwith a linear regression with a slope of 3.0. This resultlarge events (.1.5 pA), respectively. About 56% of so-
matic events are selected by this criterion. A comparison indicates that, on average, the amount of released trans-mitter is proportional to the volume (r3) of the secretoryof the median half-width (see Table 2) of such “close”
events shows that release signals from LDCVs (1100 ms) organelle. It should be noted that the coefficient of varia-tion (CV 5 SD/mean) has not decreased when “close”are still slower than those from SSVs (440 ms). In fact,
,3% of the LDCV events at axonal or somatic sites events are selected, suggesting that variations in theamount of transmitter released by the vesicle rather thanshow a release profile that is similar or faster than the
median half-width of SSV events. Thus, properties of diffusional loss is the major determinant for the scatterof the event charges in our experiments. The same con-the release process are responsible for the observation
that the majority of LDCV signals exhibit a main phase clusion is reached with simulations of LDCV releasesignals by using Monte-Carlo methods (see Appendixof transmitter release (“spike”) that is slower than re-
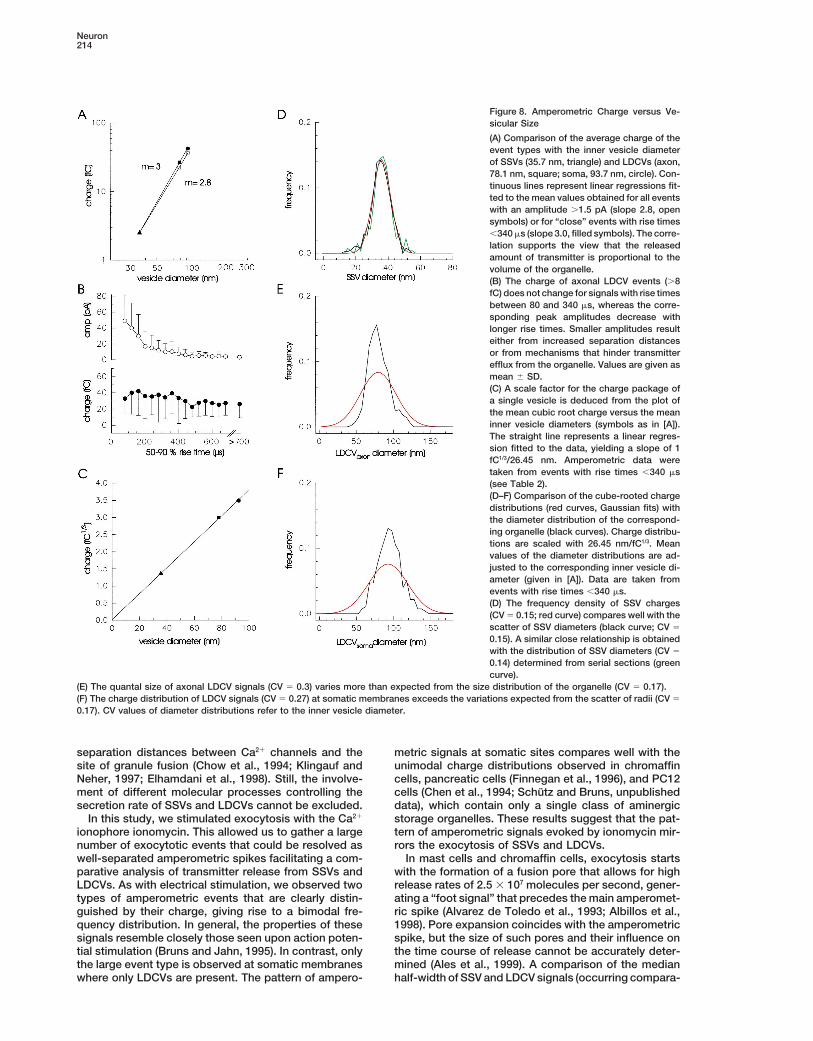
lease from SSVs, as will be discussed below. for details). Furthermore, LDCV events with rise timesranging from 80 to 340 ms show a similar mean charge(Figure 8B). Thus, the majority of LDCV signals (riseCharge versus Diametertime , 340 ms) is measured with high collection effi-Figure 8A plots the mean charge of characterized event
types (deduced from the Gaussian fits shown in Figures ciency, providing a reliable estimate of the amount of

Quantal Characteristics of Serotonin Release213
Table 2. Properties of Transmitter Release from SSVs and LDCVs
Axonal Signals Somatic Signals
SSV—Small Events LDCV—Large Events LDCV—Events(.1.5 pA) (0.2–8.0 fC, n 5 2793) (8.0–300 fC, n 5 1945) (0.2–300 fC, n 5 1084)
Charge (fC) 2.85 6 1.4 (2.6) 33.6 6 24.7 (26.3) 47.4 6 40.6 (35.8)Charge (fC1/3) 1.36 6 0.2 (1.37) 2.8 6 0.8 (2.97) 3.3 6 0.9 (3.30)Amplitude (pA) 3.76 6 2.2 (3.1) 16.1 6 23 (6.2) 20.0 6 25 (8.1)50%–90% risetime (ms) 125 6 85 (90) 530 6 566 (280) 580 6 790 (250)Half-Width (ms) 615 6 360 (480) 3110 6 2700 (2320) 3480 6 3900 (2200)Frequency (s21) 1.82 6 1.45 1.29 6 1.25 0.42 6 0.15
(,340 ms) n 5 2716 n 5 1035 n 5 613
Charge (fC) 2.80 6 1.3 (2.57) 38.5 6 27.7 (32.5) 52.30 6 45 (42.4)Charge (fC1/3) 1.36 6 0.2 (1.36) 3.0 6 0.9 (3.19) 3.49 6 1.0 (3.49)Amplitude (pA) 3.81 6 2.2 (3.14) 26.3 6 27 (15.3) 30.80 6 29 (19.4)50%–90% risetime (ms) 110 6 40 (90) 180 6 60 (160) 180 6 65 (160)Half-Width (ms) 580 6 270 (440) 1400 6 1070 (1140) 1390 6 1140 (1100)
Amperometric signals at axonal sites are classified as SSV- and LDCV-related release signals with a charge smaller or larger than 8 fC,respectively. Events are characterized with respect to area (charge in fC), amplitude (peak value pA), and kinetic parameters. The cubic rootcharge (fC1/3) is deduced from the Gaussian fit of the frequency distribution. The 50%–90% rise time reflects the time span between 50% and90% amplitude. The half-width gives the duration of the current transient at half-height of its peak amplitude. The frequency refers to themean secretory rate between 40 and 80 s after the onset of ionomycin application. The lower part of the table refers to values obtained for“close” events with a 50%–90% rise time ,340 ms. Data are collected from 12 neurons measured at the axonal tip and from 12 somaticrecordings (9 cells stimulated with two applications of ionomycin). Measurements are given as mean 6 SD, and numbers in brackets representmedian values of the corresponding frequency distribution.
released transmitter. Encouraged by these findings, we and LDCVs. Furthermore, our results show that quantalvariability of SSV release can be exclusively attributedcompared the individual charge distributions with the
size distribution of the corresponding vesicle type. For to the size variability of this class of organelles. Theseobservations indicate that the transmitter concentrationthis, a scale factor was obtained from a plot of the
vesicle’s cubic root charge against its diameter (Figure within SSVs is maintained at a remarkably constant leveland suggest that release from SSVs is an all-or-none8C). A linear regression with the slope of 1 fC1/3/26.45
nm approximates the data. Provided that the majority event.of stored transmitter molecules is released during exo-cytotic discharge, this renders an estimate for the aver- Comparing Transmitter Release from SSVs and LDCVsage intravesicular serotonin concentration in SSVs and Electrochemical measurements of transmitter releaseLDCVs of about 270 mM (assuming 4 mols of electrons from neuroendocrine cells and aminergic neurons havetransferred per mol of serotonin; Bruns and Jahn, 1995). shown that unitary amperometric events can be attrib-Figures 8D–8F compare the Gaussian fits of the quantal uted to quantal transmitter discharge from individualsize distributions with the corresponding diameter distri- vesicles (Wightman et al., 1991; Chow et al., 1992; Al-butions of the different vesicle types. The variability in varez de Toledo et al., 1993; Chen et al., 1994; Zhouquantal size of SSV signals (charge1/3) corresponds with and Misler, 1995; Koh and Hille, 1997; Albillos et al.,the variability of the vesicle’s diameter. This suggests 1998; Jaffe et al., 1998; Pothos et al., 1998). Retzius cellsthat serotonin is stored at a constant intravesicular con- exhibit at distal regions of the axon a large numbercentration in SSVs. In contrast, the quantal size of the of morphological specializations that resemble putativetransmitter signals observed for LDCV exocytosis at release sites and contain mixed populations of SSVs andboth axonal and somatic sites shows a variability that LDCVs. Whereas LDCVs were shown earlier to containexceeds the variations expected from the size differ- aminergic transmitter (Kuffler et al., 1987), we have nowences of this organelle type. extended this observation to SSVs by using permanga-
nate fixation. This procedure results in reserpine-sensi-Discussion tive, electron-dense precipitates in SSVs of Retzius
cells, consistent with our previous notion that releasefrom both vesicle types contributes to the pattern ofIn this study we have characterized the vesicular origin
and the quantal variability of transmitter release in sero- amperometric signals at axonal recording sites. SSVexocytosis differs from LDCV exocytosis with respecttonergic neurons. As a model system, we used isolated
Retzius cells of the leech. Retzius cells are hitherto the to frequency and temporal coupling upon stimulationwith single action potentials (Bruns and Jahn, 1995). Theonly preparation in which exocytosis of SSVs and LDCVs
can be simultaneously monitored at the resolution of spatial organization of SSVs within the terminal regionoccurring often adjacent to presynaptic “thickenings”single vesicles (Bruns and Jahn, 1995). We found that
the pattern of exocytotic signals observed at axonal and of the plasma membrane corresponds with the shortlatency response of small quantal events that occursomatic sites correlates with the subcellular distribution
of SSVs and LDCVs, confirming that serotonin is inde- within the first milliseconds after the action potential,as expected for vesicles that colocalize with the site ofpendently released from both types of storage organ-
elles. On average, quantal size varies proportionally to transmembrane Ca21 influx. These observations agreewith findings in chromaffin cells showing that variablethe size differences of SSVs and LDCVs, suggesting that
serotonin is stored at similar concentrations in SSVs exocytotic delays are best explained by heterogeneous
Neuron214
Figure 8. Amperometric Charge versus Ve-sicular Size
(A) Comparison of the average charge of theevent types with the inner vesicle diameterof SSVs (35.7 nm, triangle) and LDCVs (axon,78.1 nm, square; soma, 93.7 nm, circle). Con-tinuous lines represent linear regressions fit-ted to the mean values obtained for all eventswith an amplitude .1.5 pA (slope 2.8, opensymbols) or for “close” events with rise times,340 ms (slope 3.0, filled symbols). The corre-lation supports the view that the releasedamount of transmitter is proportional to thevolume of the organelle.(B) The charge of axonal LDCV events (.8fC) does not change for signals with rise timesbetween 80 and 340 ms, whereas the corre-sponding peak amplitudes decrease withlonger rise times. Smaller amplitudes resulteither from increased separation distancesor from mechanisms that hinder transmitterefflux from the organelle. Values are given asmean 6 SD.(C) A scale factor for the charge package ofa single vesicle is deduced from the plot ofthe mean cubic root charge versus the meaninner vesicle diameters (symbols as in [A]).The straight line represents a linear regres-sion fitted to the data, yielding a slope of 1fC1/3/26.45 nm. Amperometric data weretaken from events with rise times ,340 ms(see Table 2).(D–F) Comparison of the cube-rooted chargedistributions (red curves, Gaussian fits) withthe diameter distribution of the correspond-ing organelle (black curves). Charge distribu-tions are scaled with 26.45 nm/fC1/3. Meanvalues of the diameter distributions are ad-justed to the corresponding inner vesicle di-ameter (given in [A]). Data are taken fromevents with rise times ,340 ms.(D) The frequency density of SSV charges(CV 5 0.15; red curve) compares well with thescatter of SSV diameters (black curve; CV 5
0.15). A similar close relationship is obtainedwith the distribution of SSV diameters (CV 5
0.14) determined from serial sections (greencurve).
(E) The quantal size of axonal LDCV signals (CV 5 0.3) varies more than expected from the size distribution of the organelle (CV 5 0.17).(F) The charge distribution of LDCV signals (CV 5 0.27) at somatic membranes exceeds the variations expected from the scatter of radii (CV 5
0.17). CV values of diameter distributions refer to the inner vesicle diameter.
separation distances between Ca21 channels and the metric signals at somatic sites compares well with theunimodal charge distributions observed in chromaffinsite of granule fusion (Chow et al., 1994; Klingauf and
Neher, 1997; Elhamdani et al., 1998). Still, the involve- cells, pancreatic cells (Finnegan et al., 1996), and PC12cells (Chen et al., 1994; Schutz and Bruns, unpublishedment of different molecular processes controlling the
secretion rate of SSVs and LDCVs cannot be excluded. data), which contain only a single class of aminergicstorage organelles. These results suggest that the pat-In this study, we stimulated exocytosis with the Ca21
ionophore ionomycin. This allowed us to gather a large tern of amperometric signals evoked by ionomycin mir-rors the exocytosis of SSVs and LDCVs.number of exocytotic events that could be resolved as
well-separated amperometric spikes facilitating a com- In mast cells and chromaffin cells, exocytosis startswith the formation of a fusion pore that allows for highparative analysis of transmitter release from SSVs and
LDCVs. As with electrical stimulation, we observed two release rates of 2.5 3 107 molecules per second, gener-ating a “foot signal” that precedes the main amperomet-types of amperometric events that are clearly distin-
guished by their charge, giving rise to a bimodal fre- ric spike (Alvarez de Toledo et al., 1993; Albillos et al.,1998). Pore expansion coincides with the amperometricquency distribution. In general, the properties of these
signals resemble closely those seen upon action poten- spike, but the size of such pores and their influence onthe time course of release cannot be accurately deter-tial stimulation (Bruns and Jahn, 1995). In contrast, only
the large event type is observed at somatic membranes mined (Ales et al., 1999). A comparison of the medianhalf-width of SSV and LDCV signals (occurring compara-where only LDCVs are present. The pattern of ampero-

Quantal Characteristics of Serotonin Release215
Figure 9. Amperometric Collection Efficiencyin the “Cell-Contact” Configuration
(A) Collection efficiency determined by three-dimensional random walk simulations oftransmitter release at different radii from thecenter of the carbon fiber (CF). The fiber tipis placed at an axial distance of 300 nm (filledsymbols) and 100 nm (open symbols) fromthe cell. Detection limits (amplitudes ,1.5 pA)for average-sized SSV (2.51 fC; dashed lines)and LDCV signals (27 fC, LDCV #2; continu-ous lines) are indicated. Inset, see text forexplanation.(B) Calculated charge distributions deter-mined for LDCV (template 1) and SSV releaseat 300 nm (blue curve) and 100 nm (red curve)cell electrode spacing. Black curves indicatethe distribution of charges defined by sizevariation of the organelles, filled with thesame concentration of transmitter.(C) Properties of simulated amperometriccurrent signals for release from SSVs andLDCVs. Numbers indicate median values ofthe corresponding frequency distribution(cell electrode spacing, 300 nm). Numbers inbrackets indicate properties of the template.
bly close to the detector) reveals a 2.5-fold slower trans- Marszalek et al., 1997), we estimate a half-width of ,30 ms for LDCV events, an order of magnitude fastermitter discharge from LDCVs (1100 ms) than from SSVs
(440 ms). Only 3% of LDCV signals exhibit a time course than the minimum discharge time observed for this vesi-cle type (z400 ms). Thus, low diffusivity within a vesicularthat is similar or faster than the median half-width of
the SSV signals. These results suggest that bulk release matrix is unlikely to account for the kinetic differencesof SSV and LDCVs release. We propose that dynamicsfrom LDCVs is hindered. In the case of a rapid expansion
of the pore to large diameters, release kinetics might of the expanding fusion pore mainly govern the ampero-metric spike phase during transmitter discharge frombe slowed by restricted diffusivity of 5-HT within an
intravesicular storage matrix, as it has been suggested LDCVs.The different mean quantal sizes observed for SSVfor serotonin release from mast cell vesicles (Alvarez de
Toledo et al., 1993; Marszalek et al., 1997). The minimum and LDCV signals compare well with the average sizedifferences of the organelles suggesting that all typeshalf-width of such a LDCV fusion event can be estimated
by using the simple equation of relationship for one- of vesicles store serotonin at a similar concentration(270 mM). Serotonin is transported into vesicles bydimensional diffusion, t 5 r2/2D, where r is the radius of
the vesicle, t is the half-width (approximate time for means of the vesicular monoamine transporter that hasbeen shown to reside on both LDCVs and SSVs (Niren-the mean squared displacement), and D is the diffusion
constant. Assuming a 20-fold reduced diffusivity within berg et al., 1995, 1997). Transport depends on the protonelectrochemical gradient generated by the vacuolarvesicles (D5HT 5 2.9 3 1027 cm2 s21, as has been deter-
mined for serotonin release from mast cell vesicles by H1-ATPase (Maycox et al., 1990; Liu and Edwards,

Neuron216
1997). Our result is in line with the expectation that pro- lar transmitter concentration holds for glutamatergicSSVs, one can speculate that vesicle size determineston electrochemical gradients across the vesicular
membrane of SSVs and LDCVs are similar and that the mainly the variability of quantal glutamate release inhippocampal neurons. This is in line with the observationsize of this gradient defines the intravesicular transmitter
concentration. An alternative mechanism for the regula- of Bekkers et al. (1990) reporting a reasonable agree-ment between the distribution of vesicle radii and thetion of quantal size has been proposed on the observa-
tion that transmitter packaging in secretory organelles cube-rooted amplitude distribution of unitary gluta-matergic events.is limited by the rate of neurotransmitter uptake (Song
et al., 1997; Fon et al., 1997; Travis et al., 2000). These In contrast to the results obtained for SSVs, we failedto observe a similarly close relationship between quantalobservations have led to the hypothesis that the in-
travesicular concentration is set by a balance between size and the size distribution of LDCVs. We would liketo emphasize that LDCV signals generally exhibit a con-uptake and leakage from the vesicle (Williams, 1997).
Our results do not exclude the possibility that transport tinuous decay of the current signal, giving no indicationthat incomplete or interrupted transmitter dischargeactivity rather than a transvesicular electrochemical gra-
dient is the limiting factor in serotonin loading, provided contributes to quantal variability, as one might expectwhen premature closing of a fusion pore terminates re-that transport activity (e.g., number of transporters per
vesicle) and counteracting drain are similar or vary pro- lease. This agrees with observations in chromaffin cellsshowing that even larger-sized chromaffin granulesportionally to each other in the different organelle types.
Furthermore, the possibility that vesicular filling is gov- complete their discharge during a kiss-and-run fusionevent (Ales et al., 1999). Our random walk simulationserned by a hitherto unidentified “sensor” mechanism
cannot be discarded. Interestingly, recent studies in (see Appendix for details) suggest that a contributionof “rim events” with reduced charge (due to reducedneuroendocrine cells and serotonergic neurons suggest
that trimeric GTPases modulate vesicular transmitter collection efficiency outside of the electrode contactarea) is not sufficient to account for the entire divergencecontent by regulation of the monoamine transporter
(Holtje et al., 2000). The latter mechanism may also be between the frequency distributions, suggesting thatserotonin packaging in LDCVs is indeed more variablean attractive target of intracellular signaling pathways
that regulate quantal size (van der Kloot, 1991; Sulzer than in SSVs. The increased quantal variability of LDCVevents might be a consequence of the biogenesis ofand Pothos, 2000).this vesicle type. LDCVs derive from the trans-Golginetwork, whereas SSVs undergo local recycling withinQuantal Variabilityaxon terminals. Previous studies suggested that LDCVsTheoretical and experimental evidence has suggestedundergo a complex process of maturation while theythe potential importance of structural and functionaltravel to the terminal by axonal flow (Winkler, 1997). Weproperties of synapses such as vesicle size, the geome-observed that LDCVs in the soma are larger than attry of the synaptic cleft and of the extrajunctional space,axonal sites, suggesting that a reduction in size accom-as well as binding to neurotransmitter transporters inpanies maturation. Such a scenario may also interfereshaping the transmitter concentration profile in the syn-with the electrochemical gradient or produce a largeaptic cleft (Bruns et al., 1993; Clements, 1996; Frerkingdiversity in the number of neurotransmitter transportersand Wilson, 1996; Kleinle et al., 1996; Wahl et al., 1996;per vesicle. It remains to be clarified whether sequestra-Asztely et al., 1997; Diamond and Jahr, 1997; Walmsleytion of membrane from LDCVs contributes also to theet al., 1998). In fact, recent evidence corroborates theorigin of SSVs in these neurons, a concept that has beenview that varying transmitter concentrations in the syn-controversially discussed (Jahn and de Camilli, 1991;aptic cleft and a lack of receptor saturation contribute toBauerfeind et al., 1995; Winkler, 1997). Since LDCVsquantal variability of GABA mini amplitudes in amacrinerelease their content preferentially at extrasynaptic loca-cells (Frerking et al., 1995) and of glutamatergic unitarytions, the functional consequences of a variable seroto-events in hippocampal cultures and slice preparationsnin loading of LDCVs may not be as crucial as for rapid(Forti et al., 1997; Liu et al., 1999; Choi et al., 2000). Ourand discrete synaptic signaling that relies on the exo-experiments provide information to what extent presyn-cytosis of SSVs. The ability of LDCVs to store and releaseaptic sources can be responsible for quantal variability.large amounts of serotonin make these vesicles primeWe observed that the amount of transmitter releasedcandidates for the paracrine mode of serotonin actionfrom a SSV varies proportionally with the volume ofin the CNS.the organelle. The close correspondence between the
distribution of cube-rooted amperometric charges andExperimental Procedures
the scatter of vesicle radii suggests that all SSVs areindeed filled with the same concentration of serotonin Animals(270 mM). A similar mean value and dispersion of quantal Experiments were performed on cells of adult leeches (Hirudo me-SSV size was observed upon stimulation with single dicinalis) kept in laboratory aquaria.action potentials or hypertonic sucrose solution (unpub-
Cell Culturelished data), suggesting that with a variety of physiologi-Retzius cells and AE (annulus erector) motoneurons were isolatedcally distinct stimuli, transmitter discharge from SSVsfrom desheathed ganglia by suction pipettes (Dietzel et al., 1986)is an all-or-none event. The coefficient of variation ofafter enzyme treatment with collagenase-dispase (2 mg/ml for 1 hr;SSV charges (CV 5 0.4–0.5, untransformed data) in ourBoehringer Mannheim, Germany) and were kept on nonadhesive
neurons compares well with that observed for ampli- culture dishes (Falcon no. 3001) in Leibowitz L-15 medium (GIBCO,tudes of unitary events at single release sites in hippo- Germany) supplemented with 6% fetal calf serum (GIBCO), glucosecampal neurons (Liu et al., 1999). SSVs in these neurons (4 mg/ml), and gentamycin (0.1 mg/ml; Merk, Germany). A crucialare slightly smaller but exhibit a similar size scatter (Bek- point in the isolation procedure was to ensure that a long stretch
of the original process was prepared together with the soma. Thekers et al., 1990). If our finding of a constant intravesicu-

Quantal Characteristics of Serotonin Release217
cells were transferred after 24 hr into culture dishes coated with conventional bridge amplifier. Microelectrodes (borosilicate glass,GC150F10, Clark Electromedical Instruments) were back filled withpoly-L-ornithine (Sigma, Germany) and filled with Leibowitz medium.
After adhesion of the neurons, the medium was supplemented as 3 M potassium acetate and 100 mM KCl and had resistances rangingfrom 30 to 50 MV. The external saline contained (in mM): 130 NaCl,described above. Under these conditions, the cells did not develop
extended neurites and were used for recordings at room tempera- 4 KCl, 1 CaCl2, 48 mM glucose, and 10 HEPES-NaOH (pH 7.3).Experiments were performed on the stage of an inverted microscopeture (238C) on days 2–4 of culture.(Zeiss Axiovert 100, Oberkochen, Germany). Amperometric currentswere filtered at 3 kHz (8-pole, Bessel), digitized gapfree at a rate ofElectron Microscopy25–50 kHz, and stored on a personal computer. For data collectionFor electron microscopy, neurons were plated on poly-L-ornithine-and evaluation, the programs pClamp6 (Axon Instruments, Fostercoated Petriperm dishes (Bachhofer, Germany). The cells were fixedCity, CA) and AutesW (NPI Electronics, Tamm, Germany) were used.in 3% glutaraldehyde in 0.1 M cacodylate buffer (pH 7.4) and post-Amperometric signals were again digitally filtered at 3 kHz (effectivefixed in 2% OsO4 in 0.1 M cacodylate buffer (pH 7.4) at 48C for 1 hr.overall filtering 2.1 kHz) and were analyzed with an AutesW-basedThe specimen was contrasted en bloc in 2% uranyl acetate (aque-customized event detection routine (written by Bruns) that uses aous) at 48C for 1 hr and serially dehydrated in ethanol followed bythreshold criterion of 1.5 pA and allows for direct visual control ofinfiltration in Embed-812 (Electron Microscopy Science, Munchen,the determination of the event’s properties. Current transients thatGermany). The Embed was polymerized at 608C for 48 hr. The resinexceeded the average baseline noise standard deviation (0.28 6containing individual neurons was mounted on a dowel. Ultrathin0.04 pA) by more than five times were included, a criterion thatsections of gray/silver interference color (estimated thickness, 50yields a false event rate of 0.003 events/s, reflecting about one-nm, cut parallel to the plane of the culture dish) were counterstainedthousandth of the mean rate of secretory events during ionomycinwith 2% uranyl acetate (aqueous) and lead citrate (0.4 mg/ml [pHapplication (3.1 6 1.9 events/s). Drugs and external solutions were12.0]) and analyzed with a Philips CM 120 (80 kV) electron micro-delivered from a multichannel perfusion pipette (Carbone and Lux,scope. Permanganate fixation of cultured neurons was performed1987) placed z340 mm from the cell. Change of superfusion solu-according to Hokfelt and Jonsson (1968). Retzius cells and AE moto-tions was accomplished by triggered electromagnetic valves (Theneurons were fixed in 3% ice-cold sodium permanganate (0.1 MLee Co., Westbrook, CT). The slow solution exchange (time con-sodium phosphate [pH 7.0]), rinsed in Ringer’s solution, contrastedstant, 600–800 ms), as determined by tip potential measurementsen bloc in 2% uranyl acetate (aqueous) at 48C for 1 hr, dehydrated,with a microelectrode placed at a distance of 2–10 mm from theand embedded as described above. Ultrathin sections were cutcell, will not affect the charge integral of the amperometric signalat silver interference color. The percentage of electrondense SSVmeasured over a time period of 40 ms. Measurements are given asprofiles was evaluated on prints of 60,0003 magnification. Vesicularmean 6 SD, unless indicated otherwise. Data were fitted using aprofiles of SSV size were counted as “dense” when they exhibitedleast squares criterion.an electron-opaque precipitate similar in density to that of LDCVs.
ChemicalsMorphometric AnalysisIonomycin was obtained from Calbiochem (Germany).The diameter of SSVs was measured on micrographs acquired at
a magnification of 60,0003 and printed to a final magnification of180,0003. For measurements of LDCV diameters, micrographs were Appendixtaken at the somatic periphery and distal regions of the axon (taken Amperometry is well suited for quantifying the amount of releasedat 22,0003) and were printed at 110,0003. The microscope was transmitter because electroxidative consumption generates steepcalibrated with a cross-grating replica (2160 lines/mm). Since the concentration gradients and thus increases the collection efficiencyshape of some organelles is slightly elliptical, diameters of SSVs (Wightman et al., 1995). Still, a quantitative answer depends onand LDCVs were measured generally for perpendicularly oriented spatial arrangement, the relative location of release sites, and thelong (a) and short (b) axes (measured with an electronic digital caliper detecting surface (Schroeder et al., 1992; Haller et al., 1998). To[Mitutoyo, Perschman, Berlin, Germany] between the outsides of minimize diffusional loss of transmitter, the carbon fiber was placedthe outer leaflets). The mean diameter was approximated by daveg 5 directly on the releasing cell surface as visualized by deformation(a 3 b 3 c)1/3, where c 5 (a 1 b)/2. All organelles with clearly of the cell membrane. We performed Monte-Carlo simulations todelineated membranes were counted. The mean diameters obtained estimate the amperometric collection efficiency in the “cell-contact”from a Gaussian fit of the distribution of vesicle diameters were configuration and to study whether diffusional loss of transmittercorrected for section thickness (estimated at 50 nm) by using the released from a vesicle may contribute to the scatter of chargestheoretical solution given by Parsons et al. (1995). SSV diameters observed in our experiments. It was assumed that exocytotic eventswere also determined on micrographs obtained from 8 serial sec- occur in a random and uniform distribution over the cell surface.tions of 2 cells and printed at 205,0003. To identify SSV profiles The carbon fiber (5.4 mm diameter) is placed at an axial distance ofthat are entirely enclosed within an 80 nm section, we aligned mor- 300 nm or 100 nm from the cell membrane to account for variablephological structures with preceding and following sections using cell–electrode spacing. Molecules allowed to diffuse into the sur-LDCVs profiles as “landmarks.” rounding medium with a diffusion coefficient of 5.4 3 1026 cm2 s21
(Gerhardt and Adams, 1982) were reflected at the cell surface andthe cylindrical surface of the fiber (continuous lines, inset, Figure 9)Electrophysiology
Single-stranded carbon fibers (model, Pan-T650; cross-sectional and absorbed at the disc-like tip of the fiber (dashed line). Releasesites are distributed at radial distances from the central axis of thediameter, 5.4 mm; Amoco Performance Products, Greenville, SC)
were polyethylene insulated as described (Chow and von Ruden, carbon fiber ranging from 0 to 5 mm. The probability of release isproportional to the corresponding area of the surface segment. For1995), connected to copper wires using conductive carbon paste
(Electrodag 5513, Acheson Colloids, Scheemda, Netherlands), and each release site, an amperometric current signal was calculatedby a random walk process with 42,000 molecules. Transmitter mole-mounted in glass microcapillaries (borosilicate glass, GC150F10,
Clark Electromedical Instruments, United Kingdom) with two-com- cules were released with a time course determined by a templateto mimic properties of noninstantaneous transmitter discharge fromponent epoxy glue. Amperometric currents were recorded with a List
EPC-7 amplifier (Heka Electronics, Lambrecht, Germany; electrode LDCVs. Recorded fast current transients (filtered at 5.7 kHz, 8-pole,Bessel) were selected as templates, assuming that such eventsvoltage set to 1650 mV). The tip of the carbon fiber was cut with a
surgical blade just before the experiment to ensure cleanliness and occur close to the surface of the fiber and thus report faithfully thekinetics of release. Templates with different kinetic properties weresensitivity of the exposed tip surface. Transsected tips were exam-
ined for irregularities at 8003 magnification (objective, Olympus compared (Figure 9C). To simulate release from differentially sizedLDCVs, amplitude and charge of the template were scaled propor-ULWD CDPlan 403) on the stage of a microforge (Narishige, MF-
90, Tokyo, Japan) and were recut if the exposed carbon surface tionally to the volume of the organelle, and the frequency of suchsignals was adjusted to the frequency distribution of LDCV diame-was visibly uneven. In all experiments the actual membrane potential
was recorded with an additional microelectrode connected to a ters at axonal sites. Events with amplitudes .1.5 pA were analyzed

Neuron218
with respect to charge, amplitude, and kinetic properties; the charge aptic reuptake current during serotonergic transmission in identifiedneurons of Hirudo. Neuron 10, 559–572.was integrated over a 40 ms time period as for the experimental
signals. Median values of the corresponding frequency distributions Carbone, E., and Lux, H.D. (1987). Kinetics and selectivity of a low-are given in Figure 9C. We found that peak amplitudes and kinetic voltage-activated calcium current in chick and rat sensory neurones.properties of the signals predicted from the “rapid-releasing” tem- J. Physiol. (Lond.) 386, 547–570.plate (LDCV #3) are incompatible with the experimental data (Figure
Chazal, G., and Ralston, H.J., III. (1987). Serotonin-containing struc-9C, compare Table 2). In contrast, a reasonable agreement between
tures in the nucleus raphe dorsalis of the cat: an ultrastructuralsimulated and experimental results was obtained for “slow-releas-
analysis of dendrites, presynaptic dendrites, and axon terminals. J.ing” templates (LDCV #1 and #2). This is consistent with the observa-
Comp. Neurol. 259, 317–329.tion that properties of the release process are responsible for slow
Chen, T.K., Luo, G., and Ewing, A.G. (1994). Amperometric monitor-kinetics of transmitter discharge from LDCVs. The calculated distri-ing of stimulated catecholamine release from rat pheochromocy-bution of LDCV charges (charge1/3; LDCV #1, CV 5 0.18; LDCV #2,toma (PC12) cells at the zeptomole level. Anal. Chem. 66, 3031–3035.CV 5 0.20) shows a similar scatter as the charge distribution set by
the size variability of the vesicles (CV 5 0.17; Figure 9B). Even for Choi, S., Klingauf, J., and Tsien, R.W. (2000). Postfusional regulationtemplate LDCV #3, the predicted variation of charges (CV 5 0.22) of cleft glutamate concentration during LTP at “silent synapses”.is much smaller than observed in the experiment (CV 5 0.3). This Nat. Neurosci. 3, 330–336.confirms the view that variability in the amount of released transmit- Chow, R.H., and von Ruden, L. (1995). Electrochemical detection ofter rather than diffusional loss determines the scatter of charges in secretion from single cells. In Single-Channel Recording, Secondthe “cell-contact” configuration. On average, about 21%–29% of Edition, B. Sakmann and E. Neher, eds. (New York: Plenum Press),the molecules released from LDCVs can escape detection by the pp. 245–275.carbon fiber. Similar calculations for SSV release (using a fast tem-
Chow, R.H., von Ruden, L., and Neher, E. (1992). Delay in vesicleplate with a half-width of 190 ms, amplitude 10.3 pA, charge 2.5 fC)fusion revealed by electrochemical monitoring of single secretoryrevealed a maximum loss of 6.5% of the discharged molecules.events in adrenal chromaffin cells. Nature 356, 60–63.The relative difference of diffusional loss for SSV and LDCV signalsChow, R.H., Klingauf, J., and Neher, E. (1994). Time course of Ca21(14%–23%) compares well with the experimentally observed in-concentration triggering exocytosis in neuroendocrine cells. Proc.crease of LDCV charges (16%–19%) when LDCV events with riseNatl. Acad. Sci. USA 91, 12765–12769.times similar to those of SSV events are selected (,340 ms; Table
2). Similar collection efficiencies were obtained for an axial distance Clements, J.D. (1996). Transmitter timecourse in the synaptic cleft:of 100 nm (Figure 9B). Thus, such variability in axial distance due its role in central synaptic function. Trends Neurosci. 19, 163–171.to irregularities of the carbon fiber tip will not significantly affect the Colquhoun, D., and Sigworth, F.J. (1995). Fitting and statistical anal-collection efficiency. ysis of single-channel records. In Single-Channel Recording, Sec-
ond Edition, B. Sakmann and E. Neher, eds. (New York: PlenumAcknowledgments Press), pp. 483–587.
Diamond, J.S., and Jahr, C.E. (1997). Transporters buffer synapti-The authors would like to express their gratitude to Drs. E. Neher,cally released glutamate on a submillisecond time scale. J. Neurosci.A. Marty, S. Arch, and U. Kuhnt for valuable discussions. We thank17, 4672–4687.S. Bruns-Engers for excellent technical assistance.Dietzel, I.D., and Gottmann, K. (1988). Development of dopamine-containing neurons and dopamine uptake in embryos of HirudoReceived July 12, 2000; revised August 14, 2000.medicinalis. Dev. Biol. 128, 277–283.
Dietzel, I.D., Drapeau, P., and Nicholls, J.G. (1986). Voltage depen-Referencesdence of 5-hydroxytryptamine release at a synapse between identi-fied leech neurons in culture. J. Physiol. 372, 191–205.Albillos, A., Dernick, G., Horstmann, H., Almers, W., Alvarez de To-
ledo, G., and Lindau, M. (1998). The exocytotic event in chromaffin Edwards, F.A., Konnerth, A., and Sakmann, B. (1990). Quantal analy-cells revealed by patch amperometry. Nature 389, 509–512. sis of inhibitory synaptic transmission in the dentate gyrus of rat
hippocampal slices: a patch-clamp study. J. Physiol. (Lond.) 430,Ales, E., Tabares, L., Poyato, J.M., Valero, V., Lindau, M., and Alvarez213–249.de Toledo, G. (1999). High calcium concentrations shift the mode of
exocytosis to the kiss-and-run mechanism. Nat. Cell Biol. 1, 40–44. Elhamdani, A., Zhou, Z., and Artalejo, C.R. (1998). Timing of dense-Alvarez de Toledo, G., Fernandez-Chacon, R., and Fernandez, J.M. core vesicle exocytosis depends on the facilitation L-type Ca chan-(1993). Release of secretory products during transient vesicle fusion. nel in adrenal chromaffin cells. J. Neurosci. 18, 6230–6240.Nature 363, 554–558. Finnegan, J.M., Pihel, K., Cahill, P.S., Huang, L., Zerby, S.E., Ewing,Arluison, M., and de la Manche, I.S. (1980). High-resolution radioau- A.G., Kennedy, R.T., and Wightman, R.M. (1996). Vesicular quantaltographic study of the serotonin innervation of the rat corpus stria- size measured by amperometry at chromaffin, mast, pheochromo-tum after intraventricular administration of [3H]5-hydroxytrypta- cytoma, and pancreatic beta-cells. J. Neurochem. 66, 1914–1923.mine. Neuroscience 5, 229–240. Fon, E.A., Pothos, E.N., Sun, B.C., Killeen, N., Sulzer, D., and Ed-Asztely, F., Erdemli, G., and Kullmann, D.M. (1997). Extrasynaptic wards, R.H. (1997). Vesicular transport regulates monoamine stor-glutamate spillover in the hippocampus: dependence on tempera- age and release but is not essential for amphetamine action. Neuronture and the role of active glutamate uptake. Neuron 18, 281–293. 19, 1271–1283.
Auger, C., and Marty, A. (1997). Heterogeneity of functional synaptic Forti, L., Bossi, M., Bergamaschi, A., Villa, A., and Malgaroli, A.parameters among single release sites. Neuron 19, 139–150. (1997). Loose-patch recordings of single quanta at individual hippo-
campal synapses. Nature 388, 874–878.Bauerfeind, R., Jelinek, R., Hellwig, A., and Huttner, W.B. (1995).Neurosecretory vesicles can be hybrids of synaptic vesicles and Frerking, M., and Wilson, M. (1996). Saturation of postsynaptic re-secretory granules. Proc. Natl. Acad. Sci. USA 92, 7342–7346. ceptors at central synapses? Curr. Opin. Neurobiol. 6, 395–403.Beaudet, A., and Descarries, L. (1981). The fine structure of central Frerking, M., Borges, S., and Wilson, M. (1995). Variation in GABAserotonin neurons. J. Physiol. 77, 193–203. mini amplitude is the consequence of variation in transmitter con-
centration. Neuron 15, 885–895.Bekkers, J.M., Richerson, G.B., and Stevens, C.F. (1990). Originof variability in quantal size in cultured hippocampal neurons and Fried, G., Thureson-Klein, A., and Lagercrantz, H. (1981). Noradrena-hippocampal slices. Proc. Natl. Acad. Sci. USA 87, 5359–5362. line content correlated to matrix density in small noradrenergic vesi-
cles from rat seminal ducts. Neuroscience 6, 787–800.Bruns, D., and Jahn, R. (1995). Real-time measurement of transmitterrelease from single synaptic vesicles. Nature 377, 62–65. Gerhardt, G., and Adams, R.N. (1982). Determination of diffusion
coefficients by flow injection analysis. Anal. Chem. 54, 2618–2620.Bruns, D., Engert, F., and Lux, H.D. (1993). A fast activating presyn-

Quantal Characteristics of Serotonin Release219
Haller, M., Heinemann, C., Chow, R.H., Heidelberger, R., and Neher, and postsynaptic targets in rat substantia nigra. Neuroscience 76,1159–1171.E. (1998). Comparison of secretory responses as measured by mem-
brane capacitance and by amperometry. Biophys. J. 74, 2100–2113. Nirenberg, M.J., Liu, Y., Peter, D., Edwards, R.H., and Pickel, V.M.Henderson, L.P. (1983). The role of 5-hydroxytryptamine as a trans- (1995). The vesicular monoamine transporter 2 is present in smallmitter between identified leech neurones in culture. J. Physiol. synaptic vesicles and preferentially localizes to large dense core(Lond.) 339, 309–324. vesicles in rat solitary tract nuclei. Proc. Natl. Acad. Sci. USA 92,
8773–8777.Hokfelt, T. (1968). In vitro studies on central and peripheral mono-amine neurons at the ultrastructural level. Z. Zellforsch. 91, 1–74. Nirenberg, M.J., Chan, J., Liu, Y., Edwards, R.H., and Pickel, V.M.
(1997). Vesicular monoamine transporter-2: immunogold localiza-Hokfelt, T., and Jonsson, G. (1968). Studies on reaction and bindingtion in striatal axons and terminals. Synapse 26, 194–198.of monoamines after fixation and processing for electron micros-
copy with special reference to fixation with potassium permanga- Palay, S.L., and Chan-Palay, V. (1974). The mossy fiber. In Cerebellarnate. Histochemie 16, 45–67. Cortex: Cytology and Organization (Springer: New York), p. 159.Holtje, M., von Jagow, B., Pahner, I., Lautenschlager, M., Hortnagl, Parsons, T.D., Coorssen, J.R., Horstmann, H., and Almers, W. (1995).H., Nurnberg, B., Jahn, R., and Ahnert-Hilger, G. (2000). The neuronal Docked granules, the exocytic burst, and the need for ATP hydroly-monoamine transporter VMAT2 is regulated by the trimeric GTPase sis in endocrine cells. Neuron 15, 1085–1096.Go(2). J. Neurosci. 20, 2131–2141. Plattner, H., Artalejo, A.R., and Neher, E. (1997). Ultrastructural orga-Jaffe, E.H., Marty, A., Schulte, A., and Chow, R.H. (1998). Extrasyn- nization of bovine chromaffin cell cortex-analysis by cryofixationaptic vesicular transmitter release from the somata of substantia and morphometry of aspects pertinent to exocytosis. J. Cell Biol.nigra neurons in rat midbrain slices. J. Neurosci. 18, 3548–3553. 139, 1709–1717.Jahn, R., and de Camilli, P. (1991). Membrane proteins of synaptic Pothos, E.N., Davila, V., and Sulzer, D. (1998). Presynaptic recordingvesicles: markers for neurons and neuroendocrine cells: tools for of quanta from midbrain dopamine neurons and modulation of thethe study of neurosecretion. In Markers for Neural and Endocrine quantal size. J. Neurosci. 18, 4106–4118.Cells, M. Gratzl and K. Langley, eds. (New York: VCH), pp. 25–92.
Raastad, M., Storm, J.F., and Anderson, P. (1992). Putative singleKlein, R.L., Lagercrantz, H., and Zimmermann, H. (1982). Ultrastruc- quantum and single fibre excitatory postsynaptic currents showtural preservation of vesicles in sympathetic nervous tissue. In Neu- similar amplitude range and variability in rat hippocampal slices.rotransmitter Vesicles (London: Academic Press), pp. 65–87. Eur. J. Neurosci. 4, 113–117.Kleinle, J., Vogt, K., Luscher, H.R., Muller, L., Senn, W., Wyler, K., Redman, S. (1990). Quantal analysis of synaptic potentials in neu-and Streit, J. (1996). Transmitter concentration profiles in the synap- rons of the central nervous system. Physiol. Rev. 70, 165–198.tic cleft: an analytical model of release and diffusion. Biophys. J.
Rude, S., Coggeshall, E., and Van Orden, L.S., III. (1969). Chemical71, 2413–2426.and ultrastructural identification of 5-hydroxytryptamine in an identi-
Klingauf, J., and Neher, E. (1997). Modeling buffered Ca21 diffusion fied neuron. J. Cell. Biol. 41, 832–854.near the membrane: implications for secretion in neuroendocrine
Sargent, P.B. (1977). Synthesis of acetylcholine by excitatory moto-cells. Biophys. J. 72, 674–690.neurons in central nervous system of the leech. J. Neurophysiol. 40,
Koh, D.S., and Hille, B. (1997). Modulation by neurotransmitters of 453–460.catecholamine secretion from sympathetic ganglion neurons de-
Schroeder, T.J., Jankowski, J.A., Kawagoe, K.T., Wightman, R.M.,tected by amperometry. Proc. Natl. Acad. Sci. USA 94, 1506–1511.Lefrou, C., and Amatore, C. (1992). Analysis of diffusional broadening
Korn, H., and Faber, D.S. (1991). Quantal analysis and synapticof vesicular packets of catecholamines released from biological
efficacy in the CNS. Trends Neurosci. 14, 439–445.cells during exocytosis. Anal. Chem. 64, 3077–3083.
Kuffler, D.P., Nicholls, J., and Drapeau, P. (1987). Transmitter local-Silver, R.A., Cull-Candy, S.G., and Takahashi, T. (1996). Non-NMDA
ization and vesicle turnover at a serotoninergic synapse betweenglutamate receptor occupancy and open probability at a rat cerebel-
identified leech neurons in culture. J. Comp. Neurol. 256, 516–526.lar synapse with single and multiple release sites. J. Physiol. (Lond.)
Lagnado, L., Gomis, A., and Job, C. (1996). Continuous vesicle cy- 494, 231–250.cling in the synaptic terminal of retinal bipolar cells. Neuron 17,
Song, H., Ming, G., Fon, E., Bellocchio, E., Edwards, R.H., and Poo,957–967.M. (1997). Expression of a putative vesicular acetylcholine trans-
Lent, C.M., Ono, J., Keyser, K.T., and Karten, H.J. (1979). Identifica- porter facilitates quantal transmitter packaging. Neuron 18,tion of serotonin within vital-stained neurons from leech ganglia. J. 815–826.Neurochem. 32, 1559–1563.
Stevens, C.F. (1993). Quantal release of neurotransmitter and long-Lenzi, D., Runyeon, J.W., Crum, J., Ellisman, M.H., and Roberts, term potentiation. Cell 72 (suppl.), 55–63.W.M. (1999). Synaptic vesicle populations in saccular hair cells re-
Sulzer, D., and Pothos, E.N. (2000). Regulation of quantal size byconstructed by electron tomography. J. Neurosci. 19, 119–132.presynaptic mechanisms. Rev. Neurosci. 11, 159–212.
Liu, Y., and Edwards, R.H. (1997). The role of vesicular transportTang, C.M., Margulis, M., Shi, Q.Y., and Fielding, A. (1994). Saturationproteins in synaptic transmission and neural degeneration. Annu.of postsynaptic glutamate receptors after quantal release of trans-Rev. Neurosci. 20, 125–156.mitter. Neuron 13, 1385–1393.
Liu, G., Choi, S., and Tsien, R.W. (1999). Variability of neurotransmit-Thureson-Klein, A. (1983). Exocytosis from large and small denseter concentration and nonsaturation of postsynaptic AMPA recep-cored vesicles in noradrenergic nerve terminals. Neuroscience 10,tors at synapses in hippocampal cultures and slices. Neuron 22,245–259.395–409.Till, R., and Banks, P. (1976). Pharmacological and ultrastructuralMarszalek, P.E., Farrell, B., Verdugo, P., and Fernandez, J.M. (1997).studies on the electron dense cores of the vesicles that accumulateKinetics of release of serotonin from isolated secretory granules. II.in noradrenergic axons constricted in vitro. Neuroscience 1, 49–55.Ion exchange determines the diffusivity of serotonin. Biophys. J. 73,
1169–1183. Tong, G., and Jahr, C.E. (1994). Multivesicular release from excit-atory synapses of cultured hippocampal neurons. Neuron 12, 51–59.Maycox, P.R., Hell, J.W., and Jahn, R. (1990). Amino acid neurotrans-
mission: spotlight on synaptic vesicles. Trends Neurosci. 13, 83–87. Torre, J.C., and Surgeon, J.W. (1976). A methodological approach torapid and sensitive monoamine histofluorescence using a modifiedMcAdoo, D.J., and Coggeshall, R.E. (1976). Gas chromatographic-glyoxylic acid technique: the SPG method. Histochemistry 49,mass spectrometric analysis of biogenic amines in identified neu-81–93.rons and tissues of Hirudo medicinalis. J. Neurochem. 26, 163–167.
Moukhles, H., Bosler, O., Bolam, J.P., Vallee, A., Umbriaco, D., Gef- Tranzer, J.P., and Thoenen, H. (1967). Significance of “empty” vesi-cles in postganglionic sympathetic nerve terminals. Experientia 23,fard, M., and Doucet, G. (1997). Quantitative and morphometric data
indicate precise cellular interactions between serotonin terminals 123–124.

Neuron220
Travis, E.R., Wang, Y.M., Michael, D.J., Caron, M.G., and Wightman,R.M. (2000). Differential quantal release of histamine and 5-hydroxy-tryptamine from mast cells of vesicular monoamine transporter 2knockout mice. Proc. Natl. Acad. Sci. USA 97, 162–167.
Van der Kloot, W. (1991). The regulation of quantal size. Prog. Neuro-biol. 36, 93–130.
Wahl, L.M., Pouzat, C., and Stratford, K.J. (1996). Monte Carlo simu-lation of fast excitatory synaptic transmission at a hippocampalsynapse. J. Neurophysiol. 75, 597–608.
Walmsley, B., Alvarez, F.J., and Fyffe, R.E. (1998). Diversity of struc-ture and function at mammalian central synapses. Trends Neurosci.21, 81–88.
Wightman, R.M., Jankowski, J.A., Kennedy, R.T., Kawagoe, K.T.,Schroeder, T.J., Leszczyszyn, D.J., Near, J.A., Diliberto, E.J., Jr.,and Viveros, O.H. (1991). Temporally resolved catecholamine spikescorrespond to single vesicle release from individual chromaffin cells.Proc. Natl. Acad. Sci. USA 88, 10754–10758.
Wightman, R.M., Schroeder, T.J., Finnegan, J.M., Ciolkowski, E.L.,and Pihel, K. (1995). Time course of release of catecholamines fromindividual vesicles during exocytosis at adrenal medullary cells. Bio-phys. J. 68, 383–390.
Williams, J. (1997). How does a vesicle know it is full? Neuron 18,683–686.
Winkler, H. (1997). Membrane composition of adrenergic large andsmall dense cored vesicles and of synaptic vesicles: consequencesfor their biogenesis. Neurochem. Res. 22, 921–932.
Zhang, B., Koh, Y.H., Beckstead, R.B., Budnik, V., Ganetzky, B., andBellen, H.J. (1998). Synaptic vesicle size and number are regulatedby a clathrin adaptor protein required for endocytosis. Neuron 21,1465–1475.
Zhou, Z., and Misler, S. (1995). Amperometric detection of stimulus-induced quantal release of catecholamines from cultured superiorcervical ganglion neurons. Proc. Natl. Acad. Sci. USA 92, 6938–6942.