quantification and its applications in fluorescent microscopy imaging
TRANSCRIPT
Traffic 2009; 10: 951–961© 2009 John Wiley & Sons A/S
doi: 10.1111/j.1600-0854.2009.00938.x
Review
Quantification and its Applications in FluorescentMicroscopy Imaging
Nicholas Hamilton*
ARC Centre of Excellence in Bioinformatics, Institute forMolecular Bioscience, The University of Queensland, Qld4072, Australia∗Corresponding author: Nicholas Hamilton,[email protected]
Fluorescent microscope imaging technologies have
developed at a rapid pace in recent years. High-
throughput 2D fluorescent imaging platforms are now in
wide use and are being applied on a proteome wide scale.
Multiple fluorophore 3D imaging of live cells is being
used to give detailed localization and subcellular struc-
ture information. Further, 2D and 3D video microscopy
are giving important insights into the dynamics of
protein localization and transport. In parallel with these
developments, significant research has gone into devel-
oping new methodologies for quantifying and extracting
meaning from the imaging data. Here we outline and
give entry points to the literature on approaches to quan-
tification such as segmentation, tracking, automated
classification and data visualization. Particular attention
is paid to the distinction between and application of
concrete quantification measures such as number of
objects in a cell, and abstract measures such as texture.
Key words: confocal microscopy, image analysis, image
quantification, subcellular imaging, visualization
Received 25 February 2009, revised and accepted for pub-
lication 1 May 2009, uncorrected manuscript published
online 5 May 2009, published online 3 June 2009
Unlike many imaging methodologies such as X-ray crys-tallography that are intrinsically analytic and mathematical,fluorescent microscopy has been slower to take advan-tage of and to develop novel methods in analysis andquantification. This may in part be because of the factthat the results may immediately be ’seen’ and hencequantification may not appear essential. The diversity ofusers such as cell biologists, cancer researchers, neuro-scientists and plant biologists also ensures that the fieldfurther suffers from a literature that is scattered in spe-cialist journals and publications unlikely to be read by thecell biologist.
Hence, while there are several widely known quantifi-cation methodologies such as co-localization analysis,
fluorescence resonance energy transfer (FRET), fluo-rescence correlation spectroscopy (FCS), fluorescencerecovery after photobleaching (FRAP) and fluorescencelifetime imaging microscopy (FLIM), the range of meth-ods applicable to fluorescent imaging of cells is muchbroader than may be apparent. In response to the recentadvances in imaging technologies, new methods are beingdeveloped in automated classification, machine learning,image statistics, clustering, visualization, modelling, fea-ture extraction, segmentation and object tracking to firstlydeal with the scale of the data becoming available, butmore importantly to find new ways to extract the infor-mation contained within the data sources and fully exploittheir potential.
There is a wide range of reasons to want to quantifyfluorescent imaging. One of the most important is theneed to remove potential (unconscious) bias in dataselection. A typical microscope may well contain upwardsof 1000 cells, the majority of which will not be examined indetail when observing by eye, for instance, the localizationof a protein. As well as selection bias, important datamay be missed. Of those 1000 cells, a small proportionmight be exhibiting a distinct or multiple localizations.If only 1–2% of the available data are being sampled,such effects will in all likelihood be missed and may havebeen the more interesting result. Similarly, quantificationof large numbers of images gives the statistical power todetect subtle effects when comparing experiments. Uponstimulation of a pancreatic cell with sucrose, there mightbe a 5% drop in the number of insulin granules in the cellas the insulin is released into the intracellular environment;an effect that would be visually undetectable. However,with an automated granule counting assay, 100’s of cellsmight be quantified under a variety of treatments and thecompounds found that subtly change this response. Morebroadly, with whole proteome localization imaging now areality (1), automated quantification and classification arebecoming essential to deal with the growth in imaging dataand remove the bottleneck of manual inspection. In thelonger term, quantification is needed to enable the sorting,comparison and integration of the valuable data containedin the millions of fluorescent images that are now beinggenerated each year. Just as database, searching andquantification methodologies have added great value tothe sequencing revolution, similar tools for imaging willextend the range of biological conclusions that can bemade. Finally, fluorescent imaging is potentially a rich datasource for mathematical modelling. With the ability toobserve and quantify multiple proteins simultaneously in a
www.traffic.dk 951
Hamilton
live cell context over time and under a range of conditions,there is now the data to begin to model and understandthe systems biology of the cell.
The purpose here is to outline the main approachesand progress that is being made in the analysis ofsubcellular imaging, give entry points to the literature,and to identify some of the points at which furtherresearch is required. To a large degree, image analysisbegins once an image set has been captured. In thefollowing, a range of analysis options that might be appliedto such an image set will be described. However, there isstrong need for analysis options to be considered beforethe images are acquired. Firstly, as has been observed:’tweaking microscope settings for 5 min could savemonths of tweaking algorithms’ (2). But more importantly,awareness of the analysis options changes the range ofexperiments that will be attempted and conclusions thatcan be drawn. Further, simply posing the question of ‘howcould the difference be quantified?’ can give invaluableinsights into the data.
Spatial Imaging
Abstract and concrete image quantification
Within fluorescent image analysis there are presently twomain approaches to quantification measures. The first,and most well known, might be called concrete statistics.These include counting measures such as the number ofstructures in a cell, the volume occupied by a structureor the ratio of fluorescent intensity between regions. Atthe other end of the spectrum are abstract statisticsto measure image content. These are abstract in thesense that they measure properties of an image suchas texture or morphology, rather than the more concretecounting measures. One such set of image statistics arethe Haralick texture measures (3), the essence of which isto quantify correlations between pixels at a given distanceand angular separation.
The advantage in concrete measures is that it isimmediately apparent what is being measured, and thusit is possible to make statements such as ’there wasa 50% reduction in the count under treatment withcompound X’. However, the choice of concrete measuresis typically based on the expectations of the researcher,and hence unexpected distinctions may be missed. Incontrast, abstract measures such as texture make fewerassumptions and tend to be more generic in the rangeof imaging that can be distinguished. But while abstractstatistics may distinguish a wider range of experiments,what the actual difference is can be less clear. In thenext section concrete statistics generation and theirapplications will be outlined, followed by a section onapplications of abstract statistics.
Segmentation and quantification
Quantification from fluorescent imaging involves severalstages, each of which may influence the results in another.
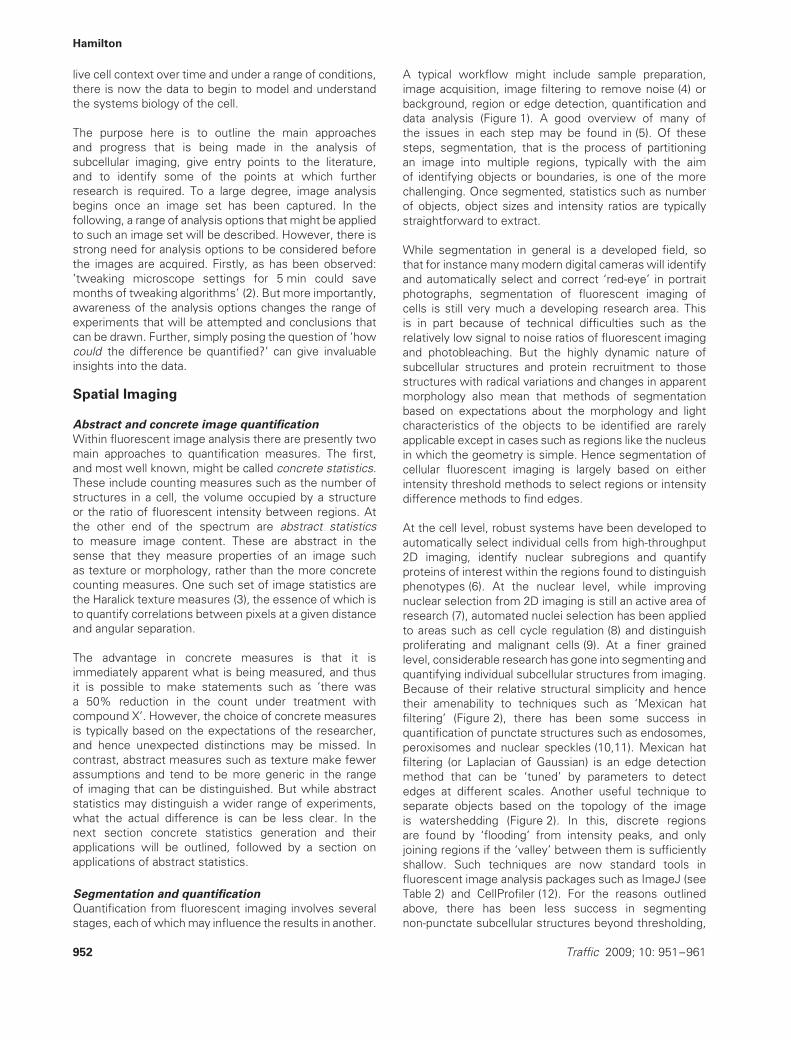
A typical workflow might include sample preparation,image acquisition, image filtering to remove noise (4) orbackground, region or edge detection, quantification anddata analysis (Figure 1). A good overview of many ofthe issues in each step may be found in (5). Of thesesteps, segmentation, that is the process of partitioningan image into multiple regions, typically with the aimof identifying objects or boundaries, is one of the morechallenging. Once segmented, statistics such as numberof objects, object sizes and intensity ratios are typicallystraightforward to extract.
While segmentation in general is a developed field, sothat for instance many modern digital cameras will identifyand automatically select and correct ‘red-eye’ in portraitphotographs, segmentation of fluorescent imaging ofcells is still very much a developing research area. Thisis in part because of technical difficulties such as therelatively low signal to noise ratios of fluorescent imagingand photobleaching. But the highly dynamic nature ofsubcellular structures and protein recruitment to thosestructures with radical variations and changes in apparentmorphology also mean that methods of segmentationbased on expectations about the morphology and lightcharacteristics of the objects to be identified are rarelyapplicable except in cases such as regions like the nucleusin which the geometry is simple. Hence segmentation ofcellular fluorescent imaging is largely based on eitherintensity threshold methods to select regions or intensitydifference methods to find edges.
At the cell level, robust systems have been developed toautomatically select individual cells from high-throughput2D imaging, identify nuclear subregions and quantifyproteins of interest within the regions found to distinguishphenotypes (6). At the nuclear level, while improvingnuclear selection from 2D imaging is still an active area ofresearch (7), automated nuclei selection has been appliedto areas such as cell cycle regulation (8) and distinguishproliferating and malignant cells (9). At a finer grainedlevel, considerable research has gone into segmenting andquantifying individual subcellular structures from imaging.Because of their relative structural simplicity and hencetheir amenability to techniques such as ‘Mexican hatfiltering’ (Figure 2), there has been some success inquantification of punctate structures such as endosomes,peroxisomes and nuclear speckles (10,11). Mexican hatfiltering (or Laplacian of Gaussian) is an edge detectionmethod that can be ‘tuned’ by parameters to detectedges at different scales. Another useful technique toseparate objects based on the topology of the imageis watershedding (Figure 2). In this, discrete regionsare found by ‘flooding’ from intensity peaks, and onlyjoining regions if the ‘valley’ between them is sufficientlyshallow. Such techniques are now standard tools influorescent image analysis packages such as ImageJ (seeTable 2) and CellProfiler (12). For the reasons outlinedabove, there has been less success in segmentingnon-punctate subcellular structures beyond thresholding,
952 Traffic 2009; 10: 951–961
Fluorescent Microscopy Imaging
Figure 1: Typical steps in (concrete) quantification of fluorescent imaging. Before image acquisition commences it is worthconsidering the kinds of analyses for which the imaging is required. For instance, if analysis is to be performed on a per cell basis,ensuring that the cells have low confluency on the plate can save considerable time by enabling automatic selection of individual cells.Similarly, if imaging experiments of treated/untreated cells, utilizing identical microscope settings such as exposure time will reducethe chance of detecting differences in imaging conditions rather than a true variation between experiments. Once imaging has beenacquired, some filtering such as background subtraction to remove uneven illumination or a diffuse cytoplasmic signal, or medianfiltering to reduce noise can be appropriate. However, care should be taken that such filtering is not altering the truth of the experiment.Hence median filtering can be appropriate to enable better object selection, but filtering before taking intensity measurements might notbe justifiable. Object detection then often involves testing several edge detection or segmentation methods and adjusting parametersto find the ones that produce the best results. Once segmentation has occurred generating statistics on the number, size, spatialdistribution and so on is usually straightforward, and the data can then be analysed. As data sets become larger, data visualizationtechniques are becoming increasingly important. Visual comparison across more than four to five columns of data is difficult, and so itis often beneficial to represent the data utilizing colour, size, spatial and time dimensions to give the eye the opportunity for insight intothe data. Finally, analyses will often suggest further avenues for experimentation or the need for more imaging in order that statisticalsignificance can be achieved. In creating an analysis cycle it is to be recommended to test and adjust the pipeline on a small set ofimages before commencing on a large-scale image capture. Figure 3 gives a similar workflow for abstract image statistics.
edge detection and watershedding schemes, althoughneurite segmentation is an exception (13). A wide range ofmethods with references can be found in Table 1 of (14).
Imaging in two dimensions can be problematic for seg-mentation as objects that apparently overlap may bespatially separated in the third dimension. Hence 3D fluo-rescent imaging provides both opportunities in a moredetailed view of subcellular structures and a greateramenability to segmentation and quantification, and isa developing area of research for segmentation. Usingsegmentation techniques such as gradient flows and cou-pled active surfaces nuclei may readily be segmented andquantified from 3D fluorescent imaging (15,16). Similarly,tools exist to count and quantify punctate structures in3D imaging via watershedding techniques (17). Furtherexamples and tools for segmentation and visualizationof 3D fluorescent imaging may be found in (17,18) andreferences therein.
At present there is no universal solution to segmentationof fluorescent imaging. For the microscopist, the usualapproach is to experiment in software such as ImageJ thatsupports a range of methods. If simple approaches such as
thresholding fail because of background intensity variationor highly clustered objects, then edge detection or water-shedding methods might be tried. If these fail, a literaturesearch may turn up software methods that have beenspecifically designed for the imaging of interest. In somecases, small changes in experimental protocol or imagecapture setting may improve segmentation results. In thisway, fluorescent image segmentation is still an experi-mental science involving an iterative process of testing andalteration of computational and experimental methods.
Classification and testing for difference
In understanding the functions of the tens of thousandsof proteins being found by the sequencing revolution themost fundamental question is what does the protein do?The first steps towards this are where is the protein in acell? and what does it interact with? Towards answeringthese, modern automated fluorescent microscopy offeran enormous depth and coverage of information: depth inthat a single well may contain over a thousand cells thatcan be imaged in a few tens of seconds; and coverage inthat whole proteomes may now be imaged. However, thenumber of images so obtained is overwhelming. In 2003,some 75% of the yeast proteome (4156 proteins) was
Traffic 2009; 10: 951–961 953
Hamilton
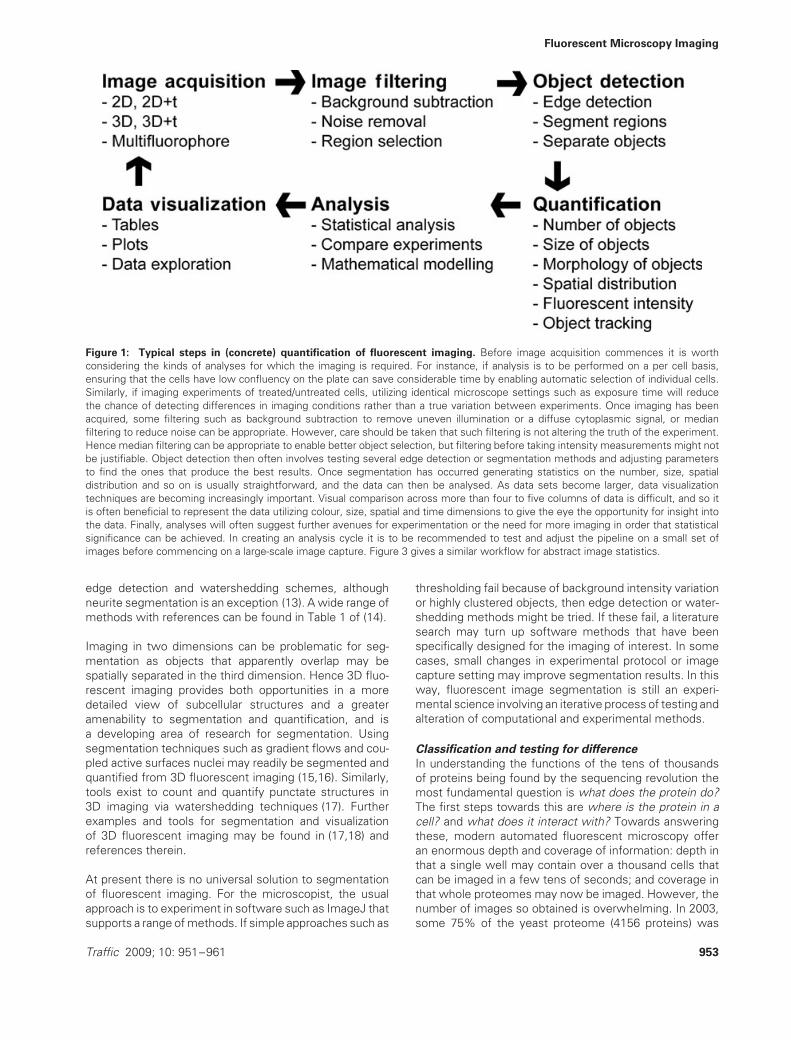
Figure 2: Examples of object selection. A) An image of 4’,6-diamidino-2-phenylindole (DAPI) stained nuclei in HeLa cells (Imagecourtesy Teasdale Group, IMB). One approach to object detection is Laplacian of Gaussian (LoG) edge filtering, the result of which canbe seen in (B). Edge detection via LoG first utilizes a Gaussian filter: each pixel in the image is replaced by a weighted average of theintensity of pixels in the local area, the weighting given by a Gaussian distribution centred on the pixel of interest. The effect of theGaussian filtering is to smooth or blur the image, and choice of different widths of the Gaussian in the LoG filter may be utilized toextract features on different scales in the image. A Laplacian operator is then applied to the image to calculate the second derivativeof the image. The second derivative is zero in flat regions of an image; positive on one side of an edge; negative on the other; andzero at some point between. Hence edges maybe found by determining the ‘zero-crossings’ of the LoG filter and gives results suchas shown in (B). In practice, the calculation of the LoG intensity image often occurs in a single step with a convolution matrix beingused to replace each pixels intensity with a weighted average of pixels in the local area. Interpreting the weights in the convolutionmatrix as ‘heights’, the result looks somewhat like a Mexican hat. Image (B) was generated using the LoG filter available as a plug-in toImageJ. It can be seen in (B) that the LoG filter has found the majority of edges of the nuclei. Also, the soft glow between the two cellsin the lower right corner has correctly not been detected. However, two closely adjacent cells in the centre of the image have beenincorrectly segmented with a single boundary enclosing both.
Watershedding may sometimes be used to cut objects that are touch. There are many variants of watershed methods, buthere the one implemented in the ImageJ core is briefly described. The first step is to create a binary image for which white regionscorrespond to objects of interest and black to background. The image in (C) was constructed by first subtracting background using arolling ball method (implemented in ImageJ) to remove unevenness in intensity of the background. An intensity threshold was thenapplied to create the binary image (C). C) The image might similarly have been produced by taking the results of the LoG filter in (B) andfilling the enclosed regions with white. A distance map (D) is then generated from (C). The intensity of each pixel in (D) is proportionalto the distance of the corresponding pixel in (C) to a black region. Hence the central regions of the nuclei become intensity peaks. Thenext step in the algorithm is to ‘flood’ from the intensity peaks. Distinct regions are then incrementally grown from each intensity peakuntil all non-background regions are covered. Where regions from distinct intensity peaks meet, boundaries are formed (E). It can beseen that the region delineating the two nuclei incorrectly segmented in (B) contains two peaks in (D) and a boundary between the twocan be seen in (E).
screened and manually classified into 22 localizations (1).Further, it has been estimated that a complete humangenome RNAi screen could be imaged in approximately 2weeks, but would give rise to 106 images (19).
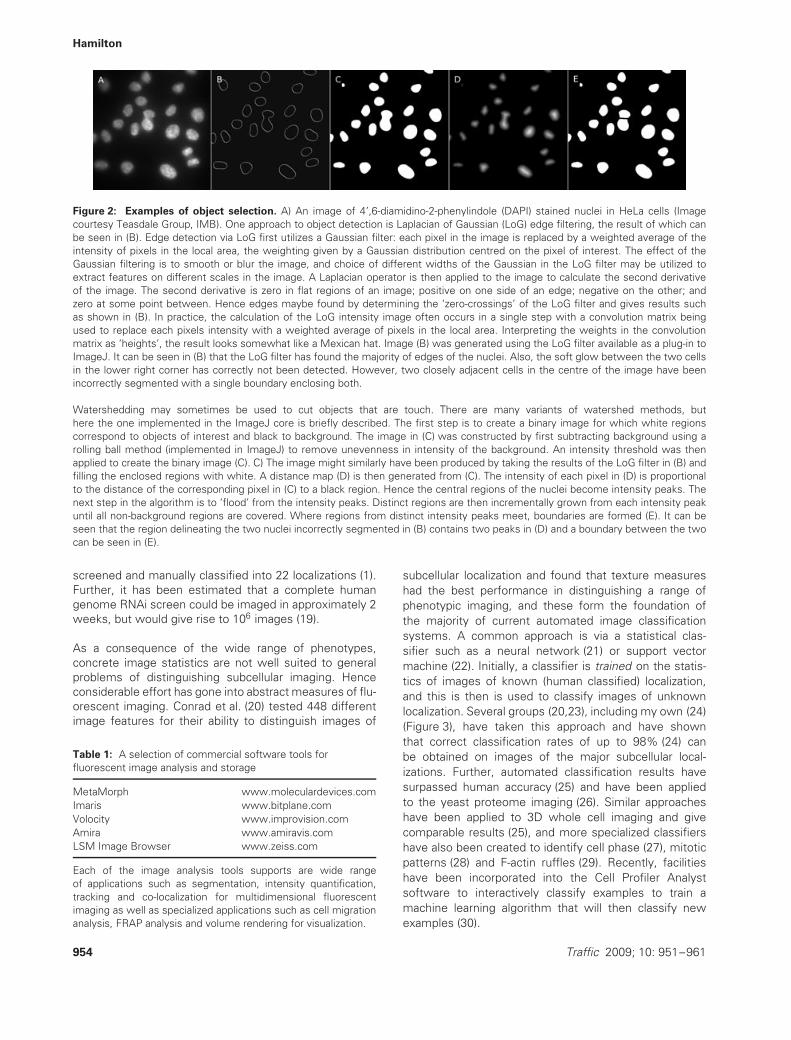
As a consequence of the wide range of phenotypes,concrete image statistics are not well suited to generalproblems of distinguishing subcellular imaging. Henceconsiderable effort has gone into abstract measures of flu-orescent imaging. Conrad et al. (20) tested 448 differentimage features for their ability to distinguish images of
Table 1: A selection of commercial software tools forfluorescent image analysis and storage
MetaMorph www.moleculardevices.comImaris www.bitplane.comVolocity www.improvision.comAmira www.amiravis.comLSM Image Browser www.zeiss.com
Each of the image analysis tools supports are wide rangeof applications such as segmentation, intensity quantification,tracking and co-localization for multidimensional fluorescentimaging as well as specialized applications such as cell migrationanalysis, FRAP analysis and volume rendering for visualization.
subcellular localization and found that texture measureshad the best performance in distinguishing a range ofphenotypic imaging, and these form the foundation ofthe majority of current automated image classificationsystems. A common approach is via a statistical clas-sifier such as a neural network (21) or support vectormachine (22). Initially, a classifier is trained on the statis-tics of images of known (human classified) localization,and this is then is used to classify images of unknownlocalization. Several groups (20,23), including my own (24)(Figure 3), have taken this approach and have shownthat correct classification rates of up to 98% (24) canbe obtained on images of the major subcellular local-izations. Further, automated classification results havesurpassed human accuracy (25) and have been appliedto the yeast proteome imaging (26). Similar approacheshave been applied to 3D whole cell imaging and givecomparable results (25), and more specialized classifiershave also been created to identify cell phase (27), mitoticpatterns (28) and F-actin ruffles (29). Recently, facilitieshave been incorporated into the Cell Profiler Analystsoftware to interactively classify examples to train amachine learning algorithm that will then classify newexamples (30).
954 Traffic 2009; 10: 951–961
Fluorescent Microscopy Imaging
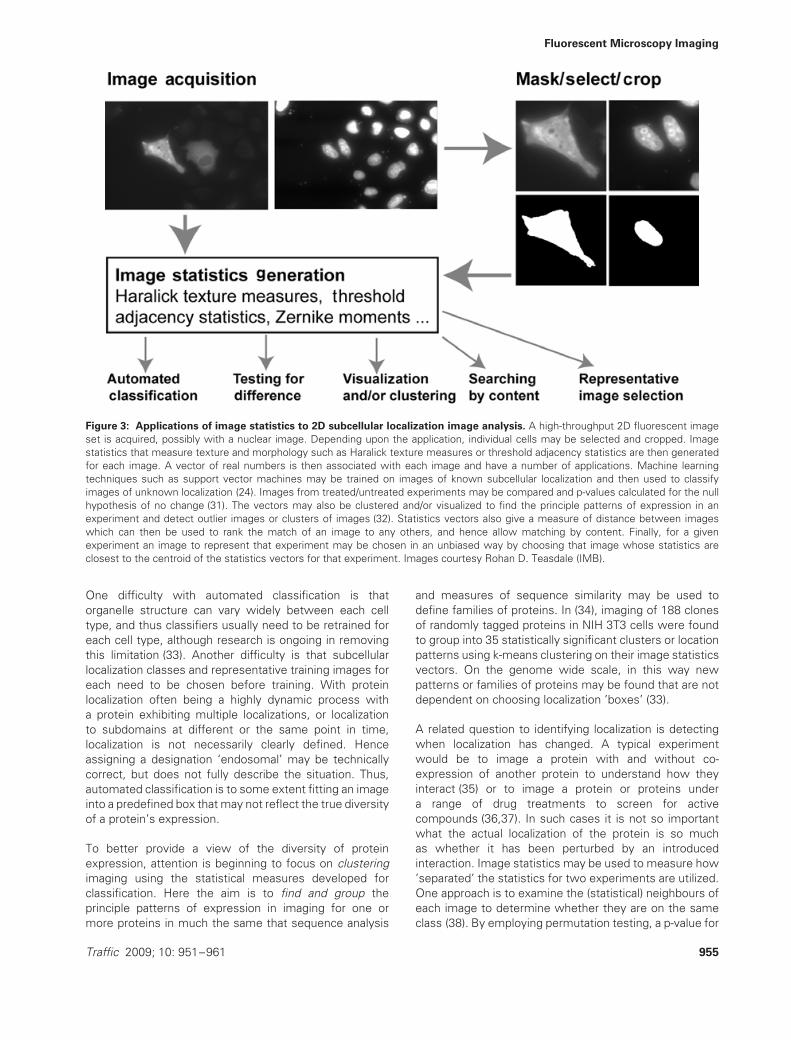
Figure 3: Applications of image statistics to 2D subcellular localization image analysis. A high-throughput 2D fluorescent imageset is acquired, possibly with a nuclear image. Depending upon the application, individual cells may be selected and cropped. Imagestatistics that measure texture and morphology such as Haralick texture measures or threshold adjacency statistics are then generatedfor each image. A vector of real numbers is then associated with each image and have a number of applications. Machine learningtechniques such as support vector machines may be trained on images of known subcellular localization and then used to classifyimages of unknown localization (24). Images from treated/untreated experiments may be compared and p-values calculated for the nullhypothesis of no change (31). The vectors may also be clustered and/or visualized to find the principle patterns of expression in anexperiment and detect outlier images or clusters of images (32). Statistics vectors also give a measure of distance between imageswhich can then be used to rank the match of an image to any others, and hence allow matching by content. Finally, for a givenexperiment an image to represent that experiment may be chosen in an unbiased way by choosing that image whose statistics areclosest to the centroid of the statistics vectors for that experiment. Images courtesy Rohan D. Teasdale (IMB).
One difficulty with automated classification is thatorganelle structure can vary widely between each celltype, and thus classifiers usually need to be retrained foreach cell type, although research is ongoing in removingthis limitation (33). Another difficulty is that subcellularlocalization classes and representative training images foreach need to be chosen before training. With proteinlocalization often being a highly dynamic process witha protein exhibiting multiple localizations, or localizationto subdomains at different or the same point in time,localization is not necessarily clearly defined. Henceassigning a designation ‘endosomal’ may be technicallycorrect, but does not fully describe the situation. Thus,automated classification is to some extent fitting an imageinto a predefined box that may not reflect the true diversityof a protein’s expression.
To better provide a view of the diversity of proteinexpression, attention is beginning to focus on clusteringimaging using the statistical measures developed forclassification. Here the aim is to find and group theprinciple patterns of expression in imaging for one ormore proteins in much the same that sequence analysis
and measures of sequence similarity may be used todefine families of proteins. In (34), imaging of 188 clonesof randomly tagged proteins in NIH 3T3 cells were foundto group into 35 statistically significant clusters or locationpatterns using k-means clustering on their image statisticsvectors. On the genome wide scale, in this way newpatterns or families of proteins may be found that are notdependent on choosing localization ’boxes’ (33).
A related question to identifying localization is detectingwhen localization has changed. A typical experimentwould be to image a protein with and without co-expression of another protein to understand how theyinteract (35) or to image a protein or proteins undera range of drug treatments to screen for activecompounds (36,37). In such cases it is not so importantwhat the actual localization of the protein is so muchas whether it has been perturbed by an introducedinteraction. Image statistics may be used to measure how’separated’ the statistics for two experiments are utilized.One approach is to examine the (statistical) neighbours ofeach image to determine whether they are on the sameclass (38). By employing permutation testing, a p-value for
Traffic 2009; 10: 951–961 955
Hamilton
the null hypothesis of no difference between experimentsmay then be generated. Similarly, in my own research, thedistance between the mean vectors for two experimentsgave a measure of how separated experiments were, andpermutation testing could then be employed to assignp-values for how unlikely that separation was under theassumption of the null hypothesis (31). With this approachit was possible to differentiate 10 distinct localizations inHeLa cells and detect relatively subtle changes such asendosomal redistribution.
Imaging in Time
Live cell fluorescent video microscopy offers a wealth ofinformation on the dynamic organization of proteins andsubcellular structures that is unavailable in static 2D and3D imaging. With the addition of time, organelle dynamicsas proteins are recruited, transported and expelled canbe viewed in detail and the passage though a cell ofproteins and the structures that they interact with canbe readily observed. However, while visual comparisonof spatial structures for differences such as in size andmorphology may be easily made if the differences arelarge enough, comparisons in time are more difficult, andhence quantification is essential to detect anything butthe coarsest features of the image data.
Tracking
As with segmentation, object tracking from fluorescentvideo microscopy presents many challenges. Objectsviewed may join, split, disappear, change directionor substantially change their morphology, and thereare technical challenges such as photobleaching andcompromises between spatial and temporal resolution.Typically, higher spatial resolution leads to betteridentification of the objects to be tracked, but reducesthe time resolution and hence the ability to decidewhich object corresponds to which at distinct time-points.Further, depending on the markers used, the subcellularenvironment can appear complex and cluttered. Hencetracking algorithms developed in other research areasand adapted to fluorescent video microscopy tendto perform poorly (14) and considerable research hasgone into designing algorithms specific to fluorescentimaging. Typical steps taken in object tracking are imageacquisition, image filtering to enhance object detection,segmentation or object detection and finally matchingof objects at different time-point to create paths. Oneadvantage that tracking can have over other imagequantification problems is that in most cases imagefiltering need only preserve the position of the detectedobject and not necessarily the structure. An excellentreview of approaches taken is given in (14).
The art of tracking is in the matching of objects betweenimages to create paths. At its simplest, an object ismatched to the object that it is closest to in the successiveimage within a given radius (the expected maximum
distance an object can move between frames). Variationsallow objects to appear or disappear temporarily orpermanently, or state the problem as a global optimizationproblem to minimize the total path lengths of objects, forinstance. However, such an approach is likely to fail inenvironments in which the typical distances betweenobjects are of the order of the distance an objectmay move between time-points. Technologies such asquantum dots (39) attempt to avoid this by introducinga few fluorescently bright dots to track. Improvedtracking can occur by incorporating assumptions aboutthe object tracked such as maximum changes in velocity,morphology or size. With such models, objects can oftenbe tracked in surprisingly complicated environments. Forinstance, in (40) complex networks of microtubules couldbe tracked firstly by filtering to enhance lines and thenutilizing the fact that the tips of microtubules either growor shorten to track them. From such tracking, detailedstatistics of microtubule behaviour could then be obtained.
Another approach is to track features (without segmenta-tion) rather than objects. In SpotTracker (41), a particle istracked in complex environments by considering all possi-ble paths taken and a cost function to optimize involvingpath smoothness, distance and passing through bright pix-els. Thus the particle is not segmented from the image,but the algorithm tracks a bright feature within certain con-straints. This enabled telomeres to be accurately trackeddespite potential confusion with the nuclear envelope thatalso appeared in the imaging. Combinations of segmen-tation and features have also been successfully appliedto automate lineage tracking up to the 350 cell stage inCaenorhabditis elegans (42).
Possibly, the most ambitious tracking to date was thatcreated to investigate the dynamics of promyelocyticleukemia nuclear bodies (PML NBs) in mitosis (43). In thiswork human osteosarcoma cells (U2 OS) were imagedin 3D over time with varieties of marker proteins. Nucleiat distinct time-points were then registered with eachother by applying appropriate rotations and translations,the results segmented, and the PML bodies then trackedin each nucleus. This gave very detailed information onchanges in the dynamics of PML NBs at stages of mitosisand associations with mitotic proteins.
Quantifying over time
While tracking and counting objects over time givesinvaluable information about the movement and dynamicsof cells and subcellular structures, intensity informationwithin tracked objects can also be exploited. Twoexamples are given here, one at the cellular and oneat the subcellular level.
At the cell and multicellular level, automated trackinghas been combined with automated classification toelucidate the phases and timing of the mitosis (28).Multicell 3D image sequences in time of the chromosomalmarker histone 2B-enhanced green fluorescent protein
956 Traffic 2009; 10: 951–961
Fluorescent Microscopy Imaging
(EGFP) were generated. These were then automaticallysegmented into individual nuclei, tracked and mitoticevents identified as points at which new tracks wereinitiated. Each nuclei at a time-point was also classified intoone of seven cell cycle classes utilizing automated texturebased classification techniques similar to those describedearlier. This enabled automated analysis of the duration ofthe phases of the cell life cycle in high throughput, andhas the potential to be applied to high-throughput RNAiscreens to explore the coordination of mitotic processes.
At the subcellular level, in my group’s collaborations, 2Dand 3D video microscopy has been used to study the roleof 3-phosphoinositides in macropinocytosis (44). A typicalexperiment involves two fluorescent markers: dextran tofill and delineate the region of the macropinosome and amarker such as GFP-2xFYVE to track phosphatidylinositol-3-phosphate (PI(3)P). The dextran channel is used to createa mask of the macropinosome and track its movements,and within this mask the average intensity within thePI(3)P channel could be calculated. In this way the rate ofrecruitment, the time of retention and the rate of expulsionof phosphoinositides from the macropinosome could beautomatically obtained. Combinations of phosphoinositidemarkers could be used to show quantitatively the orderand timings of recruitments and expulsions from themacropinosomes.
Visual Data Representation
As high-throughput imaging and analysis becomes morecommonplace, there is a need to develop a language ofdata representation and visualization to make sense ofand convey the meaning of the multidimensional data.New forms of data require new forms of representation.As noted by Edward Tufte, a pioneer in the field of datavisualization, ‘‘At their best, graphics are instruments forreasoning about quantitative information’’ (45).
With many fields having utilized 3D and 4D imaging,numerous tools exist to surface and volume render (18),but techniques need to be adapted to visualizing theinformation of interest to the fluorescent microscopist. Inthe dense environment of the cell relative, motility of evensegmented and rendered objects observed can be difficultto ascertain when viewed as a movie. One approach toovercoming this is to use time as a spatial dimension.In (46), vesicles were segmented and tracked from 3Dsubcellular movies, and the dimensionality reduced byz-projection giving a 2D image for each time-point.These were then visualized in 3D with the third spatialdimension being the time-point from the movie. Hencestable vesicles appeared as long straight cylinders, whilemore motile vesicles would show greater curvature inthe time dimension enabling a fast visual assessment ofthe motility state of a large number of vesicles. In mygroups work we have used similar techniques to visualizethe growth and retraction of tubules from vesicles during
endocytosis (47). The advantage in transforming the timedimension into a spatial one is that all of the data can beviewed, compared and the relationships between objectsand the timing of events seen at a glance.
In another visualization technique borrowed from phy-logeny, statistics generated to quantify imaging havebeen used to define distances between images, andhence generate ‘phylogenetic’ trees for imaging. In (9),this approach was used to cluster and creates similar-ity trees for confocal images of breast epithelial cells,and in (34) a consensus subcellular localization tree wascreated for imaging from 126 wells of randomly tagged3T3 cells. In this way it was possible to see the relation-ships between images, but also the hierarchical structurenaturally created classes such as ‘punctate’ as unionsof several localization classes. Along similar lines, in mygroup, we are interested in comparing and reviewinghigh-throughput imaging. Towards this the iCluster high-throughput subcellular localization imaging visualizationand clustering tool was developed (Figure 4) (31,32). Inthe software, large image sets from single or multipleexperiments may be loaded, statistics generated for eachimage and then mapped into two or three dimensions insuch a way as to preserve the distances between thestatistics vectors. In this way images that are statisti-cally similar are spatially close, and dissimilar images aredistance, thus allowing the full range of patterns of expres-sion of experiment(s) to be readily observed. Outliers andunusual cells are then easily detected, and differencesbetween treated and untreated experiments can be seenas spatial separation.
Software Tools
In any rapidly developing field requiring computationalsupport, software to implement new methodologies isinevitably a significant problem. Several commercial solu-tions for analysis of fluorescent imaging are now availableand provide a wide range of functionality (Table 1). How-ever, the rise of several large-scale open source projectssuch as ImageJ, Cell Profiler and the Open MicroscopyEnvironment (Table 2) are now beginning to provide a pow-erful alternative. ImageJ provides functions for commonlyperformed image analysis tasks such as thresholding, par-ticle detection, watershedding, region selection, intensityquantification and so forth; Cell Profiler (6) is principallyfor high-throughput image quantification and automatedanalysis; and the Open Microscopy Environment (12)supports data management for light microscopy andhas components for storing, visualizing, managing, andannotating microscopic images and metadata.
The importance of these open source projects is thatthey provide a high quality common foundation andenvironment for sharing methods and tools in bio-imageanalysis that can be built upon and verified. Each providesa plug-in architecture or application programming interface
Traffic 2009; 10: 951–961 957

Hamilton
Figure 4: Visualizing to make sense of high-throughput imaging. One thousand and four hundred images of 10 subcellularlocalizations spatially arranged by iCluster are shown (31,32). For each image, threshold adjacency statistics and Haralick texturemeasures are generated to associate a vector with that image. Vectors are Sammon mapped into three dimensions such that distancesbetween vectors are preserved to a high degree. Images are then visualized at the coordinates so found. Each border colour representsa different subcellular localization. It can be seen that images of the same localization are largely clustered together, hence outliersand distinct patterns of localization are visually readily detectable. iCluster also provides facilities for representative image selection,statistical testing for difference between image sets and image reclassification. While developed for subcellular imaging, iCluster canbe applied to any objects for which there are high-dimensional data that need to be visualized in low dimensions to observe therelationships. Cell images courtesy Rohan D. Teasdale (IMB).
which enables researchers to easily contribute newmethods as they are developed and exploit a core oflibrary of functions and plug-ins previously contributed.For instance, ImageJ has some 500 contributed plug-ins and 300 macros. Macro creation and recordingfacilities allow even the novice user to establish
and distribute analysis pipelines using combinations offunctions.
Another significant advantage in the open source analysisand storage projects is in interoperability. Hence ImageJ,Cell Profiler and Open Microscopy Environment are
Table 2: A selection of open source software tools for fluorescent image analysis and storage
ImageJ rsbweb.nih.gov/ij/download.html Image analysis and quantification with many plug-insCell Profiler www.cellprofiler.org/download.htm High-throughput image quantification and analysis (6)CPAnalyst www.cellprofiler.org/downloadCPA.htm Image analysis including machine classification (30)OME www.openmicroscopy.org/site/downloads Visualizing, analysis and managing microscope data (12)BISQUE www.bioimage.ucsb.edu/downloads Bio-image database and analysisCellID www.molsci.org/protocols/software.html Cell finding, tracking and analysis (48)Murphy Lab murphylab.web.cmu.edu/software/ Automated image classification and applications (25)ImageSurfer 152.19.37.82/main/ Multichannel volume visualization and analysis (18)iCluster icluster.imb.uq.edu.au/ Visual and statistical image differentiation (31)
958 Traffic 2009; 10: 951–961
Fluorescent Microscopy Imaging
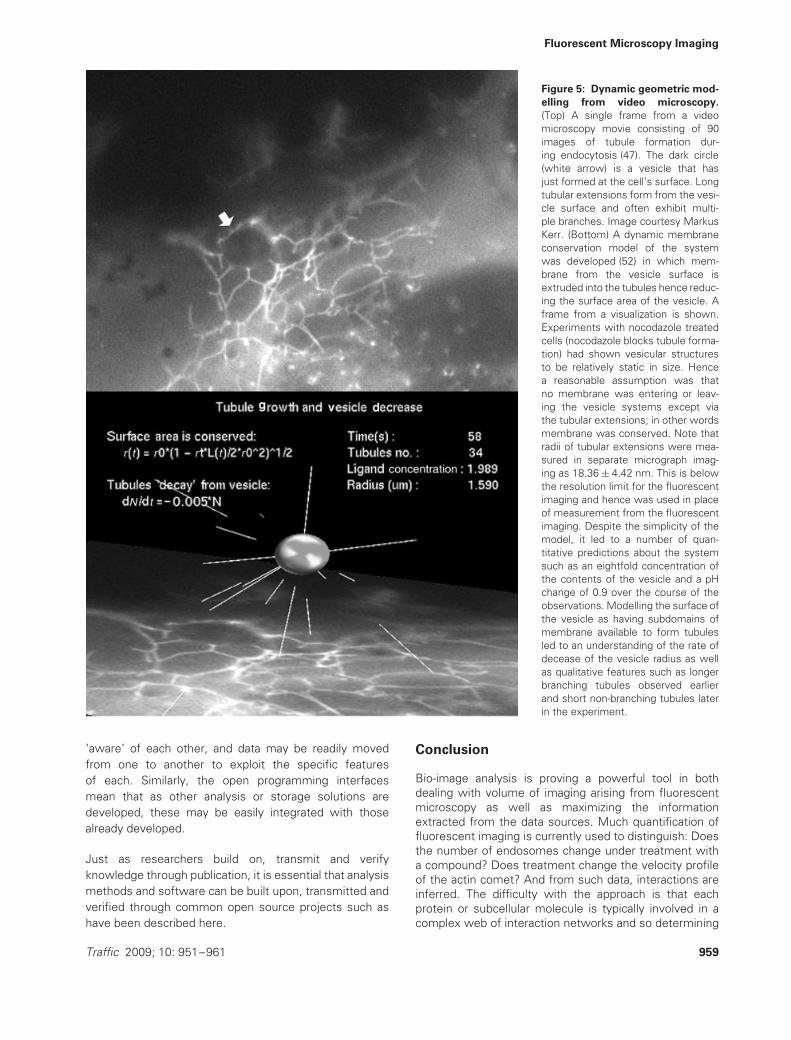
Figure 5: Dynamic geometric mod-
elling from video microscopy.
(Top) A single frame from a videomicroscopy movie consisting of 90images of tubule formation dur-ing endocytosis (47). The dark circle(white arrow) is a vesicle that hasjust formed at the cell’s surface. Longtubular extensions form from the vesi-cle surface and often exhibit multi-ple branches. Image courtesy MarkusKerr. (Bottom) A dynamic membraneconservation model of the systemwas developed (52) in which mem-brane from the vesicle surface isextruded into the tubules hence reduc-ing the surface area of the vesicle. Aframe from a visualization is shown.Experiments with nocodazole treatedcells (nocodazole blocks tubule forma-tion) had shown vesicular structuresto be relatively static in size. Hencea reasonable assumption was thatno membrane was entering or leav-ing the vesicle systems except viathe tubular extensions; in other wordsmembrane was conserved. Note thatradii of tubular extensions were mea-sured in separate micrograph imag-ing as 18.36 ± 4.42 nm. This is belowthe resolution limit for the fluorescentimaging and hence was used in placeof measurement from the fluorescentimaging. Despite the simplicity of themodel, it led to a number of quan-titative predictions about the systemsuch as an eightfold concentration ofthe contents of the vesicle and a pHchange of 0.9 over the course of theobservations. Modelling the surface ofthe vesicle as having subdomains ofmembrane available to form tubulesled to an understanding of the rate ofdecease of the vesicle radius as wellas qualitative features such as longerbranching tubules observed earlierand short non-branching tubules laterin the experiment.
‘aware’ of each other, and data may be readily movedfrom one to another to exploit the specific featuresof each. Similarly, the open programming interfacesmean that as other analysis or storage solutions aredeveloped, these may be easily integrated with thosealready developed.
Just as researchers build on, transmit and verifyknowledge through publication, it is essential that analysismethods and software can be built upon, transmitted andverified through common open source projects such ashave been described here.
Conclusion
Bio-image analysis is proving a powerful tool in bothdealing with volume of imaging arising from fluorescentmicroscopy as well as maximizing the informationextracted from the data sources. Much quantification offluorescent imaging is currently used to distinguish: Doesthe number of endosomes change under treatment witha compound? Does treatment change the velocity profileof the actin comet? And from such data, interactions areinferred. The difficulty with the approach is that eachprotein or subcellular molecule is typically involved in acomplex web of interaction networks and so determining
Traffic 2009; 10: 951–961 959
Hamilton
the nature of the effect on the interaction network thatgave rise to the observed change can be problematic. Butas quantification methods become more commonplaceand sophisticated, the next step is to use the quantifieddata in combination with mathematical modelling in orderthat the interaction networks may be teased apart. Abeautiful example of this is given in the fluorescentimaging and mathematical modelling of oscillations innuclear factor κB (NF-κB) localization between nucleusand cytoplasm (49,50). Combining detailed fluorescentimaging data and modelling it was shown that the NF-κBsystem is oscillatory and uses delayed negative feedbackto direct nuclear-to-cytoplasmic cycling of transcriptionfactors. In my groups research, the simple geometricinformation available from live cell video microscopyproved an extraordinarily rich source of information to buildmathematical models and infer biologically relevant data(Figure 5). On the whole cell scale, research is beginninginto generative models of subcellular localization byfirst quantifying the range of morphologies and spatialdistributions of structures such as the plasma membrane,nucleus and lysosomes, and then utilizing the statisticsof the distributions to generate synthetic models ofcells (51). Once high-resolution spatial and temporalmaps of cellular distribution combining multiple proteinshave been created this will provide a foundation fromwhich to model and understand the systems biology ofthe cell.
Acknowledgments
The author would like to thank Dr Rohan D. Teasdale (UQ) and Dr MarkusC. Kerr (UQ) for their help in the editing and preparation of this manuscript.
References
1. Huh WK, Falvo JV, Gerke LC, Carroll AS, Howson RW, Weissman JS,O’Shea EK. Global analysis of protein localization in budding yeast.Nature 2003;425:686–691.
2. Auer M, Peng H, Singh A. Development of multiscale biological imagedata analysis: review of 2006 International Workshop on MultiscaleBiological Imaging, Data Mining and Informatics, Santa Barbara, USA(BII06). BMC Cell Biol 2007;8(Suppl. 1):S1.
3. Haralick RM. Statistical and structural approaches to texture. ProcIEEE 1979;67:768–804.
4. Broser PJ, Schulte R, Lang S, Roth A, Helmchen F, Waters J,Sakmann B, Wittum G. Nonlinear anisotropic diffusion filtering ofthree-dimensional image data from image data from two-photonmicroscopy. J Biomed Opt 2004;9:1253–1264.
5. Ronneberger O, Baddeley D, Scheipl F, Verveer PJ, Burkhardt H,Cremer C, Fahrmeir L, Cremer T, Joffe B. Spatial quantitative analysisof fluorescently labeled nuclear structures: problems, methods,pitfalls. Chromosome Res 2008;16:523–562.
6. Carpenter A, Jones T, Lamprecht M, Clarke C, Kang I, Friman O,Guertin D, Chang J, Lindquist R, Moffat J, Golland P, Sabatini D.CellProfiler: image analysis software for identifying and quantifyingcell phenotypes. Genome Biol 2006;7:R100.
7. Gudla PR, Nandy K, Collins J, Meaburn KJ, Misteli T, Lockett SJ.A high-throughput system for segmenting nuclei using multiscaletechniques. Cytometry A 2008;73:451–466.
8. Stacey DW, Hitomi M. Cell cycle studies based upon quantitativeimage analysis. Cytometry A 2008;73:270–278.
9. Long FH, Peng HC, Sudar D, Lelievre SA, Knowles DW. Phenotypeclustering of breast epithelial cells in confocal images based on nuclearprotein distribution analysis. BMC Cell Biol 2007;8(Suppl. 1):S3.
10. Pham TD, Crane DI, Tran TH, Nguyen TH. Extraction of fluores-cent cell puncta by adaptive fuzzy segmentation. Bioinformatics2004;20:2189–2196.
11. Niemisto A, Selinummi J, Saleem R, Shmulevich I, Aitchison J, Yli-Harja O. Extraction of the number of peroxisomes in yeastcells by automated image. Conf Proc IEEE Eng Med Biol Soc2006;1:2353–2356.
12. Schiffmann DA, Dikovskaya D, Appleton PL, Newton IP, CreagerDA, Allan C, Nathke IS, Goldberg IG. Open microscopy environmentand findspots: integrating image informatics with quantitativemultidimensional image analysis. Biotechniques 2006;41:199–208.
13. Abdul-Karim MA, Roysam B, Dowell-Mesfin NM, Jeromin A,Yuksel M, Kalyanaraman S. Automatic selection of parameters forvessel/neurite segmentation algorithms. IEEE Trans Image Process2005;14:1338–1350.
14. Kalaidzidis Y. Multiple objects tracking in fluorescence microscopy.J Math Biol 2009;58:57–80.
15. Li G, Liu T, Tarokh A, Nie J, Guo L, Mara A, Holley S, Wong S. 3D cellnuclei segmentation based on gradient flow tracking. BMC Cell Biol2007;8:40.
16. Dufour A, Shinin V, Tajbakhsh S, Guillen-Aghion N, Olivo-Marin JC,Zimmer C. Segmentation and tracking fluorescent cells in dynamic 3-D microscopy with coupled active surfaces. IEEE Trans Image Process2005;14:1396–1410.
17. Gniadek TJ, Warren G. WatershedCounting3D: a new method forsegmenting and counting punctate structures from confocal imagedata. Traffic 2007;8:339–346.
18. Feng D, Marshburn D, Jen D, Weinberg RJ, Taylor RM II, Burette A.Stepping into the third dimension. J Neurosci 2007;27:12757–12760.
19. Wollman R, Stuurman N. High throughput microscopy: from rawimages to discoveries. J Cell Sci 2007;120:3715–3722.
20. Conrad C, Erfle H, Warnat P, Daigle N, Lorch T, Ellenberg J, PepperkokR, Eils R. Automatic identification of subcellular phenotypes on humancell arrays. Genome Res 2004;14:1130–1136.
21. Bishop CM. Neural Networks for Pattern Recognition. Oxford: OxfordUniversity Press; 1995.
22. Cortes C, Vapnik V. Support vector networks. Mach Learn 1995;20:273–297.
23. Boland MV, Markey MK, Murphy RF. Automated recognition ofpatterns characteristic of subcellular structures in fluorescencemicroscopy images. Cytometry 1998;33:366–375.
24. Hamilton N, Pantelic R, Hanson K, Karunaratne S, Teasdale RD. Fastautomated cell phenotype image classification. BMC Bioinformatics2007;8:113.
25. Huang K, Murphy RF. From quantitative microscopy to automatedimage understanding. J Biomed Opt 2004;9:893–912.
26. Chen S-C, Zhao T, Gordon GJ, Murphy RF. Automated image analysisof protein localization in budding yeast. Bioinformatics 2007;23:i66–i71.
27. Wang M, Zhou X, Li F, Huckins J, King RW, Wong ST. Novel cellsegmentation and online SVM for cell cycle phase identification inautomated microscopy. Bioinformatics 2008;24:94–101.
28. Harder N, Eils R, Rohr K, Kevin FS. Automated classification of mitoticphenotypes of human cells using fluorescent proteins. Methods inCell Biology. Academic Press, New York; 2008;pp. 539–554.
29. Yi Q, Coppolino MG. Automated classification and quantification ofF-actin-containing ruffles in confocal micrographs. Biotechniques2006;40:745–746 8, 50 passim.
30. Jones TR, Carpenter AE, Lamprecht MR, Moffat J, Silver SJ, GrenierJK, Castoreno AB, Eggert US, Root DE, Golland P, Sabatini DM.
960 Traffic 2009; 10: 951–961
Fluorescent Microscopy Imaging
Scoring diverse cellular morphologies in image-based screens withiterative feedback and machine learning. Proc Natl Acad Sci U S A2009;2:2.
31. Hamilton N, Wang J, Kerr MC, Teasdale RD. Statistical and visualdifferentiation of high throughput subcellular imaging. BMC Bioinfor-matics 2009;10:94.
32. Hamilton N, Teasdale RD. Visualizing and clustering high throughputsub-cellular localization imaging. BMC Bioinformatics 2008;9:81.
33. Newberg J, Murphy R. A framework for the automated analysis ofsubcellular patterns in human protein atlas images. J Proteome Res2008;7:2300–2308.
34. Garcı́a Osuna E, Hua J, Bateman N, Zhao T, Berget P, Murphy R.Large-scale automated analysis of location patterns in randomlytagged 3T3 cells. Ann Biomed Eng 2007;35:1081–1087.
35. Fink JL, Karunaratne S, Mittel A, Gardiner D, Hamilton N, Teasdale RD.Towards defining the nuclear proteome. Genome Biol 2008;9:R15.
36. Cohen AA, Geva-Zatorsky N, Eden E, Frenkel-Morgenstern M, IssaevaI, Sigal A, Milo R Cohen-Saidon C, Liron Y, Kam Z, Cohen L, DanonT, Perzov N, Alon U. Dynamic proteomics of individual cancer cells inresponse to a drug. Science 2008;322:1511–1516.
37. Lang P, Yeow K, Nichols A, Scheer A. Cellular imaging in drugdiscovery. Nat Rev Drug Discov 2006;5:343–356.
38. Zhao T, Soto S, Murphy R, editors. Improved comparison of proteinsubcellular location patterns. 3rd IEEE International Symposiumon Biomedical Imaging: Nano to Macro. Arlington, Virginia: IEEE;2006.
39. Bonneau S, Dahan M, Cohen LD. Single quantum dot tracking basedon perceptual Grouping using minimal paths in a spatiotemporalvolume. IEEE Trans Image Process 2005;14:1384–1395.
40. Altinok A, Kiris E, Peck AJ, Feinstein SC, Wilson L, Manjunath BS,Rose K. Model based dynamics analysis in live cell microtubuleimages. BMC Cell Biol 2007;8(Suppl. 1):S4.
41. Sage D, Neumann FR, Hediger F, Gasser SM, Unser M. Automatictracking of individual fluorescence particles: application to the studyof chromosome dynamics. IEEE Trans Image Process 2005;14:1372–1383.
42. Bao Z, Murray JI, Boyle T, Ooi SL, Sandel MJ, Waterston RH. Auto-mated cell lineage tracing in Caenorhabditis elegans. Proc Natl AcadSci U S A 2006;103:2707–2712.
43. Chen Y-CM, Kappel C, Beaudouin J, Eils R, Spector DL. Live celldynamics of promyelocytic leukemia nuclear bodies upon entry intoand exit from mitosis. Mol Biol Cell 2008;19:3147–3162.
44. Kerr MC, Wang JTH, Hamilton N, Jeanes A, Yap AS, Meunier FA,Brown N, Stow JL, Teasdale RD. 3-Phosphoinostides have sequentialand discrete roles during Macropinocytosis. 2008;(In press).
45. Tufte ER. 2nd edn. The Visual Display of Quantitative Information.Cheshire, CT: Graphics Press; 2001.
46. Racine V, Sachse M, Salamero J, Fraisier V, Trubuil A, Sibarita JB.Visualization and quantification of vesicle trafficking on a three-dimensional cytoskeleton network in living cells. J Microsc 2007;225:214–228.
47. Kerr MC, Lindsay MR, Luetterforst R, Hamilton N, Simpson F, PartonRG, Gleeson PA, Teasdale RD. Visualisation of macropinosomematuration by the recruitment of sorting nexins. J Cell Sci2006;119(19):3967–3980.
48. Gordon A, Colman-Lerner A, Chin TE, Benjamin KR, Yu RC, Brent R.Single-cell quantification of molecules and rates using open-sourcemicroscope-based cytometry. Nat Methods 2007;4:175–181.
49. Mullassery D, Horton CA, Wood CD. Single live-cell imaging forsystems biology 9. Essays Biochem 2008;45:121–134.
50. Nelson DE, Ihekwaba AE, Elliott M, Johnson JR, Gibney CA, ForemanBE, Nelson G, See V, Horton CA, Spiller DG, Edwards SW, McDowellHP, Unitt JF, Sullivan E, Grimley R, Benson N, Broomhead D, Kell DB,White MR. Oscillations in NF-kappaB signaling control the dynamicsof gene expression. Science 2004;306:704–708.
51. Zhao T, Murphy RF. Automated learning of generative models forsubcellular location: building blocks for systems biology. CytometryPart A 2007;71A:978–990.
52. Hamilton N, Kerr MC, Burrage K, Teasdale RD. Analysing real-timevideo microscopy: the dynamics and geometry of vesicles and tubulesin endocytosis. In: Morgan K, editor. Current Protocols in Cell Biology.Wiley Interscience, New York; 2007.
Traffic 2009; 10: 951–961 961