quantitative analysis of acetylsalicylic acid by q-nmr
TRANSCRIPT
Governors State UniversityOPUS Open Portal to University Scholarship
All Student Theses Student Theses
Fall 2016
Quantitative Analysis of Acetylsalicylic Acid by q-NMR (Quantitative-Nuclear Magnetic ResonanceSpectroscopy)Charles Flemming Jr.Governors State University
Follow this and additional works at: http://opus.govst.edu/theses
Part of the Analytical Chemistry Commons
For more information about the academic degree, extended learning, and certificate programs of Governors State University, go tohttp://www.govst.edu/Academics/Degree_Programs_and_Certifications/
Visit the Governors State Analytical Chemistry DepartmentThis Thesis is brought to you for free and open access by the Student Theses at OPUS Open Portal to University Scholarship. It has been accepted forinclusion in All Student Theses by an authorized administrator of OPUS Open Portal to University Scholarship. For more information, please [email protected].
Recommended CitationFlemming, Charles Jr., "Quantitative Analysis of Acetylsalicylic Acid by q-NMR (Quantitative-Nuclear Magnetic ResonanceSpectroscopy)" (2016). All Student Theses. 89.http://opus.govst.edu/theses/89
iii
QUANTITATIVE ANALYSIS OF ACETYLSALICYLIC ACID
BY Q-NMR
(QUANTITATIVE-NUCLEAR MAGNETIC RESONANCE SPECTROSCOPY)
By
Charles Flemming, Jr.
B.Sc. (Pre-Med., Biology) Chicago State University, 2007
A.A.A. (Liberal Arts) South Suburban College, 2003
A.A.S. (Biology) South Suburban College, 2003
THESIS
Submitted in Partial Fulfillment of the
Requirements for the Degree of
Masters of Science
In the Department of Chemistry
With a Major in Analytical Chemistry
Governors State University
University Park, Illinois 60484
Fall 2016
ACKNOWLEDGMENTS
I am thankful to my committee chairperson, Dr. Shailendra Kumar, to whom this research would
not have been possible.
I would also like to thank professors Dr. Joong-Won Shin, and Dr. Walter Henne, for their
guidance throughout my academic career.
Finally, I am grateful for my wonderful family members that have always given me their
support.
2
TABLE OF CONTENTS
ACKNOWLEDGMENTS .............................................................................................................. 1
LIST OF TABLES .......................................................................................................................... 4
LIST OF FIGURES ........................................................................................................................ 5
ABSTRACT .................................................................................................................................... 6
INTRODUCTION .......................................................................................................................... 7
MATERIALS AND INSTRUMENTATION ................................................................................. 9
Materials ...................................................................................................................................... 9
Instrumentation............................................................................................................................ 9
EXPERIMENTAL PROCEDURES ............................................................................................... 9
NMR Test Solutions .................................................................................................................... 9
Solubility of Acetylsalicylic Acid ........................................................................................... 9
Preparation of Acetylsalicylic Acid Solvent System ............................................................... 9
Preparation of High and Low Concentration Acetylsalicylic Acid Stock Solutions ............... 9
Preparation of High and Low Concentration Acetylsalicylic Acid Diluted Solutions .......... 10
HPLC Test Solutions ................................................................................................................. 10
Solubility of Acetylsalicylic Acid ......................................................................................... 10
Preparation of Acetylsalicylic Acid Solvent System ............................................................. 10
Preparation of Low Concentration Acetylsalicylic Acid Stock Solutions ............................ 10
Preparation of Low Concentration Acetylsalicylic Acid Diluted Solutions .......................... 10
Preparation of Mobile Phase.................................................................................................. 10
General Procedure for Operation of the Bruker NMR Spectrometer........................................ 11
General Procedure for Operation of the Agilent HPLC ............................................................ 12
RESULTS ..................................................................................................................................... 13
NMR Spectra ............................................................................................................................. 13
NMR Analysis of High Concentration Acetylsalicylic Acid Solutions .................................... 17
NMR Analysis of Low Concentration Acetylsalicylic Acid Solutions..................................... 29
HPLC Analysis of Low Concentration Acetylsalicylic Acid Solutions ................................... 42
DISCUSSION ............................................................................................................................... 45
Qualitative Analysis .................................................................................................................. 45
NMR of CDCl3 ...................................................................................................................... 45
NMR of tert-butanol in CDCl3 .............................................................................................. 45
3
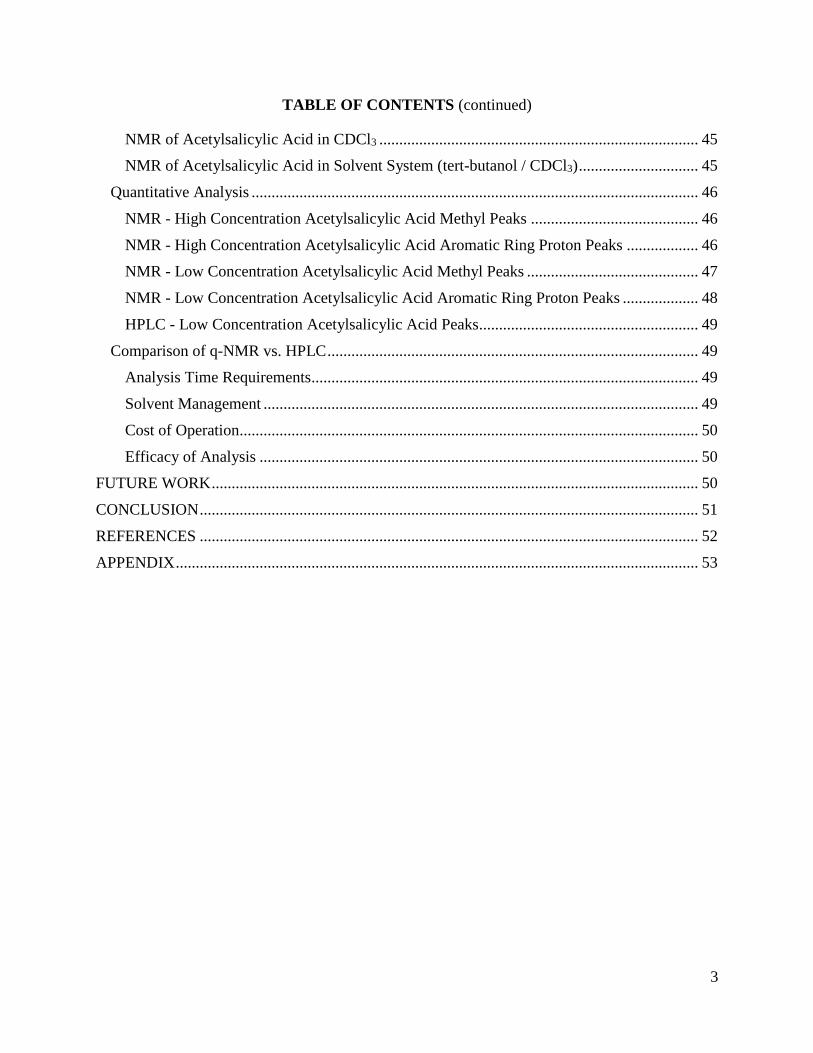
TABLE OF CONTENTS (continued)
NMR of Acetylsalicylic Acid in CDCl3 ................................................................................ 45
NMR of Acetylsalicylic Acid in Solvent System (tert-butanol / CDCl3) .............................. 45
Quantitative Analysis ................................................................................................................ 46
NMR - High Concentration Acetylsalicylic Acid Methyl Peaks .......................................... 46
NMR - High Concentration Acetylsalicylic Acid Aromatic Ring Proton Peaks .................. 46
NMR - Low Concentration Acetylsalicylic Acid Methyl Peaks ........................................... 47
NMR - Low Concentration Acetylsalicylic Acid Aromatic Ring Proton Peaks ................... 48
HPLC - Low Concentration Acetylsalicylic Acid Peaks ....................................................... 49
Comparison of q-NMR vs. HPLC ............................................................................................. 49
Analysis Time Requirements ................................................................................................. 49
Solvent Management ............................................................................................................. 49
Cost of Operation................................................................................................................... 50
Efficacy of Analysis .............................................................................................................. 50
FUTURE WORK .......................................................................................................................... 50
CONCLUSION ............................................................................................................................. 51
REFERENCES ............................................................................................................................. 52
APPENDIX ................................................................................................................................... 53
4
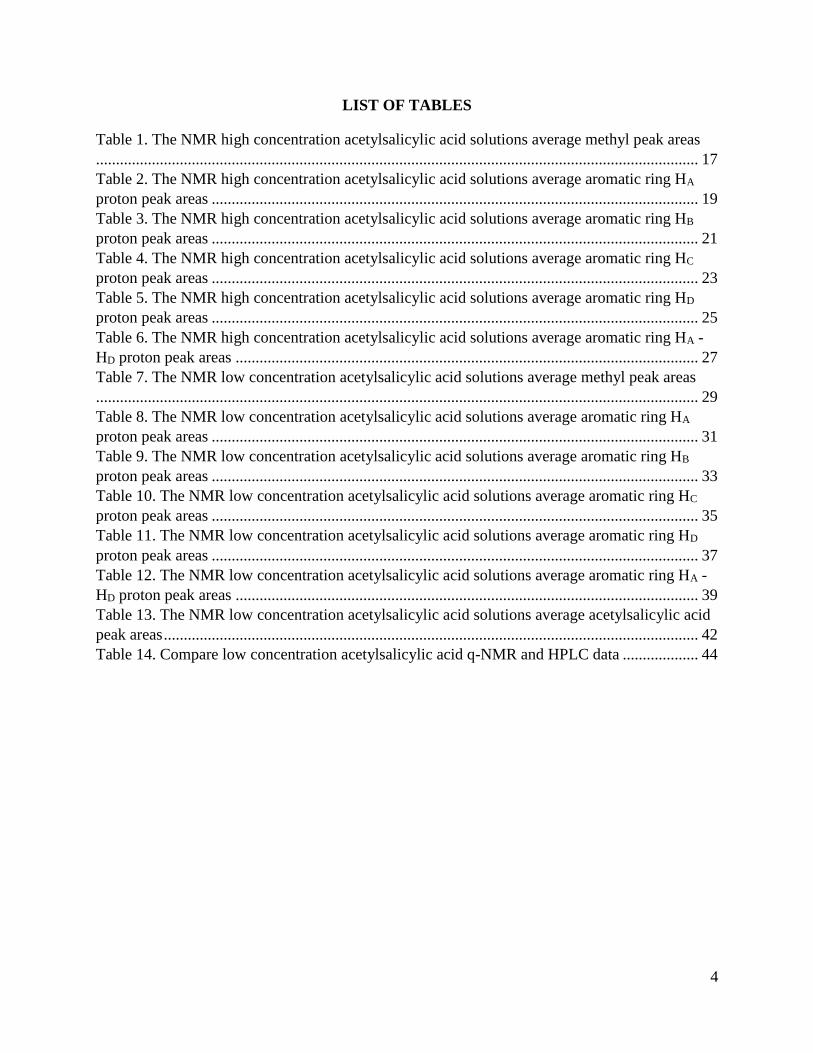
LIST OF TABLES
Table 1. The NMR high concentration acetylsalicylic acid solutions average methyl peak areas
....................................................................................................................................................... 17
Table 2. The NMR high concentration acetylsalicylic acid solutions average aromatic ring HA
proton peak areas .......................................................................................................................... 19
Table 3. The NMR high concentration acetylsalicylic acid solutions average aromatic ring HB
proton peak areas .......................................................................................................................... 21
Table 4. The NMR high concentration acetylsalicylic acid solutions average aromatic ring HC
proton peak areas .......................................................................................................................... 23
Table 5. The NMR high concentration acetylsalicylic acid solutions average aromatic ring HD
proton peak areas .......................................................................................................................... 25
Table 6. The NMR high concentration acetylsalicylic acid solutions average aromatic ring HA -
HD proton peak areas .................................................................................................................... 27
Table 7. The NMR low concentration acetylsalicylic acid solutions average methyl peak areas
....................................................................................................................................................... 29
Table 8. The NMR low concentration acetylsalicylic acid solutions average aromatic ring HA
proton peak areas .......................................................................................................................... 31
Table 9. The NMR low concentration acetylsalicylic acid solutions average aromatic ring HB
proton peak areas .......................................................................................................................... 33
Table 10. The NMR low concentration acetylsalicylic acid solutions average aromatic ring HC
proton peak areas .......................................................................................................................... 35
Table 11. The NMR low concentration acetylsalicylic acid solutions average aromatic ring HD
proton peak areas .......................................................................................................................... 37
Table 12. The NMR low concentration acetylsalicylic acid solutions average aromatic ring HA -
HD proton peak areas .................................................................................................................... 39
Table 13. The NMR low concentration acetylsalicylic acid solutions average acetylsalicylic acid
peak areas ...................................................................................................................................... 42
Table 14. Compare low concentration acetylsalicylic acid q-NMR and HPLC data ................... 44
5
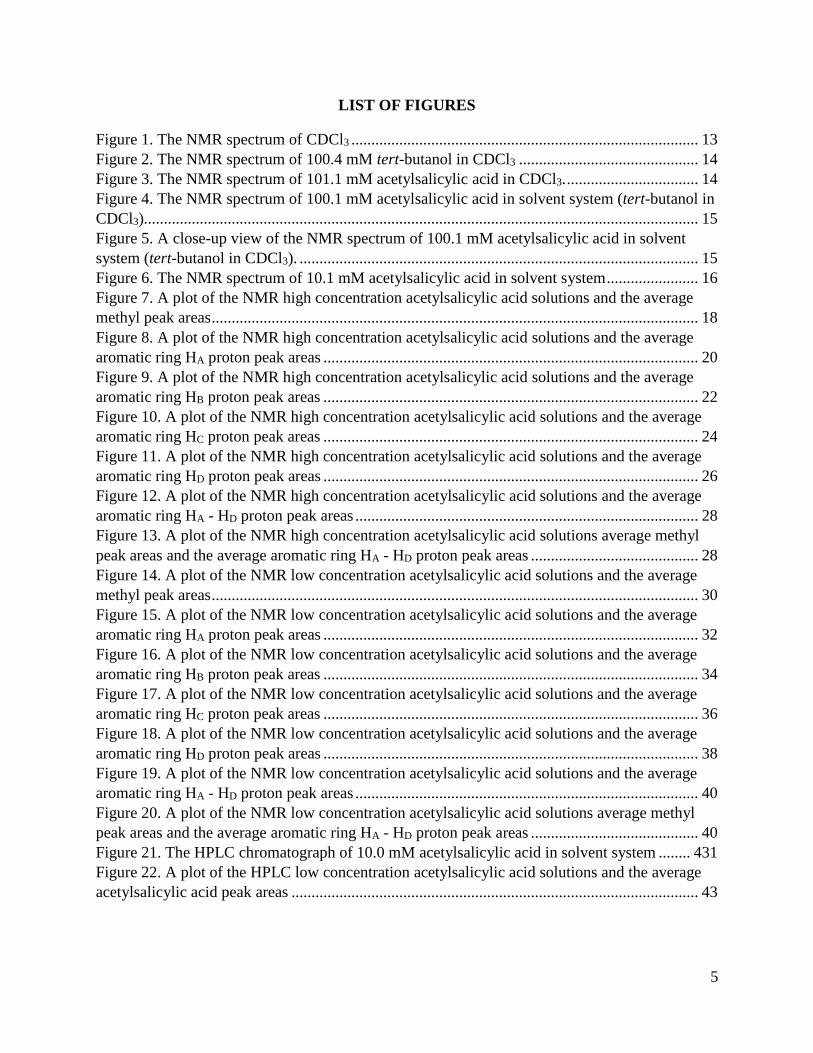
LIST OF FIGURES
Figure 1. The NMR spectrum of CDCl3 ....................................................................................... 13
Figure 2. The NMR spectrum of 100.4 mM tert-butanol in CDCl3 ............................................. 14
Figure 3. The NMR spectrum of 101.1 mM acetylsalicylic acid in CDCl3. ................................. 14
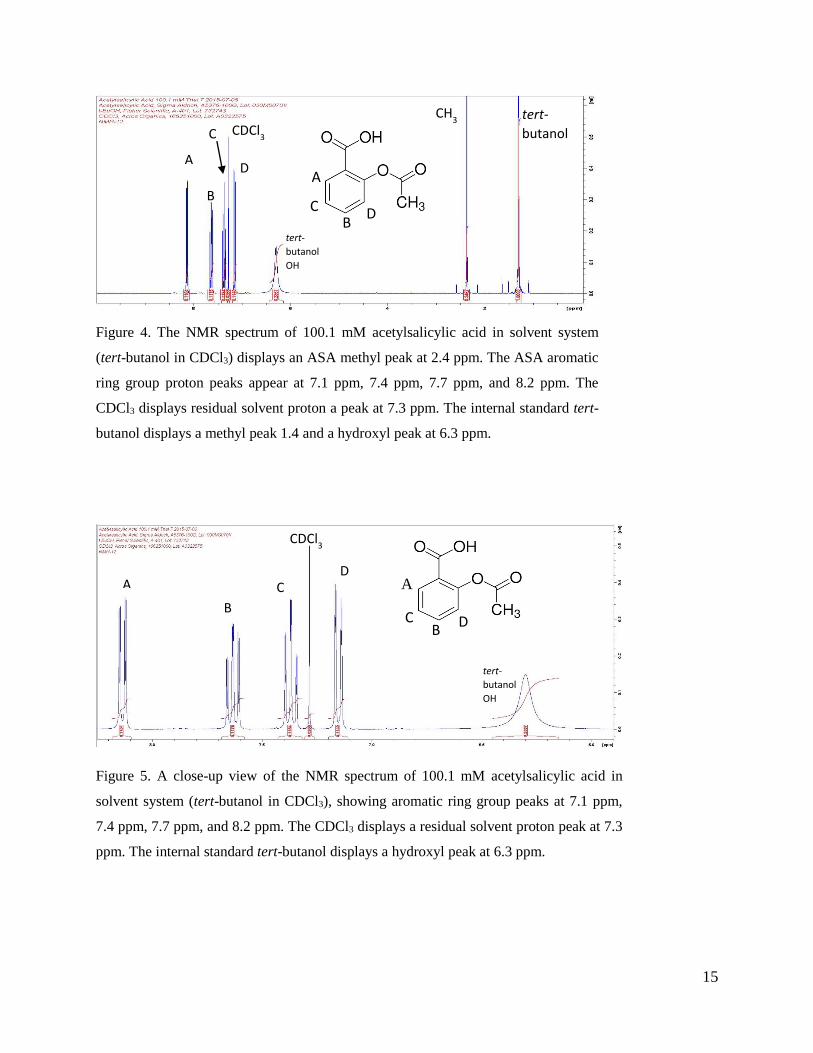
Figure 4. The NMR spectrum of 100.1 mM acetylsalicylic acid in solvent system (tert-butanol in
CDCl3)........................................................................................................................................... 15
Figure 5. A close-up view of the NMR spectrum of 100.1 mM acetylsalicylic acid in solvent
system (tert-butanol in CDCl3). .................................................................................................... 15
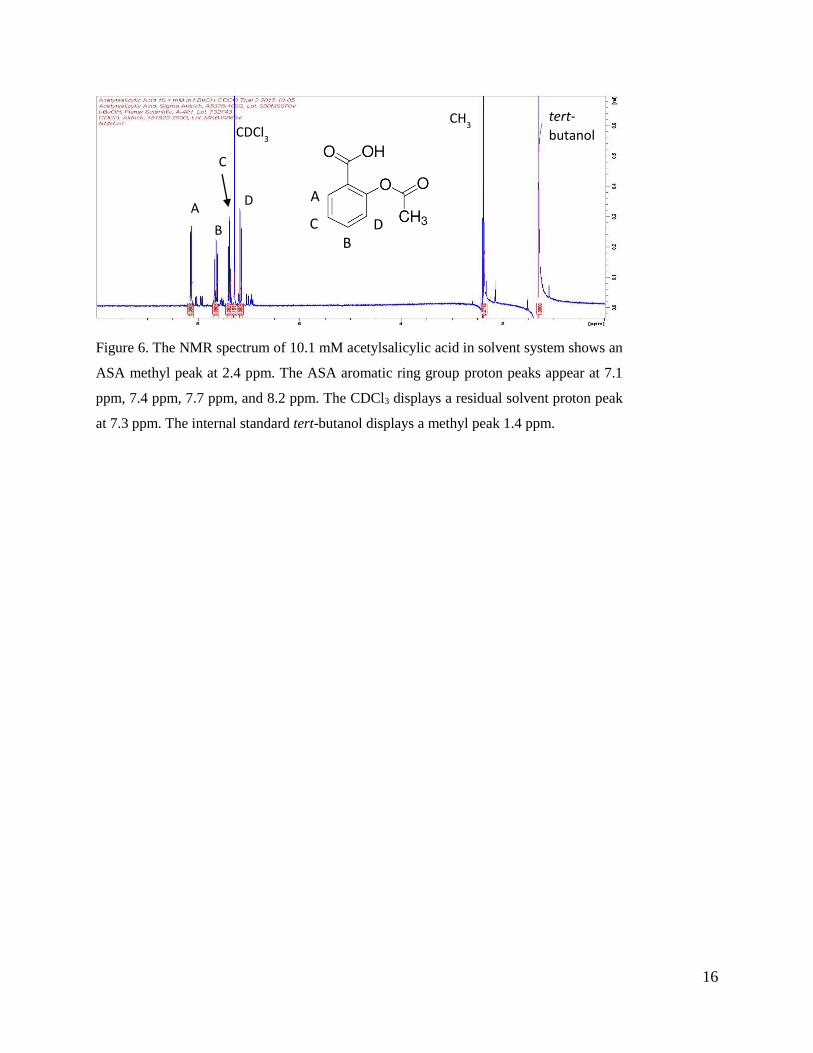
Figure 6. The NMR spectrum of 10.1 mM acetylsalicylic acid in solvent system ....................... 16
Figure 7. A plot of the NMR high concentration acetylsalicylic acid solutions and the average
methyl peak areas .......................................................................................................................... 18
Figure 8. A plot of the NMR high concentration acetylsalicylic acid solutions and the average
aromatic ring HA proton peak areas .............................................................................................. 20
Figure 9. A plot of the NMR high concentration acetylsalicylic acid solutions and the average
aromatic ring HB proton peak areas .............................................................................................. 22
Figure 10. A plot of the NMR high concentration acetylsalicylic acid solutions and the average
aromatic ring HC proton peak areas .............................................................................................. 24
Figure 11. A plot of the NMR high concentration acetylsalicylic acid solutions and the average
aromatic ring HD proton peak areas .............................................................................................. 26
Figure 12. A plot of the NMR high concentration acetylsalicylic acid solutions and the average
aromatic ring HA - HD proton peak areas ...................................................................................... 28
Figure 13. A plot of the NMR high concentration acetylsalicylic acid solutions average methyl
peak areas and the average aromatic ring HA - HD proton peak areas .......................................... 28
Figure 14. A plot of the NMR low concentration acetylsalicylic acid solutions and the average
methyl peak areas .......................................................................................................................... 30
Figure 15. A plot of the NMR low concentration acetylsalicylic acid solutions and the average
aromatic ring HA proton peak areas .............................................................................................. 32
Figure 16. A plot of the NMR low concentration acetylsalicylic acid solutions and the average
aromatic ring HB proton peak areas .............................................................................................. 34
Figure 17. A plot of the NMR low concentration acetylsalicylic acid solutions and the average
aromatic ring HC proton peak areas .............................................................................................. 36
Figure 18. A plot of the NMR low concentration acetylsalicylic acid solutions and the average
aromatic ring HD proton peak areas .............................................................................................. 38
Figure 19. A plot of the NMR low concentration acetylsalicylic acid solutions and the average
aromatic ring HA - HD proton peak areas ...................................................................................... 40
Figure 20. A plot of the NMR low concentration acetylsalicylic acid solutions average methyl
peak areas and the average aromatic ring HA - HD proton peak areas .......................................... 40
Figure 21. The HPLC chromatograph of 10.0 mM acetylsalicylic acid in solvent system ........ 431
Figure 22. A plot of the HPLC low concentration acetylsalicylic acid solutions and the average
acetylsalicylic acid peak areas ...................................................................................................... 43
6
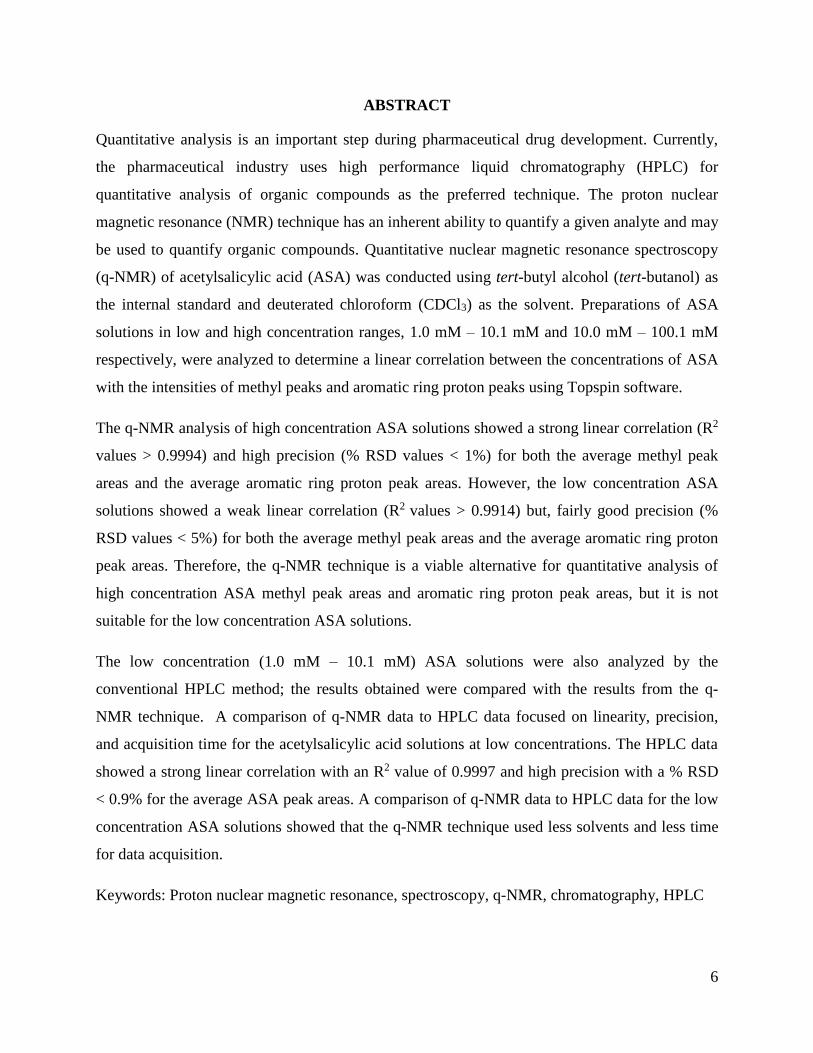
ABSTRACT
Quantitative analysis is an important step during pharmaceutical drug development. Currently,
the pharmaceutical industry uses high performance liquid chromatography (HPLC) for
quantitative analysis of organic compounds as the preferred technique. The proton nuclear
magnetic resonance (NMR) technique has an inherent ability to quantify a given analyte and may
be used to quantify organic compounds. Quantitative nuclear magnetic resonance spectroscopy
(q-NMR) of acetylsalicylic acid (ASA) was conducted using tert-butyl alcohol (tert-butanol) as
the internal standard and deuterated chloroform (CDCl3) as the solvent. Preparations of ASA
solutions in low and high concentration ranges, 1.0 mM – 10.1 mM and 10.0 mM – 100.1 mM
respectively, were analyzed to determine a linear correlation between the concentrations of ASA
with the intensities of methyl peaks and aromatic ring proton peaks using Topspin software.
The q-NMR analysis of high concentration ASA solutions showed a strong linear correlation (R2
values > 0.9994) and high precision (% RSD values < 1%) for both the average methyl peak
areas and the average aromatic ring proton peak areas. However, the low concentration ASA
solutions showed a weak linear correlation (R2 values > 0.9914) but, fairly good precision (%
RSD values < 5%) for both the average methyl peak areas and the average aromatic ring proton
peak areas. Therefore, the q-NMR technique is a viable alternative for quantitative analysis of
high concentration ASA methyl peak areas and aromatic ring proton peak areas, but it is not
suitable for the low concentration ASA solutions.
The low concentration (1.0 mM – 10.1 mM) ASA solutions were also analyzed by the
conventional HPLC method; the results obtained were compared with the results from the q-
NMR technique. A comparison of q-NMR data to HPLC data focused on linearity, precision,
and acquisition time for the acetylsalicylic acid solutions at low concentrations. The HPLC data
showed a strong linear correlation with an R2 value of 0.9997 and high precision with a % RSD
< 0.9% for the average ASA peak areas. A comparison of q-NMR data to HPLC data for the low
concentration ASA solutions showed that the q-NMR technique used less solvents and less time
for data acquisition.
Keywords: Proton nuclear magnetic resonance, spectroscopy, q-NMR, chromatography, HPLC
7
INTRODUCTION
The ability to quantify an active pharmaceutical ingredient (API) is a crucial step in drug
development. Currently, in the pharmaceutical industry high performance liquid chromatography
(HPLC) is the preferred technique for purity determinations due to its selectivity and
reproducibility. HPLC implements a combination of mobile phases and stationary phases
(analytical column) for quantitatively separating organic compounds. The mobile phase flows
through the HPLC system and a volume (microliters) of analyte is injected into the mobile phase
(1). The components of the analyte elute from the HPLC column according to their affinity to the
stationary phase and mobile phase (1). As the components pass thru the flow cell, the ultraviolet-
visible (UV-VIS) detector measures the absorbance of the analyte (1). The area under the peak
is directly proportional to the concentration of the compound in solution.
Quantitative nuclear magnetic resonance (q-NMR) is gaining attention as a viable alternative
technique for quantification of organic compounds. Proton nuclear magnetic resonance (NMR)
spectroscopy is a powerful technique, which is mainly used for providing information for
elucidating structures of organic compounds. The NMR spectrometer applies a magnetic field to
the organic compound in solution; the protons are excited to a higher energy level after
absorbing electromagnetic energy in the form of radio frequencies (2). The NMR spectrum is a
plot of the frequencies of the absorption peaks versus the peak intensities (2). Proton (NMR)
technique has an inherent ability to quantify organic compounds (3). By means of quantitative
nuclear magnetic resonance (q-NMR) spectroscopy technique, various pharmaceutical
ingredients have been utilized for quantification of organic compounds using an internal standard
(4, 5). The area under the q-NMR signal is directly proportional to the number of protons for a
given peak, and hence directly proportional to the concentration of the compound in solution.
The cost of acquiring and operating HPLC instrumentation is increasing as the chromatographic
technology advances. The time necessary to development HPLC methods requires many operator
hours, multiple columns, and a high volume of solvents (mobile phase) leading to increased
waste disposal. However, it costs less to obtain an HPLC than a NMR spectrophotometer. The q-
NMR method development does not use columns, requires less operator time, and uses less
solvent, therefore decreasing waste disposal. The cost of HPLC and the q-NMR technique for
quantitative analysis are becoming comparable, thus making q-NMR a viable option.
8
Acetylsalicylic acid (ASA) is the active pharmaceutical ingredient in Aspirin, an anti-
inflammatory pharmaceutical for the treatment of pain and fever. In a previous study, ASA was
analyzed by q-NMR using ethanol as an internal standard and dimethyl sulfoxide-d6 (DMSO-d6)
as the solvent (6). In this study, the q-NMR analysis of ASA showed linearity in respects to the
concentrations of ASA in solutions with the methyl peak areas and aromatic ring proton peak
areas. In another study, two pharmaceuticals were analyzed by q-NMR, acetaminophen the API
in Tylenol (treats minor aches, pains) and ASA. In this study, the separate acetaminophen and
ASA solutions were prepared with diethyl ether (internal standard) and deuterated chloroform
(CDCl3) as the solvent (7). The methyl peak areas and aromatic ring proton peak areas showed
linearity in respects to the concentrations of the acetaminophen and ASA solutions.
In the present study, the q-NMR technique is used to quantify acetylsalicylic acid solutions from
1 mM – 100 mM using tert-butanol as the internal standard and deuterated chloroform (CDCl3)
as the solvent. The linear correlation was determined by plotting the acetylsalicylic acid
concentrations versus the average methyl peak areas and the average aromatic ring proton peak
areas; the precision was determined by calculating the percent relative standard deviation (%
RSD). A comparison of q-NMR data to HPLC data focused on linearity, precision, solvent
management, operation costs, and acquisition time for the acetylsalicylic acid solutions at low
concentrations.
9
MATERIALS AND INSTRUMENTATION
Materials
Acetylsalicylic acid (Sigma-Aldrich, CAS: 50-78-2, ≥99.0%), deuterated chloroform (Sigma-
Aldrich, CAS: 865-49-6, for NMR 99.8 atom D), and acetic acid (Sigma-Aldrich, CAS: 64-19-7,
≥99.0%), were obtained from Sigma-Aldrich. Methanol (Honeywell, CAS: 67-56-1, HPLC),
water (Honeywell, CAS: 7732-18-5, HPLC), and tert-butanol (Fisher, CAS: 75-65-0), was
obtained. The HPLC analytical column was a Keystone BDS or Hypersil, C-18, (15 cm x 4.6
mm x 5 um). The glassware used included glass pipets, 1 mL graduated syringe, NMR tubes
(Kimax), HPLC vials (Agilent Technologies), volumetric flasks (Kimax) 1 mL, 10 mL, 25 mL
and a 100 mL graduated cylinder (Kimax).
Instrumentation
Analytical balances, a 300MHz Bruker Nuclear Magnetic Resonance Spectrometer (NMR), and
an Agilent 1260 High Performance Liquid Chromatograph (HPLC) were used for this study.
EXPERIMENTAL PROCEDURES
NMR Test Solutions
Solubility of Acetylsalicylic Acid
A solubility test of acetylsalicylic acid (ASA) was successfully performed using about five mg
ASA and 1.0 mL of deuterated chloroform (CDCl3).
Preparation of Acetylsalicylic Acid Solvent System
A 100.4 mM tert-butanol (internal standard) solvent system was prepared by adding 186.0 mg of
tert-butanol to CDCl3 in a 25 mL volumetric flask for the high concentration ASA solutions. A
10.3 mM tert-butanol solvent system was prepared by adding 18.53 mg of tert-butanol to CDCl3
in a 25 mL volumetric flask for the low concentration ASA solutions.
Preparation of High and Low Concentration Acetylsalicylic Acid Stock Solutions
A 100.1 mM stock solution of ASA was prepared by adding 180.3 mg of ASA to the solvent
system in a 10 mL volumetric flask. A 10.1 mM stock solution of ASA was prepared by adding
18.2 mg of ASA to the solvent system in a 10 mL volumetric flask.
10
Preparation of High and Low Concentration Acetylsalicylic Acid Diluted Solutions
Preparation of the high concentration acetylsalicylic acid solutions 80.1 mM, 60.1 mM, 40.0
mM, 20.0 mM and 10.0 mM was accomplished by adding aliquots of the ASA stock solution
(0.8 mL, 0.6 mL, 0.4 mL, 0.2 mL, 0.1 mL) to the solvent system in a 1 mL volumetric flask.
Preparation of the 8.1 mM, 6.1 mM, 4.0 mM, 2.0 mM, and 1.0 mM low concentration ASA
solutions was accomplished by adding aliquots of the ASA stock solution (0.8 mL, 0.6 mL, 0.4
mL, 0.2 mL, 0.1 mL) to the solvent system in a 1 mL volumetric flask.
HPLC Test Solutions
Solubility of Acetylsalicylic Acid
A solubility test of acetylsalicylic acid (ASA) was successfully performed using about five mg
ASA and 1.0 mL of 95:5 methanol / glacial acetic acid.
Preparation of Acetylsalicylic Acid Solvent System
A 95:5 methanol / glacial acetic acid solvent system was prepared by adding 2.5 mL glacial
acetic acid to methanol in a 50 mL volumetric flask for the low concentration ASA solutions.
Preparation of Low Concentration Acetylsalicylic Acid Stock Solutions
A 10.0 mM stock solution of ASA was prepared by adding 18.0 mg of ASA to the solvent
system in a 10 mL volumetric flask.
Preparation of Low Concentration Acetylsalicylic Acid Diluted Solutions
Preparation of the 8.0 mM, 6.0 mM, 4.0 mM, 2.0 mM, and 1.0 mM low concentration ASA
solutions was accomplished by adding aliquots of the ASA stock solution (0.8 mL, 0.6 mL, 0.4
mL, 0.2 mL, 0.1 mL) to the solvent system in a 1 mL volumetric flask.
Preparation of Mobile Phase
The mobile phase was composed of water, methanol, and glacial acetic acid at this ratio 69:28:3,
respectively (8). A liter of mobile phase was prepared by combining 690 mL water, 280 mL
methanol, and 30 mL glacial acetic acid.
11
General Procedure for Operation of the Bruker NMR Spectrometer
The procedure for acquiring NMR spectra for the Bruker 300 MHz NMR spectrophotometer
with Topspin 3.2 software was as follows:
Create a new data set using start > create data set.
Use “rpar” command to choose experiment parameters for the proton-NMR spectrum.
Select proton-all.
Select “lift” to eject previous sample.
Place 0.7 mL of the solution in the NMR tube and insert it in the NMR probe through a
turbine.
Use “ij” to inject present sample.
Use “lock” command to lock the signal of the solvent.
Use “tune” command to tune instrument to solvent.
Use “prolsol single pulse calibration” to acquire the 90° pulse value at -8.2 dB
Use “rga” command to check the receiver gain of the amplifier.
Use “zg” command to begin the experiment and acquire data in the free induction decay
(FID) format.
Use “efp” command to convert the FID format to a frequency domain spectrum.
Use “apk” to correct the baseline.
Use “Integrate” to obtain peak areas. TE Topspin 3.2 software assigns an area of 1.000
for the first peak and the other peaks are assigned numbers proportional to their areas.
Use “xwinplot” command to display the spectrum with legends.
12
General Procedure for Operation of the Agilent HPLC
The procedure for acquiring HPLC spectra for the Agilent 1260 High Performance Liquid
Chromatograph with ChemStation software was as follows:
Turn on the column heater (column temperature 4oC).
Turn on the ultraviolet or visible light detector (wavelength 275 nm).
Connect the HPLC analytical column.
Condition the column with the mobile phase (flow rate 1.5 ml/min).
Create a new method set.
Create a new sample set.
Perform the sample analysis
13
RESULTS
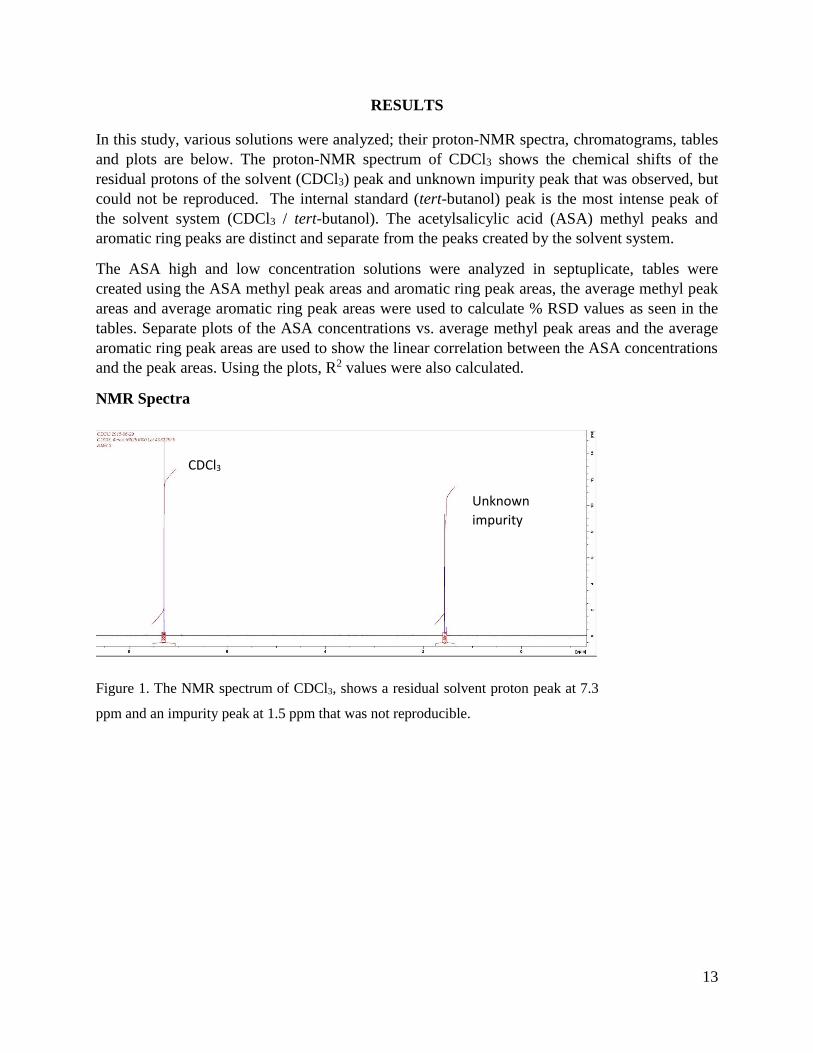
In this study, various solutions were analyzed; their proton-NMR spectra, chromatograms, tables
and plots are below. The proton-NMR spectrum of CDCl3 shows the chemical shifts of the
residual protons of the solvent (CDCl3) peak and unknown impurity peak that was observed, but
could not be reproduced. The internal standard (tert-butanol) peak is the most intense peak of
the solvent system (CDCl3 / tert-butanol). The acetylsalicylic acid (ASA) methyl peaks and
aromatic ring peaks are distinct and separate from the peaks created by the solvent system.
The ASA high and low concentration solutions were analyzed in septuplicate, tables were
created using the ASA methyl peak areas and aromatic ring peak areas, the average methyl peak
areas and average aromatic ring peak areas were used to calculate % RSD values as seen in the
tables. Separate plots of the ASA concentrations vs. average methyl peak areas and the average
aromatic ring peak areas are used to show the linear correlation between the ASA concentrations
and the peak areas. Using the plots, R2 values were also calculated.
NMR Spectra
Figure 1. The NMR spectrum of CDCl3, shows a residual solvent proton peak at 7.3
ppm and an impurity peak at 1.5 ppm that was not reproducible.
Unknown
impurity
CDCl3
14
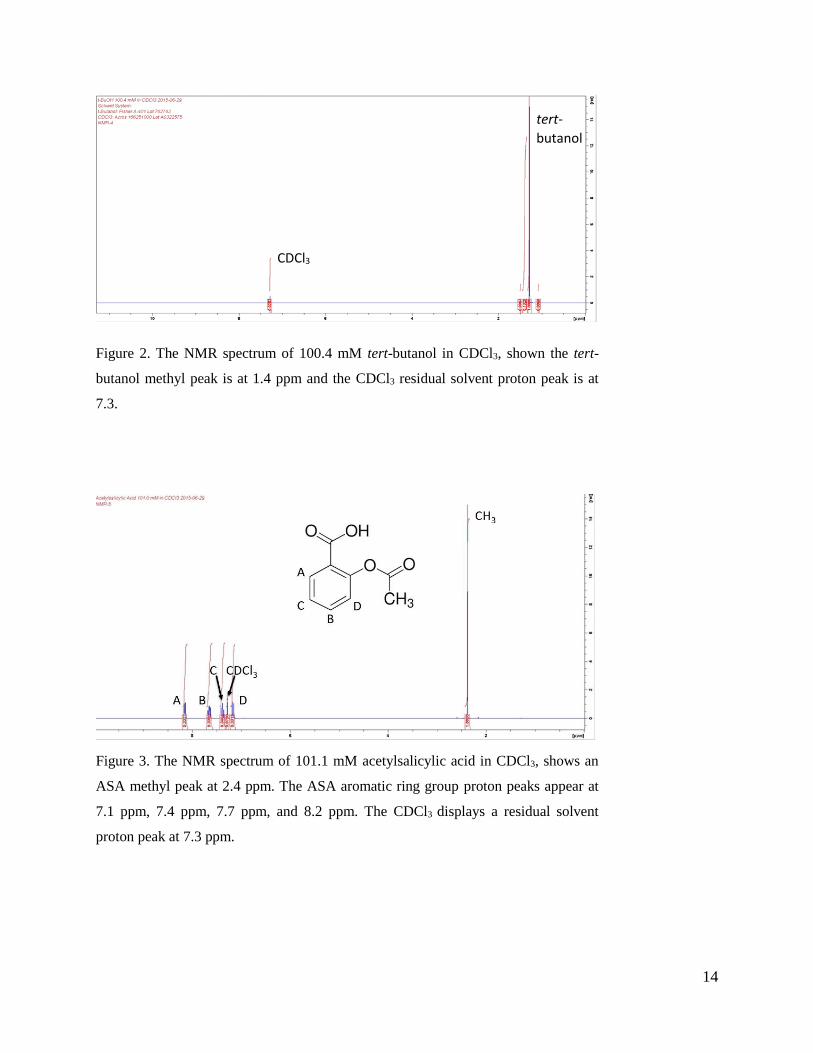
Figure 2. The NMR spectrum of 100.4 mM tert-butanol in CDCl3, shown the tert-
butanol methyl peak is at 1.4 ppm and the CDCl3 residual solvent proton peak is at
7.3.
Figure 3. The NMR spectrum of 101.1 mM acetylsalicylic acid in CDCl3, shows an
ASA methyl peak at 2.4 ppm. The ASA aromatic ring group proton peaks appear at
7.1 ppm, 7.4 ppm, 7.7 ppm, and 8.2 ppm. The CDCl3 displays a residual solvent
proton peak at 7.3 ppm.
tert-
butanol
CDCl3
15
Figure 4. The NMR spectrum of 100.1 mM acetylsalicylic acid in solvent system
(tert-butanol in CDCl3) displays an ASA methyl peak at 2.4 ppm. The ASA aromatic
ring group proton peaks appear at 7.1 ppm, 7.4 ppm, 7.7 ppm, and 8.2 ppm. The
CDCl3 displays residual solvent proton a peak at 7.3 ppm. The internal standard tert-
butanol displays a methyl peak 1.4 and a hydroxyl peak at 6.3 ppm.
Figure 5. A close-up view of the NMR spectrum of 100.1 mM acetylsalicylic acid in
solvent system (tert-butanol in CDCl3), showing aromatic ring group peaks at 7.1 ppm,
7.4 ppm, 7.7 ppm, and 8.2 ppm. The CDCl3 displays a residual solvent proton peak at 7.3
ppm. The internal standard tert-butanol displays a hydroxyl peak at 6.3 ppm.
CDCl3
D A
CH3 tert-
butanol
B
tert-
butanol
OH
C
D B
A
C
CDCl3
D A
B
tert-
butanol
OH
C
D B
A
C
16
Figure 6. The NMR spectrum of 10.1 mM acetylsalicylic acid in solvent system shows an
ASA methyl peak at 2.4 ppm. The ASA aromatic ring group proton peaks appear at 7.1
ppm, 7.4 ppm, 7.7 ppm, and 8.2 ppm. The CDCl3 displays a residual solvent proton peak
at 7.3 ppm. The internal standard tert-butanol displays a methyl peak 1.4 ppm.
CDCl3
D A
CH3 tert-
butanol
B
C
D
B
A
C
17
NMR Analysis of High Concentration Acetylsalicylic Acid Solutions
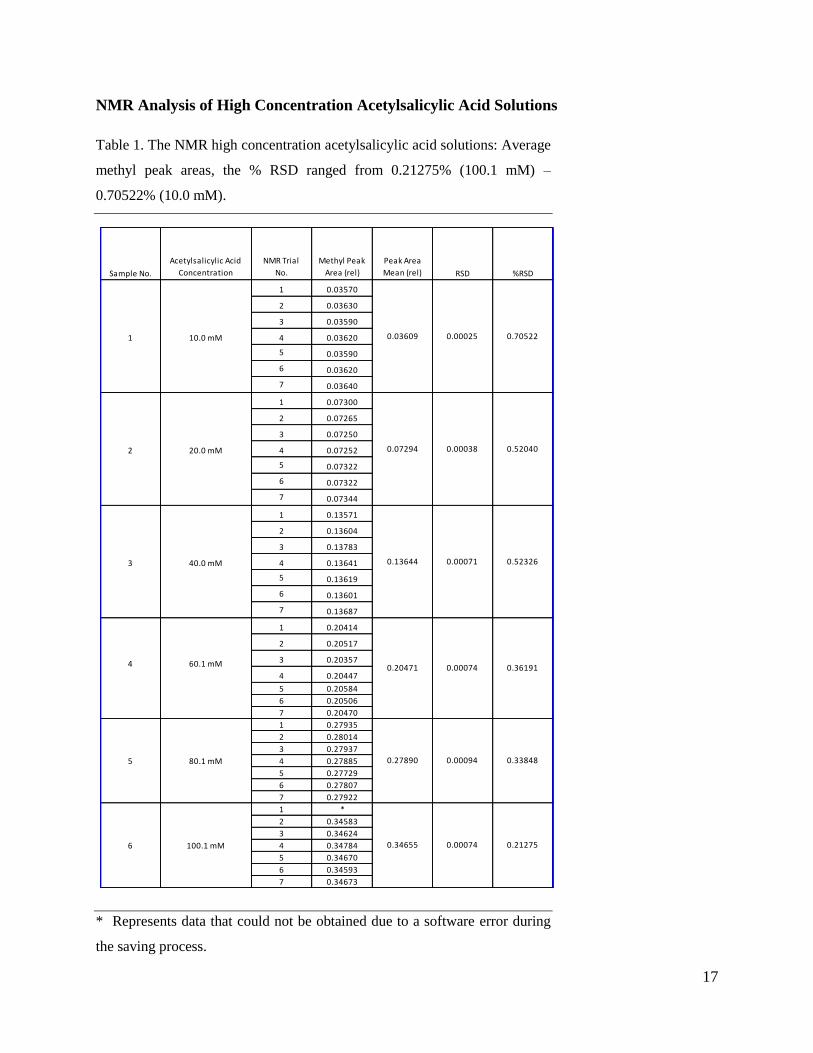
Table 1. The NMR high concentration acetylsalicylic acid solutions: Average
methyl peak areas, the % RSD ranged from 0.21275% (100.1 mM) –
0.70522% (10.0 mM).
* Represents data that could not be obtained due to a software error during
the saving process.
Sample No.
Acetylsalicylic Acid
Concentration
NMR Trial
No.
Methyl Peak
Area (rel)
Peak Area
Mean (rel) RSD %RSD
1 0.03570
2 0.03630
3 0.03590
4 0.03620
5 0.03590
6 0.03620
7 0.03640
1 0.07300
2 0.07265
3 0.07250
4 0.07252
5 0.07322
6 0.07322
7 0.07344
1 0.13571
2 0.13604
3 0.13783
4 0.13641
5 0.13619
6 0.13601
7 0.13687
1 0.20414
2 0.20517
3 0.20357
4 0.20447
5 0.20584
6 0.20506
7 0.20470
1 0.27935
2 0.28014
3 0.27937
4 0.27885
5 0.27729
6 0.27807
7 0.27922
1 *
2 0.34583
3 0.34624
4 0.34784
5 0.34670
6 0.34593
7 0.34673
1 10.0 mM 0.03609 0.00025 0.70522
2 20.0 mM 0.07294 0.00038 0.52040
3 40.0 mM 0.13644 0.00071 0.52326
4 60.1 mM 0.20471 0.00074 0.36191
5 80.1 mM 0.27890 0.00094 0.33848
6 100.1 mM 0.34655 0.00074 0.21275
18
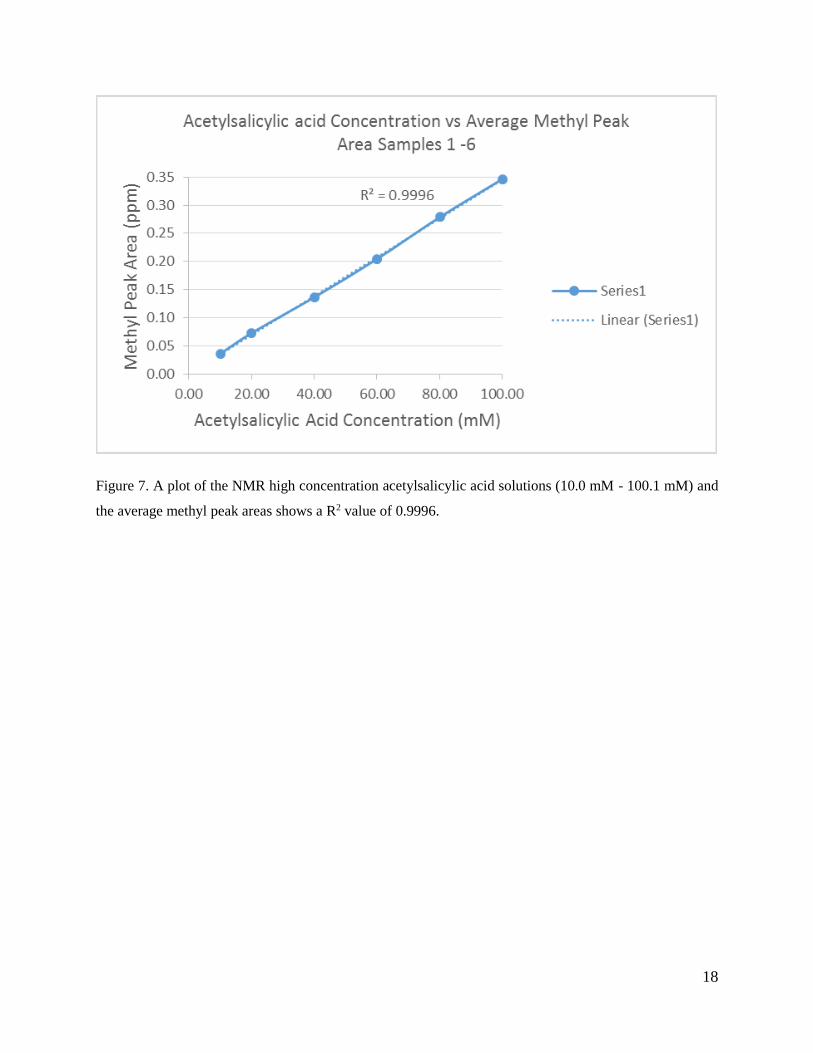
Figure 7. A plot of the NMR high concentration acetylsalicylic acid solutions (10.0 mM - 100.1 mM) and
the average methyl peak areas shows a R2 value of 0.9996.
19
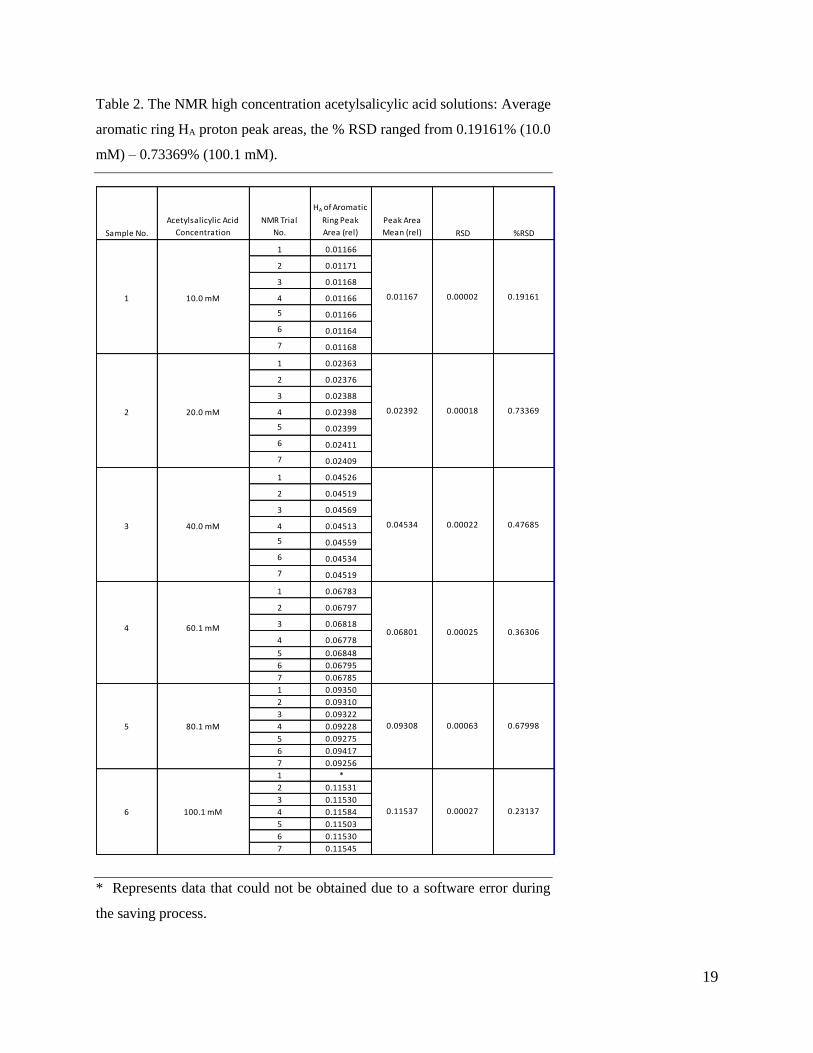
Table 2. The NMR high concentration acetylsalicylic acid solutions: Average
aromatic ring HA proton peak areas, the % RSD ranged from 0.19161% (10.0
mM) – 0.73369% (100.1 mM).
* Represents data that could not be obtained due to a software error during
the saving process.
Sample No.
Acetylsalicylic Acid
Concentration
NMR Trial
No.
HA of Aromatic
Ring Peak
Area (rel)
Peak Area
Mean (rel) RSD %RSD
1 0.01166
2 0.01171
3 0.01168
4 0.01166
5 0.01166
6 0.01164
7 0.01168
1 0.02363
2 0.02376
3 0.02388
4 0.02398
5 0.02399
6 0.02411
7 0.02409
1 0.04526
2 0.04519
3 0.04569
4 0.04513
5 0.04559
6 0.04534
7 0.04519
1 0.06783
2 0.06797
3 0.06818
4 0.06778
5 0.06848
6 0.06795
7 0.06785
1 0.09350
2 0.09310
3 0.09322
4 0.09228
5 0.09275
6 0.09417
7 0.09256
1 *
2 0.11531
3 0.11530
4 0.11584
5 0.11503
6 0.11530
7 0.11545
100.1 mM 0.11537 0.00027 0.231376
80.1 mM 0.09308 0.00063 0.679985
60.1 mM 0.06801 0.00025 0.363064
40.0 mM 0.04534 0.00022 0.476853
20.0 mM 0.02392 0.00018 0.733692
10.0 mM 0.01167 0.00002 0.191611

20
Figure 8. A plot of the NMR high concentration acetylsalicylic acid solutions (10.0 mM - 100.1 mM) and
the average aromatic ring HA proton peak areas shows a R2 value of 0.9996.

21
Table 3. The NMR high concentration acetylsalicylic acid solutions: Average
aromatic ring HB proton peak areas, the % RSD ranged from 0.34918% (10.0
mM) – 1.05501% (20.0 mM).
* Represents data that could not be obtained due to a software error during
the saving process.
Sample No.
Acetylsalicylic Acid
Concentration
NMR Trial
No.
HB of Aromatic
Ring Peak
Area (rel)
Peak Area
Mean (rel) RSD %RSD
1 0.01217
2 0.01215
3 0.01221
4 0.01215
5 0.01222
6 0.01223
7 0.01226
1 0.02440
2 0.02422
3 0.02423
4 0.02465
5 0.02463
6 0.02468
7 0.02492
1 0.04617
2 0.04612
3 0.04652
4 0.04630
5 0.04616
6 0.04585
7 0.04579
1 0.06916
2 0.06949
3 0.06925
4 0.06924
5 0.06962
6 0.06891
7 0.06882
1 0.09493
2 0.09531
3 0.09562
4 0.09407
5 0.09460
6 0.09624
7 0.09443
1 *
2 0.11794
3 0.11753
4 0.11823
5 0.11679
6 0.11732
7 0.11762
0.11757 0.00050 0.424846 100.1 mM
0.09503 0.00075 0.788315 80.1 mM
0.06921 0.00029 0.414384 60.1 mM
0.04613 0.00025 0.543823 40.0 mM
0.02453 0.00026 1.055012 20.0 mM
0.01220 0.00004 0.349181 10.0 mM
22
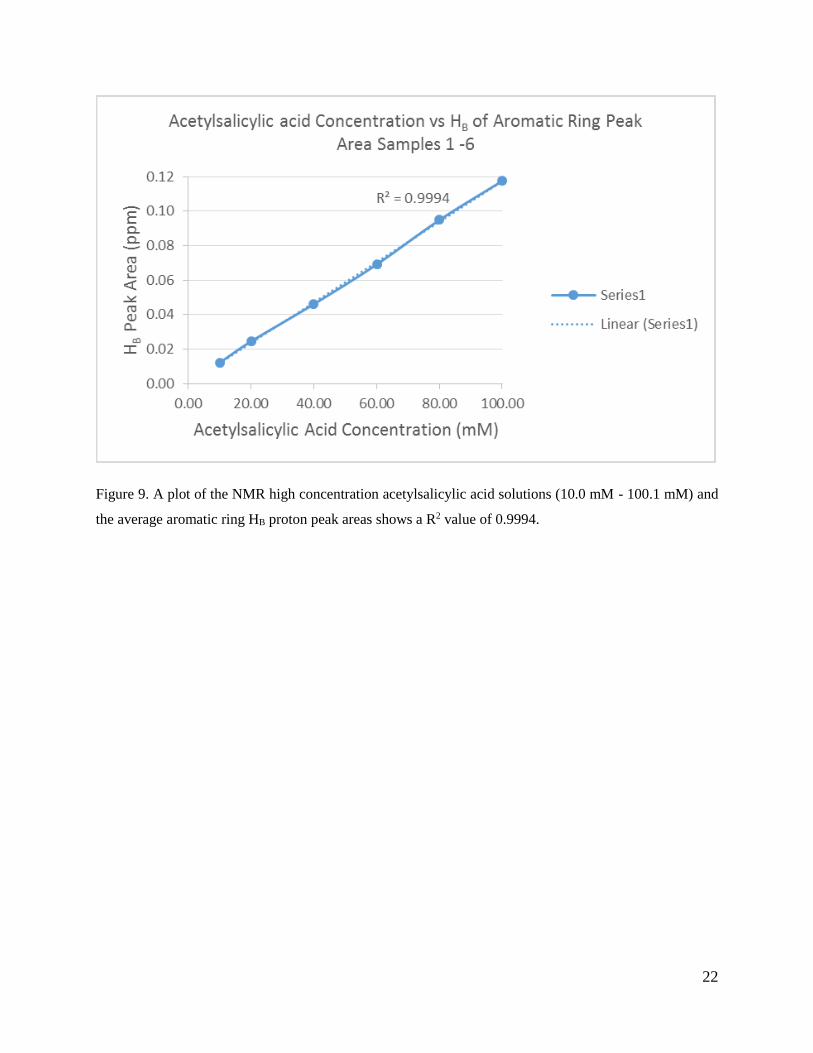
Figure 9. A plot of the NMR high concentration acetylsalicylic acid solutions (10.0 mM - 100.1 mM) and
the average aromatic ring HB proton peak areas shows a R2 value of 0.9994.
23
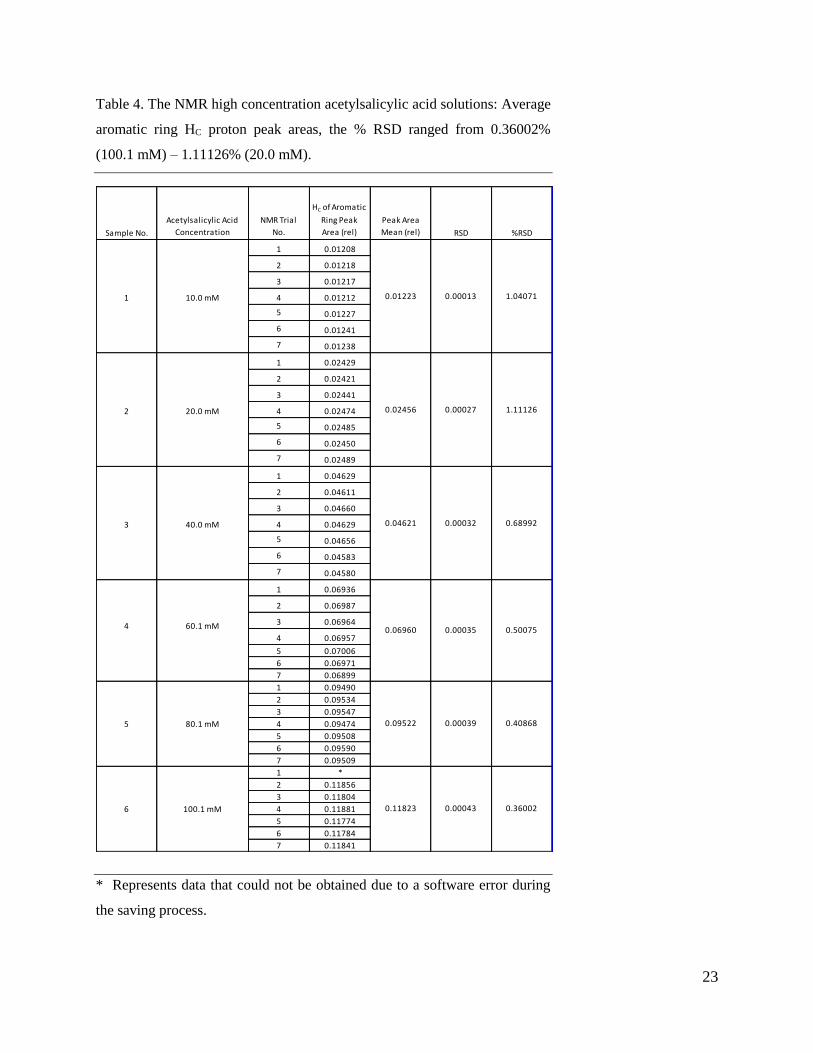
Table 4. The NMR high concentration acetylsalicylic acid solutions: Average
aromatic ring HC proton peak areas, the % RSD ranged from 0.36002%
(100.1 mM) – 1.11126% (20.0 mM).
* Represents data that could not be obtained due to a software error during
the saving process.
Sample No.
Acetylsalicylic Acid
Concentration
NMR Trial
No.
HC of Aromatic
Ring Peak
Area (rel)
Peak Area
Mean (rel) RSD %RSD
1 0.01208
2 0.01218
3 0.01217
4 0.01212
5 0.01227
6 0.01241
7 0.01238
1 0.02429
2 0.02421
3 0.02441
4 0.02474
5 0.02485
6 0.02450
7 0.02489
1 0.04629
2 0.04611
3 0.04660
4 0.04629
5 0.04656
6 0.04583
7 0.04580
1 0.06936
2 0.06987
3 0.06964
4 0.06957
5 0.07006
6 0.06971
7 0.06899
1 0.09490
2 0.09534
3 0.09547
4 0.09474
5 0.09508
6 0.09590
7 0.09509
1 *
2 0.11856
3 0.11804
4 0.11881
5 0.11774
6 0.11784
7 0.11841
0.00043 0.360026 100.1 mM 0.11823
0.00039 0.408685 80.1 mM 0.09522
0.00035 0.500754 60.1 mM 0.06960
0.00032 0.689923 40.0 mM 0.04621
0.00027 1.111262 20.0 mM 0.02456
0.00013 1.040711 10.0 mM 0.01223
24
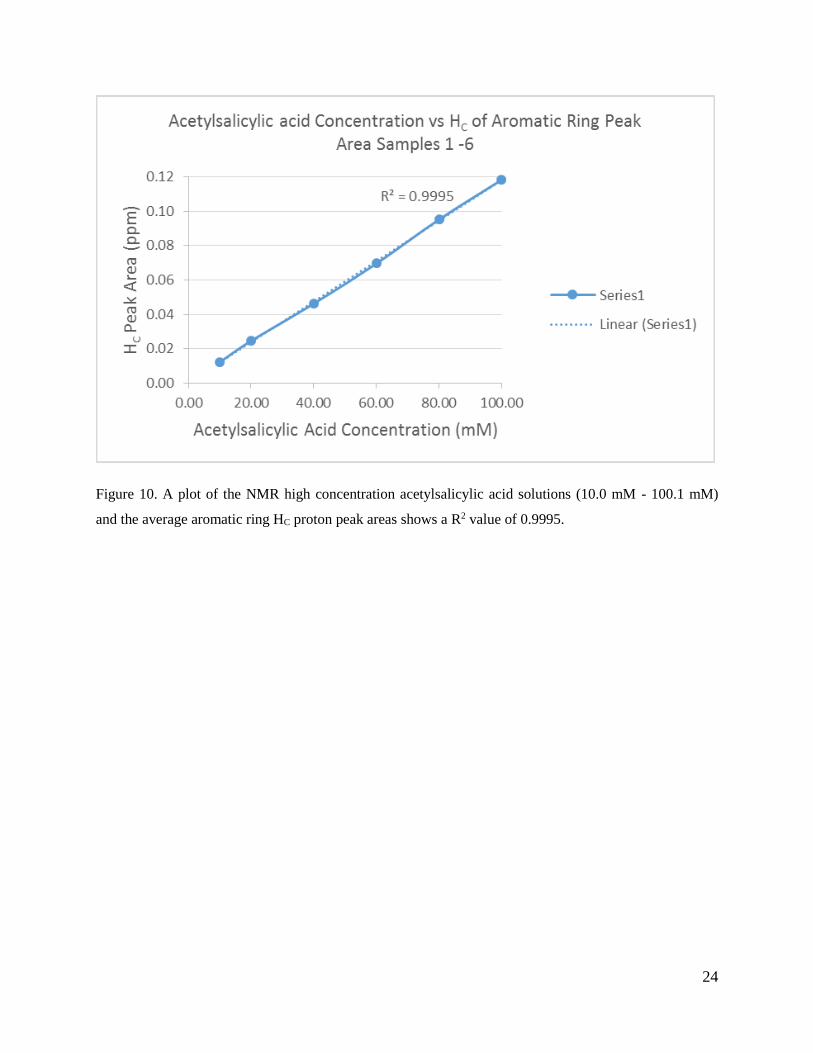
Figure 10. A plot of the NMR high concentration acetylsalicylic acid solutions (10.0 mM - 100.1 mM)
and the average aromatic ring HC proton peak areas shows a R2 value of 0.9995.

25
Table 5. The NMR high concentration acetylsalicylic acid solutions: Average
aromatic ring HD proton peak areas, the % RSD ranged from 0.27292%
(100.1 mM) – 0.62974% (20.0 mM).
* Represents data that could not be obtained due to a software error during
the saving process.
Sample No.
Acetylsalicylic Acid
Concentration
NMR Trial
No.
HD of Aromatic
Ring Peak
Area (rel)
Peak Area
Mean (rel) RSD %RSD
1 0.01131
2 0.01151
3 0.01151
4 0.01147
5 0.01142
6 0.01141
7 0.01149
1 0.02388
2 0.02384
3 0.02371
4 0.02394
5 0.02376
6 0.02379
7 0.02388
1 0.04527
2 0.04533
3 0.04589
4 0.04507
5 0.04541
6 0.04506
7 0.04522
1 0.06720
2 0.06764
3 0.06748
4 0.06717
5 0.06798
6 0.06754
7 0.06694
1 0.09113
2 0.09103
3 0.09060
4 0.09115
5 0.09131
6 0.09092
7 0.09132
1 *
2 0.11417
3 0.11347
4 0.11426
5 0.11372
6 0.11365
7 0.11397
0.272926 100.1 mM 0.11387 0.00031
0.274525 80.1 mM 0.09107 0.00025
0.514264 60.1 mM 0.06742 0.00035
0.621273 40.0 mM 0.04532 0.00028
0.334352 20.0 mM 0.02383 0.00008
0.629741 10.0 mM 0.01145 0.00007
26
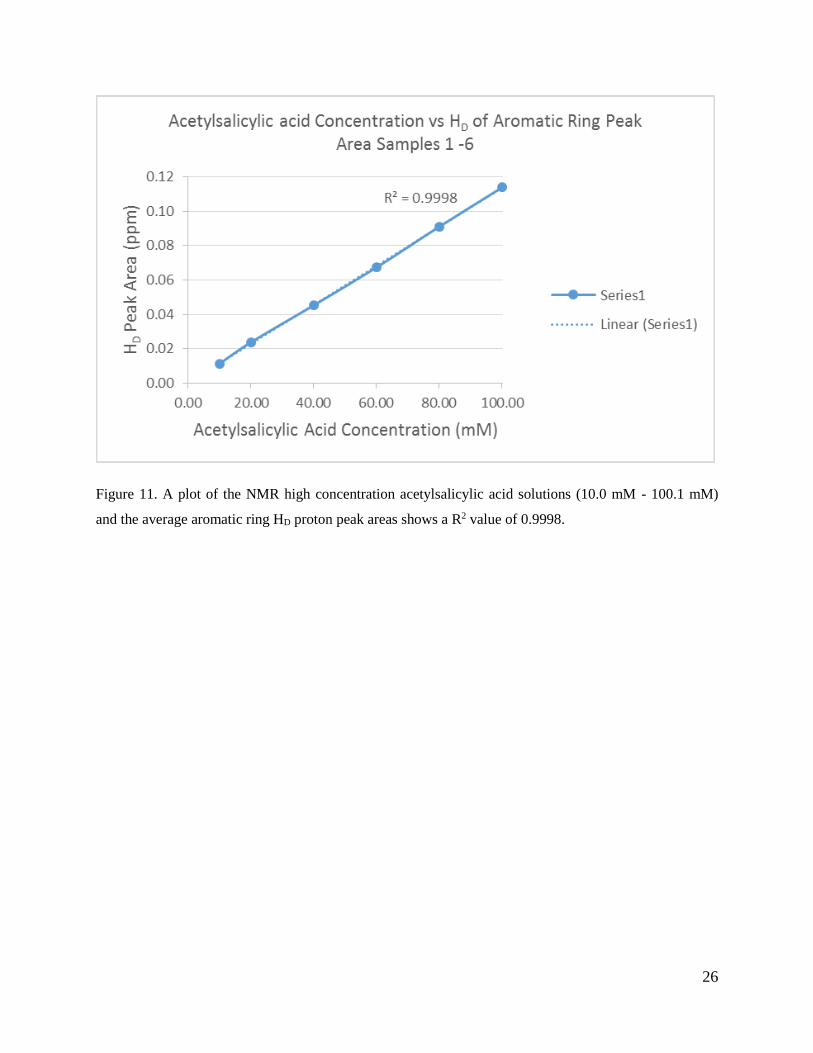
Figure 11. A plot of the NMR high concentration acetylsalicylic acid solutions (10.0 mM - 100.1 mM)
and the average aromatic ring HD proton peak areas shows a R2 value of 0.9998.
27
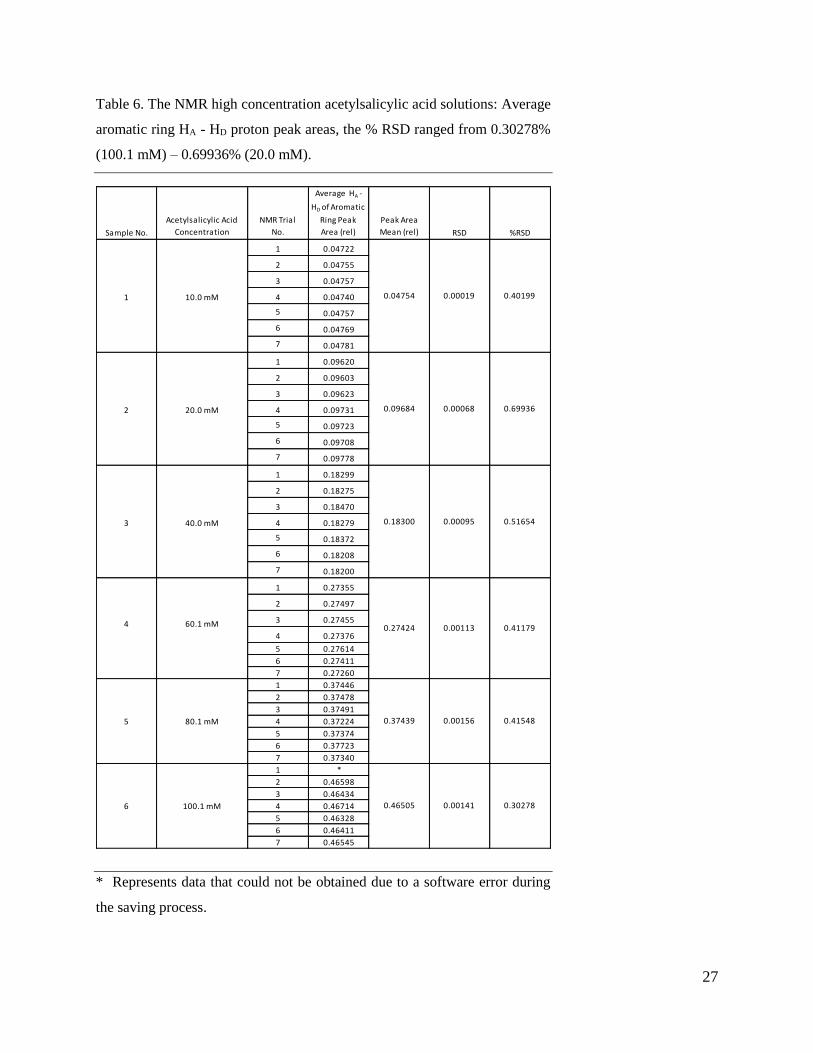
Table 6. The NMR high concentration acetylsalicylic acid solutions: Average
aromatic ring HA - HD proton peak areas, the % RSD ranged from 0.30278%
(100.1 mM) – 0.69936% (20.0 mM).
* Represents data that could not be obtained due to a software error during
the saving process.
Sample No.
Acetylsalicylic Acid
Concentration
NMR Trial
No.
Average HA -
HD of Aromatic
Ring Peak
Area (rel)
Peak Area
Mean (rel) RSD %RSD
1 0.04722
2 0.04755
3 0.04757
4 0.04740
5 0.04757
6 0.04769
7 0.04781
1 0.09620
2 0.09603
3 0.09623
4 0.09731
5 0.09723
6 0.09708
7 0.09778
1 0.18299
2 0.18275
3 0.18470
4 0.18279
5 0.18372
6 0.18208
7 0.18200
1 0.27355
2 0.27497
3 0.27455
4 0.27376
5 0.27614
6 0.27411
7 0.27260
1 0.37446
2 0.37478
3 0.37491
4 0.37224
5 0.37374
6 0.37723
7 0.37340
1 *
2 0.46598
3 0.46434
4 0.46714
5 0.46328
6 0.46411
7 0.46545
6 100.1 mM 0.46505 0.00141 0.30278
5 80.1 mM 0.37439 0.00156 0.41548
4 60.1 mM 0.27424 0.00113 0.41179
3 40.0 mM 0.18300 0.00095 0.51654
2 20.0 mM 0.09684 0.00068 0.69936
1 10.0 mM 0.04754 0.00019 0.40199
28
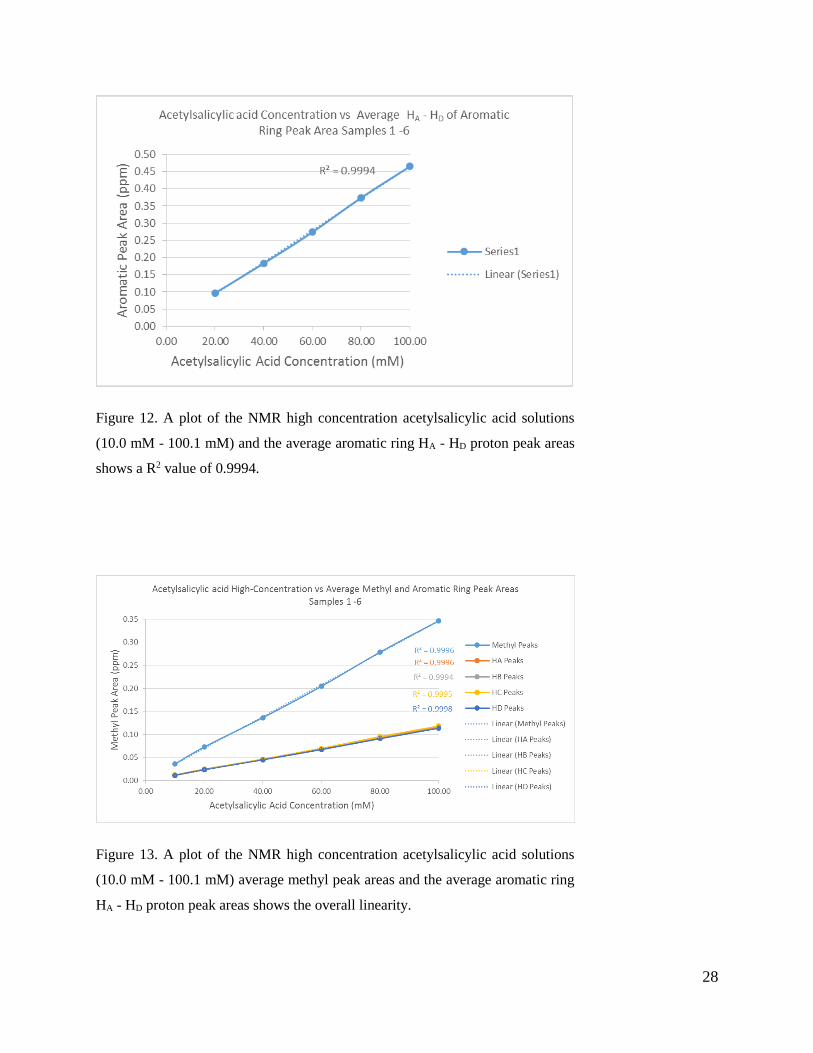
Figure 12. A plot of the NMR high concentration acetylsalicylic acid solutions
(10.0 mM - 100.1 mM) and the average aromatic ring HA - HD proton peak areas
shows a R2 value of 0.9994.
Figure 13. A plot of the NMR high concentration acetylsalicylic acid solutions
(10.0 mM - 100.1 mM) average methyl peak areas and the average aromatic ring
HA - HD proton peak areas shows the overall linearity.
29
NMR Analysis of Low Concentration Acetylsalicylic Acid Solutions
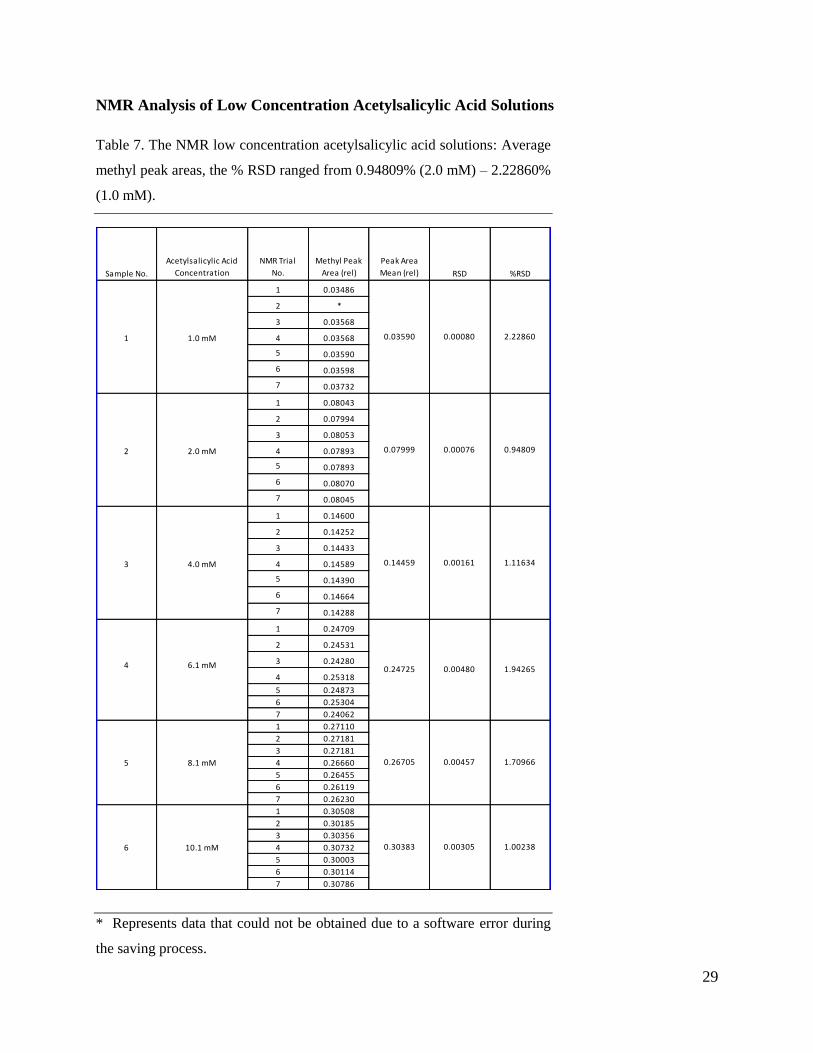
Table 7. The NMR low concentration acetylsalicylic acid solutions: Average
methyl peak areas, the % RSD ranged from 0.94809% (2.0 mM) – 2.22860%
(1.0 mM).
* Represents data that could not be obtained due to a software error during
the saving process.
Sample No.
Acetylsalicylic Acid
Concentration
NMR Trial
No.
Methyl Peak
Area (rel)
Peak Area
Mean (rel) RSD %RSD
1 0.03486
2 *
3 0.03568
4 0.03568
5 0.03590
6 0.03598
7 0.03732
1 0.08043
2 0.07994
3 0.08053
4 0.07893
5 0.07893
6 0.08070
7 0.08045
1 0.14600
2 0.14252
3 0.14433
4 0.14589
5 0.14390
6 0.14664
7 0.14288
1 0.24709
2 0.24531
3 0.24280
4 0.25318
5 0.24873
6 0.25304
7 0.24062
1 0.27110
2 0.27181
3 0.27181
4 0.26660
5 0.26455
6 0.26119
7 0.26230
1 0.30508
2 0.30185
3 0.30356
4 0.30732
5 0.30003
6 0.30114
7 0.30786
5
6
1.11634
10.1 mM
0.26705 0.00457 1.70966
1.0 mM 0.03590 0.00080 2.228601
2
3
4
2.0 mM 0.07999 0.00076 0.94809
4.0 mM 0.14459 0.00161
6.1 mM 0.24725 0.00480 1.94265
8.1 mM
0.30383 0.00305 1.00238
30
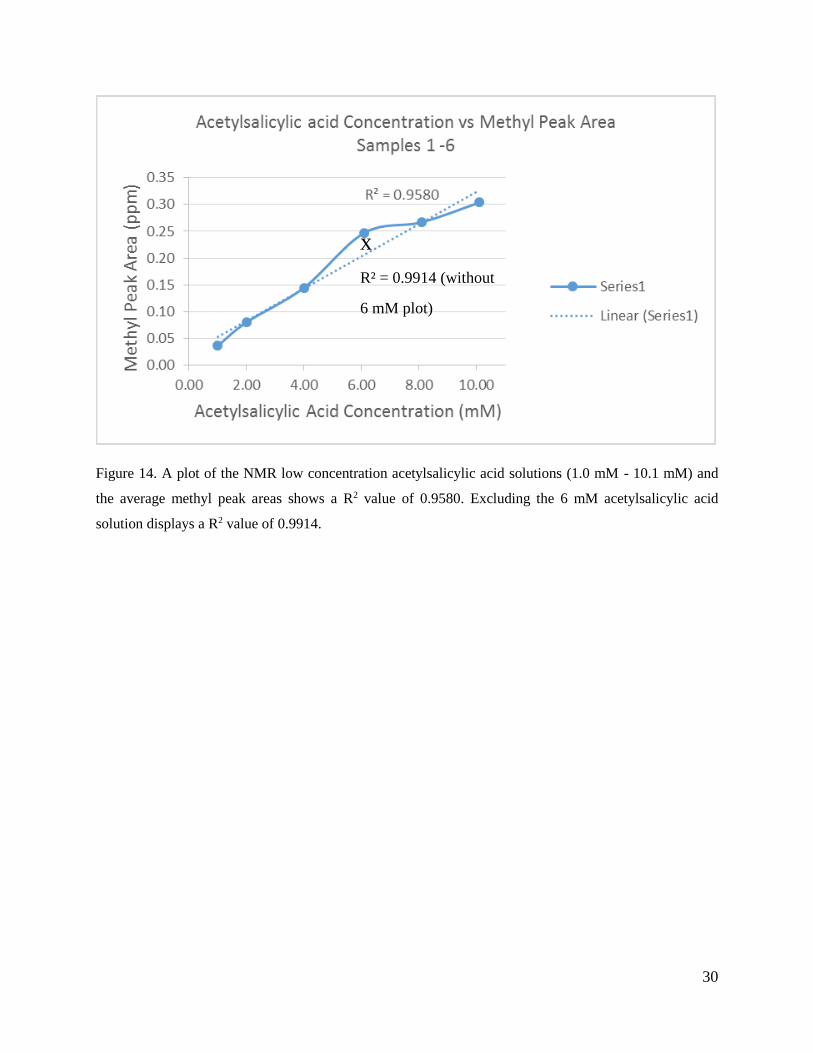
Figure 14. A plot of the NMR low concentration acetylsalicylic acid solutions (1.0 mM - 10.1 mM) and
the average methyl peak areas shows a R2 value of 0.9580. Excluding the 6 mM acetylsalicylic acid
solution displays a R2 value of 0.9914.
x
R² = 0.9914 (without
6 mM plot)
31
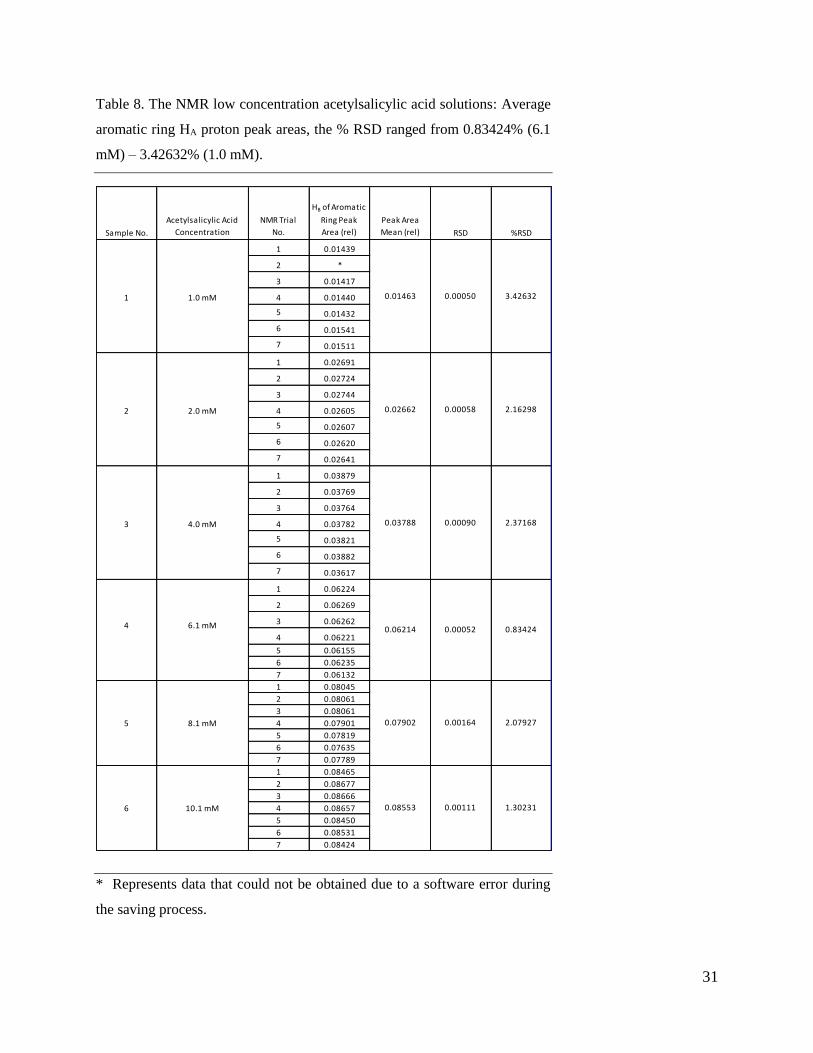
Table 8. The NMR low concentration acetylsalicylic acid solutions: Average
aromatic ring HA proton peak areas, the % RSD ranged from 0.83424% (6.1
mM) – 3.42632% (1.0 mM).
* Represents data that could not be obtained due to a software error during
the saving process.
Sample No.
Acetylsalicylic Acid
Concentration
NMR Trial
No.
HB of Aromatic
Ring Peak
Area (rel)
Peak Area
Mean (rel) RSD %RSD
1 0.01439
2 *
3 0.01417
4 0.01440
5 0.01432
6 0.01541
7 0.01511
1 0.02691
2 0.02724
3 0.02744
4 0.02605
5 0.02607
6 0.02620
7 0.02641
1 0.03879
2 0.03769
3 0.03764
4 0.03782
5 0.03821
6 0.03882
7 0.03617
1 0.06224
2 0.06269
3 0.06262
4 0.06221
5 0.06155
6 0.06235
7 0.06132
1 0.08045
2 0.08061
3 0.08061
4 0.07901
5 0.07819
6 0.07635
7 0.07789
1 0.08465
2 0.08677
3 0.08666
4 0.08657
5 0.08450
6 0.08531
7 0.08424
1
2
3
4
5
6
2.0 mM 0.02662 0.00058 2.16298
1.0 mM 0.01463 0.00050 3.42632
6.1 mM 0.06214 0.00052
4.0 mM 0.03788 0.00090 2.37168
0.83424
1.30231
2.07927
10.1 mM
0.07902 0.001648.1 mM
0.08553 0.00111
32
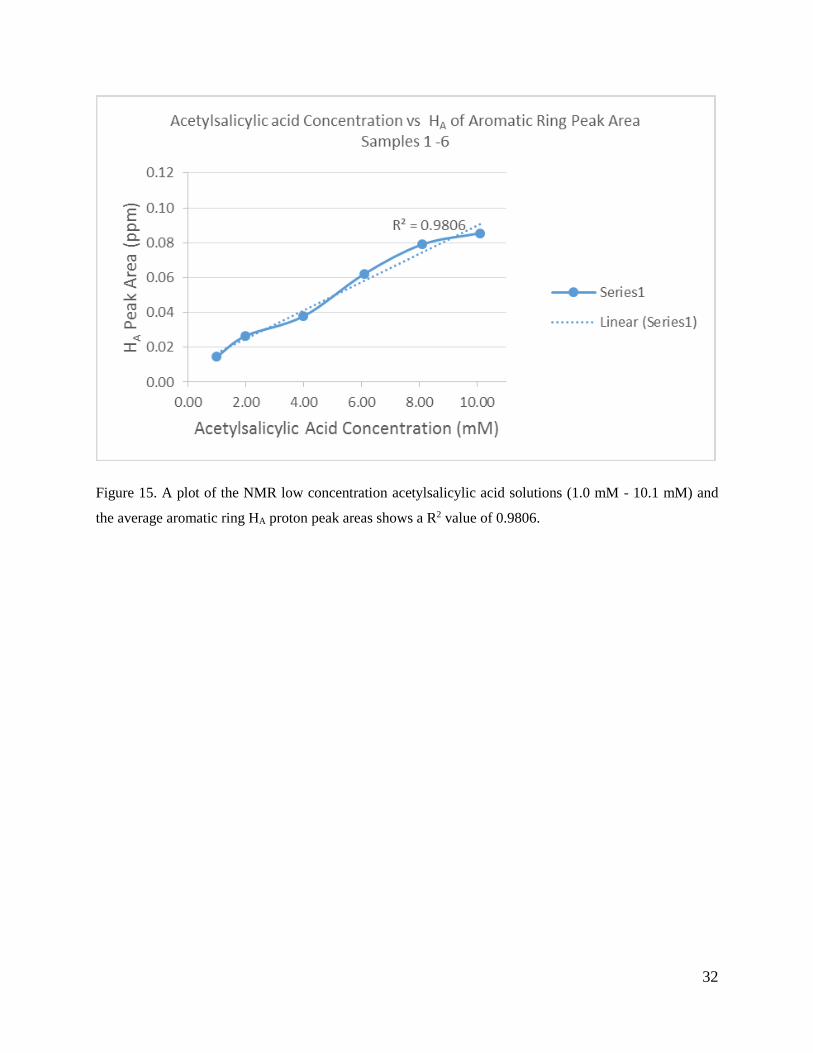
Figure 15. A plot of the NMR low concentration acetylsalicylic acid solutions (1.0 mM - 10.1 mM) and
the average aromatic ring HA proton peak areas shows a R2 value of 0.9806.

33
Table 9. The NMR low concentration acetylsalicylic acid solutions: Average
aromatic ring HB proton peak areas, the % RSD ranged from 0.80307% (6.1
mM) – 2.95824% (1.0 mM).
* Represents data that could not be obtained due to a software error during
the saving process.
Sample No.
Acetylsalicylic Acid
Concentration
NMR Trial
No.
HB of Aromatic
Ring Peak
Area (rel)
Peak Area
Mean (rel) RSD %RSD
1 0.01714
2 *
3 0.01792
4 0.01730
5 0.01816
6 0.01842
7 0.01735
1 0.03105
2 0.03071
3 0.03141
4 0.02980
5 0.02990
6 0.03016
7 0.03020
1 0.04192
2 0.04203
3 0.04139
4 0.04155
5 0.04117
6 0.04058
7 0.04105
1 0.07009
2 0.07096
3 0.07072
4 0.07143
5 0.07018
6 0.06977
7 0.07052
1 0.09095
2 0.09052
3 0.09052
4 0.08875
5 0.08662
6 0.08735
7 0.08864
1 0.09214
2 0.09519
3 0.09525
4 0.09555
5 0.09474
6 0.09478
7 0.09325
1 1.0 mM 0.01772 0.00052 2.95824
0.03046 0.00061 1.996822 2.0 mM
0.04138 0.00051 1.222593 4.0 mM
4 6.1 mM 0.07052 0.00057 0.80307
0.08905 0.00168 1.889395 8.1 mM
0.09441 0.00125 1.322746 10.1 mM
34
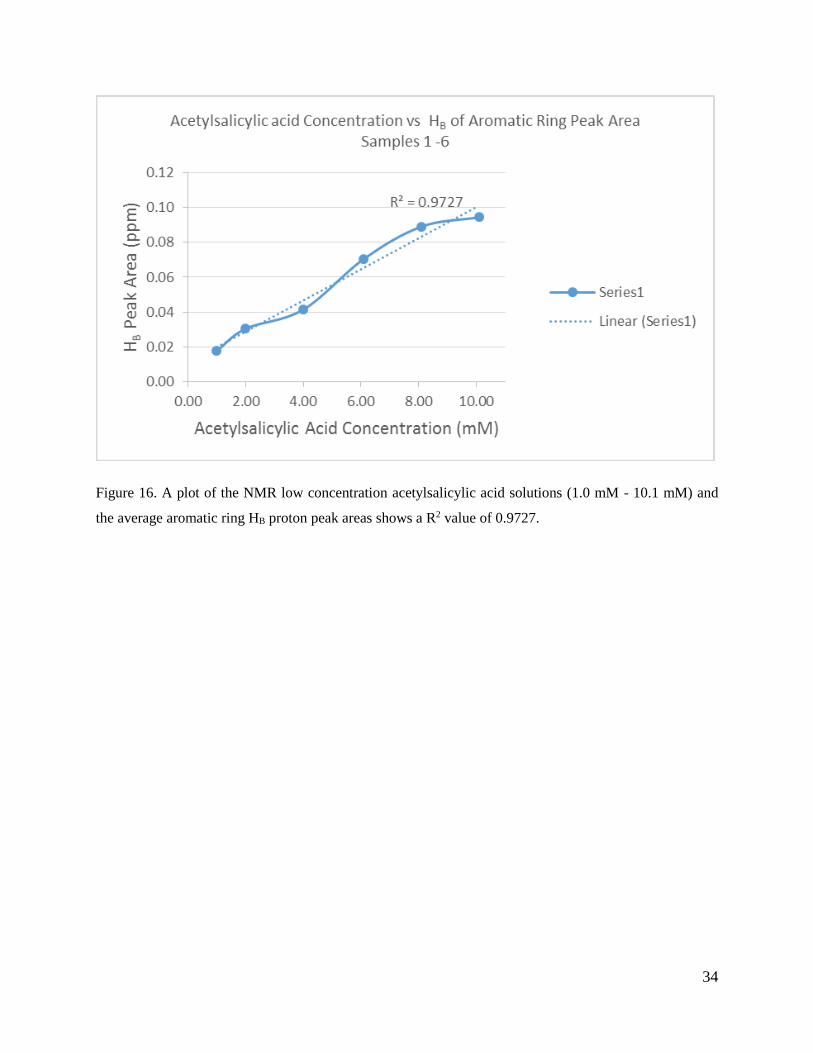
Figure 16. A plot of the NMR low concentration acetylsalicylic acid solutions (1.0 mM - 10.1 mM) and
the average aromatic ring HB proton peak areas shows a R2 value of 0.9727.
35
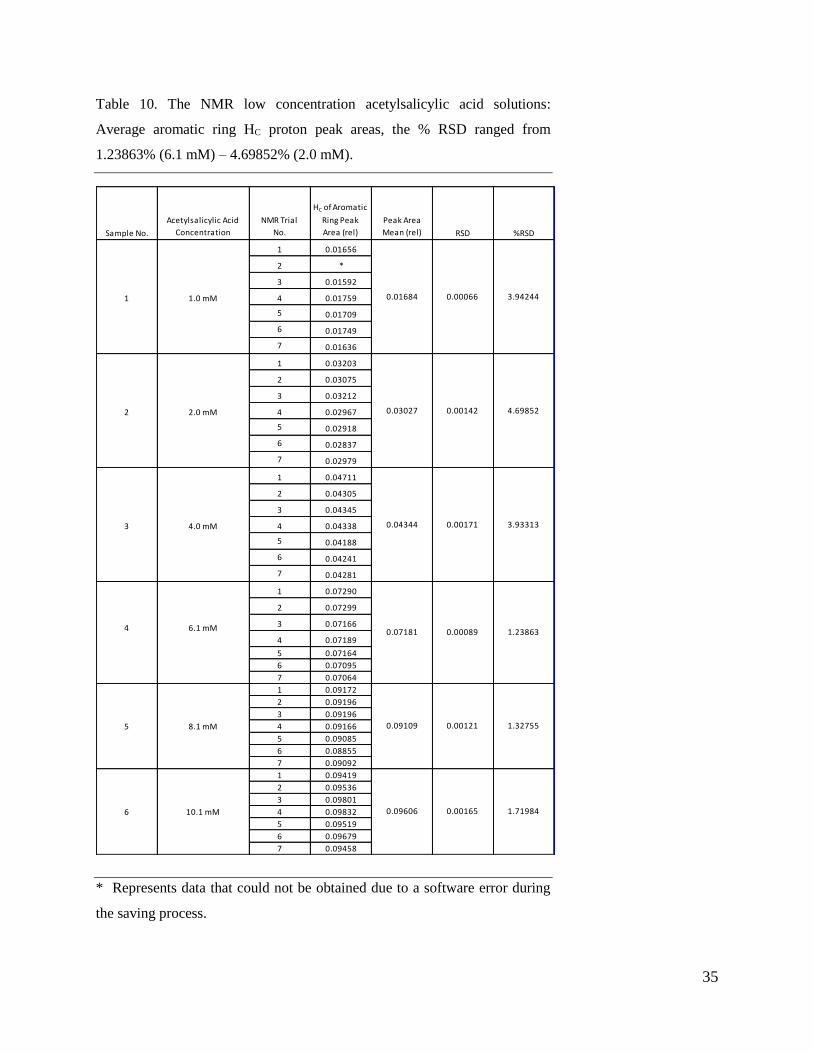
Table 10. The NMR low concentration acetylsalicylic acid solutions:
Average aromatic ring HC proton peak areas, the % RSD ranged from
1.23863% (6.1 mM) – 4.69852% (2.0 mM).
* Represents data that could not be obtained due to a software error during
the saving process.
Sample No.
Acetylsalicylic Acid
Concentration
NMR Trial
No.
HC of Aromatic
Ring Peak
Area (rel)
Peak Area
Mean (rel) RSD %RSD
1 0.01656
2 *
3 0.01592
4 0.01759
5 0.01709
6 0.01749
7 0.01636
1 0.03203
2 0.03075
3 0.03212
4 0.02967
5 0.02918
6 0.02837
7 0.02979
1 0.04711
2 0.04305
3 0.04345
4 0.04338
5 0.04188
6 0.04241
7 0.04281
1 0.07290
2 0.07299
3 0.07166
4 0.07189
5 0.07164
6 0.07095
7 0.07064
1 0.09172
2 0.09196
3 0.09196
4 0.09166
5 0.09085
6 0.08855
7 0.09092
1 0.09419
2 0.09536
3 0.09801
4 0.09832
5 0.09519
6 0.09679
7 0.09458
0.00066 3.942441 1.0 mM 0.01684
0.00142 4.698522 2.0 mM 0.03027
3 4.0 mM 0.04344 0.00171 3.93313
0.00089 1.238634 6.1 mM 0.07181
0.00121 1.327555 8.1 mM 0.09109
6 10.1 mM 0.09606 0.00165 1.71984

36
Figure 17. A plot of the NMR low concentration acetylsalicylic acid solutions (1.0 mM - 10.1 mM) and
the average aromatic ring HC proton peak areas shows a R2 value of 0.9737.
37
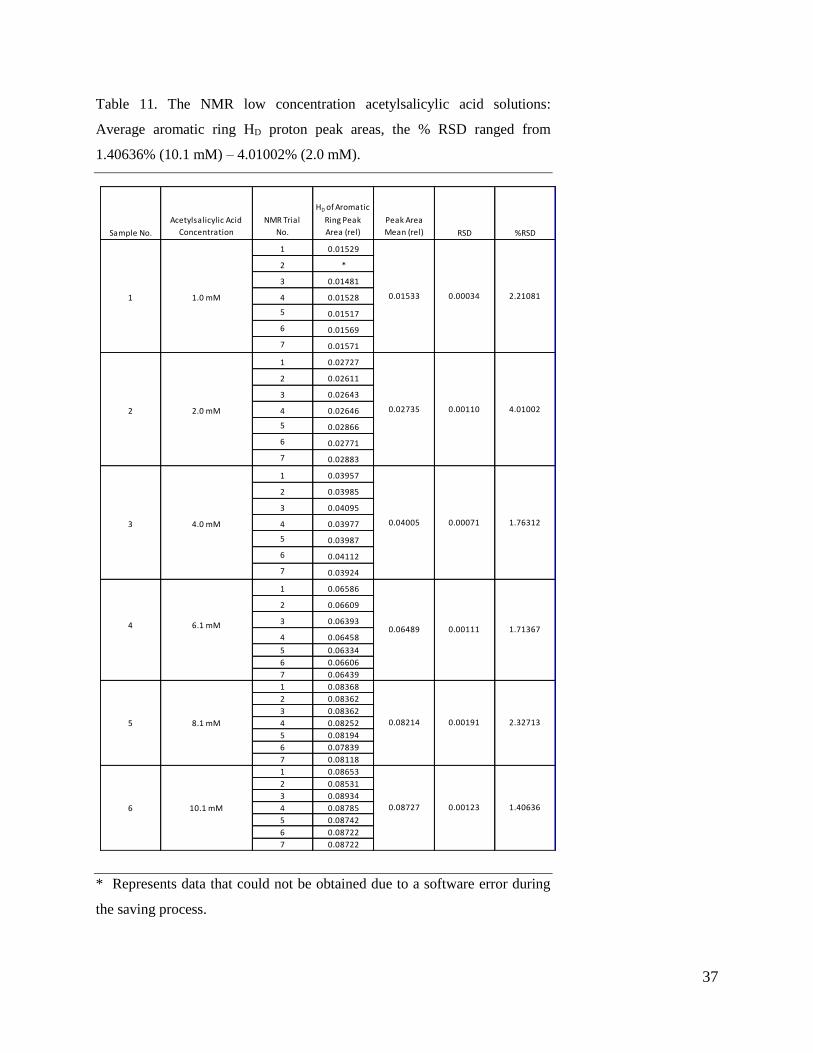
Table 11. The NMR low concentration acetylsalicylic acid solutions:
Average aromatic ring HD proton peak areas, the % RSD ranged from
1.40636% (10.1 mM) – 4.01002% (2.0 mM).
* Represents data that could not be obtained due to a software error during
the saving process.
Sample No.
Acetylsalicylic Acid
Concentration
NMR Trial
No.
HD of Aromatic
Ring Peak
Area (rel)
Peak Area
Mean (rel) RSD %RSD
1 0.01529
2 *
3 0.01481
4 0.01528
5 0.01517
6 0.01569
7 0.01571
1 0.02727
2 0.02611
3 0.02643
4 0.02646
5 0.02866
6 0.02771
7 0.02883
1 0.03957
2 0.03985
3 0.04095
4 0.03977
5 0.03987
6 0.04112
7 0.03924
1 0.06586
2 0.06609
3 0.06393
4 0.06458
5 0.06334
6 0.06606
7 0.06439
1 0.08368
2 0.08362
3 0.08362
4 0.08252
5 0.08194
6 0.07839
7 0.08118
1 0.08653
2 0.08531
3 0.08934
4 0.08785
5 0.08742
6 0.08722
7 0.08722
2.210811 1.0 mM 0.01533 0.00034
2 2.0 mM 0.02735 0.00110 4.01002
1.763123 4.0 mM 0.04005 0.00071
1.713674 6.1 mM 0.06489 0.00111
5 8.1 mM 0.08214 0.00191 2.32713
1.406366 10.1 mM 0.08727 0.00123
38
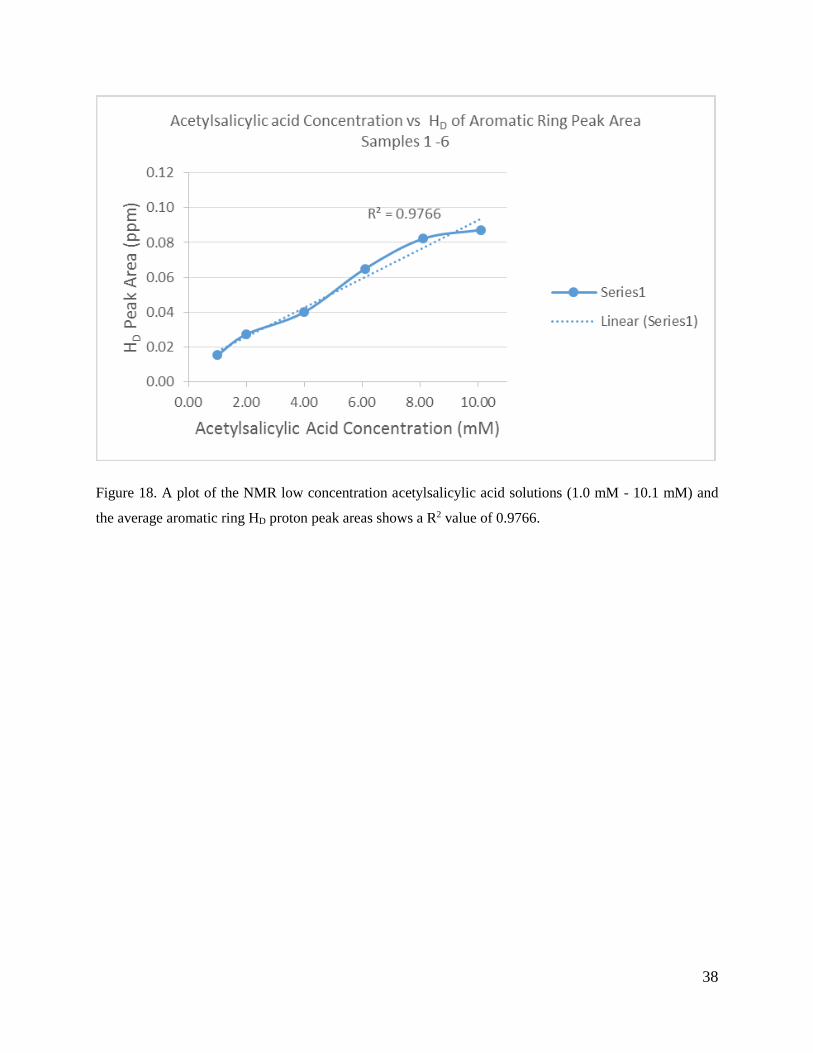
Figure 18. A plot of the NMR low concentration acetylsalicylic acid solutions (1.0 mM - 10.1 mM) and
the average aromatic ring HD proton peak areas shows a R2 value of 0.9766.
39
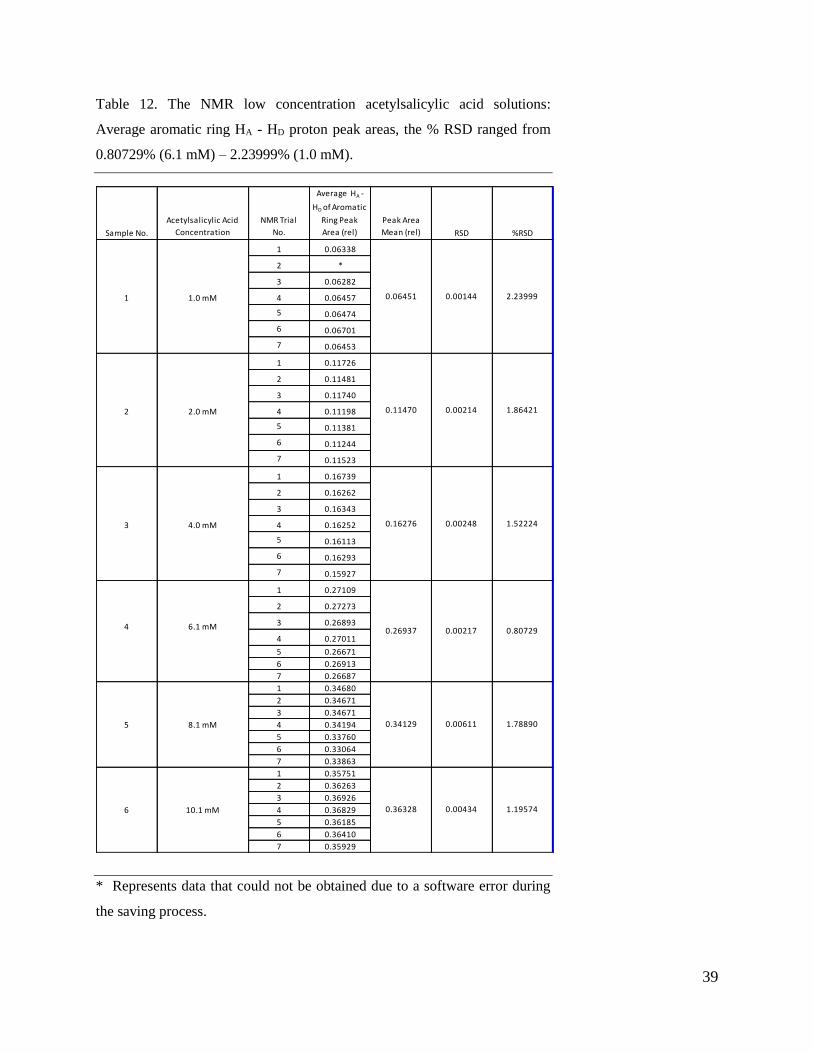
Table 12. The NMR low concentration acetylsalicylic acid solutions:
Average aromatic ring HA - HD proton peak areas, the % RSD ranged from
0.80729% (6.1 mM) – 2.23999% (1.0 mM).
* Represents data that could not be obtained due to a software error during
the saving process.
Sample No.
Acetylsalicylic Acid
Concentration
NMR Trial
No.
Average HA -
HD of Aromatic
Ring Peak
Area (rel)
Peak Area
Mean (rel) RSD %RSD
1 0.06338
2 *
3 0.06282
4 0.06457
5 0.06474
6 0.06701
7 0.06453
1 0.11726
2 0.11481
3 0.11740
4 0.11198
5 0.11381
6 0.11244
7 0.11523
1 0.16739
2 0.16262
3 0.16343
4 0.16252
5 0.16113
6 0.16293
7 0.15927
1 0.27109
2 0.27273
3 0.26893
4 0.27011
5 0.26671
6 0.26913
7 0.26687
1 0.34680
2 0.34671
3 0.34671
4 0.34194
5 0.33760
6 0.33064
7 0.33863
1 0.35751
2 0.36263
3 0.36926
4 0.36829
5 0.36185
6 0.36410
7 0.35929
1 1.0 mM 0.06451 0.00144 2.23999
0.11470 0.00214 1.864212 2.0 mM
3 4.0 mM 0.16276 0.00248 1.52224
4 6.1 mM 0.26937 0.00217 0.80729
0.34129 0.00611 1.788905 8.1 mM
6 10.1 mM 0.36328 0.00434 1.19574
40
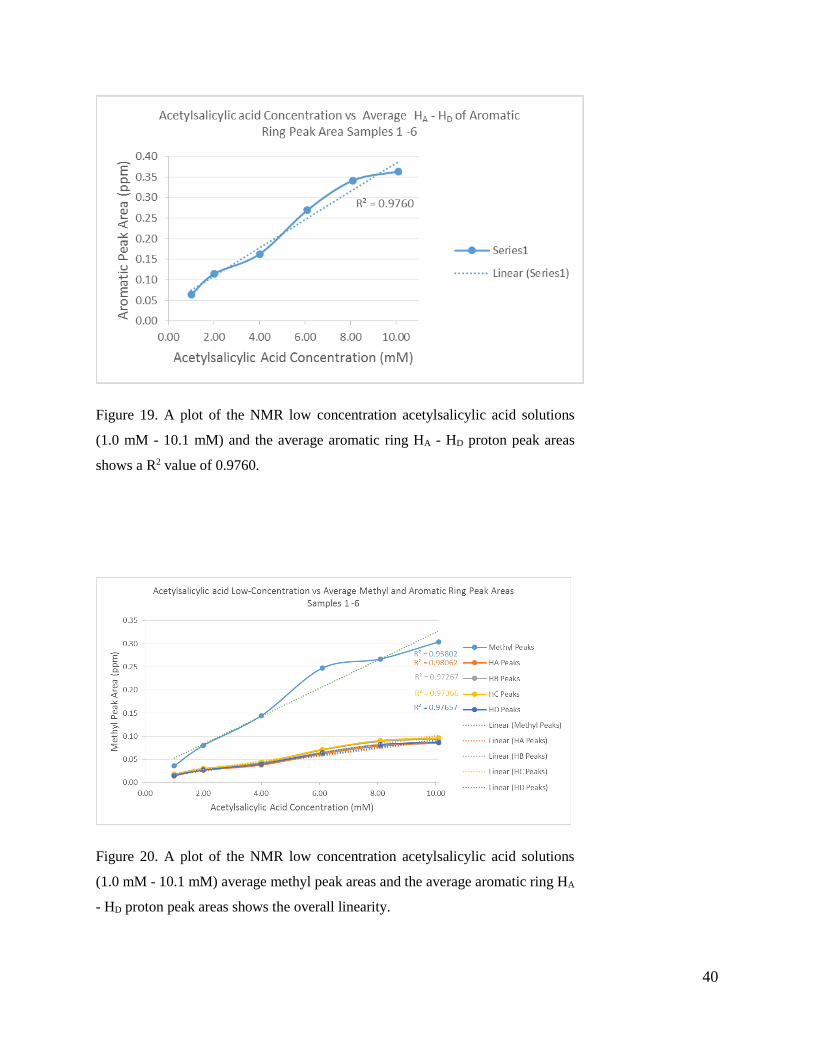
Figure 19. A plot of the NMR low concentration acetylsalicylic acid solutions
(1.0 mM - 10.1 mM) and the average aromatic ring HA - HD proton peak areas
shows a R2 value of 0.9760.
Figure 20. A plot of the NMR low concentration acetylsalicylic acid solutions
(1.0 mM - 10.1 mM) average methyl peak areas and the average aromatic ring HA
- HD proton peak areas shows the overall linearity.
41
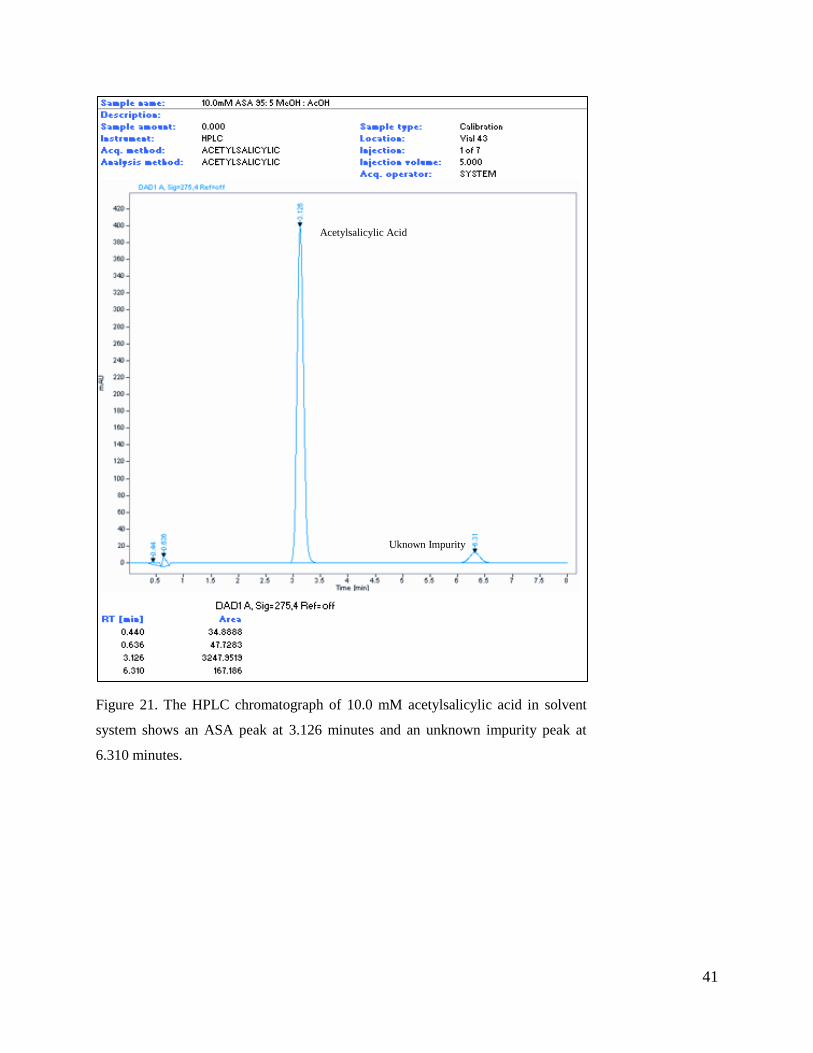
Figure 21. The HPLC chromatograph of 10.0 mM acetylsalicylic acid in solvent
system shows an ASA peak at 3.126 minutes and an unknown impurity peak at
6.310 minutes.
Uknown Impurity
Acetylsalicylic Acid
42
HPLC Analysis of Low Concentration Acetylsalicylic Acid Solutions
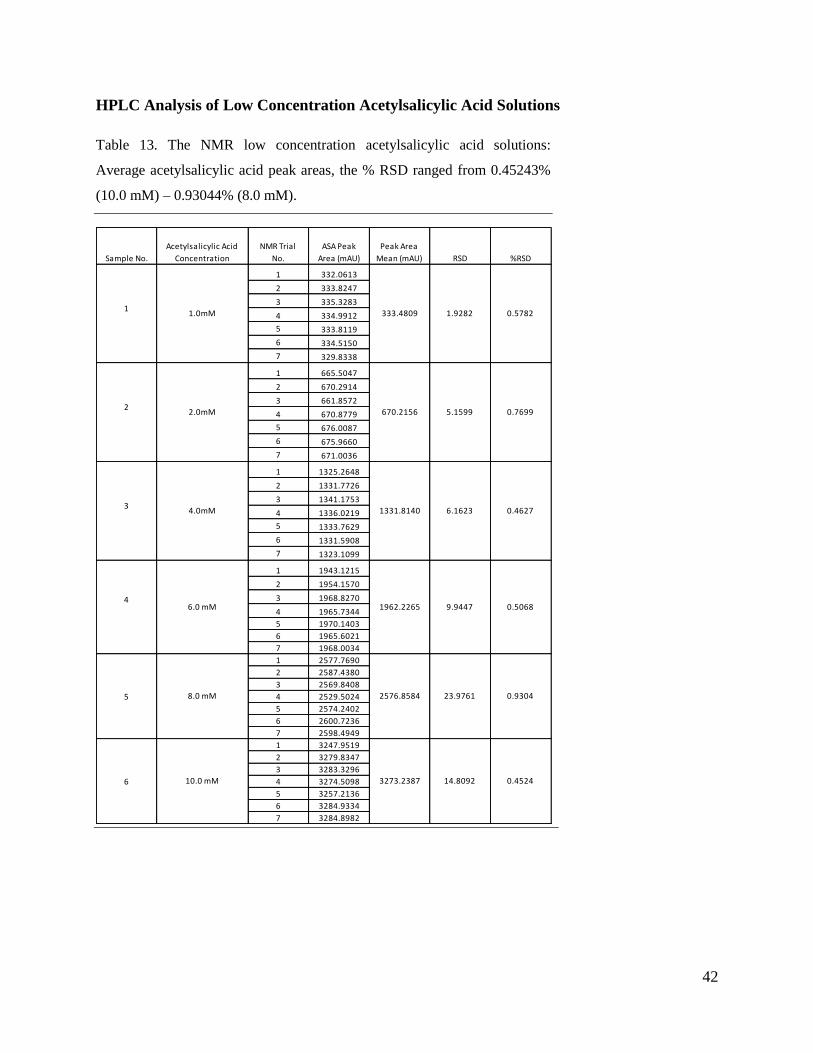
Table 13. The NMR low concentration acetylsalicylic acid solutions:
Average acetylsalicylic acid peak areas, the % RSD ranged from 0.45243%
(10.0 mM) – 0.93044% (8.0 mM).
Sample No.
Acetylsalicylic Acid
Concentration
NMR Trial
No.
ASA Peak
Area (mAU)
Peak Area
Mean (mAU) RSD %RSD
1 332.0613
2 333.8247
3 335.3283
4 334.9912
5 333.8119
6 334.5150
7 329.8338
1 665.5047
2 670.2914
3 661.8572
4 670.8779
5 676.0087
6 675.9660
7 671.0036
1 1325.2648
2 1331.7726
3 1341.1753
4 1336.0219
5 1333.7629
6 1331.5908
7 1323.1099
1 1943.1215
2 1954.1570
3 1968.8270
4 1965.7344
5 1970.1403
6 1965.6021
7 1968.0034
1 2577.7690
2 2587.4380
3 2569.8408
4 2529.5024
5 2574.2402
6 2600.7236
7 2598.4949
1 3247.9519
2 3279.8347
3 3283.3296
4 3274.5098
5 3257.2136
6 3284.9334
7 3284.8982
6 10.0 mM 3273.2387 14.8092 0.4524
5 8.0 mM 2576.8584 23.9761 0.9304
46.0 mM 1962.2265 9.9447 0.5068
34.0mM 1331.8140 6.1623 0.4627
22.0mM 670.2156 5.1599 0.7699
11.0mM 333.4809 1.9282 0.5782
43
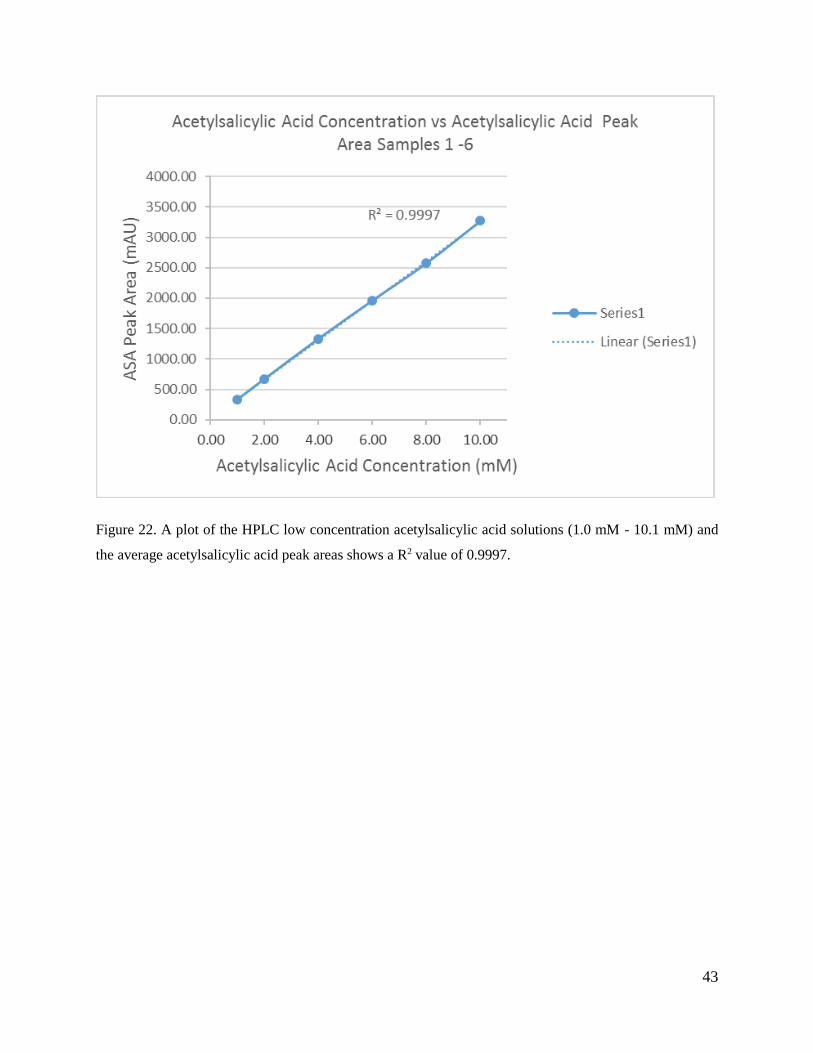
Figure 22. A plot of the HPLC low concentration acetylsalicylic acid solutions (1.0 mM - 10.1 mM) and
the average acetylsalicylic acid peak areas shows a R2 value of 0.9997.
44
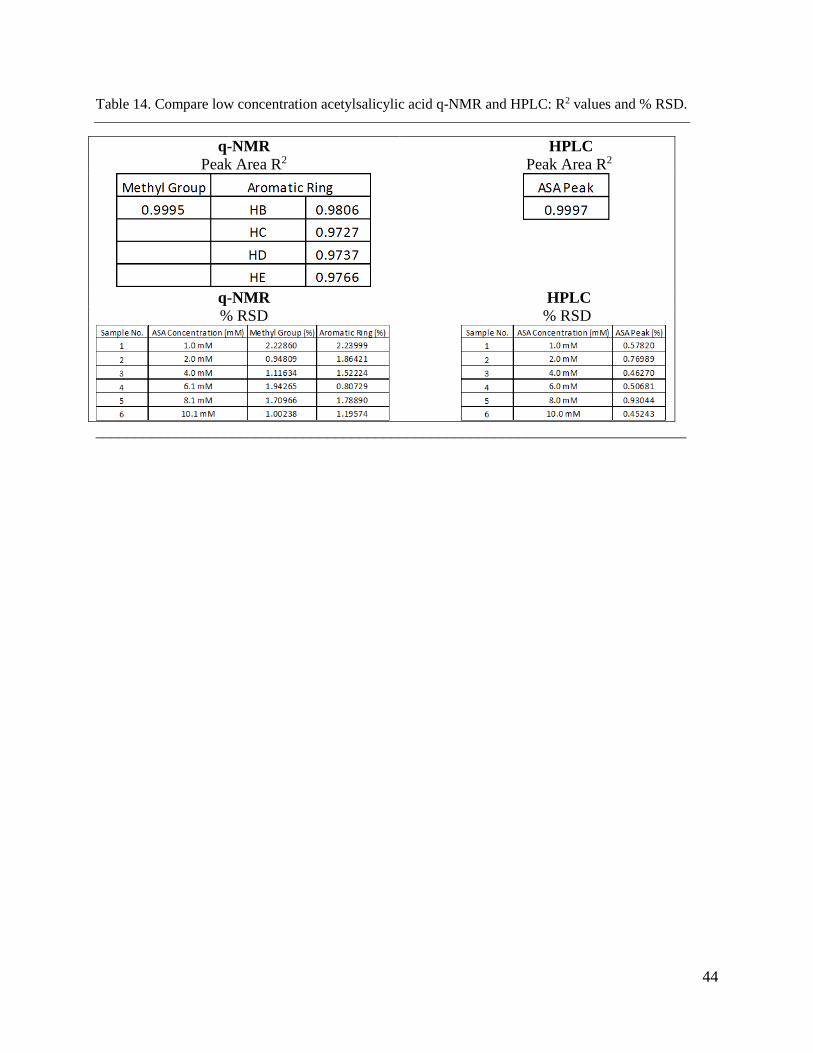
Table 14. Compare low concentration acetylsalicylic acid q-NMR and HPLC: R2 values and % RSD.
q-NMR HPLC
Peak Area R2 Peak Area R2
q-NMR HPLC
% RSD % RSD
__________________________________________________________________________
45
DISCUSSION
Qualitative Analysis
NMR of CDCl3
The proton NMR spectrum of CDCl3 (Figure 1) shows a residual solvent proton peak at 7.3 ppm
and an impurity peak at 1.5 ppm. Acetylsalicylic acid is readily soluble in CDCl3.
NMR of tert-butanol in CDCl3
The proton NMR spectrum of 100.4 mM tert-butanol in CDCl3 shows a tert-butanol methyl peak
at 1.4 ppm (Figure 2). The CDCl3 produces a residual solvent proton peak at 7.3 ppm.
NMR of Acetylsalicylic Acid in CDCl3
Figure 3 shows a proton NMR spectrum of 101.1 mM acetylsalicylic acid in CDCl3. The
acetylsalicylic acid methyl peak is at 2.4 ppm (singlet). The acetylsalicylic acid aromatic ring
proton peaks HA and HD, are both doublet of doublets at 8.2 ppm and 7.1 ppm respectively. The
remaining aromatic ring proton peaks HB and HC are both triplet of triplets at 7.7 ppm and 7.4
ppm respectively. The CDCl3 produces a residual solvent proton peak at 7.3 ppm.
NMR of Acetylsalicylic Acid in Solvent System (tert-butanol / CDCl3)
In Figure 4 and Figure 5, the proton NMR spectrum of 100.1 mM acetylsalicylic acid in the
solvent system shows an acetylsalicylic acid singlet methyl peak at 2.4 ppm. The acetylsalicylic
acid aromatic ring proton peaks are displayed at 8.2 ppm (HA), 7.7 ppm (HB), 7.4 ppm (HC), and
7.1 ppm (HD). The CDCl3 residual solvent proton peak is at 7.3 ppm. The tert-butanol methyl
peak is at 2.4 ppm and hydroxyl peak (broad singlet) has chemical shift of 6.3 ppm. The tert-
butanol hydroxyl peak does not interfere with the acetylsalicylic acid methyl peaks or the
aromatic ring proton peaks and will be used as the internal standard.
Figure 6 shows the proton NMR spectrum of 10.1 mM acetylsalicylic acid in the solvent system.
The acetylsalicylic acid methyl peak is at 2.4 ppm and aromatic ring proton peaks are located at
8.2 ppm (HA), 7.7 ppm (HB), 7.4 ppm (HC), and 7.1 ppm (HD). The CDCl3 residual solvent
proton peak is at 7.3 ppm. The tert-butanol peaks do not interfere with the acetylsalicylic acid
peaks. However, the acetylsalicylic acid concentrations lower than 10.1 mM shows tert-butanol
hydroxyl peaks interfering with the methyl peaks (see appendix).
46
Quantitative Analysis
NMR - High Concentration Acetylsalicylic Acid Methyl Peaks
The high concentration acetylsalicylic acid solutions ranging from 10.0 mM – 100.1 mM are
analyzed in septuplicate by q-NMR (Table 1). The acetylsalicylic acid methyl peak (singlet)
appears at 2.4 ppm (Figure 4). A plot of concentration of acetylsalicylic acid solutions vs.
average methyl peak areas shows a strong linear correlation with a R2 value of 0.9996 (Figure 7).
The % RSD for the analysis ranged from 0.2% to 0.7% showing high precision and robustness
(Table 1).
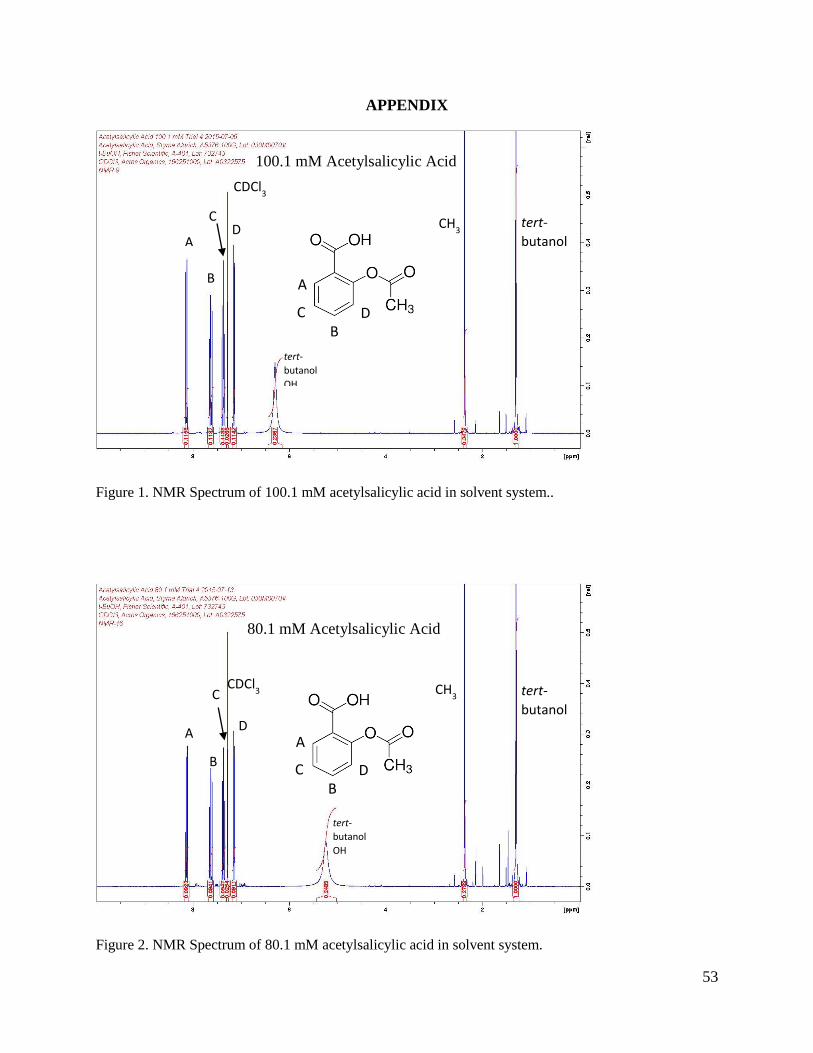
As the acetylsalicylic acid solution concentration decreases, the chemical shift of the tert-butanol
hydroxyl peak ranges from 2.4 ppm to 6.4 ppm (see appendix). It is likely that acetylsalicylic
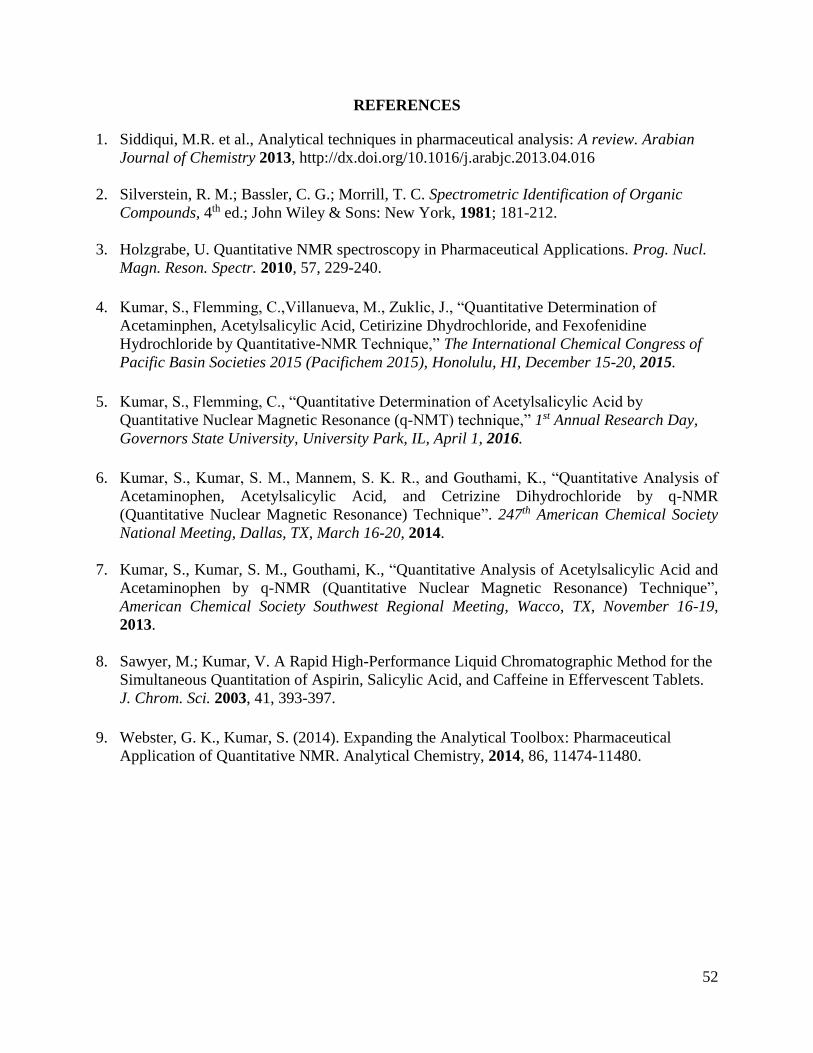
acid is forming a hydrogen bond with tert-butanol. However, the tert-butanol hydroxyl peak does
not interfere with any methyl peaks of acetylsalicylic acid and, therefore is suitable for
quantitative analysis.
NMR - High Concentration Acetylsalicylic Acid Aromatic Ring Proton Peaks
The proton NMR of the acetylsalicylic acid shows aromatic ring proton peaks HA, HB, HC, HD at
chemical shifts 8.2 ppm, 7.7 ppm, 7.4 ppm, and 7.1 ppm, respectively (Figure 4 & Figure 5). The
plot of concentration of acetylsalicylic acid solutions vs. average HA aromatic ring proton peak
areas shows a strong linear correlation, with a R2 value of 0.9996 (Figure 8). The % RSD for the
HA proton peak ranges from 0.2% to 0.7% for the high concentration acetylsalicylic acid
solutions, showing high precision (Table 2).
The plot of concentration of acetylsalicylic acid solutions vs. average HB aromatic ring proton
peak areas shows a strong linear correlation, with a R2 value of 0.9996 (Figure 9). The % RSD
for the HB proton peaks ranges from 0.3% to 1% for the high concentration acetylsalicylic acid
solutions showing high precision (Table 3).
The plot of concentration of acetylsalicylic acid solutions vs. average HC aromatic ring proton
peak areas shows a strong linear correlation, with a R2 value of 0.9995 (Figure 10). The % RSD
for the HC proton peaks ranges from 0.4% to 1% for the high concentration acetylsalicylic acid
solutions showing high precision (Table 4).
47
The plot of concentration of acetylsalicylic acid solutions vs. average HD aromatic ring proton
peak areas shows a strong linear correlation, with a R2 value of 0.9998 (Figure 11). The % RSD
for the HD proton peaks ranges from 0.3% to 0.6% for the high concentration acetylsalicylic acid
solutions showing high precision (Table 5).
The plot of concentration of acetylsalicylic acid solutions vs. average proton peak areas for HA -
HD shows a strong linear correlation, with a R2 value of 0.9994 (Figure 12). The % RSD for the
HA - HD proton peaks ranges from 0.3% to 0.7% for the high concentration acetylsalicylic acid
solutions showing high precision (Table 6).
The acetylsalicylic acid aromatic ring proton peak areas for the solutions ranging from 10.0 mM
to 100.1 mM have R2 values with a strong linear correlation and % RSD values <0.8% showing
high precision. Therefore, the aromatic ring proton peak areas of acetylsalicylic acid are suitable
for quantitative analysis.
The average methyl peak areas and average aromatic ring HA - HD proton peak areas for the high
concentration acetylsalicylic solution are plotted on the same graph to compare their overall
linearity (Figure 13).
NMR - Low Concentration Acetylsalicylic Acid Methyl Peaks
The acetylsalicylic acid solutions in low concentrations ranging from 1.0 mM – 10.1 mM are
analyzed in septuplicate by q-NMR (Table 7). The acetylsalicylic acid methyl peak (singlet)
appears at 2.4 ppm (Figure 6). A plot of concentration of acetylsalicylic acid solutions vs.
average methyl peak areas shows a weak linear correlation with a R2 value of 0.9580 (Figure 14).
The % RSD for this analysis ranged from 1% to 2% showing fairly good precision and
robustness (Table 7). However, the % RSD for the low concentration solutions is slightly lower
compared to the high concentration acetylsalicylic acid solutions.
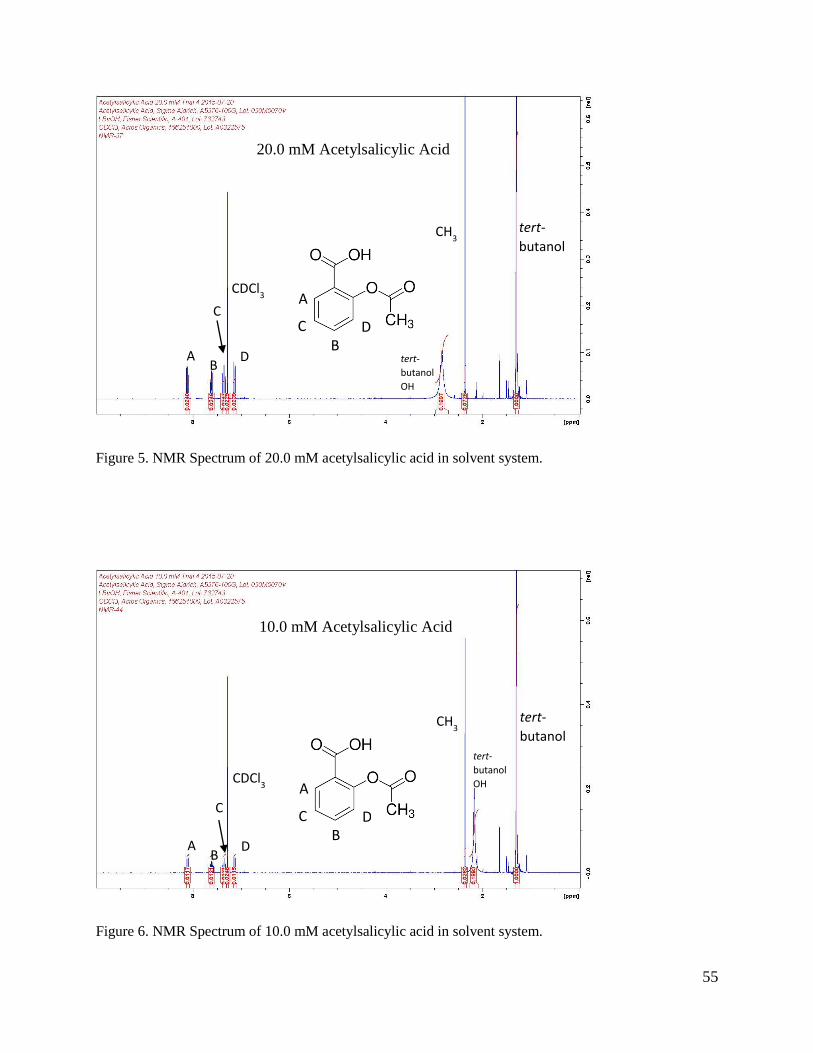
In addition, as the acetylsalicylic acid solution concentrations decrease, the chemical shift of the
tert-butanol hydroxyl peak shifts from 3.5 ppm to 6.4 ppm (see appendix). The tert-butanol
hydroxyl peak does interfere with the acetylsalicylic acid methyl peak for the solutions ranging
from 2.0 mM to 10.1 mM. However, if the acetylsalicylic acid solutions in low concentrations
are plotted without the 6.0 mM methyl peak areas a strong linear correlation is seen with a R2
48
value of 0.9914. Therefore, the methyl peak areas of acetylsalicylic acid are not suitable for
quantitative analysis at these low concentrations.
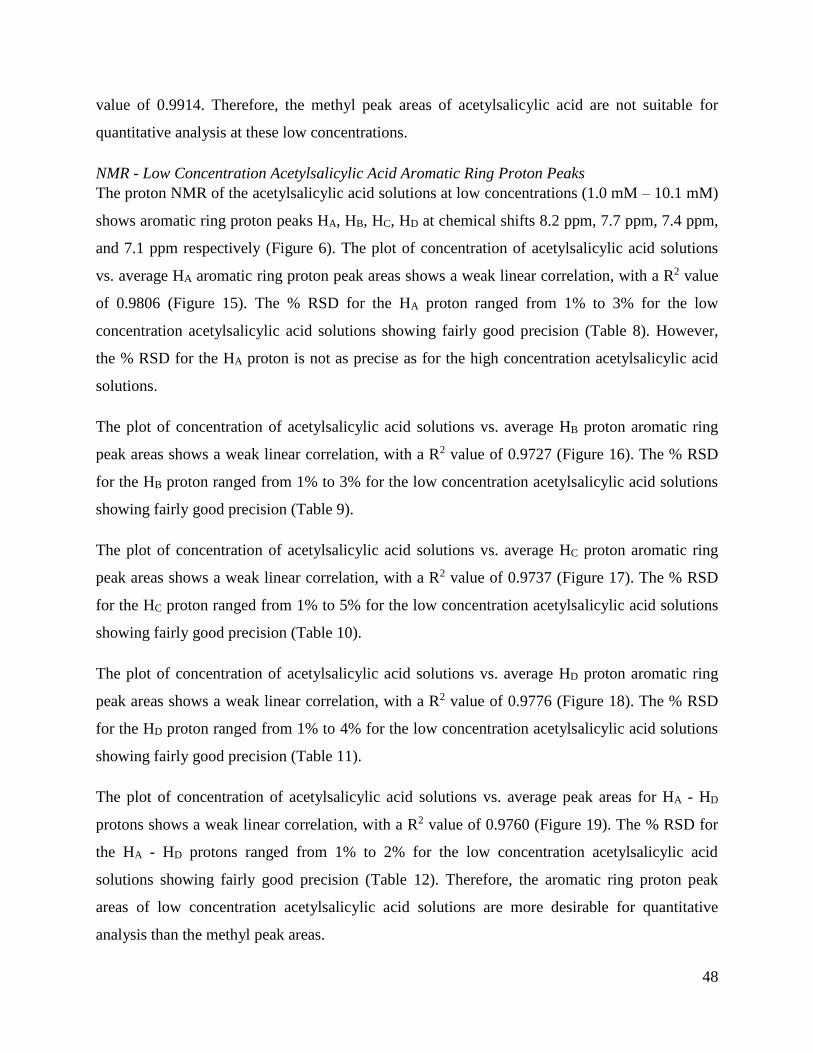
NMR - Low Concentration Acetylsalicylic Acid Aromatic Ring Proton Peaks
The proton NMR of the acetylsalicylic acid solutions at low concentrations (1.0 mM – 10.1 mM)
shows aromatic ring proton peaks HA, HB, HC, HD at chemical shifts 8.2 ppm, 7.7 ppm, 7.4 ppm,
and 7.1 ppm respectively (Figure 6). The plot of concentration of acetylsalicylic acid solutions
vs. average HA aromatic ring proton peak areas shows a weak linear correlation, with a R2 value
of 0.9806 (Figure 15). The % RSD for the HA proton ranged from 1% to 3% for the low
concentration acetylsalicylic acid solutions showing fairly good precision (Table 8). However,
the % RSD for the HA proton is not as precise as for the high concentration acetylsalicylic acid
solutions.
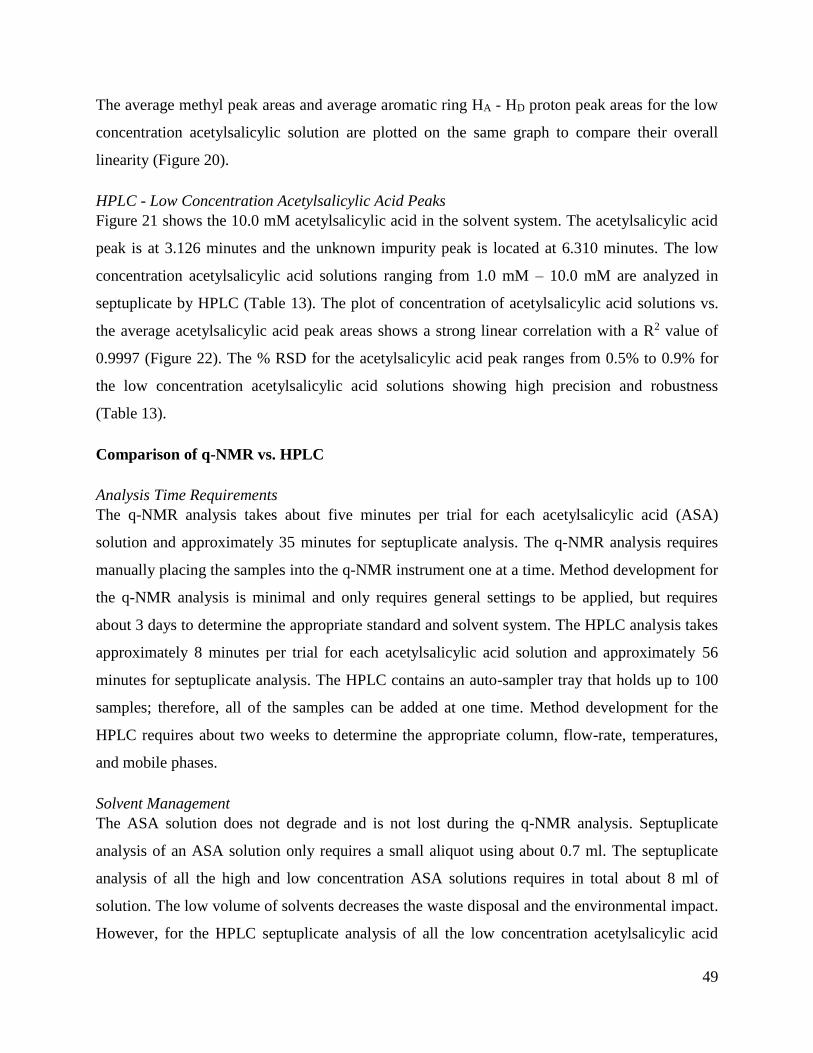
The plot of concentration of acetylsalicylic acid solutions vs. average HB proton aromatic ring
peak areas shows a weak linear correlation, with a R2 value of 0.9727 (Figure 16). The % RSD
for the HB proton ranged from 1% to 3% for the low concentration acetylsalicylic acid solutions
showing fairly good precision (Table 9).
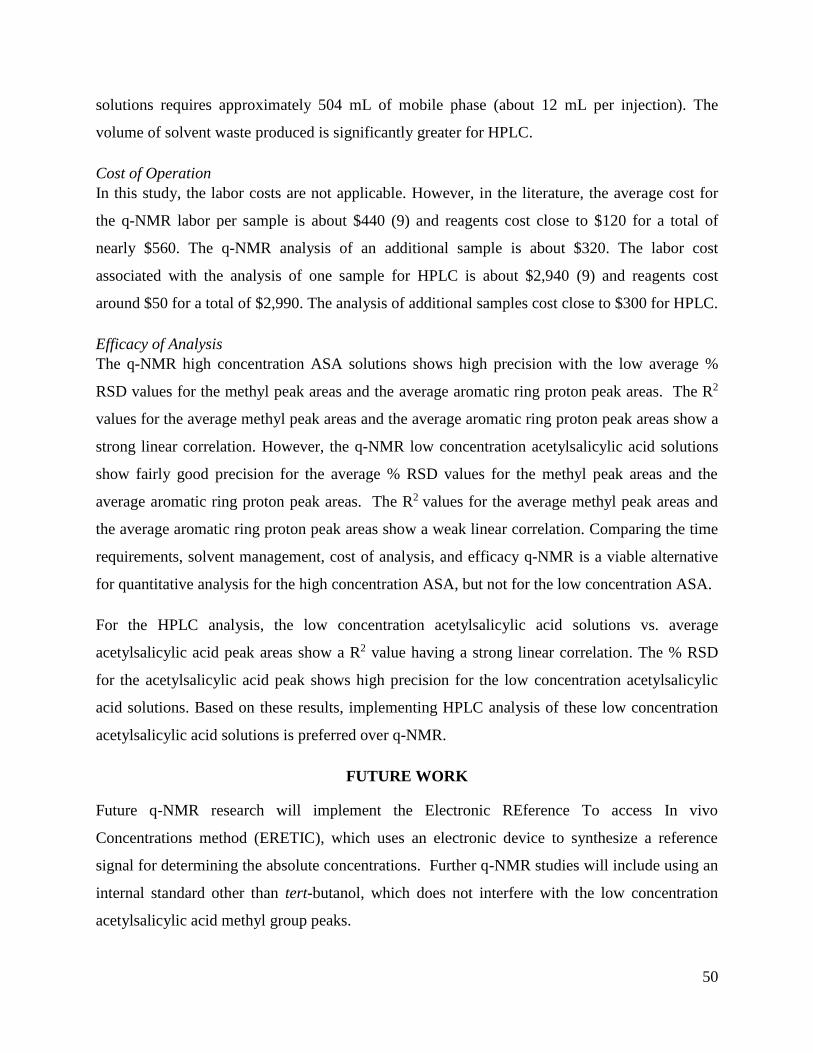
The plot of concentration of acetylsalicylic acid solutions vs. average HC proton aromatic ring
peak areas shows a weak linear correlation, with a R2 value of 0.9737 (Figure 17). The % RSD
for the HC proton ranged from 1% to 5% for the low concentration acetylsalicylic acid solutions
showing fairly good precision (Table 10).
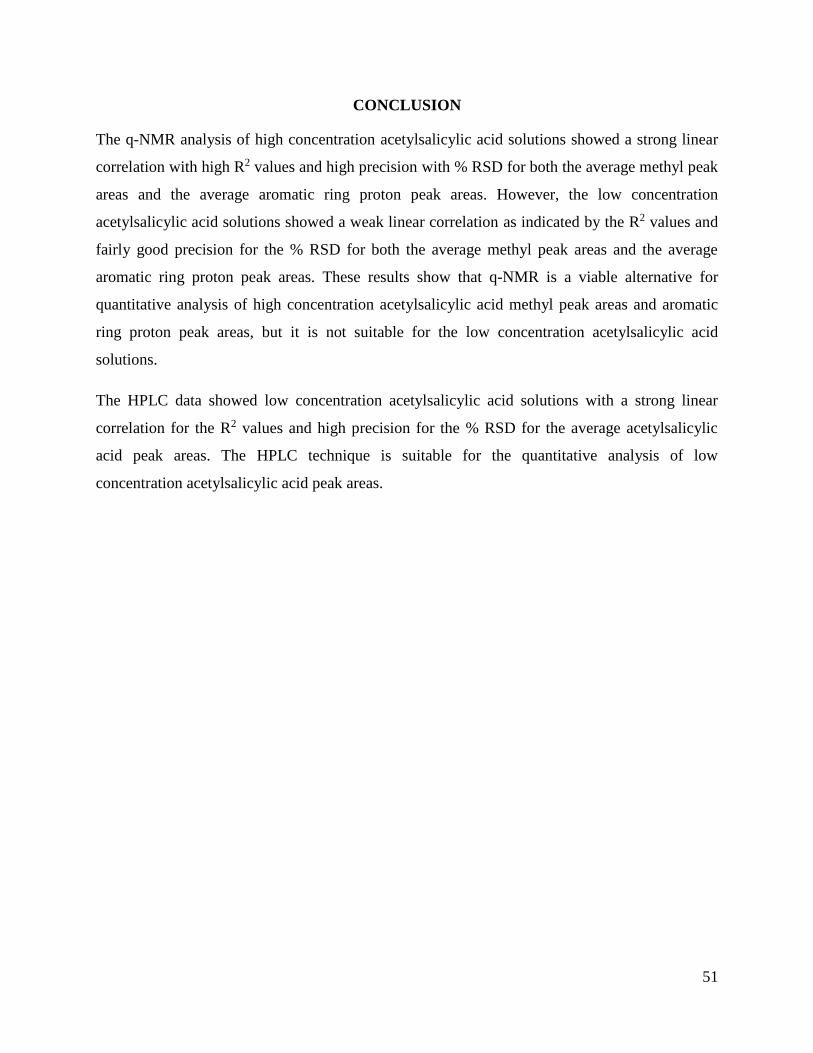
The plot of concentration of acetylsalicylic acid solutions vs. average HD proton aromatic ring
peak areas shows a weak linear correlation, with a R2 value of 0.9776 (Figure 18). The % RSD
for the HD proton ranged from 1% to 4% for the low concentration acetylsalicylic acid solutions
showing fairly good precision (Table 11).
The plot of concentration of acetylsalicylic acid solutions vs. average peak areas for HA - HD
protons shows a weak linear correlation, with a R2 value of 0.9760 (Figure 19). The % RSD for
the HA - HD protons ranged from 1% to 2% for the low concentration acetylsalicylic acid
solutions showing fairly good precision (Table 12). Therefore, the aromatic ring proton peak
areas of low concentration acetylsalicylic acid solutions are more desirable for quantitative
analysis than the methyl peak areas.
49
The average methyl peak areas and average aromatic ring HA - HD proton peak areas for the low
concentration acetylsalicylic solution are plotted on the same graph to compare their overall
linearity (Figure 20).
HPLC - Low Concentration Acetylsalicylic Acid Peaks
Figure 21 shows the 10.0 mM acetylsalicylic acid in the solvent system. The acetylsalicylic acid
peak is at 3.126 minutes and the unknown impurity peak is located at 6.310 minutes. The low
concentration acetylsalicylic acid solutions ranging from 1.0 mM – 10.0 mM are analyzed in
septuplicate by HPLC (Table 13). The plot of concentration of acetylsalicylic acid solutions vs.
the average acetylsalicylic acid peak areas shows a strong linear correlation with a R2 value of
0.9997 (Figure 22). The % RSD for the acetylsalicylic acid peak ranges from 0.5% to 0.9% for
the low concentration acetylsalicylic acid solutions showing high precision and robustness
(Table 13).
Comparison of q-NMR vs. HPLC
Analysis Time Requirements
The q-NMR analysis takes about five minutes per trial for each acetylsalicylic acid (ASA)
solution and approximately 35 minutes for septuplicate analysis. The q-NMR analysis requires
manually placing the samples into the q-NMR instrument one at a time. Method development for
the q-NMR analysis is minimal and only requires general settings to be applied, but requires
about 3 days to determine the appropriate standard and solvent system. The HPLC analysis takes
approximately 8 minutes per trial for each acetylsalicylic acid solution and approximately 56
minutes for septuplicate analysis. The HPLC contains an auto-sampler tray that holds up to 100
samples; therefore, all of the samples can be added at one time. Method development for the
HPLC requires about two weeks to determine the appropriate column, flow-rate, temperatures,
and mobile phases.
Solvent Management
The ASA solution does not degrade and is not lost during the q-NMR analysis. Septuplicate
analysis of an ASA solution only requires a small aliquot using about 0.7 ml. The septuplicate
analysis of all the high and low concentration ASA solutions requires in total about 8 ml of
solution. The low volume of solvents decreases the waste disposal and the environmental impact.
However, for the HPLC septuplicate analysis of all the low concentration acetylsalicylic acid
50
solutions requires approximately 504 mL of mobile phase (about 12 mL per injection). The
volume of solvent waste produced is significantly greater for HPLC.
Cost of Operation
In this study, the labor costs are not applicable. However, in the literature, the average cost for
the q-NMR labor per sample is about $440 (9) and reagents cost close to $120 for a total of
nearly $560. The q-NMR analysis of an additional sample is about $320. The labor cost
associated with the analysis of one sample for HPLC is about $2,940 (9) and reagents cost
around $50 for a total of $2,990. The analysis of additional samples cost close to $300 for HPLC.
Efficacy of Analysis
The q-NMR high concentration ASA solutions shows high precision with the low average %
RSD values for the methyl peak areas and the average aromatic ring proton peak areas. The R2
values for the average methyl peak areas and the average aromatic ring proton peak areas show a
strong linear correlation. However, the q-NMR low concentration acetylsalicylic acid solutions
show fairly good precision for the average % RSD values for the methyl peak areas and the
average aromatic ring proton peak areas. The R2 values for the average methyl peak areas and
the average aromatic ring proton peak areas show a weak linear correlation. Comparing the time
requirements, solvent management, cost of analysis, and efficacy q-NMR is a viable alternative
for quantitative analysis for the high concentration ASA, but not for the low concentration ASA.
For the HPLC analysis, the low concentration acetylsalicylic acid solutions vs. average
acetylsalicylic acid peak areas show a R2 value having a strong linear correlation. The % RSD
for the acetylsalicylic acid peak shows high precision for the low concentration acetylsalicylic
acid solutions. Based on these results, implementing HPLC analysis of these low concentration
acetylsalicylic acid solutions is preferred over q-NMR.
FUTURE WORK
Future q-NMR research will implement the Electronic REference To access In vivo
Concentrations method (ERETIC), which uses an electronic device to synthesize a reference
signal for determining the absolute concentrations. Further q-NMR studies will include using an
internal standard other than tert-butanol, which does not interfere with the low concentration
acetylsalicylic acid methyl group peaks.
51
CONCLUSION
The q-NMR analysis of high concentration acetylsalicylic acid solutions showed a strong linear
correlation with high R2 values and high precision with % RSD for both the average methyl peak
areas and the average aromatic ring proton peak areas. However, the low concentration
acetylsalicylic acid solutions showed a weak linear correlation as indicated by the R2 values and
fairly good precision for the % RSD for both the average methyl peak areas and the average
aromatic ring proton peak areas. These results show that q-NMR is a viable alternative for
quantitative analysis of high concentration acetylsalicylic acid methyl peak areas and aromatic
ring proton peak areas, but it is not suitable for the low concentration acetylsalicylic acid
solutions.
The HPLC data showed low concentration acetylsalicylic acid solutions with a strong linear
correlation for the R2 values and high precision for the % RSD for the average acetylsalicylic
acid peak areas. The HPLC technique is suitable for the quantitative analysis of low
concentration acetylsalicylic acid peak areas.
52
REFERENCES
1. Siddiqui, M.R. et al., Analytical techniques in pharmaceutical analysis: A review. Arabian
Journal of Chemistry 2013, http://dx.doi.org/10.1016/j.arabjc.2013.04.016
2. Silverstein, R. M.; Bassler, C. G.; Morrill, T. C. Spectrometric Identification of Organic
Compounds, 4th ed.; John Wiley & Sons: New York, 1981; 181-212.
3. Holzgrabe, U. Quantitative NMR spectroscopy in Pharmaceutical Applications. Prog. Nucl.
Magn. Reson. Spectr. 2010, 57, 229-240.
4. Kumar, S., Flemming, C.,Villanueva, M., Zuklic, J., “Quantitative Determination of
Acetaminphen, Acetylsalicylic Acid, Cetirizine Dhydrochloride, and Fexofenidine
Hydrochloride by Quantitative-NMR Technique,” The International Chemical Congress of
Pacific Basin Societies 2015 (Pacifichem 2015), Honolulu, HI, December 15-20, 2015.
5. Kumar, S., Flemming, C., “Quantitative Determination of Acetylsalicylic Acid by
Quantitative Nuclear Magnetic Resonance (q-NMT) technique,” 1st Annual Research Day,
Governors State University, University Park, IL, April 1, 2016.
6. Kumar, S., Kumar, S. M., Mannem, S. K. R., and Gouthami, K., “Quantitative Analysis of
Acetaminophen, Acetylsalicylic Acid, and Cetrizine Dihydrochloride by q-NMR
(Quantitative Nuclear Magnetic Resonance) Technique”. 247th American Chemical Society
National Meeting, Dallas, TX, March 16-20, 2014.
7. Kumar, S., Kumar, S. M., Gouthami, K., “Quantitative Analysis of Acetylsalicylic Acid and
Acetaminophen by q-NMR (Quantitative Nuclear Magnetic Resonance) Technique”,
American Chemical Society Southwest Regional Meeting, Wacco, TX, November 16-19,
2013.
8. Sawyer, M.; Kumar, V. A Rapid High-Performance Liquid Chromatographic Method for the
Simultaneous Quantitation of Aspirin, Salicylic Acid, and Caffeine in Effervescent Tablets.
J. Chrom. Sci. 2003, 41, 393-397.
9. Webster, G. K., Kumar, S. (2014). Expanding the Analytical Toolbox: Pharmaceutical
Application of Quantitative NMR. Analytical Chemistry, 2014, 86, 11474-11480.
53
APPENDIX
Figure 1. NMR Spectrum of 100.1 mM acetylsalicylic acid in solvent system..
Figure 2. NMR Spectrum of 80.1 mM acetylsalicylic acid in solvent system.
CDCl3
D A
CH3 tert-
butanol
B
tert-
butanol
OH
C
D
B
A
C
CDCl3
D A
CH3 tert-
butanol
B
tert-
butanol
OH
C
D
B
A
C
80.1 mM Acetylsalicylic Acid
100.1 mM Acetylsalicylic Acid
54
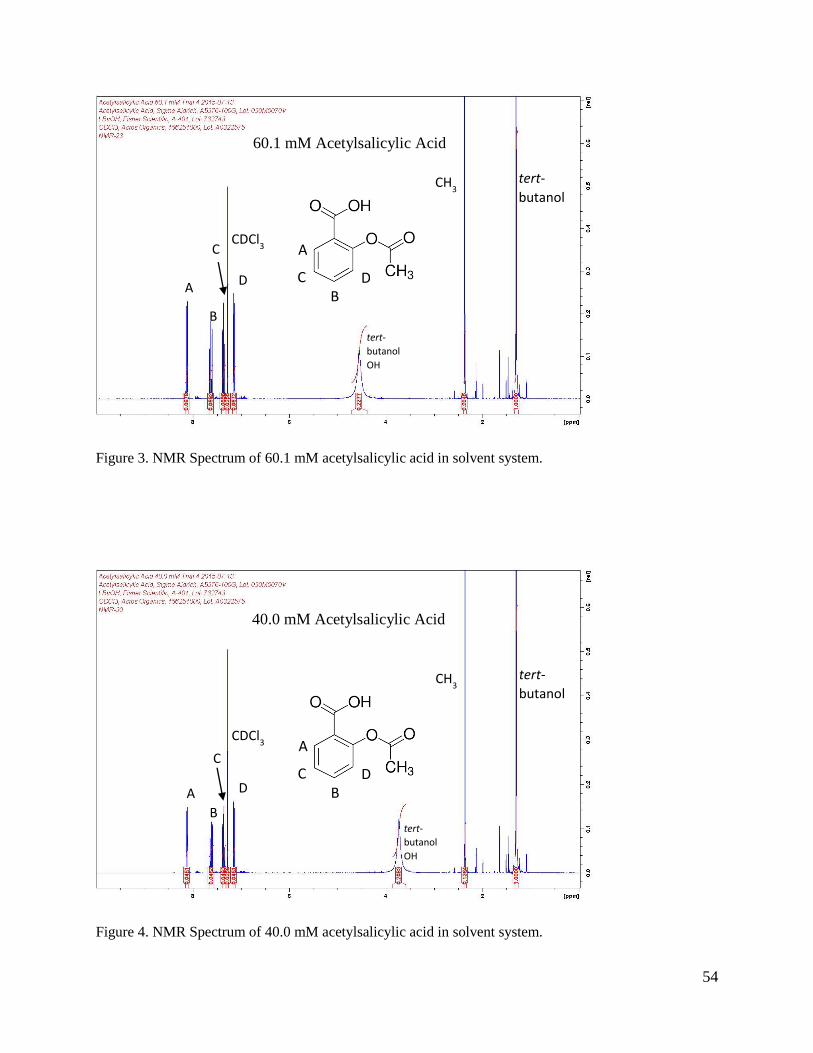
Figure 3. NMR Spectrum of 60.1 mM acetylsalicylic acid in solvent system.
Figure 4. NMR Spectrum of 40.0 mM acetylsalicylic acid in solvent system.
CDCl3
D A
CH3 tert-
butanol
B
tert-
butanol
OH
C
D
B
A
C
CDCl3
D A
CH3 tert-
butanol
B tert-
butanol
OH
C D
B
A
C
60.1 mM Acetylsalicylic Acid
40.0 mM Acetylsalicylic Acid
55
Figure 5. NMR Spectrum of 20.0 mM acetylsalicylic acid in solvent system.
Figure 6. NMR Spectrum of 10.0 mM acetylsalicylic acid in solvent system.
CDCl3
D A
CH3 tert-
butanol
B tert-
butanol
OH
C D
B
A
C
CDCl3
D A
CH3 tert-
butanol
B
tert-
butanol
OH
C D
B
A
C
20.0 mM Acetylsalicylic Acid
10.0 mM Acetylsalicylic Acid
56
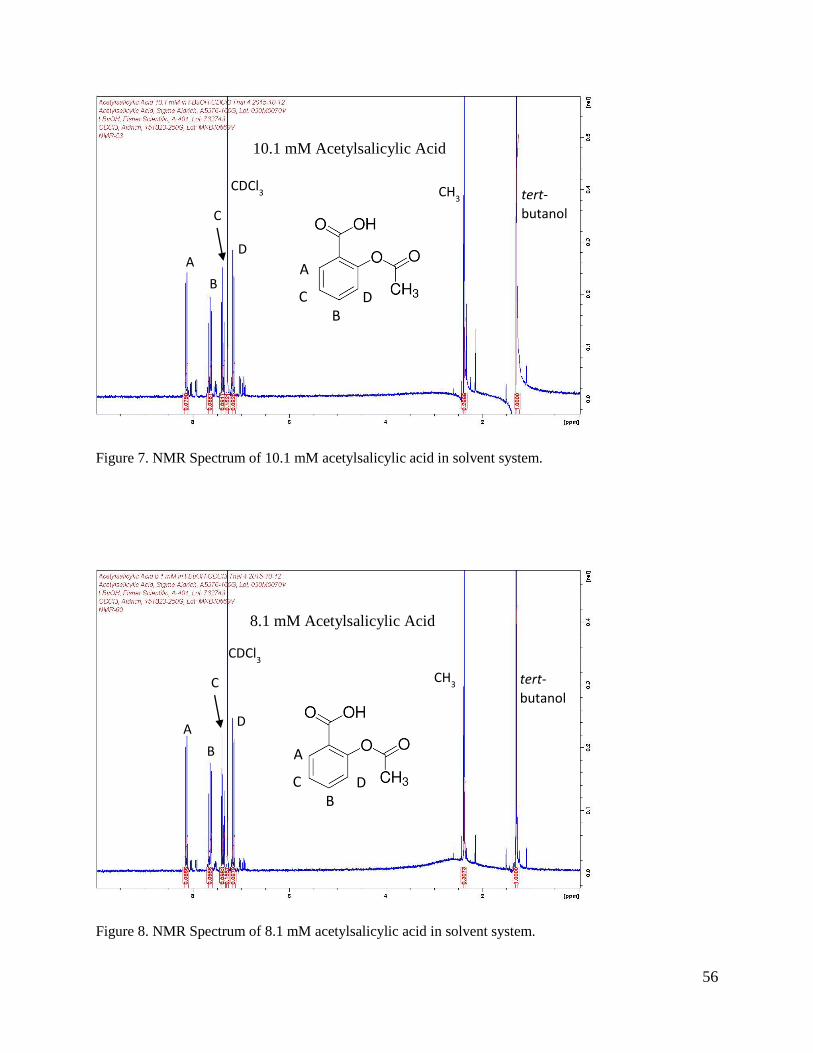
Figure 7. NMR Spectrum of 10.1 mM acetylsalicylic acid in solvent system.
Figure 8. NMR Spectrum of 8.1 mM acetylsalicylic acid in solvent system.
CDCl3
D A
CH3 tert-
butanol
B
C
D
B
A
C
CDCl3
D A
CH3 tert-
butanol
B
C
D
B
A
C
8.1 mM Acetylsalicylic Acid
10.1 mM Acetylsalicylic Acid
57
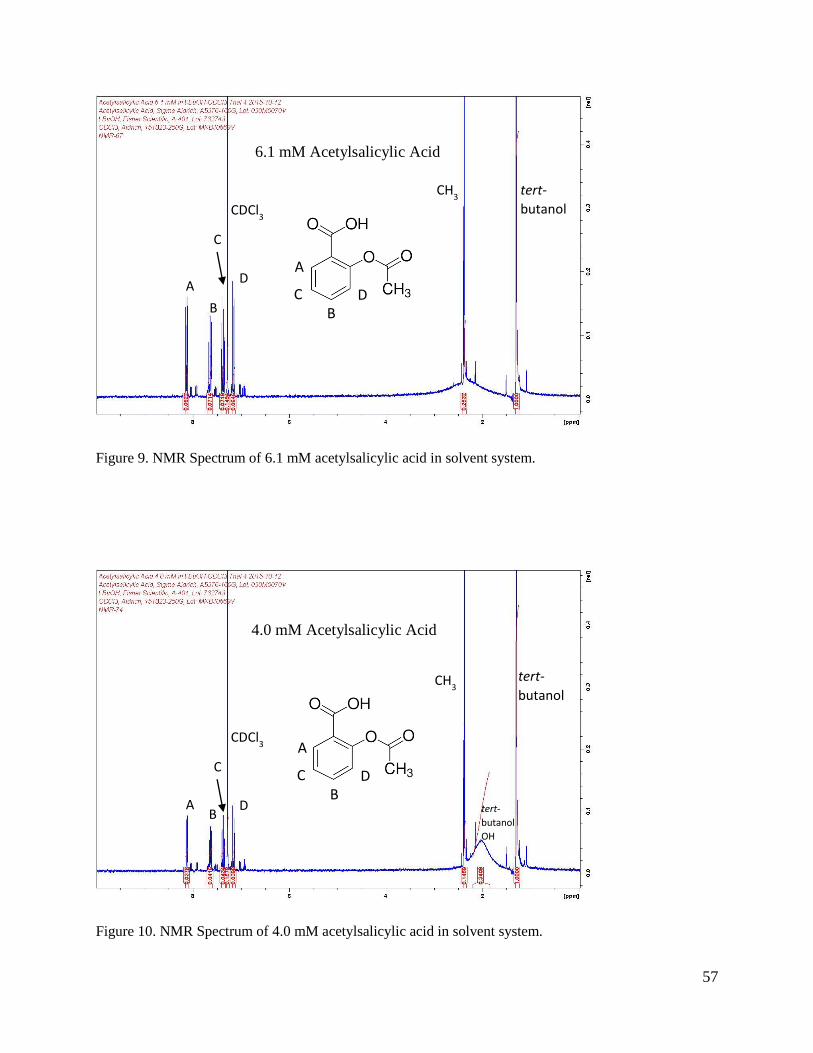
Figure 9. NMR Spectrum of 6.1 mM acetylsalicylic acid in solvent system.
Figure 10. NMR Spectrum of 4.0 mM acetylsalicylic acid in solvent system.
CDCl3
D A
CH3 tert-
butanol
B
C
D
B
A
C
CDCl3
D A
CH3 tert-
butanol
B tert-
butanol
OH
C D
B
A
C
4.0 mM Acetylsalicylic Acid
6.1 mM Acetylsalicylic Acid
58
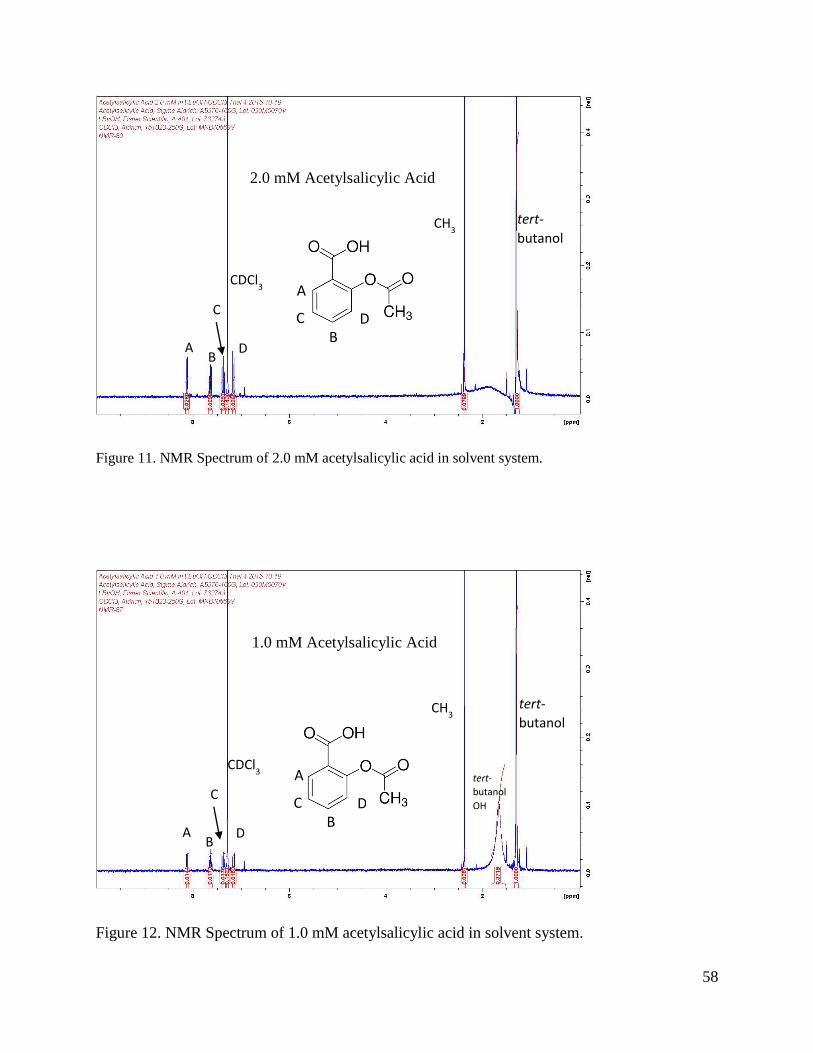
Figure 11. NMR Spectrum of 2.0 mM acetylsalicylic acid in solvent system.
Figure 12. NMR Spectrum of 1.0 mM acetylsalicylic acid in solvent system.
CDCl3
D A
CH3 tert-
butanol
B
C D
B
A
C
CDCl3
D A
CH3 tert-
butanol
B
tert-
butanol
OH
C D
B
A
C
1.0 mM Acetylsalicylic Acid
2.0 mM Acetylsalicylic Acid