quantitative analysis of chemical and biological kinetics...
TRANSCRIPT
QUANTITATIVE ANALYSIS OFCHEMICAL AND BIOLOGICAL
KINETICS FOR THE ACIDMINE DRAINAGE PROBLEM
MEND Project 1.51.1
This work was done on behalf of MEND and sponsored byEnvironment Canada
June 1994
QUANTITATIVE ANALYSIS OF CHEMICAL AND BIOLOGICAL KINETICS
FOR THE ACID MINE DRAINAGE PROBLEM
bY
M. OtwinowskiSynergetic Technology139, 31-Avenue N.W.
Calgary, Alberta T2M 2Pl
REPORT PREPARED FORMINE ENVIRONMENT NEUTRAL DRAINAGE PROGRAM
ANDBRITISH COLUMBIA ACID MINE DRAINAGE TASK FORCE
CONTENTS
Acknowledgements . . . . . . .
Summary . . . . .
I. Introduction . . . . . . .
II. Elementary Chemical Processes Involved in Acid Mine Drainage
II. 1. Chemical oxidation of pyrite . . . .Oxidation of pyrite by dissolved oxygen . .Oxidation of ferrous iron . . . .Oxidation of pyrite by ferric iron . . .Precipitation of ferric hydroxide . . .
11.2. Bacterial oxidation . . . . .Aerobic bacterial oxidation of pyrite . .Aerobic bacterial oxidation of ferrous iron . .Anaerobic pyrite oxidation by Thiobacillus ferrooxidans
11.3. Neutralization . . . . . .
11.4. Solubility of oxygen in water . . . .
III. Mathematical Analysis of Chemical Kinetics . . .
111.0. Analysis of Experimental Data on Abiotic OxidationPyrite oxidation by dissolved oxygen . .Oxidation of ferrous iron . . . .Pyrite oxidation by ferric iron . . .
III. 1. Abiotic Chemical Oxidation of Pyrite without NeutralizationOxidation at pH between 4 and 7 . . . .Oxidation at pH less than 4 . . . . .
111.2. Oxidation of Pyrite in the Presence of Neutralizing Minerals
111.3. Quasi-Equilibrium Evolution of Concentrations of Ferricand Ferrous Iron and the Absence of Chemical Oscillations
. . .111
iv
1
5
611172126
28293136
38
41
48
48485154
575768
79
93

IV. Bacterial oxidation of pyrite . . . . .
IV.0. Analysis of Experimental Data on Bacterial OxidationTemperature and pH dependence of bacterial activityAnaerobic oxidation of pyrite by ferric iron .Bacterial oxidation of ferrous iron . . .Bacterial oxidation by dissolved oxygen . .
IV. 1. Bacterial Oxidation of Pyrite at High Concentrationsof Dissolved Oxygen . . . . .
IV.2. Bacterial Oxidation of Pyrite at Low Concentrationsof Dissolved Oxygen . . . . .
V. Further Experiments . . . . . .
REFERENCES . . . . . . . 123
.
96
100102105107110
112
115
119
Acknowledgements
The guidance by Benoit Godin who provided several ideas and continued
support for this project is gratefully acknowledged. This project benefited greatly
from discussions and information provided by M. Blanchette, C.J. Bland,
R.F. Chaiken, P. Clark, K. Ferguson, P. Grabinski, H.R. Krouse, B. Krusche,
E.J. Laishlay, H. Lizama, G.W. Luther III, R. McCandless, M.A. McKibben,
K.A. Mot-in, R.V. Nicholson, C. Pelletier, W.A. Price, I. Suzuki, G.A. Tremblay,
G. Weres, W.W. White III and R.M. Yoon. This project was jointly funded by Mine
Neutral Environment Program (CANMET) and Environment Canada.
iv
Summary
This report describes the results of a research project which has been initiated withthe purpose to provide a quantitative analysis of the interrelated elementary chemical andbiological processes which are responsible for pyrite oxidation and acid rock drainage(ARD). The highly nonlinear nature of the kinetic equations describing coupled chemical andmicrobial reactions involved in pyrite oxidation raised serious questions about thepredictability of the environmental impact of acid rock drainage.
The main objective of this project was to determine whether the coupled chemicalreactions involved in a multistage oxidation of pyrite lead to irregular or chaotic in timechanges of products of the chemical and microbial reactions responsible for acid rockdrainage. The main conclusion of the model analysis described in this report is the absenceof such an irregular temporal behaviour. The set of nonlinear kinetic equations for thechemical reactions involved in pyrite oxidation does not produce a chaotic behaviour or othertypes of chemical oscillations. The nonlinear nature of the elementary nonequilibriumprocesses is responsible for the presence of the quasi-equilibrium values of the concentrationsof ferrous and ferric iron. This property is a key to understanding the complexity of acidicdrainage and should be helpful in designing efficient ways of minimizing acidic drainage.The presence of the quasi-equilibrium states increases our chances to formulate predictiveARD models. This study does not exclude, however, physico-chemical oscillations whenprocesses of water and oxygen transport are included in a future model. (The analysis oftransport processes was outside the scope of the present project designed as a low-budgetpreliminary analysis of the nonlinear chemical and biological kinetics.)
Several experimental results are reevaluated and, in some cases, values of rateconstants different than those previously published in the literature are determined. A kineticmodel in the form of coupled nonlinear ordinary differential equations is constructed for thecoupled chemical reactions responsible for acid rock drainage. The equations describe thetime dependence of the concentrations of the hydronium ions, ferrous and ferric iron,sulphate and oxygen dissolved in water.
In our analysis a clear distinction is made between the chemical and bacterialreactions which require the presence of dissolved oxygen and the chemical and bacterialprocesses which do not require oxygen.
At pH values greater than four, the process of pyrite oxidation is mainly due to the pyriteoxidation by oxygen dissolved in water:
Fe&(s) + 7/2 O2 + H,O = Fe2+ + 2SOd2- + 2H+ . W)Ferrous iron is released to the water solution where it is oxidized to ferric iron:
Fez+ + l/4 O2 + H+ = Fe3+ + l/2 H20 .
At pH values less than four the ferric iron reacts with pyriteW)
FeS,(s) + 14Fe3+ + 8H2O = 15Fe2+ + 2SOd2- + 16H+ . (R3)At high pH values the ferric iron reacts further with oxygen and water, and forms ferrichydroxide which precipitates:
Fe3’ -I- 3H,O = Fe(OH),(s) -i- 3H+. (R4)Reactions (Rl), (R3) and (R4) produce acid which, if not neutralized, mobilizes the metalions contained in the waste rock. High pH values can be maintained by neutralizing mineralswhich often are present in the waste rock, or by minerals (like calcite) added to the wasterock. The process of neutralization by calcite is described by two reactions
CaCO, + 2 H+ + SO:- + 2H,O = CaSO, 2 H20 + H2C03“ , w 1)
CaCO, + H+ + SO:- + H,O = CaSO, 2 HZ0 + HC03- . W.2)
The relative rates of the reactions (R5.1) and (R5.2) depend on pH values and areresponsible for the efficiency of the neutralization process. The rate of oxidation of ferrousiron increases with increasing pH values and the neutralizing potential of the reactions (R5.1)and (R5.2) decreases when pH increases. This leads to a stoichiometric incompatibilitybetween acid-generating and acid-neutralizing reactions. Minimizing the stoichiometricincompatibility during the neutralization process should reduce the amount of sludgegenerated and lower the cost of neutralization. Since the analysis of the neutralization processis limited to equilibrium conditions for the neutralizing species (pH is a control parameter),further analysis is required.
At pH less than four, ferric hydroxide is soluble and the reaction of pyrite oxidation by ferriciron contributes to acidic drainage. The source of ferric iron may be reaction (R2)(oxidation .of ferrous iron) or the ferric hydroxide formed higher in the pile and washeddown to a region where pH is low. The reaction of pyrite oxidation by ferrous iron may alsobe initiated if an insufficient amount of neutralizing minerals is used.
The kinetic model is analyzed for different regimes corresponding to possible differentsituations at various sites. The rates of pyrite oxidation and oxygen depletion are analyzedat different temperatures between 273 K and 333 K, and at concentrations of dissolvedoxygen corresponding to the concentration of oxygen in the gaseous phase ranging from 21%to 2 % . The ratio between the active surface area, S and the water volume, V, varies between0.1 m2/1 and 100 m2/1. The nonlinear nature of the elementary chemical processes involvedis responsible for a dramatic increase in iron concentration by increasing acidity. Thecompetition between increasing temperature and decreasing concentration of oxygen

vi
dissolved in water is analyzed in detail. The increasing temperature, while accompanied bya lower concentration of dissolved oxygen, leads to the oxidation rates increasing about tentimes per a 20 K increase in temperature. Computer simulations for the concentrations ofhydronium ions, ferrous iron, ferric iron and sulphate generated during time intervalsranging from a few hours to several months have been performed for different values of thechemical and physical parameters which control the process of acidic drainage. In some casesthe nonlinear kinetic equations have been solved analytically and several useful closed-formmathematical formulae have been obtained.
At low pH values and at temperatures about 303 K, Thiobacillus ferrooxidans atconcentrations on order of one gram of wet cells per litre, can accelerate the process ofpyrite dissolution by about a thousand times. Kinetic equations for the bacterial processes ofpyrite oxidation by dissolved oxygen and by ferric iron are proposed for the first time.Bacterial processes accelerate each of the reactions (Rl), (R2) and (R4) in a different way.The reaction (Rl) is accelerated about three hundred times. The reaction (R2) becomes abouta million times faster. The reaction (R4) is accelerated by bacteria about three times.
The reactions of the bacterial oxidation of ferrous iron to ferric iron and the pyrite oxidationby ferric iron provide a nonlinear negative feedback mechanism which is responsible for asmaller than desired effect of slowing-down pyrite oxidation by reducing oxygenconcentration. When oxygen partial pressure decreases from 0.21 atm to 0.04 atm (i.e. by75 %), the rate of pyrite oxidation by Thiobacillus ferrooxidans decreases by only 30%. Thisnegative feedback mechanism is also responsible for a chemistatic bacterial action andprolonged bacterial activity in an acidic environment.
Several problems which merit further experimental and modelling studies are identified.
Quantitative results presented in this study should be confronted with field data and, aftercalibration, the kinetic model presented here can be used as a part of a comprehensivephysical waste rock model and an underwater disposal model.
vii
SOMMAIRE
Dans ce rapport, on d&-it les r&mats d’un projet de recherche entrepris en vue
d’analyser quantitativement les processus chimiques et biologiques elementaires inter-relies qui
sont responsables de l’oxydation de la pyrite et du drainage rocheux acide (DRA). Vu la
nature hautement non Ii&air-e des equations d6criva.m la cinetique des reactions chimiques et
microbiennes couplkes qui interviennent dans l’oxydation de la pyrite, il y a lieu de se poser
de graves questions sur la previsibilid de l’impact du drainage rocheux acide sur
l’environnement.
Ce projet avait comme principal objectif de determiner si les reactions chimiques
coupl6es intervenant dans l’oxydation a plusieurs &apes de la pyrite sont accompagnk de
changements, irreguliers ou chaotiques dans le temps, dans les produits des reactions
chimiques et microbiennes responsables du drainage rocheux acide. L’absence d’un tel
comportement irregulier dans le temps constitue la principale conclusion de l’analyse de
modelisation d&rite dans ce rapport. Le systeme d’6quations dkcrivant la cinetique non
lin6aire des reactions chimiques intervenant dans l’oxydation de la pyrite ne revitle ni
comportement chaotique ni autres types de fluctuations de nature chimique. La nature non
lineaire des processus &5mentaires non a l’equilibre est a l’origine des concentrations d’ions
ferreux et ferriques a quasi-equilibre. Cette propriete est essentielle pour comprendre la
complexite du drainage acide et devrait etre utile darts la mise au point de methodes
permettant de le r&mire le plus possible. L’existence d’etats de quasi-6quilibre ameliore nos
chances d’elaborer des modeles permettant de prevoir le DRA. Toutefois, dans cette etude
on n’exclut pas les fluctuations physico-chimiques qui seront observkes apres inclusion, dans
un modele futur, des processus de transport de l’cau et de l’oxygene. (L’analyse des
processus de transport debordait le cadre du present projet qui a et6 concu comme une
analyse preliminaire, a faible budget, de la cinetique chimique et biologique non linktire.)
On a r&aluC plusieurs resultats experimentaux et, dans certains cas, on a obtenu des
constantes de vitesse differentes de celles qui avaient Cte publiees dans la litterature. On a
elabore un modele cinetique se presentant sous forme d’ equations differentielles ordinaires
non lineaires couplkes, afin de d&-ire les reactions chimiques coup&s responsables du
. . .Vlll
drainage rocheux acide. Les equations decrivent la dependance sur le temps de la
concentration des ions hydronium, du fer ferreux et du fer ferrique, du sulfate et de
l’oxygene dissous dans l’eau.
Dans notre analyse, nous faisons une distinction bien nette entre les reactions
chimiques et bacteriennes qui exigent et qui n’exigent pas la presence d’oxygene dissous. A
un pH superieur a 4, c’est l’oxygene dissous dans l’eau qui est surtout responsable de
l’oxydation de la pyrite:
Fe&(s) + 712 02 + Hz0 = Fe+* + 2 SOi* + 2H+ (RI)
Le fer ferreux passe en solution dans l’eau et est oxyde en fer ferrique:
Fe+* + l/4 O2 + H+ = Fe+3 + l/2 H,O w9
A un pH inferieur % 4, le fer ferrique reagit avec la pyrite:
Fe&(s) + 14 Fe+3 + 8 H20 = 15 Fe+* + 2 SOi* + 16 H+ (R3)
A un pH ClevC, le fer ferrique reagit encore avec l’eau et l’oxygene pour donner de
l’hydroxyde ferrique qui precipite:
Fe+3 + 3H,O = Fe(OH),(s) + 3 H+ (R4)
Les reactions (Rl), (R3) et (R4) produisent de l’acide qui, s’il n’est pas neutralise, dissout
les ions contenus dans les steriles. Un pH ClevC peut etre maintenu par la presence de
mineraux neutralisants, que l’on trouve souvent dans les steriles, ou par l’addition de
mineraux comme la calcite. Les deux reactions suivantes d&-ivent le processus de
neutralisation par la calcite:
CaCO, + 2 H+ + SOi* + 2 Hz0 = CaSO,-2H,O + H2CO3”
CaCO, + H+ + SOi* + H20 = CaSO,.2H,O + HCO,ww(R5.2)
ix
Les vitesses relatives des reactions (R5.1) et (R5.2) dependent du pH et determinent
l’efficacite du processus de neutralisation. Comme la vitesse d’oxydation du fer ferreux
augmente au fur et a mesure qu’augmente le pH et que le potentiel de neutralisation des
reactions (R5.1) et (R5.2) diminue au fur et a mesure qu’augmente le pH, il y a
incompatibilid stoechiometrique entre les reactions lib&ant un acide et les reactions de
neutralisation. La reduction au minimum de l’incompatibilid stoechiometrique durant le
processus de neutralisation devrait entrainer une baisse de la quantite de boue produite et
rkluire le coGt de la neutralisation. Comme le processus de neutralisation ne peut se faire
que dans des conditions d’6quilibre pour l’espkce neutralisante (le pH est le parametre de
regulation), il faut proceder a une analyse plus approfondie.
A un pH inferieur a 4, l’hydroxyde ferrique est soluble et la reaction d’oxydation de la
pyrite par le fer ferrique contribue au drainage acide. Le fer ferrique peut etre produit par la
reaction (R2) (l’oxydation du fer ferreux) ou provenir de l’hydroxyde ferrique form6 plus
haut dans la halde et entraM vers une zone ob le pH est plus faible. 11 peut aussi y avoir
oxydation de la pyrite par le fer ferreux, si la quantite de mineraux de neutralisation ajoutes
est insuffisante.
On a analyse le modele cinetique a differents regimes correspondant a differentes situations
possibles a divers sites. On determine la vitesse d’oxydation de la pyrite et la vitesse de
d&oxygenation a differentes temperatures comprises entre 273 K et 333 K et a des
concentrations d’oxygene dissous correspondant a des concentrations d’oxygene gazeux
comprises entre 21 % et 2 %. Le rapport entre l’aire de la surface active, S, et le volume
de l’eau, V, varie entre 0,l m2/L et 100 m’/L. C’est la nature non lin&.ire des processus
chimiques elementaires qui est a l’origine de la hausse dramatique de la concentration de fer
en fonction de l’acidid. On examine en detail la competition entre l’augmentation de la
temperature et la diminution de la concentration d’oxygene dissous dans l’eau. La hausse de
temperature, bien qu’elle soit accompagn6e d’une baisse de la concentration d’oxygene
dissous, entraine une augmentation de la vitesse d’oxydation par un facteur d’environ 10
pour chaque accroissement de temperature de 20 K. On a pro&de % des simulations par
ordinateur des concentrations d’ions hydronium, de fer ferreux, de fer ferrique et de sulfate
produits au tours de p&odes allant de quelques heures a plusieurs mois, pour differentes
X
valeurs des parametres chimiques et physiques regissant le drainage acide. Dans certains
cas, les equations d&crivant la cinetique non linka.ire ont CtC resolues par analyse et plusieurs
formules mathematiques utiles de forme ferm6e ont et6 obtenues.
A un faible pH et a une temperature d’environ 303 K, Thiobacil1u.s ferrooxidans en
concentration de l’ordre de 1 gramme de cellules humides par litre peut acc&rer le
processus de dissolution de la pyrite par un facteur d’environ 1000. On propose pour la
premiere fois des equations dkcrivant la cinetique de l’oxydation bacterienne de la pyrite par
l’oxygene dissous et par le fer ferrique. Les processus bacteriens accelerent differemment
les reactions (Rl), (R2) et (R4), l’augmentation de vitesse &ant d’environ 300, d’environ
1 000 000 et d’environ 3 respectivement.
Les reactions d’oxydation bacterienne du fer ferreux en fer ferrique et l’oxydation de la
pyrite par le fer ferrique constituent un m6canisme de retroaction negative non lin6aire
responsable d’un ralentissement, plus faible que le ralentissement escompte, de l’oxydation
de la pyrite par diminution de la concentration d’oxygene. Une diminution de la pression
partielle d’oxygene de 0,21 atmosphere a 0,04 atmosphere (C.-%-d. une baisse de 75 %) se
traduit par une reduction de seulement 30 % de la vitesse d’oxydation de la pyrite par
i%iobacillus ferrooxidans. Ce m6canisme de retroaction negative est egalement a l’origine
de l’action bacterienne chemistatique et de l’activite bacterienne prolong&z en milieu acide.
On souligne plusieurs problemes sur lesquels il y aurait lieu d’effectuer d’autres travaux
experimentaux et d’autres etudes de modelisation.
Les resultats quantitatifs obtenus au tours de cette etude devraient Ctre v&ifiCs par des
donrkes obtenues sur le terrain; ainsi, aprb Ctalonnage, le modele cinetique present6 dans ce
rapport peut Ctre utilise dans le cadre d’un modele simulant l’ensemble des aspects physiques
des steriles et d’un modele d’elimination subaquatique.
1
1. INTRODUCTION
Acid Mine Drainage (AMD) results when oxygen and water react with the sulphide
minerals contained in natural rock, underground workings, open pit mine walls, mine waste
rock piles or mine tailings to produce acidic seepage or leachate. Biological processes also
play an important role in acidic drainage. The net result of the chemical and biological
reactions involved is the production of low pH water. Low pH water has the potential to
mobilize heavy metals which may migrate into and contaminate adjacent soils and waters
[BrC], [ChB], [Co], [Fe]. Characterization of waste materials and prediction of their long
term environmental impact is not a simple task. Apart from chemical processes AMD
depends also on physical, biological and mineralogical factors.
In newly formed piles of chemically active porous medium, for example, one often
observes three phases of physico-chemical kinetics [BrC]: the first phase of increasing
activity, the second relatively steady phase and the third phase of decreasing activity. The
duration of individual phases varies depending on chemical and physical factors involved
and, in some cases [Ar], [KoB], [ScD], [Otl], [Ot2], may be predicted by comprehensive
nonlinear models describing chemical kinetics and transport of mass and energy.
The main objective of this project was to analyze the possible natural limitations on
the predictive power of AMD models imposed by the nonlinear nature of the chemical and
biological processes involved. Networks of chemical reactions described by coupled
nonlinear equations often produce irregular or chaotic temporal variations of products. When
this happens, special techniques have to be used by collecting the laboratory and field data
and additional complexity is introduced to predictive models. The purpose of this study is
to provide a quantitative description of the interrelated nonlinear processes responsible for
AMD and to determine the time dependence of reaction products as a function of the initial
concentrations of reactants and temperature.
This report reviews and critically analyzes several experimental and theoretical results
on various chemical, physical and biological aspects of pyrite oxidation. Based on available
experimental data, a model in the form of a set of kinetic differential equations is formulated
and solved. Unfortunately, experimental results reported by various laboratories are often
different and in some cases a subjective choice of entry data for the model had to be made.
For this reason the mathematical analysis is performed together with a critical review and
additional analysis of the experimental results published in available literature.
Information about chemical and biological processes provided by this study can be
later used in a comprehensive model including mass and energy transport (via diffusion,
percolation, thermal conductivity and convection). Previous waste rock models did not
consider coupled elementary reactions to describe the oxidation of pyrite under aerobic and
anaerobic conditions and did not describe properly the process of pyrite oxidation in regions
where oxygen concentration is low and temperature is high.
The report starts with an introductory survey and interpretation of experimental
results, which lays the ground for the quantitative model. In Chapter II, we analyze
separately the following coupled processes:
0 pyrite oxidation by water and oxygen dissolved in water and the release of Fe2+(ferrous) ions and acid (reaction (Rl))
oxidation of ferrous ions to ferric (Fe’+) ions by oxygen (reaction (R2))
anaerobic oxidation of pyrite by ferric ions and water (reaction (R3))
precipitation of ferric hydroxide, which eliminates ferric ions from the stream
(reaction (R4))
0 the neutralization process (reaction (R5))
These processes are analyzed both for abiotic conditions and in the presence of bacterial
oxidation responsible for much higher oxidation rates.
Experimental data on the kinetics of elementary chemical reactions and bacterial
processes are reviewed. Only the experiments which provide quantitative data suitable for
our mathematical analysis are discussed and Chapter II does not pretend to be a complete
review of research work on pyrite oxidation. A reader who does not want to spend time on
reading the literature review may limit his attention to pages 5, 6, 7 and 28 where
stoichiometric equations (Rl)-(R4) for chemical oxidation of pyrite and reactions (Bl)-(B3)
for bacterial oxidation are discussed. On page 39 stoichiometric relations (R5.1) and (R5.2)
for the neutralization reactions are presented. These reactions are used in the kinetic model
analyzed in Chapters III and IV. In paragraph 2.4 (p. 41) the solubility of oxygen in water
is discussed.

3
A kinetic model for abiotic chemical reactions is constructed and analyzed in Chapter
III. We consider the temporal behaviour of concentrations of the chemical species separately
for pH values greater than four and less than four. This distinction is necessary because of
the dramatic changes in the nature of pyrite oxidation due to precipitation of ferric hydroxide
at pH values above four. Section 111.0 demonstrates that the kinetic equations used in our
model reproduce experimental results for individual chemical reactions. The kinetic model
for abiotic reactions without neutralization is given by equations (Dl) on page 57 (for pH
between 4 and 7) and equations (D2) on page 68 (for pH less than 4). The neutralization
process is included in equations (D3) (p. 80) in an equilibrium way by stabilizing pH values.
The main results of the analysis presented in Chapter III are: (i) the absence of chaotic
behaviour or temporal oscillations of the concentrations of final and transient products (Fig.
3.1. l), and (ii) there is stoichiometric incompatibility between acid-generating and acid-
neutralizing reactions (see p. 91). The intermediate asymptotic behaviour of the
concentrations of ferric and ferrous ions is referred to as quasi-equilibrium states (eqs.
(3.1.5) and (3.2. l), and figures 3.1.5, 3.2.4 and 3.2.5)). The presence of quasi-equilibrium
states, if confirmed by field studies, increases chances for formulating reliable predictive
AMD models. Pyrite oxidation rates increase dramatically with temperature - for
temperatures between 273K and 323K the rate of pyrite oxidation accelerates about ten times
per 20K. Other conclusions of Chapter III are listed on pages 45 and 46.
Chapter IV is devoted to bacterial processes. Both aerobic and anaerobic reactions
which are accelerated by bacteria are considered in the mathematical model defined by eqs.
(DB) on page 100. Anaerobic bacterial oxidation is used in the kinetic model despite a long-
time controversy about the anaerobic bacterial oxidation of pyrite. We use recent results of
experiments which, in our opinion, are methodologically correct and provide reliable
quantitative data. The main conclusion of Chapter IV is the existence of a nonlinear feedback
mechanism which is responsible for maintaining significant levels of bacterial activity and
sustained bacterial oxidation rates at low oxygen concentrations (figures 4.1.1 and 4.2.1).
Another feedback mechanism is responsible for maintaining pH values optimal for bacterial
activity. Both feedback mechanisms should be given serious consideration by designing
practical ways of reducing and controlling AMD. Other results and conclusions of Chapter
IV are summarized on pages 96-98.
In Chapter V, some problems which merit further experimental and modelling work
4
are discussed.
The model discussed in this report uses laboratory data on pure pyrite. In the next
step, the results presented in this report should be confronted with available experimental
data on acidic drainage from large samples of pyritic rocks [Res], [Gel, [WhJ] should be
used to calibrate the model. Transport processes which control the supply of water and
oxygen are ultimately responsible for both the rate of acid generation and its release to the
environment.
5
The rates of chemical processes leading to acid formation are affected by physical,
biological and mineralogical factors. Physical parameters include the porosity and
permeability of a rock mass, the ratio of particle size/surface area, meteorological factors,etc.. Bacterial activity is often a dominant factor determining the overall rate of acid
formation. Important mineralogical factors are: type and quantity of sulphide minerals
(pyrite, pyrrhotite, marcasite and non-ferrous sulphides), texture and morphology, degree
of rock fracture, content of acid consuming minerals. These factors affect both the chemicalrates of acid formation and neutralization.
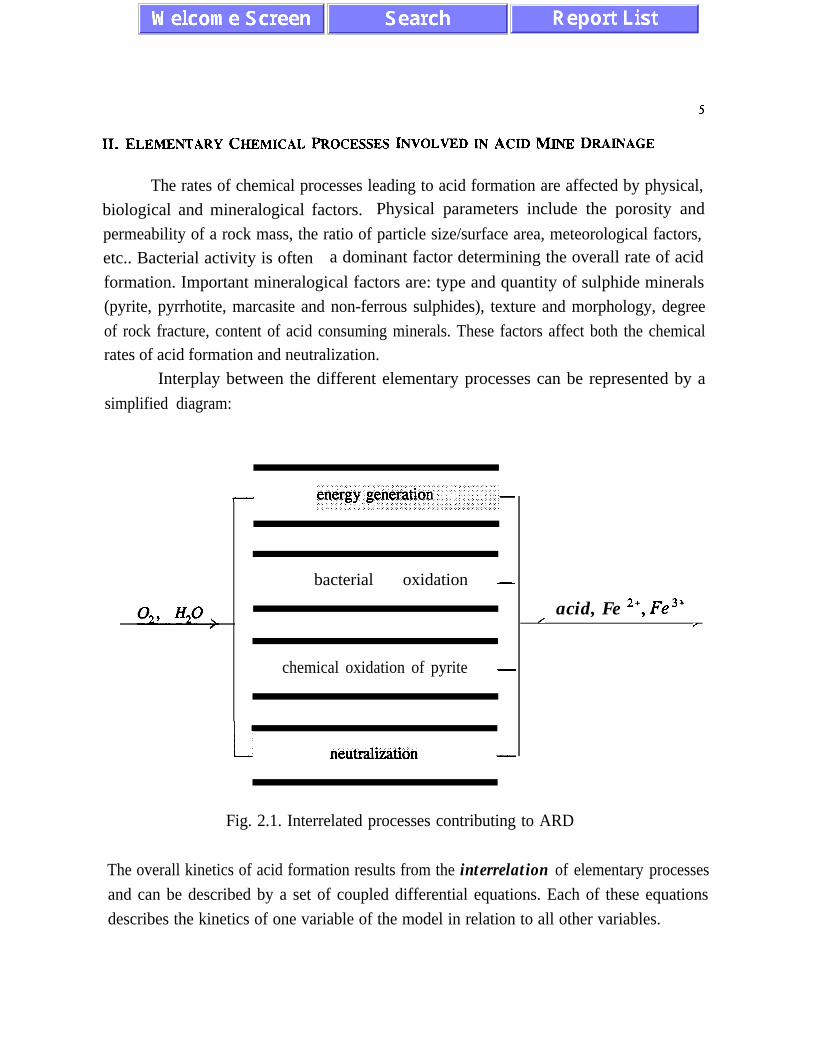
Interplay between the different elementary processes can be represented by a
simplified diagram:
1
bacterial oxidation -
chemical oxidation of pyrite -
L neutralization -
acid, Fe 2+, Fe3’/ /
Fig. 2.1. Interrelated processes contributing to ARD
The overall kinetics of acid formation results from the interrelation of elementary processes
and can be described by a set of coupled differential equations. Each of these equations
describes the kinetics of one variable of the model in relation to all other variables.
6
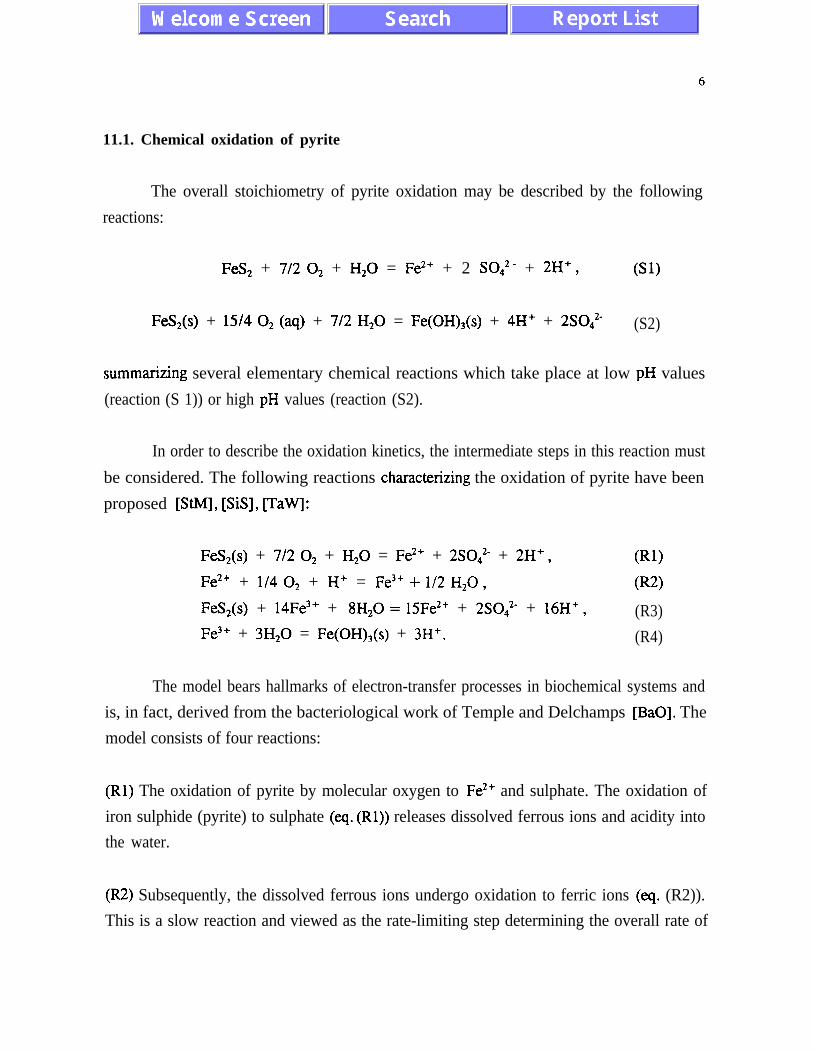
11.1. Chemical oxidation of pyrite
The overall stoichiometry of pyrite oxidation may be described by the following
reactions:
Fe& + 712 O2 + H,O = Fe*+ + 2 SO,*- + 2H+ , w
Fe&(s) + 15/4 0, (aq) + 7/2 H,O = Fe(OH),(s) + 4H+ + 2S04*- (S2)
summarizing several elementary chemical reactions which take place at low pH values
(reaction (S 1)) or high pH values (reaction (S2).
In order to describe the oxidation kinetics, the intermediate steps in this reaction must
be considered. The following reactions characterizing the oxidation of pyrite have been
proposed [StMJ, [SiS], [TaWJ:
Fe&(s) + 7/2 O2 + H,O = Fe*+ + 2SO,2- + 2H+ , W
Fe*’ + l/4 O2 + H+ = Fe3+ + l/2 H,O ,
FeS,(s) + 14Fe3+ + 8H2O = 15Fe*+ + 2SO4*- + 16H+ ,
Fe3’ + 3H,O = Fe(OH),(s) + 3H+.
W)
(R3)
(R4)
The model bears hallmarks of electron-transfer processes in biochemical systems and
is, in fact, derived from the bacteriological work of Temple and Delchamps [BaO]. The
model consists of four reactions:
(Rl) The oxidation of pyrite by molecular oxygen to Fe*’ and sulphate. The oxidation of
iron sulphide (pyrite) to sulphate (eq. (Rl)) releases dissolved ferrous ions and acidity into
the water.
(R2) Subsequently, the dissolved ferrous ions undergo oxidation to ferric ions (eq. (R2)).
This is a slow reaction and viewed as the rate-limiting step determining the overall rate of

pyrite oxidation.
(R3) Sulphide is oxidized again by ferric ion and acidity is released
ferrous ions which may re-enter the reaction cycle via reaction (R2).
fast step.
7
along with additional
This is regarded as a
(R4) Ferric ions hydrolyse to form insoluble ferric hydroxide (eq. (R3)), releasing more
acidity to the stream. This reaction takes place only at high pH values which can be attained
when the mineral composition of the waste rock is such that self-buffering processes take
place or when neutralizing minerals are added.
Reactions (R2) and (R3) provide a feedback loop presented below after Singer and Stumm
(p. 471 of ref. [StM] ).
Fe*’ + S *.2
/l+ 02
FeS, + 0, ___3 SO:- + Fe*’
+ FeS,
fast
Fe3+
The nature of this feedback is very similar to the autocatalytic mechanism leading to
oscillating behaviour, as described in a series of papers by Prigogine and others [PrL],
[NIP], [OtLl]. The number of reacting species during acid formation is greater than two.
This leads to strong nonlinearities in the kinetic equations and one may suspect that under

8
some conditions various types of oscillations including chaotic oscillations may be exhibited
by the system [FIN], fly], [Nip].
If one was to construct kinetic equations for the stoichiometric relations (Rl) - (R4)
by following (often postulated) the simple rules of chemical reactions in homogeneous
solutions, the set of kinetic reactions would have the form (compare [WhJ]:
d[Fe*+]/dt = k,[0217’* - k2[Fe2’][02]1’4[H+] + 15k,[Fe3’]14
- qi[Fe*+][SO,2-]*m+]* + qJFe3’] - qJFe2’]15[SO~-]2[H+]16,
d[Fe3+]/dt = k2[Fe2’][02]“4[H+] - 14 k3[Fe3’]14 - kJFe3+] + q2[Fe3+] +
+ 14q3[Fe2+]15[S042-]2[H+]16 + q4[Fe(OH)3][H’]3 ,
d[SO,*-]/dt = 2k,[02]“* + 2k3[Fe3’] -
- 2qJFe*+][SO~-]*[H+]* 2q3[Fe2’]‘5[S0,2-]2[H+]16- ,
VC)
d[[H+]/dt = 2k,[0217’* - k2[Fe2+][02]“4[H+] - 16 k3[Fe3+]14 + 3k,[Fe3+] -
- 2q,[Fe*+][S0,2-]*[H+]* + q2[Fe3+] -16q3[Fe2+]‘5[S0,2]2[H+]16+
+ 3q4FWW31W+13 ,
d[O,]/dt = - (7/2)k,[02]7’2 - (l/2) k2[Fe2’][02]1’4[H+] +
+ (7/2)q,[Fe*+][SO,*-]*[H+]* + 1/4qJFe3’] ,
d[H,O]/dt = - k,[02]7’2 + (1/2)k2[02]“4[H+] - 8k3[Fe3+]i4 +
+ qi[Fe*‘][SO,*-][H’]* - qJFe3+] + 8q3[Fe2+]‘5[S042~]2[H+]‘6 +
+3s4[W~W31W13 .
In the above set of nonlinear kinetic equations (IC), coefficients k,, k2, k, , & are rate
constants for equations (Rl)-(R4) for reactions with products on the right hand side, and q,,
q,, q,, q4 are rate constants for the reverse reactions with products on the left hand side of
9
equations (Rl)-(R4). Square brackets denote concentration of species in moles per litre and
powers of concentrations define the order of reactions with respect to the species involved.
[0,] denotes concentration of oxygen dissolved in water. (In Section II.4 we will also discuss
[0,] as a function of oxygen concentration in the gas phase (denoted by [O&J surrounding
the aqueous solution.
Equations (IC) (from “incorrect”) are not realistic, however. Simple stoichiometric
rules in the case of pyrite oxidation cannot be applied for several physico-chemical reasons.
1. Reaction (Rl)-(R4) are complex multistep reactions. Only one or two electrons are
transferred per elementary reaction and usually one elementary reaction is rate limiting and
dominates the order of a complex reaction with respect to individual reactants.
2. Reactions (Rl) and (R3) are heterogeneous surface reactions between dissolved species
and a solid surface of pyrite crystals.
3. There are arguments about the electrochemical nature of the chemical process described
by stoichiometric relations (RI) and (R3) for which Eh values are also significant[Yo].
4. Ferric and ferrous ions have a tendency to form water complexes which may limit the
probability of reaction (R3) - one should then expect that the order with respect to ferrous
iron, Fe*’ should be lower than 1.
5. Even in perfect homogeneous solutions staeric relations make it impossible for a large
number of species to interact chemically at the same moment - this comment applies in
particular to reaction (R3) whose stoichiometry suggests the largest number of species
involved.
All of the above arguments lead to the conclusion that the nonlinearities
corresponding to the multi-molecular nature of reactions, should not be derived from
stoichiometric relations and probabilistic principles disregarding the size of the reacting
species (even if the multi-species reactions were very fast). In principle, one could
theoretically derive the orders of chemical reactions by using methods of molecular dynamics
based on computer simulations. Such an approach does not seem efficient, however, given
the practical nature of the acid mine drainage problem. Fortunately there are several sets of
independent experimental data which allow the construction of a reasonable kinetic model
for the chemical, biological and physical processes responsible for acidic drainage.
In subsequent paragraphs we analyze in detail various experiments and on that basis

10
we derive kinetic equations which recognize the significance of various individual chemical
reactions and at the same time provide quantitative information which cannot be derived from
stoichiometric relations (Rl) - (R4). In analyzing individual reactions it is important to keep
in mind that experimental data are obtained for some control parameters. These parameters
are easily and economically measurable during large scale field tests at different sites and can
be controlled by using prevention methods or by the natural transport processes in waste rock
piles - such as mass and energy transport.
In our analysis we have used several results obtained before 1982 , and summarized
in three review articles by Lowson m] and Nordstrom [No], as well as more recent data
published in a series of articles in geochemical journals after 1982.
11
II.1 .l. Oxidation of pyrite by dissolved oxygen
The reaction of pyrite with aqueous solutions containing dissolved oxygen is described
by the overall reaction
Fe&(s) + 7/2 0, + H,O + Fe*’ + 2S04*- + 2H+ 03
As mentioned before, eq. (Rl) should be considered as giving only some qualitative information
on the recognized process of direct pyrite oxidation by dissolved oxygen. Relation (Rl) is not
the only possible reaction stoichiometry for the oxidation of pyrite by dissolved oxygen in acidic
solutions. Two other scenarios have been considered in the literature:
and
FeS2 + 3/202 g Fe*’ + S20j2‘ (2.1)
FeS2 + 7140, + H+ * Fe*’ + l/2 S40z- + 1/2H,O (2.2)
Reaction (Rl) indicates that 12.5 % of the oxygen in the sulphate ions originates from water
molecules and 87.5% originates from the dissolved oxygen molecules. Reactions (2.1) and (2.2)
indicate that all oxygen originates from dissolved oxygen molecules.
We have selected scenario (Rl) because it is supported by isotopic trace analysis [EvK],
[TaW 11, [TaW2], WeBI, [PrT], [WaK], [Jo], [KrG] which indicates that part of oxygen in
sulphate is derived from water molecules. In addition, there is no evidence for the presence of
S203*- or S406*- species as stable products [Gol], [Nil.
We also consider reactions (Rl), (R2) and (R3) as unidirectional. This is motivated by
practical reasons. There are no experimental data for rates of reverse reactions. In this and other
paragraphs the rate constants should be interpreted as cumulative rate constants whose values
account for slow reverse reactions. The argument that very small rate constants for reverse
reactions do not affect the qualitative behaviour of a chemical system, is not always correct,
however. There are situations when slow reverse reactions significantly modify the kinetics of
a nonlinear chemical network [OtLl].
Even when a chemical system is far from equilibrium, it is possible for transient species
to exhibit oscillatory behaviour or evolve to weakly time dependent quasi-equilibrium states
[Nip], fly]. Often chemical oscillations occur for very narrow ranges of kinetic parameters.
Accurate values of rate constant should be determined before a mathematical analysis initiated.
12
(a) order with respect to oxygen
It is important to identify reactants and products whose rate of change can be used to
define a rate of pyrite oxidation unambiguously. In a series of experiments McKibben and
Barnes [McK], were able to measure the oxidation of pyrite by measuring concentrations of
ferrous ions in the absence of ferric iron. The rate dependence on dissolved oxygen
concentration was determined in a series of runs conducted at two different ambient oxygen
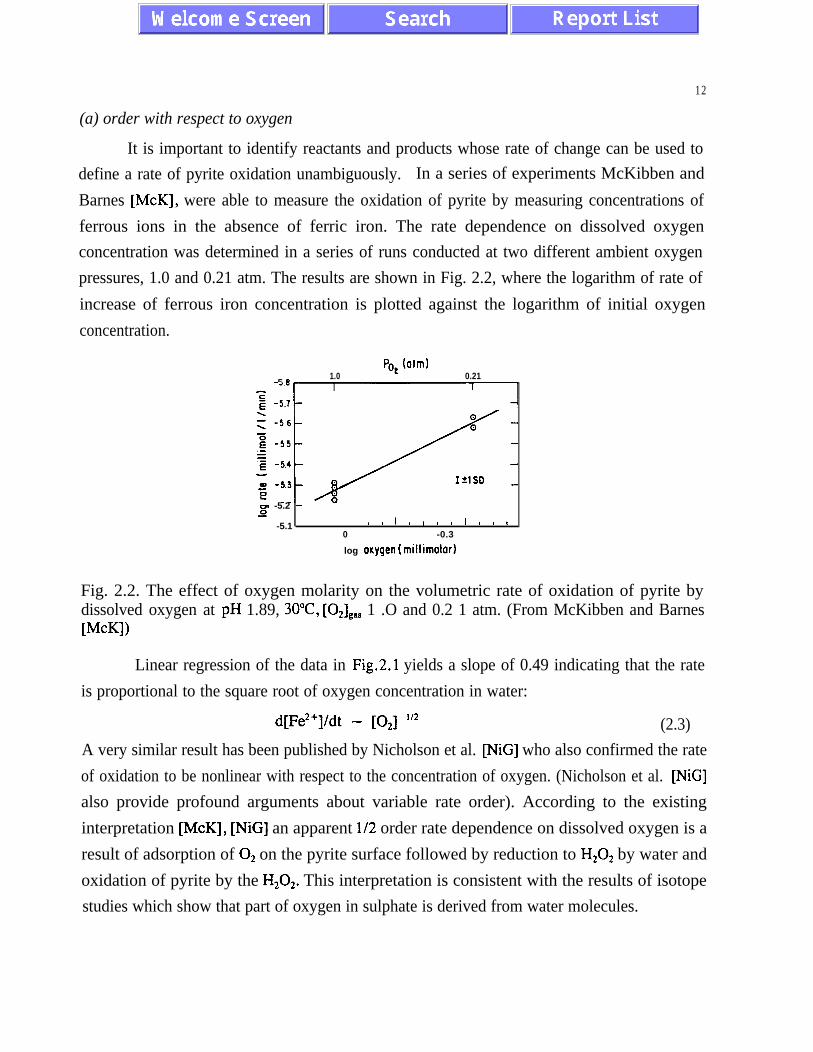
pressures, 1.0 and 0.21 atm. The results are shown in Fig. 2.2, where the logarithm of rate of
increase of ferrous iron concentration is plotted against the logarithm of initial oxygen
concentration.
Pot (otm)
-5 81.0 0.21
Yz
ijl,/I-
m -5.2 -0
-5.1 ’ I ’ ’ ’ ’ ’ ’ ’ ’ ’0 -0.3
log oxygen (millimolor)
Fig. 2.2. The effect of oxygen molarity on the volumetric rate of oxidation of pyrite bydissolved oxygen at pH 1.89, 3O”C, [OJ,,, 1 .O and 0.2 1 atm. (From McKibben and BarnesWKI)
Linear regression of the data in Fig.2.1 yields a slope of 0.49 indicating that the rate
is proportional to the square root of oxygen concentration in water:
d[Fe2+]/dt - [O,] “2 (2.3)
A very similar result has been published by Nicholson et al. [NiG] who also confirmed the rate
of oxidation to be nonlinear with respect to the concentration of oxygen. (Nicholson et al. [NiG]
also provide profound arguments about variable rate order). According to the existing
interpretation McK], [NiG] an apparent l/2 order rate dependence on dissolved oxygen is a
result of adsorption of O2 on the pyrite surface followed by reduction to H202 by water and
oxidation of pyrite by the H202. This interpretation is consistent with the results of isotope
studies which show that part of oxygen in sulphate is derived from water molecules.

13
In reaction (Rl) 87.5 % of the sulphate oxygen is derived from molecular oxygen and
12.5% from water molecules. Thus the rate of reaction (Rl) can be limited by oxygen partial
pressure.
Usually the concentration of dissolved oxygen is described by Henry’s law
Ial - KP*l,as (2.4)
which indicates that the concentration of dissolved oxygen is a linear function of oxygen
concentration in the gas phase of the surroundings. At 298 K and in contact with air of
atmospheric conditions
max RI = 8.3 mg/l (2.5)
In large piles of waste rock, far from the pile boundaries, the concentration of dissolved oxygen
can be very low. Both theoretical estimates and field data [BeR], [PaR] indicate that the oxygen
concentration [O,],,, may be below 1% inside a pile. In this way the rates of diffusive and
convective transport of oxygen inside a waste rock pile play a significant role as one of the main
rate limiting factors in the process of pyrite oxidation.
In our further numerical studies we will treat [O,],, as a model parameter . Detailed
analysis of convective and diffusive transport as a function of pile porosity and temperature
distribution goes beyond the scope of this study and should be performed in a future project.
(b) pH dependence
Many chemical reactions are sensitive to pH values. Results presented by McKibben and
Barnes [McK] indicate, however, that in reaction (Rl) the rate of abiotic pyrite oxidation by
dissolved oxygen is effectively independent of pH over the range of pH between 2 and 4. Linear
regression of experimental data for the logarithm of the rate of oxidation of pyrite versus the
logarithm of proton concentration [McK] yields a slope of 0.09 which is negligible. In a later
study Moses et al. [MoN] concluded that reaction (Rl) is pH independent up to pH =7.
(c) rate constant
McKibben and Barnes [McK] give the value of the rate constant determined at
temperature T, = 30°C as
k,(T,)=2.83 ~10~~ Ml’* cm-“* s-i. (2.6)One can find in the literature other values of the rate constant for reaction (Rl) [Lo].
Those values were not measured directly but were always determined as a proportionality
14
coefficient between the rates of change of product and substrate concentrations at a constant
temperature after assuming the order of reaction. The value (2.6) does not reproduce, however,
fundamental experimental results presented by McKibben and Barnes [McK]. We had to
reanalyze the experimental data and a correct value is given in Chapter III.
(d) activation energy
Rate constants are temperature dependent and usually can be represented as a product of
the pre-exponential factor A, = k, (T = 00) and an exponential factor depending on activation
energy. Because in most experiments the rate constants were determined at a certain temperature
T,, we use the formula
k,(T) = k, (T,) exp (2.7)
where k,(T,,)=A,exp (-E,/RT,,) and E, is the activation energy, R is the gas constant and T is
temperature Kelvins. The activation energy was determined in a series of experiments. The
values obtained by various researchers range from 39 kI/mol to 88 kJ/mol [Lo]. Values above
90kJ/mol have been reported for temperatures above 100°C.
Temperatures observed in waste rock piles do not exceed 90°C and for our model we will
use the values
E,=57+7.5 kJ/mol for pH<4 and E,=88 kJ/mol for pH>4 ( 2 . 8 )
determined by McKibben and Barnes [McK] and Nicholson et al. [NiG] at temperatures between
20°C and 40°C. Other values quoted by Lowson [Lo] have been obtained from an analysis of
experimental data in which the authors assumed rather than determined the orders of reaction
and obtained pre-exponential factors which varied with temperature. We favour the value
obtained by McKibben and Barnes because they did not make such assumption and their pre-
exponential factor does not show a temperature variation.
It is important that a future waste rock model uses a correct value of the activation
energy. The higher the value of activation energy the faster the acceleration of the oxidation
process when temperature increases.
1.5
(e) pre-exponential factor
For a value of activation energy equal to 56.9 kJ/mol we obtain the pre-exponential factor
A, = 1.1 x 10⁻⁸M1’2cm-1’2s-1 (2.9)For the process of pyrite oxidation the value of the pre-exponential factor measured in
any experiment cannot be considered as a universal material constant. The pre-exponential factor
depends strongly on the surface area/mass ratio for a pyrite sample and may be different for
rocks of different morphology. Experimental data collected by Nicholson et al. [NiG2] for
tailings over a period of 4 years indicate that after some time - as a result of coating by ferric
hydroxide - one observes a crossover from a linear dependence on surface area/mass ratio to a
linear dependence on volume/mass ratio. This tendency is accompanied by a decrease in the
chemical activity of the rock samples. These experimental facts may be interpreted as an
indication that the fractal dimensions of a pore structure may be an important factor contributing
to the chemical activity of waste rock. In general it is difficult to use basic physico-chemical
principles to derive numerical values of pre-exponential factors for different fractal dimensions.
A possible way to account for variability in reactivity of minerals containing pyrite is to include
a factor S/V which measures the active surface area, S per volume, V of water. In our model
we use values observed in some experiments. One must remember, however, that rocks have
different morphology at different sites and the pre-exponential factor should be measured for
every site in order to provide reliable entry data for a predictive waste rock model [Lap].
As the result of the above discussion we can write
dpe2+lC,,, /dt = (S/V) ki(TJ exp[WT,YWJX)I [OJ”* . (2.10)
The symbol [Fe2+lcR,, is used to indicate the contribution from reaction (Rl). (The total rate of
change of ferrous iron concentration is a sum of contributions from all elementary reactions
(Rl)-(R4)).In an analogous way we can write
WM(R~~/dt = -VSW k, 0 exp ~W’-T,YWTJ1 10211’2 , (2.11)
d[S0,2j&dt = (2S/V) k, (T,) exp [E,(T-T,)/(R?T,)] [O,] 1’2 , (2.12)
dW’l,,i,/dt = (2S/V) k&T,) exp [E,(T-T,)/(RTT,)] [02]“* , (2.13)
16
d[H,O]&dt = - (S/V) k,(T,) exp [E,(T-T,)/(RTT,,)] [OJ1’* . (2.14)
In equations (2.11) - (2.14) the concentration of FeS, does not appear explicitly. This is
due to the fact that the pyrite solubility in water is very low and that reactions leading to the
release of ferric and ferrous ions take place mostly on solid surface. The effective active surface
area is described by the parameter S/V. Parameter S is constant for times short in comparison
with the decay time for the pyrite crystal. Usually the decay process is described by various
versions of the shrinking core model. In the shrinking core model the parameter S decreases in
time WiGIZ]. Nicholson et al. [NiG2] performed their analysis for tailings. Unfortunately, we
do not have any similar data for waste rock. The values of S/V are site specific and depend on
several mineralogical factors.
17
II.1.2. Oxidafion of ferrous if-on
The oxidation of ferrous iron to ferric iron by molecular oxygen:
Fe*’ + l/4 O2 + H+ = Fe3+ + l/2 H20 W)is a well documented step occurring in acid rock drainage. Singer and Stumm [SiS] suggested
that this can become and is known to limit the rate of pyrite oxidation at low pH, because
it is slower than reaction (R3). This step is important for the reaction (R3) because it
regenerates the ferric irons which are reduced during reaction (R3). Moses and Herman
WsH] investigated the microscopic features of the oxidation of aqueous Fe*’ at
circumneutral pH and 23°C. They suggested that Fe*’ and dissolved oxygen react in a
termolecular transition state complex. The reaction produces as an intermediate species the
superoxide radical (0,) and hydrogen peroxide. Fe*’ and H,O, react in a termolecular
reaction or in a two-step bimolecular reaction which depends on [OH-] concentration.
(al) reaction order with respect to dissolved oxygen
The order of the reaction with respect to dissolved oxygen was determined by Stumm
and Singer [SiS]. They found it to be equal to one and independent of pH for low pH
values, and independent of ferric iron concentration. Moses and Herman [MsH]
demonstrated later that the order with respect to oxygen is independent of pH also for higher
pH values up to pH=7.
(a2) reaction or&r with respect to ferrous iron concentration
At low pH values, the stoichiometric reaction (R2) has two different paths whose
relative rates depend on the ferrous ion concentration [SaG]. At concentrations below 0.05
mol of Fe*‘/1 the oxidation is first order with respect to ferrous iron. Above 0.1 mol of Fe*+
per litre the reaction is second order. Thus, in general, the rate equation for ferrous iron
oxidation will contain terms proportional to [Fe*‘] and [Fe*‘]*. The increase in the order
of the reaction as a function of concentration can be explained by the fact that ferrous ions
form complexes with water molecules and at higher concentrations the reaction takes place
when two such complexes are in contact (which is unlikely to happen at low concentrations
of ferrous ions). Detailed analysis of this fact is presented by Astanina and Rudenko [AsR].
18
The presence of more than one microscopic pathway for the reaction (R2) has to be assumed
in any experimental study conducted with the purpose of determining the values of rate
constants and activation energies at concentrations between 0.05 and 0.1. In many existing
reports this assumption has not been made and this fact accounts for large discrepancies
between values obtained in those papers [DaS]. In field studies iron concentrations up to
18g/l have been reported [Gel and it is important that a kinetic model for acidic drainage has
both linear and quadratic terms in [Fe*+].
(II) pH dependence and reaction order with respect to hydroxyl
Additional complication is introduced by the dependence of reaction (R2) on the
concentration of [OH-] of hydroxyl groups. At pH values below 3.5, the reaction proceeds
at a rate independent of pH. At pH values between 3.5 and 5 the reaction becomes first order
with respect to [OH-]. As the pH is raised above 5 to neutral, the reaction rate increases and
the order changes to second order with respect to hydroxyl. Increasing the pH into the
alkaline region causes precipitation of ferrous hydroxide.
While the neutralization process reduces acidity, it also accelerates the rate of the
abiotic reaction (R2) which at pH=7 is five orders of magnitude faster than at pH=4 (see
Fig. 2.3). This problem seems to be of great practical importance and one should carefully
analyze benefits of the neutralization process in comparison with other methods of reducing
acidic drainage. Proper blending of neutralizing minerals seems to be crucial for the
effectivness of neutralization process.
(c) activation energy
The value of activation energy shows a tendency of increasing with pH. For pH less
than 3.5 and temperatures below 100°C relevant for acidic drainage, Mathews and Robins
[MaRl] obtained
%, =74kJ/mol , pHc3.5 (2.15)
At higher values of pH, a higher value
b3 =96M/mol ,
has been reported [StL].
pH>5 (2.16)
Because of the lack of experimental data for activation energy at pH between 3.5 and 5 we
will use the value
b,,=85kJ/mol , 3S<pH<5
which is assumed to be simply an arithmetic average of &, and F&.
19
(2.17)
(d) pre-exponential factorPre-exponential factor is again site specific. Various field investigations of Fe2+ in
natural mine drainage waters show higher rates than under laboratory conditions [SiS]. This
is due to a catalytic effect of various substances present in natural mine drainage waters. the
catalytic effects of copper, manganese, aluminium, charcoal, clay particles have been
reported. As a result, values of pre-exponential factors differ often by two or three orders
of magnitude [SiS].
The most dramatic effect on the rate of reaction (R2) is bacterial oxidation which may
accelerate the reaction by a factor graterer than 106. Microbial oxidation is discussed in
Section 11.3.
The rate equation has the form:
4Fe3’l/d&?j = k2dW) P2,,l[Fe2’l + k22 @HI [02,AOHI[Fe2’l ++ k23@H) [02,aJFe2’lPH-12 (2.18)
with the rate constants
k,,@H) = 4.0 x 10” M-i atm-’ s-l for pHc3.5, T,=303 K, (2.19)
k&H) = 1.66 x 10m9 atm-’ s“ for pH < 5, To=298 K, (2.20)
k,@H) = 1.33~10’~ Mq2 atm-i s-* for pH>5, T,,=298 K (2.21)
given in ref. m] and [SiS]. pH dependence of rate constants indicates both different values
of activation energy for different pH values (eqs. (15-17)) and different functional
dependence as indicated in eqs. (19)-(21) and illustrated in Fig.2.3. Eq. (18) can also be
expressed in terms of hydronium ion concentration we], as discussed in Chapter III.

20
-3.0
G5 -4.0
2
4 -5.0
-6.0
-9.0I 2 3 4 5 6 7
PH
Fig.2.3 Oxidation rate of ferrous iron as a function of pH in abiotic conditions. (From Singerand Stumm [SiS]).
21
lI.1.3. Oxidation of pyrite by ferric iron
In reaction (R3) :
Fe&(s) + 14Fe3+ + 8H,O = lSFe*’ + 2S04*- + 16H+ (R3)
all oxygen in sulphate is derived from water molecules. Reaction of pyrite with ferric iron has
been analyzed in a series of papers. When pH falls below 4, the solubility of ferric iron
increases. At low pH values ferric iron is the major oxidant of pyrite, while the slow process
of oxidation of ferrous iron to ferric iron remains the rate limiting factor in the absence of
bacteria. As mentioned before, the form of the stoichiometric relations (Rl)-(R4) may be
misleading if they were used to establish orders of the reaction with respect to the reacting
species. At first glance there is a temptation to model the kinetics by using 14th order
representation with respect to ferric ions and eighth order with respect to water. As we
mentioned earlier such an approach is not correct. Reaction (R3) is a multistep reaction with an
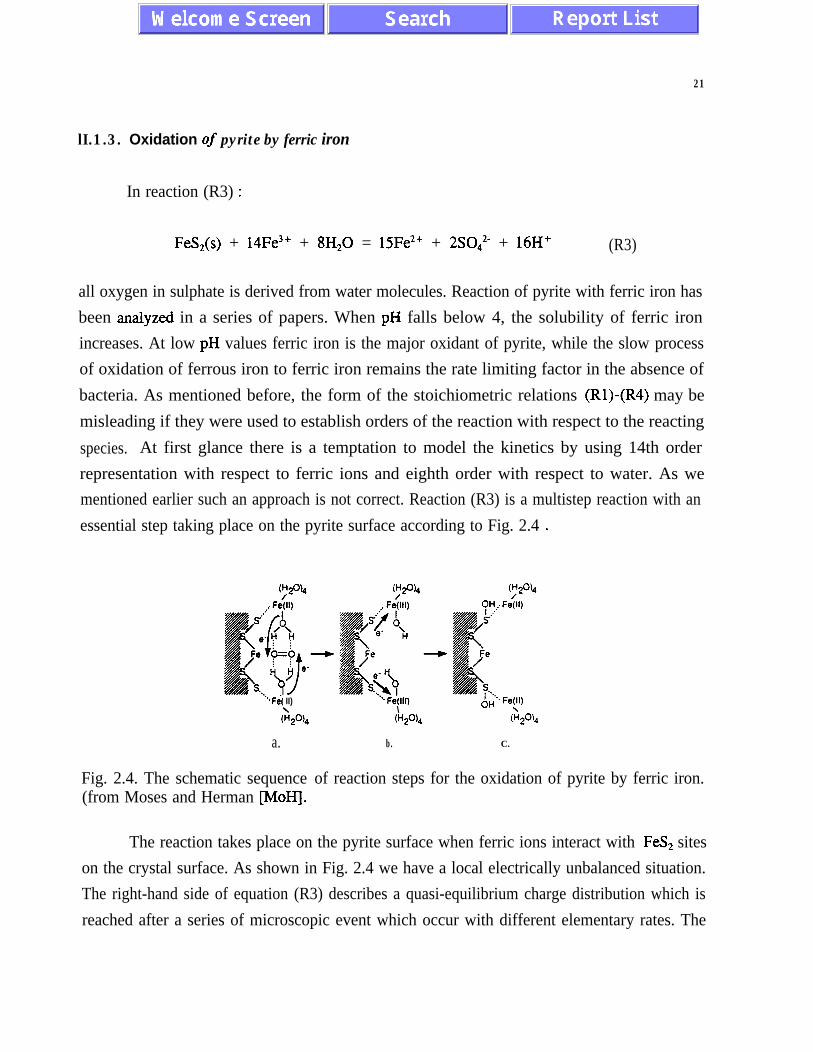
essential step taking place on the pyrite surface according to Fig. 2.4 .
“. Fi( II)\W20)4
a.
Fig. 2.4. The schematic sequence(from Moses and Herman MoH’J.
\6”“. Fe(ll)
\(H20)4 CH204
b. C.
of reaction steps for the oxidation of pyrite by ferric iron.
The reaction takes place on the pyrite surface when ferric ions interact with FeS, sites
on the crystal surface. As shown in Fig. 2.4 we have a local electrically unbalanced situation.
The right-hand side of equation (R3) describes a quasi-equilibrium charge distribution which is
reached after a series of microscopic event which occur with different elementary rates. The

22
molecular scenario does not require a large number of ferric ions to be in direct contact with
each other and with pyrite sites, and the order of the reaction with respect to ferric iron is lower
than 14. So far there are no elementary microscopic quantitative models which would describe
the complex process of charge transfer between the species involved in reaction (R3). The
electrochemical nature of this process manifests itself strongly at high temperatures (due to the
increased mobility of reactants) and has been investigated by Mayer [Ma] . As pointed out by
several researchers (see WiR] ), a specific electrochemical mechanism involving ferric ion and
pyrite at the solution/solid interface is a likely rate determining step.
Fortunately there are several experimental results which allow the formulation of a
realistic mathematical description of the reaction kinetics. For our model we will use the data
obtained by McKibben and Barnes [McK]. The rate of reduction of ferric ion can be used in
laboratory tests as a measure of the extent of oxidation of the sulphide mineral, since 14 moles
of ferric iron are reduced during the decomposition of one mole of Fe& releasing one additional
mole of iron to the solution. Because the process involves the ferric-ferrous redox couple, the
redox potential, E,, of the solution as given by the Nemst equation (Morgan and Stumm [S&l],
Nordstrom et al. [NoJ]).
E,,=E, + (RT/F) In [a(Fe3+)/a(Fe2+)] (2.22)
can be used to measure the kinetics of the reaction. In the Nemst equation a(Fe*‘) and a(Fe3+)
denote activities of the species in the brackets.
The reaction rates are the same for aerobic and anaerobic conditions. This indicates that
in a waste rock pile, rates of pyrite oxidation may be large even in regions where oxygen
concentration is low but concentration of ferric iron is high as the result of oxidation of ferrous
iron higher in the pile. The transport of water with dissolved ferric ions should be considered
as an important factor responsible for acidic drainage.
(al) order with respect to ferric ion concentration
As the reaction takes place on the pyrite surface one has to distinguish between the
physical process of adsorption of ferric iron and the chemical process of pyrite oxidation. Both
processes contribute to the observed change in concentration of ferric ions in water. The
adsorption process is relatively fast at the beginning and slows down after a large number of
ferric ions are adsorbed on the pyrite surface. This initial phase lasts less than an hour and is
short on the time scale of acid rock drainage which can be on the order of several years. For
23
this reason one should use results of measurements performed after the initial fast phase in which
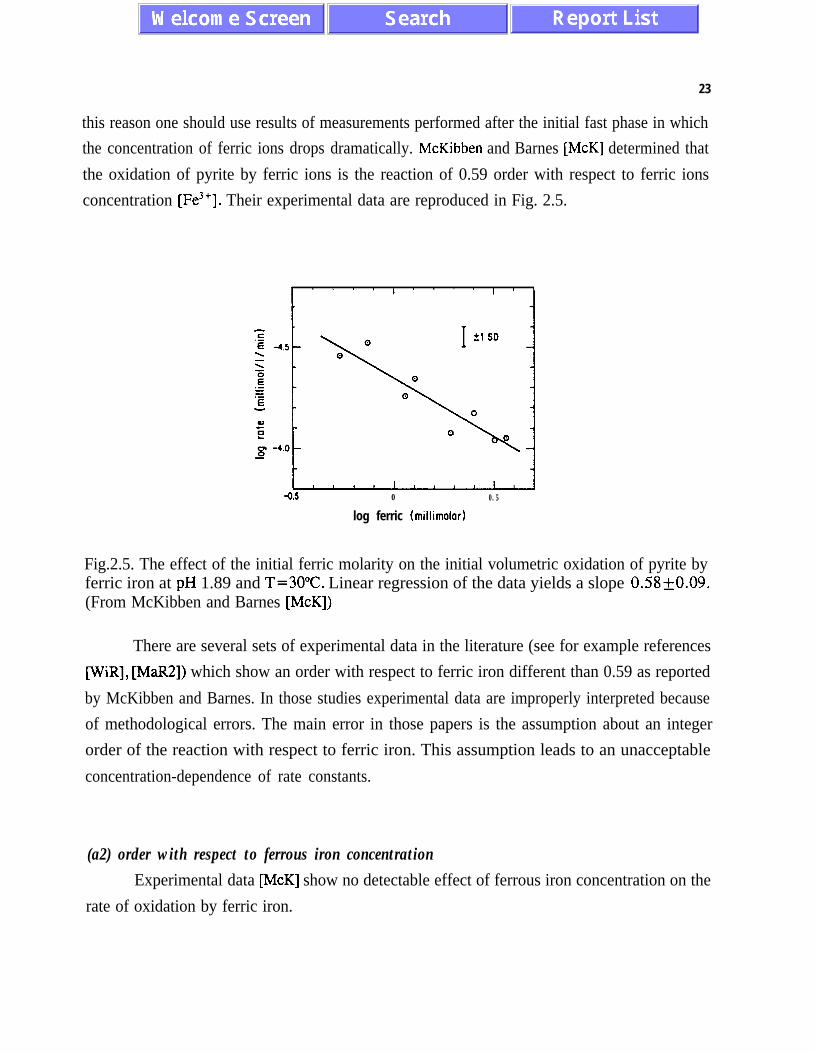
the concentration of ferric ions drops dramatically. McKibben and Barnes [McK] determined that
the oxidation of pyrite by ferric ions is the reaction of 0.59 order with respect to ferric ions
concentration [Fe3’]. Their experimental data are reproduced in Fig. 2.5.
-0.5 0 0.5
log ferric (millimolor)
Fig.2.5. The effect of the initial ferric molarity on the initial volumetric oxidation of pyrite byferric iron at pH 1.89 and T=30”C. Linear regression of the data yields a slope 0.58+0.09.(From McKibben and Barnes [McK])
There are several sets of experimental data in the literature (see for example references
WiR], [MaR2]) which show an order with respect to ferric iron different than 0.59 as reported
by McKibben and Barnes. In those studies experimental data are improperly interpreted because
of methodological errors. The main error in those papers is the assumption about an integer
order of the reaction with respect to ferric iron. This assumption leads to an unacceptable
concentration-dependence of rate constants.
(a2) order with respect to ferrous iron concentrationExperimental data @4cK] show no detectable effect of ferrous iron concentration on the
rate of oxidation by ferric iron.

24
(b) order with respect to proton concentration
Experimental data [McK] show an inverse square-root dependence of the rate on proton
concentration (i.e. reaction rate is proportional to [H+]-*‘* which decreases with increasing
proton concentration. Similar value has been obtained by Mathews and Robins [MaR3]. There
is no explanation of this fact in literature. We can only speculate that the reaction (R3) is
reversible, with a reverse reaction showing a positive order with respect to protons. In the
reaction (R3) the adsorbed ferric iron is reduced to ferrous iron by an electron transfer from one
of the pyrite sites. (This mechanism is consistent with the semiconductive properties of pyrite).
(c) activation energy
Mathews and Robins [MaR2] and Wiersma and Rimstidt NiR] obtained activation
energy values of 85 kJ/mol and 92 kJ/mole respectively. These values have been obtained over
a temperature range 30-70°C and can be used as characteristic values for acid rock drainage. In
our model we use the value
& = 90 k.I/mol (2.23)
(d) pre-exponential factor
The pre-exponential factor describes in this case both the characteristic rates of chemical
processes taking place on pyrite surface, and the chemical activity, a, as a function of the pyrite
reactive surface area to volume of solution ratio (Singer and Stumm [SiS])
a3 = k,S/V (2.24)
(S - pyrite surface area, V - solution volume). Several authors suggested that the reactive surface
area is significantly different than the total surface area. Oxidation has been observed to take
place on reactive sites with excess surface energy, such as grain boundaries, defects, solid and
fluid inclusion pits, cleavages and fractures. A reliable waste rock model must take into
consideration the decrease in surface area over time. Usually this is done by using a shrinking
core model. The shrinking core model does not take into consideration changes of physico-
chemical properties of the rock surface during the oxidation process. The rate constants
obtained during most experiments have been measured over time intervals from a few minutes
to a few hours and it is possible that they are not representative of long-term acidic drainage.
Determining a long-time dependence of the pre-exponential factor should provide important entry
data for a waste rock model.
From the relation
2.5
d[Fe3+]&dt = S/V k,(T) [Fe3+][H+]-o,s , (2.25)
obtained by McKibben and Barnes [McK], and the stoichiometric relation (R3), we obtain other
kinetic equations for water, sulphate, ferrous iron and proton concentrations.
For pyrite concentration in units of moles of pyrite cmm2, McKibben and Barnes obtained the rate
constant
k3 (T,,) = 3.03 x lo-l2 M crnm2 s-i at To=303 K . (2.26)
We could not reproduce experimental data of MC Kibben and Barnes when we used the above
value of k3. A different value of the rate constant k, is determined in Chapter III.

26
II. 1 A. Precipitation offerric hydroxide
The reaction
Fe3’ + 3Hz0 F’ Fe(OH),(s) + 3H+ 0
is reversible and its direction depends on the pH value. Fig.2.6 presents the diagram of
activity of Fe3’ (denoted by (Fe3+)) as a function of pH:
4
- 1 4
- 1 60 2 4 6 8 10 12. 14 16
PH
Fig. 2.6. Activity-pH diagram for Fe(II1) species in equilibrium with Fe(OH),(ppt) at 298K. (From Kelsall and Williams [Kew 11.
The equilibrium between ferric iron and ferric hydroxide in silica is given by [Kew l] :
log((Fe(OH),)/(Fe3+)) = -11.95 + 3 pH. (2.27)
The solubility equation has the form
log (Fe(OH),) = -7.98 . (2.28)
Processes of precipitation and dissolution of ferric hydroxide play an important role in acidic

27
drainage by providing a sink (at high pH values) and a source (at low pH values) of ferric
ions for reaction (R3). Nicholson et al. [NiG] have found that at circumneutral pH, ferric
hydroxide forms a passive protective film on pyrite, which results in lower rates of oxidation
by dissolved oxygen. This also means that if we can control and maintain high pH values in
waste rock, then we can eliminate pyrite oxidation by ferric iron (reaction (R3) and we can
also slow down the oxidation by dissolved oxygen (reaction (Rl).
On the other hand, the rate of ferrous iron oxidation in reaction (R2) increases with
pH. In this way the neutralization process leads to the formation of reservoir of ferric iron
in the solid form, which, if dissolved, may cause accelerated pyrite oxidation. This means
that if an insufficient amount of the neutralizing minerals is mixed with waste rock to control
acidic drainage, pH may decrease below 4 and pyrite oxidation may become faster than it
would have been had neutralization not been attempted. This danger exists in particular when
ferric hydroxide accumulates during a dry period and than redissolution occurs during a wet
period, when acidic conditions with pH <4 are initiated. Dissolution rates of neutralizing
minerals affect the neutralization process. The dissolution rates of calcite, dolomite and
magnesite are significantly different and additional kinetic studies are required to determine
optimum amounts of neutralizing minerals.
28
11.2. Bacterial oxidation
Sulphide minerals undergo accelerated oxidation in the presence of bacteria to form
sulphuric acid. For pH below 4, reaction (R2) is thought to be the rate-limiting step for
reaction (R3), the principal inorganic oxidation mechanism [StM], [SiS]. Bacteria such as
Thiobacillus ferrooxidans increase the rate of oxidation of ferrous to ferric iron (reaction
(R2)) by several orders of magnitude in acidic environments [In], [An], [BaO], [BOB], [Br],
lcawl, WL’I, lEh1, DW,I~W,DWt~KL IDSI, IWI, IN ISal, WA, PUT], WWI,[wiv] . Following several studies, we will incorporate the process of bacterial oxidation by
describing it in our model as three stoichiometric reactions
Fe&(s) + 7/2 0, + H,O bacteria Fe*’ + 2S04*- + 2H+ , P1)
Fe*’ + l/4 O2 + H+ bacteria Fe3’ + l/2 H 02 9 FQ)
F&(S) + 14Fe3+ + 8H2Obacteria lSFe*’ + 2SO,*- + 16H+ @9
which have the same form as the abiotic chemical reactions (Rl) , (R2) and (R3). The details
of bacterial oxidation of pyrite are different than for abiotic chemical reactions (Rl), (R2)
and (R3), and remain unknown to some extent. Reaction (B3), in particular, is probably
quite different than reaction (R3) . It has been suggested [LiS4] that elemental sulphur is an
important intermediate product of the bacterial oxidation of pyrite, while during the abiotic
reaction (R3) elemental sulphur has not been detected at any stage of the reaction. Anaerobic
oxidation of pyrite T. ferrooxidans has been documented only recently [SuL], [Pr], [Gu],
contrary to an earlier belief that pyrite oxidation by T. ferrooxidans under anaerobic
conditions is negligibly slow.
The microbial catalysts lower the activation energy of the reactions and greatly
accelerate reaction rates. The microbial influence on pyrite oxidation as given by reaction
(B2) is usually referred to as an indirect action, as distinguished from a direct action
mechanism in which T. ferrooxidans or other microbes attach themselves to the pyrite
surface and directly attack the surface, enzymatically oxidizing sulphide to sulphate, in a way
similar to reaction (Rl).

29
II.2.1. Aerobic bacterial oxidation of pyrite
Bacterial aerobic oxidation of pyrite involves dissolved oxygen and oxygen derived
from water molecules. Because products in a bacterial process are the same as in the reaction
(Rl) we use the same stoichiometric relation
Fe&(s) + 7/2 O2 + H,O bacteria Fe*+ + 2S04*- + 2H+ (Bl)
as for the abiotic reaction (Rl).
ISwe* ______ 0 e--w
. . . . . * . . . . . . . . . . . &
u
i 10ehmnicd bactuiai
i
100 2 0 0
T I M E i n m i n u t e s
3 0 0 4 0 0
Fig.2.7. Oxygen consumption in the oxidation of washed pyrite with and without Fe*+ orFe3’ by T. ferrooxidans. Concentration of T. ferrooxidans, 1 mg of wet cells per ml; Fe*‘,6 25 mM* Fe3’. , , 13.5 mM. (From Lizama and Suzuki [LiS4].
From Fig.2.7 and other experimental data it is evident that the bacterial oxidation rates are
much greater then abiotic chemical oxidation rates. Bacterial activity reaches its maximum
at a temperature T, which is typically between 298K and 338K.
When pyrite and water are in excess we use the formula
d[O,],,,/dt = - S/V BO B@H) kn, Crm,bW[0211’2 (2.29)
Equation for ferrous iron production can be obtained from the stoichiometric formula and
has the form

30
d[Fe*+],,,/dt = (2S/7V) B(T) B(pH) k,b(Tm,[cell])[02]“2 (2.30)
Eqs. (2.28) and (2.29) describe rates oxygen consumption and ferrous iron production as the
functions of dissolved oxygen concentration, [0,] and cell concentration, [cell] at different
values of pH and temperature. The coeeficients B(T) and B(pH) are equal to one for T=T,
and pH for which T. ferrooxidans exhibit the maximum activity.
The value of k,, is obtained by analyzing experimental data obtained by Lizarna and Suzuki
piS4]:
kn,(Tm,[cell]) = 8.49 x 10” M”*lm-* s-i
for 1 mg of cells per 1 ml. at T,=303 K and pH=2.3 (2.31)
The value (2.31) is obtained in paragraph 4.0.3 by analyzing data presented in Fig.2.7 and
data on the reactions (B2) and (B3).
(al) order with respect to oxygenThere are no quantitative experimental data for the dependence on oxygen
concentration and the l/2 order reaction with respect to oxygen is postulated (the same as
for the reaction (Rl)).
(a2) dependence on cell concentrationFor the reaction (Bl) we do not know of any systematic experimental data on the rate
dependence on cell concentration. We use a value [cell] = lg/l for which experimental data
exist. For large bacteria concentrations in unwashed pyrite some inhibition effects have been
observed. We expect to extend our analysis when experimental data on reactions (Bl) and
(B3) for other cell concentrations become available.
@) temperature and pH dependenceThe rate coefficient K,, defined as
Ki, = h,KJceN) B(T) WPW (2.32)
depends on temperature and pH. The form of the coefficients B(T) and B@H) is assumed
to be the same for all bacterial reactions and is discussed in paragraph 11.2.2.

31
II.2.2. Aerobic bacterial oxidation of ferrous iron
Reaction
Fe2+ + l/4 02 + H+ bacteriaFe3+ + l/2 H,O GQ)
is much faster than the analogous abiotic reaction (R2). The mechanism of the biochemical
oxidation of ferrous iron has been summarized by Ingledew [In]; see also [LuV], [LuS]). The
process involves an Fe2+ - oxidoreductase as the initial electron acceptor. To date the nature
of the intermediate electron acceptor is not known. However, there are candidates which
include rusticyanin, a redox peptide with a molecular weight of 16 000, and a cytochrome
c with a molecular weight of about 12 000. The other electron transport components involved
in iron oxidation are membrane-bound cytochrome c and cytochrome oxidase. In the first
part of the process ferrous iron is oxidized with the release of electrons:
2Fe2’ + 2Fe3’ + 2e- (2.33)
The second part of the reaction takes place on the inside of the cytoplasmic membrane and
within the cytoplasm:
2e- + 2H+ + l/2 O2 + H20. (2.34)
This means that the membrane properties play an important role by gating the charge transfer
in the process of bacterial oxidation.
Thk rapid elimination of the H+ as shown in equation (2.34) maintains a neutral pH
within the cytoplasm, which is required to establish the H+ electrochemical gradient, the
driving force for producing biological energy. In this way the acidic environment provides
energy for bacterial growth and at the same time a neutral pH is maintained inside the
bacteria. Lundgren et al. [LuV] estimate that about 3x lo6 atoms of Fe2+ are oxidized per cell
per second.
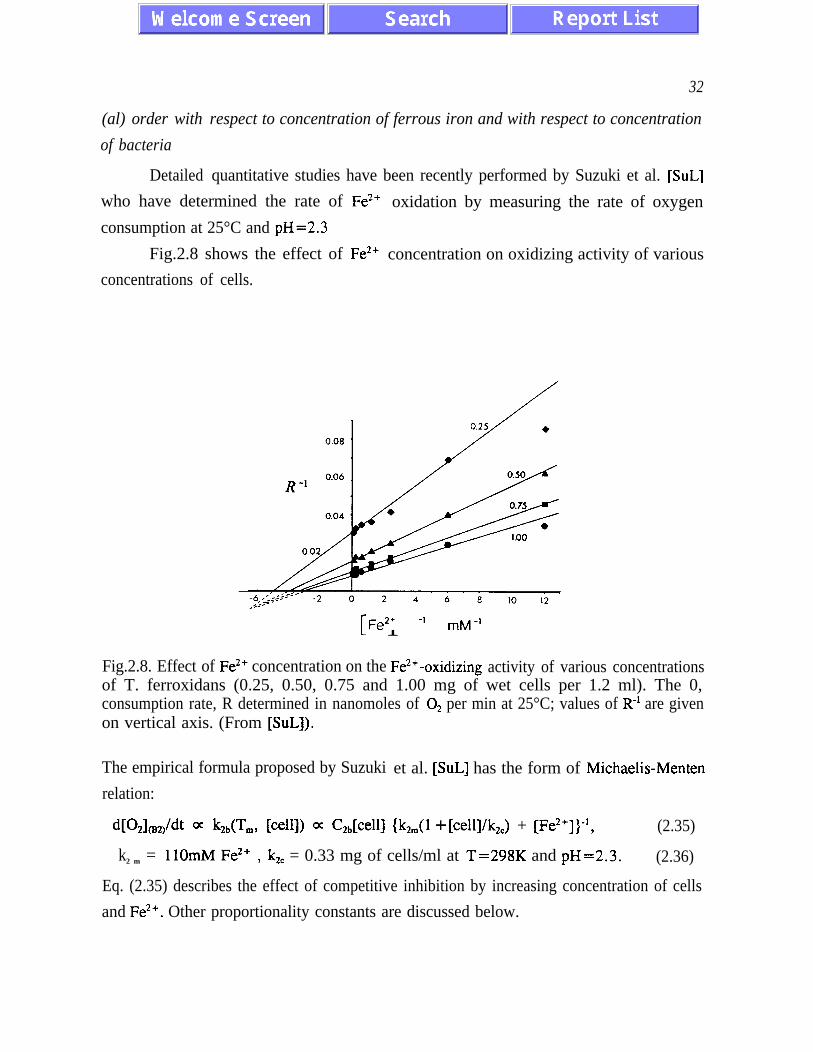
(al) order with
of bacteria
Detailed
32
respect to concentration of ferrous iron and with respect to concentration
quantitative studies have been recently performed by Suzuki et al. [SuL]
who have determined the rate of Fe*+ oxidation by measuring the rate of oxygen
consumption at 25°C and pH=2.3
Fig.2.8 shows the effect of Fe*+ concentration on oxidizing activity of various
concentrations of cells.
II 1,+2+ -1 mM-i
Fig.2.8. Effect of Fe*’ concentration on the Fe*’ -oxidizing activity of various concentrationsof T. ferroxidans (0.25, 0.50, 0.75 and 1.00 mg of wet cells per 1.2 ml). The 0,consumption rate, R determined in nanomoles of O2 per min at 25°C; values of R-r are givenon vertical axis. (From [SuL]).
The empirical formula proposed by Suzuki
relation:
et al. [SuL] has the form of Michaelis-Menten
W&ddt a bA’L, WI) a C2&eW {k2,,,(l +[cell]/k,,) + [Fe*+])-‘, (2.35)
k2 m = 11OmM Fe*’ 7 kZc = 0.33 mg of cells/ml at T=298K and pH=2.3. (2.36)
Eq. (2.35) describes the effect of competitive inhibition by increasing concentration of cells
and Fe*+. Other proportionality constants are discussed below.

33
(a2) order with respect to dissolved oxygen
We could not find any systematic results on bacterial activity for different values of
oxygen concentration. We assume that the bacterial oxidation rate depends linearly on
oxygen concentration (i.e. in the same way as the abiotic reaction (R2).
(b) rate constants for bacterial oxidation
For dissolved oxygen concentration Suzuki et al. [SuL] report the rate constant CZb
between 1.46 and 2.38 pmol 0,/s per mg of cells per ml for oxygen concentration at
atmospheric partial pressure. We will perform our analysis for a particular strain, SM-4 of
Tiobacillus ferrooxidans for which Suzuki et al. obtained
C,, = (2kO.3) FM 0,/s per mg of cells per ml at T=298K and pH=2.3 (2.37)
(c) pH dependence
We did not find in literature any detailed quantitative study of the pH effect on rates
of bacterial oxidation. Typically Thiobacillus ferrooxidans show maximum of activity at pH
between 2 and 4. Often it is assumed that Michaelis-Menten factor
fM = (1 + lob’-pH + 10pH-b2)-1 where
can be used to describe a pH dependence of bacterial
derived for enzymatic reactions [BaO], [Se]. Apart
oxidation involves also other processes which modify
Wb, (2.38)
oxidation . Formula (2.38) has been
from enzymatic reactions, bacterial
kinetics of enzymatic reactions.
Expression (2.38) has its maximum for pH =bm=(bl +b,)/2 and goes to zero for pH
less than b, and greater than b,. For br =2.2 and b2=2.4 it describes quite well the known
property that T. ferroxidans are chemically active for low pH values with a maximum at
pH=b,=2.3. By introducing the requirement that at the maximum B@H =bm) = 1 we
obtain
B@H) = (l+lObl-bm + 10bm-b2) (1 + 10b’-pH + 10”H-b2)-‘. (2.39)
As an alternative one could also use B(pH) in the form
B’(PW = P@W” .
34
(2.40)
The last formula introduces an adjustable parameter n which provides some flexibility for
describing the quantitative features of pH dependence when more detailed experimental data
become available. The problem of detailed pH dependence of bacterial activity merits further
experimental work. It is also important to know that Thiobacillus ferrooxidans show a large
degree of adaptability and, if grown at very low pH values, they may oxidize pyrite at
significant rates at pH values below 2 [Su].
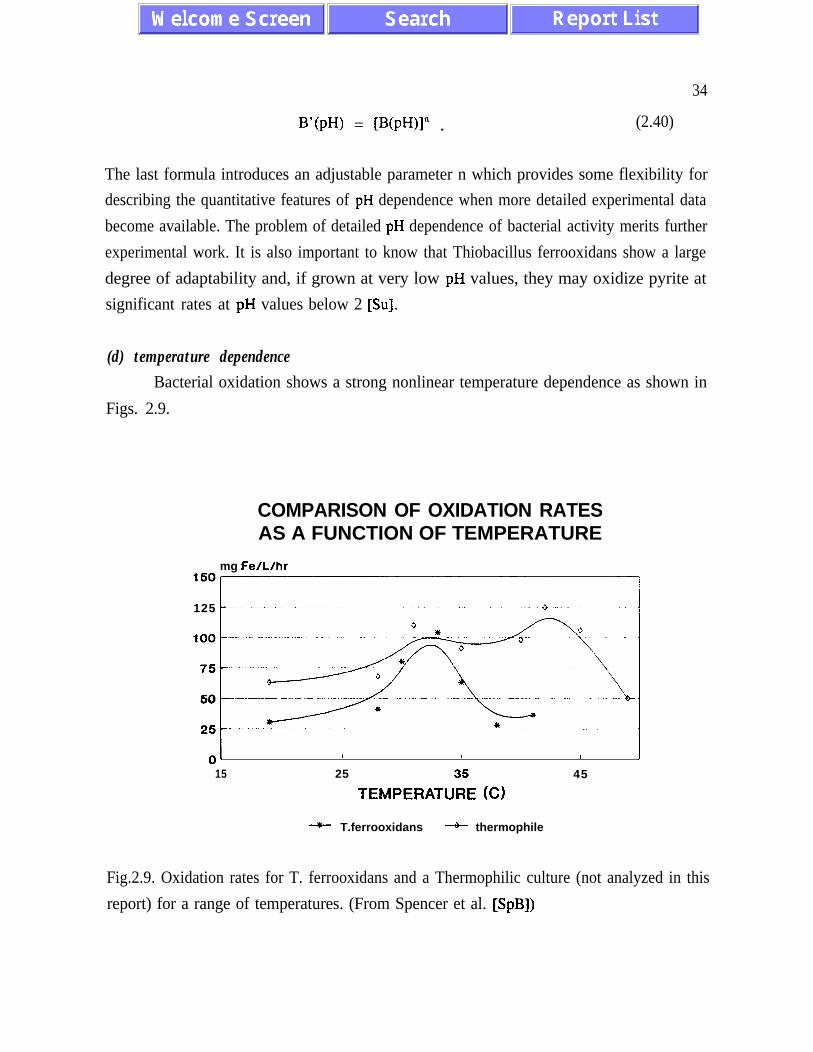
(d) temperature dependenceBacterial oxidation shows a strong nonlinear temperature dependence as shown in
Figs. 2.9.
COMPARISON OF OXIDATION RATESAS A FUNCTION OF TEMPERATURE
mg Fe/L/hr
-OS125
OL I I I I
15 25
TEMPEFM”3R5E (C)
45
-*- T.ferrooxidans -+- thermophile
Fig.2.9. Oxidation rates for T. ferrooxidans and a Thermophilic culture (not analyzed in this
report) for a range of temperatures. (From Spencer et al. [SpB])

35
Different strains of Thiobacillus ferrooxidans show sharp maxima of activity at
temperatures between 30°C and 40°C. We use the formula
B(T) = exp [- c(T-T,,)‘.~ ] (1 - th [-d(T-T,,J3] > . (2.41)
B(T) has a maximum at T=T, . The factor (1 - th(-d(T-Ta3) accounts for the observed
asymmetry of temperature dependence and for the sharp decrease in bacterial activity for
temperatures higher than T, . A good agreement with experimental data is obtained for
c=O.O5/K* and d=0.005/K3 - see paragraph 4.0.0 for further discussion.
There are studies which use the Arrhenius expression to describe temperature
dependence of bacterial activity (Bailay and Ollin ‘[BaO] and [Se]). The main deficiency of
the Arrhenius formula in application to bacterial processes is its inability to account for the
observed maxima in bacterial activity. It assumes that the bacterial activity is proportional
to enzymatic activity for which the Arrhenius expression can be applied. It does not take into
account, however, the fact that bacterial activity depends also on membrane permeability and
other cell properties which cannot be described by the Arrhenius expression. The membrane
permeability often changes faster than exponentially with temperature (see Otwinowski and
Paul [OtP], for example) and for this reason we use Gaussian and hyperbolic functions.
W21p2,/dt = -( Wk2,(T,, [W) WV WFW [021Fe2’l (2.42)
The efficiency of the bacterial oxidation process depends on the bacterial chemical activity
and the population growth. So far we did not model the population growth. For practical
reasons, controlling bacterial population is an important aspect of acid drainage. A model
for population growth under different physico-chemical conditions may be an important tool
for both predicting and preventing acid rock drainage.
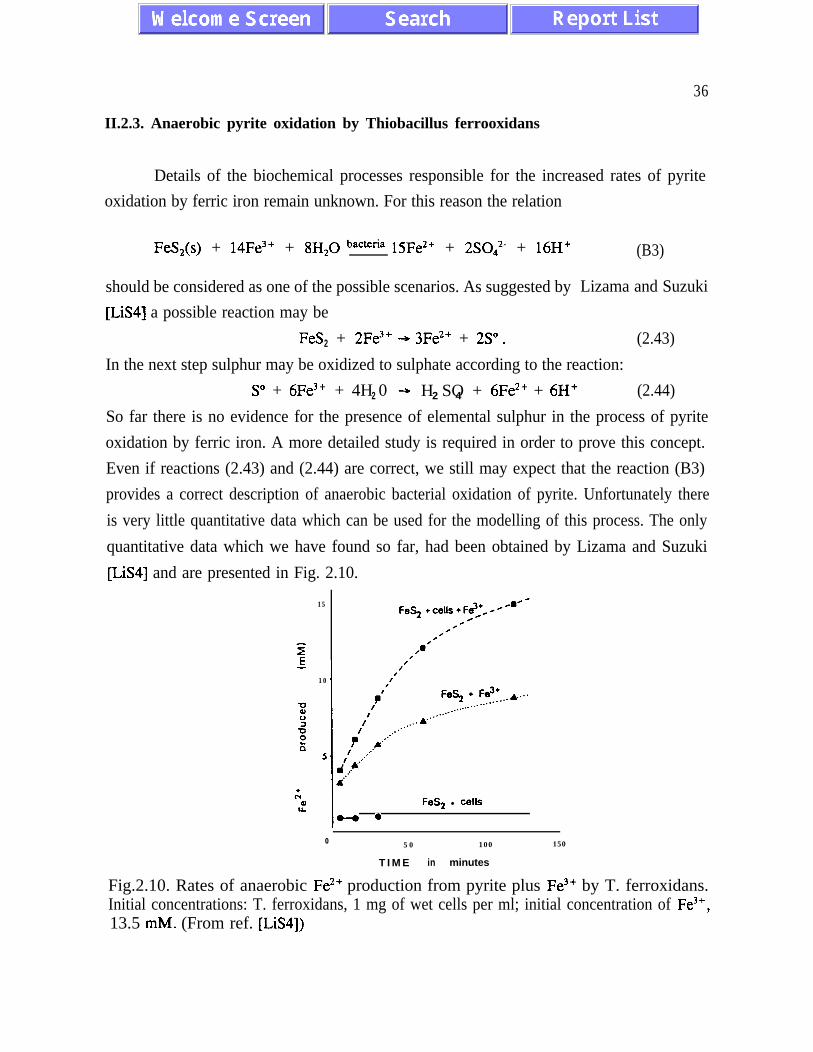
36
II.2.3. Anaerobic pyrite oxidation by Thiobacillus ferrooxidans
Details of the biochemical processes responsible for the increased rates of pyrite
oxidation by ferric iron remain unknown. For this reason the relation
Fe&(s) + 14Fe3’ + 8H,O bacteria lSFe*+ + 2S04*- + 16H+
should be considered as one of the possible scenarios. As suggested by
[LiS4] a possible reaction may be
FeS 2 + 2Fe3’ --, 3Fe*’ + 2s” .
(B3)
Lizama and Suzuki
(2.43)
In the next step sulphur may be oxidized to sulphate according to the reaction:
So + 6Fe3+ + 4H 02 + H SO + 6Fe*+ + 6H+2 4 (2.44)
So far there is no evidence for the presence of elemental sulphur in the process of pyrite
oxidation by ferric iron. A more detailed study is required in order to prove this concept.
Even if reactions (2.43) and (2.44) are correct, we still may expect that the reaction (B3)
provides a correct description of anaerobic bacterial oxidation of pyrite. Unfortunately there
is very little quantitative data which can be used for the modelling of this process. The only
quantitative data which we have found so far, had been obtained by Lizama and Suzuki
[LiS4] and are presented in Fig. 2.10.
15
10
.
I- = FeS, l cells
0 50 100 150
T I M E in minutes
Fig.2.10. Rates of anaerobic Fe*’ production from pyrite plus Fe3’ by T. ferroxidans.Initial concentrations: T. ferroxidans, 1 mg of wet cells per ml; initial concentration of Fe3’,13.5 mM. (From ref. [LiS4])
37
Fig. 2.10 shows that the Fe2+ production from Fe3’ and pyrite is faster in the presence of
bacterial cells.
The order of reaction (B3) with respect to ferric iron, dependence on bacteria
concentration and ferrous iron have not yet been analyzed We use the formula
d[Fe*+],,,/dt = (15S/14V) k,, (T,,[cell])B(T) B(pH) [Fe3+]3’5[H+]-1’2 (2.45)
(which will be justified later in mathematical analysis in Chapter IV). The value of
k3,,(Tm,[cell]) is estimated as
k3dL, WI) = 2.18 x lOa Mo.9 lmw2 s-’ at lmg of cells/lml (2.46)
We also use the same coefficients B(T) and B@H) as for the other two bacterial reactions.
The rate of anaerobic pyrite oxidation by bacteria is significantly greater than the
rates observed for anaerobic oxidation of pyrite by ferric iron in the absence of bacteria. At
low pH values and high concentrations of ferric iron the anaerobic bacterial oxidation is a
very significant process responsible for acidic drainage. Recently it has been demonstrated
that T. ferroxidans may grow under anaerobic conditions. The rates of bacterial growth
increase with concentration of carbon dioxide [Se], [Su], [Pr]. This indicates that controlling
the levels of carbon dioxide inside waste rock piles may be almost as important as controlling
the levels of oxygen. It also indicates that the bacterial oxidation of pyrite may be observed
deep inside waste rock piles where oxygen levels are low. We do not know, however, of any
field tests which would analyze this possibility. In laboratory tests nutrients containing
phosphorus and nitrogen are used. We do not have, however, quantitative data on the effect
of phosphorus and nitrogen concentration on the bacterial oxidation rates. This aspect may
merit further experimental and modelling studies whose findings may be particularly
significant for ARD from apatite bearing rocks.
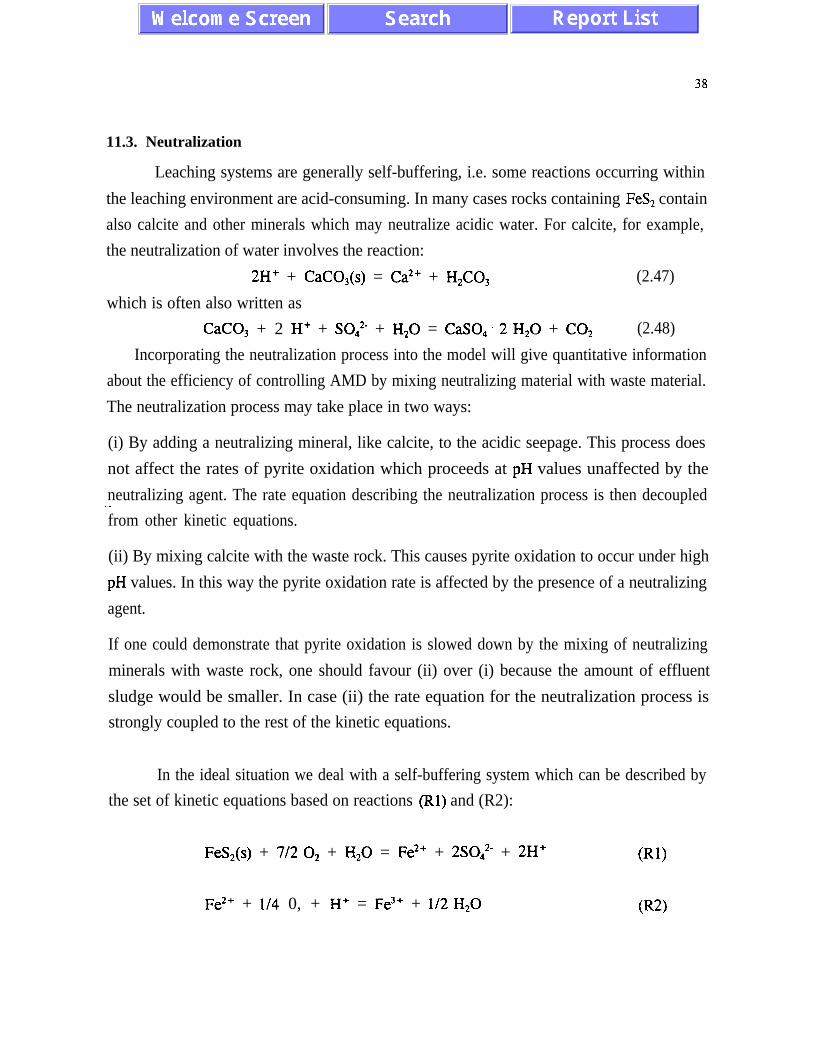
38
11.3. Neutralization
Leaching systems are generally self-buffering, i.e. some reactions occurring within
the leaching environment are acid-consuming. In many cases rocks containing FeS, contain
also calcite and other minerals which may neutralize acidic water. For calcite, for example,
the neutralization of water involves the reaction:
2H+ + CaCO,(s) = Ca2+ + H2C03 (2.47)
which is often also written as
CaCO, + 2 H+ + SOa2- + H,O = CaSO, ‘2 H,O + CO2 (2.48)
Incorporating the neutralization process into the model will give quantitative information
about the efficiency of controlling AMD by mixing neutralizing material with waste material.
The neutralization process may take place in two ways:
(i) By adding a neutralizing mineral, like calcite, to the acidic seepage. This process does
not affect the rates of pyrite oxidation which proceeds at pH values unaffected by the
neutralizing agent. The rate equation describing the neutralization process is then decoupled._from other kinetic equations.
(ii) By mixing calcite with the waste rock. This causes pyrite oxidation to occur under high
pH values. In this way the pyrite oxidation rate is affected by the presence of a neutralizing
agent.
If one could demonstrate that pyrite oxidation is slowed down by the mixing of neutralizing
minerals with waste rock, one should favour (ii) over (i) because the amount of effluent
sludge would be smaller. In case (ii) the rate equation for the neutralization process is
strongly coupled to the rest of the kinetic equations.
In the ideal situation we deal with a self-buffering system which can be described by
the set of kinetic equations based on reactions (Rl) and (R2):
FeS,(s) + 7/2 O2 + H,O = Fe2’ + 2SOd2- + 2H+ (Rl)
Fe2+ + l/4 0, + H+ = Fe3’ + l/2 H,O (R2)
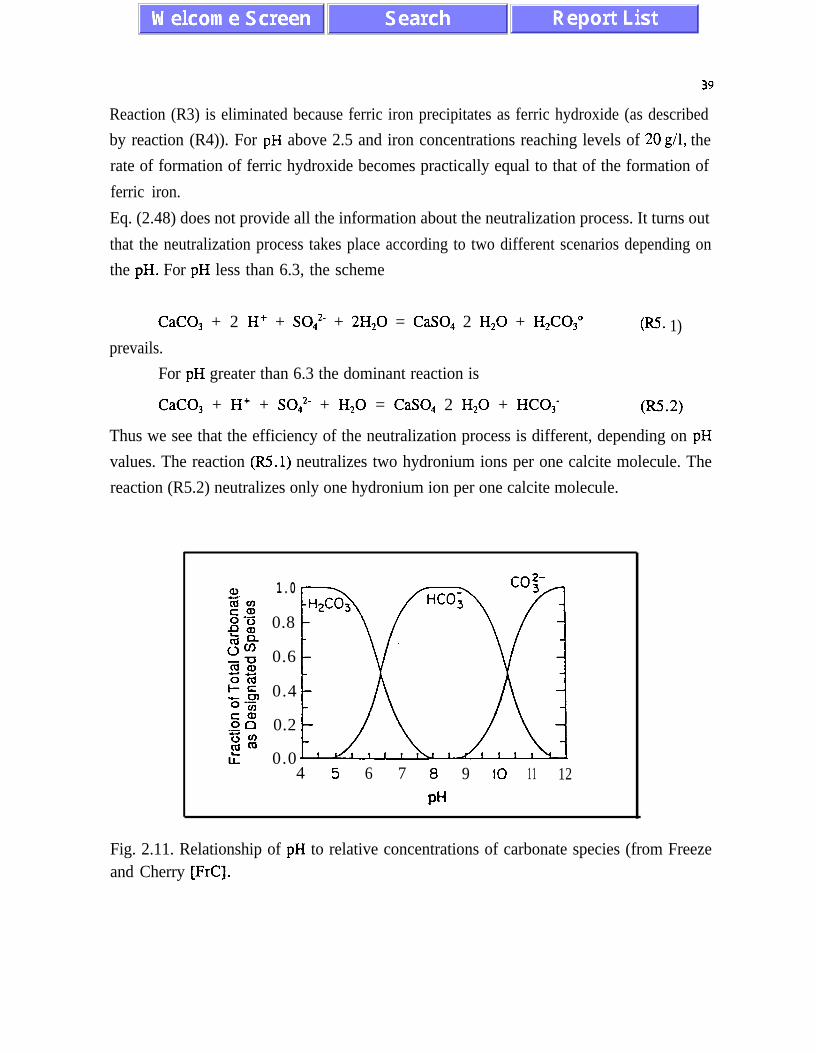
39
Reaction (R3) is eliminated because ferric iron precipitates as ferric hydroxide (as described
by reaction (R4)). For pH above 2.5 and iron concentrations reaching levels of 20 g/l, the
rate of formation of ferric hydroxide becomes practically equal to that of the formation of
ferric iron.
Eq. (2.48) does not provide all the information about the neutralization process. It turns out
that the neutralization process takes place according to two different scenarios depending on
the pH. For pH less than 6.3, the scheme
CaCO, + 2 Hf + SOa2- + 2H,O = CaSO, 2 H,O + H,CO,”
prevails.W. 1)
For pH greater than 6.3 the dominant reaction is
CaCO, + H+ + SOd2- + H,O = CaSO, 2 H,O + HCO,- W-2)
Thus we see that the efficiency of the neutralization process is different, depending on pH
values. The reaction (R5.1) neutralizes two hydronium ions per one calcite molecule. The
reaction (R5.2) neutralizes only one hydronium ion per one calcite molecule.
1.0
0.8
0.6
0.4
0.2
0.04 5 6 7 0 9 10 11 12
PH
Fig. 2.11. Relationship of pH to relative concentrations of carbonate species (from Freezeand Cherry [FrC].

40
Iron carbonates provide no net consumption of acid [Lap], [MoC]. The initial dissolution of
one mole of iron carbonate consumes one or two moles of acid:
FeCO, + H+ = HCO _ + Fe*’3 7 (2.49)
FeCO, + 2H+ = H,CO,- + Fe” . (2.50)
Under environmental conditions one mole of ferrous iron released is oxidized to ferric iron
which precipitates as ferric hydroxide. The oxidation and precipitation yield two moles of
acid. Thus, iron carbonate does not contribute to acid consumption.

41
II.4. Solubility of oxygen in water
In the previous paragraphs, we have summarized the experimental results on the
temperature dependent rates of the chemical and biological reactions involved in pyrite
oxidation. Chemical factors are primarily responsible for the generation of acid and
dissolved metal ions. Reaction rates are also controlled by several physical factors like
temperature, solubility of oxygen in water, rates of energy and mass transport, surface
properties of rock, etc.
Inside large waste rock piles the oxygen concentration varies as a function of the
distance from the pile boundaries. Near the pile boundaries the oxygen concentration in the
gas phase is about 21% and may decrease to almost 0% far from the boundaries. This
nonhomogeneous oxygen distribution depends on the rates of chemical reactions and on the
rates of mass and energy transport through a porous pile. When the pile porosity is small,
mass transport is slow and reaction rates are greatly reduced because of the small
concentration of oxygen inside a pile. In this way the reaction rates are controlled by the
mass transport rates. We leave a detailed analysis of the interplay between chemical,
biological and physical factors for a future project. To construct a realistic waste rock model
we need, however, quantitative information on the reaction rates as a function of oxygen
concentration.
Table I presents data on the concentrations of oxygen dissolved in water, [0,] as a
function of the temperature and oxygen concentration in the gas phase, [O,],,. The
temperature values correspond to those observed in waste rock piles. [0,] increases slightlyfaster than linearly with [OJ,, at constant temperature. At 60°C and [O&=21 %, [OJ is
less than 50% of its value at 10°C. In this way we observe a competitive effect of
temperature and dissolved oxygen concentration on the reaction rates. A detailed analysis
of temperature dependence of reaction rates will be presented in our numerical analysis.As we mentioned before, the values of activation energies for pyrite oxidation by
dissolved oxygen have been determined by compensating for the effect of decreasing [0,]
with increasing temperature. We can thus use the activation energy values without further
corrections.
The values in Table I are obtained for water without any dissolved iron or sulphate
ions. Unfortunately we do not have any experimental data on the concentrations of
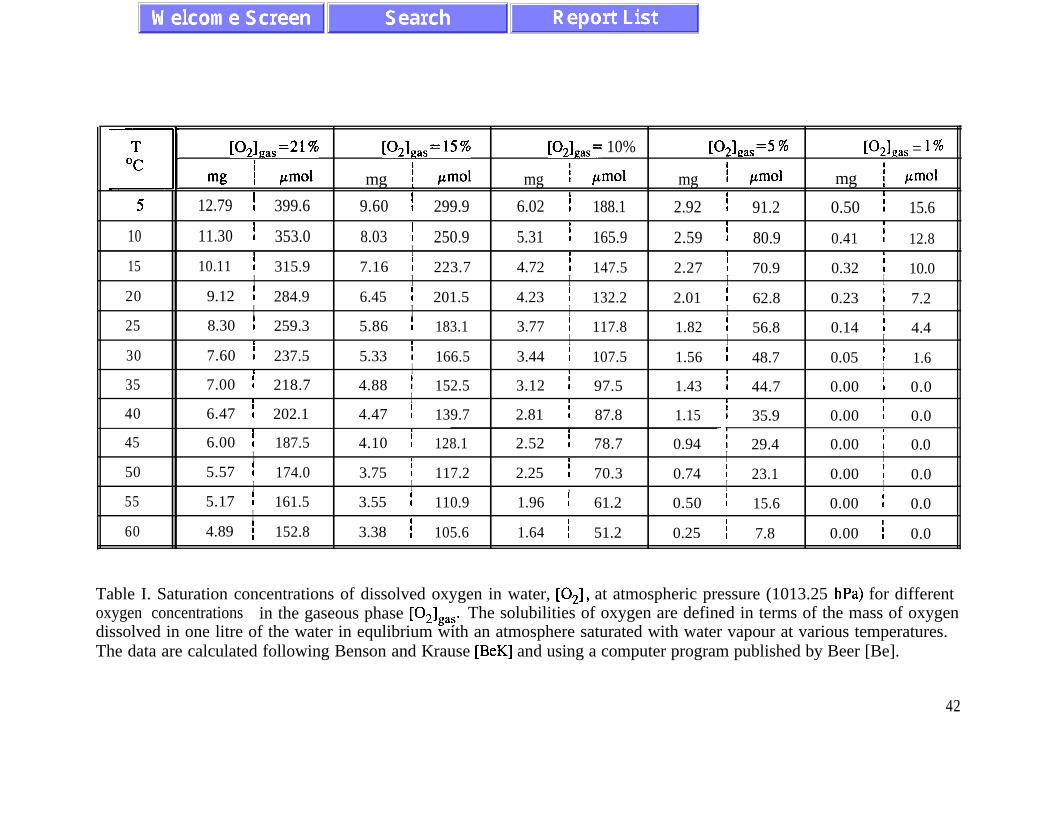
T7. [0,],,,=21% [O&,=15% [O,],,,= 10% [O&=5 % F&s = 1%OC I
mg i pm01 Img ! pm01 mg i pm01 mg I pm01 Img ! pm01I I I I I
5 12.79 : 399.6 9.60 ! 299.9 6.02 I 188.1 2.92 ! 91.2 0.50 I 15.6I I I I 1
10 11.30 I 353.0 8.03 : 250.9 5.31 : 165.9 2.59 : 80.9 0.41 f 12.8I I I 1 I
15 10.11 : 315.9 7.16 1 223.7 4.72 I 147.5 2.27 I 70.9 0.32 1 10.0I I I I I
20 9.12 I 284.9 6.45 ! 201.5 4.23 1 132.2 2.01 I 62.8 0.23 ! 7.2I I I I I
25 8.30 i 259.3 5.86 1 183.1 3.77 I 117.8 1.82 ! 56.8 0.14 I 4.4I I I I I
30 7.60 : 237.5 5.33 I 166.5 3.44 I 107.5 1.56 i 48.7 0.05 1 1.61 I 1 1 I
35 7.00 : 218.7 4.88 t 152.5 3.12 : 97.5 1.43 : 44.7 0.00 I 0.0I I 1 I 1
40 6.47 ! 202.1 4.47 I 139.7 2.81 : 87.8 1.15 : 35.9 0.00 I 0.0I 1 I
45 6.00 : 187.5 4.10 i 128.1 2.52 ! 78.7 0.94 pi 29.4 0.00 i 0.0I I I I I
50 5.57 I 174.0 3.75 : 117.2 2.25 : 70.3 0.74 I 23.1 0.00 I 0.0I I , I I
55 5.17 ; 161.5 3.55 I 110.9 1.96 : 61.2 0.50 I 15.6 0.00 I 0.0I
60 4.89 i 152.8 3.38 i 105.6 1.64 i 51.2 0.25 i 7.8 0.00 i 0.0
Table I. Saturation concentrations of dissolved oxygen in water, [02] , at atmospheric pressure (1013.25 hPa) for differentoxygen concentrations in the gaseous phase [O,]Oras. The solubilities of oxygen are defined in terms of the mass of oxygendissolved in one litre of the water in equlibrium with an atmosphere saturated with water vapour at various temperatures.The data are calculated following Benson and Krause [BeK] and using a computer program published by Beer [Be].
42
43
dissolved oxygen in the presence of iron and sulphate ions at various pH values. We will
simply assume that the maximum concentration of oxygen dissolved in water does not depend
on pH. This assumption is supported by the fact that the order of reaction (R3) with respect
to oxygen does not depend on pH, as discussed by McKibben and Barnes [McK].
In our numerical analysis we use values of [O,] instead of [O,],,, used previously in
most experimental and modelling studies. This choice is motivated by a strong dependence
of [0,] on temperature, as illustrated by data in Table I. A future waste rock model should
use an empirical formula describing the nonlinear dependence of [OJ on temperature for
various concentrations of [OJ,, in waste rock piles.
44
IILMAT~~TICAL ANALYSIS 0~ CHEMICAL KINETICS
This chapter presents results of our mathematical analysis of a set of kinetic equations
constructed on the basis of experimental data obtained independently for reactions (Rl)-(R5)
and B(l)-(B3), as discussed in previous paragraphs. The purpose of our analytical and
numerical analysis is to establish the relative importance of individual factors responsible for
acid rock drainage. When useful, we also derive closed form formulae which may be helpful
in designing and interpreting some new experiments. Our kinetic equations are ordinary
differential equations and we do not analyze explicitly the processes of mass and energy
transport, which after a sufficiently long time control reaction rates in large waste rock piles.
The only physical factors involved in the present analysis are temperature and oxygen
concentration. Mass and energy transport will be described in our future project by means
of nonlinear partial differential equations which will describe the spatially nonhomogeneous
distribution of oxygen, water, reaction products and temperature as a function of physical and
mineralogical properties such as pile porosity, oxygen diffusion and convection, thermal
conductivity, water infiltration rates, water evaporation, rock neutralizing potential, etc.
We want to obtain quantitative results which would allow us to understand better the
complex chemistry of ARD as a function of two physical parameters: concentration of
dissolved oxygen and temperature. Most experimental results were obtained for small samples
of less than ten grams of pyrite and times shorter than ten hours. We use the available
experimental data to obtain information on chemical and physical behaviour of greater
masses of pyrite and water during several weeks. This initial information should be useful
for a future reliable waste rock model. After achieving the necessary understanding ‘of the
chemical processes involved, a waste rock model should concentrate on the physical and
geochemical processes and should provide the understanding of physico-chemical behaviour
of much greater masses of waste rock (greater than 10’ tons) over time intervals of several
years.
Discharge of contaminants from waste rock sites shows temporal variations. One of
the key questions is whether these variations are related to (i) an oscillatory nature of
45
chemical and biological reactions or (ii) result from an interplay between local chemical
processes and mass and energy transport. In case (i), a future model including transport
processes would be very complicated and one would have to use sophisticated numerical
methods to obtain reliable results. If no chemical oscillations are detected for a set of
ordinary differential equations, we will be able to reduce the number of coupled nonlinear
differential equations and deal with a relatively simple model.
We have analyzed acid generation, discharge of iron ions, oxygen and water
depletion for different scenarios corresponding to various situations in waste rock piles and
our results are presented in Sections III. 1 and 11112.
III. 1. Pyrite oxidation without bacteria and without neutrahzation (Reactions (Rl), (R2) and(R3) at low pH values and reactions (Rl), (R2) and (R4) at high pH values).
III.2. Pyrite oxidation with neutralization in the absence of bacteria (reactions (Rl), (R2),(R4) and (R5).
Bacterial oxidation is analyzed in Chapter IV.
Numerical results are presented for different values of temperature, pH and
concentration of dissolved oxygen. Numerical analysis has been performed for two types of
conditions:
(i) when oxygen concentration is constant in time
(ii) when oxygen concentration evolves in time from an initial valuecorresponding to the atmospheric conditions
Condition (i) simulates the situation near the pile boundary. Condition (ii) simulates the
situation far from the boundaries at the initial stage after a waste rock pile is formed.
The main results of our analysis can be summarized by the following points:
1. The coupled chemical reactions do not produce temporal oscillations of concentrations of
final and transient products. No chaotic behaviour or limit cycles are detected.
2. At low pH below four, the rate of oxidation of ferrous iron (Fe2+) to ferric iron (Fe3+)
controls the rate of pyrite oxidation by ferric iron. This is a qualitative feature known before.
46
We have obtained a closed form formula for the rate of pyrite oxidation by ferric iron,
expressed in terms of the rate constant governing the oxidation of ferrous iron.In the absence
of bacteria the concentration of ferric iron does not affect qualitative features of temporal
changes of concentrations of other species.
3. The oxidation of ferrous iron leads to concentrations of ferric iron given by the quasi-
equilibrium principle applied to the chemical network.
4. For constant in time oxygen concentrations at pH values between four and seven, and
without neutralization, the rate of pyrite oxidation is practically time independent. The
amount of oxidized pyrite and concentrations of iron, hydronium and sulphate ions increase
linearly with time.
5. Application of neutralizing compounds leads to fast rates of oxidation of ferrous iron to
ferric iron and subsequent formation of ferric hydroxide which precipitates and slows the
oxidation process when pH is greater than four..
6. At high pH values the concentration of ferrous iron converges to a quasi-equilibrium value
which increases when pH values become lower.
7. We estimated the amount of neutralizing material necessary to maintain high pH values.
There is a stoichiometric incompatibility between acid-generating processes and acid-
neutralizing processes. The values obtained for quantities of neutralizing material are different
from the values suggested in the literature.
8. In every case we have obtained quantitative results for pyrite oxidation rates as a function
of oxygen concentration, temperature, the ratio between active surface area and the volume
of water, for various initial conditions. In our computation we have used existing data on the
concentration of oxygen dissolved in water, which decreases when temperature increases.
Despite this, in the absence of bacteria the pyrite oxidation rate increases monotonically with
temperature. This temperature effect is dramatic - for temperatures between 273K and 323K
the rate of pyrite oxidation accelerates ten times per 20K.
9. We have derived simple scaling relations which allow the translation of results obtained
for one set of entry data, into results for a different set of entry data (without computation).

47
10. The results of our analysis are essential for establishing the hierarchy of characteristic
time scales for chemical and biological reactions and transport processes. This knowledge
should be used in a future comprehensive waste rock model. These results can also be used
for modelling of acid generation at underwater disposal sites.
Before we proceed with presenting the results of our numerical analysis, we briefly
discuss in the next paragraph the numerical values of parameters governing the rates of
individual chemical reactions. We include this analysis because some papers which provide
fundamental experimental data, contain erroneous values of rate constants and other
parameters essential for our study.
III.0. Preliminary analysis of experimental data on abiotic oxidation
In Chapter II we have reviewed experimental results pertaining to the elementary
48
chemical and biological processes contributing to pyrite oxidation and responsible for acidic
drainage. Unfortunately, some papers contain erroneous values of rate constants for chemical
reactions. The purpose of this section is to determine the correct numerical values of
chemical and physical parameters. Experimental results are reproduced by solving kinetic
differential equations with proper values of rate constants and other parameters. Both
numerical and analytical results are presented.
III.O.1. Pyrite oxidation by dissolved oxygen
Rate equations for the reaction (Rl) depend on the pyrite surface area, S and the
volume, V of water with dissolved oxygen.
dwcR1, = _ 7sdt
+m KJ,l”*
d[Fe2+l(R,, = 2 k
dt" ,m [q"*
(3.0.1)
(3.0.2)
For the dissolved oxygen concentration in molar units and the specific rate in units of moles
of pyrite cm‘* min-‘, MC Kibben and Barnes [McK p. 15141 give the rate constant value of
10d.n moleso.’ crna.’ min-’ at 30°C. This value is incorrect (by 3 orders of magnitude) and
does not reproduce McKibben and Barnes’s experimental results. (This has also been
pointed out by Nicholson mi], p. 121). The correct value of k, at To=303 K and [O,] in units
M = mol/litre, is:
k&7” =2.83.10-8M”2m -*s -’ . (3.0.3)
We will use chemical units M=mol/litre and physical units following the SI standard.
Figs. 3.0.1(a) and 3.0.1(b) compare experimental data obtained by McKibben and

49
Barnes [McK p. 15 131 with our solution of eq.(3.0.2) . We have used the rate constant given
by (3.0.3).
time (min)
(4
2.00e-6
0.00 60000.00 120000.00S
W
3.0.1. (a) Experimental data WcK, Fig.61 on the oxidation of pyrite at 303 K,[0,] = 1.260 mM, pH= 1.89. Line indicates fit of linear regression equation used todetermine rates. (b) Plot of the solution to eq. (3.0.2) giving the concentration of ferrousions (in moles per litre) as a function of time. At constant temperature and constant oxygenconcentration, the solution has the form given by eq. (3.0.4). Horizontal axis: time(120000s=2OOm); vertical axis: concentration (millimolar in Fig. (a), molar in Fig. (b),M = mol/litre.
For the time independent concentration of dissolved oxygen, eq. (3.0.2) has a trivial solution
[t;e*+(t)] = [Fe*+(tJ] + ;~,(nro*l’” (t -tJ (3.0.4)
We want to mention again, that Nicholson et al. [NiG] give the Longmuir-type rate
expression based on a profound analysis of the adsorption mechanism involved in the process
of oxidation by dissolved oxygen. Both formulae reproduce experimental data within an
experimental error. While the Longmuir expression is more appropriate from a general

50
physical and chemical point of view, we prefer to use expressions (3.0.1) and (3.0.2)
because they have the same form of a power law as other expressions for abiotic oxidation
and it is easier to analyze some scaling relations (see paragraph III. 1.3).
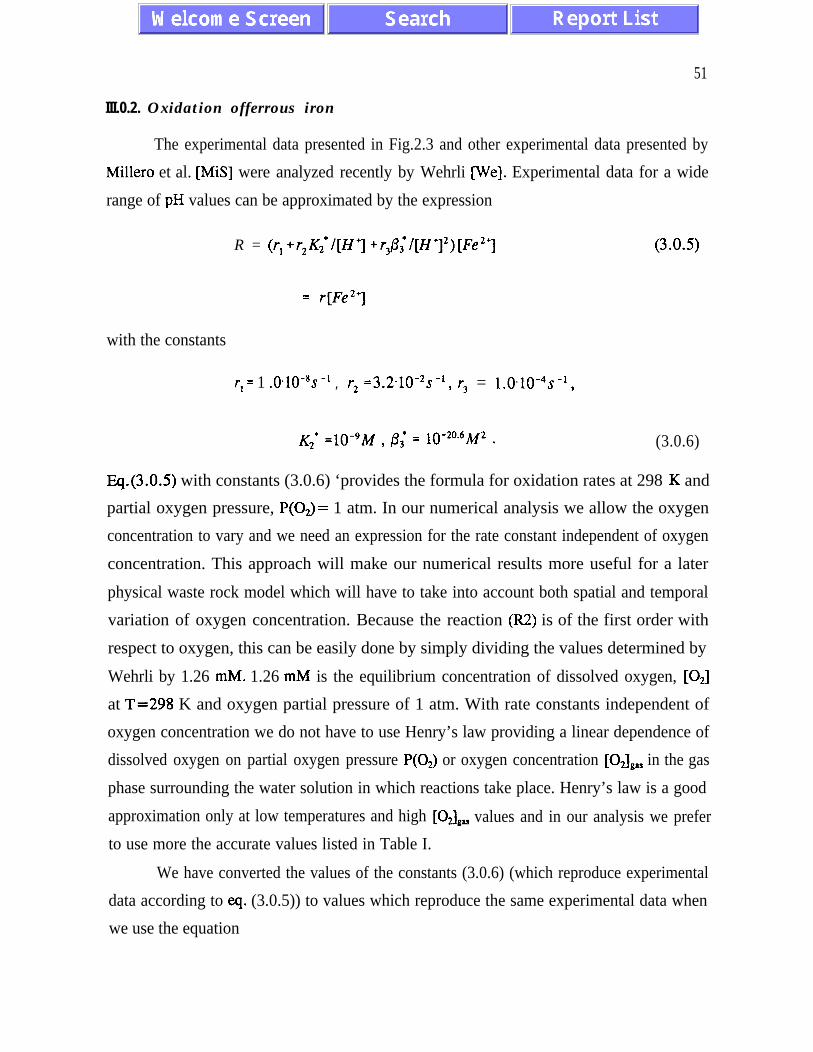
51
III.0.2. Oxidation offerrous iron
The experimental data presented in Fig.2.3 and other experimental data presented by
Miller0 et al. [MIS] were analyzed recently by Wehrli we]. Experimental data for a wide
range of pH values can be approximated by the expression
R = (rl +r,K;l[H*] +r3/3;/[H’]2)[Fe2’] (3.05)
= r[Fe2+]
with the constants
r, = 1 .o~lo-*s -’ , r2 =3.2.10-2s-i, r3 = 1.0.10-4s-1,
K2* =1(-J9M , p; = 10-20.6M2 . (3.0.6)
Eq.(3.0.5) with constants (3.0.6) ‘provides the formula for oxidation rates at 298 K and
partial oxygen pressure, P(Oa= 1 atm. In our numerical analysis we allow the oxygen
concentration to vary and we need an expression for the rate constant independent of oxygen
concentration. This approach will make our numerical results more useful for a later
physical waste rock model which will have to take into account both spatial and temporal
variation of oxygen concentration. Because the reaction (R2) is of the first order with
respect to oxygen, this can be easily done by simply dividing the values determined by
Wehrli by 1.26 mM. 1.26 mM is the equilibrium concentration of dissolved oxygen, [OJ
at T=298 K and oxygen partial pressure of 1 atm. With rate constants independent of
oxygen concentration we do not have to use Henry’s law providing a linear dependence of
dissolved oxygen on partial oxygen pressure P(0,) or oxygen concentration [021gas in the gas
phase surrounding the water solution in which reactions take place. Henry’s law is a good
approximation only at low temperatures and high [OJ,, values and in our analysis we prefer
to use more the accurate values listed in Table I.
We have converted the values of the constants (3.0.6) (which reproduce experimental
data according to eq. (3.0.5)) to values which reproduce the same experimental data when
we use the equation

52
d[Fe3+1’Ra = (k,,(T) + k,,(T)[H+]-’ + k,3(T)[H+]-2)[02] [Fe2+] .dt
The rate constants have the form
(3.0.7)
E,,V-rJ&,i(r> = &JTO)eT , i =1,2,3; (3.0.8)
with the values
k,(T,) = 1.30.10-5M-‘s -’ , k,,(TJ = 1.41.10-8~ -’ , h,(T) = 3.78.10-14Ms -’ . (3.0.9)
at T,=303 K. The values of activation energies &r, b2 and b3 are given by eqs. (2.19)-
(2.21).
We define
k(T) = qr> + &*(?I w+1-’ + &,u-9 CH+]-* (3.0.10)
as an effective pH dependent rate coefficient. Fig.3.0.2a presents the experimental results
compiled by Wehrli, and the products k2(T)[02] as a function of pH for various
concentrations of dissolved oxygen and various temperatures.
-2
-6
I-
-8 --OI I , , , ,
2 3 4 5 6 7 8 9
PH
(a)
-8.004.00PH
8.00
('N

53
-8.00
0.00 4.00PH
8.00 4.00PH
8.00
w (4Fig. 3.0.2. (a) The oxidation rate coefficient r for [0,] = 1.26 mM at T=298 K. Open circlesrepresent data by Singer and Stumm [SiS], dots are data from Miller0 et al. @4iS]. The solidline was calculated with eq. (3.0.5) by Wehrli we]. The diagram reproduced from p. 326in [we]. (b) k,[OJ at T=298K and [0,] = 1264pM corresponding to P(0,) = latm at 298K.(c) kZIOJ at T=283K and [O,] =353pM corresponding to P(0,) =0.2latm at 298K.(d) k2[02]at T=313K and [02]=202pM corresponding to P(O,)=0.2latm at 313K. (Horizontal axis:pH values; vertical axis: log (k,[O,]) in s-l).
The oxidation rates show a strong temperature dependence by accelerating about 3.5 times
per every 10 K increase in temperature. This temperature effect will be discussed more
extensively in paragraph 3.1.3, where scaling properties of time dependent solutions to the
kinetic equations are analyzed.
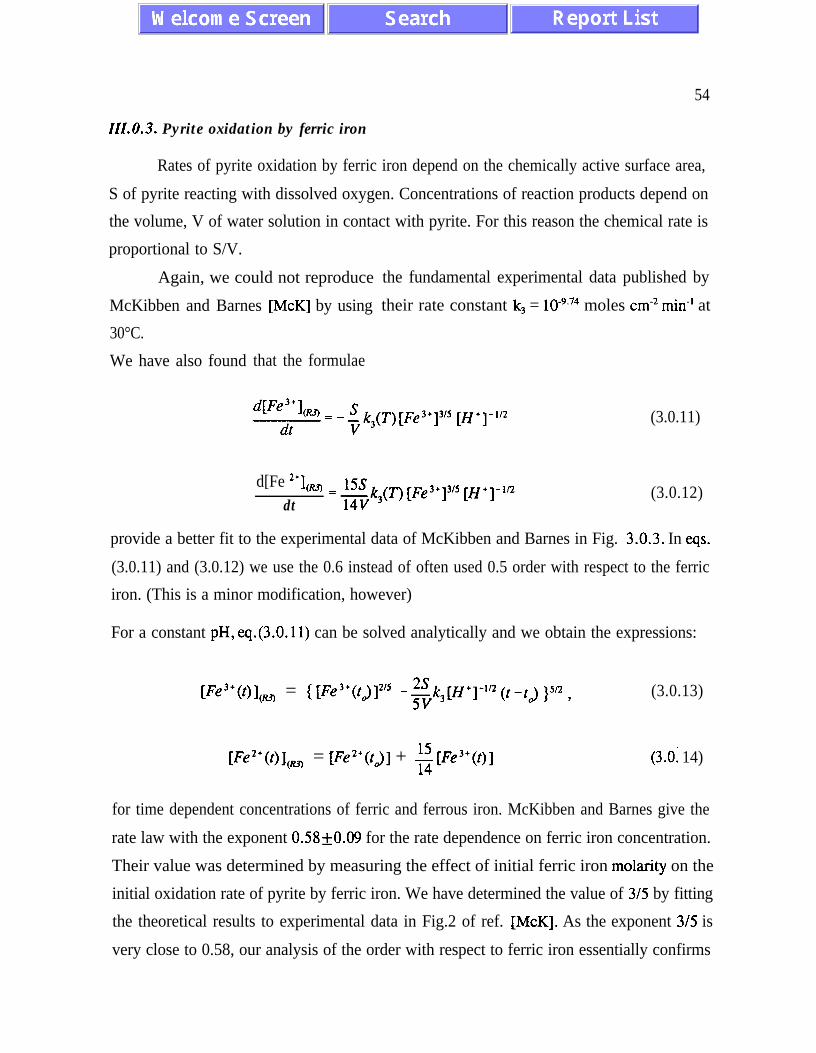
54
111.0.3. Pyrite oxidation by ferric iron
Rates of pyrite oxidation by ferric iron depend on the chemically active surface area,
S of pyrite reacting with dissolved oxygen. Concentrations of reaction products depend on
the volume, V of water solution in contact with pyrite. For this reason the chemical rate is
proportional to S/V.
Again, we could not reproduce
McKibben and Barnes [McK] by using
30°C.
We have also found
the fundamental experimental data published by
their rate constant k, = 10-9.74 moles cme2 min-’ at
that the formulae
d[Fe;;]m = _@)[Fe”]“S [fy]-1/2 (3.0.11)
d[Fe *+I (mdt
= gvk3(n [Fe3’]3/5 [H+]-112 (3.0.12)
provide a better fit to the experimental data of McKibben and Barnes in Fig. 3.0.3. In eqs.
(3.0.11) and (3.0.12) we use the 0.6 instead of often used 0.5 order with respect to the ferric
iron. (This is a minor modification, however)
For a constant pH, eq.(3.0.11) can be solved analytically and we obtain the expressions:
Fe3+Wl,, = { [Fe3+(tk,]2's -$c3[lZ+]-l~* (t-t> 15’2 , (3.0.13)
W2+(Ol, = [Fe2+(to)] + E [Fe3’(t)] (3.0: 14)
for time dependent concentrations of ferric and ferrous iron. McKibben and Barnes give the
rate law with the exponent 0.58kO.09 for the rate dependence on ferric iron concentration.
Their value was determined by measuring the effect of initial ferric iron molarity on the
initial oxidation rate of pyrite by ferric iron. We have determined the value of 3/5 by fitting
the theoretical results to experimental data in Fig.2 of ref. [McK]. As the exponent 3/5 is
very close to 0.58, our analysis of the order with respect to ferric iron essentially confirms
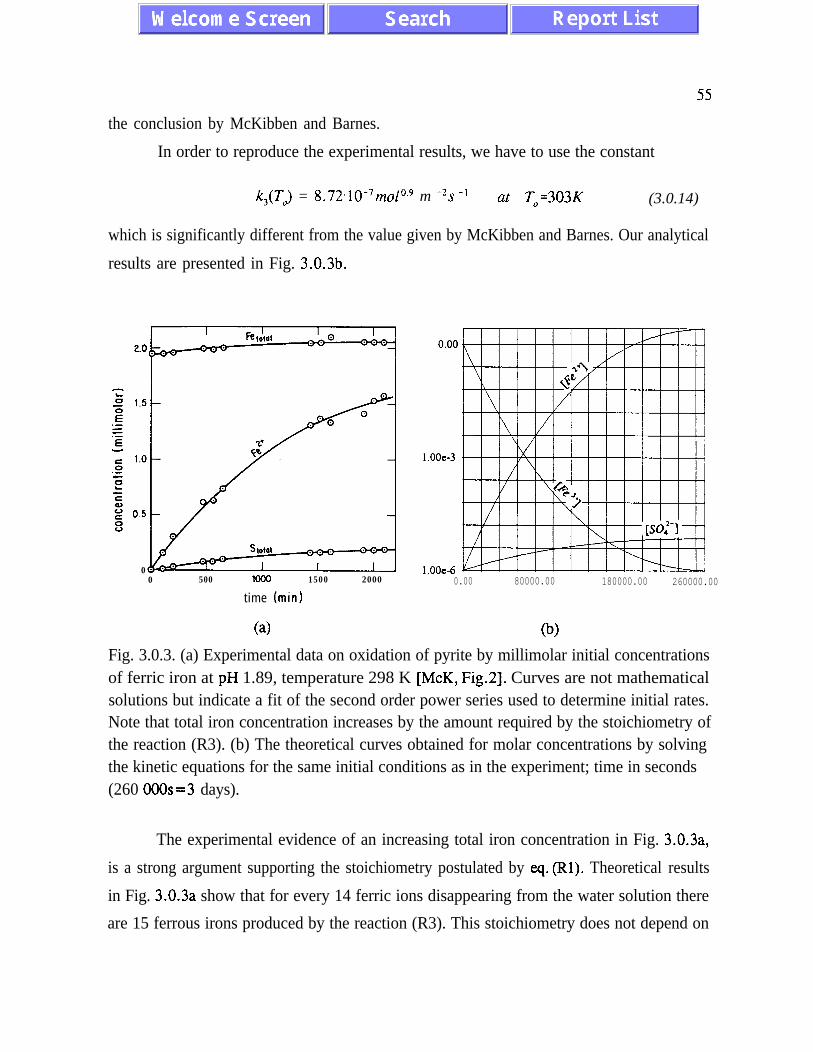
5.5
the conclusion by McKibben and Barnes.
In order to reproduce the experimental results, we have to use the constant
k,(T) = 8.72.10-7m010.9 m -*s -’ ut T0=303K (3.0.14)
which is significantly different from the value given by McKibben and Barnes. Our analytical
results are presented in Fig. 3.0.3b.
00 500 1000 1500 2000
t ime (min)
(a)
l.OOe-3
l.OOe-60.00 80000.00 180000.00 260000.00
0.9Fig. 3.0.3. (a) Experimental data on oxidation of pyrite by millimolar initial concentrationsof ferric iron at pH 1.89, temperature 298 K [McK, Fig.21. Curves are not mathematicalsolutions but indicate a fit of the second order power series used to determine initial rates.Note that total iron concentration increases by the amount required by the stoichiometry ofthe reaction (R3). (b) The theoretical curves obtained for molar concentrations by solvingthe kinetic equations for the same initial conditions as in the experiment; time in seconds(260 OOOs=3 days).
The experimental evidence of an increasing total iron concentration in Fig. 3.0.3a,
is a strong argument supporting the stoichiometry postulated by eq. (Rl). Theoretical results
in Fig. 3.0.3a show that for every 14 ferric ions disappearing from the water solution there
are 15 ferrous irons produced by the reaction (R3). This stoichiometry does not depend on
56
the hydronium ions concentration. The analytical solution (3.0.13) is valid only for constant
in time low pH values for which the reaction of oxidation of ferrous iron is very slow. The
relation (3.0.14) is valid for arbitrary conditions and must be satisfied by numerical solutions
when pH varies with time.
Eq.(3.0.13) also provides a prescription for measuring the effective reactive surface
area for rocks with pyrite. The experiment could use the relation
S=v ;;‘;; ([Fe3+(c&q2’5 -[Fe3+(l))2’5) . (3.0.15)
In an experiment under anaerobic conditions one would measure the difference between the
initial concentration of ferric iron, [Fe3+(t,)] and the final concentration of ferric iron
[Fe3+(t)] after a time interval (t-t,,) at constant pH values. At low temperatures and low pH
values the oxidation of ferrous iron even in the presence of oxygen can be neglected (in the
absence of bacteria) and the change in [Fe3+] is almost entirely due to oxidation of pyrite by
ferric iron. Under stirred conditions, the reaction should be completed after time
(3.0.16)
Thus the experiment should not last longer than 20-200 minutes for S/V between 1 m2/1 and
10 m2/1 and millimolar initial concentrations of Fe3+ at pH=2. Interpretation of experimental
results depends, of course, on a presence of compounds other than pyrite, which may also
react with ferric iron.
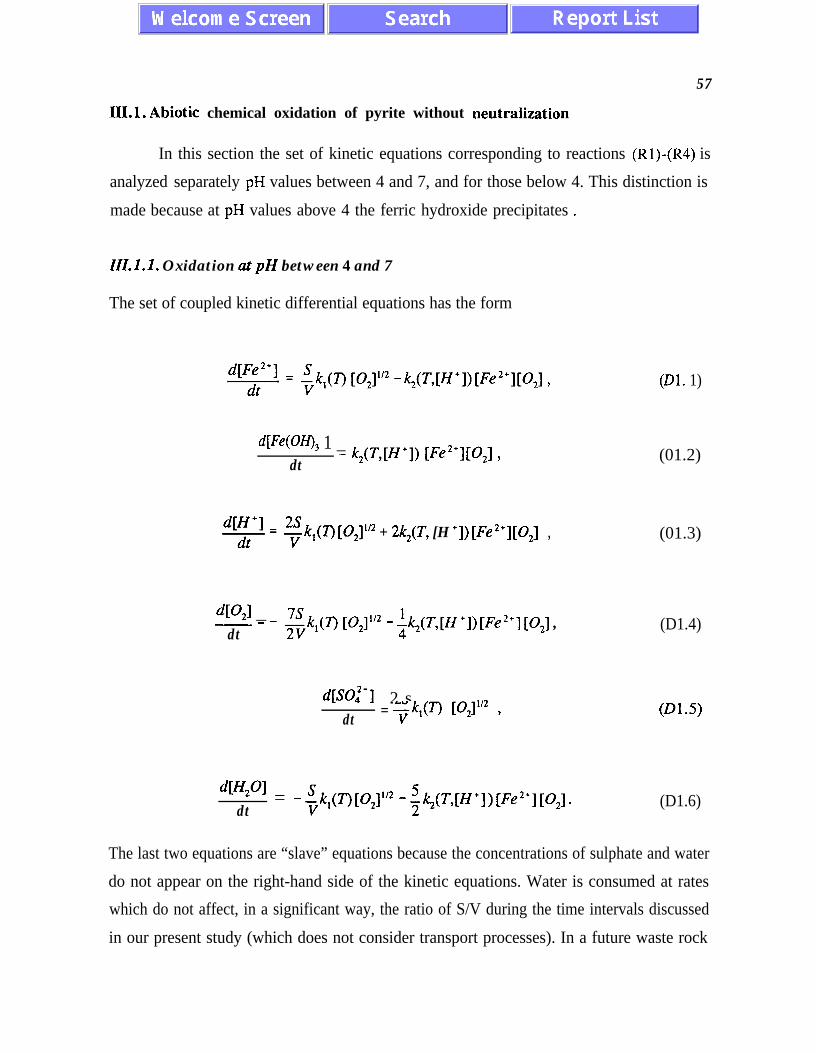
57
III.1. Abiotic chemical oxidation of pyrite without neutralization
In this section the set of kinetic equations corresponding to reactions (Rl)-(R4) is
analyzed separately pH values between 4 and 7, and for those below 4. This distinction is
made because at pH values above 4 the ferric hydroxide precipitates .
III.l.1. Oxidation a.t pH between 4 and 7
The set of coupled kinetic differential equations has the form
d’;12+1 = ;k,(7) [02]‘” - k,(T,[H+]) [Fe2+][02] ,
WWN), 1 _dt - ~2(TW+I) [~e2’1[021 9
1’2 + 2k2(T, [H ‘1) [Fe2+][02] ,
dEO,l _- - - $(7) [02]1’2 - ;I(,(T,[H ‘I) [F’e2+] [O,] ,dt
&@-I 2 sdt = 93 [O,l'" >
d[H,Oldt
= - $(T)[02]1'2 - ~k2(T,[H+])[Fe2’][02] .
(Dl. 1)
(01.2)
(01.3)
(D1.4)
(D1.5)
(D1.6)
The last two equations are “slave” equations because the concentrations of sulphate and water
do not appear on the right-hand side of the kinetic equations. Water is consumed at rates
which do not affect, in a significant way, the ratio of S/V during the time intervals discussed
in our present study (which does not consider transport processes). In a future waste rock

58
model, the total amount of water should no longer be a parameter but should become an
important variable. Still, water consumption in chemical processes will be relatively small,
but changes due to water transport will be significant. The time dependent concentrations of
sulphate and the changes in the amount of water can be determined from stoichiometric
relations after we find solutions to the first four equations.
Eq.(D1.2) assumes that the precipitation of ferric hydroxide is much faster than the rate of
oxidation of ferrous iron. We also assume that ferric hydroxide precipitates fast enough, so
that the oxidation of pyrite by ferric iron does not take place at high pH values. In this way
the rate of formation of ferric hydroxide becomes equal to the rate of oxidation of ferrous
iron and we disregard terms proportional to k,.
The total amount of dissolved pyrite, [Fe&], satisfies the stoichiometric relations (Rl)
and (R3):
At high pH values [Fe&], follows the differential equation
WeS,l, _ sdt
- 7 k,(T) v*l”* *
The last equation is proportional to the eq. (D1.5) and we do not include it in
independent equations (Dl).
a set of
The numerical factors in the kinetic equations result from the stoichiometric relations
(3.1.1)
(3.1.2)
(Rl), (R2), (R3) and (R4) which are the conservation laws for the species involved.
The rate coefficient k,(T,,[H+]) is defined in ecl(3.0.10). Rate constants in equations (Dl)
have the form
ki(l) =&(To)exp[E,(T-TJR* 1; i=1,21,22,23.
0(3.1.3)
These have been discussed before on p. 12.
The coefficient S/V describes both the characteristic rates of the chemical processes
taking place on the pyrite surface and the chemical activity as a function of physical factors
such as the pyrite reactive surface area, crystalline structure, pyrite content, rock porosity
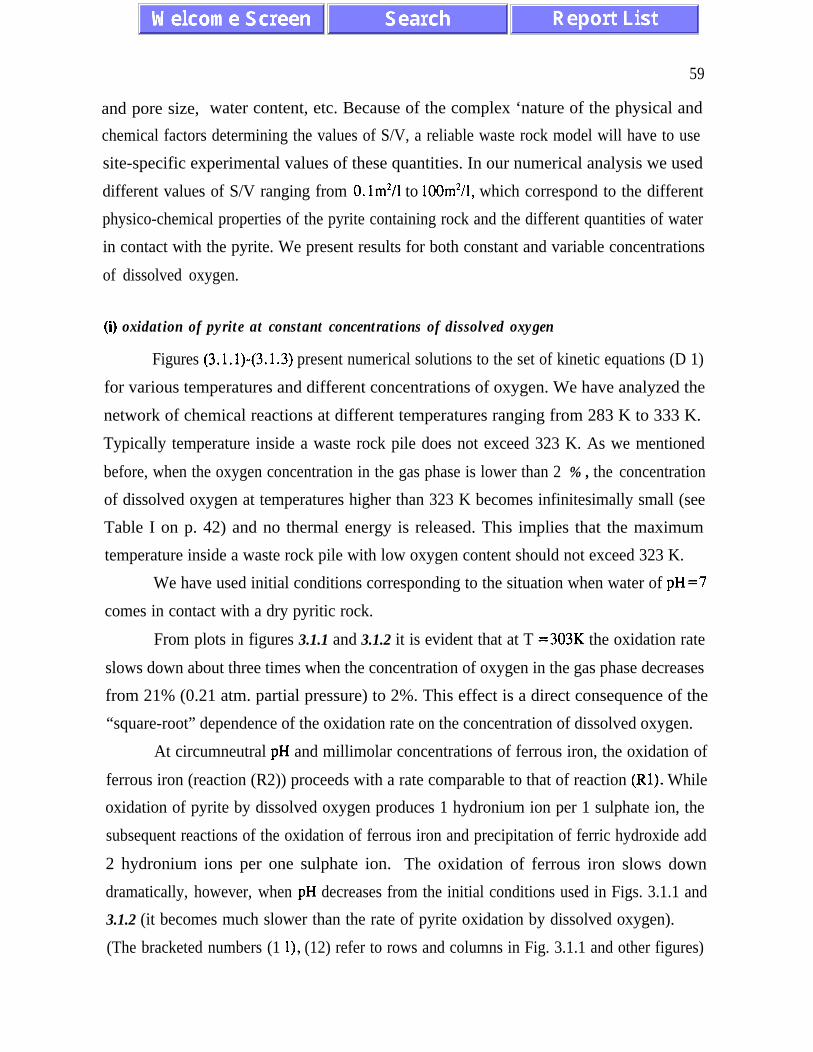
59
and pore size, water content, etc. Because of the complex ‘nature of the physical and
chemical factors determining the values of S/V, a reliable waste rock model will have to use
site-specific experimental values of these quantities. In our numerical analysis we used
different values of S/V ranging from O.lm*/l to lOOm*/l, which correspond to the different
physico-chemical properties of the pyrite containing rock and the different quantities of water
in contact with the pyrite. We present results for both constant and variable concentrations
of dissolved oxygen.
(i) oxidation of pyrite at constant concentrations of dissolved oxygen
Figures (3.1.1)-(3.1.3) present numerical solutions to the set of kinetic equations (D 1)
for various temperatures and different concentrations of oxygen. We have analyzed the
network of chemical reactions at different temperatures ranging from 283 K to 333 K.
Typically temperature inside a waste rock pile does not exceed 323 K. As we mentioned
before, when the oxygen concentration in the gas phase is lower than 2 % , the concentration
of dissolved oxygen at temperatures higher than 323 K becomes infinitesimally small (see
Table I on p. 42) and no thermal energy is released. This implies that the maximum
temperature inside a waste rock pile with low oxygen content should not exceed 323 K.
We have used initial conditions corresponding to the situation when water of pH=7
comes in contact with a dry pyritic rock.
From plots in figures 3.1.1 and 3.1.2 it is evident that at T =303K the oxidation rate
slows down about three times when the concentration of oxygen in the gas phase decreases
from 21% (0.21 atm. partial pressure) to 2%. This effect is a direct consequence of the
“square-root” dependence of the oxidation rate on the concentration of dissolved oxygen.
At circumneutral pH and millimolar concentrations of ferrous iron, the oxidation of
ferrous iron (reaction (R2)) proceeds with a rate comparable to that of reaction (Rl). While
oxidation of pyrite by dissolved oxygen produces 1 hydronium ion per 1 sulphate ion, the
subsequent reactions of the oxidation of ferrous iron and precipitation of ferric hydroxide add
2 hydronium ions per one sulphate ion. The oxidation of ferrous iron slows down
dramatically, however, when pH decreases from the initial conditions used in Figs. 3.1.1 and
3.1.2 (it becomes much slower than the rate of pyrite oxidation by dissolved oxygen).
(The bracketed numbers (1 I), (12) refer to rows and columns in Fig. 3.1.1 and other figures)

6 0
l.OOe-4
l.OOe-70.00 60000.00 120000.00 180000.00
(11) T=283K (12)
2.00e-4
l.OOe4
l.OOe-70.00 25000.00 50000.00
2.00e4
1 .OOe4
3.53e4
2.SOe4
l.OOe-4
l.OOe-70.00 60000.00 120000.00 180000.00
(21) T=293K (22)
1 .OOe-70.00 6000.00 12000.00 18000.00
2.60e4
1.80e4
S.OOe-5
l.OOe-70.00
2.38e-4
1.2Oe4
l.OOe-70.00 6000.00 12000.00 18000.00
I/ I
A’I
/-
(31) T=303K (32)
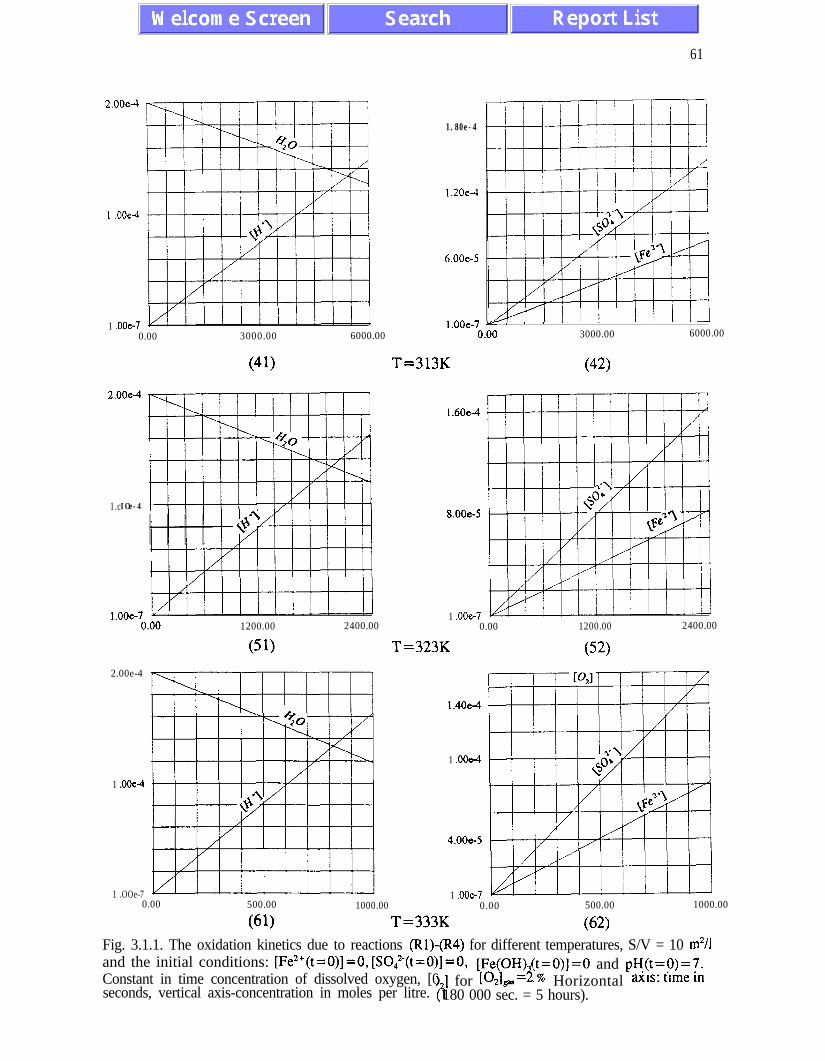
61
2.00e4
I .OOe4
1 .OOe-70.00 3000.00 6000.00
1.80e-4
1.20e-4
6.00e-5
l.OOe-7 yr ! ’ ’0.00 3000.00 6000.00
(41) T=313K (42)
1.cIOe-4
2.00e-4
l.OOe-7 y !0.00 1200.00 2400.00
1.60eA
8.00e-5
1 .OOe-70.00 1200.00 2400.00
2.00e-4
T=323K
1.40e4
1 .OOeA
1 .OOe-4
4.00e-5
1 .OOe-70.00 500.00
(61)
1 .OOe-71000.00 0.00
T=333K500.00 1000.00
(62)Fig. 3.1.1. The oxidation kinetics due to reactions @Xl)-(R4) for different temperatures, S/V = 10 m2/land the initial conditions: [Fe’+(t=O)]=O, (SO,‘-(t=O)]=O, [Fe(OH) (t=O)]=O and pH(t=?)=l.Constant in time concentration of dissolved oxygen, [0
Pfor [O&P= 1% Horizontal ax*s: time ln??
seconds, vertical axis-concentration in moles per litre. 180 000 sec. = 5 hours).
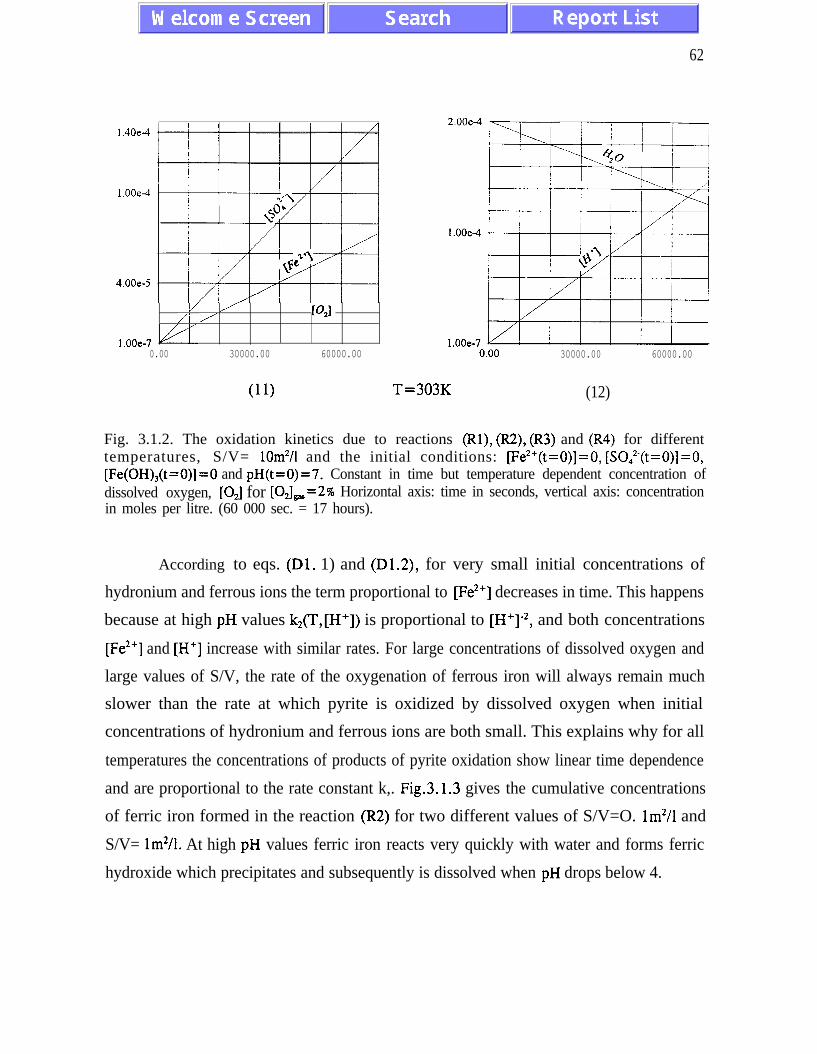
62
y //I / rq
l.OOe-70.00 30000.00 60000.00
(11)
0.00 30000.00 60000.00
T=303K (12)
Fig. 3.1.2. The oxidation kinetics due to reactions (Rl), (R2), (R3) and (R4) for differenttemperatures, S/V= lOm*/l and the initial conditions: [Fe*+(t=O)]=O, [SO,“(t=O)]=O,[Fe(OH),(t=O)]=O and pH(t=O)=7. Constant in time but temperature dependent concentration ofdissolved oxygen, [OJ for [C&J, =2% Horizontal axis: time in seconds, vertical axis: concentrationin moles per litre. (60 000 sec. = 17 hours).
According to eqs. (Dl. 1) and (D1.2), for very small initial concentrations of
hydronium and ferrous ions the term proportional to [Fe*‘] decreases in time. This happens
because at high pH values k,(T,[H+]) is proportional to [H+]-*, and both concentrations
[Fe*‘] and [H+] increase with similar rates. For large concentrations of dissolved oxygen and
large values of S/V, the rate of the oxygenation of ferrous iron will always remain much
slower than the rate at which pyrite is oxidized by dissolved oxygen when initial
concentrations of hydronium and ferrous ions are both small. This explains why for all
temperatures the concentrations of products of pyrite oxidation show linear time dependence
and are proportional to the rate constant k,. Fig.3.1.3 gives the cumulative concentrations
of ferric iron formed in the reaction (R2) for two different values of S/V=O. lm*/l and
S/V= lm*/l. At high pH values ferric iron reacts very quickly with water and forms ferric
hydroxide which precipitates and subsequently is dissolved when pH drops below 4.
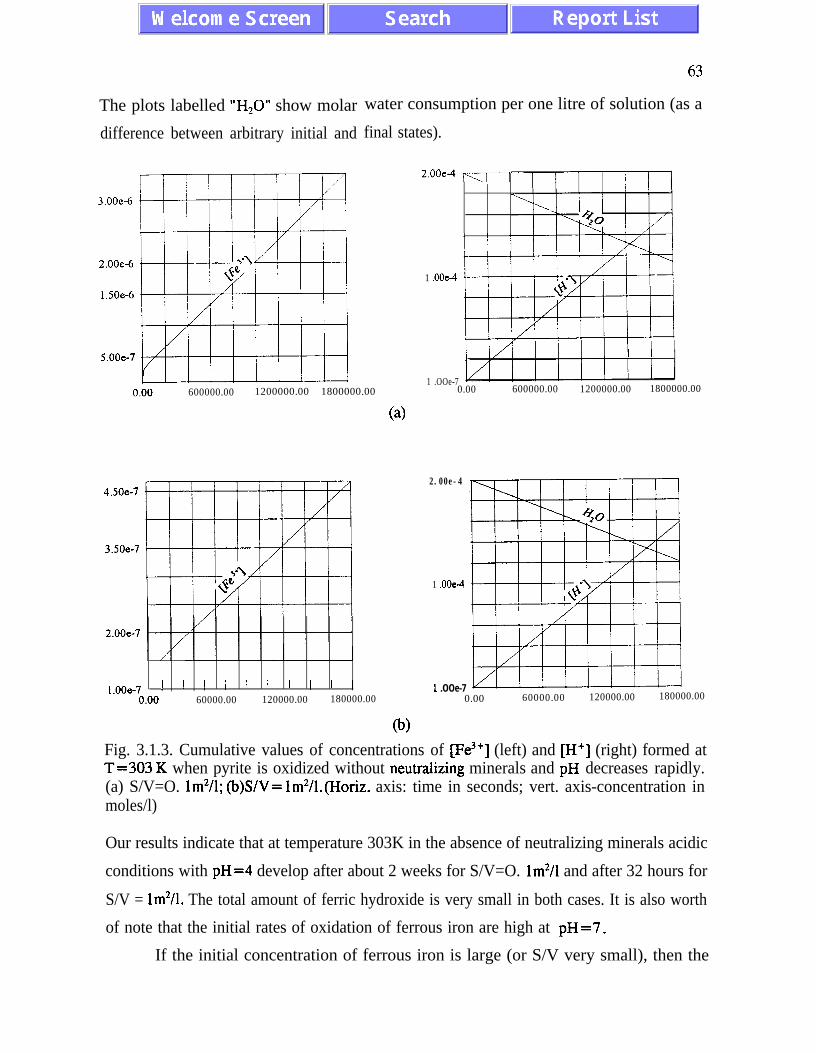
The plots labelled “H,O” show molar water consumption per one litre of solution (as a
difference between arbitrary initial and final states).
63
3.00e-6
2.00e-6
1.50e-6
S.OOe-7
600000.00 1200000.00 1800000.00
(4
4.50e-7
3SOe-7
2.00e-7
t i 11 .OOe4
’ ’
1 .OOe-70.00 600000.00 1200000.00 1800000.00
l.OOe-7 I ’ ! ! ’ ’ ’ ! ’ I 1 .OOe-70.00 60000.00 120000.00 180000.00 0.00 60000.00 120000.00 180000.00
@)
Fig. 3.1.3. Cumulative values of concentrations of [Fe3’] (left) and [H+] (right) formed atT=303 K when pyrite is oxidized without neutrahzing minerals and pH decreases rapidly.(a) S/V=O. lm’/l; @)S/V= 1m2/1.(Horiz. axis: time in seconds; vert. axis-concentration inmoles/l)
Our results indicate that at temperature 303K in the absence of neutralizing minerals acidic
conditions with pH=4 develop after about 2 weeks for S/V=O. 1m2/1 and after 32 hours for
S/V = 1m2/1. The total amount of ferric hydroxide is very small in both cases. It is also worth
of note that the initial rates of oxidation of ferrous iron are high at pH=7 _
If the initial concentration of ferrous iron is large (or S/V very small), then the
2.00e-4
1 .OOe4

64
reactions (R2) and (R4) proceed with rates comparable to (Rl). This happens also when
circumneutral pH values are stabilized for a long time (i.e. when the factor [H+]-2 is small
(see eq. (3.0.10) and Fig. 3.0.2). Because reaction (R4) generates hydronium ions, there is
a positive feedback between the neutralizing reactions and the formation of hydronium ions.
Hydronium ions formed in the reaction (R4) are, of course, subsequently neutralized. We
discuss this phenomenon in more detail in Section 111.2, where we analyze effects of
neutralizing compounds.
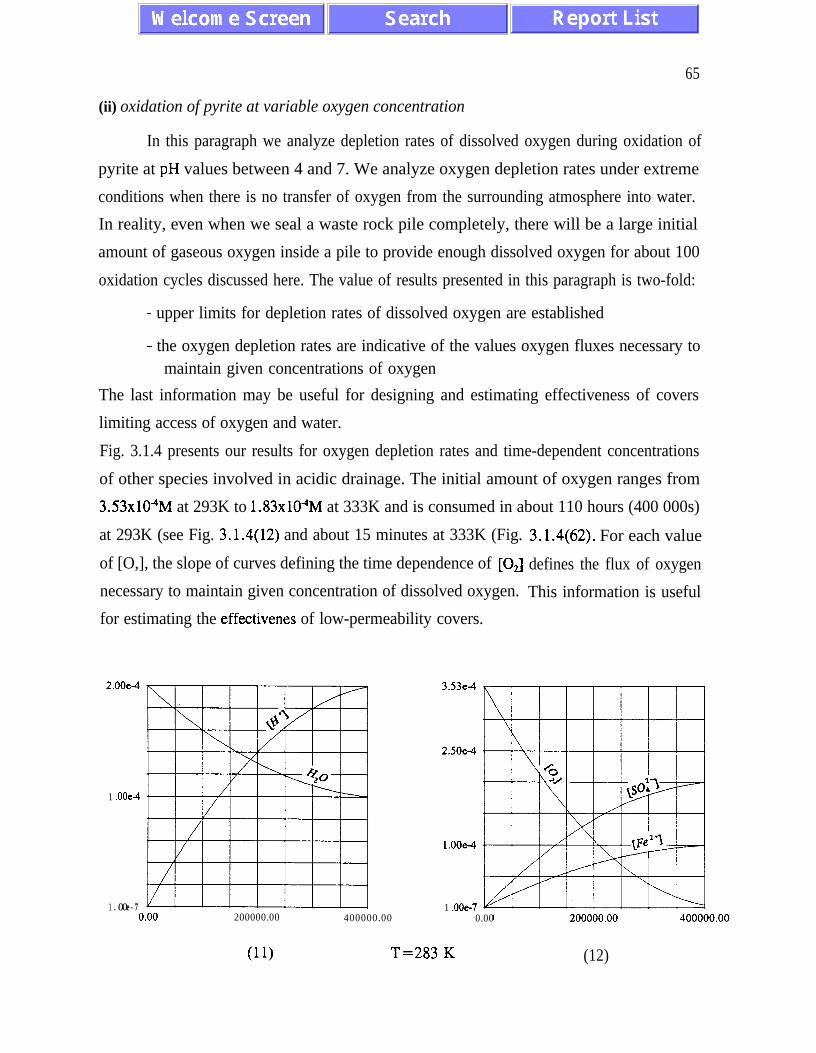
65
(ii) oxidation of pyrite at variable oxygen concentration
In this paragraph we analyze depletion rates of dissolved oxygen during oxidation of
pyrite at pH values between 4 and 7. We analyze oxygen depletion rates under extreme
conditions when there is no transfer of oxygen from the surrounding atmosphere into water.
In reality, even when we seal a waste rock pile completely, there will be a large initial
amount of gaseous oxygen inside a pile to provide enough dissolved oxygen for about 100
oxidation cycles discussed here. The value of results presented in this paragraph is two-fold:
- upper limits for depletion rates of dissolved oxygen are established
- the oxygen depletion rates are indicative of the values oxygen fluxes necessary tomaintain given concentrations of oxygen
The last information may be useful for designing and estimating effectiveness of covers
limiting access of oxygen and water.
Fig. 3.1.4 presents our results for oxygen depletion rates and time-dependent concentrations
of other species involved in acidic drainage. The initial amount of oxygen ranges from
3.53xlO”M at 293K to 1.83xlO”M at 333K and is consumed in about 110 hours (400 000s)
at 293K (see Fig. 3.1.4(12) and about 15 minutes at 333K (Fig.
of [O,], the slope of curves defining the time dependence of [OJ
necessary to maintain given concentration of dissolved oxygen.
for estimating the effectivenes of low-permeability covers.
3.1.4(62). For each value
defines the flux of oxygen
This information is useful
2.00e4
1 .OOe4
1 .OOe-70.00 200000.00 400000.00
(11) T=283
3.53e4
1 .OOe-70.00
‘K (12)
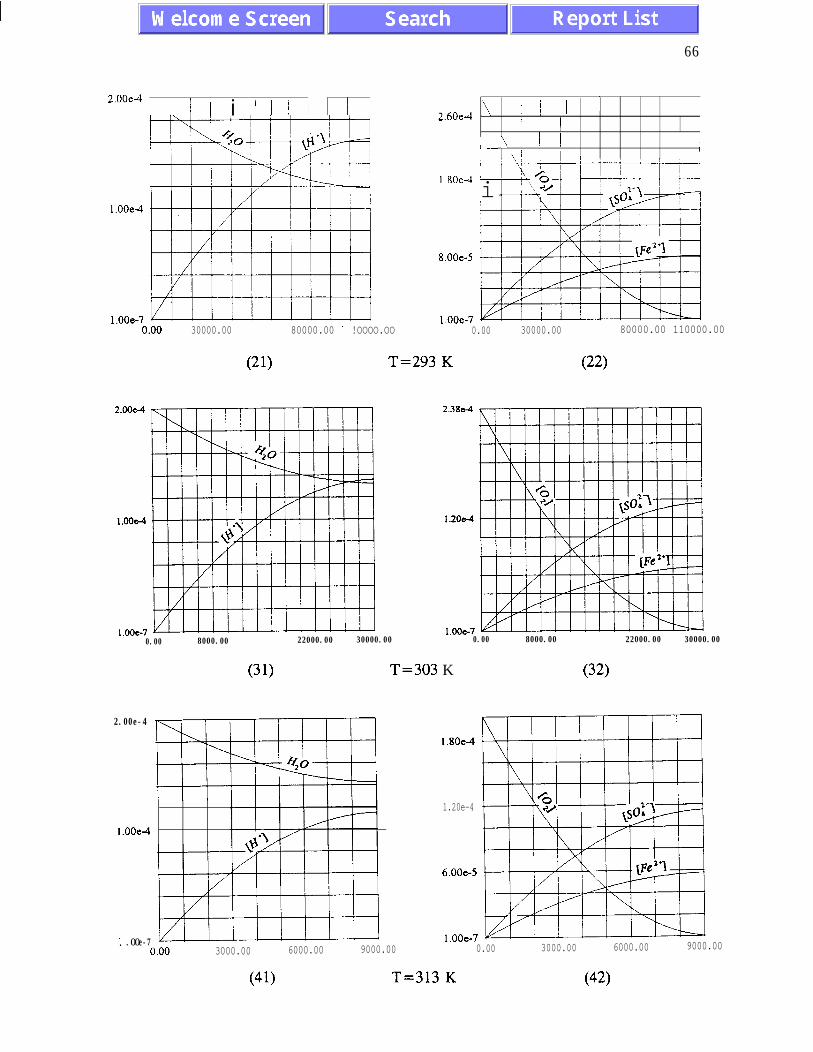
66
I I i / I ! II 1 I 2.60e-J \! i
, I I! I I ~I )
\. / I I ! i! I 1
I 80e-1 Lil.OOe-4
8.00e-5
l.OOe-7 l.OOe-70.00 30000.00 80000.00 1 !OOOO.OO 0.00 30000.00 80000.00 110000.00
(21) T=293 K (22)
l.OOe-70.00 8000.00 22000.00 30000.00
2.384
l.OOc-70.00 8000.00 22000.00 30000.00
(31) T=303 K (32)
2.00e-4
l.OOe4
1 .OOe-70.00 3000.00 6000.00 9000.00
1.80e4
1.20e-4
6.00e-5
l.OOe-70.00 3000.00 6000.00 9000.00
(41) T=313 K (42)
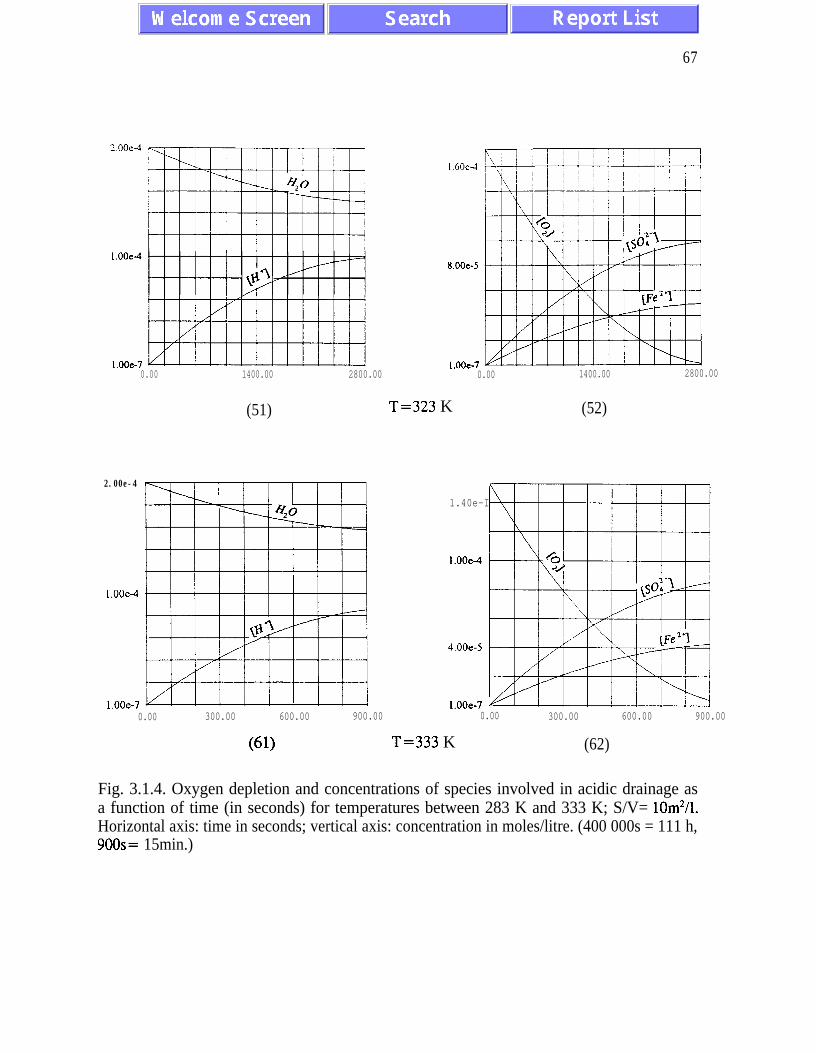
67
l.Ooe-70.00 1400.00 2800.00
8.00~~5
l.OOc-70.00 1400.00 2800.00
(51) T=323 K (52)
2.00e-4
1.40e-I
l.OOeA
l.OOe-4
4.00e-5
l.OOe-70.00
jl.OOe-7300.00 600.00 900.00 0.00 300.00 600.00 900.00
(61) T=333 K (62)
Fig. 3.1.4. Oxygen depletion and concentrations of species involved in acidic drainage asa function of time (in seconds) for temperatures between 283 K and 333 K; S/V= 10m2/1.Horizontal axis: time in seconds; vertical axis: concentration in moles/litre. (400 000s = 111 h,9OOs= 15min.)
68
III.1.2. Oxidation ai pH less than 4
At low pH values ferric hydroxide does not precipitate if concentrations of ferric iron are
sufficiently small (see Fig.2.6 on p. 27). This means that the ferric iron, Fe3+ (which is
formed by oxidation of ferrous iron) oxidizes pyrite according to the reaction (R3). The set
of coupled kinetic differential equations has the form
d[7t2’1 = %k,(T) [02]112 - k,(T,[H ‘I) [Fe2+][02] + gvk,[Fe3+]3’5[H+]-1’2 , (02.1)
d[Fe3’1 = &(Tdt 9 [H’]) [Fe2+] [0 ]2 - .$c3(T)[Fe3+]3" [H’]-1’2 , (02.2)
7 = ~k,(r)[O2]‘n-k,(T,[H+])[Fe2+][O2]+~~k,(T)[Fel.l”‘fH’l’n , (02.3)
4021 _dt
- - Fvk,cQ [02]112 - fk,(C W+1W’e2’l [O,l 9
d[S0,2-]
dt= 2&(T) [0211’2 + -&k,(T) [Fe3’13/’ [H +]-112 ,
(02.4)
(02.5)
d[H,Oldt
= - ;k,(q [O,]‘” + $2V, WI) [Fez'1 LO,1 - 7 v!?k3(T)[Fe3+]3’5[H+]-1R . (02.6)
At low pH values the process of pyrite oxidation by ferric iron may play an important
role. There are at least two possible scenarios under which significant amounts of ferric iron
may be formed.
(1). Ferric iron can be formed at high rates in the presence of Thiobacillus ferrooxidans atlow pH values.
69
(2). At high pH values the process of oxidation of ferrous iron is also relatively fast andleads to the formation of ferric hydroxide. If neutralization agents are not applied in asufficient amount, further pyrite oxidation may lead to lower pH values at which ferrichydroxide dissolves and provides ferric iron for the accelerated oxidation of pyrite.
The neutralization process and bacterial oxidation will be discussed in Section 3.2 and
Chapter IV. In this paragraph we concentrate on the oxidation of pyrite by ferric iron as
such, independently of accompanying circumstances.
The total amount of dissolved pyrite [Fe&], satisfies the stoichiometric relations (Rl)
and (R3):
and follows the differential equation
d[FeS,l,dt
= Sk,(T) [O,]“’ + -&k3 [Fe3']3'5[H+]-112 . (3.1.4)
The last equation is proportional to eq. (D2.5) and we do not include it in a set of
independent equations (D2).
There are two competitive effects associated with the process of pyrite oxidation by
ferric iron. As shown in Fig. 2.6, the solubility of ferric iron increases when pH decreases.
On the other hand the rate of oxidation decreases when pH decreases. These two effects do
not play a dominant role, however, in determining the rate of pyrite oxidation by ferric iron.
By comparing the values of rate constants, it becomes evident that in the absence of bacteria
the rate of reaction (R3) is controlled by the rate of reaction (R2) which produces ferric
iron.
It turns out that independently of its initial value, the concentration of ferric iron
converges after a relatively short time to its quasi-equilibrium value defined by the condition
d[Fe3+]/dt=0. From the condition d[Fe3+]/dt=0 imposed on equation (D2.2) we obtain the
quasi-equilibrium value of the ferric iron concentration, [Fe3+],, :

70
Fe3+lqe4 = fk*(T w+I) v
k (T)S W+11’2[021~~e2+l3
5131 - (3.1.5)
The concept of quasi-equilibrium for transient species produced by non-equilibrium
chemical and physical processes is discussed in Section 111.3. In this paragraph we present
only quantitative results without discussing the mathematical properties of the differential
equations governing the time evolution of the chemical system.
For pH between 2 and 4, [0,] =2x10” M, [Fe2’]= 10m2M, S/V= lm*/l the concentration of
ferric iron are below a critical value at which the precipitation of ferric hydroxide takes
place. Fig.3.1.5 gives the values of [Fe3’lscs as a function of pH=-log [H+].
4.00e-9
3.00e-9
ISOe-9
5.00e-10
1 1.80PH
3.20 4.00
Fig.3.1.5 The quasi-equilibrium values of the concentration of ferric iron as a function ofpH for [O,] =2x10’ M, [Fe*‘] = lO_*M, S/V= 1 m*/l, T=303K. Vertical axis: concentrationin moles per litre.
For small concentrations of ferric iron reaction (R3) is slow and pyrite oxidation is mainly
due to reaction (Rl) - see Fig. 3.1.6. We present results on pyrite oxidation at low pH
values for two situations: when the concentration of dissolved oxygen is time independent
and when oxygen is depleted.
71
(i) oxidation at time-independent concentrations of dissolved oxygen
By comparing terms on the right-hand side of eq.(D2.5) we conclude that for the
oxidation of pyrite by ferric iron to be faster than the oxidation by dissolved oxygen, the
ferric iron concentration would have to satisfy the condition
[Fe3+] 2 ( ‘;;:}5/3 ,qS/S [fj +]5/6 .
3
(3.1.6)
For pH=4 and [02]=2.38x10⁴ M at 303 K we obtain [Fe3+]22.6x10A. According to eq.
(3.1.6) this condition cannot be satisfied in waste rock piles in the absence of bacteria
because the quasi-equilibrium value of ferric iron concentration [Fe3+],, is four orders of
magnitude smaller even for S/V=O. lm*/l. (Note that the relation (3.1.6) does not depend
explicitly on S/V, but [Fe3+lqq defined by eq. (3.1.5) does.)
The maximum rate of pyrite oxidation by ferric iron can be obtained after substituting eq.
(3.1.5) into eq.(3.1.4), and is given by the relation
d[FeS,l, _ 1dt
- ,,k,K V’I) W,l Fe*+1 (3.1.7)
Eq. (3.1.7) does not depend explicitly on S/V or [Fe3’], it gives the rate of pyrite oxidation
by ferric iron contained in one litre of water.
For the ratio between the rates of reactions (R3) and (RI) we obtain the expression
W’eS,l,dt = _v_ k(C WI)
d Ws, lRI 14s 4(T)[O,]‘” [Fe2+] (3.1.8)
dt
For [0,1=2x10’ M, [Fe*‘] = lo-*M, S/V= 1 m*/l. In the absence of bacteria the rate of
pyrite oxidation by ferric iron is three orders of magnitude slower than the rate of pyrite
oxidation by dissolved oxygen according to the reaction (Rl). In this way the reaction (R2)
controls the rate of the reaction (R3). The relation (3.1.8) is plotted in Fig.3.1.6.
Underwater disposal offers lower oxidation rates overall - mainly because high pH
values can be maintained and oxygen diffusion in water is much slower than in air, becoming
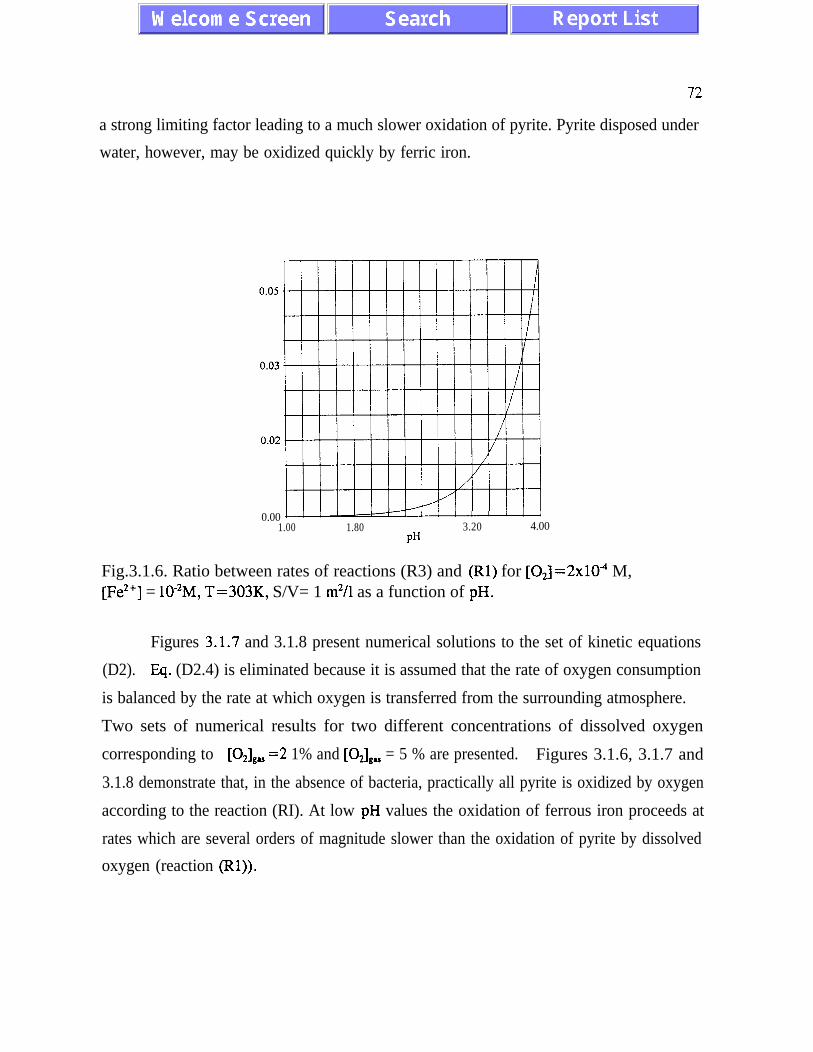
72
a strong limiting factor leading to a much slower oxidation of pyrite. Pyrite disposed under
water, however, may be oxidized quickly by ferric iron.
0.00 d1.00 1.80 3.20 4.00
PH
Fig.3.1.6. Ratio between rates of reactions (R3) and (Rl) for [02]=2x10⁴ M,[Fe2+] = 10e2M, T=303K, S/V= 1 m2/1 as a function of pH.
Figures 3.1.7 and 3.1.8 present numerical solutions to the set of kinetic equations
(D2). Eq. (D2.4) is eliminated because it is assumed that the rate of oxygen consumption
is balanced by the rate at which oxygen is transferred from the surrounding atmosphere.
Two sets of numerical results for two different concentrations of dissolved oxygen
corresponding to [O&, =2 1% and [O,],, = 5 % are presented. Figures 3.1.6, 3.1.7 and
3.1.8 demonstrate that, in the absence of bacteria, practically all pyrite is oxidized by oxygen
according to the reaction (RI). At low pH values the oxidation of ferrous iron proceeds at
rates which are several orders of magnitude slower than the oxidation of pyrite by dissolved
oxygen (reaction (Rl)).
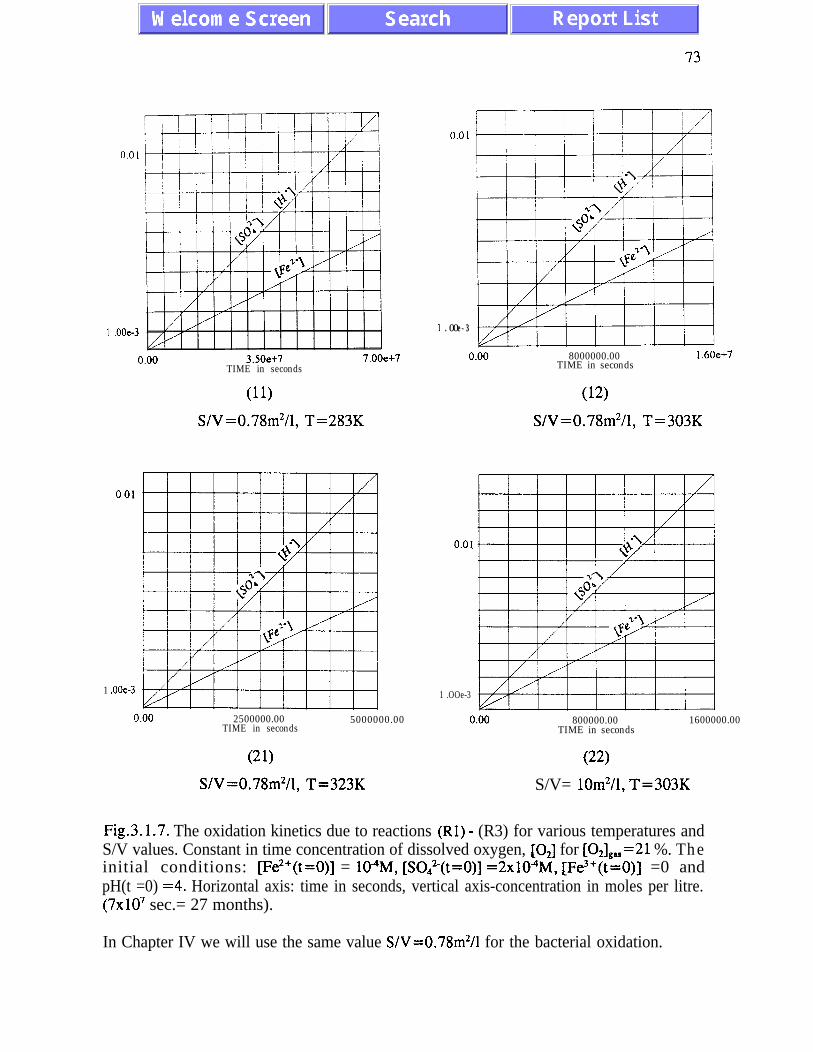
1 .OOe-3
1 .OOe-3
0.00 3SOe+7 7,00e+7TIME in seconds
(11)
S/V=0.78m2/1, T=283K
2500000.00TIME in seconds
5000000.00 800000.00TIME in seconds
1600000.00
(21) (22)S/V=0.78m2/1, T=323K S/V= lOm*/l, T=303K
1 .OOe-3
8000000.00TIME in seconds
1.60e+7
(12)S/V=0.78m2/1, T=303K
1 .OOe-3
Fig.3.1.7. The oxidation kinetics due to reactions (Rl) - (R3) for various temperatures andS/V values. Constant in time concentration of dissolved oxygen, [O,] for [021gu=21 %. Theinitial conditions: [Fe*+(t=O)] = lO”M, [SO:-(t=O)] =2xlO”M, [Fe3+(t=0)] =0 andpH(t =0) =4. Horizontal axis: time in seconds, vertical axis-concentration in moles per litre.(7~10~ sec.= 27 months).
In Chapter IV we will use the same value S/V=0.78m2/1 for the bacterial oxidation.
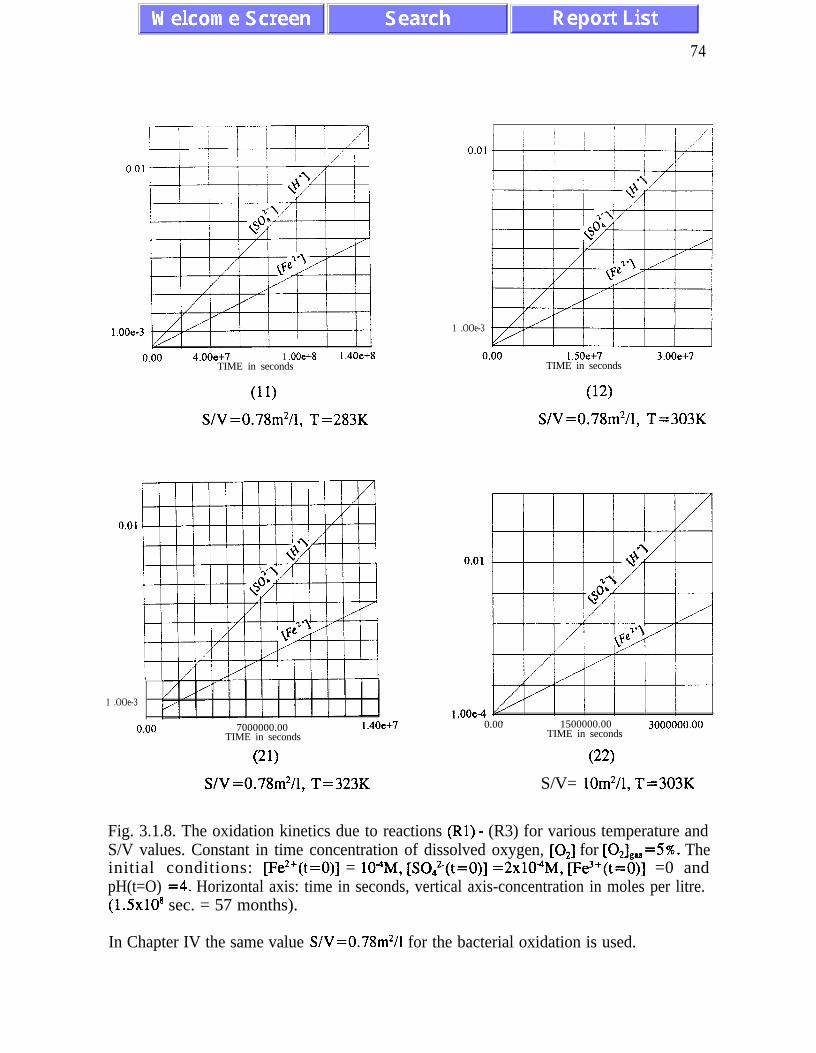
74
I,i
1 , I / !
4.00e+7 1 .OOe+8TIME in seconds
1.40e+8
1 .OOe-3
(11) (12)S/V=0.78m2/1, T=283K S/V=0.78m2/1, T=303K
1 .OOe-3
0.00 7000000.00TIME in seconds
(21)
1.40e+7
1.50e+7TIME in seconds
3.00e+7
.OOeA0.00 1500000.00
TIME in seconds
(22)S/V=0.78m2/1, T=323K S/V= lOm*/l, T=303K
Fig. 3.1.8. The oxidation kinetics due to reactions (Rl) - (R3) for various temperature andS/V values. Constant in time concentration of dissolved oxygen, [O,] for [0,],,=5%. Theinitial conditions: [Fe*+(t=O)] = lOaM, [SO:-(t=O)] =2x10⁴M, [Fe3+(t=O)] =0 andpH(t=O) =4. Horizontal axis: time in seconds, vertical axis-concentration in moles per litre.(1.5x10* sec. = 57 months).
In Chapter IV the same value S/V=0.78m2/1 for the bacterial oxidation is used.
75
We see that in figures 3.1.7 and 3.1.8 the changes of concentrations are linear in
time. This is an obvious property because for small concentrations of ferric iron, terms
proportional to k, and k, are very small and the concentrations can be approximated by
[Fe*+(t)] = [W’(lJ + ~k,(q[021”‘*‘(t-lo) )
W’(Ol = W’(to)l + ~k,o[02]‘yl-lo) ,
[so:-(t)] = [my&)] + ~k,(T)[O,]““(r -to) .
(3.1.9)
(3.1.10)
(3.1.11)
Fig. 3.1.10 provides further insight into the interplay between reactions (Rl), (R2)
and (R3) for high initial concentrations of ferric iron. By comparing time intervals over
which the concentration of ferrous iron increases by 0.01 M, we conclude that at high
concentrations of ferric iron the reaction of pyrite oxidation by ferric iron is much faster than
the oxidation of pyrite by dissolved oxygen. Therefore it is very important to keep the levels
of ferric iron as low as possible. In particular, sufficient amounts of neutralizing minerals
should be used, so that pH always remains high and ferric hydroxide formed at high pH
values does not dissolve. The neutralization process is analyzed in Section 3.2.
76
(ii) oxidation at variable concentrations of dissolved oxygen
We analyze the depletion rates of dissolved oxygen under ideal conditions, when there
is no transfer of oxygen from the surrounding atmosphere. Although this is not a realistic
situation, we obtain some useful information about reduced values of oxygen fluxes sufficient
to slow down the long-term oxidation process below required levels. We analyze reactions
(Rl), (R2) and (R3) for two sets of different initial concentrations of dissolved oxygen at
temperatures from 283 K to 333 K. The two sets of initial concentrations are saturation
concentrations corresponding to two different concentrations of gaseous oxygen: 21% and
2 % . For each temperature, the slope of [O,(t)] gives a value of oxygen fluxes per one litre
of water, necessary to maintain the concentration of dissolved oxygen at a given level. This
information should be useful for estimating the permeability of covers used in order to
reduce the access of oxygen. It can also be used for estimates of oxygen depletion rates for
underwater disposal where lower oxygen concentration is expected to be observed near the
pyrite surface. In Chapter IV we will perform a similar analysis for much higher oxidation
rates due to bacterial processes.
According to eq. (D2.4), the rate of oxygen depletion is proportional to [02]1’2. This
means that when low-permeability covers are used and oxygen concentration decreases n
times, the rate of pyrite oxidation by dissolved oxygen decreases only n1’2 times. We arrive
at a similar conclusion when we use the formula:
lo21W',l __-dt 1 +~[ql
(3.1.12)
given by Nicholson et al. [NiG]. Eq. (3.1.12) also describes a slower than linear increase
of the oxygen depletion rates with an increasing concentration of dissolved oxygen. In the
next paragraph we discuss the general scaling properties of the chemical processes
responsible for acid rock drainage.
We analyze oxygen depletion rates at various temperatures. When the rate of reaction
(R2) is very slow, we may neglect the second term in eq. (D2.4) and obtain the approximate
analytical solution
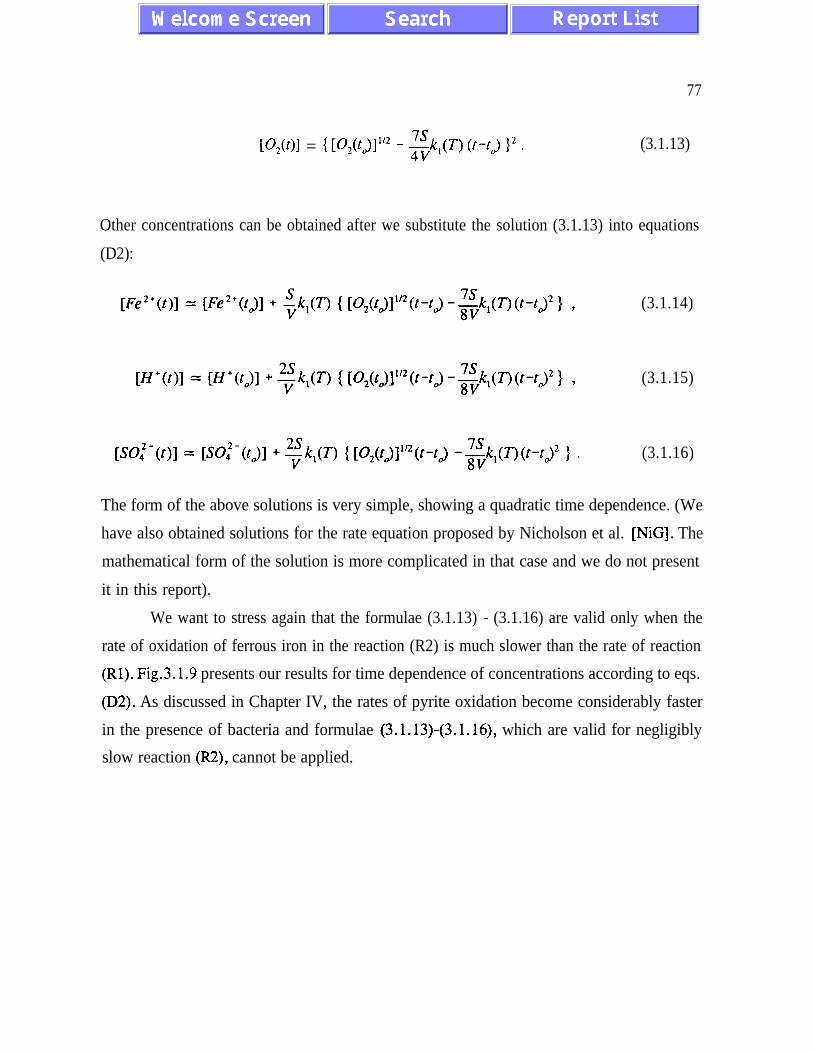
[qtol = 1 [q(J"* - &T) (t-t) >’ .
77
(3.1.13)
Other concentrations can be obtained after we substitute the solution (3.1.13) into equations
(D2):
[saf-(t)] = [SO,‘+J + p,(T) { [o*(lJ]yt-tk) -$T)(r-c@)* > .
(3.1.14)
(3.1.15)
(3.1.16)
The form of the above solutions is very simple, showing a quadratic time dependence. (We
have also obtained solutions for the rate equation proposed by Nicholson et al. [NiG]. The
mathematical form of the solution is more complicated in that case and we do not present
it in this report).
We want to stress again that the formulae (3.1.13) - (3.1.16) are valid only when the
rate of oxidation of ferrous iron in the reaction (R2) is much slower than the rate of reaction
(Rl). Fig.3.1.9 presents our results for time dependence of concentrations according to eqs.
(D2). As discussed in Chapter IV, the rates of pyrite oxidation become considerably faster
in the presence of bacteria and formulae (3.1.13)-(3.1.16), which are valid for negligibly
slow reaction (R2), cannot be applied.
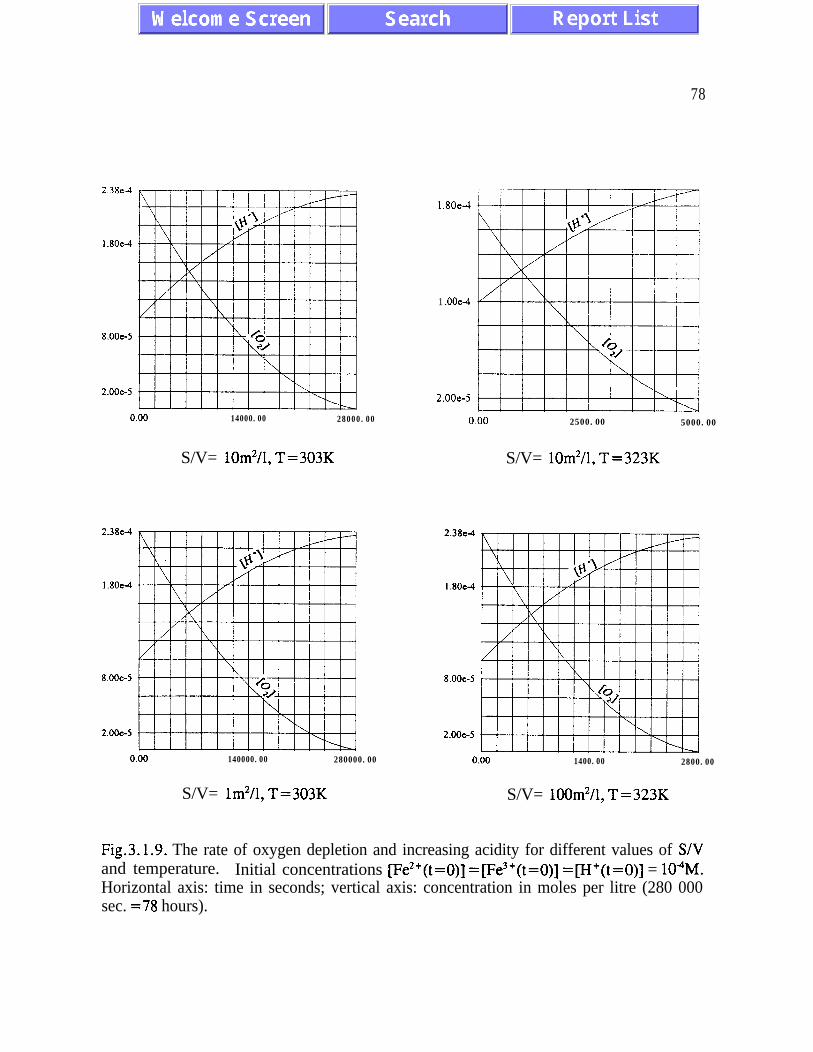
78
2.38e4
1.80e-4
8.OOc-5
0.00 14000.00 28000.00
S/V= 10m2/1, T=303K
8.00e-5
0.00 140000.00 280000.00
S/V= lm*/l, T=303K
1.80e4
1 .OOe4
2.00e-5
0.00 2500.00 5000.00
S/V= lOm’/l, T=323K
1.8Oc-4
8.OOc-5
0.00 1400.00 2800.00
S/V= 100m2/1, T=323K
Fig.3.1.9. The rate of oxygen depletion and increasing acidity for different values of S/Vand temperature. Initial concentrations [Fe*+(t=O)] =[Fe3+(t=O)] =[H+(t=O)] = lOaM.Horizontal axis: time in seconds; vertical axis: concentration in moles per litre (280 000sec. =78 hours).
79
III.2. Oxidation of pyrite in the presence of neutraiizing minerals
Acid neutralization reduces the environmental impact of acid generation by stabilizing
high pH values. At high pH values ferrous ions react with oxygen and water, and then
precipitate from the water. The typical neutralizing minerals are calcite (CaCO,), dolomite
(CaMg(CO,),), ankerite (CaFe(CO&, and many others. As mentioned before we can
distinguish three different scenarios for neutralization:
1” Acid-generating and acid-neutralizing minerals react simultaneously with water and
oxygen. During this process high pH values above 5.5 can be maintained, if a sufficient
amount of neutralizing mineral is used.
2”. Water and oxygen react with acid generating minerals first, and then flow over acid
neutralizing minerals. In this case, the results of the previous paragraphs apply to the acid
generation phase.
3”. The water flows over neutralizing minerals and by dissolving a portion of the minerals
accumulates alkalinity and then reacts with acid generating minerals.
Maintaining high pH values has beneficial environmental effects: a large portion of
iron precipitates and remains in a waste rock pile, the reaction (R3) does not take place, and
the reactions (R2) and (R4) do not produce sulphate ions which are formed in the reaction
(R3) at low pH values; at the same time hydronium ions formed in the reaction (R4) are
neutralized .
If neutralizing minerals are consumed completely before the acid-generating minerals are
consumed, acid drainage may occur at accelerated rates. This may happen both in scenario
1” and scenario 3”. There are two factors which may contribute to this undesirable effect:
(a) At high pH values ferrous iron is oxidized to ferric iron at high rates and precipitates as
ferric hydroxide (reactions (R2) and (R4)).
(b) When pH decreases below 4, ferric hydroxide becomes soluble and the dissolved ferric
ions react quickly with pyrite (reaction (R3)).
The net result is an increased rate of acid generation. Because the reaction (R3) does not
require oxygen, this effect may be very severe far from waste pile boundaries, where the
oxygen concentration is usually low.
80
As in the previous paragraphs, we present results obtained for different temperatures and
oxygen concentrations constant in time as well as oxygen concentrations that are time
dependent .
We solve numerically the following set of coupled kinetic differential equations:
d[Fe2’]dt I, [Fe2’l[0,1 ,
WWH), 1dt = &(CW+l) [Fe2’l[021 ,
W’l, _ 2sdt - V
-~k,(~[0211’2 +2&V, [~+IWe2+l[021 ,
W,l _- - - gvk,(IJ [02]112 - bk,(T,[H+]) [Fe2’] [O,] ,dt
(03.4)
dW:-1 = 2sdt
77 k,(T) [oy2 7
dW,Oldt =
- g,(T) [02y2 - ~k,(T,[H’I)[Fe2+l lo21 .
(03.1)
(03.2)
(03.3)
(03.5)
(03.6)
Eqs. (D3) describe the concentrations of the species produced in the reactions (Rl),
(R2) and (R4) at constant pH values which are maintained due to the neutralization process.
In eqs. (D3) the neutralization process is included implicitly by the imposed condition of
time-independent pH. [HflR in eqs. (D3) has a different sense than [H+] in the definition of
k#,[H+]) and in eqs. (Dl) and (D2). In equations (Dl) and (D2) the concentration [H+] of
hydronium ions also defined pH @H=-log([H+]). In equations (D3), [H’lR corresponds to
the number of hydronium ions produced in the reactions (Rl), (R2) and (R4) and [H+lR does
not define pH. A time independent total concentration of the hydronium ions [H+] is assumed
to be maintained by neutralizing reactions. In this way there is no logical inconsistency
81
between constant pH and variable [H’lR in equations (D2).
We focus our attention on the relative rates of formation of hydronium and sulphate
ions in reactions (Rl), (R2) and (R4) at high pH values maintained due to the neutralizing
reactions (R5.1) or (R5.2). This information is significant for designing the most efficient
and cost-effective neutralization methods which should produce a minimum amount of
sludge.
The relative rates of formation of the hydronium and sulphate ions are different for
different pH values because the rate coefficient k,(T,[H+]) for the reaction (R2) increases
dramatically with pH. The reactions (R2) and (R4) produce hydronium ions but do not
produce sulphate ions.
(i) pyrite oxidation by time-independent concentrations of dissolved oxygen
We present three sets of results for three different time-independent pH values: 5.5,
6.3 and 6.9. These values correspond to the range of equilibrium pH for calcium-based
carbonates used as neutralizing minerals in field and laboratory studies [MO], [MoJ] , [Re].
At pH values close to 6.3 H,C03” and HCOi are similar in concentrations and according to
the diagram on p. 40, strong buffering occurs, which stabilizes the pH value despite the
addition of acidity or alkalinity. We use a simplified approach to the neutralization process
and focus our attention on a long term effect of high pH values on reactions (Rl), (R2) and
(R4). While this approach seems to be well justified for pH=6.3 at which strong self-
buffering occurs, it should be considered as an approximation for other pH values. A more
realistic model should take into account the kinetics of carbonate species as a function of pH.
Such an analysis goes beyond the scope and limited time of this study. We will analyze this
problem in future. In paragraph III.2(iii), we discuss two important aspects of the
neutralization process, which merit further attention.
Figures 3.2.1, 3.2.2 and 3.2.3 present our results for acid drainage at different
temperatures for three different pH values and temperature dependent concentrations of
dissolved oxygen corresponding to the oxygen partial pressure of 0.21 atm. At high pH
values the concentration of ferrous iron shows very similar behaviour to the concentration
of ferric iron at low pH values.
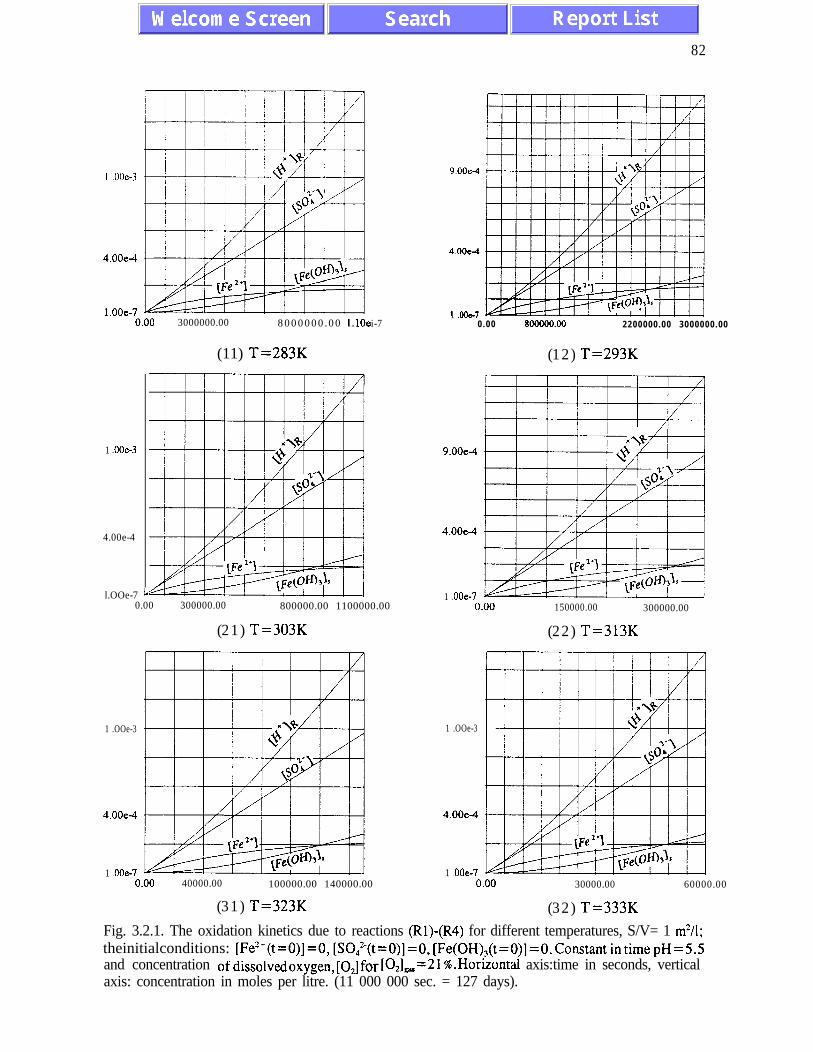
82
I .OOe-3
4.00e4
1 .OOe-3
4.00e-4
.oo 3000000.00 8000000.00 l.lOei-7
(11) T=283K (12) T=293K
l.OOe-7 L0.00 300000.00 800000.00 1100000.00
1 .OOe-3
4.00e-4
1 .OOe-7
(21) T=303K
0.00 40000.00 100000.00 140000.00 0.00 30000.00 60000.00
(31) T=323K (32) T=333K
1 .Ooc-70 .00 8OWOO.00 2200000.00 3000000.00
9.00e-4
4.00e4
1 .OOe-70.00 150000.00 300000.00
(22) T=313K
1 .OOe-3
4.00e4
1 .ooe-7
Fig. 3.2.1. The oxidation kinetics due to reactions (Rl)-(R4) for different temperatures, S/V= 1 mYI;theinitialconditions: [Fe*+(t=O)]=O, [SO,‘-(t=O)]=O, [Fe(OH),(t=O)]=O. ConstantintimepH=5.5and concentration of dissolved oxygen, [OJ for [0&._=21 %.Horizontal axis:time in seconds, verticalaxis: concentration in moles per litre. (11 000 000 sec. = 127 days).
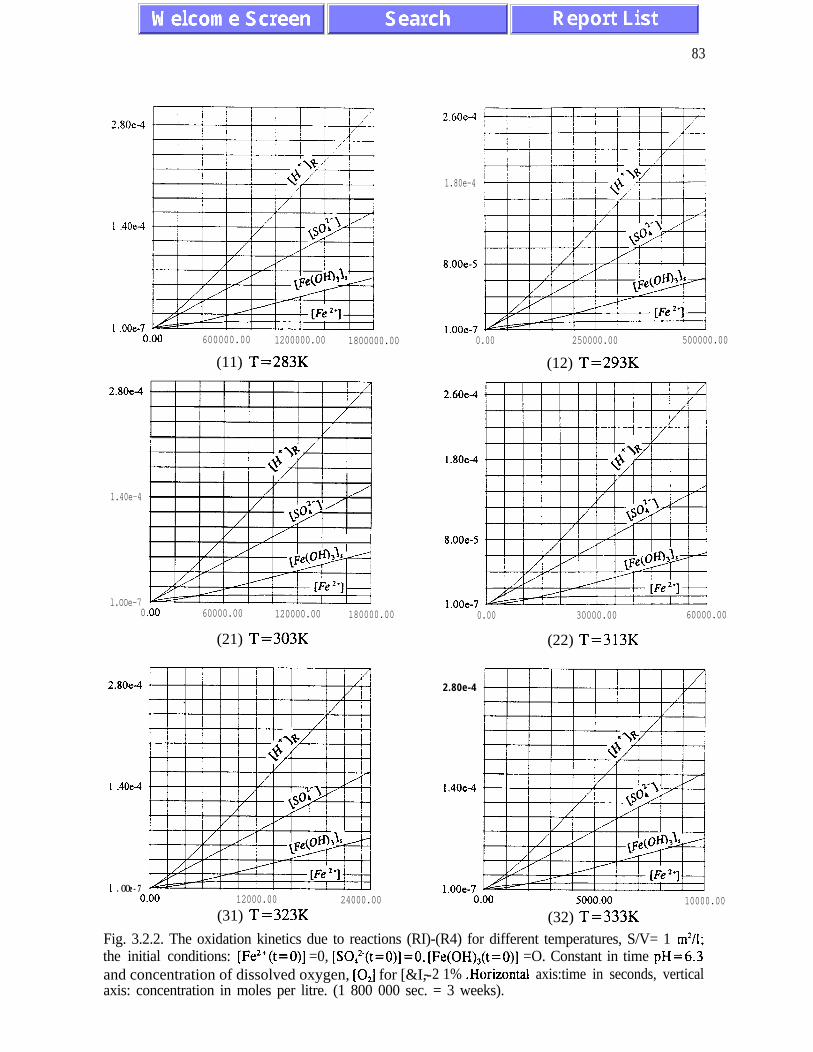
83
I .40e-4
1 .OOe-70.00 600000.00 1200000.00 1800000.00
(11) T=283K
2.80e4
1.40e-4
l.OOe-70
2.80e-4
I .40e4
I .OOe-7
iA-1 I I j
.oo 60000.00 120000.00 180000.00
(21) T=303K
l.OOe-70.00 12000.00 24000.00 0.00 5000.00 10000.00
(31) T=323K (32) T=333K
2.60e4
1.80e-4
8.00e-5
l.OOe-70.00 250000.00 500000.00
(12) T=293K
2.60e-4
1.80e4
8.00e-5
l.OOe-70.00 30000.00 60000.00
2.80e-4
1.40eA
(22) T=313K
Fig. 3.2.2. The oxidation kinetics due to reactions (RI)-(R4) for different temperatures, S/V= 1 m*/i;the initial conditions: [Fe’+(t=O)] =0, [SO,‘-(t=O)] =O, [Fe(OH),(t=O)] =O. Constant in time pH=6.3and concentration of dissolved oxygen, [OJ for [&I,-- 2 1% .Horizontal axis:time in seconds, verticalaxis: concentration in moles per litre. (1 800 000 sec. = 3 weeks).
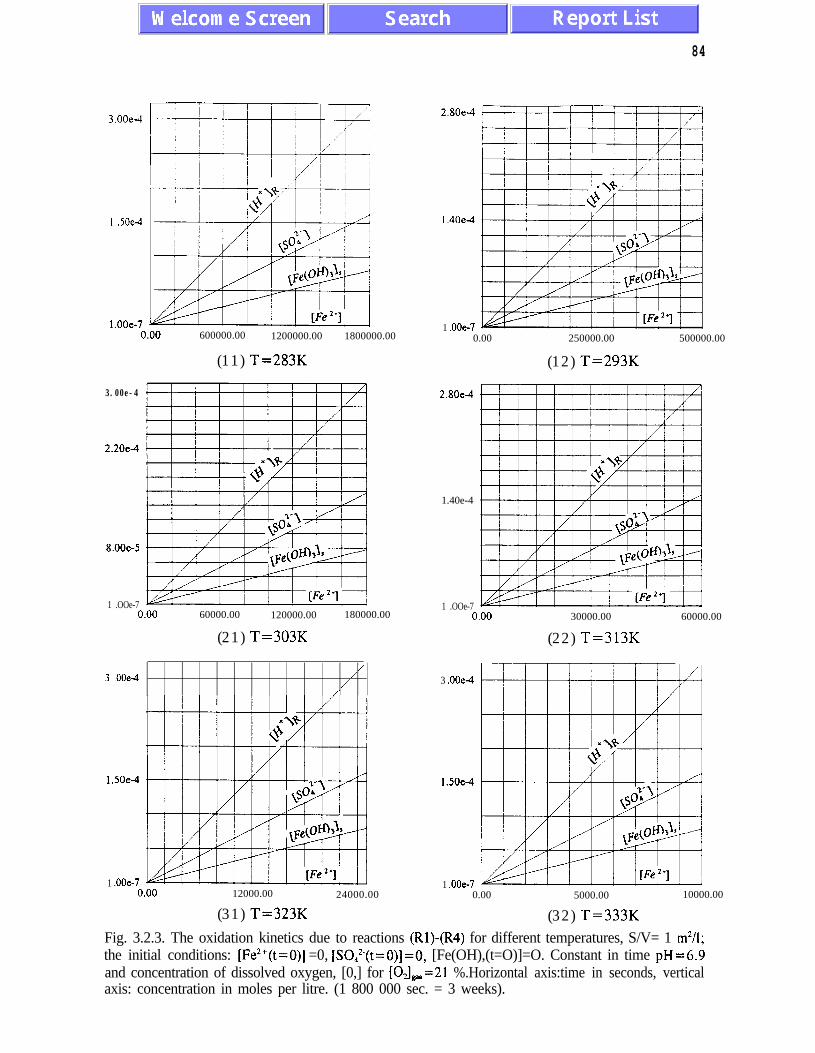
84
3.00e4
I .50e4
c
l.OOe-7 l40.00 600000.00 1200000.00 1800000.00
3.00e-4
2.20e4
8.00e-5
1 .OOe-70.00 60000.00 120000.00 180000.00
(21) T=303K
1 .OOe-70.00 250000.00 500000.00
(11) T=283K (12) T=293K
3 .OOe-4
1.50e-4
1 .OOe-7
////
0.00 12000.00 24000.00
(31) T=323K
2.80e-4
1.40e4
2.80e-4
1.40e-4
1 .OOe-70.00 30000.00 60000.00
(22) T=313K
3 .OOeA
1.50eA
1 .OOe-70.00 5000.00 10000.00
(32) T=333K
Fig. 3.2.3. The oxidation kinetics due to reactions (Rl)-(R4) for different temperatures, S/V= 1 m2/1;the initial conditions: [Fe’+(t=O)] =0, [SO,‘-(t=O)]=O, [Fe(OH),(t=O)]=O. Constant in time pH=6.9and concentration of dissolved oxygen, [0,] for IO&_+ =21 %.Horizontal axis:time in seconds, verticalaxis: concentration in moles per litre. (1 800 000 sec. = 3 weeks).
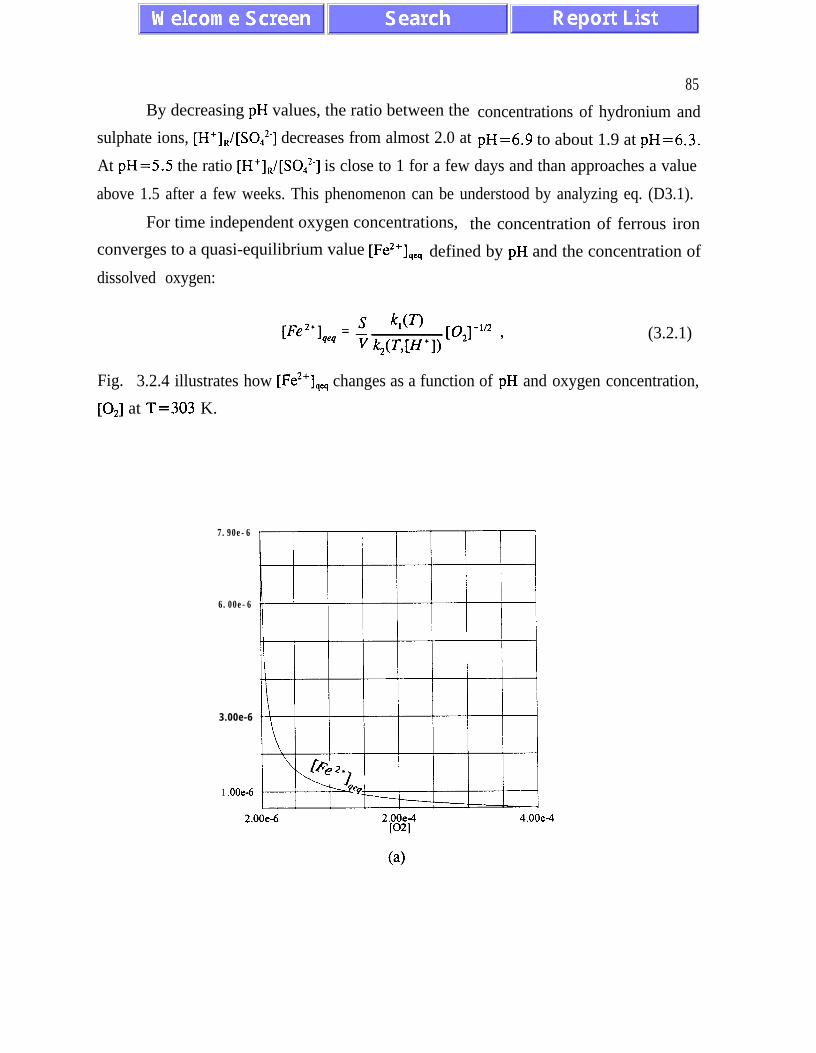
By decreasing pH values, the ratio between the concentrations of hydronium and
sulphate ions, [H+],/[S0,2-] decreases from almost 2.0 at pH=6.9 to about 1.9 at pH=6.3.
85
At pH=5.5 the ratio [H+],/[S0,2-] is close to 1 for a few days and than approaches a value
above 1.5 after a few weeks. This phenomenon can be understood by analyzing eq. (D3.1).
For time independent oxygen concentrations, the concentration of ferrous iron
converges to a quasi-equilibrium value [Fe*+&_, defined by pH and the concentration of
dissolved oxygen:
(3.2.1)
Fig. 3.2.4 illustrates how [Fe2’lsq changes as a function of pH and oxygen concentration,
[O,] at T=303 K.
7.90e-6
6.00e-6
3.00e-6
1 .OOe-6
2.00e-6 4.00e-4
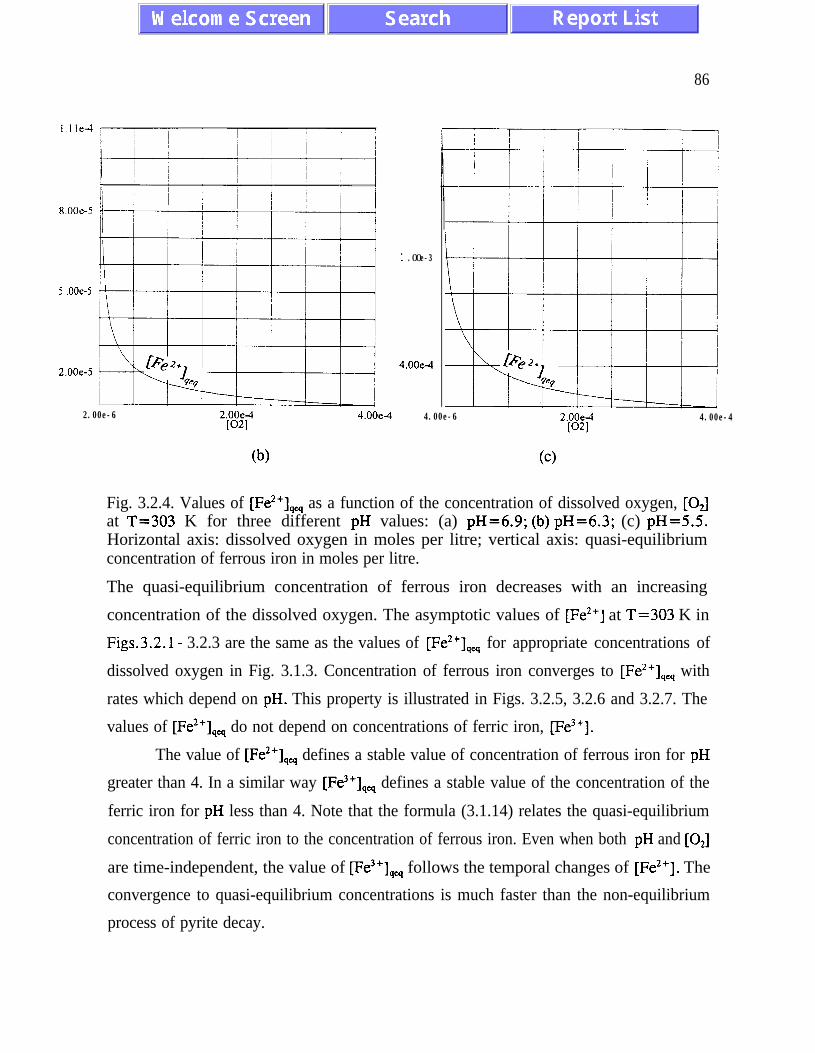
86
8.00e-5
5 .OOe-5
*.OOe-5
1 .OOe-3
4.00e4
2.00e-6 2.00e4WI
4.00e4 4.00e-6 4.00e-4
Fig. 3.2.4. Values of [Fe*‘&_., as a function of the concentration of dissolved oxygen, [O,]at T=303 K for three different pH values: (a) pH=6.9; (b) pH=6.3; (c) pH=5.5.Horizontal axis: dissolved oxygen in moles per litre; vertical axis: quasi-equilibriumconcentration of ferrous iron in moles per litre.
The quasi-equilibrium concentration of ferrous iron decreases with an increasing
concentration of the dissolved oxygen. The asymptotic values of [Fe*‘] at T=303 K in
Figs.3.2.1 - 3.2.3 are the same as the values of [Fe2’lqul for appropriate concentrations of
dissolved oxygen in Fig. 3.1.3. Concentration of ferrous iron converges to [Fe*+],+, with
rates which depend on pH. This property is illustrated in Figs. 3.2.5, 3.2.6 and 3.2.7. The
values of [Fe2’lqss do not depend on concentrations of ferric iron, [Fe3+].
The value of [Fe2+lqUI defines a stable value of concentration of ferrous iron for pH
greater than 4. In a similar way [Fe3+]_, defines a stable value of the concentration of the
ferric iron for pH less than 4. Note that the formula (3.1.14) relates the quasi-equilibrium
concentration of ferric iron to the concentration of ferrous iron. Even when both pH and [O,]
are time-independent, the value of [Fe3’lqcs follows the temporal changes of [Fe*‘]. The
convergence to quasi-equilibrium concentrations is much faster than the non-equilibrium
process of pyrite decay.
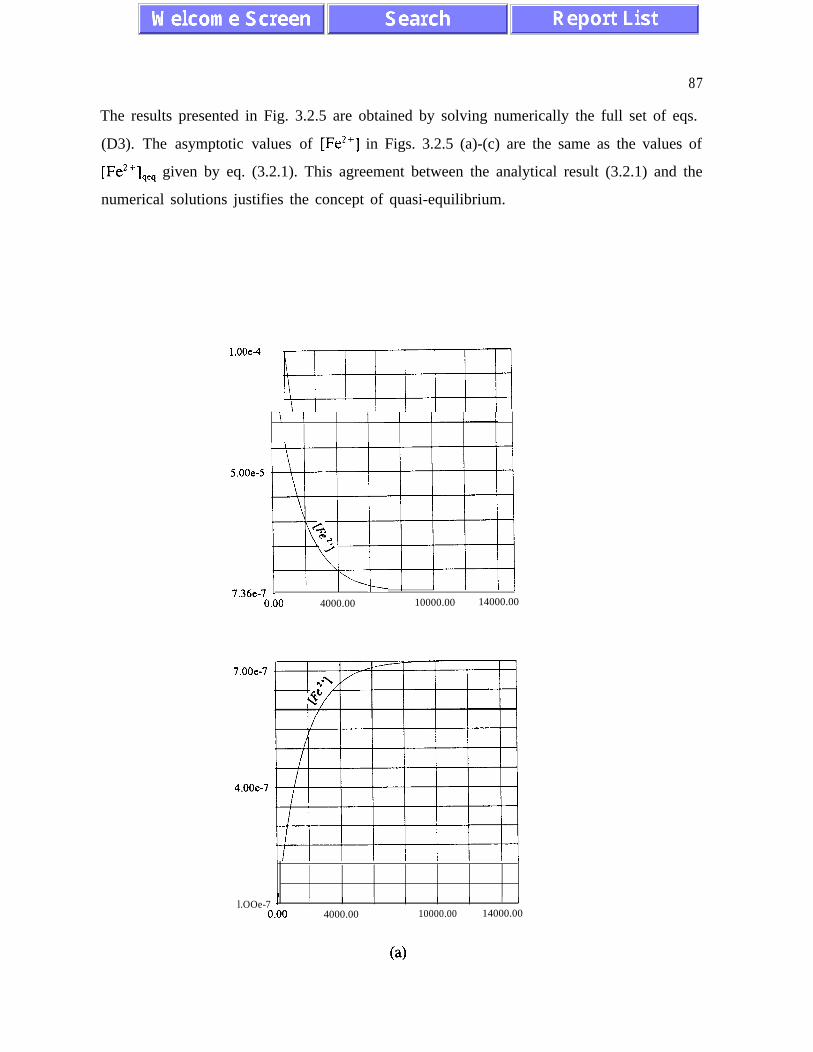
87
The results presented in Fig. 3.2.5 are obtained by solving numerically the full set of eqs.
(D3). The asymptotic values of [Fe2’] in Figs. 3.2.5 (a)-(c) are the same as the values of
[Fe2+],, given by eq. (3.2.1). This agreement between the analytical result (3.2.1) and the
numerical solutions justifies the concept of quasi-equilibrium.
1’00e4 IS.OOe-5
7.36e-7 I / I T-- ! I I I ,
0.00 4000.00 10000.00 14000.00
7.00e-7
4.00e-7
l.OOe-7 ’ I I I I I I I I
0.00 4000.00 10000.00 14000.00
(a)
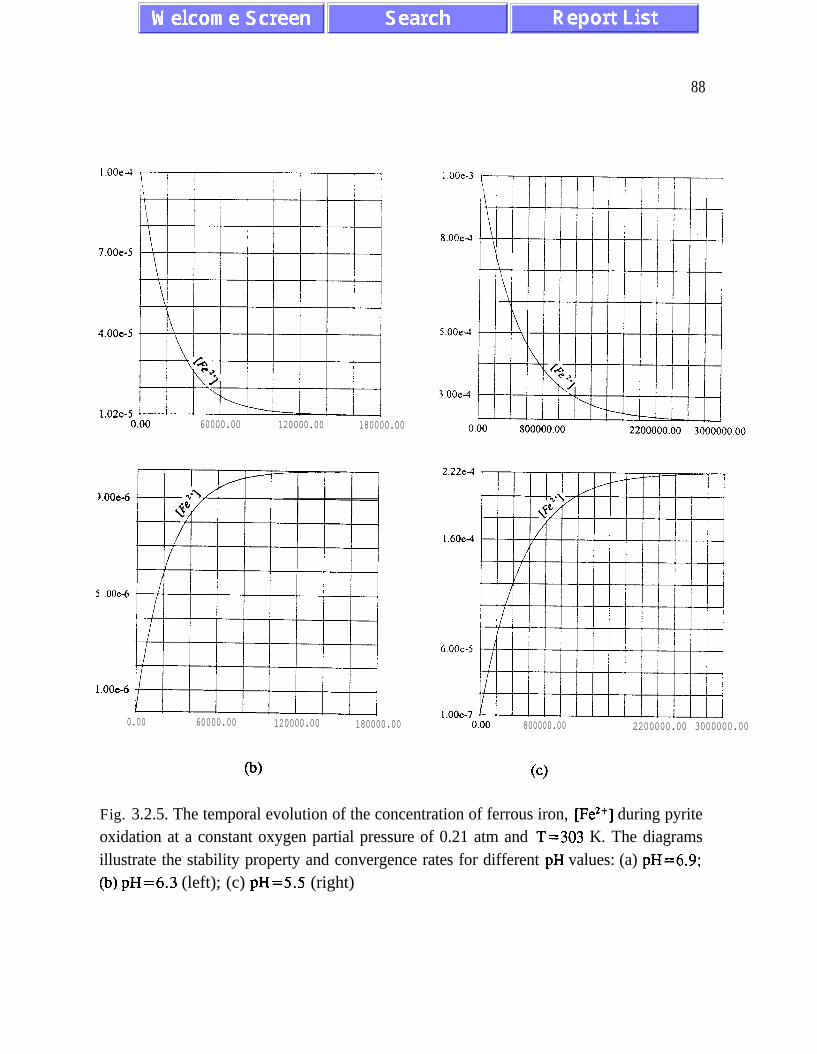
88
7.00e-5
4.00e-5
1.02e-50.00 60000.00 120000.00 180000.00
5 .OOe-6
l.OOe-6
0.00 60000.00 120000.00 180000.00
(b)
8.00e4
1.60e-4
0.00 800000.00 2200000.00 3000000.00
(4
Fig. 3.2.5. The temporal evolution of the concentration of ferrous iron, [Fe*‘] during pyriteoxidation at a constant oxygen partial pressure of 0.21 atm and T=303 K. The diagramsillustrate the stability property and convergence rates for different pH values: (a) pH=6.9;(b) pH=6.3 (left); (c) pH=5.5 (right)

89
(ii) oxygen depletion during oxidation of pyrite
We analyze the oxygen depletion rates and the inhibition of acid generation at
different temperatures for three different pH values analyzed in point III.2 (i). Our numerical
results for different values of S/V and pH are presented in Figs. 3.2.6 and 3.2.7 . It is
evident that increasing the value of S/V has the same effect on the ratio [H’]R/[S0,2-] as
decreasing pH values. By increasing the value of the active surface area per water volume,
we observe increasing rates of reaction (Rl) in which one hydronium iron is produced per
every sulphate ion.
In Figs. 3.2.6 and 3.2.7 oxygen depletion rates accelerate with temperature in a
similar way because we use similar values for the activation energies E,, b2 and G3. In
saline water, however, the activation energy for the oxidation of ferrous iron is lower than
Q3 =96 kI/mol used in our analysis [MiS], [Nip]. (We are grateful to R. Nicholson for
bringing ref. [MIS] to our attention).
3 .OOe4
1.50e-4
1 .OOe-70
2.40e4
1.20eA
1 .OOe-70 .oo 140000.00 280000.00
(a) W

90
I .80e42.38e-i
1.20e4
1.20e4
6.00e-5
1 .OOe-70.00
I .OOe-78000.00 18000.00 26000.00 0.00 8000.00 18000.00 26000.00
04 (4
Fig. 3.2.6. The consumption of dissolved oxygen at pH=6.9 for different values of S/V anddifferent temperatures. (a) S/V=lm*/l, T=283 K; (b) S/V=lm*/l, T=303 K; (c)S/V= lm*/l, T=323; (d) S/V= lOm*/l, T=303 K. Horizontal axis: time in seconds; verticalaxis: concentration in moles per litre (3 000 OOOs=35 days).
3.53e4 r-2.38e4
2.50e-4
1 .OOe4
1 .OOe-7
1.20e4
1 .OOe-70.00 80000.00 220000.00 300000.00
(a) (b)
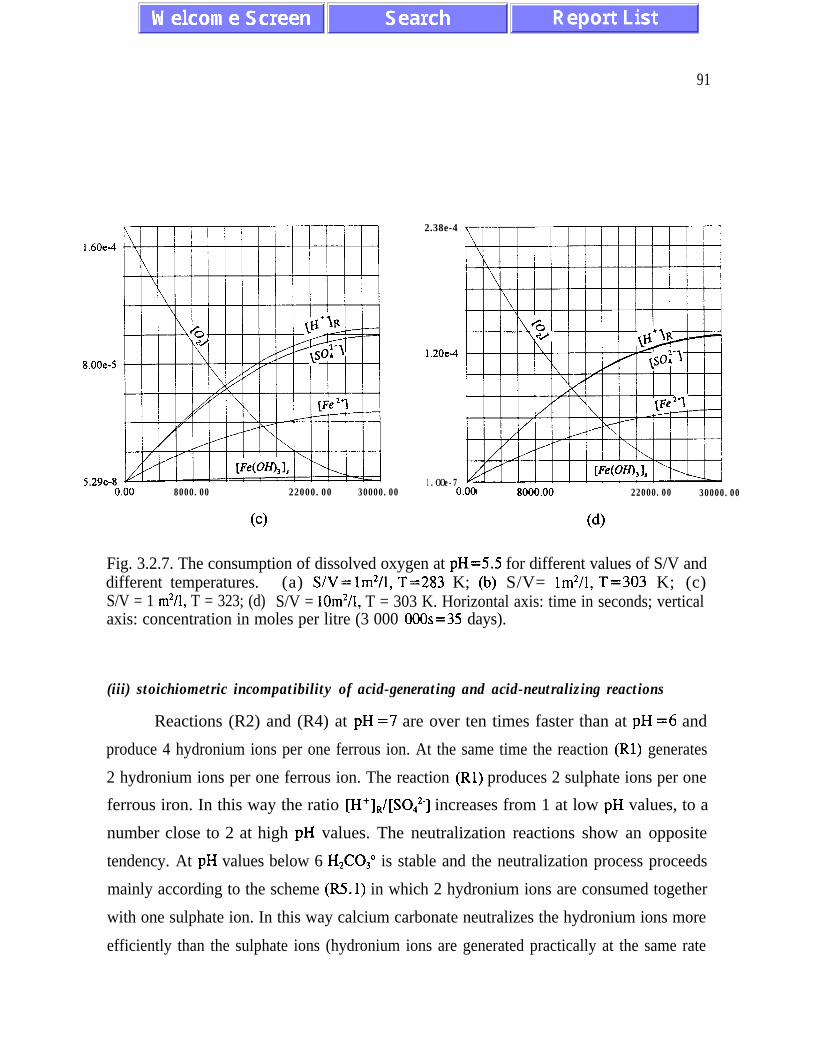
91
1.60e-4
8.00e-5
5.29e-80.00 8000.00 22000.00 30000.00
(cl
2.38e-4
1.20e-4
1 .OOe-70.00 22000.00 30000.00
09
Fig. 3.2.7. The consumption of dissolved oxygen at pH=5.5 for different values of S/V anddifferent temperatures. (a) S/V=lm2/1, T=283 K; (b) S/V= lm2/1, T=303 K; (c)S/V = 1 m’/l, T = 323; (d) S/V = 10m2/1, T = 303 K. Horizontal axis: time in seconds; verticalaxis: concentration in moles per litre (3 000 OOOs=35 days).
(iii) stoichiometric incompatibility of acid-generating and acid-neutralizing reactions
Reactions (R2) and (R4) at pH =7 are over ten times faster than at pH =6 and
produce 4 hydronium ions per one ferrous ion. At the same time the reaction (Rl) generates
2 hydronium ions per one ferrous ion. The reaction (Rl) produces 2 sulphate ions per one
ferrous iron. In this way the ratio [H’]R/[S0,2-] increases from 1 at low pH values, to a
number close to 2 at high pH values. The neutralization reactions show an opposite
tendency. At pH values below 6 H2COso is stable and the neutralization process proceeds
mainly according to the scheme (R5.1) in which 2 hydronium ions are consumed together
with one sulphate ion. In this way calcium carbonate neutralizes the hydronium ions more
efficiently than the sulphate ions (hydronium ions are generated practically at the same rate
92
as sulphate ions at pH below 6). We observe an opposite tendency at pH=7. At pH=7
HC03- is stable and the neutraiization process proceeds mainly according to the scheme (6.2)
in which only 1 hydronium ion is consumed per 1 sulphate ion. Because at pH=7 the
hydronium ions are produced faster than the sulphate ions we conclude that the neutralization
process becomes inefficient and expensive. In order to eliminate both the hydronium and
sulphate ions we have to use more neutralizing agents at pH=7 than at pH =6. This results
in a larger amount of sludge which also has a negative environmental impact. At the same
time it is environmentally desirable to maintain high values of pH close to 7 in effluent
water. To solve this dilemma, it seems that a two-step neutralization process should be used.
At first, neutralization should take place according to scenario lo, then the effluent (weakly
acidic) water should be further neutralized to reach an environmentally friendly pH value.
The two competitive stoichiometric effects associated with the neutralization process
and affecting the cost efficiency, are not the only effects which should be considered in a
future study. It was suggested that ferric hydroxide precipitates on mineral surfaces and leads
to slower rates of pyrite oxidation [NiG]. The neutralizing minerals become coated by
secondary precipitates as well. This may lead to a lower neutralizing potential. The process
of formation and precipitation of ferric hydroxide (as described by reactions (R3) and (R4))
is faster at higher pH values. Other precipitates like siderite (FeCO,) also affect (indirectly)
rates of acid generation and neutralization. One should be able to estimate the importance
of this effect in relation to the efficiency of the neutralization process discussed above.
We could not find in the literature systematic quantitative experimental results on the
effectiveness of the neutralization process as a function of pH values, stoichiometry of
hydronium and sulphate formation and coating by precipitating compounds (see [MoJ] and
references therein). These aspects seem to merit further experiments and modelling studies
which may result in practical decisions leading to reduced quantities of sludge.
93
111.3. Quasi-equilibrium evolution of concentrations of ferric and ferrous iron and the
absence of chemical oscillations
One of the working ideas which motivated this study was the hypothesis about
chemical oscillations and the possible chaotic behaviour of time dependent concentrations of
species formed during pyrite oxidation [Go]. Indeed, the diagram presented on page 5
suggests indeed that the feedback mechanism between the reactions of oxidation of ferrous
iron and pyrite oxidation by ferric iron might be responsible for chemical oscillations. There
are known examples of model chemical systems in which a similar feedback leads to an
oscillatory behaviour pr], [NIP], [Ty], [An]. Because the number of chemical species
involved in pyrite oxidation is greater than three, one might expect a chaotic behaviour [An],
CTYI.
A classical example of a chemical system exhibiting nonlinear oscillations is the
Brusselator defined by the stoichiometric relations [Nip]:
(1):/4+X ) (2): B +X-Y +D , (3): 2X + Y+3X , (4): X+E .
and the rate equations:
9 = &Ml -(&PI +k,Ml +k,PlKl +~3W12[y1 -k3F13 ,
T = ~2[~lExJ-~_2~~l~rJ-~3~xJ2~~+~-3~x13 .
(BRl) .
(BR3
The coefficients k and k-i are the rate constants for the direct (from left to right) and the
reverse (from right to left) reactions described by the stoichiometric relations (BRl). The
model describes a reactor with the fina.l products D and E removed from the reaction space
as soon as they are formed. The concentrations of species A and B are in excess. In this way
the kinetic equations for [A], [B], [D], and [E] can be disregarded. Both the Brusselator and
the acid rock drainage model describe non-equilibrium processes. The fact that we deal with
a chemical system at non-equilibrium does not exclude by itself the possibility of chemical
94
oscillations. As a matter of fact the values of concentrations [A] and [B] in eq. (BR2) must
be different from zero for oscillations to exist. The parameters k, and k, describe the rates
of decomposition of chemical compounds which are in excess and whose concentrations do
not change significantly over time. A key property of equations (BR2), which leads to
chemical oscillations, is the presence of a so called focal point in the phase space, which
becomes unstable when the concentration [B] exceeds a certain critical value. This property
results from a particular form of the nonlinear terms in the kinetic equations for (BR2)
[Nip], [OtL]. #
There is some analogy between the Brusselator and the pyrite oxidation problem. We
have a large initial amount of pyrite and nonlinear terms in eqs. (Dl)-(D3), but they do not
produce oscillations. We do not present mathematical details in this report, instead, we use
illustrative numerical results which show that the concentration of ferric iron and ferrous iron
converge to the quasi-equilibrium values defined by eqs.(3.1 S) and (3.2.1). We call the
concentrations [Fe3+],, and [Fe2’], defined by eqs.(3.1.5) and (3.2.1) quasi-equilibrium
states for the following reasons:
(i) concentrations of ferric and ferrous iron evolve to quasi-equilibrium values both when
the initial concentration is greater than the quasi-equilibrium value and when the initial
concentration is less than the quasi-equilibrium values
(ii) the initial relative evolution rates (d[Fe3+]/dt)/[Fe3+] and (d[Fe2’]/dt)/[Fe2’] for the
concentrations of ferric and ferrous iron are much greater than the relative rate
(d[FeS,],/dt)/[Fe&J at which pyrite is oxidized ([FeS,], denotes the total amount of pyrite
reacted per one litre of water, [FeS,] denotes the total amount of unreacted pyrite).
(iii) the quasi-equilibrium values evolve according to the equations (3.1 S) and (3.2.1)
which describe a slow adiabatic evolution of the ferric and ferrous species
Properties (i) - (iii) are illustrated in Fig. 3.2.4 where the full set of equations (D3) is solved
numerically for two different initial values of [Fe2+]. A good measure of the relative rates
are the quantities (d[Fe3’]/dt)/[Fe3’], (d[Fe2’]/dt)/[Fe2’] and (dm+]/dt)/[H+]. Fig.3.2.4
demonstrates that the concentration [Fe”] evolves to the value [Fe2’], and that [Fe2+lqc4
follows the slowly evolving values of the concentrations of other species, according to eqs.
(D3). The observed behaviour is a direct consequence of the fact that the derivative

95
d[Fe2+]/dt changes its sign at [Fe2+] =[Fe’+],,. d[Fe2+]/dt is negative for [Fe2+] > [FezC],,,
and positive for [Fe2+] < [Fe2+],,, (i.e. the concentration increases when it is initially below
the quasi-equilibrium value and decreases when it is above the quasi-equilibrium value). The
concentration of ferrous iron after a relatively short time converges to [Fe’+&_ which shows
only a weak time dependence in comparison with the initial change. A rigorous
mathematical stability analysis of the set of kinetic equations for pyrite oxidation will be
presented in our forthcoming publications [Otp].
96
IV. BACTERIALOXIDATION OFPYRITE
This chapter presents the results of our analysis of the experimental data on bacterial
oxidation at pH values less than 4. The processes involved in bacterial oxidation are treated
in a similar way as the abiotic reactions. An important new element in our analysis is the
introduction of coupling between all the elementary abiotic and bacterial processes. In
previous modelling efforts [Se] abiotic and bacterial processes were characterized by an
overall rate of pyrite oxidation expressed as
R*ot = Rehem +Rbact
Such an approach is often appropriate for the kinetics characterized by linear processes.
Unfortunately the experimental data reviewed in Chapter II indicate that pyrite oxidation
involves strongly nonlinear processes which require a consistently nonlinear approach. The
bacterial oxidation cannot be considered as independent from the abiotic processes. A direct
consequence of the nonlinear coupling between the individual chemical reactions is the
presence of quasi-equilibrium concentrations of transient species, which define the total rates
of pyrite oxidation. Proper understanding of the complex chemical kinetics is necessary for
the development of a reliable physical model which may become a useful tool for prediction,
prevention and monitoring of acid mine drainage.
The main results presented in this chapter can be summarized as follows:
1. The anaerobic bacterial oxidation of pyrite by ferric iron (reaction (B3)) is introduced for
the first time to the kinetic model. The rate constant governing the reaction (B3) and a
kinetic equation are derived and provide a good agreement with experimental data. At 30°C
the anaerobic pyrite oxidation by ferric iron is accelerated by about 250% when Thiobacillus
ferrooxidans are present at concentrations of 1 gram per litre.
2. The kinetic formula for the bacterial oxidation of ferrous iron, introduced previously by
Suzuki et al. [SuL], is modified and gives a satisfactory quantitative description of
97
competitive inhibition observed at bacterial concentrations between 0.1 g and 1 .O g of cells
per litre. In the presence of Thiobacillus ferrooxidans the reaction of the oxidation of ferrous
iron is over a million times faster than in the analogous abiotic reaction.
3. The rate constant for pyrite oxidation by dissolved oxygen is determined. At a
concentration of 1 gram of cells per litre, the bacterial reaction (B3) is three hundred times
faster than the analogous abiotic reaction (Rl).
4. A realistic formula is proposed for the temperature dependence of rate constants governing
the bacterial processes.
5. Kinetic equations for reactions (Bl), (B2) and (B3) are derived and included in a kinetic
model together with the abiotic reactions (Rl), (R2) and (R3).
6. The kinetic model is analyzed for various temperatures and various concentrations of
dissolved oxygen. The coupled chemical and bacterial reactions do not produce temporal
oscillations of the transient and final products. During the nonequilibrium process of pyrite
oxidation the concentrations of ferric and ferrous iron evolve to quasi-equilibrium values
which depend on pH, concentration of dissolved oxygen, concentration of bacteria,
temperature and other factors. (This conclusion is valid only in the absence of the transport
processes and does not exclude the possibility of nonlinear oscillations as the result of a
competition between the chemical and biological reactions and processes of mass and energy
transport which should be included in a future physical model).
7. The reactions (B2) and (B3) provide a negative feedback mechanism which is responsible
for a negative response of the chemical system when the concentration of oxygen decreases.
A decreasing oxygen concentration results in an increased quasi-equilibrium concentration
of ferrous iron. Because the rate of oxidation of ferrous iron is proportional to the
concentration of ferrous iron and also controls the rate of anaerobic pyrite oxidation by ferric
iron, the effect of lowering oxygen concentration, while still significant, is much weaker than
previously expected.
8. Oxygen consumption rates during bacterial oxidation of pyrite are very high and are
98
controlled by the oxygen transport to a much greater extent than abiotic oxidation. In
underwater disposal, oxygen diffusion in water seems to be an even more significant factor
limiting oxidation rates more effectively than in waste rock piles.
9. The negative feedback mechanism is also responsible for maintaining moderately low pH
values during bacterial activity. Thiobacillus ferrooxidans exhibit a chemistatic action by
maintaining moderately low pH values at which the pyrite oxidation is very fast. This is a
strong nonlinear effect resulting directly from the form of pH and temperature dependence
of the bacterial activity. Because hydronium ions are consumed during the reaction of
oxidation of ferrous iron, and ferric iron reaches high concentrations, pH values decrease
relatively slowly and remain for a long time at the optimum level for bacterial processes.
Consequently, the bacterial activity takes place longer than one would expect by analyzing
a simplified model in which reactions (Bl), (B2) and (B3) are not included as separate
processes.
10. At a high concentration of bacteria, the concentration of ferric iron may become even
greater than the concentration of ferrous iron. The ferric iron may then oxidize pyrite after
bacterial activity decreases when pH becomes very low. This may be viewed as a delayed
bacterial oxidation of pyrite.
11. At 30°C and a bacteria concentration on the order of 1 gram of bacteria per one litre of
water, the overall process of bacterial oxidation of pyrite is over a thousand times faster than
at the same temperature in the absence of bacteria - the bacterial oxidation during one week
has an environmental impact greater than the abiotic oxidation during one year (see Figs.
4.1.1, 4.1.2, 3.1.7 and 3.1.8).
12. The bacterial oxidation at temperatures between 20°C and 40°C is much faster than the
abiotic oxidation at temperatures twenty degrees higher.
13. We do not know of any experimental data on the rates of bacterial oxidation of ferrous
iron for concentrations [Fe’+] < 1mM and on the dependence of reactions (Bl) and (B3), on
oxygen concentration and the ratio between active pyrite surface area, S and cell
concentration [cell]. It seems quite possible that reactions (Bl) and (B3) show effects of
99
competitive inhibition when the bacteria concentration increases. Further experiments may
provide useful information which may lead to modifications in our model.
We have extrapolated the laboratory results to longer times, with oxygen
concentrations and temperatures different than in previous experiments. We have used
experimental data obtained under laboratory conditions which may be significantly different
than field conditions. In particular, Eh and pe values were not monitored in previous
experiments and may be important for bacterial processes. Some of the assumptions
introduced in our model require verification by further experiments. The results obtained by
computer simulation should be confronted with the available field data and calibrated before
the kinetic model developed here is used as part of a comprehensive physical waste rock
model.
In paragraphs IV.O.0 -1V.O.3, a detailed quantitative analysis of experimental data on
bacterial oxidation is presented and elementary kinetic equations for individual reactions are
derived and solved. The full set of coupled kinetic equations is analyzed in paragraphs 4.1.1
and 4.1.2. The model is constructed in a modular form which provides a high level of
flexibility to include new information.
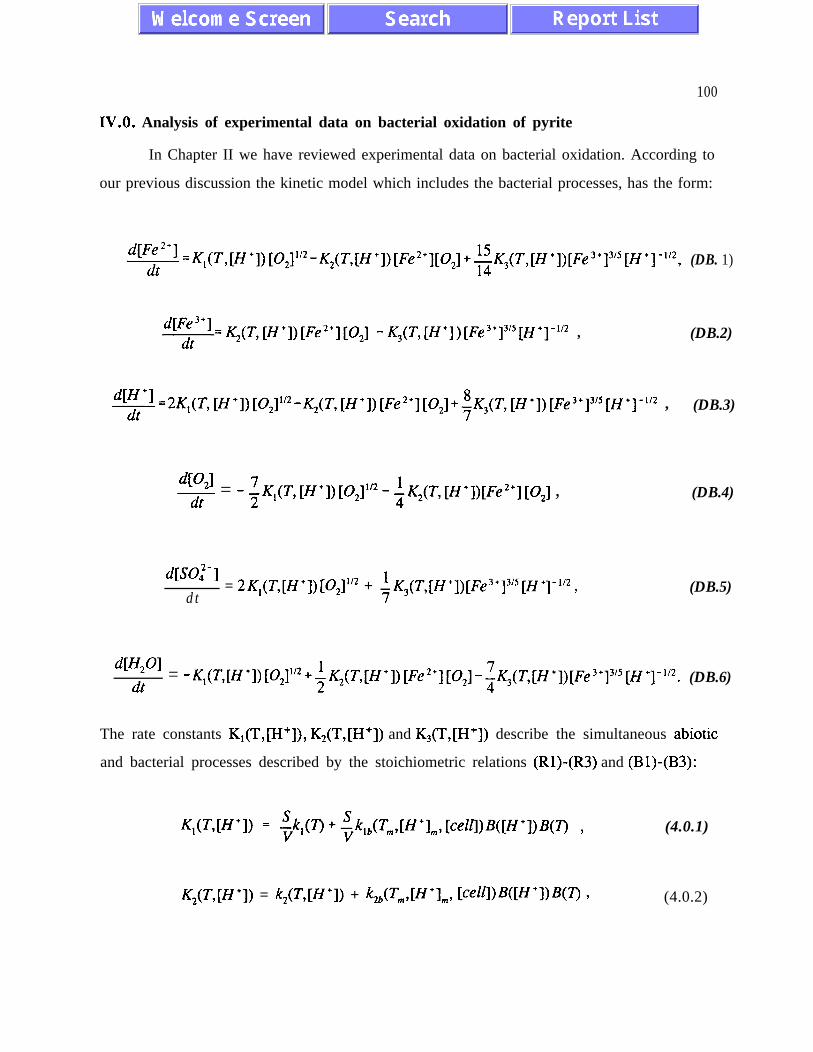
100
IV.0. Analysis of experimental data on bacterial oxidation of pyrite
In Chapter II we have reviewed experimental data on bacterial oxidation. According to
our previous discussion the kinetic model which includes the bacterial processes, has the form:
d~~t2+1=~,(T,[H+])[o2]“‘-~*(~,[H’I)[Fe”+][o2]+~K,(T,[H’])[Fe”+]3~5[H+]-~~2, (DB. 1)
d[Tt3+1 =KJT,[H+])[Fe*+][O,] -K3(T,[H+])[Fe3']3'5[H+]-1'2 , (DB.2)
~=2K,(~,[H+])[O2]“2-~2(T,[H+])[Fe2+][O2]+~K,(T,[H+])[Fe)+]3’5[H+]~1’2 , (DB.3)
d[O,l- = -~K,(T,[H+])[02]1'2-+K2(T,[H+])[Fe2'][02] ,dt
(DB.4)
d[SO:-]
dt= 2K,(T,[H’]) [0*]1’2 + +K3(T,[H+])[Fe3+]3’s[H+]-1’2 , (DB.5)
dW,Oldt
= -K,(T,[H ‘I) [O,]“* +~~*(~,[H+])[Fr”][02]-~~3(~,[H+])[Fe?’l+]-1’2. (DB.6)
The rate constants K,(T.,[H+]), K,(T,[H+]) and K,(T,[H+]) describe the simultaneous abiotic
and bacterial processes described by the stoichiometric relations (Rl)-(R3) and (Bl)-(B3):
(4.0.1)
K,(T,[H+]) = k,(T,[H+l) + k,(T,,W+l,+ WllPUH’lP(T) I (4.0.2)
101
(4.0.3)
The rate constants k,, k, and k, govern the abiotic reactions and are defined in Chapters II and
III. The rate coefficients k,,,, kZb and k,, for the bacterial processes assume their maximum
values at temperature T,, and the hydronium ions concentration [H+], . The optimum
conditions for bacterial activity of Thiobacillus ferrooxidans are strain dependent. The value
of T, is usually between 298K and 313K. Optimum pH values (defined by pH, =-log([H+],,,))
vary between 2 and 3. The coefficients klb, kTb and k3,, depend also on bacterial cell
concentration, [cell]. The coefficients B(T) and B([H+]) describe temperature and pH
dependence of bacterial activity. In paragraphs IV.O.0 - IV.0.3 experimental data are used to
determine values of rate coefficients for the bacterial processes.
In paragraph 4.0.0, we discuss the pH and temperature dependence of the bacterial
activity. This analysis is followed by a discussion of the elementary kinetic equations for
reactions (Bl)-(B3). We proceed in a different order than in Chapter III and analyze in
paragraph 4.0.1, the anaerobic reaction (B3). In paragraph 4.0.2 the reaction (B2) is analyzed.
The rate constant for the reaction (Bl) cannot be measured directly but can be determined
indirectly from the quantitative information on reactions (B2) and (B3) as described in
paragraph 4.0.3.
102
IV.O.0. Temper&we and pH dependence of bacterial activity
The coefficients B(T) and B([H+]) are defined as
B(T) = exp[ -c(T-T,)]1.4( 1 -th[d(T-T,)3]) , (4.0.3)
B([H+]) = (1 + lo”+- +l@=“z)(l + 1061-pH+l~H-6z)-* , (4.0.4)
where b,=(br+b*)/2.
The coefficient B(T) has its maximum value B(T,J = 1 at a temperature T, which is different
for different strains of bacteria. The coefficient B([H]) has its maximum value
B([H]=O.OOQ=l at pH=-log[H]=2.3. The rate constants kb define maximum rates for
reactions (Bl), (B2) and (B3). We assume that the bacterial activity for each of the
elementary reactions shows the same temperature and pH dependence. We do not have,
however, a confirmation of this assumption by independent experiments.
The coefficient B(T) is obtained by fitting the formula (4.0.3) to the experimental data
presented in Fig.2.9. (The coefficient B(T) is different than the one used in RATAP model
[Se] ). In Fig. 4.0.1 we illustrate the coefficients B(T) for two different sets of fitting
parameters in eq. (4.0.3). In Fig. 4.0.la B(T) is defined by
c=O.O5, d=0.0005 (4.0.5)
and has its maximum at T,=303K (30°C). In Fig. 4.0.lb
c=o.o4, d=0.002 (4.0.6)
and B(T) has two maxima as the upper experimental curve in Fig.2.9. The powers 1.4 and
3 in the expression (4.0.3) can be changed to fit other experimental data. Because B(T)
depends on the difference T-T,,,, a change in the value of T,,, results in shifting the plots in
Fig. 4.0.1.
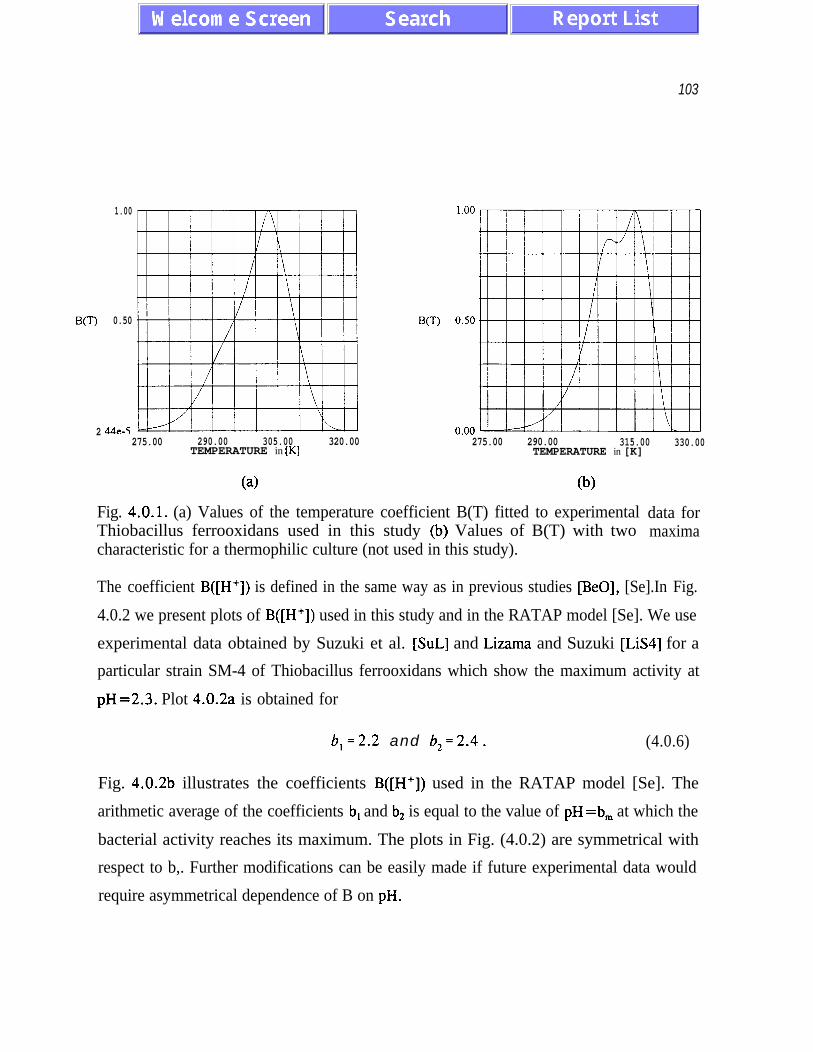
103
W-0
2
1.00
0.50
44e-5275.00 290.00 305.00 320.00 275.00 290.00 315.00 330.00
TEMPERATURE in [K] TEMPERATURE in [K]
1.00
0.50
0.00
(4 0)Fig. 4.0.1. (a) Values of the temperature coefficient B(T) fitted to experimentalThiobacillus ferrooxidans used in this study (b) Values of B(T) with twocharacteristic for a thermophilic culture (not used in this study).
data formaxima
The coefficient B([H+]) is defined in the same way as in previous studies [BeO], [Se].In Fig.
4.0.2 we present plots of B([H+]) used in this study and in the RATAP model [Se]. We use
experimental data obtained by Suzuki et al. [SuL] and Lizama and Suzuki [LiS4] for a
particular strain SM-4 of Thiobacillus ferrooxidans which show the maximum activity at
pH=2.3. Plot 4.0.2a is obtained for
b,=2.2 and b,=2.4. (4.0.6)
Fig. 4.0.2b illustrates the coefficients B([H+]) used in the RATAP model [Se]. The
arithmetic average of the coefficients b, and b2 is equal to the value of pH=b, at which the
bacterial activity reaches its maximum. The plots in Fig. (4.0.2) are symmetrical with
respect to b,. Further modifications can be easily made if future experimental data would
require asymmetrical dependence of B on pH.
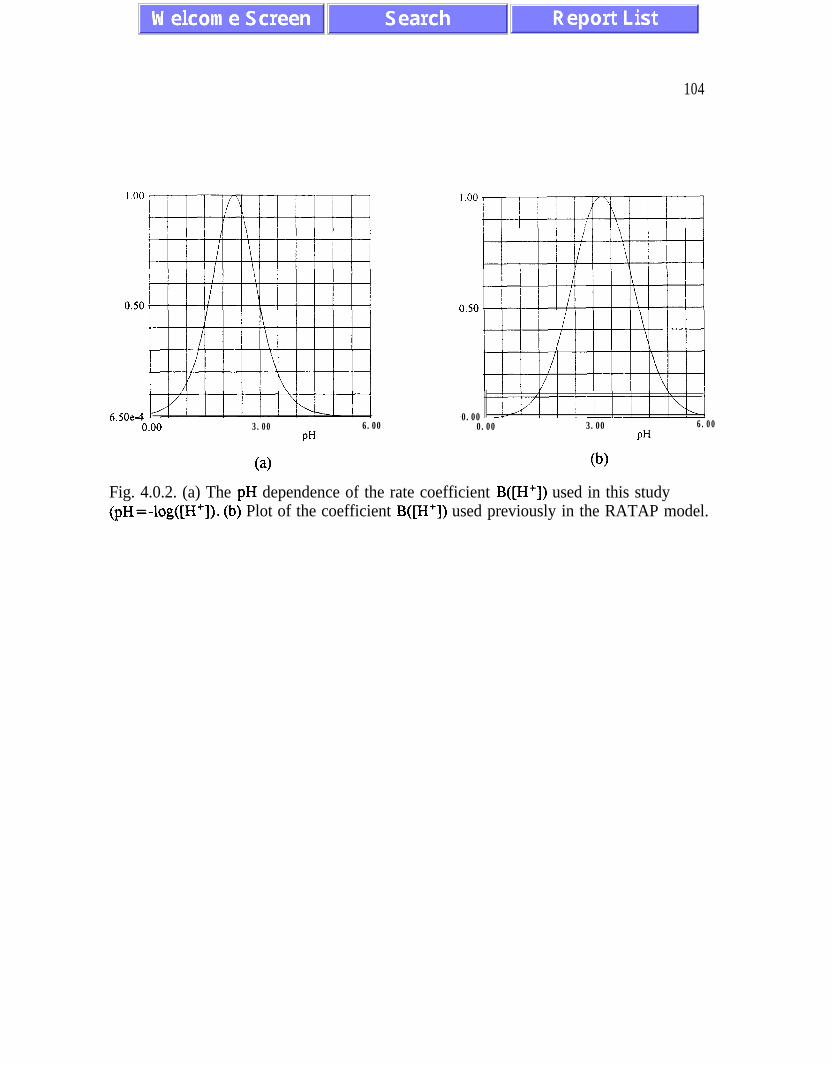
104
6.50e-40.00 3.00
(a)
PH6.00
0.000.00 3.00 6.00
PH
00
Fig. 4.0.2. (a) The pH dependence of the rate coefficient B([H+]) used in this study@H=-log([H+]). (b) Plot of the coefficient B([H+]) used previously in the RATAP model.
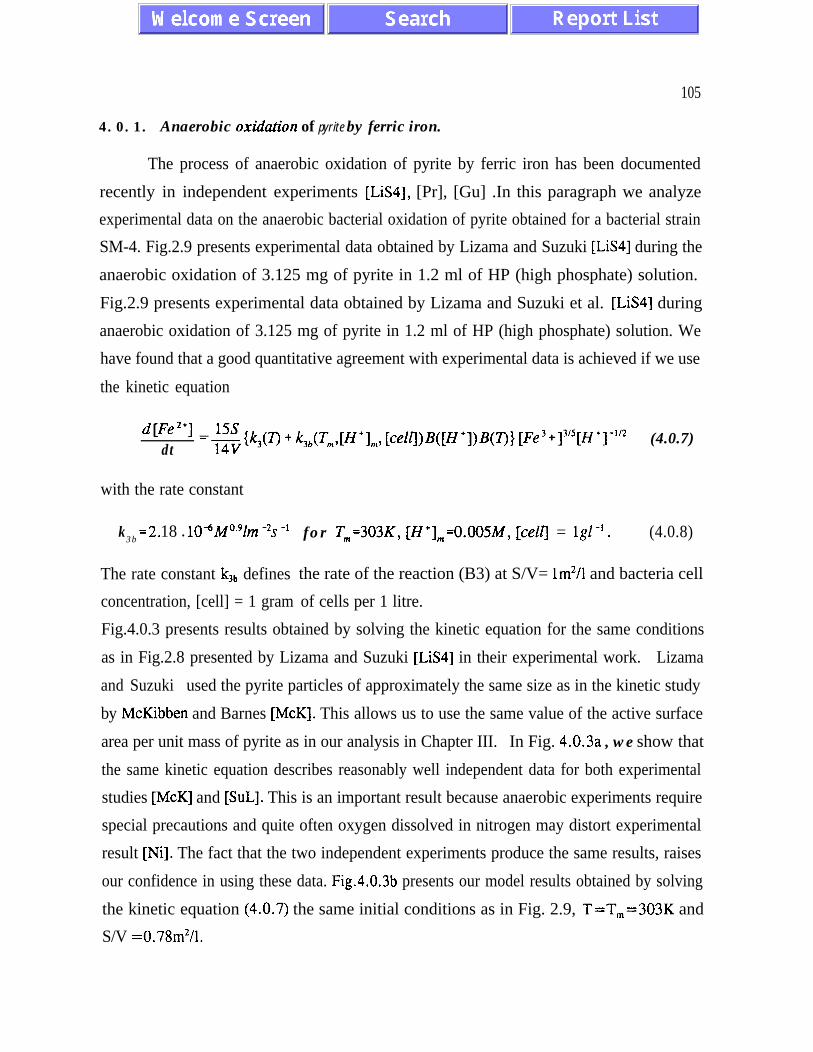
105
4.0.1. Anaerobic oxzih.tion of pyrite by ferric iron.
The process of anaerobic oxidation of pyrite by ferric iron has been documented
recently in independent experiments [LiS4], [Pr], [Gu] .In this paragraph we analyze
experimental data on the anaerobic bacterial oxidation of pyrite obtained for a bacterial strain
SM-4. Fig.2.9 presents experimental data obtained by Lizama and Suzuki [LiS4] during the
anaerobic oxidation of 3.125 mg of pyrite in 1.2 ml of HP (high phosphate) solution.
Fig.2.9 presents experimental data obtained by Lizama and Suzuki et al. [LiS4] during
anaerobic oxidation of 3.125 mg of pyrite in 1.2 ml of HP (high phosphate) solution. We
have found that a good quantitative agreement with experimental data is achieved if we use
the kinetic equation
d[Fe*+] _ 15sdt - ,,,(k,(T) +
with the rate constant
k =2 18 l 10”M”.91m -*s -’3b ’
The rate constant k3b defines
concentration, [cell] = 1 gram
k3b(T,,,,[H+]n,, [ceZl])B([H+])B(T)} [E’e3+]3’5[H+]-1’2 (4.0.7)
for Tm=303K, [H+]m=0.005M, [cell] = lgl-’ . (4.0.8)
the rate of the reaction (B3) at S/V= lm*/l and bacteria cell
of cells per 1 litre.
Fig.4.0.3 presents results obtained by solving the kinetic equation for the same conditions
as in Fig.2.8 presented by Lizama and Suzuki [LiS4] in their experimental work. Lizama
and Suzuki used the pyrite particles of approximately the same size as in the kinetic study
by McKibben and Barnes [McK]. This allows us to use the same value of the active surface
area per unit mass of pyrite as in our analysis in Chapter III. In Fig. 4.0.3a , we show that
the same kinetic equation describes reasonably well independent data for both experimental
studies [McK] and [SuL]. This is an important result because anaerobic experiments require
special precautions and quite often oxygen dissolved in nitrogen may distort experimental
result [Nil. The fact that the two independent experiments produce the same results, raises
our confidence in using these data. Fig.4.0.3b presents our model results obtained by solving
the kinetic equation (4.0.7) the same initial conditions as in Fig. 2.9, T=T,=303K and
S/V =0.78m2/1.
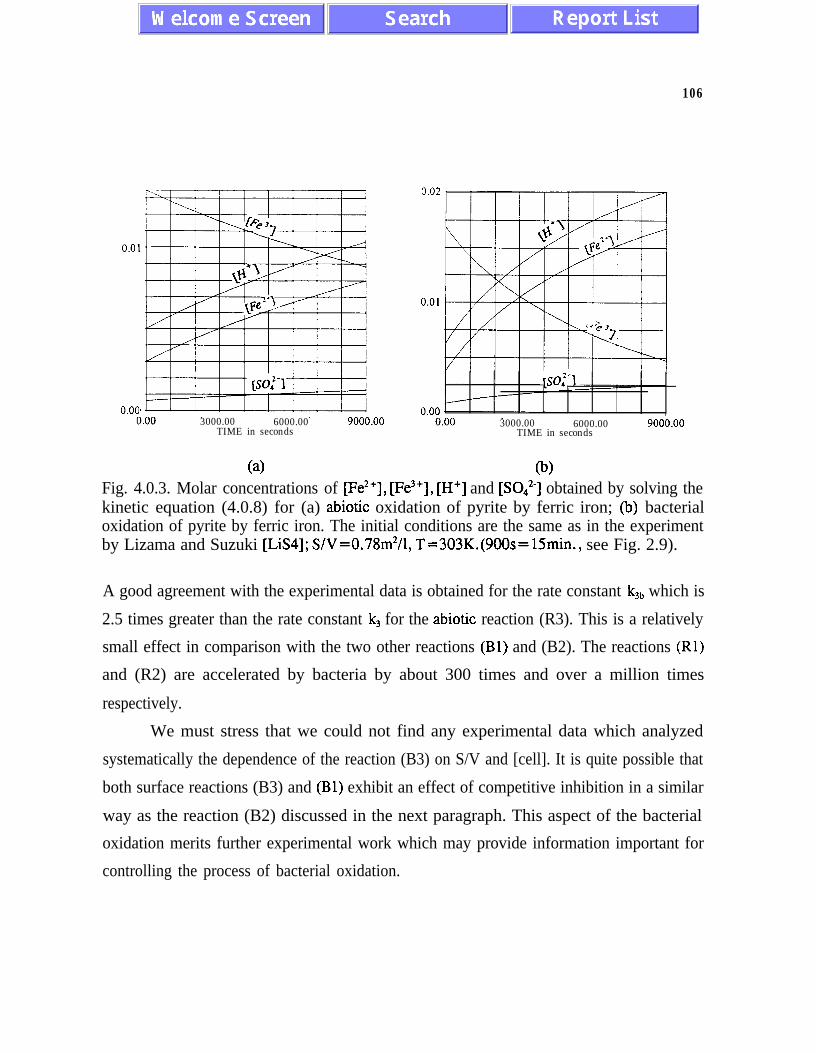
106
0.003000.00 6000.00
TIME in seconds3000.00 6000.00
TIME in seconds
(4 (b)Fig. 4.0.3. Molar concentrations of [Fe”], [Fe3+], [H+] and [SO,*-] obtained by solving thekinetic equation (4.0.8) for (a) abiotic oxidation of pyrite by ferric iron; (b) bacterialoxidation of pyrite by ferric iron. The initial conditions are the same as in the experimentby Lizama and Suzuki [LiS4]; S/V=0.78m2/1, T=303K.(9OOs=15min., see Fig. 2.9).
A good agreement with the experimental data is obtained for the rate constant k,, which is
2.5 times greater than the rate constant k, for the abiotic reaction (R3). This is a relatively
small effect in comparison with the two other reactions (Bl) and (B2). The reactions (Rl)
and (R2) are accelerated by bacteria by about 300 times and over a million times
respectively.
We must stress that we could not find any experimental data which analyzed
systematically the dependence of the reaction (B3) on S/V and [cell]. It is quite possible that
both surface reactions (B3) and (Bl) exhibit an effect of competitive inhibition in a similar
way as the reaction (B2) discussed in the next paragraph. This aspect of the bacterial
oxidation merits further experimental work which may provide information important for
controlling the process of bacterial oxidation.
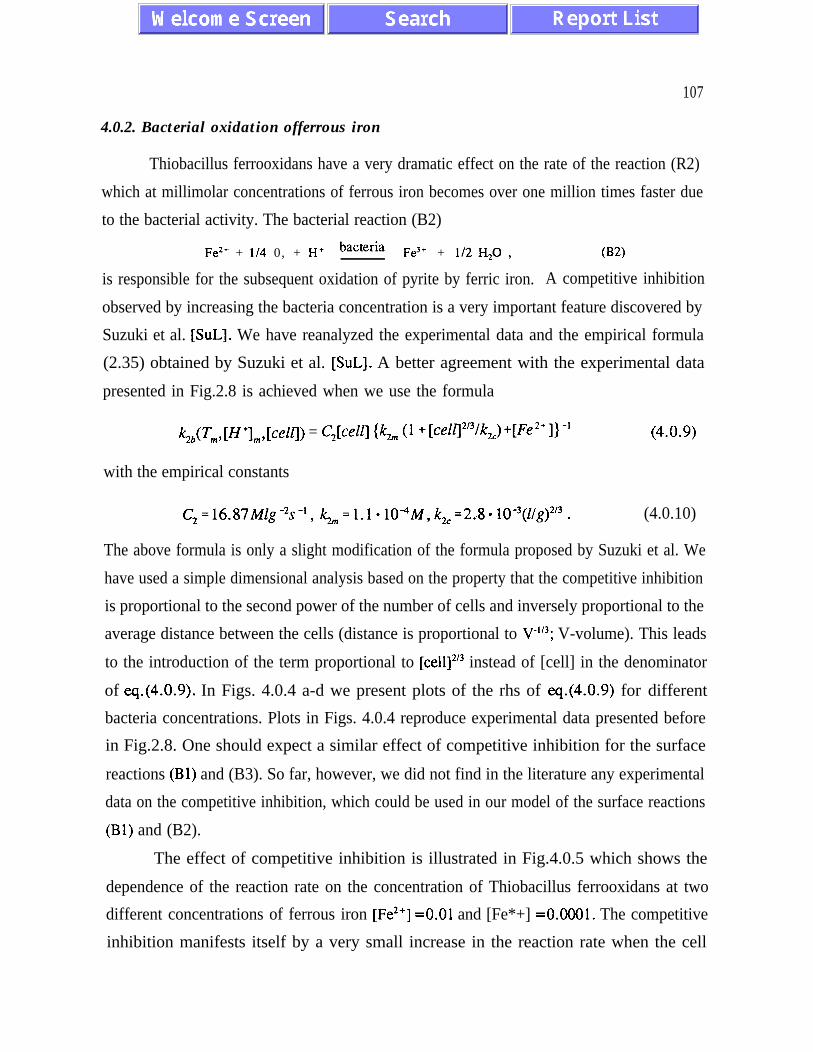
107
4.0.2. Bacterial oxidation offerrous iron
Thiobacillus ferrooxidans have a very dramatic effect on the rate of the reaction (R2)
which at millimolar concentrations of ferrous iron becomes over one million times faster due
to the bacterial activity. The bacterial reaction (B2)
Fe*+ + l/4 0, + H+ bacteria Fd+ + l/2 H,O , 032)
is responsible for the subsequent oxidation of pyrite by ferric iron. A competitive inhibition
observed by increasing the bacteria concentration is a very important feature discovered by
Suzuki et al. [SuL]. We have reanalyzed the experimental data and the empirical formula
(2.35) obtained by Suzuki et al. [SuL]. A better agreement with the experimental data
presented in Fig.2.8 is achieved when we use the formula
k,(Tm,[H+]m,[ceZZj) = C,[ceZl] {k2, (1 +~ce~112’3~~2,)+~~~2+l~~’ (4.0.9)
with the empirical constants
C2=16.87Mlg-*s-l, k,=1.1~104M,k,=2.8~10-3(Z/g)2’3. (4.0.10)
The above formula is only a slight modification of the formula proposed by Suzuki et al. We
have used a simple dimensional analysis based on the property that the competitive inhibition
is proportional to the second power of the number of cells and inversely proportional to the
average distance between the cells (distance is proportional to Vn3; V-volume). This leads
to the introduction of the term proportional to [cell]*” instead of [cell] in the denominator
of eq.(4.0.9). In Figs. 4.0.4 a-d we present plots of the rhs of eq.(4.0.9) for different
bacteria concentrations. Plots in Figs. 4.0.4 reproduce experimental data presented before
in Fig.2.8. One should expect a similar effect of competitive inhibition for the surface
reactions (Bl) and (B3). So far, however, we did not find in the literature any experimental
data on the competitive inhibition, which could be used in our model of the surface reactions
(Bl) and (B2).
The effect of competitive inhibition is illustrated in Fig.4.0.5 which shows the
dependence of the reaction rate on the concentration of Thiobacillus ferrooxidans at two
different concentrations of ferrous iron [Fe*‘] =O.Ol and [Fe*+] =O.OOOl. The competitive
inhibition manifests itself by a very small increase in the reaction rate when the cell
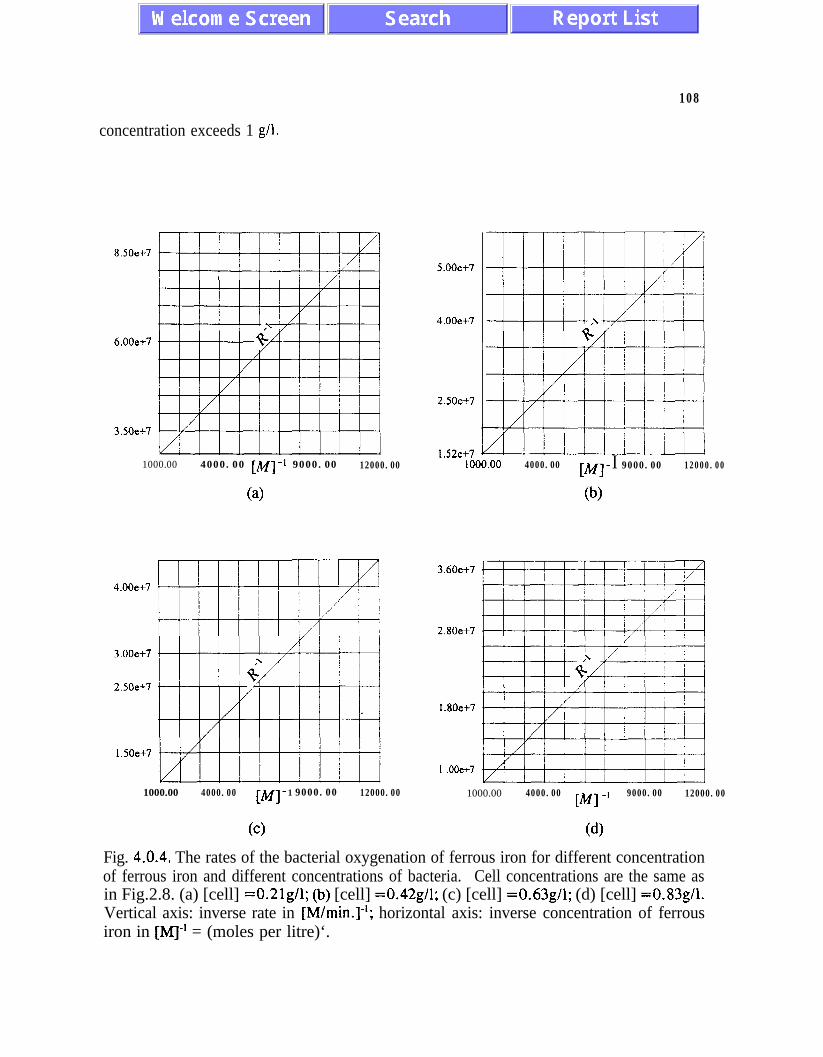
108
concentration exceeds 1 g/l.
8.50e+7
6.00e+7
3SOe+7
1000.00 4000.00 [Ml-' 9000.00 12000.00
(a>
4.00e+7
3.00e+7
2.50e+7
lSOe+7
1000.00 4000.00 [Ml- 1 9000.00 12000.00
w
5.00e+7
4.00e+7
2.50e+7
1.52e+7 i1000.00 4000.00 WI-I 9000.00 12000.00
(b)
3.60e+7
2.80e+7
1.80e+7
1 .OOe+7
1000.00 4000.00 [Ml -’ 9000.00 12000.00
(4Fig. 4.0.4. The rates of the bacterial oxygenation of ferrous iron for different concentrationof ferrous iron and different concentrations of bacteria. Cell concentrations are the same asin Fig.2.8. (a) [cell] =0.21g/l; (b) [cell] =0.42g/l; (c) [cell] =0.63g/l; (d) [cell] =0.83g/l.Vertical axis: inverse rate in [M/min.]-‘; horizontal axis: inverse concentration of ferrousiron in [Ml-’ = (moles per litre)‘.
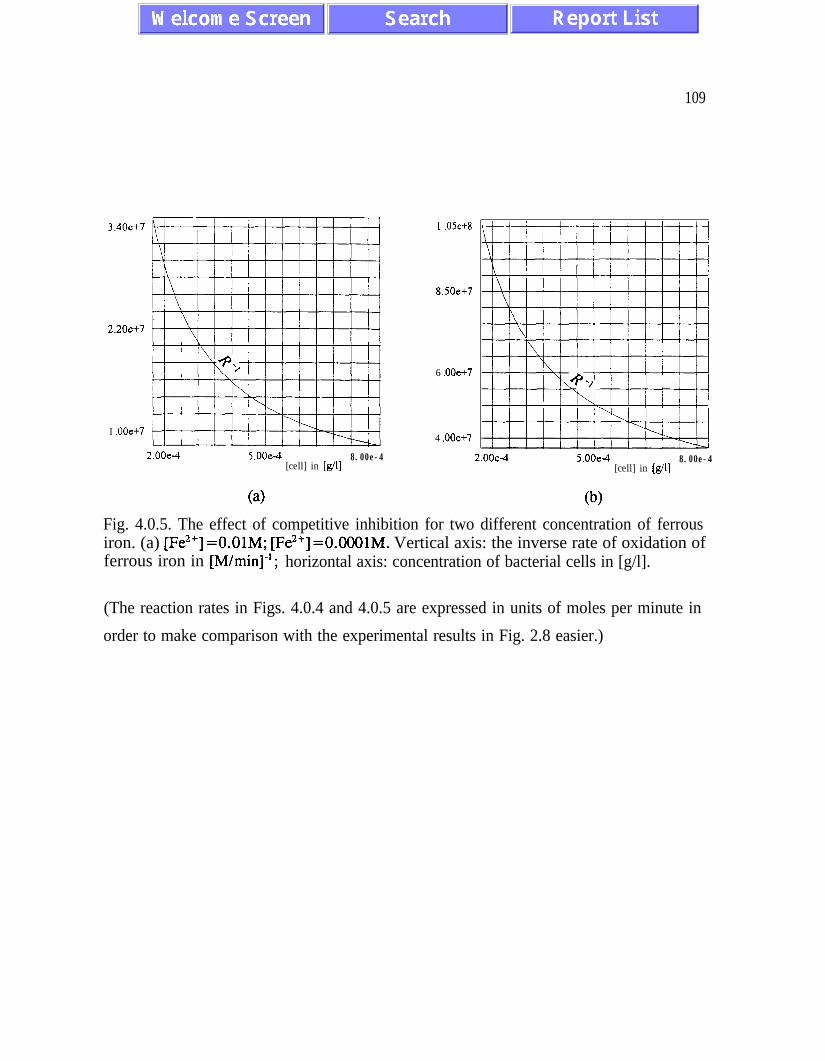
109
3.40e+7
2.20e+7
I .OOe+7
I .05e+8
8.50e+7
6 .OOe+7
4 .OOe+7
2.00e4 5.00e-4 8.00e-4[cell] in [g/l]
2.00e4 5.00e-4 8.00e-4[cell] in [gill
GO (b)Fig. 4.0.5. The effect of competitive inhibition for two different concentration of ferrousiron. (a) [Fe2’]=0.01M; [Fe2+]=0.0001M. Vertical axis: the inverse rate of oxidation offerrous iron in [M/min]-* ; horizontal axis: concentration of bacterial cells in [g/l].
(The reaction rates in Figs. 4.0.4 and 4.0.5 are expressed in units of moles per minute in
order to make comparison with the experimental results in Fig. 2.8 easier.)
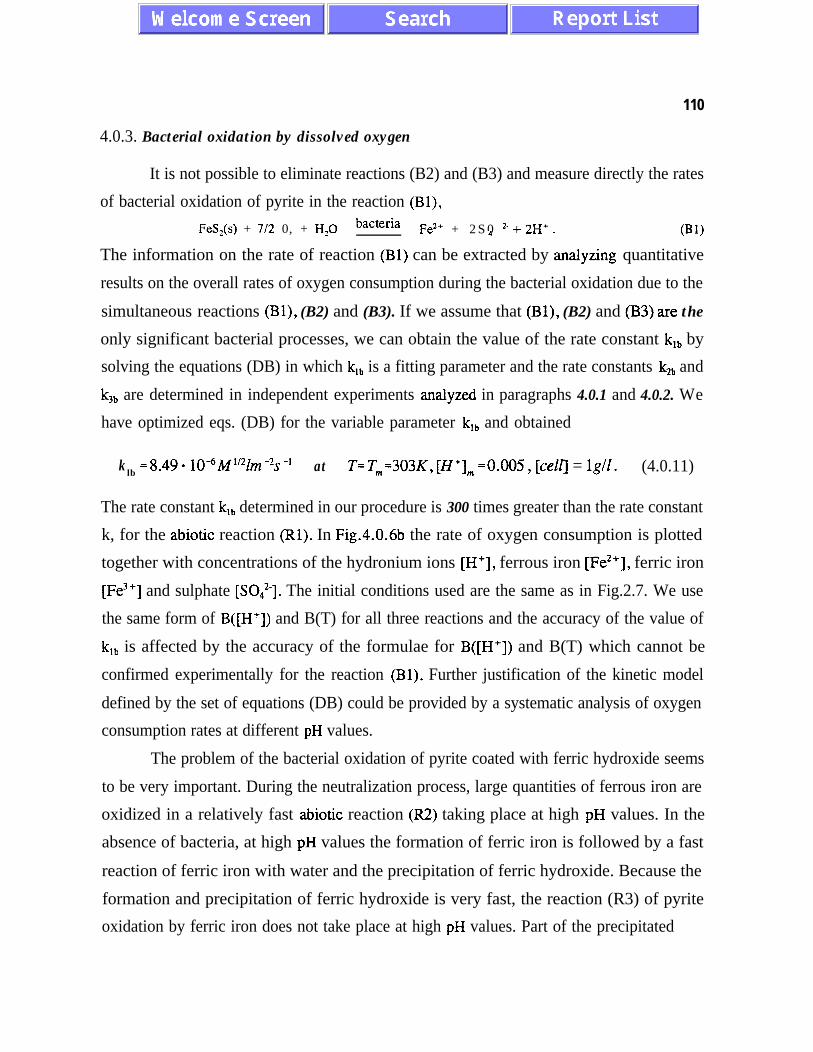
110
4.0.3. Bacterial oxidation by dissolved oxygen
It is not possible to eliminate reactions (B2) and (B3) and measure directly the rates
of bacterial oxidation of pyrite in the reaction (Bl),
FeS,(s) + 7/2 0, + H,O bacteria Fe2’ + 2 S 0 2- + 2H’ .4 031)
The information on the rate of reaction (Bl) can be extracted by analyzing quantitative
results on the overall rates of oxygen consumption during the bacterial oxidation due to the
simultaneous reactions (Bl), (B2) and (B3). If we assume that (Bl), (B2) and (B3) a.re the
only significant bacterial processes, we can obtain the value of the rate constant klb by
solving the equations (DB) in which k,, is a fitting parameter and the rate constants kZb and
k3b are determined in independent experiments analyzed in paragraphs 4.0.1 and 4.0.2. We
have optimized eqs. (DB) for the variable parameter k,, and obtained
k =8 490 10dM1’2Zm-2s-’lb - at T=Tm=303K, [H’], =0.005, [ceZZj = lgll. (4.0.11)
The rate constant k,, determined in our procedure is 300 times greater than the rate constant
k, for the abiotic reaction (Rl). In Fig.4.0.6b the rate of oxygen consumption is plotted
together with concentrations of the hydronium ions [H+], ferrous iron [Fe2’], ferric iron
[Fe3+] and sulphate [SO,2-]. The initial conditions used are the same as in Fig.2.7. We use
the same form of B([H+]) and B(T) for all three reactions and the accuracy of the value of
klb is affected by the accuracy of the formulae for B([H+]) and B(T) which cannot be
confirmed experimentally for the reaction (Bl). Further justification of the kinetic model
defined by the set of equations (DB) could be provided by a systematic analysis of oxygen
consumption rates at different pH values.
The problem of the bacterial oxidation of pyrite coated with ferric hydroxide seems
to be very important. During the neutralization process, large quantities of ferrous iron are
oxidized in a relatively fast abiotic reaction (R2) taking place at high pH values. In the
absence of bacteria, at high pH values the formation of ferric iron is followed by a fast
reaction of ferric iron with water and the precipitation of ferric hydroxide. Because the
formation and precipitation of ferric hydroxide is very fast, the reaction (R3) of pyrite
oxidation by ferric iron does not take place at high pH values. Part of the precipitated
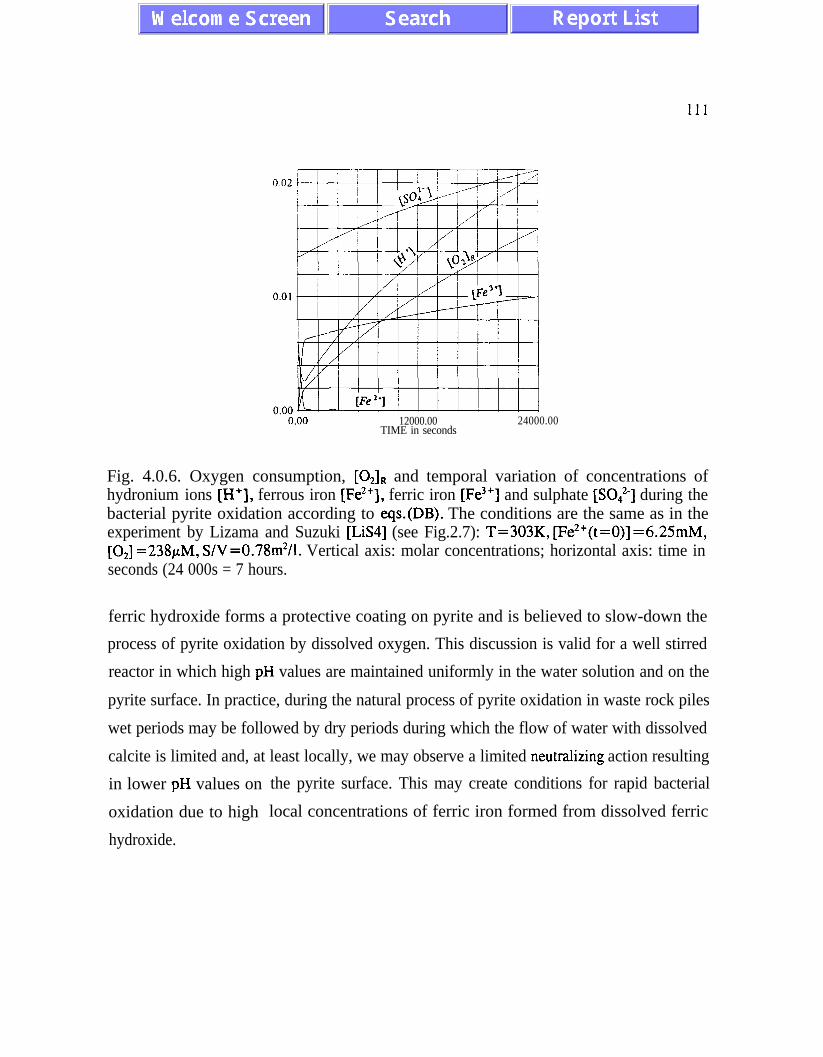
111
12000.00TIME in seconds
24000.00
Fig. 4.0.6. Oxygen consumption, [O& and temporal variation of concentrations ofhydronium ions [H+], ferrous iron [Fe2+], ferric iron [Fe3’] and sulphate [S0,2-] during thebacterial pyrite oxidation according to eqs.(DB). The conditions are the same as in theexperiment by Lizama and Suzuki [LiS4] (see Fig.2.7): T=303K, [Fe2’(t=O)]=6.25mM,[O,] =23@M, S/V=0.78m2/1. Vertical axis: molar concentrations; horizontal axis: time inseconds (24 000s = 7 hours.
ferric hydroxide forms a protective coating on pyrite and is believed to slow-down the
process of pyrite oxidation by dissolved oxygen. This discussion is valid for a well stirred
reactor in which high pH values are maintained uniformly in the water solution and on the
pyrite surface. In practice, during the natural process of pyrite oxidation in waste rock piles
wet periods may be followed by dry periods during which the flow of water with dissolved
calcite is limited and, at least locally, we may observe a limited neutralizing action resulting
in lower pH values on
oxidation due to high
hydroxide.
the pyrite surface. This may create conditions for rapid bacterial
local concentrations of ferric iron formed from dissolved ferric
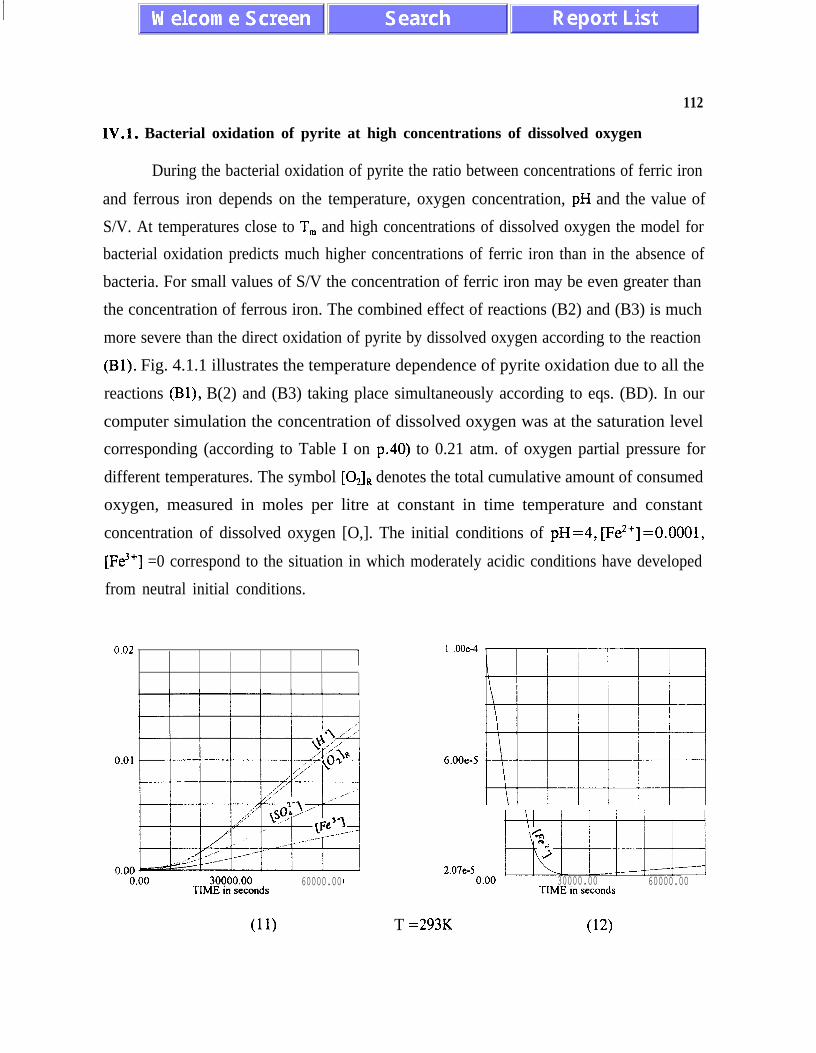
112
IV.1. Bacterial oxidation of pyrite at high concentrations of dissolved oxygen
During the bacterial oxidation of pyrite the ratio between concentrations of ferric iron
and ferrous iron depends on the temperature, oxygen concentration, pH and the value of
S/V. At temperatures close to T, and high concentrations of dissolved oxygen the model for
bacterial oxidation predicts much higher concentrations of ferric iron than in the absence of
bacteria. For small values of S/V the concentration of ferric iron may be even greater than
the concentration of ferrous iron. The combined effect of reactions (B2) and (B3) is much
more severe than the direct oxidation of pyrite by dissolved oxygen according to the reaction
(Bl). Fig. 4.1.1 illustrates the temperature dependence of pyrite oxidation due to all the
reactions (Bl), B(2) and (B3) taking place simultaneously according to eqs. (BD). In our
computer simulation the concentration of dissolved oxygen was at the saturation level
corresponding (according to Table I on p.40) to 0.21 atm. of oxygen partial pressure for
different temperatures. The symbol [O& denotes the total cumulative amount of consumed
oxygen, measured in moles per litre at constant in time temperature and constant
concentration of dissolved oxygen [O,]. The initial conditions of pH=4, [Fe2+]=0.0001,
[Fe3+] =0 correspond to the situation in which moderately acidic conditions have developed
from neutral initial conditions.
0.02 1
“.__0.00 60000.00
l .OOe-4
6.00e-5
2.07e_5 r0.00 30000.00 60000.00
TlMEinsecon&
(11) T =293K (12)
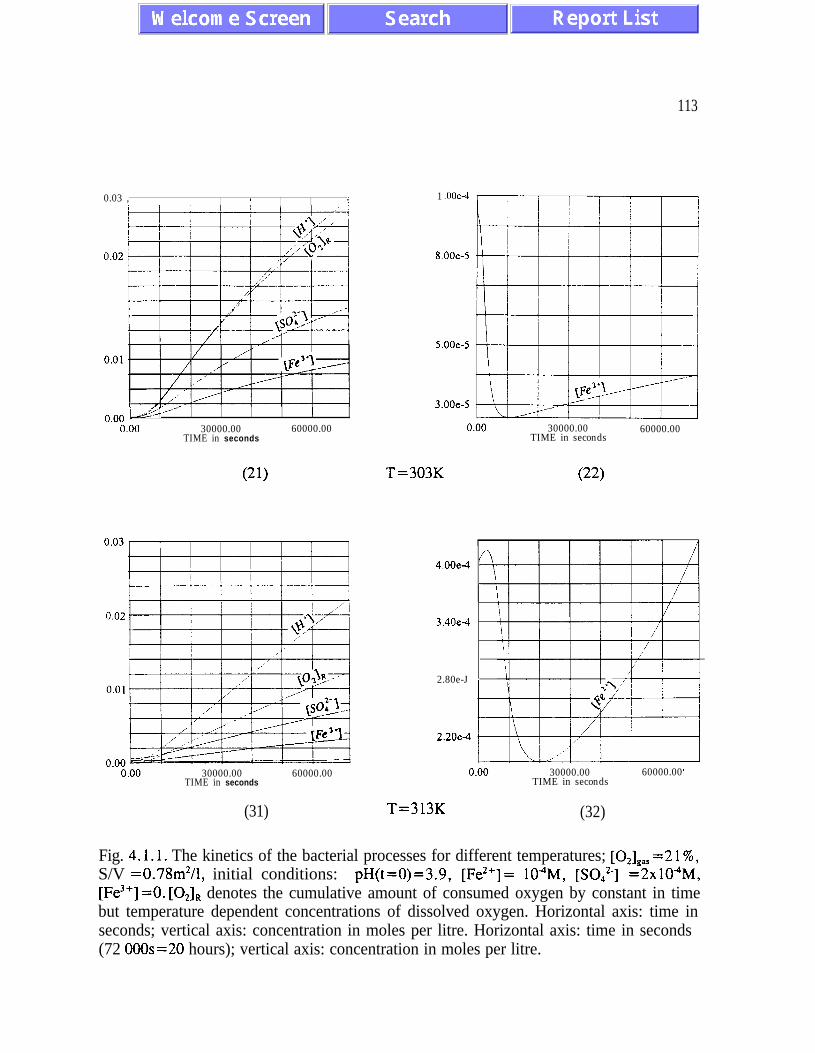
113
0.03 , I / I I 4 1 .OOeJ
8.00e-5
& _*r
0.00 1 -A !0.00 30000.00 60000.00
TIME in seconds
(21) T=303K
30000.00TIME in seconds
60000.00
(31) T=313K (32)
S.OOe-5
3.00e-5
30000.00TIME in seconds
60000.00
(22)
4.00e4
3.40e4
2.80e-J
2.20e4
30000.00TIME in seconds
60000.00
Fig. 4.1-l. The kinetics of the bacterial processes for different temperatures; [O,],,, =2 1%)S/V =0.78m2/1, initial conditions: pH(t=O)=3.9, [Fe2’]= lOaM, [S0,2-] =2x10AM,[Fe3+]=0. [O,], denotes the cumulative amount of consumed oxygen by constant in timebut temperature dependent concentrations of dissolved oxygen. Horizontal axis: time inseconds; vertical axis: concentration in moles per litre. Horizontal axis: time in seconds(72 OOOs=20 hours); vertical axis: concentration in moles per litre.
114
Fig.4.1.1 also demonstrates that the concentration of ferrous iron evolves to the quasi-
equilibrium value. The quasi-equilibrium concentration of ferrous iron is the smallest at
T,=303K. The initial increase of [Fe2’] in Fig. 4.1.1(32) is due to the fact that at pH values
close to 4 the bacterial activity is small and the dominant role is played by the reaction (Rl).
We also present results of the numerical simulation for high initial concentration of
ferric iron, [Fe3+(t=O)]=0.01. As we see in Fig. 4.1.2 ferric iron is initially rapidly reduced
to ferrous iron and reaches a quasi-equilibrium value which then slowly evolves during the
rest of the oxidation process. For the total concentration of iron ([Fe2’]+[Fe3+]), the ratio
[Fe2’]/[Fe3’] is defined by temperature, pH and S/V. In all our computer simulations we
have used the same values S/V=0.78m2/1 as in the experiments by Suzuki et al. [SuL] and
Lizama and Suzuki [LiS4]. Further extrapolation to other values of S/V should be performed
in a physical model. A physical model should account for site-specific values of S/V which
depend on several factors, including geochemical properties of waste rock and water
transport.
Information on the oxygen consumption rates is important for a future physical waste
rock model and an underwater disposal model which should properly describe oxygen
depletion leading to lower concentration of oxygen.
The process of bacterial oxidation is much faster than the pyrite oxidation in the
absence of bacteria. The key element is the bacterial oxidation of ferrous iron which provides
ferric iron for the fast process of pyrite oxidation. Comparing figures 3.1.7 and 4.1.1 we
conclude that at T=303K and cell concentrations on the order of lg/l the bacterial oxidation _
of pyrite is about thousand times faster than the abiotic oxidation. This effect results from
accelerated rates of the individual reactions of pyrite oxidation by dissolved oxygen,
oxygenation of ferrous iron to ferric iron and oxidation of pyrite by ferric iron.
115
IV.2. Bacterial oxidation of pyrite at low concentrations of dissolved oxygen
During the process of pyrite oxidation the oxygen depletion rates are sufficiently high
to cause a substantial decrease in the concentration of oxygen dissolved in the water. In
waste rock piles the concentration of dissolved oxygen decreases until oxygen consumption
rates become sufficiently low to be balanced by oxygen transport through porous piles.
Depending on the temperature gradients established, the transport of oxygen takes place by
diffusion and convection with convection rates increasing with the temperature gradient.
(Often convective rolls develop in an outer layer near the pile boundaries as the result of
flow instability [Gel, [Gep)]. There are field observations indicating that the coupling
between chemical process and physical processes of mass and energy transport may lead to
complex spatio-temporal patterns and a possible chaotic behaviour for the reaction rates
controlled by the supply of oxygen and thermal energy transport. These aspects should be
addressed by a physical reaction-transport model. One possible way of reducing acid rock
drainage is to apply covers limiting the access of oxygen and the flow of -.vater. Results
presented here may be useful for analyzing the efficiency of covers.
We have analyzed the effect of lower oxygen concentration on the bacterial oxidation
of pyrite. As an example we discuss the results obtained for 5% oxygen content in the gas
phase, i.e. 4-5 times lower concentrations of dissolved oxygen than in Section 4.1. Reactions
(Bl) and the feedback loop (B2)-(B3) respond in a different way to lower oxygen
concentrations. The rate of reaction (Bl) depends on the concentration of dissolved oxygen
but does not depend on the concentrations of ferrous and ferric iron. According to the kinetic
equation (BD. 1) the rate of direct pyrite oxidation by dissolved oxygen decreases two times
when the oxygen concentration decreases four times. The kinetic equations for indirect
oxidation involve the oxidation of ferrous iron with the rate proportional to the first power
of oxygen concentration. It might seem, that lowering oxygen concentration four times
should result in oxidation rate four times slower . This does not happen, however. The effect
of reduced oxygen concentration for the reaction (B2) is much weaker than linear. The
kinetic equations for the oxidation of ferrous iron also contain factors proportional to the
concentration of ferrous iron. By comparing plots obtained for [Fe*‘] in Figs. 4.1.1 and
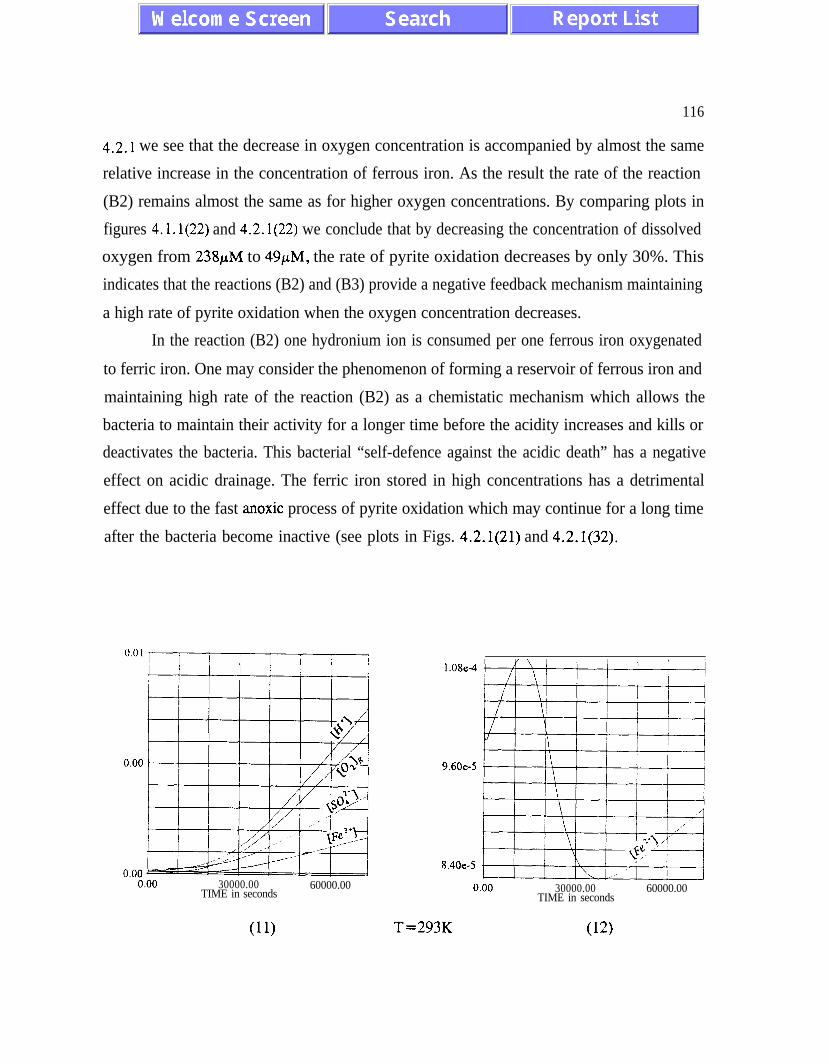
116
4.2.1 we see that the decrease in oxygen concentration is accompanied by almost the same
relative increase in the concentration of ferrous iron. As the result the rate of the reaction
(B2) remains almost the same as for higher oxygen concentrations. By comparing plots in
figures 4.1.1(22) and 4.2.1(22) we conclude that by decreasing the concentration of dissolved
oxygen from 238pM to 49pM, the rate of pyrite oxidation decreases by only 30%. This
indicates that the reactions (B2) and (B3) provide a negative feedback mechanism maintaining
a high rate of pyrite oxidation when the oxygen concentration decreases.
In the reaction (B2) one hydronium ion is consumed per one ferrous iron oxygenated
to ferric iron. One may consider the phenomenon of forming a reservoir of ferrous iron and
maintaining high rate of the reaction (B2) as a chemistatic mechanism which allows the
bacteria to maintain their activity for a longer time before the acidity increases and kills or
deactivates the bacteria. This bacterial “self-defence against the acidic death” has a negative
effect on acidic drainage. The ferric iron stored in high concentrations has a detrimental
effect due to the fast anoxic process of pyrite oxidation which may continue for a long time
after the bacteria become inactive (see plots in Figs. 4.2.1(21) and 4.2.1(32).
30000.00TIME in seconds
60000.00
(11) T=293K
1.08e-Q
9.60e-5
30000.00TIME in seconds
60000.00
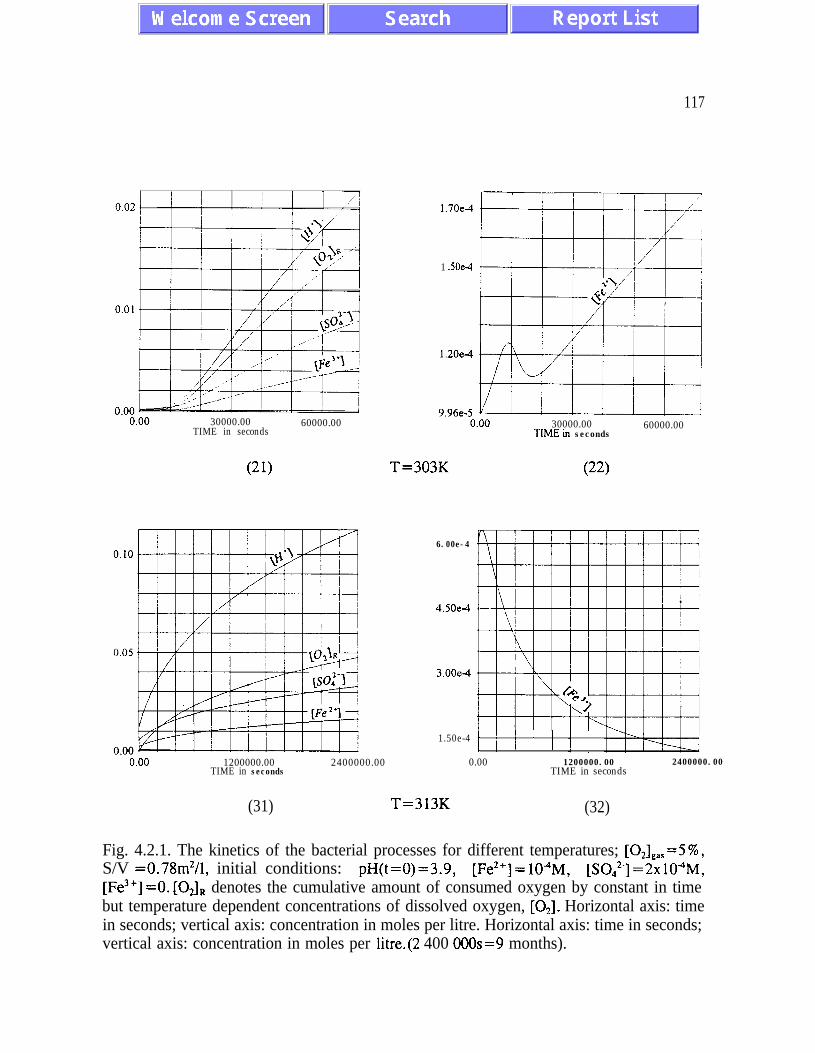
117
30000.00TIME in seconds
60000.00
(21) T=303K (22)
1.70e-4
1 SOe4
1.20e4
9.96e-5
6.00e-4
4SOe4
3.00e-4
1.50e-4
30000.00TIMEin seconds
60000.00
t i i i i i0.00 1200000.00
TIME in seconds2400000.00 0.00 1200000.00
TIME in seconds2400000.00
(31) T=313K (32)
Fig. 4.2.1. The kinetics of the bacterial processes for different temperatures; [O&+=5%,S/V =0.78m2/1, initial conditions: pH(t=0)=3.9, [Fe2+]=104M, [SO,,*-]=2x10⁴M,[Fe3+]=0. [021R denotes the cumulative amount of consumed oxygen by constant in timebut temperature dependent concentrations of dissolved oxygen, CO,]. Horizontal axis: timein seconds; vertical axis: concentration in moles per litre. Horizontal axis: time in seconds;vertical axis: concentration in moles per litre.(2 400 OOOs=9 months).
118
The key to the understanding of the chemistatic bacterial action is provided by the
stability properties of the set of eqs. (BD). In one of our future publications we will use
analytical mathematical tools for a rigorous stability analysis of the set of kinetic equations
(BD). The stability properties of the set of kinetic equations are responsible for a
spontaneous evolution of the biogeochemical system to a quasi-equilibrium state characterized
by the ratio, [Fe2’]/[Fe3’] between the concentration of ferrous and ferric iron, which
strongly depends on the oxygen concentration. Again, we interpret this property as the
presence of quasi-equilibrium concentrations of ferric and ferrous iron because for a given
initial total iron concentration, the system evolves very fast to the state characterized by the
ratio [Fe2+]/[Fe3+] which is independent of its initial value. Proper understanding of
nonequlibrium thermodynamics of physical, chemi6a.l and biological processes involved is
very important for formulating reasonable predictive waste rock and underwater disposal
models. The total rates of pyrite oxidation are controlled by mass and energy transport which
are relatively slow in comparison with chemical rates. It is known that various physical
reaction-transport models involving very different chemical reactions often give very similar
results for the distribution of oxygen and temperature. The comparison between model
results and field data for temperature and oxygen distribution inside a waste rock pile cannot
be used as a decisive criterion for the validity of a mathematical model. The environmental
impact is related to the acidity and concentrations of dissolved heavy metals and sulphate
which may be quite different under very similar physical conditions and depend strongly on
the detailed features of the chemical reactions involved.
The fact that the chemical reactions alone do not lead to a chaotic behaviour is a nice
feature which should facilitate the analysis of a realistic physical model. On the other hand,
the strong dependence of the ratio between ferrous and ferric iron on temperature, oxygen
concentration and geochemical properties of waste rock, requires some advanced numerical
techniques to be used in a mathematical analysis of a future physical waste rock model. The
expected rapid spatial variation in the rates of the chemical reactions involved, requires
adaptive numerical methods for solving a set of coupled partial differential (reaction-
transport) equations (see [SyT] and literature therein).
119
V. FURTHEREXPERIMENTS
The results of this study should be confronted with field data and calibrated before
any practical recommendations are formulated.
By constructing the kinetic model we have used quantitative experimental data from
at least two different sources. In some cases, however, we were forced to make assumptions
which should be tested in further experiments. We list some problems which, in our view,
merit further experimental and modelling work which should lead to a reliable physical waste
rock model and a model for underwater disposal.
1. The kinetics of the neutralization process requires further work. The total amounts of
sulphate and ferric hydroxide formed as a result of pyrite oxidation depend strongly on pH
and temperature values. pH values are controlled by the amount and dissolution rates of the
neutralizing minerals, and affect also the stoichiometry of the neutralization process. These
aspects should be analyzed together with the problem of stoichiometric incompatibility
(discussed in Section 11.2). Results may be significant for predicting the amount of sludge
generated and for designing the site-specific neutralization processes which would minimize
the amount of sludge. Temperature is very important for the efficiency of neutralization
because it affects both the rates of chemical reactions and exsolution of carbon dioxide from
the water.
2. Different elementary reactions respond in a different way to various methods used to
minimize ARD. To reduce acid rock drainage at existing sites in the most effective way it
is important to know the relative contributions from the elementary processes involved.
Oxygen in water molecules and molecular oxygen dissolved in water have a different isotope
composition. Isotope techniques can be used to analyze the isotope composition of sulphate
and should allow the determination of the relative contributions from the elementary abiotic
and bacterial processes.
3. The nature of the chemical reactions indicates that pe and Eh values may be almost as
important as pH for the bacterial activity. Further experiments measuring bacterial activity
as a function of Eh may provide information useful in designing methods of reducing ARD.
120
4. The oxidation-reduction potential, Eh affects the stability of passive films formed by
precipitated ferric hydroxide [Yo]. Passive films of ferric hydroxide dissolve at negative Eh
values. For this reason Eh should be measured inside waste rock piles during field tests.
5. There are no systematic experimental data on the dependence of the rates of bacterial
reactions (Bl) and (B2) on the oxygen concentration. Our model predicts that as the result
of bacterial activity, the rate of pyrite oxidation may be still fast at low oxygen
concentrations.
6. There are no systematic experimental data which would determine the order of reaction
(B3) with respect to the concentration of ferric iron. We have obtained a reasonable
agreement with experimental data by using the same reaction order, 0.6 as for the reaction
(R3). The same agreement should be reached with future experimental data for other initial
concentrations of ferric iron.
7. The assumption about the same form of coefficients B([H+]) and B(T) which describe pH
and temperature dependence of the bacterial activity in reactions (Bl), (B2) and (B3) remains
to be tested.
8. It seems quite possible that Thiobacillus ferrooxidans may attack pyrite coated by the
ferric hydroxide. This process may lead to locally low pH values at which ferric hydroxide
dissolves and the ferric iron contributes to the accelerated pyrite oxidation.
9. Surface reactions (Bl) and (B3) may show a similar competitive inhibition as the reaction
(B2). Experimental analysis of anaerobic bacterial oxidation of pyrite by different
concentrations of bacteria and different values S/V should provide useful results for
estimating the efficiency of covers limiting water flow. Such laboratory analysis should be
performed for the whole range of bacterial concentrations observed in the field studies. After
a formula for competitive inhibition of reaction (B3) is derived, it can be used for an
analysis of the total oxygen consumption measured for different bacterial concentrations.
10. Parameters T, and [H+], should be determined for bacterial cultures at different sites.
11. Hydraulic connectivity of the water film surrounding different mineral particles affects
121
the neutralization process. During dry periods the water film surrounding different mineral
particles may become disjointed. It is known that pyrite coated with ferric hydroxide is
hydrophobic. On the other hand, bacteria have a natural tendency to accumulate on pyrite.
The bacterial ability to retain water during dry periods should be analyzed. This may lead
to the local acid production despite the presence of neutralizing minerals.
12. Because of the ubiquitous nature of bacteria, traditional methods of acid/base accounting
should be reevaluated. If pH values become initially low in some regions, the bacterial
oxidation may lead to a very fast acid production. Under such circumstances the efficiency
of neutralization process is governed not by the stoichiometric relations but by the dissolution
rates and the kinetics of neutralization reactions.
13. The kinetic model analyzed in this study is based on small-scale experimental data for
pure pyrite. Our results should be compared with medium-scale results obtained for pyritic
rocks. A set of standard tests should be designed to measure independently the acidic
potential and the neutralization potential for rocks at different sites.
14. The usefulness of any predictive model depends
standard data base should be designed and created
on the availability of entry data. A
together with a set of inexpensive
experimental procedures which would provide data for a predictive physical model which can
be also used as a monitoring tool and provide clues on the most effective ways of minimizing
acidic drainage. A great deal of work has been already done in this direction. Several static
and kinetic geochemical tests for determining ARD potential have been designed [Al], [BrC] ,
[CoR11, EC~JW, F-4, DGI, WY, DwRl, PW, PI, KW, [Resl, PW, [SW,[SnL], [Sul]. However, comparison and correlation of test generated data with field data has
been minimal (refs. [FeM] and [Da] are notable exceptions). One of the key problems is the
ability to scale the results obtained for small quantities of rock to generate quantitative
predictions for a much greater mass of rock in the field. The small-scale geochemical tests
should be conducted together with physical tests which should measure thermal energy
released and simulate water and oxygen transport. This is very important because the mass
and energy transport controls the rates of chemical reactions involved in the processes of acid
generation and acid neutralization. While the existing tests (humidity cell test, for example
122
[Res]) often simulate the water transport, they do not simulate the nonhomogeneous
distribution of oxygen and do not provide information on oxygen transport at the rates
different for various parts of waste rock piles. A possible solution to this problem is the
derivation of simple scaling relations for the rates of chemical and physical processes. Such
scaling relations can be used to translate the existing laboratory data into large-scale
estimates on acid-producing potential (AP) and acid neutralizing potential (NP) for waste
rock piles. The scaling relations often allow to make large-scale and long-term predictions
for the behaviour of chemically active minerals, which is impossible to simulate during
laboratory experiments. Typically, a very large mass of chemically active minerals evolves
to one of several possible spatially nonhomogeneous states which are characterized by
different rates of chemical reactions and different temperatures controlled by the mass and
energy transport. The size of the system and other physical and chemical parameters, like
particle size, macroscopic pile porosity, thermal conductivity ambient atmospheric conditions
and chemical rates determine various possible types of the thermodynamic behaviour of
chemically active systems [Ar], [ScD], [Otl], [Ot2]. Often very small changes in the
physical and chemical (often controllable) parameters lead to a dramatic change in oxygen
transport rates and temperature distribution which control chemical and bacterial processes.
Simple scaling relations should be both a good step towards a predictive waste rock model
and a useful practical tool for estimates based on the existing test results. The scaling
relations should also help in designing geochemical tests which would provide suitable data
for a predictive large-scale model.
15. A carefully designed sampling procedure is very important for the successful use of
predictive models. The minimum number of samples collected from each site should increase
with mass of rock, the number of different rock types and variability of other significant
physico-chemical characteristics. Elemental composition, mineralogy, sulphide content,
solubility and reactivity of carbonate compounds and general weathering characteristics
should be analyzed for the samples. Morphologic characteristics of pyrite are important. The
surface area (and chemical reactivity) of framboidal pyrite is greater than that of euhedral
and subhedral pyrite [WhJ]. Determination of the range of variability of individual
characteristics is important for reliable estimates.
123
REFERENCES
[All
[AnI
MM1
[APKI
[Arl
WV
PW
Pa01
VW
[BeI
R. Albrightin Proceedings of Acid Mine Drainage Workshop; Environment Canada andTransport Canada, Halifax, NS, p. 146, 1987.
Graham F. Andrews“The Selective Adsorption of Thiobacilli to Dislocation Sites on PyriteSulfaces”Biotechnology and Bioengineering 31, 378 (1988).
G. F. Andrews and J. Maczuga“Bacterial coal desuljiuization”Biotechnology and Bioengineering Symposium No. 12, 337 (1982).
R.J. Applegate and M. Kraatz“Rehabilitation of Rum Jungle Mine”Proc. MEND Conf, Montreal 1991.
R. ArisA Mathematical Theory of Reacting and [email protected] SystemsWiley 198 1.
A.N. Astanina and A.P. RudenkoRuss. J. Phys. Chem. 45, 191 (1971).
G.I. Barenblatt and Y.B. ZeldovichA. Rev. Fluid Mech. 4, 285 (1972)
J.E. Bailey and D.F. Ollis“Biochemical engineering jimdamentals”McGraw-Hill, New York 1986.
L. K. Bailey and E. Peters“Decomposition of pyrite in acids by pressure leaching and anodization:the case for an electrochemical mechanism”.
Can. Metall. Quart. 15, 333 (1976).
T. BeerApplied Environmetrics Hydrological TablesApplied Environmetrics, Victoria, Australia, 199 1.
124
CBW
PePI
[BeRl
IPoW
PoLl
B-1
DC1
WaGI
[CW
[Cd01
[Chl
B.B. Benson and D. Krouse, Jr.,“The concentration and isotopic fractionation of gases dissolved in freshwater in equilibrium with the atmosphere, I Oxygen ”Limnol. Oceanog., 25, 662 (1980).
J.W. Bennet and G. Pantelis“Construction of a waste rock dump to minimise acid mine drainage a casestudy”Proc. MEND Conf., Montreal 1991.
J. W. Bennett and A.I.M. Ritchie“Measurements of the transport of oxygen into two rehabilitated wasterock dumps”Proc. MEND Conf., Montreal 199 1.
F.C. Boogerd, C. van den Beemd, T. Stoelwinder, P.Bos and J.G. Kuenen“Relative contributions of biological and chemical reactions to the overallrate of pyrite oxidation at temperatures between 30°C and 70°C ”Biotechnology and Bioengineering 38, 109 (1991).
Jacques Boulegue, Charles J. Lord III and Thomas M. Church“Sulfur speciation and associated trace metals (Fe, Cu) in the pore watersof Great Marsh, Delaware”Geochimica et Cosmochimica Acta 46, 453 (1982).
C.L. Brierley“Bacterial Leaching”CRC Critical Reviews in Microbiology 6, 207 (1979).
British Columbia Acid Mine Drainage Task Force“Acid Rock Drainage Technical Guide”BC AMD Task Force Report, 1989.
F.T. Carruccio, G. Geidel and M. PelletierJ. Energy (Amer. Sot. Civil Engineers) 107, (1981).
M.C. Campbell, D.Wadden, A. Marchbank, R.G.L. McCready and G.Ferroni“In-place leaching of uranium at Denison Mines Ltd. ”Proc. IAEA Meeting, Vienna 1985.
J. Chadam and P. OrtolevaEarth Science Reviews 29, 175 (1990).
F. Chaiken, private communication (1992).
125
WBI
WI
[CoR l]
[co=1
WI’1
[Dal
DR31
Pas1
PuBI
K. Ye Cheng and P.L. BishopJ. Air&Waste Manage. Assoc. 42, 164 (1992).
W.R. CowanHazardous Mat. Mgmt., 3, 12 (1991)
Coastech Research“Investigation of Prediction Techniques for Acid Mine Drainage ”MEND Project, West Vancouver, BC, Canada, 1989.
Coastech Research“Acid Rock Drainage Prediction Manual: A manual of Chemical EvaluationProcedures for the prediction of Acid Generation from Mine Wastes”Mend Project, North Vancouver, BC, Cnada 1990.
G. Cragnolio and O.H. Tuovinen“The role of sulphate-reducing and sulfur-oxidizing bacteria in the localizedcorrosion of iron-base alloys - a review”International Biodeterioration 20, 9 (1984)
S. Day“Long term kinetic acid generation studies: Cinola project”B.C. AMD Task Force, 1993.
G.B. Davis and A.I.M. Ritchie“A model of oxidation in pyritic mine wastes: part 1: equations andapproximate solutions”Appl. Math. Modelling 10, 314 (1986).
G.B. Davis and A.I.M. Ritchie“4 model of oxidation in pyritic mine wastes: part: comparison ofnumerical and approximate solutions”Appl. Math. Modelling 10, 323 (1986).
G.B. Davis and A.I.M. Ritchie“A model of oxidation in pyritic mine wastes: part 3: importance ofparticle size distribution”Appl. Math. Modelling 11, 417 (1987)
W.Davison and G.SeedGeochimica et Cosmochimica Acta 47, 67 (1983).
D.W. Duncan and A. Bruynsteyn“Determination of the Acid Production Potential of Waste Materials”
126
Metallurgical Society of AIME Annual Meeting, New Orleans (1979).
[DuDI J.G. Dunn, G.C. De and P.G. Femandez“The effect of experimental variables on the multiple peaking phenomenonobserved during the oxidation of pyrite”Thermochimica Acta, 135, 267 (1988).
WI H.L. EhrlichGeomicrobiologyDekker, New York, 1981.
N-II P.M. Erickson, R.W. Hammack and R.L.P. Kleinman“Prediction of acid drainage potential in advance of mining”in Control of Acid Mine Drainage, USBM IC 9027.
[Es1 H. Ese“Acidic mine drainage from the Killingdal Mine Norway ”Proc. MEND Conf., Montreal 1991.
WKI R.O. van Everdingen and H.R. Krouse“Isotope composition of sulphates generated by bacterial and abiologicaloxidation ”
Nature 315, 395 (1985).
Fe1 K.D. Ferguson“Static and Kinetic Methods to Predict Acid Mine Drainage ”Env. Canada, 1985.
WEI K.D. Ferguson and P.M. Erickson“Approaching the AMD Problem-from Prediction and early Detection ”In. Proc. Int. Conf. on Control of Environmental Problems from MetalMines, 1988, Roros, Norway.
[FeEl] K.D. Ferguson and P.M. Erickson“Will It Generate Acid? An Overview of Methods to Predict Acid MineDrainage ”
[FeMe] K.D. Ferguson and P.E. Mehling“Acid Mine Drainage in B. C. The Problem and Search for Solutions ”Environment Canada, 1986.
[FM K.D. Ferguson and K.A. Morin“The prediction of Acid Rock Drainage - Lesson from the Database ”
127
Environment Canada Report, 1992.
[FiN]
[Gal
WI
We1
WI
Poll
[Growl
[GUI
[Hal
R. J. Field, R.M. NoyesJ. Chem. Phys. 60, 1877, (1974).
R.B. Finkelman, D.E. GiffinReclamation and Revegetation Research 5, 521 (1986).
R.A. Freeze and J.A. CherryGroundwaterPrentice -Hall of Canada, 1979
D.M. Galbraith“The mount Washington acid mine drainage reclamation project”Proc. MEND Conf., Montreal 1991.
P. Gelinas and R. Guay“Acid Mine Drainage Generation from a Waste Rock Dump and Evaluation ofDry Covers Using Natural Minerals: La Mine Doyon Case Study”MEND Report (1990)
P. Gelinasprivate communication ( 1993)
B. Godinprivate communication (1992)
M. B. Goldhaber“Experimental study of metastable sulpfir oxyanion formation during
pyrite oxidation nAm. J. Sci. 283, 193 (1983).
H.C. Granger and C.G. Warren“Unstable Sulfir Compounds and the Origin of Roll-typeUranium Deposits ’Economic Geology 64, 160, (1969)
R. Guayprivate communication (1993)
Sophie Bierens de Haan“A review of the rate of pyrite oxidation in aqueous systems at lowtemperature @Earth-Science Reviews 31, 1, (1991).
128
[Hip] J.B. Hiskey and M.D. Pritzker“Electrochemical behavior of pyrite in sulfuric acid solution containingsilver ions ”J. Appl. Electrochem. 18, 484 (1988).
D-W George R. Holdren, Jr. and Patricia M. Speyer“Reaction rate - sut$ace area relationships during the early stages ofweathering - I. Initial observations”Geochimica et Cosmochimica Acta 49, 675 (1985).
[HwSl C.C. Hwang, R. C. Streeter, R.K. Young and Y.T. Shah“Kinetics of the ozonation of pyrite in aqueous suspension ”Fuel 66, 1574 (1987).
[InI W.J. Ingledew“Ferrous iron oxidation by lhiobacillus ferrooxidans ”Biotechnology and Bioengineering Symp. No. 16,23 (1986).
[JoI B.B. Jorgensen“A theoretical model of the stable sulfur isotope distribution in marinesediments ”Geochimica et Cosmochimica Acta 43, 363 (1979).
WI G.I. Karavaiko“Microbiological processes for the leaching of metals from ores ”United Nations Environmental Program, 1985.
SW H.C. Kasan and A.A.W Baecker“An assessment of toxic metal biosolption by activated sludge from thetreatment of coal-gastjication efluent of a petrochemical plant”Water Research 23, 795 (1989).
[KeWl] G.H. Kelsall and R.A. Williams“Electrochemical behavior of ferrosilicides (FeJi) in Neutral AlkalineAqueous Electrolites. I. Thermodynamics of Fe-Si-H,O systems at 298 K”J. Electrochem. Sot. 138, 941 (1991).
[KeW2] G.H. Kelsall and R.A. Williams“Electrochemical behavior of ferrosilicides (FeSi) in Neutral and Alkaline
Aqueous Electrolites. II. FeJi Electrochemical kinetics and Corrosionbehavior ”
J. Electrochem. Sot. 138, 941 (1991).
[KeW3] G.H. Kelsall and R.A. Williams
129
“Electrochemical behaviour of ferrosilicides (FeJi) in Neutral andAlkaline Aqueous Electrolites. III. The nature of passive films on FeSiElectrodes ”J. Electrochem. Sot. 138, 941 (1991).
BoBI A. Kok, N. Bolt and J.H.N. JergersmaKEMA Sci.&Tech. Reports 7, 63 (1989)
tuGI H.R. Krouse, W.D. Gould, R.G.L. McCready and S.Rajan“I80 incorporation into sulphate during the bacterial oxidation of sulphideminerals and the potential for oxygen isotope exchange between O,, , Hz0and sulphur intermediates nEarth and Planetary Sci. Lett. 107, 90 (1991).
[KuMl C.F. Kulpa, Jr., N. Mjoli and M.T. Roskey“Comparison of iron and sulfir oxidation in Thiobacillus ferrooxidans.inhibition of iron oxidation by growth on sulfur”Biotechnology and Bioengineering Symp. No. 16 (1986).
Wwl Y.T.J. Kwong“Acid generation in waste rock as exemplified by the Mount Washingtonminesite, B. C., Canada @Proc. MEND Conf., Montreal 1991.
E.J. Laishley, R.D. Bryant, B.W. Kobryn and J.B. Hyne“Microcrystalline structure and surface area of elemental sulphur as
factors influencing its oxidation by Thiobacillus Oilbirds”Can. J. Microbial. 32, 237 (1986).
S.B. Lalvaui, B.A. DeNeve and A. Weston“Prevention of pyrite dissolution in acidic media ”Corrosion 47, 55 (1991).
La S.B. Lalvani and M. Shami“Passivation of pyrite oxidation with metal cations”J. Mat. Sci. 22, 3503 (1987).
K=l Antonio C. Lasaga“Chemical Kinetics of Water-Rock Interactions nJournal of Geophysical Research 89, 4009, (1984).
DwRl R.W. Lawrence, G.M. Ritcey, G.W. Poling, P.B. Marchant“Strategies for the Prediction of Acid Mine Drainage nProceedings of the 13th Mine Reclamation Symposium, Ministry of Energy,
130
Mines and Petroleum Resources; Victoria, 1989.
[LeKl
IwYl
biNI
[LiS l]
[LiS2]
[LiS3]
[LiS4]
[LiSS]
[LiS6]
H. Lees, S.C. Kwok and I. Suzuki“The thermodynamics of iron oxidation by the ferrobacilli ”Can. J. Microbiology 15, 43 (1969).
J.H. Levy and T. J. White“The reaction of pyrite with water vapour”Fuel 67, 1336 (1988)
X.-P. Li, N.A. Vante and H. Tributsch“Involvement of coordination chemistry during electron transfer in thestabilization of the pyrite (FeS j photoanode nJ. Electroanal. Chem. 242, 255 (1988)
H.M. Lizama and I. Suzuki*Bacterial leaching of a suljide ore by lhiobacillus ferrooxidans ana!Thiobacillus thiooxidans: I. Shake Flask Studies ”Biotechnology and Bioengineering 32, 110 (1988).
H. M. Lizama and I. Suzuki“Bacterial leaching of a &fide ore by lhiobacillus ferrooxidans andlhiobacillus thiooxidans Part II: Column leaching studies”Hydrometallurgy 22, 301 (1989).
H.M. Lizama and I. Suzuki“Synergistic competitive inhibition of ferrous iron oxidation bylhiobacillus ferrooxidans by increasing concentrations of ferric iron andcells ”Appl. Env. Microbiology 55, 2588 (1989).
H.M. Lizama and I. Suzuki“Rate equations and kinetic parameters of the reactions involved in pyriteoxidation by Thiobacillus ferrooxidans ”Appl. Env. Microbiology 55, 2918 (1989).
H. M. Lizama and I. Suzuki“Kinetics of sulfirr and pyrite oxidation by Thiobacillus thiooxidans.Competitive inhibition by increasing concentrations of cells nCan. J. Microbiology 37, 182 (1991).
H.M. Lizama and I. Suzuki“Interaction of chalcopyrite and sphalerite with pyrite during leaching byThiobacillus ferrooxidans and Thiobacillus thiooxidans “.

131
Can. J. Microbiology 37, 304 (1991).
LOCI C. J. Lord III and Thomas M. Church“The geochemistry of salt marshes: sedimentary ion d$j%sion, sulfatereduction, and pyritization ’Geochimica et Cosmochimica Acta 47, 1381 (1983).
D-4 Richard T. Lowson“Aqueous Oxidation of Pyrite by Molecular oxygen”Chemical Reviews 82, 461 (1982).
La D.G. Lundgren and M. Silver“Ore leaching by bacteria ”Ann. Rev. Microbial. 34, 263 (1980).
LUVI D.G. Lundgren, M.Valkova-Valchanova and R.Reed“Chemical reactions important in bioleaching and biaccumulation ”Biotechnology and Bioengineering Symp. No. 16 (1986).
Dl George W. Luther III“Pyrite oxidation and reduction: Molecular orbital theory considerations nGeochimica et Cosmochimica Acta 51, 3193 (1987).
IUFI G.W. Luther III, T.G. Ferdelman, J.E. Kostka, E.J. Tsamakis and T.M.Church“Temporal and spatial variability of reduced sulpjkr species and porewater
parameters in salt marsh sediments ”Biogeochemistry 14, 57 (1991).
WuKl G.W. Luther III, J.E Kostka, T.M. Church, B. Sulzberger and W. Stumm“Seasonal iron cycling in the salt-marsh sedimentary environment: theimportance of ligana’ complexes with Fe(II) and Fe(III) minerals and pyrite,respectively nMarine Chemistry 40, 81 (1992).
[MaRl] C.T. Mathews and R.G. RobinsAustralas. Ins. Mining Metall. 242, 47 (1972).
[MaR2] C.T. Mathews and R.G. RobinsAust. Chem. Eng. 15, 19 (1975).
[MaR3] C.T. Mathews and R.G. RobinsAust. Chem. Eng. 13, 129 (1972).

132
WC1
[McKl
[MiS]
WC1
[MoJl
[MoMI
WHI
NH1
[MsHl
R. McCandlessprivate communication, 1993.
Michael A. McKibben and Hubert L. Barnes“Oxidation of pyrite in low temperature acidic solutions: Rate laws andsurface textures ”Geochimica et Cosmochimica Acta 50, 1509-20 (1986).
F. J. Millero, S. Sotolongo and M. Izaguirre“The oxidation kinetics of Fe@) in Seawater”Geochimica et Cosmochimica Acta 51, 793-801 (1987).
K.A. Morin and J.A. Cherry“Trace Amounts of Siderite Near a Uranium-Tailing Impoundment, ElliotLake, Ontario, Canada, and Its implication in Controlling ContaminantMigration in a Sand Aquifer”Chemical Geology, 56, 117 (1986).
K. A. Morin, E. Gerencher, C.E. Jones, D. Konasewich and J.R. Harries“Critical literature review of acid drainage from waste-rock”Nrthwest Geochem, 1990.
John W. Morse, Frank J. Millero, Jeffrey C. Cornwell and D. Rickard“The chemistry of the Hydrogen Sulfide and Iron Sulfide Systems inNatural Waters ”Earth-Science Review 24, 1 (1987).
Carl 0. Moses, Alan T. Herlihy, Janet. S. Herman and Aaron L. Molls“Ion-chromatographic analysis of mixtures of ferrous and ferric iron ”Talanta 35, 15 (1988).
Carl 0. Moses and Janet S. Herman“Homogeneous Oxidation Kinetics of Aqueous Ferrous Iron atCircumneutral pH ”Journal of Solution Chemistry 18, 705 (1989).
Carl 0. Moses and Janet S. Herman“Pyrite oxidation at circumneutral pH”Geochimica et Cosmochimica Acta 55, 471 (1991).
Carl 0. Moses, DKirk Nordstrom, Janet S. Herman and Aaron L. Mills“Aqueous pyrite oxidation by dissolved oxygen and by ferric iron ”Geochimica et Cosmochimica Acta 51, 1561 (1987).

133
[Nil
[NiG]
[NiG]
[Nip]
[NiS]
[NoI
WI
m
WI
WI
R. V. Nicholson, private communication (1993).
Ronald V. Nicholson, Robert W. Gillham and Eric J. Reardon“Pyrite oxidation in carbonate-bufered solution:. I. Experimentalkinetics ”Geochimica et Cosmochimica Acta 52, 1077 (1988)
Ronald V. Nicholson, Robert W. Gillham and Eric J. Reardon“Pyrite oxidation in carbonate-bufered solution:. 2. Rate control by oxidecoatings ’Geochimica et Cosmochimica Acta” 54, 395 (1990)
G. Nicolis and I. PrigogineSelf-Organization in Nonequilibrium SystemsWiley, 1977.
R.V. Nicholson and J.M. Scharer“Laboratory Studies of Fyrrhotite Oxidation Kinetics”preprint
D.K. Nordstrom“Aqueous pyrite oxidation and the consequent formation of secondary ironminerals”in Acid sulfate wearhering: pedogeochemistry and relationship tomanipulation of soil materials, Soil Science Sot. Amer. Press, Madison,1982.
Nordstrom D.K. , E.A. Jenne and J.W. Ball“Redox equilibria of iron in acid mine waters”,ACS Symposium Series 93, 5 1-59 (1979).
G.J. OlsonBiohydrometallurgy, p. 73 CANMET 1989.
M. Otwinowski“A thermodynamic model for the spontaneous heating and combustion ofcoal. I:Elementary exothenttic processes *Fuel, submitted; also Alberta Energy Report, Edmonton 1991.
M. Otwinowski“A thermodynamic model for the spontaneous heating and combustion ofcoal. II: Reaction-d@%sion model nFuel, submitted; also Alberta Energy Report, Edmonton 1991.

134
WI
[OtLl]
[OtL2]
COtpI
DPI
PW
CPrLl
PrTl
WI
IX@1
[Resl
M. OtwinowskiStatic and Dynamic Patterns in Equilibrium and NonequilibriumSystemsin Nonlinear Structures in Physical Systems, Chaos Pattern formation and
Waves , Springer, 1990
M. Otwinowski, W.G. Laidlaw and R. Paul“Structural instability of the Brusselator model with reversible chemicalreactions ”Can. J. Phys. 68, 743 (1990)
M. Otwinowski, W.G. Laidlaw and R. Paul“Explicit solutions to a class of nonlinear diJ%sion equations ”Phys. Lett. 124, 149 (1988).
M. Otwinowskiin preparation.
M. Otwinowski and R. Paul“A thermodynamic theory of axon permeability”Biophysical Journal 29, 126 (1989)
G. Pantelis and A.I.M. Ritchie“Macroscopic transport mechanisms as a rate-limiting factor in dumpleaching of pyrite ores nAppl. Math. Modelling 15, 136 (1991)
I. Prigogine and R. LefevreJ. Chem. Phys. 48, 1695 (1968).
William A. Pryor and Umberto Tonnellato“Nucleophilic Displacements at Sulfir. III. The Exchange of Oxygen-18between Sodium lhiosulfate-180 and Water”Journal of the American Chemical Society 89, 3379 (1967).
J. Pronkprivate communication (1993)
S.R. Rao and J.A. Finch“Galvanic interaction studies on sulphide minerals ”Can. Metall. Quart. 27, 252 (1988).
Rescan Env. Services Ltd.“Kutcho Creek project. Acid generation testwork”
135
Report, 1990, Vancouver, Canada.
WA
Csal
[SaGI
WGI
WDI
WI
[SiS]
PnLl
[sosl
[SPBI
WI
[StLl]
Brian J. Reedy, James K. Beattie and Richard T. Lowson“A vibrational spectroscopic I80 tracer study of pyrite oxidation”Geochimica et Cosmochimica Acta 55, 1609 (1991).
V. Sanmugasunderam“Bacterially assisted column leaching nBiotechnology and Bioengineering Symp. 16, 73 (1986).
A.F. Saprygin and L.S. GusarZh. Prikl. Khim. 45, 345 (1971)
J.M. Scharer, V. Garga, R. Smith and B.E. Halbert“Use od Steady-State Models for Assesing Acid Generation in Pyritic MineTailings ”in Proceedings of the 2nd International Conference on Abatement, Montreal,p. 211, Tome 2, 1991.
A. Schmal, J.H. Duyzer and J.W. van HeuvenFuel 64, 1969 (1985)
Senes Consultants“Description of RATAP. BMT3 Component Modules ”Report, 1991.
P.C. Singer and W. Stumm“Acidic Mine Drainage: The Rate Determining Step ”Science 167, 1121 (1970).
G.A. Singleton and L.M. LavkulichSoil Science 42, 984 (1978).
A.A. Sobek, W.A. Schuller, J.R. Freeman and R.M. SmithUS EPA Report; EPA 600/2-78-054, 1978
P.A. Spencer, J.R. Budden and R. SneydBiohydrometallurgy, p.23 1, CANMET 1989.
W. Stumm ed.,“Aquatic Chemical Kinetics. Reaction Rates of Processes in Natural
Waters”, Wiley, 1991.
W. Stumm and G.F. Lee

136
Schwei. 2. Hydrol. 22, 295 (1960).
[S tL2] W. Stumm and G.F. LeeInd. Eng. Chem. 53, 143 (1961).
WMI W. Stumm and J.J. Morgan,“Aquatic Chemistry. An introduction Emphasizing ChemicalEquilibria in Natural Waters”, Wiley, 1986.
P.J. Sullivan and A.A. SobekMinerals and the Environment 4, 9 (1982)
[SW A. 0. Summers P. Roy and M.S. Davidson“Current techniques for the genetic manipulation of bacteria and theirapplication to the study of sulfur-based autotrophy in lhiobacillus ”Biotechnology and Bioengineering Symp. No. 16, 268 (1986).
[Sul I. Suzuki, private comminication (1993)
PULI I. Suzuki, H.M. Lizama and P.D Tackaberry“Competitive inhibition of ferrous iron oxidation by thiobacillus
ferrooxidans by increasing concentrations of cells nAppl. Env. Microbiology 55, 1117 (1989).
wcl I. Suzuki, T.L. Takeuchi, T.D. Yuthasastrakosol and J.K. Oh“Ferrous iron and sulfir oxidation and ferric iron reduction activities ofThiobacillus ferrooxidans are afleeted by growth on ferrous iron, sulJir, ora sulfide ore”Appl. Env. Microbiology 56, 1620 (1990).
[SYTI Synergetic Technology“A Thermodynamic Reaction Transpon Model for Acidic Drainage fromWaste Rock Piles”project proposal (1993)
[TaGI H. Tamura, K. Goto and M.J. NagayamaInorg. Nucl. Chem. 38, 113 (1976).
[TaWl] B.E. Taylor, M.C. Wheeler and D.K Nordstrom“Isotope composition of sulphate in acid mine drainage as measure ofbacterial oxidation nNature 308, 538 (1984).

137
[TaW21
[ToI
FYI
[UhH]
[VW
We1
WiUl
B.E. Taylor and M.C. Wheeler and D.K. Nordstrom“Stable isotope geochemistry of acid mine drainage: Experimentaloxidation of pyrite ”Geochimica et Cosmochimica Acta 48, 2669 (1984)
A.E. Torma“Biohydrometallurgy as an emerging technology ”Biotechnology and Bioengineering Symp. No. 16, 49 (1986).
J.J. Tysonin Oscillations and Travelling Waves ,
Wiley, 1985.
W. Uhl, H.-J. Hone, M.Beyer and JKlein“Continuous microbial desufurization of coal-application of a multistageslurry reactor and analysis of the interactions of microbial and chemicalkinetics nBiotechnology and Bioengineering 34, 1341 (1989)
D.R. Van Stempvoort and H.R. Krause“Controls of 6t80 in Sulfate: A Review of Experimental Data and Applicationto Specific Environments ’preprint ( 1993).
J.A. Vastano, J.E. Pearson, W. Horshemke and H.L. SwinneyJ. Chem. Phys. 88, 6175 (1988)
E. I. Wallick, H.R. Krause and A. Shakur“Environmental isotopes: principles and applications in ground watergeochemical studies in Alberta, Canada”in First Can. Conf. on Hydrology, 1984.
Bernhard Wehrli“Redox reactions of metal ions at mineral surfaces”in Aquatic Chemical Kinetics W. Stumm ed.,Willey, 1990.
W.W. White III and T.H. Jeffers“Chemical predictive modelling of acid mine drainage from metallic sulfide-bearing waste rock”U.S. Department of Interior, Bureau of Mines, 1992.
P.L. Wichlacz and R. F. Unz“Fixed film biokinetics of ferrous iron oxidation nBiotechnology and Bioengineering Symp. No. 11 (1981).
138
WiRl C.L. Wiersma and J.D Rimstidt“Rates of reaction of pyrite and marcasite with ferric iron at pH 2 ’Geochimica et Cosmochimica Acta 48, 85 (1984)
WW E.K. Yanful, K.G. Wheeland, C. Luc and N. Kuyucak“Overview of Noranda Research on Prevention and Control of Acid MineDrainage nEnvironmental Workshop 199 1, Australian Mining Industry Council
PO1 R.M. Yoonprivate communication (1993)
WRI S.B. Yunker and J.M. Radovich“Enhanced Growth of Thiobacillus ferrooxidans in an ElectrolyticBioreactor nBiotechnology and Bioengineering Symp. No. 15 (1985).
[ZiM] Z.D. Zivkovic, N. Molosavljevic and J. Sestak“Kinetics and Mechanism of Pyrite Oxidation ”Thermochimica Acta 157, 215 (1990).