quantitative risk management and stress test · quantitative risk management and stress test ......
TRANSCRIPT
IFC-Bank Indonesia Satellite Seminar on “Big Data” at the ISI Regional Statistics Conference 2017
Bali, Indonesia, 21 March 2017
Quantitative risk management and stress test to ensure safety and soundness of financial institutions1
Agus Sudjianto, Executive Vice President, Head of Corporate Model Risk, Wells Fargo
1 This presentation was prepared for the meeting. The views expressed are those of the author and do not necessarily reflect the views of the BIS, the IFC or the central banks and other institutions represented at the meeting.
Quantitative risk management and stress test to ensure safety and soundness of financial institutions
March 21, 2017
Agus Sudjianto, Ph.D. Executive Vice President, Head of Corporate Model Risk
© 2017 Wells Fargo Bank, N.A. All rights reserved. For public use.
Stress test
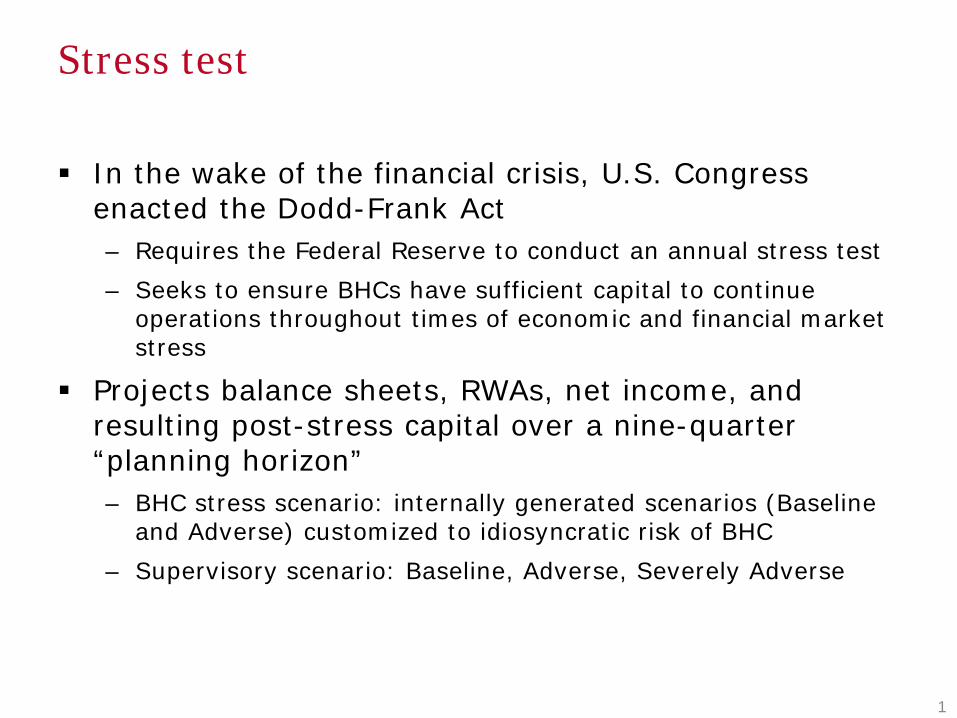
In the wake of the financial crisis, U.S. Congress enacted the Dodd-Frank Act – Requires the Federal Reserve to conduct an annual stress test – Seeks to ensure BHCs have sufficient capital to continue
operations throughout times of economic and financial market stress
Projects balance sheets, RWAs, net income, and resulting post-stress capital over a nine-quarter “planning horizon” – BHC stress scenario: internally generated scenarios (Baseline
and Adverse) customized to idiosyncratic risk of BHC – Supervisory scenario: Baseline, Adverse, Severely Adverse
1
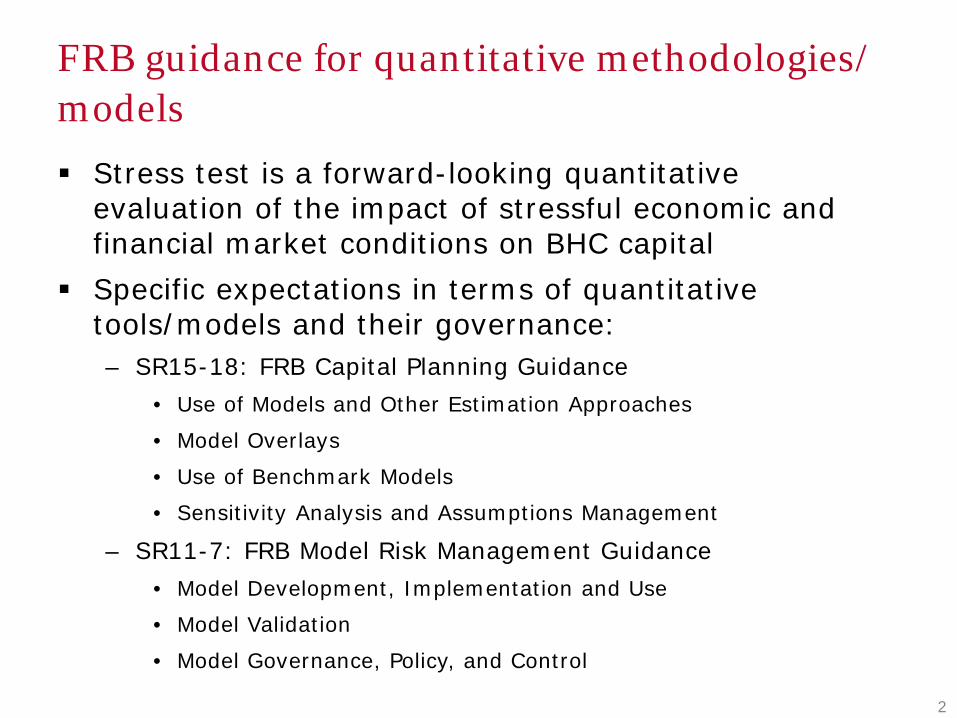
FRB guidance for quantitative methodologies/ models Stress test is a forward-looking quantitative
evaluation of the impact of stressful economic and financial market conditions on BHC capital
Specific expectations in terms of quantitative tools/models and their governance: – SR15-18: FRB Capital Planning Guidance
• Use of Models and Other Estimation Approaches
• Model Overlays
• Use of Benchmark Models
• Sensitivity Analysis and Assumptions Management
– SR11-7: FRB Model Risk Management Guidance • Model Development, Implementation and Use
• Model Validation
• Model Governance, Policy, and Control
2
Applications of models
Economic Scenario Generation – Firm-specific scenarios: specific vulnerabilities of the firm’s
risk profile – Multiple stressful conditions or events can occur
simultaneously or in rapid succession
Loss Estimation – Credit risk losses on loans and securities – Fair-value losses on loans and securities – Market and default risks on trading and counterparty
exposures – Operational-risk losses
3
Applications of models (continued)
Pre-Provision Net Revenue (PPNR) – Net interest income – Non-interest income – Non-interest expense
Risk Weighted Asset (RWA)
4
Model data/input and sources
5
SR15-18 Guidance ─ Disaggregated levels to capture observed variations in risk
characteristics and performance across sub-portfolios/segments under changing conditions
─ Internal data to estimate Losses and PPNR when possible
Data quality and relevance ─ Downturn historical data ─ Suitability for the model and consistent with the modeling
framework • Included/excluded data and proxies for model development
population, rationale, and impact on results • Representative of the bank’s portfolio • Reconciles with general reporting information (e.g., GL) as
applicable
Modeling consideration
6
SR15-18 Guidance ─ Separately estimate Losses and PPNR for portfolios or business
lines that are sensitive to different risk drivers ─ Qualitative Approaches are allowable in limited cases
Model requires both accuracy and sensitivity; where the later might be more important ─ Loss forecasting: performance both for short- and long-term
predictions are important ─ Stress Test: sensitivity is more important than model fit
Proper granularity and segmentations are critical to deal with changing portfolio composition
Modeling consideration (continued)
7
Beware of correlation between dynamic input or “time” dummy variables which can mute the impact of macroeconomic variables
Treatment dynamic variables which cannot be predicted ─ Time-varying behavioral variables
Modeling framework
8
Credit/PPNR Models ─ Account level modeling
• Conditional (i.e., hazard) model/panel regression • Credit rating migration model
− Pool level models: vintage, segment, or behavior pool − Time-series regression − Choice consideration: granularity to capture portfolio
changes, ability to capture important drivers, data availability, resource/timing, and on-going maintenance
Market Models − Full revaluation using Front Office pricing model
• Need to evaluate the model function properly during stress condition: stability, convergence, no arbitrage
− Approximation (Greek-based) models − Need Risk not in Model to deal with limitation

General modeling framework
Let T a random time of account closing (e.g., due to default or attrition/prepayment), the hazard function is modeled as a regression with g(.) link function and covariates Z(s)
Where 𝜆𝜆0 𝑡𝑡 is the baseline hazard to represent the effects of unobserved factors and s is the observation time which can be: − Static such as time of origination, s = 0 − Dynamics
• Last snapshot information without future prediction • Including future prediction, i.e. s = t and prediction model
Z(t) is available such as PPNR models (e.g., utilization or spend rate) or macro-economic factors
9
𝜆𝜆 𝑡𝑡 𝑍𝑍 𝑠𝑠 = 𝑔𝑔 𝜆𝜆0 𝑡𝑡 ,𝑍𝑍 𝑠𝑠
𝑍𝑍 𝑡𝑡 𝑋𝑋 𝑠𝑠 = ℎ 𝑍𝑍0 𝑡𝑡 ,𝑋𝑋 𝑠𝑠
Dynamic covariates and data stacking
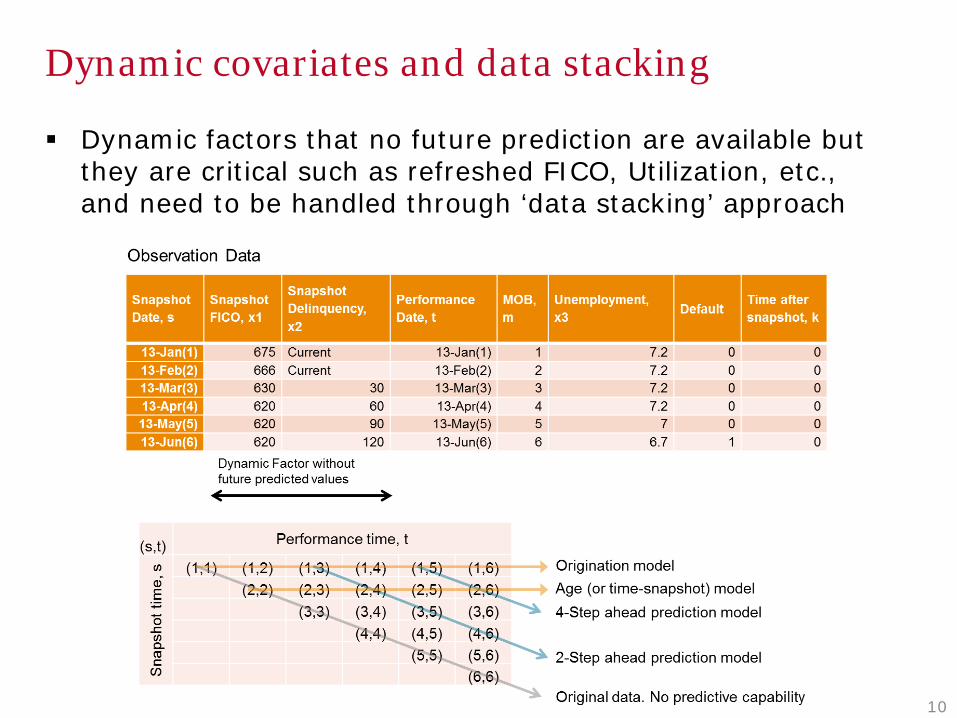
Dynamic factors that no future prediction are available but they are critical such as refreshed FICO, Utilization, etc., and need to be handled through ‘data stacking’ approach
10
Model validation depth and scope
Soundness of modeling approach ─ Methodology, granularity, data quality, and treatment (coverage,
proxy, etc.), parameter estimation/calibration
Model stability under market shock ─ computational stability, parameter stability, reasonable outcome
Rigor of model performance evaluation ─ Backtesting to previous stress condition ─ Out-of-sample and out-of-time testing ─ Sensitivity to risk varying risk drivers
• Separation across different scenarios • Consistency with respect to scenarios
Issues and limitations ─ Risk in model, risk not in model, parameter uncertainty
Holistic approach ─ Not only focus on the targeted core models, but also include critical
upstream and downstream models and tools
Thorough documentation 11
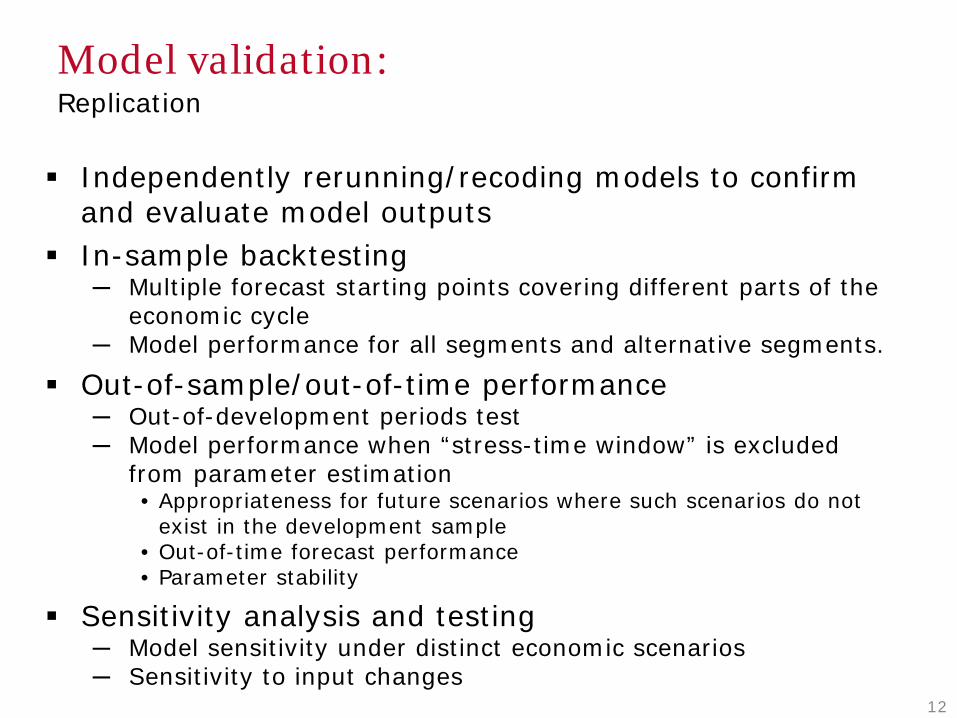
Model validation: Replication
12
Independently rerunning/recoding models to confirm and evaluate model outputs
In-sample backtesting ─ Multiple forecast starting points covering different parts of the
economic cycle ─ Model performance for all segments and alternative segments.
Out-of-sample/out-of-time performance ─ Out-of-development periods test ─ Model performance when “stress-time window” is excluded
from parameter estimation • Appropriateness for future scenarios where such scenarios do not
exist in the development sample • Out-of-time forecast performance • Parameter stability
Sensitivity analysis and testing ─ Model sensitivity under distinct economic scenarios ─ Sensitivity to input changes
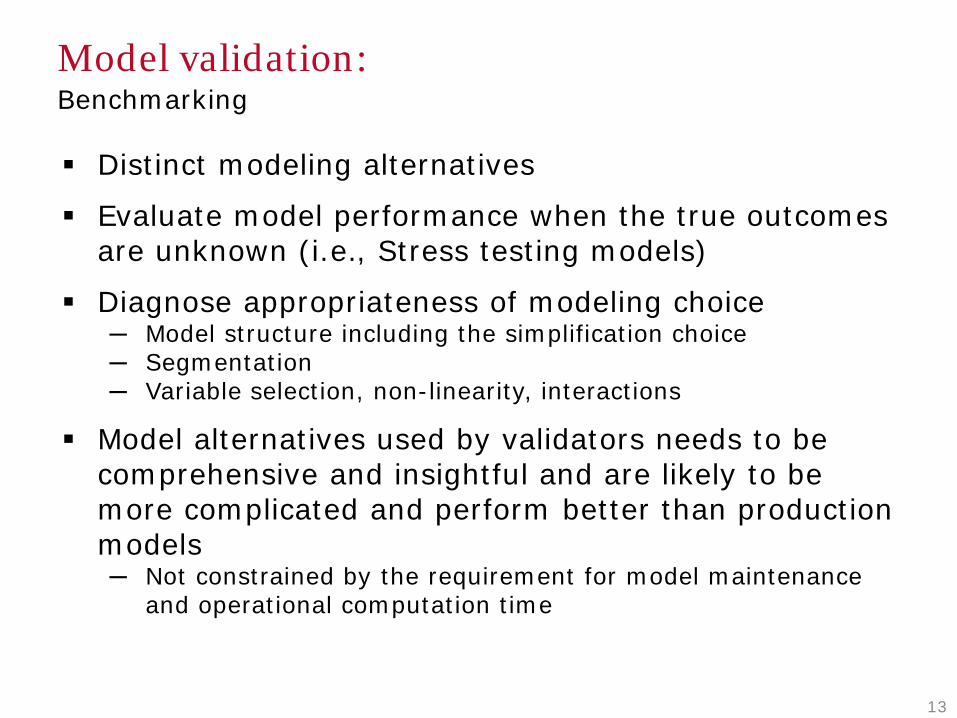
Model validation: Benchmarking
13
Distinct modeling alternatives
Evaluate model performance when the true outcomes are unknown (i.e., Stress testing models)
Diagnose appropriateness of modeling choice ─ Model structure including the simplification choice ─ Segmentation ─ Variable selection, non-linearity, interactions
Model alternatives used by validators needs to be comprehensive and insightful and are likely to be more complicated and perform better than production models ─ Not constrained by the requirement for model maintenance
and operational computation time
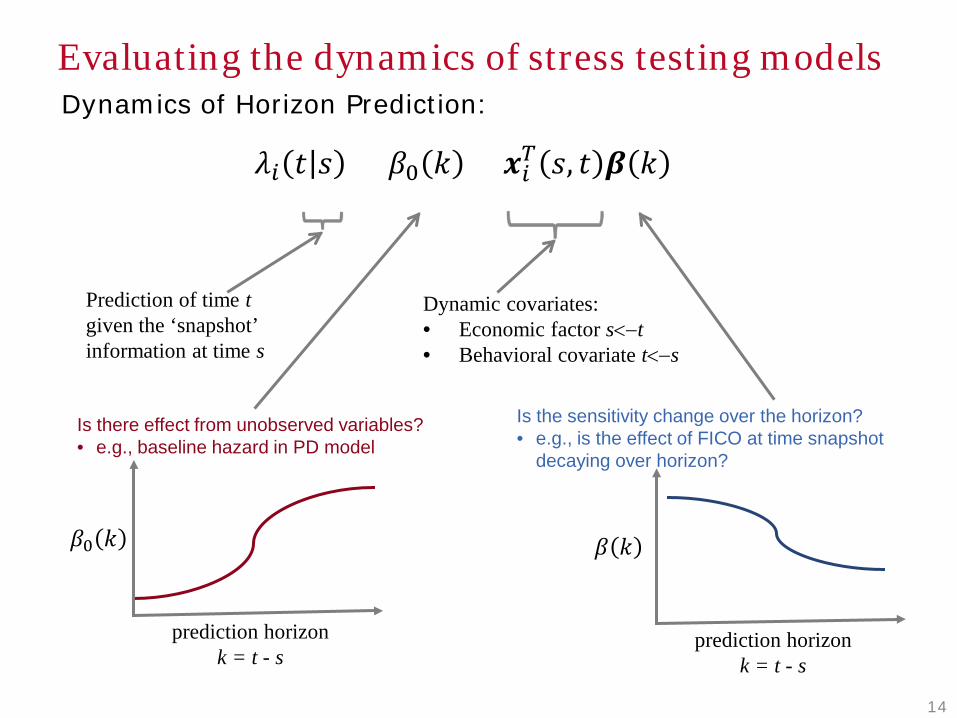
Evaluating the dynamics of stress testing models Dynamics of Horizon Prediction:
𝜆𝜆𝑖𝑖 𝑡𝑡 𝑠𝑠 = 𝛽𝛽0 𝑘𝑘 + 𝒙𝒙𝑖𝑖𝑇𝑇 𝑠𝑠, 𝑡𝑡 𝜷𝜷 𝑘𝑘
Prediction of time t given the ‘snapshot’ information at time s
Dynamic covariates: • Economic factor s<−t • Behavioral covariate t<−s
prediction horizon k = t - s
𝛽𝛽0 𝑘𝑘
Is there effect from unobserved variables? • e.g., baseline hazard in PD model
prediction horizon k = t - s
𝛽𝛽 𝑘𝑘
Is the sensitivity change over the horizon? • e.g., is the effect of FICO at time snapshot
decaying over horizon?
14
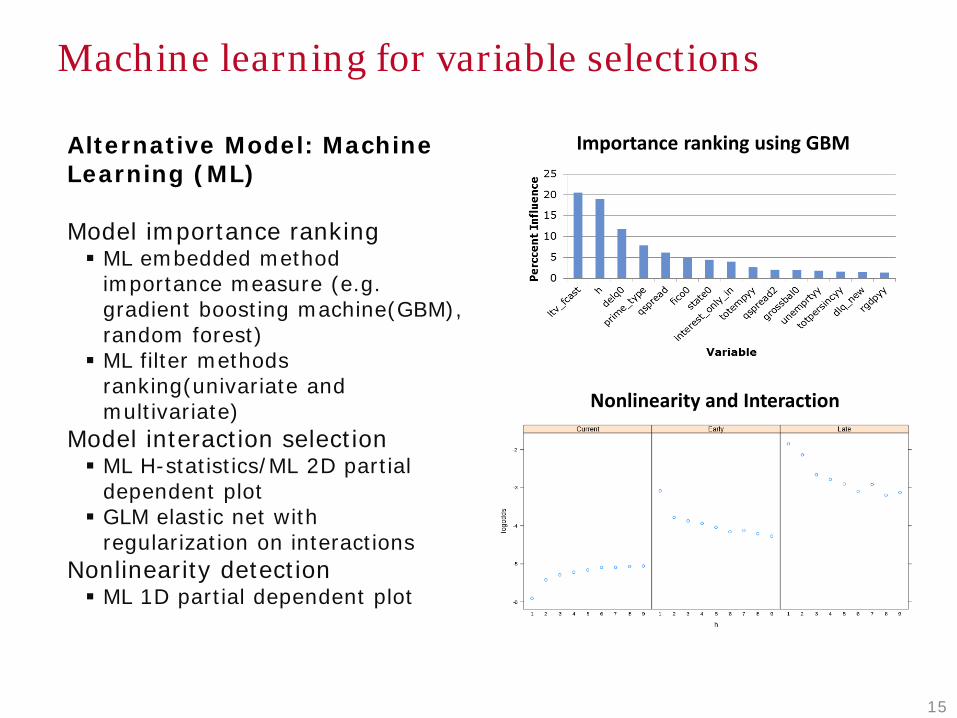
Machine learning for variable selections
Alternative Model: Machine Learning (ML) Model importance ranking ML embedded method
importance measure (e.g. gradient boosting machine(GBM), random forest) ML filter methods
ranking(univariate and multivariate)
Model interaction selection ML H-statistics/ML 2D partial
dependent plot GLM elastic net with
regularization on interactions Nonlinearity detection ML 1D partial dependent plot
Importance ranking using GBM
Nonlinearity and Interaction
15
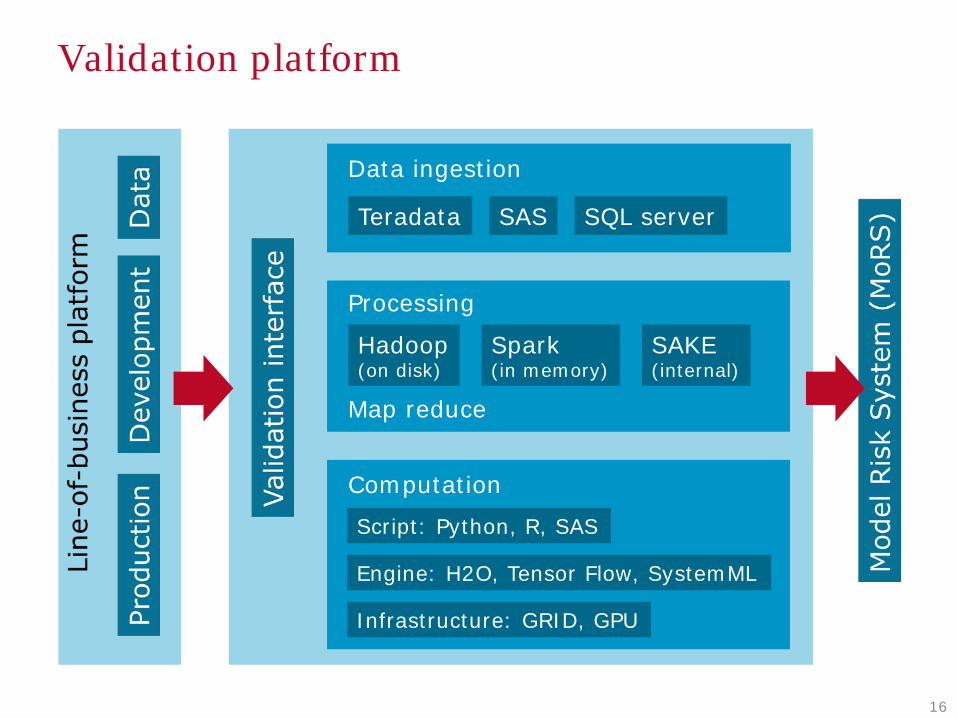
Validation platform
Data ingestion
Teradata SAS SQL server
Processing
Hadoop (on disk)
Spark (in memory)
SAKE (internal)
Map reduce
Computation
Script: Python, R, SAS
Engine: H2O, Tensor Flow, SystemML
Infrastructure: GRID, GPU
16
Compensating model weakness during usage: Overlays
Models are often have weakness and limitation due to: – Risk in Model:
• Outstanding issues, limitations, or restriction identified during model validations or performance monitoring
• Model dependency Weakness of upstream (feeder) models
Uncertainty of input assumptions
– Risk Not in Model: model limitation to capture risk drivers listed in the stress test risk identification process
• Factors in economic scenario that are not in the models
• Idiosyncratic factors both external events or business drivers/strategy
17
Compensating model weakness during usage: Overlays
Compensating factors such as model overlays are typically applied for model weakness – Quantitative overlay: model benchmark, quantitative analysis,
back testing, sensitivity analysis – Qualitative overlay: management judgment
18