quantum chemical studies related to biomass conversion by ... · catalyst lowers the barriers...
TRANSCRIPT

i
Technische Universität München
Department Chemie
Fachgebiet für Theoretische Chemie
Quantum Chemical Studies Related to
Biomass Conversion by Heterogeneous Catalysis
Cheng-chau Chiu
Vollständiger Abdruck der von der Fakultät für Chemie der Technischen Universität
München zur Erlangung des akademischen Grades eines
Doktors der Naturwissenschaften (Dr. rer. nat)
genehmigten Dissertation.
Vorsitzender: Univ.-Prof. Dr. Dr. h.c. Bernhard Rieger
Prüfer der Dissertation: 1. Univ.-Prof. Dr. Dr. h.c. Notker Rösch, i.R.
2. Univ.-Prof. Dr. Klaus Köhler
3. Hon.-Prof. Dr. Dr. h.c. Hans-Joachim Freund
(schriftliche Beurteilung)
Univ.-Prof. Dr. Ville R. I. Kaila
(mündliche Prüfung)
Die Dissertation wurde am 7. Januar 2015 bei der Technischen Universität München
eingereicht und durch die Fakultät für Chemie am 18. Februar 2015 angenommen.


iii
Acknowledgments
I want to start this page with expressing my gratitude to my PhD advisor, Professor Notker
Rösch, for giving me the opportunity to study this interesting topic in his group as well as
for the guidance of my scientific work.
Special appreciation further goes to Dr. Alexander Genest, who literally took care of
everything, starting from scientific discussions, to providing solutions to computer problems
and even administrative support. Another person who deserves an extra mention is Dr. Sven
Krüger who provided assistance with both scientific as well as administrative issues.
I want to thank all external collaborators who were involved in my studies for their
contribution to the success of the projects. I should mention here Professor Georgi
Vayssilov and Dr. Armando Borgna for their participation in the zeolite project and the
guaiacol project, respectively. I also thank Dr. Michael Sullivan for administrative support
during my stay at the Institute of High Performance Computing (IHPC) in Singapore.
Furthermore, I want to thank my colleagues Dr. Duygu Başaran and Dr. Zhijian Zhao
for the daily discussions on our works on heterogeneous catalysis and various other things. I
also thank Dr. Lili Zhao for the good cooperation on our joint project on mixed metal
oxides. Special thanks also go to Thomas Soini, who was always ready to help, also for
issues beyond our scientific works.
I thank all present and past colleagues I have encountered during my time at the
Technische Universität München (TUM) and at the Catalysis Modelling Group at IHPC,
Benjamin Chen, Dr. Ion Chiorescu, Dr. Konstantina Damianos, Dr. Shrabani Dinda, Dr.
Wilhelm Eger, Dr. Agalya Govindasamy, Bo Li, Dr. Virve Kartunen, Stefan Kienzle, Dr.
Alena Kremleva, Dr. Xiufang Ma, Dr. Remi Marchal, Dr. Alexei Matveev, Dr. Astrid
Nikodem, Dr. Suwit Suthirakun, Dr. Yin Wu, for the good working atmosphere.
Apart from those persons, which I have encountered at the university, I want to
mentioned and thank a special group of person, which have awaken my interest for
chemistry: my high school chemistry teachers Volker Lang, Hartmut Volke, Klaus Lorbach
and Heiner Greis.

Acknowledgments
iv
I also thank the International Graduate School of Science and Engineering at the TUM
and the A*STAR Graduate Academy for their generous scholarships. Furthermore, I thank
the Leibniz-Rechenzentrum of the Bayerische Akademie der Wissenschaften and the
A*STAR Computing Resource Center for providing the computing resources.
Last but not least, I want to thank my family for their unconditional love and support.

v
Abstract / Zusammenfassung
This thesis deals with the theoretical description of the conversion of biomass derived
feedstock in heterogeneously catalyzed reactions as well as related chemical processes. The
first part of this work uses periodic DFT methods to study the reaction mechanisms of
metal-catalyzed transformations of organic oxygenates, e.g., alcohols and phenols, to
unfunctionalized hydrocarbons. This thesis shows that the presence of step sites on a Pt
catalyst lowers the barriers associated with the alkane formation from 1-propanol;
nevertheless, this reaction path is, consistent with experiment, less favored than the
reforming path. This thesis also demonstrates that the preferred decomposition route of
ethanol on a close-packed Ru surface leads to the scission of the C-C bond yielding CO and
methylene. It is further revealed that the Ru-catalyzed hydrodeoxygenation of guaiacol
proceeds via the intermediates catecholate and phenolate and that the availability of step
sites determines whether phenol or benzene is formed as the main product. The second part
of this work examines two common DFT-based strategies for describing dispersive forces,
the DFT-D2 method and the vdW-DF2 functional. Adsorption energies for water, alcohols
and alkanes in MFI type zeolites are calculated using the two approaches. Comparison with
experimental values shows that both methods are only partially suitable for modeling
reactions in zeolites, as they systematically overestimate the exothermicity of alkane
adsorption.
Die vorliegende Arbeit beschäftigt sich mit der theoretischen Untersuchung der heterogen
katalysierten Umsetzung von biogenen Rohstoffen sowie mit den damit
zusammenhängenden chemischen Prozessen. Der erste Teil dieser Arbeit verwendet
periodische DFT-Methoden, um die Reaktionsmechanismen der metallkatalysierten
Umsetzung von sauerstoffhaltigen, organischen Verbindungen wie Alkohole und Phenole
zu nicht funktionalisierten Kohlenwasserstoffen zu untersuchen. Unter anderem zeigt diese
Arbeit, dass die Präsenz von Stufen auf einer Pt-Oberfläche die Barrieren für die
Alkanbildung aus 1-Propanol herabsetzt. Dennoch ist dieser Reaktionspfad, in

Abstract / Zusammenfassung
vi
Übereinstimmung mit dem Experiment, energetisch weniger vorteilhaft als die
Reformierungsreaktion. Diese Arbeit zeigt auch, dass die bevorzugte Zerfallsroute von
Ethanol auf einer dichtest gepackten Ru-Oberfläche zur Spaltung der C-C Bindung und
damit zur Bildung von CO und Methylen führt. Zudem wird dargelegt, dass die Ru-
katalysierte Hydrodeoxygenierung von Guaiacol über die Intermediate Catecholat und
Phenolat verläuft und dass die Verfügbarkeit von Stufen dafür entscheidend ist, ob
hauptsächlich Phenol oder Benzol gebildet wird. Im zweiten Teil dieser Arbeit werden zwei
gängige, DFT-basierte Methoden zur Beschreibung von Dispersionskräften untersucht, die
DFT-D2 Methode und das vdW-DF2 Funktional. Mit beiden Methoden wurden
Adsorptionsenergien für Wasser, Alkohole und Alkane in Zeoliten des MFI-Strukturtyps
berechnet. Der Vergleich mit experimentellen Werten zeigt, dass beide Methoden nur
bedingt für die Modellierung von Reaktionen in Zeoliten geeignet sind, da sie die
Exothermizität der Adsorption von Alkanen systematisch überschätzen.

vii
Contents
Acknowledgments iii
Abstract / Zusammenfassung v
Contents vii
Chapter 1 Introduction 1
Chapter 2 Background 5
2.1. Aqueous Phase Processing of Biomass 5
2.2. Processing of Aromatic Oxygenates 10
2.3. Conversion of Ethanol to Hydrocarbons 14
Chapter 3 Computational Methods and Models 17
3.1. Quantum Chemical Methods 17
3.2. Models for Metal-Catalyzed Reactions 19
3.3. Models for Processes in Zeolites 21
3.4. Definition of Reaction Energies and Barriers 23
Chapter 4 Aqueous Phase Processing of 1-Propanol over Pt 25
4.1. Indroduction 25
4.1.1. Previous Studies 26
4.2. Results and Discussion 30
4.2.1. Effect of Steps on the Propane Formation Pathway 30
4.2.1.1. C-O Cleavage of the Alcohol-Hydrogenolysis Pathway 31
4.2.1.2. Propylene Hydrogenation in
the Acidic Dehydration-Hydrogenation Pathway 34
4.3. Conclusion 36
Chapter 5 Decomposition of Ethanol over Ru 39
5.1. Introduction 39
5.2. Nomenclature 40
5.3. Results and Discussion 41
5.3.1. Adsorption Geometries 41
5.3.2. Reaction Energies 45
5.3.3. Reaction Barriers 47
5.3.4. Reaction Pathways 51
5.4. Conclusions 55

Contents
viii
Chapter 6 Hydrodeoxygenation of Guaiacol over Ru 57
6.1. Introduction 57
6.2. Nomenclature 59
6.3. Results and Discussion 60
6.3.1. Adsorption and Reactions on Close-Packed Ru(0001) 62
6.3.1.1. Adsorption Geometries 62
6.3.1.2. Energetics of Reactions 66
6.3.1.3. Comment on the Temperature and Pressure Dependency 71
6.3.1.4. Adsorption Processes 72
6.3.1.5. Reaction Pathways 74
6.3.2. Reaction on Stepped S3-Ru(101̄5) and S3-Ru(101̄5) Surfaces 82
6.3.2.1. Extension to Nomenclature Rules 83
6.3.2.2. Adsorption of Catecholate and Phenolate at Step Sites 85
6.3.2.3. Energetics of the C-O Cleavage Process at Step Sites 87
6.3.2.4. Interpretation of the Experimental Results 91
6.4. Conclusions 92
Chapter 7 Benchmark of DFT Strategies to Address
van der Waals Interactions in Zeolites 95
7.1. Introduction 95
7.2. Results and Discussion 96
7.2.1. Adsorption Energies from PBE-D2 Calculations 98
7.2.1.1. Adsorption of Alkanes 98
7.2.1.2. Adsorption of Alcohols and Water 103
7.2.1.3. Comparison of Adsorption Enthalpies and Adsorption Energies 106
7.2.2. Adsorption Energies from vdW-DF2 Calculations 108
7.2.2.1. Adsorption of Alkanes 108
7.2.2.2. Adsorption of Alcohols and Water 109
7.2.3. Comparison of the Two Types of Zeolites 109
7.2.4. Analysis of PBE-D2 Adsorption Energies and
Comparison with vdW-DF2 Results 111
7.2.5. General Comments 113
7.3. Conclusions 116
Chapter 8 Summary 119
Appendix: List of Abbreviations 123
References 125
1
Chapter 1 Introduction
The remaining availability of fossil energy resources as oil, natural gas and coal is disputed in
the literature, but it is generally accepted that they will be depleted.1-5
For instance, the rate of
petroleum extraction has been predicted to reach its maximum (“peak oil”) in the first half of
the 21st century.2,3
However it is still being discussed whether the extraction rate will stay
constant at a high level or will decrease after the peak.2,3
To get a rough idea of the time
scales discussed for the depletion of fossil energy, recall that some of the simple forecast
models assume the production of oil to continue for 100 years after the peak oil is reached.2
This is a challenging issue as more than 80% of the world’s energy consumption in 2011 was
covered by energy sources of fossil origin.6 The remaining share was covered by
hydroelectric, nuclear, and renewable energy sources, although the contribution of the latter
is only minor, less than 5%.6 The up-coming depletion of fossil resources will not only have
an impact on the availability of energy, but will also affect the chemical industry, as a large
variety of chemicals are produced from fossil resources in petrochemical processes.7 Thus, it
is necessary to reduce the dependency on fossil resources both as energy source and as
feedstock for the chemical industry.8 One possible approach to reach this goal is the usage of
renewable resources such as biomass, which has been claimed to be “the only practical
source of renewable liquid fuel”.9 Great efforts have been made to establish a biomass based
industry that, in analogy to the petrochemical industry, uses a small number of chemicals as
building blocks for the synthesis of a large variety of products.10
For this purpose, various
chemical species that may be suitable as building blocks, have been identified, based on their
potential for the industrial application, as so-called “platform molecules” for the biomass
based industry.11
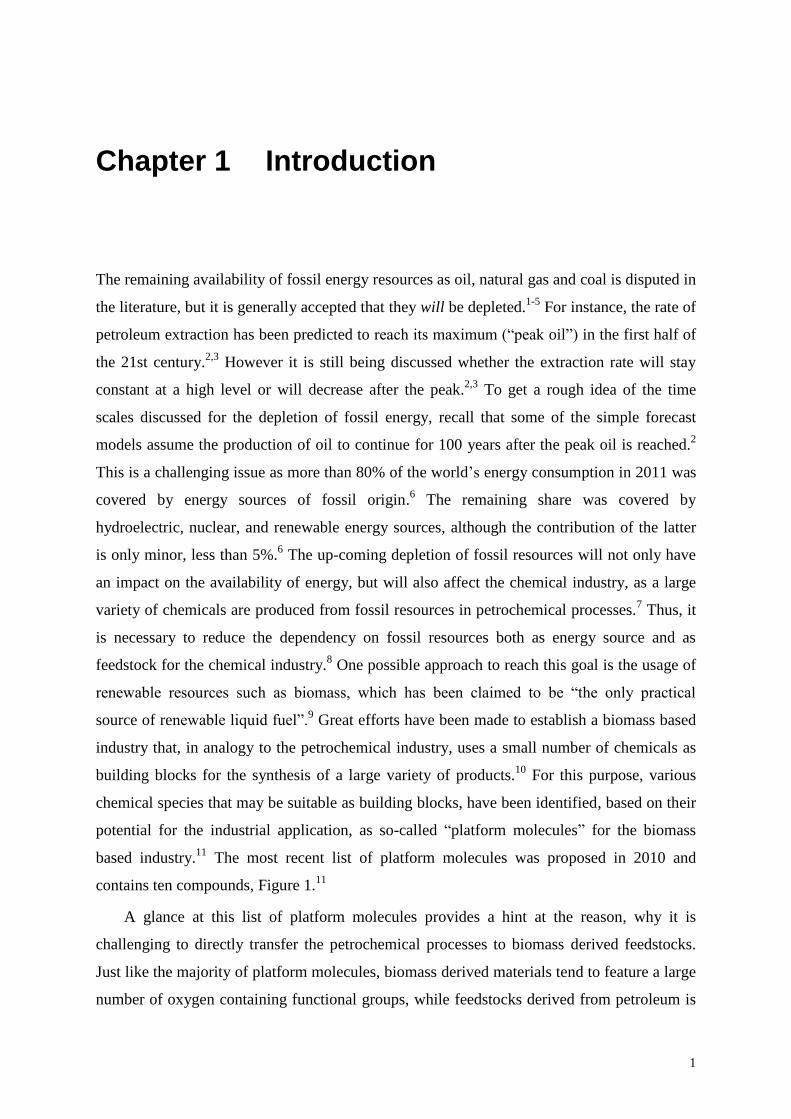
The most recent list of platform molecules was proposed in 2010 and
contains ten compounds, Figure 1.11
A glance at this list of platform molecules provides a hint at the reason, why it is
challenging to directly transfer the petrochemical processes to biomass derived feedstocks.
Just like the majority of platform molecules, biomass derived materials tend to feature a large
number of oxygen containing functional groups, while feedstocks derived from petroleum is

Chapter 1. Introduction
2
generally less strongly functionalized.10
This issue has a significant impact on the chemical
and physical properties of the respective materials, which have to be taken into account when
processing them. The large number of functional groups in biomass induces strong
intermolecular interactions, which renders many biomass derived molecules to be non-
volatile. Such molecules are often soluble in water, making a reaction in the aqueous phase
(AP) possible. At variance, the unfunctionalized and thus volatile fossil feed molecules are
often hydrophobic. Due to the absence of functional groups, fossil feed molecules are hard to
activate and are therefore often processed at high temperature in gas phase.10
In contrast,
functionalized molecules derived from biomass tend to decompose before they evaporate.
Therefore, this type of feedstock is best processed in aqueous phase under milder reaction
conditions.10,12
The difference in the chemistry between petrochemical and biomass derived feedstocks
sketched above illustrates the necessity to develop new processes that are tailored to the
properties of biomass materials. Quantum chemical studies as carried out in this thesis can
assist the development of such new processes, as they can reveal the molecular mechanisms
behind a complex reaction network.13-15
Theoretical methods enable the identification and
understanding of the atomic / electronic interactions that are crucial for chemical processes,
which is often hard to achieve by experimental methods only. Such information is valuable
especially when a process involves complex reaction sequences or networks, as often
encountered in catalytic reactions. Applying the additional knowledge about the reactions
enables a target driven design and improvement of chemical processes.
Figure 1: Platform molecules for a biomass based industry according to Ref 11.

Chapter 1. Introduction
3
Next, the structure of this thesis shall briefly be elucidated. The next chapter after this
introduction describes some background information on the utilization of biomass, in order to
illustrate the context of the projects in this thesis. In Chapter 3, a short sketch of the applied
quantum chemical methods will be provided and various aspects concerning the model
building will be addressed.
The results of this thesis will be presented and discussed the Chapters 4 to 7. Chapter 4
deals with the reaction network of 1-propanol over Pt catalysts under AP processing
conditions, which has also been studied experimentally.16
Earlier works at the Fachgebiet für
Theoretische Chemie have explored both the reforming17-19
as well as the alkane formation
pathways.20,21
However, the C-O cleavage pathways leading to alkane formation thus far have
been modeled with a close-packed Pt(111) surface only, leaving open the effect of step sites
on the alkane formation. This issue will be addressed in this chapter by presenting
calculations using a stepped Pt surface to model the catalyst. In combination with the earlier
results,17-21
the new data will be used to derive a complete overview of the reactions of
1-propanol over Pt in AP processing.
Chapter 5 deals with the decomposition of ethanol over Ru catalysts. This chapter can be
understood as a complementary study to the contents of Chapter 4, in which reactions
catalyzed by a metal favoring the reforming pathway have been investigated. At variance, Ru
has been reported to catalyze the formation of alkanes from alcohols.22,23
A major aspect of
this chapter is the competition between the C-O and the C-C cleavage, which is discussed to
be crucial for the question whether a catalytic system will favor the formation of alkanes or
the reforming pathway.12,23-25
A second focus of this chapter is put on the mechanism of the
C-O and C-C bond cleavages.
Chapter 6 continues with Ru-catalyzed reactions and deals with the hydrodeoxygenation
(HDO) process of aromatic oxygenates derived from biomass, e.g. from lignocellulose.
Experiments using guaiacol (2-methoxyphenol) as a model feedstock have shown that the
oxygen functionalities can (partly) be removed, when the oxygenate is brought to reaction
with H2 over Ru nanoparticles supported on activated carbon.26-29
Depending on the reaction
conditions, in particular on the H2 pressure, guaiacol can be processed to yield benzene26
or
phenol,27-29
both chemicals of industrial importance. This chapter will illustrate the
calculations to establish, based on the computationally evaluated energetics, a reaction
mechanism for the guaiacol HDO on Ru that is consistent with the experimental observations.
Furthermore, the calculated results will be used to rationalize why the product selectivity of

Chapter 1. Introduction
4
the HDO process depends on the H2 pressure.
The next chapter, Chapter 7, will deal with zeolites. Due to the importance of zeolites for
industrial applications, among others as catalysts,30,31
it is desirable to establish quantum
chemical methods that are able to describe accurately molecular processes and interactions in
zeolites. However, the proper description of the van der Waals (vdW) interactions, which is
known from experimental32-36
and theoretical studies35,37-47
to play an important role for the
chemistry of zeolites, is a challenge to semi-local DFT approximations.48
The DFT-D2
method49
and the non-local correlation density functional of the type vdW-DF250
are two
approaches, which are claimed to describe the dispersive interactions. This chapter will
benchmark the performance of these two methods on the example of the adsorption of water,
alcohols and alkanes in Silicalite and H-ZSM5 zeolites.
The final Chapter 8 will present a brief summary of all results, together with some
concluding remarks.

5
Chapter 2 Background
In this chapter, some of the recent developments in biomass processing shall be highlighted.
A focus is placed on those processes that are relevant for the reactions studied in this thesis.
Earlier approaches to the production of bio-fuels such as the production of bio-diesel from
vegetable oil51
will be omitted here. The aim of this chapter is not only to list promising
technologies; the chemical principles behind those processes should also be illustrated here.
2.1. Aqueous Phase Processing of Biomass
In one of the pioneering works on the field of biomass processing, Dumesic and co-workers
have shown that sugars, e.g. glucose, as well as biomass derived polyols like glycerol can
react to form H2 and alkanes in AP reactions catalyzed by Pt supported on Al2O3.52
Not only
alkanes are interesting as an energy carrier, as they can be used as a liquid fuel that is
compatible with the current technology, also H2 is interesting for the energy industry, for
instance in fuel cells. A large number of subsequent works have improved the processes for
Figure 2: Reaction pathways involved in the catalytic aqueous phase processing of alcohols.
The reactions in blue are associated with the reforming pathway; those in red are associated
with the formation of alkanes. Ref 52.

Chapter 2. Background
6
the production of alkanes or H2.12,16,22-24,53-62
In later works, aqueous phase processing has
also been developed further to produce structurally more complex chemicals such as
γ-valerolactone.63-65
As this thesis focuses on the reforming pathway and the alkane
formation, the production of other (platform) chemicals in AP processing will not be further
addressed.
AP processing of sugars or sugar derived alcohols is often performed as a reaction in a
single reaction vessel catalyzed by supported metal nanoparticles. The typical reaction
conditions are temperatures around 500 K and elevated pressure between 15 and 50 bar. The
actual process involves a complex reaction network with reactions that may occur on the
metal catalyst, the support and / or in the solvent phase, as shown in Figure 2.52
The
selectivity of this process can for instance be tuned by varying the catalyst / support system.
The reforming pathway leading to the formation of H2 and CO2 is associated with late, or
rather non-oxophilic, transition metal catalysts as Pt or Pd and neutral supports.23,55,66
At
variance, the formation of alkanes is favored by more oxophilic metal catalysts as well as by
acidic reaction conditions, which may be induced by an acidic support or by mineral acids in
the aqueous phase (Figure 3).23,55,66
The impact of the acidic conditions on the selectivity can be easily explained with the
acid-catalyzed dehydration, which removes OH groups as water, Figure 2.24
The preference
for alkane formation by catalysts based on more oxophilic metals such as Ni, Ru or Rh,23,55,66
can be rationalized with the Brønsted-Evans-Polanyi relation (BEP). In this context the BEP
relation can be phrased as: the more stable a product state, the lower is the activation barrier
for its formation.67
As oxygen groups are per definition strongly stabilized on the surface of
oxophilic metals, barriers associated with C-O bond cleavage reactions yielding a carbon
moiety and an oxygen moiety on the metal surface will also be low. Thus oxophilic metals
favor the cleavage of C-O bonds, which is necessary for the formation of alkanes.
Figure 3: Factors controlling the selectivity of aqueous phase processing of feedstocks
derived from starch and sugars as summarized by Dumesic and co-workers; adapted from Ref
23.

Chapter 2. Background
7
As discussed in literature, the preference for the formation of either H2 or alkanes is
related to the competition between the C-C and the C-O scission reactions.12,23-25,68
While it is
apparent, why alkane formation is associated with the C-O cleavage, the connection between
the preference for the reforming pathway and the C-C cleavage is not so easily accessible and
thus shall be elaborated here by a thought experiment. When an alcohol, for instance glycerol
(HOCH2-CHOH-CH2OH), shall be used as feedstock for the production of H2, it is desirable
to turn all H atoms of the alcohol to H2. If reactions with the aqueous solvent are neglected,
the theoretical maximum is four equivalents of H2 for each glycerol. The removal of all H
atoms from glycerol would leave a hypothetical, radical entity “(CO)3” which strongly binds
to the catalyst surface and may cause poisoning if not removed. The (CO)3 species can only
be removed from the catalyst, if it decomposes via C-C cleavage to non-radical C1 species
such as CO (or CO2). Of course, there are also other carbonaceous species with more than
one C atom that feature a close-shell electron configuration and thus allow for easy
desorption, e.g. propane or propylene. However, all these species contain H atoms, i.e., their
formation would reduce the H2 yield. Furthermore, a good reforming catalyst should not
favor the C-O cleavage. If a catalyst is active for the C-O scission of CO formed upon C-C
cleavage as mentioned above, the CO moiety will be converted into adsorbed C and O.
Without the re-formation of the C-O bond, the C and O atoms can only desorb as methane
and H2O, respectively. Hydrogen is consumed in both cases, leading to the undesired
reduction of the H2 yield. Note that CO is normally not observed as a product in aqueous
phase processing, as the typical reaction conditions also favor the water gas shift (WGS)
reaction (Figure 2). Thus CO reacts with H2O from the solvent phase to form CO2 and H2,
which is a desirable side effect that increases the H2 yield.
There is a large number of theoretical works dealing with the reactions of alcohols or
(aliphatic) oxygenates in general on metals surfaces, which partly reflects the success of the
aqueous phase processing of biomass.17,19,25,68-83
On the other hand, reactions of alcohols are
not only playing a role in biomass processing, but also in other important processes, such as
steam reforming84
or the methanol synthesis from CO or CO2.85
One of the first theoretical
studies to address AP processing of alcohols is the work by Mavrikakis and co-workers on C-
O and C-C cleavage reactions of ethanol on Pt(111).71
Consistent with the preference of Pt
for the H2 formation, Pt was shown to be more active for the scission of the C-C bonds than
for the C-O bond cleavage.71
The ethanol decomposition on close-packed surfaces of 10
selected transition metals from groups 7−11 has been investigated using BEP relations
Chapter 2. Background
8
derived from DFT calculations.68
The resulting energetics for the C-C and C-O scission steps
was used to predict reaction rates that deviate by 1–2 orders of magnitude from the
experimental reference.68
Note that this agreement between experiment and theory can be
considered reasonable for state-of-the-art quantum chemical methods.68
However, that work68
did not explicitly consider the dehydrogenation steps and concluded that the rate-limiting
steps of ethanol decomposition on the various metals is a C-C cleavage step.68
It is now
known that neglecting hydrogen transfer steps is too strong a simplification when one studies
the reaction of alcohols.86
In fact, the dehydrogenation steps can be more relevant for the
kinetics than the C-C and C-O scission steps.86
Various DFT studies addressing the
mechanism of ethanol decomposition on close-packed surfaces of Pt,87,88
Pd,75
Rh,77,80
and
Co89
have demonstrated that dehydrogenation steps often have associated barriers that are
comparable or higher than the C-C and C-O scission barriers.
The comparison of the ethanol reforming barriers and the DOS (density of states) of a
metal catalyst revealed that those metals featuring a high DOS at around the Fermi level are
catalytically more active.90
A high DOS near the Fermi level can be understood as an
indicator for a high redox capability, which benefits the redox steps involved in ethanol
reforming, e.g., dehydrogenation, C-C scission etc.90
Based on this finding, it has been
concluded that Rh and Ir should show high catalytic activity for alcohol reforming.90
However, a high DOS at the Fermi level does not guarantee a high selectivity for the
reforming pathway as the competing alkane formation also involves redox steps.
As the preceding paragraph shows, many quantum chemical studies focus on the reaction
of ethanol, the smallest alcohol containing both a C-O and a C-C bond. Despite of the success
of these studies on ethanol, one has to realize that such studies have a certain model character,
as mono-ols are not typical for the AP processing of biomass.23
Thus, various works have
studied the reaction of polyols like glycerol on Pt(111).78,82,91
Similar to the reaction of
ethanol, glycerol has to dehydrogenate multiple times before the C-C cleavage becomes
kinetically accessible.82,91
The rate of glycerol reforming on Pt is controlled by the
dehydrogenation steps and not the C-C scission.91
Using the energetics evaluated at the DFT
level, BEP relations and linear scaling relations have been derived and applied to investigate
the reactions of glycerol on Pd, Rh, Cu and Ni.92
The linear scaling relations correlate the
adsorption energy of an organic species on a given metal surface with the bond strength of
atomic C and O centers on the surface. That study showed, consistent with experiment,22
that
Pt and Pd are suitable reforming catalysts.92
A work on the reforming kinetics of glycol
Chapter 2. Background
9
(ethanediol) over Pt(111) demonstrated that the ideal reforming catalyst should be slightly
more oxophilic than Pt,93
as the better stabilization of O groups would facilitate the rate-
limiting dehydrogenation at the OH groups.93
This finding rationalizes the higher reforming
activity of bimetallic NiPt catalysts compared to Pt.93
Recall that the typical biomass processing is carried out in aqueous phase, as mentioned
at the beginning of this section. Although the solvent likely has an effect on the reaction, the
majority of the previously mentioned computational studies do not account for the solvent
phase. A first step to overcome this gap between the model and the reality is to consider the
reactions of the feedstock with the solvent. DFT calculations on surface reactions on Au,76
Pt,19,76,88,94
Pd,95
Rh,96
and Co89
illustrated that an OH group from the solvent phase can react
with adsorbed acyl (R-C=O) groups which derive from the dehydrogenation of alcohols.
These reactions yield carboxylic acids which are observed as intermediates in AP processing
over Pt.16
Although it is an interesting issue to understand the effect of the aqueous phase on
the reactions, only few studies, e.g. Ref 76, account for the solvent by including explicit
water molecules to the quantum chemical model. The latter work showed for the ethanol
oxidation on Au that the solvent effects are only minor, apart from the reaction of surface
acetyl with OH from the solvent.76
It is widely accepted that the surface structure of catalysts can have an effect on the
reactivity.97
However, most of the works discussed in the present section rely on modeling
metal catalysts with close-packed surfaces. This approximation is often good enough to
obtain trends that allow one to rationalize the experimental observations. When studying
mechanistic details, one may need to compare the reactions on differently shaped surfaces of
a metal. Studies on the alcohol oxidation on Pt88
and Pd95
indicate that the open (100)
surfaces are catalytically more active than the close-packed (111) surfaces. The presence of
step sites can also have an impact on the reaction mechanism. For instance, the
decomposition of 1-propanol on Pt(111) can only proceed via decarbonylation; in contrast,
two kinetically accessible decomposition pathways have been identified for the stepped
Pt(221) surface (cf. Section 4.1.1).19
Another example is the decomposition of ethanol on Rh:
while the reaction on Rh(111) is limited by the dehydrogenation step yielding the surface
oxa-metalla-cycle CH2CH2O,77,80
ethanol decomposition at step sites modeled by Rh(211) do
not proceed at all via this intermediate.81,96
The works discussed thus far focus on the reaction on metal catalysts, although it is
known that the support material itself can be catalytically active, as mentioned before. Some

Chapter 2. Background
10
works have addressed the acid-catalyzed alcohol dehydration on typical support materials,
like γ-Al2O3, used in biomass processing.98
Suitable models for supported metal catalysts, e.g.
Pt/γ-Al2O399
or Pd/MgO,100,101
have been reported. These models typically consist of a small
metal cluster on a slab model that describes the support material.99-101
Such more complex
models have, for instance, been used to investigate NO activation,99,100
CO oxidation100
or the
water gas shift reaction,101
but have yet to be applied in the context of biomass processing.
Summing up the present section, it can stated that the computational studies mentioned
above have already been able to reveal various mechanistic details, contributing to the
understanding of the reactivity of alcohols on metals. However the reactions of alcohols
involving the complex interplay with the metal catalyst, the support and the solvent, still
raises questions yet to be explored.
2.2. Processing of Aromatic Oxygenates
The majority of the works introduced in the preceding section deals with the processing of
aliphatic alcohols, i.e. species that are derived from sugars or starches. As these parts of
biomass are also edible, an unwanted competition between the food production and the
biomass based chemical industry can arise, if the latter exclusively focuses on the processing
of sugars and starches.10
Therefore, recent research has also addressed the utilization of
feedstocks derived from lignin, one of the inedible main-components of woody
biomass.26-29,102-124
Due to the structure of lignin, which contains aromatic C6 rings as a
repeating structural motif, many molecules derived from processing of lignin are aromatic
species. These species display different reactivity than the aliphatic species derived from
starches and sugars, which have been mentioned in the preceding section.
One of the typical approaches to process lignin or woody biomass to liquid fuels is
pyrolysis, the thermo-chemical decomposition of a feedstock under anaerobic
conditions.24,108,125
The product of this process, referred as “pyrolysis oil” or “bio oil”,
contains of a large variety of different aliphatic and aromatic oxygenates.110,126,127
This
mixture of chemicals is not yet suitable for usage as fuel, because it still features various
undesired properties like chemical instability, low heating value and high viscosity.110,128
As
these problems are associated with the high oxygen content of the pyrolysis oil,110,128
(partial)
removal of the oxygen functionalities is necessary in order to upgrade the oil and to obtain a
product that is compatible with the current petrochemical technology.128
The removal of the O groups and the formal replacement by H atoms is referred to as
hydrodeoxygenation (HDO). The alkane formation from alcohols or aliphatic oxygenates in

Chapter 2. Background
11
general as mentioned in Section 2.1 can also be understood as a HDO process. Compared to
the reactions of aliphatic oxygenates, the HDO of aromatic species is more challenging due to
the stability of the aromatic C-O bonds.120
There is a large variety of differently designed,
catalytic processes for the transformation of aromatic oxygenated, which use
metals,26-29,102-106,111,114-117,120,123,124
metals in conjunction with mineral acids or
zeolites,107,113,122
but also non-metallic materials like carbides, sulfides or oxides as
catalysts.26,112,114,120,121,129
Some of the processes aim at the production of aromatic
products,27-29,102,103,105,106,111,112,114-117,120-124,129
while other variants couple the C-O cleavage
with the hydrogenation of the aromatic system yielding cyclic, aliphatic or olefinic
products.104-107,113-115,120,121
The experimental works on the HDO of aromatics can give a rough idea about the
reaction pathways over the various catalytic systems.26,28,102,103,111,113,114,116-118,130-136
Reactions
which combine a metallic hydrogenation catalyst with an acid functionality, typically aim at
the production of non-aromatic products.107,113,122
Such processes start with the hydrogenation
of the aromatic ring to yield a saturated system. In a second step, the oxygen group is
eliminated in an acid-catalyzed reaction leading to the formation of an olefinic system, which
can be re-hydrogenated.107,113,122
Figure 4 illustrates the reaction mechanism on the example
of phenol conversion over Pd/C in the presence of H3PO4.113
In reactions on a metal only,
which often target the production of aromatics, the mechanism is slightly
different.26,28,55,102,103,111,116,117
The hydrogenation at the phenyl group is often an unwanted
side reaction as it reduces the yield of aromatics. The mechanism for the hydrodeoxygenation
of the model molecule guaiacol over CoMo and NiMo catalysts has been proposed to proceed
via the intermediates catechol and phenol, leading to the formation of benzene (Figure
5).102,103
In other words, the aromatic C-O bonds are suggested to be directly cleaved on the
metal catalysts. This mechanism has recently also been proposed for that reaction over
Ru.26,28
However, this is not the only pathway under discussion. The direct formation of
phenol from guaiacol via the removal of the methoxy group as shown in Figure 5 has also
Figure 4: Mechanism for the conversion of phenol to cyclohexane over Pd/C in the presence
of H3PO4, according to Ref 113.

Chapter 2. Background
12
been suggested.28
Both reaction routes have also been proposed for guaiacol HDO over Pd,
Pt, Cu, Fe as well as bimetallic PdFe catalysts.28
The main difference between the reactions
on precious metals (Pd, Pt, Ru) on the one hand and the reactions on base metals (Cu, Fe) or
PdFe on the other hand is that only the precious metals are active for the (undesired)
hydrogenation of the aromatic ring.28
Further works suggested that Pt-catalyzed HDO may
also proceed via the intermediate anisole which in return can demethylate (removal of CH3)
or demethoxylate (removal of OCH3) to yield phenol and benzene, respectively (Figure
5).111,116,117
Despite of these experimental studies, the exact HDO mechanism at an atomistic
level and the underlying principles are not as well understood as the reactions of aliphatic
oxygenates. This is partly due to the fact that the number of computational works dealing
explicitly with the HDO of aromatics is still low.
For a long time, the majority of the computational works on the HDO process only
addressed the adsorption of various model substrates on the catalyst surface.28,112,121,124
Calculations addressing the HDO of m-cresol [3-hydroxytoluene, C6H4(OH)(CH3)] have
demonstrated that the adsorbate only interacts with the C6 ring with a Ni(111) surface but not
via its OH group.124
In contrast, m-cresol also binds via its O center to Fe(110) and NiFe(111)
surfaces.124
The metal-O interaction rationalizes why Fe and NiFe show a high activity for
the removal of oxygen yielding toluene while reactions on Ni mainly yield oxygenated
products.124
Different from the “flat” adsorption mode of aromatic oxygenates as found on
Ni, Fe and NiFe,124
such adsorbates only interact via their oxygen center but not their C6 ring
with sulfidic HDO catalysts like MoS2 or CoMoS.112,121
It has been speculated that this
Figure 5: Main reaction pathways discussed for the metal-catalyzed hydrodeoxygenation of
guaiacol yielding aromatic products. Alkylation steps catalyzed by the acidic support have
been omitted for clarity. Mechanisms taken from Refs 26, 28, 102, 103,111, 116, and 117.

Chapter 2. Background
13
interaction mode allows a stronger activation of the C-O bond, thus facilitating the
deoxygenation reaction.112,121
Some efforts to explore the reaction network of guaiacol HDO on Ru137,138
and Pt139
have
recently been reported. Although these studies give an overview on large parts of the reaction
networks, they still leave some fundamental questions unanswered. For instance, neither the
formation of benzene on Ru26
nor the production of phenol on Pt28,29,111,116,117
has so far been
explained by theory.137-139
Beside mechanistic studies on guaiacol HDO, it has also been
attempted to derive BEP relations for aromatic systems.139
The reactions of aromatics indeed
follow the BEP relations, like the reactions of aliphatic alcohols mentioned in the previous
section.139
However, those parameters derived for aliphatic alcohols are not transferable to
aromatics,139
reflecting the different reactivity of the two classes of reactants. The C-O
scission on Fe(110) has been studied for phenol as model;140
that work showed the direct
removal of the OH group to be more favorable than various hydrogen assisted
mechanisms.140
Apart from monocyclic aromatic systems, some computational works
evaluated the reactions of larger model molecules like aromatic ethers.141,142
Studies on the
solvent effect illustrate that the C-O bond in benzyl phenyl ether (C6H5-CH2-O-C6H5) can be
cleaved easily in the presence of acidic protons and a polar solvent.142
At variance, the
reaction in an apolar solvent invokes a radical mechanism that this hardly accessible.142
Furthermore, the thermodynamics of the transformation of di-arylic ethers
(R-C6H4-O-C6H4-R’) on Ni have been explored to clarify why the ether C-O bond can be
broken to form (substituted) phenols, whereas the scission of the C-O bond in phenols is
inaccessible.141
The calculations provide as hint that this may be related to the competition
between the desorption of the phenols and the C-O cleavage reaction.141
However, this
system needs further investigation as the reported mechanism involves reaction energies of
up to 150 kJ mol−1
.141
Instead of focusing on the reactions, some works addressed the nature of the HDO
catalysts, as done for the PdFe bimetallic system.143
The synergistic effects in that catalyst
was related to the partial electron donation from Pd to Fe, resulting in the stabilization of the
reduced Fe surface which would otherwise be easily poisoned by oxygen.143
Before the HDO
of aromatics has been studied, most quantum chemical investigations dealing with the
reactions of aromatics on metals focused on (de)hydrogenation reactions.144-151
Among
others, transformations of model molecules like benzene,144-147,149
phenol148,150,151
or
pyridine149
on Rh, Ni, Pd, Pt, and Cu surfaces have been examined. A recent ab-initio

Chapter 2. Background
14
molecular dynamics study on the hydrogenation of phenol on Pt and Ni revealed that these
reactions are both thermodynamically and kinetically significantly easier accessible in
aqueous phase than in the gas phase.151
Also those studies on (de)hydrogenation may
contribute to the understanding of the HDO process because hydrogen transfer steps at the
aromatic ring are discussed to play a role in HDO.138,140
2.3. Conversion of Ethanol to Hydrocarbons
With (bio-)ethanol becoming more abundant since the chemical industry has started to focus
on the usage of biomass, there are increased efforts to use ethanol as precursor for the
production of higher hydrocarbons, olefins and aromatics.152-158
Recent works attempted to
establish a process catalyzed by pure zeolites152-154
or by metal modified zeolites.153,155-158
Due to the different nature of the catalyst, zeolite catalyzed conversion of ethanol invokes a
fundamentally different chemistry than the metal-catalyzed reactions introduced in the
preceding Sections 2.1 and 2.2.
Although the conversion of ethanol on zeolites has already been mentioned in the
1970’s,160,161
the mechanistic details of this process are not very clear. A very rough reaction
scheme as depicted in Figure 6 has been formulated to illustrate the reaction pathways.159
Based on the analysis of intermediates and products, it has been proposed that the conversion
of ethanol on pure zeolites follows a so called “hydrocarbon pool mechanism”,162
similar to
the well-studied conversion of methanol on zeolites.163-166
According to the hydrocarbon pool
mechanism for the conversion of methanol to olefins, a large variety of hydrocarbons
(olefins, aromatics etc.), referred to as the “hydrocarbon pool”, is built up from methanol.
These hydrocarbons are methylated in acid-catalyzed steps by methanol to form larger
hydrocarbons, which in return can eliminate olefins as products. A variant of the hydrocarbon
pool mechanism based on hexamethylbenzene, which has been proposed for the formation of
propylene from methanol in H-ZSM5, is exemplarily depicted in Figure 7.167
As visible from
Figure 6: Proposed reaction pathway for ethanol conversion in zeolites according to Ref 159.

Chapter 2. Background
15
the mechanism, the conversion of alcohols in zeolites invokes complex interactions between
the actual feedstock (methanol or ethanol), the catalytic active side products (the hydrocarbon
pool) and the zeolite. It is known from methanol conversion that the zeolite does not only act
as an acid.165,166
The structure of the zeolite (pore size, pore shape… etc.) has a strong impact
on the product distribution. Thus the undirected interactions between the reactant and the
walls of the zeolite framework also play an important role.165,166
The walls of the zeolite
framework can introduce steric limitations, which favor the formation of more “compact”
products e.g. short, linear hydrocarbons.165
The product selectivity of ethanol conversion can be tuned by modifying the zeolite
catalysts with metal or metal oxide particles.155,159
Experiments have demonstrated that Au,
Pt, Rh, Pd or Ga can enhance the selectivity for aromatic products to 50–70%.159
At variance,
the incorporation of oxidic clusters as Cr2O3, FeOx and NiO to the catalyst system results in
higher selectivity of up to around 30% for C3 or longer olefins.155,159
Similar yields for higher
olefins have also been reported for reactions over Na, Zr or Sr substituted zeolites.153,157,158
It
is reasonable to assume that the presence of the metal / metal oxides will induce changes to
the mechanism, but mechanistic studies on the reactions in such catalytic systems have not
been reported yet.
A main focus of the current research is to improve yield and selectivity for the formation
of higher olefins,168
while avoiding the competing coke formation process which ultimately
leads to the deactivation of the catalyst.169
Figure 7: A variant of the hydrocarbon pool mechanism proposed for the zeolite catalyzed
conversion of methanol to propylene according to Ref 167. Z-H and Z– represent the Lewis
acid group of the zeolite and the deprotonated zeolite framework, respectively.


17
Chapter 3 Computational Methods and Models
3.1. Quantum Chemical Methods
All results reported in this thesis have been obtained from periodic DFT calculations using
the quantum chemistry program Vienna Ab initio Simulation Package (VASP, Version
5.2.12).170-173
In the following, those parameters that hold for all calculations will be given
first. Afterwards, the specific computational parameters employed to study the processes on
metals and in zeolites, respectively, will be presented.
All calculations use the projector augmented wave (PAW) method174,175
in combination
with a plane wave basis set characterized by a cut-off energy of 400 eV, if not specified
otherwise. The convergence criterion for the evaluation of the electronic structure required
the changes of the total energy between two SCF (self-consistent field) iterations to be less
than 10–6
eV. The optimization of a stationary point structure [i.e. minimum or transition state
(TS)] is considered as converged, if the forces on each relaxed atom are below 2×10⁻⁴
eV/pm.
To identify TS structures, which have only been determined for the systems on metals,
pre-optimizations using various implementations of the nudged elastic band method
(NEB)176-183
and the dimer method,184-187
have been performed. Starting from such an
approximate TS structure, a quasi-Newton algorithm was used for the final optimization.
In some cases, the discussion involves enthalpies H and Gibbs free enthalpies G.
Standard methods were used to calculate the thermodynamic corrections to the electronic
energy to estimate H and G.188,189
The corrections have been calculated from the harmonic
vibrational frequencies, evaluated for the adsorbate. The contribution of the metal or of the
zeolite framework to the thermodynamic corrections has been largely omitted. Details on the
evaluation of the vibrational frequencies are given in the next paragraphs, dealing with the
specific computational protocols for the chemical systems on metal and on zeolite,
respectively.
Reactions on metals. Reactions on metals are studied with GGA type (generalized
gradient approximation) exchange-correlation functionals. The earlier works presented in

Chapter 3. Computational Methods and Models
18
Chapter 4 (propanol on Pt) and Chapter 5 (ethanol of Ru) used the functional PW91190
while
the later works in Chapter 6 (guaiacol on Ru) employed the functional PBE.191,192
The
calculations use first-order Methfessel-Paxton smearing,193
with a smearing width of 0.15 eV
(Chapter 4 and Chapter 5) and 0.1 eV (Chapter 6), respectively, to support faster SCF
convergence. However, all reported energies refer to values, for which the smearing width is
extrapolated to 0. When performing a geometry optimization, a Mockhorst-Pack mesh194
with
5×5×1 k-points is used to sample the Brillouin zone. The energies reported in this thesis are
obtained from a single point calculation on the optimized geometry using a denser mesh of
7×7×1 k-points. Earlier studies indicate that the chosen k-point grid is dense enough to
consider the reaction energies to be converged with respect to the density of the grid.195
The
bulk metal-metal distance is determined by varying the unit cell parameters of the close-
packed unit cells of Pt and Ru while maintaining the cubic and hexagonal symmetry,
respectively. The optimal bulk metal-metal distance corresponds to the distance found in the
unit cell with the lowest single point energy. Different to the unit cell optimization for
zeolites addressed in the next paragraph, the present approach does not lead to artifacts
arising from Pulay-stress. Thus the single point calculations used to determine the metal unit
cell sizes are performed with a cut-off energy of 400 eV. All stationary point structures are
verified by the evaluation of harmonic vibrational frequencies. To reduce computational
costs, only the vibrational modes of the substrate atoms are considered, i.e. the surface metal
atoms are fixed during the numerical evaluation of the normal modes. This approximation is
possible, as the vibrational modes of the metal surface are typical low lying and are thus not
expected to couple strongly with the modes of the organic adsorbate.
Reactions in zeolites. Two functionals have been used to study chemical systems in
zeolites: The PBE-D2 functional49
and the non-local correlation functional of type vdW-
DF2.50,196
The former functional is the PBE functional, as used to study reactions on metal,
corrected by an empirical, additive term to account for dispersive interactions.49
The
electronic energies at the PBE-D2 level EPBE-D2 can be separated into two contributions, the
PBE contribution EPBE, which is the self-consistent GGA-DFT energy, and the empirical
correction referred to as the “D2 term” ED2: EPBE-D2 = EPBE + ED2.
Calculations on zeolites employ Gaussian smearing with a width of 0.1 eV as proposed
for insulators with large unit cells.197
The Brillouin zone is sampled at the Г point only. As
the MFI type zeolites under study have a lower symmetry than the bulk geometry of close-
packed metals, it is difficult to determine the optimal unit cell parameters from a series of

Chapter 3. Computational Methods and Models
19
single point calculations. Instead, the unit cell optimization routine as implemented in VASP
was used. However, this implementation can suffer from artifacts that arise from Pulay-stress,
if the plane wave basis set is too small.198
Therefore, a cut-off energy of 800 eV is chosen for
the optimization of the zeolite unit cells. When evaluating the harmonic vibrational
frequencies for adsorption complexes in all-Si zeolites, only the vibrational modes of the
adsorbates have been considered, while all atoms of the zeolite framework are fixed during
the evaluation of the normal modes. Similar to the situation of adsorption complexes on metal
illustrated above, the vibrational modes of the framework are not expected to couple with the
adsorbate modes, due to the relatively weak zeolite-adsorbate interaction, which is dominated
by dispersive interactions. This circumstance allows neglecting the framework normal modes.
For adsorption complexes in Al-substituted zeolites, the vibrational modes of the OH group
interacting with the adsorbate are also taken into account.
Species in the gas phase. For the evaluation of adsorption energies, the energies for
isolated species in the gas phase are required. These are calculated by placing the molecule
under study in a cubic unit cell with edge lengths of 1.5 nm or longer. The Brillouin zone is
sampled, similar to the zeolite systems, at the Г-point only. Spin-polarization is allowed for
radical species. All other quantum chemical parameters are identical to the settings used to
compute the corresponding adsorption complex on a metal support or in a zeolite cavity.
3.2. Models for Metal-Catalyzed Reactions
The Pt and Ru catalysts are modeled by periodic slabs which are separated by vacuum space
of more than 1.5 nm width. The thickness of the slabs corresponds to 5 close-packed layers.
The metal centers of the two top layers are allowed to relax, together with the atoms of the
substrates, during geometry optimization. The remaining metal centers are fixed at the
optimized bulk geometry with Pt-Pt = 282 pm, and Ru-Ru = 270 pm. Note that calculations
using the PW91 functional and the PBE functional yield the same bulk metal distance for Ru.
Sites on close-packed terraces of the Pt and Ru catalysts are modeled by hexagonal unit cells
of the Pt(111) and Ru(0001) surfaces, respectively. The calculations in Chapter 4 and Chapter
5 dealing with 1-propanol and ethanol as substrates use a 3×3 unit cell (9 surface atoms per
unit cell). The transformation of the larger substrate guaiacol on Ru described in Chapter 6 is
studied with a 5×5 unit cell (25 surface atoms per unit cell).
In addition, the effect of step sites on the metal catalysts has also been considered. In
Chapter 4, step sites on Pt are modeled by a monoclinic 3×1 unit cell of the Pt(221) surface
with 12 surface atoms (Figure 8). This surface contains step sites of locally three-fold

Chapter 3. Computational Methods and Models
20
coordination (“S3” step) and a three atoms wide terrace (Figure 8). The steps on a Ru surface
as studied in Chapter 6 are modeled by Ru slabs derived by cutting the hcp bulk structure of
Ru perpendicular to the crystallographic [101̄5] direction. In contrast to an fcc system like Pt,
different surfaces can be obtained, by cutting at different positions. Two stepped Ru surfaces
have been constructed. Both surfaces contain S3 type steps as well as S4 type steps, i.e. step
sites with locally four-fold coordination (Figure 8). Monoclinic 5×1 unit cells of either
stepped Ru surface feature 30 surface atoms per unit cell and a terrace that is four atoms
wide. The main difference between the two stepped Ru surfaces is the emerging step
bordering the three atoms wide terrace. In one case, the emerging step is of S3 type, in the
other case of S4 type. Based on this, the surfaces will be referred as S3-Ru(101̄5) and
S4-Ru(101̄5), respectively. The former will be used to study reactions at the S3 step and the
Figure 8: Slab models used to study step sites viewed from top (left) and from side (right).
The periodic unit cell is marked in yellow. S3 and S4 type steps are indicated. For clarity,
only the top layer is shown in the top view.

Chapter 3. Computational Methods and Models
21
latter to model processes at the S4 step.
Note that the model illustrated above formally describes the vacuum-metal interface,
although some calculations in this thesis, e.g. those in Chapters 4 and 5, aim at studying
processes in aqueous phase. In other words, solvent effects are neglected in this thesis, as the
used model approximates the solvent phase by the vacuum phase. This should be kept in
mind for the discussion of the Chapters 4 and 5.
3.3. Models for Processes in Zeolites
The unit cell for the periodic models of the MFI type zeolites H-ZSM5 and Silicalite (the all-
Si variant of H-ZSM5) are derived from the crystallographic unit cell of the all-Si system
which contains 96 T-atoms (Si or Al atoms occupying tetrahedral sites) and two intersections
between a strait channel and a sinuidal zig-zag channel (Figure 9).199
The H-ZSM5 model
was constructed by replacing three of the Si centers by Al and adding three H atoms for
charge compensation. One Al center is placed at a T12 site, a second Al is at the T8 site of
the same channel intersection, the third Al is located at the T7 position of the other channel
intersection. The present thesis will only consider the interaction of adsorbates with the
aluminol site at T12, similar to various previous theoretical works.41,43,44
The choice of the
T12 site is related to the circumstance that it is easily accessible and allows reactions to occur
with low steric constraints. The second Al atom was placed at the T8 position in order to have
an O center at the channel intersection, which is coordinated to an Al center but not to the
acidic proton. It was assumed that such an O center will show a slight Lewis base character,
and that it may play a role in sorption processes. The T7 position for the last Al atom is
motivated by the fact that it represents one of the thermodynamically most stable sites for Al
in MFI zeolites.200
Table 1: Optimized unit cell parameters for Silicalite and H-ZSM.a
Silicalite H-ZSM5
a b c α = β = γ a b c α β γ
PBE-D2 2027 1992 1333 90.00 2033 1991 1339 89.90 89.88 90.04
vdW-DF2 2050 2006 1356 90.00 2033 2011 1351 90.39 90.03 89.94
Exp.b 2009 1974 1314 90.00
a Length of unit cell vectors in pm, angles in degree.
b Ref 199, values for MFI type
zeolites in general.

Chapter 3. Computational Methods and Models
22
The unit cell parameters of empty Silicalite and H-ZSM5 have been optimized together
with their atomic positions. When studying the interaction of the zeolite framework with
adsorbates, the unit cell parameters are fixed to the optimized values for the empty zeolites
(Table 1) while all atoms were allowed to relax.
Figure 9: 2×2 super cell of the MFI type zeolites (H-ZSM5 and Silicalite) viewed along the
crystallographic b direction. O centers are shown in red, Si in gray. The positions considered
as Al sites in the H-ZSM5 model are shown as highlighted spheres. The labels of the T-atom
sites as well as the straight and sinuidal zig-zag channels are indicated. The cluster cut-outs
from the zeolite framework are shown below the super cell. For easier orientation, the front
side of the clusters is marked with wide sticks. These cluster extracts will be used in Chapter
7 to illustrate the substrate-zeolite interactions.

Chapter 3. Computational Methods and Models
23
3.4. Definition of Reaction Energies and Barriers
Figure 10 gives an overview on the definitions of the reaction energies and barriers as used in
this thesis. Figure 10a shows the adsorption of an initial state species IS from the gas phase to
a surface site s (of a metal or a zeolite) to form the adsorption complex IS-s. A bond cleavage
reaction via the transition state TS-s yields the adsorbed products P1-s und P2-s. The
electronic energies of the adsorption complexes are denoted as E(x) with x being IS-s, TS-s,
P1-s and P2-s, while E(s) and E(IS) are the energies associated with the empty surface and
the initial state in the gas phase, respectively. The activation energy Ea for the surface
reaction is defined as Ea = E(TS-s) - E(IS-s). For the calculation of the reaction energy Er, it
will be assumed that the surface species P1 and P2 form adsorption complexes at formally
infinite distance, and thus will be calculated as Er = [E(P1-s) + E(P2-s) - E(s)] - E(IS-s). This
definition neglects that the bond cleavage reaction will first yield an adsorption complex P1-
P2-s, in which P1 and P2 are co-adsorbed in direct vicinity. This intermediate is often
neglected, as it is often only a meta-stable, short-lived intermediate that does not affect the
reaction kinetics in a significant way. However, in some cases it is desirable to get an
overview of the complete potential energy surface. For this purpose, the direct reaction
energy Er,d = E(P1-P2-s) - E(IS-s) will be discussed. Following the logic that the direct
reaction energy Er,d refers to the minimum states, which are directly connected to the TS, the
direct activation barrier Ea,d is introduced. Ea,d is calculated as the difference between the
energy of the transition state and the directly preceding IS state. For a bond dissociation
reaction Ea,d is equal to Ea.
For the reverse bond formation reaction P1-s + P2-s → IS-s (Figure 10b), Er and Ea are
referred to the P1-s and P2-s at formally infinite distance, i.e. Er = E(IS-s) - [E(P1-s) +
E(P2-s) - E(s)] and Ea = E(TS-s) - [E(P1-s) + E(P2-s) - E(s)]. At variance, the direct reaction
energy and the direct reaction barrier here are defined as Er,d = E(IS-s) - E(P1-P2-s) and
Ea,d = E(TS-s) - E(P1-P2-s). Note that Ea,d is not equal to Ea for a bond formation step.
A special case, which will be encountered in Chapter 4, is the substitution reaction of
type IS-s + A-s → P-s + B-s, in which a bond formation occurs simultaneously with a bond
cleavage (Figure 10c). Such a reaction proceeds via a surface complex IS-A-s, in which IS
and A are co-adsorbed. The product of the reaction is a surface complex P-B-s with the
product species P and B co-adsorbed. Here the direct reaction energy and the direct barrier
are defined as Er,d = E(P-B-s) - E(IS-A-s) and Ea,d = E(TS-s) - E(IS-A-s). At variance, Er and
Ea are calculated as Er = E(P-s) + E(B-s) - E(IS-s) - E(A-s) and Ea = E(TS-s) +
[E(IS-s) + E(A-s) - E(s)], respectively.

Chapter 3. Computational Methods and Models
24
The adsorption energy Eads of a molecule IS is defined as Eads = E(IS-s) - E(IS) - E(s),
thus a negative values denotes a thermodynamically favorable process. Depending on the
context, the desorption energy Edes = - Eads will alternatively be reported.
When reaction energies and activation barrier are discussed that depart from the above
definition, the definition will be given in the corresponding section.
The corresponding values at the level of enthalpies H and of Gibbs free energies G are
defined in analogous fashion.
Figure 10: Schematic representation of the definitions for Er, Er,d, Ea, Ea,d, Eads, and Edes for
a bond dissociation (a), a bond formation (b), and a substitution reaction (c).

25
Chapter 4 Aqueous Phase Processing of 1-Propanol over Pt
4.1. Indroduction
Starting from this chapter, this thesis will focus on the results obtained from computational
studies. The first catalytic system to be addressed is the Pt-catalyzed aqueous phase
processing of alcohols as modeled by 1-propanol.
Despite of the high material cost, Pt was one of the first metals to be successfully tested
for the aqueous phase processing of alcohols.52
The success of Pt catalysts is partly related to
their high selectivity for the reforming path yielding H2.52
Depending on the nature of the
feed molecule, H2 selectivities of more than 90% can be achieved,52
rendering Pt, aside from
Pd, one of the most selective catalysts for reforming in the aqueous phase.22
In addition, Pt
was shown to be the catalytically most active monometallic catalyst for reforming.22
Yet, there are various experimental studies which also report the formation of alkanes as
side products, especially when the reactions run under acidic conditions.23,52,55,66
Based on
experimental studies, an outline of a reaction network for the aqueous phase processes has
been proposed (cf. Figure 2 in Chapter 2) which comprises both the reforming pathway and
the alkane formation.52
That reaction network has not been evaluated by quantum chemical
calculations. As mentioned in Chapter 2, one of the first computational works dealing with
the AP processing of alcohols on Pt addressed the competition between the C-C and the C-O
scission of ethanol on Pt(111).71,72
Furthermore, there are various theoretical studies which
focus on the hydrogenation and dehydrogenation of hydrocarbons145-147,201-203
as well as of
organic oxygenates204,205
over Pt, reflecting the high catalytic activity of Pt for hydrogen
transfer reactions. In more recent studies, complete reaction pathways on Pt(111) have been
explored computationally, e.g., for glycerol and other polyols.78,82,91,93
However, many of the
mentioned studies feature a certain model character as they do not account, among other
things, for the influence of defect sites on the catalyst or the effect of acidic functionalities.
These circumstances motivated efforts to clarify, on the example of 1-propanol, the
mechanistic details of the Pt-catalyzed aqueous phase processing.17-21
This chapter presents

Chapter 4. Aqueous Phase Processing of 1-Propanol over Pt
26
results from Ref 21, which contributes to the study of the reaction network of 1-propanol by
investigating the effect of stepped defect sites on the energetics of the alkane formation path.
As the present study is based on previous works, a more detailed review on these earlier
experimental16
and theoretical studies17-21
addressing 1-propanol on Pt will be given in the
following subsection.
4.1.1. Previous Studies
Experiments on the aqueous phase processing of 1-propanol over Pt supported on Al2O3 have
been performed at 473 K and 20 bar total pressure.16
The analysis of the gas phase and liquid
products shows the formation of ethane, propionic acid, CO2 and propanal. The formation of
H2 has not been analyzed, but its formation can safely be assumed, as the reaction of glycerol
under the same reaction conditions leads to the formation of H2.16
From the experimentally
detected products, a reaction mechanism has been proposed, that starts with the (oxidative)
dehydrogenation of 1-propanol to form propanal, which in return disproportionates to
propionic acid and 1-propanol.16
The acid can further decarboxylate to CO2 and a C2
fragment, that is fully hydrogenated to form ethane (Figure 11a).
However, there are some issues to be considered. The detection of a formed species and
the analysis of the yield as a function of reaction time cannot always prove beyond doubt that
an observed species is an intermediate of the main reaction pathway. An observed species
may also be a side product that is in equilibrium with an intermediate or the product species.
In the present case, the acid may only be a side product, as CO2 does not necessarily have to
be formed via the decarboxylation of propionic acid. A possible alternative pathway for CO2
formation that is consistent with the experimental observations is the decarbonylation of
propanal yielding CO which is subsequently converted to CO2 in a WGS step as mentioned in
Figure 11: Possible reforming pathways for 1-propanol. a) disproportionation of propanal
followed by decarboxylation, b) decarbonylation of propanal followed by a water gas shift
reaction (WGS).

Chapter 4. Aqueous Phase Processing of 1-Propanol over Pt
27
Section 2.2 (Figure 11b).16
Computational studies on the reforming pathway as shown in Figure 12 have
demonstrated that 1-propanol can dehydrogenate easily on a Pt terrace to form propanal in an
overall thermo-neutral process.17
The highest barrier of 62 kJ mol–1
is associated with the
dehydrogenation at the OH group.17
However, the dehydrogenation will most likely not stop
at the stage of propanal, as the C-H cleavage yielding the key intermediate propionyl is a
strongly exothermic process with a low barrier of only 17 kJ mol–1
.17
After a further
dehydrogenation step at α-position, this species can undergo C-C cleavage to form ethylidene
and CO.19
Both steps of the decarbonylation pathway are associated with barriers of around
90 kJ mol–1
, if the reaction occurs on terrace sites.19
An alternative reaction for propionyl is
the insertion of a surface OH to yield the experimentally detected16
species propionic acid.19
Figure 12: Reaction pathway for 1-propanol reforming over Pt as proposed by Refs 17 and
19. Reaction energies are shown in black, activation barriers in red. Energies referred to the
reaction at step sites are shown in parentheses. The decarboxylation mechanism depends on
the availability of steps. For the decarboxylation, the black arrows denote the mechanism on
a flat Pt surface. Where the presence of steps induces a change in the decarboxylation
mechanism, the corresponding reactions are marked by a blue arrow. In favor of a clearer
representation, reaction energies and barriers are only shown for the reaction on terrace or
for the reaction at step sites, where appropriate. All values in kJ mol–1
.

Chapter 4. Aqueous Phase Processing of 1-Propanol over Pt
28
The OH insertion itself is a kinetically and thermodynamically easily accessible reaction.19
However, this reaction requires the presence of surface OH groups formed from H2O
scission. Based on computational works using various solvent models,206-209
the barrier for
this endothermic process has been estimated to 90 kJ mol–1
.19
However, note that the
energetics of the H2O scission step, is associated with a significant degree of uncertainty:
Depending on the computational model, barriers of up to 130 kJ mol–1
have been reported.207
The actual C-C scission of the acid formed from the OH insertion step, which leads to
decarboxylation also proceeds via an α-dehydrogenated intermediate.19
The highest barrier
along this pathway is 142 kJ mol–1
, which indicates that on Pt terrace sites, the
decarboxylation is less likely than the decarbonylation pathway.19
If the reactions are also allowed to proceed at step sites, the highest barrier for the
decarbonylation pathway decreases slightly to 83 kJ mol–1
, but the mechanism is not
changed.19
At variance, the steps induce small changes to the mechanism of the
decarboxylation pathway: While 1-carboxyethyl is the precursor for the decarboxylation step
on terrace, CO2 is formed from 1,1-propene-diolate at step sites, see Figure 12. Furthermore,
the steps significantly reduce the highest barrier of the decarboxylation pathway to
86 kJ mol–1
only, i.e. even lower than the barrier of 90 kJ mol–1
estimated for the scission of
a water molecule, which becomes rate-limiting.19
The results indicate, under the assumption
that the estimated energetics for the water scission step is reasonable, that the decarboxylation
and the decarbonylation pathways can be considered as equally likely on a (realistic) Pt
catalyst containing step sites. The CO formed in the decarbonylation pathway can be
converted with water to CO2 and H2 in an endothermic water gas shift step that is associated
with a barrier of 104 kJ mol–1
on Pt(111).210
Computational studies on the alkane formation pathway on Pt terrace sites have
considered reactions under neutral and acidic conditions.20,21
It has been shown that the
alkane formation under neutral conditions, referred to as the alcohol hydrogenolysis (AH)
pathway, is limited by the cleavage of the C-O bond of the alcohol.20,21
Various mechanisms
as shown in Figure 13 have been considered for the C-O cleavage step. The most likely
mechanism is the activation of the C-O bond by the exothermic dehydrogenation at C1 (the C
bonded to the OH group) followed by the C-O cleavage of the formed 1-hydroxypropyl
(mechanism AH-I in Figure 13), consistent with earlier computational works on ethanol on
Pt.71
The corresponding C-O scission step is associated with a barrier Ea of 105 kJ mol–1
. This
value is lower than the barriers associated with the direct C-O cleavage of propanol (AH-II)

Chapter 4. Aqueous Phase Processing of 1-Propanol over Pt
29
or any hydrogen-assisted mechanism that couples the C-O scission with the hydrogenation at
C1 or / and at the O (AH-III to AH-V). Note that the mechanisms AH-III to AH-V can be
understood as substitutions reactions, for which the direct barrier Ea,d is not identical to Ea
(Section 3.4). To account for the strongly differing initial state structures required for the
different C-O cleavage mechanisms, Ea,d and Er,d will be used for the discussion. The energy
required to form the corresponding IS complexes from adsorbed H atoms and the most stable
adsorption complex of propanol on a Pt(111) surface is given in Figure 13.
The formation of propane from 1-propanol in the presence of acidic protons follows a
different pattern than the AH pathway.20,21
The C-O bond scission occurs via an acidic
Figure 13: Direct reaction energies (black) and barriers (red) for the C-O cleavage step in
the alcohol hydrogenolysis (AH) pathway for the conversion of 1-propanol to propane on
terraces and at step sites of a Pt surface. The reaction energy required for the transformation
of 1-propanol and H atoms adsorbed at (formally) infinite distance on a Pt(111) surface to
those surface complexes, which serve as the ISs for the C-O cleavage steps is also given.
Data for the reactions on terrace sites are taken from Refs 20 and 21. The barrier and the
energy required for the formation of 1-hydroxyproyl (*) is, differing from the original
works, referred to the most stable surface geometry of 1-propanol on Pt(111). The names of
the organic substrates are given at the first appearance of a structure. All values in kJ mol–1
.

Chapter 4. Aqueous Phase Processing of 1-Propanol over Pt
30
dehydration step yielding propylene, which is rehydrogenated to form propane (Figure 14).
This mechanism is thus referred as the dehydration–hydrogenation (DH) pathway. Using a
simple model for the solvated proton, it has been shown that the highest direct barrier for the
dehydration steps is only 82 kJ mol–1
on Pt(111).20,21
At variance, the rehydrogenation of
propylene yielding 1-propyl or 2-propyl as intermediates is the rate-limiting step of the DH
pathway. The associated direct barriers are 97 kJ mol–1
and 85 kJ mol–1
.20,21
The
corresponding values for Ea are slightly higher, 100 kJ mol–1
and 94 kJ mol–1
. 20,21
4.2. Results and Discussion
4.2.1. Effect of Steps on the Propane Formation Pathway
It is reasonable to study the effect of step sites on the propane formation, in order to achieve
comparability with the data on the reforming pathway,18,19
for which the reactions at Pt step
sites have been modeled by a Pt(221) surface. This section will re-evaluate the rate-limiting
steps of the AH pathway and of the DH pathway at step sites. The results from modeling the
Pt-catalyzed C-O cleavage steps as well as the hydrogenation of propylene on a Pt(221)
surface are presented below.
Figure 14: Reaction energies and barriers for the dehydration-hydrogenation (DH) pathway
for the conversion of propanol to propylene on Pt. The energetics of the highlighted rate-
limiting hydrogenation reaction is illustrated in greater detail. The energies for the formation
of the initial state complexes as well as direct reaction energies and direct barriers are
shown. Data for the reactions on terrace sites are taken from Refs 20 and 21. All values in
kJ mol–1
.

Chapter 4. Aqueous Phase Processing of 1-Propanol over Pt
31
4.2.1.1. C-O Cleavage of the Alcohol-Hydrogenolysis Pathway
All C-O cleavage mechanisms (AH-I to AH-V) which have been considered for the reaction
on the Pt terrace site,20,21
have been re-evaluated with the stepped surface. For C-O cleavage
of 1-propanol at step sites (AH-II to AH-V) it is assumed that the hydroxyl group interacts
with a Pt atom at the step edge or with an H atom adsorbed at the step edge, as schematically
shown in Figure 13. In case of AH-I, the IS for the C-O scission is a 1-hydroxypropyl moiety
adsorbed on a top site at the lower terrace of the step; the OH group of the adsorbate is
pointing to the step edge with a Pt-O distance of 270 pm (Figure 15). All IS geometries at
step sites are chosen such that the C-O cleavage reaction yields an oxygen functionality
(water or hydroxyl) at the step edge and a carbon-moiety (propylidene, propyl or propane) at
the lower terrace of the step site (Figure 13).
An overview of the energetics for the C-O cleavage at Pt step sites is provided in Figure
13. The comparison with the reactions on terrace shows that the influence of the steps differs
from mechanism to mechanism. The IS complexes at step sites for the C-O cleavage
according to the mechanisms AH-I to AH-III are of similar stability with their counterparts at
the terrace site. In contrast, the IS complexes at step sites for the pathways AH-IV and AH-V,
Figure 15: Stationary point structures involved in the C-O cleavage at Pt step sites
according to the mechanisms AH-I and AH-II. The stabilizing rearrangement of top
adsorbed propylidene to a bridge site is also shown. The direct reaction energies Er,d (black)
and the direct barriers Ea,d (red) are given in kJ mol–1
. Where appropriate, interatomic
distances (pm) and bond angles (degree) are shown. Black: C, red: O, white: H, cyan: Pt.

Chapter 4. Aqueous Phase Processing of 1-Propanol over Pt
32
in which the propanol molecule interacts with a H at the step edge, are significantly less
stable, by > 26 kJ mol–1
, than the corresponding structures on a Pt terrace.
The comparison of the direct barriers for the C-O cleavage reactions as displayed in
Figure 13 shows that the presence of steps decreases the direct barriers Ea,d in all cases. While
the direct barrier for the C-O scission according to AH-I is lowered by only 8 kJ mol–1
upon
introducing step sites, the barrier reducing effect of the steps on the mechanisms AH-II to
AH-V is in the range between 52 kJ mol–1
and 77 kJ mol–1
. At variance to AH-I, the organic
adsorbate in the ISs of the latter four mechanisms interact only via the OH group with the
surface or with H centers on the surface. During the reaction, the carbon group forms a new
bond with the Pt surface or with H atoms on the surface. The strong reduction of the direct
barriers for the reactions AH-II to AH-V at steps compared to the corresponding reactions on
terrace sites will be rationalized here on the example of AH-II. The corresponding TS
structure (Figure 15) features a C-Pt distance of 256 pm and an O-C-Pt angle of 125°. At
variance, values of 260 pm and 81° have been reported for the corresponding TS structure on
the Pt terrace.21
In view of the shorter C-Pt distance at the step site, the ethyl moiety interacts
stronger with the Pt surface than in the corresponding TS on a terrace. The interaction with
the Pt surface is expected to have a stabilizing effect on the ethyl moiety, as its C1 center is
under-coordinated if it would not interact with the metal catalyst. The C-O cleavage step
discussed here can be understood as a (nucleophilic) substitution reaction at the reactant
1-propanol. Within this interpretation, the OH group may be understood as the leaving group
that is replaced by a bond to the Pt surface, which acts as a nucleophile. For electronic
reasons, the nucleophile typically attacks a reactant from the “back side”, i.e. opposite to the
direction in which the leaving group is pointing.211
For the reactions under study, the O-C-Pt
angle introduced here can be used as an indicator whether reactions proceed as a substitution
from the back side. A O-C-Pt angle smaller than 90°, as found in the terrace site TS structure,
indicates that the Pt surface attacks from the same side in which the OH group is directed. An
O-C-Pt angle > 90°, as found in the TS at the steps, indicates the preferred “back-side
approach” of the Pt surface, which rationalizes the lower C-O cleavage barrier for the
reaction at the step site.
The situation for the C-O scission in AH-I differs from to the reaction mechanisms AH-II
to AH-V. In AH-I the presence of the steps results in a changed geometry of the C-O
cleavage product. As schematically depicted in Figure 13, the reaction on a terrace yields
propylidene adsorbed on a bridge site. At variance, the reaction at the step yields top

Chapter 4. Aqueous Phase Processing of 1-Propanol over Pt
33
adsorbed propylidene as an intermediate, which is significantly less stable than the conformer
at the bridge site.20
This results in the relatively endothermic Er,d value of 90 kJ mol–1
for the
C-O cleavage in mechanism AH-I at a step site. Note that the Er,d value represents a lower
limit for the direct barrier Ea,d. Due to this, the barrier Ea,d the C-O cleavage step in AH-I is
only reduced by 8 kJ mol–1
from 105 kJ mol–1
for the reaction on the terrace to 97 kJ mol–1
for the reaction at step sites, close to the lower limit of 90 kJ mol–1
.
At the Pt step site, there are only two AH mechanisms that involve direct barriers for the
C-O cleavage that are below 100 kJ mol–1
, AH-I and AH-IV. The other mechanisms can be
ruled out as the main AH pathway, due to their high barriers (Figure 13). Although the
hydrogen assisted C-O cleavage mechanism at a step site according to mechanism AH-IV
features the lowest C-O cleavage barrier of all AH type mechanisms under study, only
86 kJ mol–1
, this reaction is not likely to be the most preferred C-O cleavage mechanism
under neutral conditions. The formation of the IS complex required for this mechanism is
rather endothermic, Er = 42 kJ mol–1
, which is a major obstacle for this mechanism. At
variance, the formation of 1-hydroxypropyl at a Pt step site, the IS complex required for the
mechanism AH-I, is an exothermic process. Thus, similar to the situation at terrace sites,
AH-I is considered the most likely AH type mechanism at Pt step sites. The previously
mentioned endothermicity of the C-O cleavage step in the step site variant of AH-I is most
likely not a problem. Calculations on a Pt(111) surface showed that the unstable top adsorbed
propylidene, as formed in the AH-I mechanism at the steps, can easily rearrange to form the
more stable bridge site complex of propylidene, a process that stabilizes the C-O cleavage
products by approximately 60 kJ mol–1
.21
In summary, C-O cleavage on Pt under neutral conditions will proceed via the
mechanism AH-I. The effect of the steps on the barrier height is relatively small in this case,
less than 10 kJ mol–1
. The preference for a mechanism that involves a dehydrogenation step
may rationalize, why alkane formation is hardly observed in the aqueous phase processing of
oxygenates over Pt, even if high H2 pressure is applied.53,66
The overall process to form an
alkane and water from an alcohol requires H2 and thus should benefit from high H2 pressure.
However, the high H2 pressure will hinder the dehydrogenation step yielding
1-hydroxypropyl, which is essential for the C-O cleavage under neutral conditions.

Chapter 4. Aqueous Phase Processing of 1-Propanol over Pt
34
4.2.1.2. Propylene Hydrogenation in the Acidic Dehydration-Hydrogenation Pathway
This section will discuss the hydrogenation of propylene to yield 1-propyl and 2-propyl at the
Pt(221) step site. As seen from Figure 14, both reactions feature comparable energetics.
Therefore, this section will mainly discuss the process on the example of the reaction yielding
2-propyl, which is the slightly favored reaction pathway on a Pt terrace. The reactions
yielding 1-propyl is only addressed if it shows significant differences to the 2-propyl
pathway.
Previous works gave reason to assume that the high barrier for the reaction on terraces
may be partly related to the weak interaction between the carbon center to be hydrogenated
and the Pt surface.20,21
This is particularly pronounced for the TS of the hydrogenation at the
central propylene C, for which a C-Pt distance of 321 pm has been calculated.20
One may
expect that Pt centers at a convex step edge can interact better with the adsorbate at the TS
than metal centers of a close-packed terrace do. This circumstance should induce a lower
barrier for the hydrogenation reaction at step sites. To study the effect of the corrugated
surface structure, it is assumed that propylene is adsorbed in a di-σ fashion at the step site;
one C atom of the (formal) olefinic double bond is bound to a top site at the step edge, while
the other C center of the double bond interacts with a top site on the terrace, as shown
exemplarily for the reaction to yield 2-propyl (Figure 16). The effect of the concave step edge
described above should only play a role if the hydrogenation occurs at the C center at the step
edge. At variance, the hydrogenation of the terrace site C center is expected to resemble the
reaction on the Pt(111) surface, due to the similarity in the local geometry. Thus the
hydrogenation at the C center at the terrace site is not considered in this work. For the
hydrogenation at a step edge, two ISs are required when exploring the hydrogenation at C1
and at C2 of propylene. In the propylene absorption complex for the reaction yielding 2-
propyl (Figure 16), the methyl group of propylene is at the C center on the terrace site. At
variance, the methyl group is required to be at the C center at the step edge, when considering
the hydrogenation step to yield 1-propyl, as schematically illustrated in Figure 14.
Transferring a propylene molecule from a Pt terrace to form a step site complex as shown in
Figure 16 is by 41 kJ mol–1
endothermic. This is partly related to the substrate structure in the
step site complex. On a terrace, the C-C-Ru angles are 110° and 105°, comparable to the
tetrahedral angle of 109.5° that is typically found for four-fold coordinated carbon centers
(Figure 16). The coordination of propylene to the Pt step site induces significantly larger C-
C-Ru angles of 115° and 124° (Figure 16). This atypical adsorbate geometry likely

Chapter 4. Aqueous Phase Processing of 1-Propanol over Pt
35
destabilizes the complexes at step sites.
The hydrogenation at the step edge as considered is this study requires an IS in which a
hydrogen atom is co-adsorbed with the propylene at a step edge. The optimized IS structures
for the reactions yielding 1-propyl and 2-propyl both feature a H atom that is adsorbed to the
same step edge Pt atom, to which the propylene C atom is also bound (Figure 16). Note that
in the analogue ISs for the reactions on Pt(111), the H atom and the C atoms of propylene are
adsorbed at different Pt atoms (Figure 16). It was not possible to identify stable structures at
terrace sites in which the H and a C center of propylene adsorb at the same Pt center. Figure
16 illustrates the formation of the IS complexes for the hydrogenation step on Pt(111) and at
the Pt(221) step site as a process in which the propylene molecule is initially adsorbed at a
terrace site and at a step site, respectively. An H center adsorbed on a terrace site at formally
infinite distance is then transferred to the direct vicinity of the propylene to form the IS
complexes. While this process is endothermic only by 9 kJ mol–1
at a terrace, the analogous
process at the step site is endothermic by 24 kJ mol–1
. The stronger endothermicity at the
steps is related to the co-adsorption of the H and the C center at the same Pt atom.
The direct barrier Ea,d and the reaction energy Er,d for the formation of 2-propyl starting
from the IS described above are 48 kJ mol–1
and -20 kJ mol–1
(Figure 16). Very similar values
Figure 16: Structures of stationary points involved in the hydrogenation of propylene to
form 2-propyl on Pt terrace and step sites. The direct reaction energies Er,d (black) and the
direct barriers Ea,d (red) are given in kJ mol–1
. Where appropriate, the C-C-Pt angle is given
in degree. Black: C, white: H, cyan: Pt.

Chapter 4. Aqueous Phase Processing of 1-Propanol over Pt
36
are calculated for the hydrogenation to yield 1-propylene, 50 kJ mol–1
and -21 kJ mol–1
,
respectively (Figure 14). The presence of the steps obviously decreases the barriers for the
hydrogenation of propylene, which were computed to be 85 kJ mol–1
(yielding 2-propyl) and
97 kJ mol–1
(1-propyl) on Pt(111).20,21
However, the lower barrier at the steps is partly related
to the fact that the ISs for the reactions at step sites are energetically less stable than the
corresponding IS structures on a terrace (Figure 14). This also rationalizes why the
hydrogenation step on a terrace is endothermic but exothermic at the step edge. Therefore, it
is difficult to determine ultimately whether steps have a noticeable effect on the overall rate
for the DH pathway. This issue has been left open here because it does not affect the
interpretation of the total reaction network as the next section will show. However, it seems
worthwhile to address questions regarding the DH pathway by future kinetic modeling.
4.3. Conclusion
The study of the formation of propane from 1-propanol on Pt shows that the effect of steps
varies strongly from reaction to reaction. At step sites, the various C-O cleavage steps in an
AH type mechanism feature direct barriers that are by up to 72 kJ mol–1
lower than the
corresponding barriers of reactions at terrace sites. However, the effect on the barrier for the
most likely AH pathway, AH-I, which proceeds via 1-hydroxypropyl as intermediate, is
rather weak. While the C-O cleavage of 1-hydroxypropyl on Pt(111) is 105 kJ mol–1
, the
presence of the steps reduces the barrier to only 97 kJ mol–1
. The AH mechanism thus is only
slightly facilitated by the step sites.
In the case of the acid-catalyzed dehydration-hydrogenation, the situation is less clear,
how the presence of steps affects the overall kinetics of that reaction pathway. The direct
barrier of the hydrogenation of propylene, which is rate determining if the reaction occurs on
terraces sites, decreases from 85 kJ mol–1
(reaction yielding 2-propyl) and 97 kJ mol–1
(1-propyl) to 48 kJ mol–1
and 50 kJ mol–1
, respectively, when the reaction can occur at step
sites. However the hydrogenation reaction at step sites also involves energetically high lying
IS complexes which are less stable than the corresponding structures on terrace sites. Thus
the presence of the steps induces counter acting effects. To determine ultimately the impact
of step sites on the overall reaction rate of the DH mechanism, a modeling of the kinetics, e.g.
by micro-kinetic simulations, seems to be necessary.
Although some details of the kinetics of the DH mechanism are not completely
understood, an interpretation of the overall reaction network for the AP processing of
1-propanol is still possible. Under neutral reaction conditions, the two possible reactions for

Chapter 4. Aqueous Phase Processing of 1-Propanol over Pt
37
1-propanol are the dehydrogenation at O with a barrier of 62 kJ mol–1
and the
dehydrogenation at C1 with a barrier of 56 kJ mol–1
(Figure 17). While the former reaction
leads to the formation of surface propoxy that is only associated with the reforming pathway,
the latter reaction yields 1-hydroxypropyl. From this latter intermediate the system may take
the AH pathway, resulting in a C-O cleavage at Pt step sites with a barrier of 97 kJ mol–1
.
However, the more likely reaction of 1-hydroxypropyl is a further dehydrogenation at C1 to
yield propanal, also an intermediate on the reforming pathway (Figure 17). Based on the data
for the reaction of hydroxymethyl,205
the barrier for this dehydrogenation step is estimated to
be 70 kJ mol–1
, i.e. significantly lower than the barrier for the competing C-O cleavage.
Therefore, under neutral conditions, the reaction is directed towards the reforming route.
Under acidic conditions, a third reaction is possible for 1-propanol, the acidic dehydration
which has a barrier of 82 kJ mol–1
(Figure 17). The acidic dehydration is kinetically less
favored than the initial dehydrogenation steps of the reforming pathway. Once the hydrogen
Figure 17: Overview on the reaction network involved in the aqueous phase processing of
1-propanol over Pt. Relevant barrier heights in kJ mol–1
are shown as red numbers. Barriers
for reactions at step sites are shown in parenthesis to distinguish them from barrier
calculated for reactions at terrace sites. The barrier for the dehydrogenation of
1-hydroxypropyl (*) is estimated from the barrier for the analogous reaction of
1-hydroxymethyl. [H+] marks the presence of acidic protons which act as a catalyst.

Chapter 4. Aqueous Phase Processing of 1-Propanol over Pt
38
at the hydroxyl group of 1-propanol is removed, the acidic dehydrogenation mechanism is not
possible any more. Thus, the computational results indicate, even under acidic conditions, the
preferred path for 1-propanol processing over Pt is the reforming path, consistent with
experiments.23,55,56

39
Chapter 5 Decomposition of Ethanol over Ru
5.1. Introduction
After having presented the reactions of alcohols on a late and weakly oxophilic transition
metal, such as Pt, this chapter will turn to the reaction of alcohols over more oxophilic
metals, such as Ru,212
which is found further left in the periodic table of elements. This
chapter follows the presentation of the results in Ref 213.
As elaborated in Section 2.1, a more oxophilic catalyst may be expected to favor the C-O
cleavage, which is associated with the alkane formation pathway, over the C-C cleavage that
is related to the reforming pathway. In fact, experiments on the catalytic processing of
alcohols over Ru have reported high selectivity for the production of alkanes.22,23
Although
the formation of alkanes can be rationalized with the argument above, the mechanism at the
molecular level for the Ru-catalyzed reaction is yet to be explored. It has been suggested that
oxygenates decompose to H2 and CO / CO2 in a first step.23,52
Afterwards, alkanes are formed
from them via a Fischer-Tropsch (FT) like mechanism,23,52
for which Ru is known to be an
active catalyst.214
However, such a mechanism requires the cleavage of the C≡O triple bond,
which is substantially more difficult to break than a C-O single bond as found in alcohols, a
typical feedstock for the aqueous phase processes. Thus, is seems reasonable to ask whether a
mechanism is possible or even likely, in which the C-O bond is directly cleaved before an
alcohol decomposes to CO or CO2. After all, it has been reported for various metals including
Ru that hydrogenated or alkylated CO species have lower C-O scission barriers than carbon
monoxide.73,215-219
Due to the importance of Ru for FT synthesis, various reactions on Ru, which are also
relevant for the aqueous phase processing of organic oxygenates, have been studied
computationally, e.g. the C-O cleavage of CO and species derived from CO
hydrogenation,219,220
(de)hydrogenation of CO and C1 species,219,221-224
and the coupling of C1
species.225
However, a systematical study of the reaction pathways of oxygenates over Ru has
been lacking so far.

Chapter 5. Decomposition of Ethanol over Ru
40
The study in the present chapter explores the reaction pathways of organic oxygenates on
Ru catalysts as modeled by the flat Ru(0001) surface. A focus is placed on the competition
between the C-O and C-C scission. Ethanol, the smallest alcohol that contains a C-O and a C-
C bond is chosen as a model for organic oxygenates. Reaction barriers Ea and reaction
energies Er as defined in Section 3.4 have been evaluated for the scission of C-O, C-C, O-H,
and C-H bonds of ethanol and various intermediates derived by dehydrogenation of the
alcohol.
5.2. Nomenclature
This chapter deals with reactions of adsorption complexes formed by species described by the
general formula CHkCHlOHm. (k = 0–3; l = 0–2; m = 0,1). The adsorption complexes under
study will be denoted by labels 1 to 16 as shown in Table 2. No designators have been
assigned to species, which are only considered as bond cleavage products. Labels of the form
x-y refer to reactions in which a species x is dehydrogenated to yield the product y. C-O and
Table 2: Geometric characteristics and adsorption energies Eads (kJ mol–1
) of various
adsorption complexesa on Ru(0001).
Species
adsorption geometry Eads Species adsorption geometry Eads
CH3CH2OH 1 O-top -39 CH3CH2 hollow -170
CH3CH2O 2 O-hollow -272 CH3CH hcp -397
CH3CHOH 3 O-top, C1-hollow -169 CH2CH2 C1-hollow, C2-top -92
CH2CH2OH 4 O-top, C2-bridge -208 CH3C hcp -579
CH3CHO 5 O-bridge, C1-top -70 CH2CH C1-hcp, C2-top -318
CH3COH 6 O-top, C1-hollow -261 CH2C C1-hcp, C2-top -451
CH2CH2O 7 O-bridge, C2-top -149 CHCH C1,C2 –hollow -266
CH2CHOH 8 O-top, CC-π -86 CHC C1-hcp, C2-fcc -565
CH3CO 9 O,C1-top -233 CH2OH O-top, C-bridge -189
CH2CHO 10 O-top, CC-π -238 CH2O O-bridge, C-top -102
CH2COH 11 O-top, CC-π -297 CHOH O-top, C-bridge -301
CHCHOH 12 O,C1-top, C2-hollow -327 CHO O,C-top -245
CH2CO 13 O,C2-top, C1-hollow -150 COH hcp -455
CHCHO 14 O-top, C2-bridge -461 CO top -172
CHCO 15 O-top, C1,C2-hollow -352 CH3 hollow -210
CCO 16 C2-hcp -547 CH2 hcp -430
CH hcp -671
C hcp -730
OH hollow -342
O hcp -603
a Designators as introduced in Section 5.2 are shown for the species of formula
CHkCHlOHm.

Chapter 5. Decomposition of Ethanol over Ru
41
C-C scissions for a given species x are referred to as x-CO and x-CC, respectively. The TS
structures associated with the reactions will be denoted as TSx-y, TSx-CO, and TSx-CC,
respectively.
When addressing the C atoms in species of type CHkCHlOHm, the C atom bonded to the
oxygen functionality will be referred to, according to IUPAC rules, as C1, the other C center
as C2. For carbonaceous adsorbates CHkCHl without any oxygen, C1 denotes the C center
carrying fewer H atoms.
5.3. Results and Discussion
This section starts with discussing the structures of the adsorption complexes on the
Ru(0001) surface. Afterwards, the reactions for the surface structures and the corresponding
energetics will be presented. Based on these results the decomposition pathways of ethanol
on a Ru terrace will be evaluated.
5.3.1. Adsorption Geometries
Table 2 gives a brief overview of the geometries of the surface complexes under study. The
discussion in this section will focus on structural motifs for various typical functional groups,
rather than discussing the adsorption geometries of all species studied. Figure 18 shows the
optimized structure of the adsorption complexes considered here.
R-O(H), OH, O. The surface complexes of ethanol 1 and ethoxy 2 are prototypical
structures when considering the adsorption modes of species with hydroxyl groups and
alkoxy groups, respectively, as the hydrocarbon moieties of the two adsorbates are fully
saturated and do not interact with the Ru surface. Hydroxyl groups as in alcohols adsorb on
top sites of Ru(0001), similar to the situation on the close-packed surfaces of Pt and Pd.17,71,75
Top adsorption is determined for R-OH groups of almost all species listed in Table 2.
However, if the hydrocarbon moiety R is not saturated, deformation of the top adsorbed
geometry around the OH group may occur to allow better interaction between the moiety R
and the Ru surface. This can be for instance seen from the Ru-O-C1 angles of the adsorption
complexes 1, 3, 8, 9, and 11 (Figure 18). In 1, the adsorption complex of ethanol, this angle is
123°, but in those complexes where the adsorbates are singly (e.g. 3, 8) or doubly
dehydrogenated at C1 (e.g. 9, 11), the corresponding angle is at most 96°. Furthermore, the
Ru-O bonds in 3, 8, 9, and 11 are tilted from the surface normal by 25–30°. At variance, the
Ru-O bond in 1 is nearly parallel to the surface normal, tilted by 3° only. These distortions in
the structures 3, 8, 9, and 11 indicate the presence of structural strain in the four-member
rings formed by O, C1 and two of the coordinating Ru atoms. The C-O bonds in 3 and 9,

Chapter 5. Decomposition of Ethanol over Ru
42
structures with adsorbates dehydrogenated at C1 only, are 2 pm longer than in the surface
complex of ethanol 1 which has been calculated at 146 pm. This elongation of the C-O bond
may also be related to structural strain. The situation in the adsorption complexes 8 and 11,
which feature adsorbates dehydrogenated at C1 and C2, is slightly different. The C-O bonds
in 8 and 11 are 142 pm, i.e. 4 pm shorter than in 1. This finding is similar to the situation for
species in the gas phase: the shorter C-O bond in 8 and 11 is related to the presence of a C=C
double bond geminal to the OH group.71
The adsorption complex 4, which contains an
adsorbate that is dehydrogenated at C2 only, exhibits a Ru-O-C1 angle of 114°, i.e. an angle
that is larger than the ones in 3, 8, 9, and 11. The Ru-O bond is tilted from the surface normal
Figure 18: Optimized structures of various adsorption complexes on Ru(0001); see Table 2.
Black: C, red: O, white: H, cyan: Ru.

Chapter 5. Decomposition of Ethanol over Ru
43
by 3° only, similar to the situation of ethanol. Apparently, five-member ring structures as in 4
are less prone to distortion and steric stress than four-member rings.
In the adsorption complex of ethoxy 2, the adsorbate is bound via the O center to a
hollow site on Ru(0001), similar to the structure of methoxy on the (111) facet of Pd
clusters.73
However, the site preference of ethoxy on Ru(0001) differs from analogous
adsorption complexes of ethoxy or propoxy on Pt(111) and Pd(111) surfaces which are
reported to favor top sites.17,71,75
Not all alkoxy groups prefer hollow sites on Ru(0001); for
example, structure 7, the adsorption complex of CH2CH2O, features an oxa-metalla-cycle
Figure 18 (continued)

Chapter 5. Decomposition of Ethanol over Ru
44
with the O center at a bridge site. R-O species with an unsaturated C1 center will be
discussed separately below as species featuring a carbonyl group. Similar to alkoxy groups,
isolated O centers and surface hydroxyl groups are also adsorbed at hollow sites. Note that
only in case of the isolated O centers, there is a strong preference for hcp sites over fcc sites,
by ΔEads = Eads(fcc) - Eads(hcp) = 34 kJ mol–1
.
R-CHk (R = CH3 or H; k = 0–2) and C. The interaction of carbon moieties with the Ru
surface can be explored on the example of alkyl, alkylidene, alkylidyne groups and an
isolated C atom. In the most stable adsorption complexes of all these species, the adsorbate is
located at a hollow site. This leads to C coordination numbers (CN) of up to 6 for alkyl
groups, different to the situation on the late transition metals Pt, Pd, Rh, Ni, on which the CN
for carbon centers does not exceed 4.203,226,227
While R-CH2 complexes on fcc and hcp sites of
Ru(0001) are of comparable stability [ΔEads = Eads(fcc) - Eads (hcp) < 10 kJ mol–1
], complexes
at hcp sites become thermodynamically more favored with decreasing number of hydrogen
atoms at C1 of the adsorbate, consistent with the results of earlier studies on hydrocarbons on
Ru.221
For the series of the surface C1 species CH3 to C, the ΔEads values as defined above
increases with the number of H atoms in the adsorbate, from -7, to 15, 38, and 63 kJ mol–1
.
Other species of the type C2Hx. At variance with the adsorbate structures addressed in
the preceding paragraph, which only feature one unsaturated C center, the present paragraph
addresses those species C2Hx, which exhibit two unsaturated C centers. In other words, both
C atoms of the structures under study are able to form C-Ru bonds. In the adsorption
complexes of all C2Hx species discussed here, there is at least one C center that adsorbs at a
hollow site, similar to alkyl, alkylidene and alkylidyne discussed above. The most stable
surface complex of ethylene, CH2CH2, has one C center at a hollow site and the other C at a
top site (“C1-hollow, C2-top”). A complex adsorbed in di-σ fashion, which is reported to be
the most stable structure for ethylene on Pd and Pt,203,227-229
has not been identified on
Ru(0001). The “C1-hollow, C2-top” adsorption geometry is favored for all species of the
formula CH2CHk (k = 0–2). For k < 2, the more strongly dehydrogenated C1 center occupies
the hollow site, while the C2 center of the methylene group interacts with the top site,
consistent with earlier studies.225
Similar to the situation of the C1 species in the preceding
paragraph, the C1 center of CH2CHk (k = 0, 1) prefers hcp over fcc sites. At variance, for the
adsorption complexes of the less strongly dehydrogenated species ethylene (k = 2) in “C1-
hollow, C2-top“ geometry, the nature of the hollow site, i.e. fcc type or hcp type, only has an
weak impact on the stability of the structure.

Chapter 5. Decomposition of Ethanol over Ru
45
In the adsorption complexes of acetylene (CHCH) and ethinyl (CHC), one C center
adsorbs at an hcp and the other one at the neighboring fcc site (“C1-hcp, C2-fcc”). In case of
the asymmetric adsorbate ethinyl, the most stable structure features the completely
dehydrogenated C1 center at the hcp and C2 at the fcc site, consistent with the previously
determined preference of strongly dehydrogenated C centers for the hcp site.
R-C=O. Carbonyl groups are usually described as C=O double bonds, as justified by the
calculated C-O bond length of 122 pm for ethanal in the gas phase. In contrast, most
adsorption complexes with a carbonyl group have longer C-O bonds, > 124 pm, indicating a
somewhat activated double bond character. The carbonyl moiety can adsorb over a hollow
site, with the C center at a top site and the O center at a bridge site formed by the other two
neighboring metal atoms, as for instance visible in structure 5, the surface complex of
ethanal. Depending on the interaction of the C2 center with the surface, the carbonyl C1
center may be shifted towards the top or the hollow site, or even lifted from the surface as in
14, the adsorption complex of CHCHO. Furthermore, C1 and O of the carbonyl group can
also both adsorb at top sites, as seen in the adsorption complexes of acetyl (CH3CO, 9) or
formyl (HCO).
5.3.2. Reaction Energies
Having discussed the adsorption geometries, this section turns to the reaction energies Er of
the various reactions as shown in Table 3. In addition, the reaction energies of the C-O and
C-C cleavage reactions are compared in Figure 19.
Dehydrogenation. The calculations show that the dehydrogenation reactions at the
carbon moiety can be divided into two groups. In one group, the carbon moiety of the IS is a
saturated ethyl group (1-3, 1-4, 2-5 and 2-7). These reactions are endothermic or thermo-
neutral. The other group of reactions, consisting of all other C-H dehydrogenation steps,
involves IS structures that feature at least one unsaturated carbon center. These reactions are
all exothermic. The difference between the two groups of reactions is related to the fact that
partially strained four- or five-member metalla rings, respectively, are formed upon
dehydrogenation at the saturated ethyl group (1-3, 1-4, 2-5 and 2-7) as discussed for the
R-OH species in Section 5.3.1. At variance, there are already ring structures in the initial
states of the other C-H cleavage reactions as the unsaturated C centers are already bonded to
the Ru surface, so the dehydrogenation at these structures does not introduce significantly
more structural strain.
In contrast to dehydrogenation reactions at C centers, all O-H bond scissions studied are

Chapter 5. Decomposition of Ethanol over Ru
46
exothermic, by up to -76 kJ mol–1
(Table 3). However, O-H cleavage on Ru does not seem to
be exothermic in general. For instance, dehydrogenation at the OH group of methanol on a
Ru8 cluster has been reported to be endothermic with a reaction enthalpy of 46 kJ mol–1
.69
At
variance, the analogous reaction for ethanol 1-2 presented here is of exothermic character, Er
= -58 kJ mol–1
.
C-O cleavage. All C-O cleavage reactions under study are calculated to be exothermic
(Table 3), which reflects the oxophilic nature of Ru.212
With the exception of the C-O
scission for ethanol and ethoxy (1-CO and 2-CO), all reactions are strongly exothermic, by at
least -67 kJ mol–1
. Thus, C-O bonds, once broken, are unlikely to be re-formed on the
Ru(0001) surface. Although still exothermic, the C-O scission reactions of 1 and 2 are
thermodynamically less favored than the corresponding reactions of other intermediates,
similar to the situation of C-H dehydrogenation reactions. Different from the present findings
for reactions on Ru, C-O cleavage on close-packed surfaces of the less oxophilic metals Pd
and Pt were calculated to be endothermic in most cases.71,73
C-C cleavage. Exothermic C-C cleavage reactions (x-CC with x = 6, 9, 11, 13, 15, 16),
with Er values ranging from -39 kJ mol–1
to -90 kJ mol–1
, all start from an IS with a fully
dehydrogenated C1 center and yield CO or C-OH as product. These are the only COHx
Table 3: Reaction energies Er and barriers Ea (kJ mol–1
) for C-O cleavage, C-C cleavage,
C-H cleavage at C1 and C2 as well as the dehydrogenation reactions at the OH group
under study.
Initial state C-O C-C O-H C1-H C2-H
Er Ea Er Ea Er Ea Er Ea Er Ea
CH3CH2OH 1-CO -32 167 1-CC 24 255 1-2 -58 69 1-3 0 91 1-4 3 77
CH3CH2O 2-CO -42 136 2-CC 41 236
2-5 11 77 2-7 33 94
CH3CHOH 3-CO -71 55 3-CC 5 135 3-5 -48 66 3-6 -26 35 3-8 -23 29
CH2CH2OH 4-CO -67 80 4-CC 7 127 4-7 -28 68 4-8 -25 39
CH3CHO 5-CO -91 80 5-CC -3 103
5-9 -55 12 5-10 -35 32
CH3COH 6-CO -110 33 6-CC -56 92 6-9 -76 43
6-11 -20 53
CH2CH2O 7-CO -107 43 7-CC -6 101
CH2CHOH 8-CO -68 70 8-CC 11 72
CH3CO 9-CO -101 94 9-CC -52 102
9-13 -3 58
CH2COH 11-CO -85 66 11-CC -50 92
CHCHOH 12-CO -77 63 12-CC -3 59
CH2CO 13-CO -94 103 13-CC -64 38
13-15 -25 72
CHCHO 14-CO -99 45 14-CC -14 104
CHCO 15-CO -68 152 15-CC -90 40
CCO
16-CC -39 57

Chapter 5. Decomposition of Ethanol over Ru
47
fragments where solely the C center, but not the O center is interacting with the Ru surface.
Clearly endothermic C-C bond breaking steps are only associated with the surface complexes
1 and 2, which have a saturated adsorbate. These species are generally rather unreactive as
corroborated by the fact that the C-O cleavage and dehydrogenation reactions for these two
species are also less exothermic than analogous reactions of other intermediates. The other
C-C cleavage reactions not addressed so far, are associated with Er values between
-14 kJ mol–1
and 11 kJ mol–1
. Thus these reactions can be considered as approximately
thermo-neutral. They are characterized by moderately dehydrogenated C centers in the IS.
For all intermediates considered (except CHCO 15), C-O cleavage is thermodynamically
favored over the C-C scission, by at least 31 kJ mol–1
(Figure 19). For 15, C-C cleavage was
calculated by 21 kJ mol–1
more exothermic than the competing C-O bond scission. This
exception may be related to the formation of two very stable species upon C-C cleavage, CO
and methine, the most stable CHk species on Ru(0001).221
5.3.3. Reaction Barriers
Dehydrogenation. Earlier studies on the dehydrogenation of alkanes on Ru have shown that
the first dehydrogenation step is associated with a high barrier, while the majority of the
succeeding dehydrogenation steps are kinetically easier accessible.222,223
The current study
reveals that this also holds for the C-H dehydrogenation of alcohols. The dehydrogenation
reactions at the saturated ethyl group in the adsorption complexes of ethanol 1 and ethoxy 2
Figure 19: Reaction energies Er and activation barriers Ea for the C-O (red) and C-C
cleavage reactions (blue) under study. Numerical values are given in Table 3.

Chapter 5. Decomposition of Ethanol over Ru
48
have barriers in the range of 77–94 kJ mol–1
. At variance, breaking the C-H bonds in the
structures 3, 4, and 5, which involve singly and doubly dehydrogenated adsorbates, required
significantly lower activation energies, 12–39 kJ mol–1
. However, for adsorption complexes,
which feature an adsorbate with a completely dehydrogenated C1, e.g. the surface complexes
of hydroxyethylidene 6, acetyl 9, and ketene 13, higher C-H dehydrogenation barriers are
determined, between 53 kJ mol–1
and 72 kJ mol–1
. This finding is comparable to the situation
of ethylene transformation on Pd, Pt, Rh, and Ni, where high dehydrogenation barriers were
calculated for the reactions of CHkC species that have one completely dehydrogenated C
center.226,227,229
The dehydrogenation at the hydroxyl group has been studied for the species 1, 3, 4 and 6,
i.e. adsorbed ethanol and structures that can be derived by dehydrogenating the ethyl group of
ethanol up to two times. The Ea values for these O-H cleavage reactions fall into a rather
narrow range, indicating that the barrier heights depend only weakly on the number of H
atoms in the carbon moiety. The O-H scission barrier for the singly dehydrogenated species 3
and 4 are determined to be 66 kJ mol–1
and 68 kJ mol–1
, respectively, in good agreement with
the corresponding value for reaction 1-2, the dehydrogenation of ethanol to yield ethoxy,
68 kJ mol–1
. Only reaction 6-9, dehydrogenation of 1-hydroxyethylidene yielding acetyl, has
a lower barrier, 43 kJ mol–1
, compared to the other O-H dehydrogenations under study. This
finding may be related to the somewhat stronger exothermicity of this reaction, Er = -74 kJ
mol–1
, compared to the other O-H cleavage reactions studied here, which feature Er values
between -28 kJ mol–1
and -58 kJ mol–1
.
C-O cleavage. Due to the important role of the C-O cleavage (and of the C-C cleavage
discussed below) for the selectivity of biomass processing as mentioned in Section 2.1,12,23-25
the C-O cleavage will be discussed in more detail than it is done for the dehydrogenation
steps above. To establish trends for the C-O cleavage barriers, it seems appropriate to search
for common structural features in the IS and TS structures of reactions with comparable
barriers. Features of interest are (i) whether the atoms in the ISs are saturated, (ii) the lengths
of the C-O bond as an indicator for its bond order, and (iii) distances between the metal
surface and the adsorbate(s) in the TS geometry. The distances described in (iii) can be used
to identify molecular moieties in the TS structures that are well separated from the Ru
surface, and hence do not interact with the surface. By doing so, one may rationalize the
instability of certain TS structures and the high barrier for the corresponding reactions.
It will be demonstrated in the following that C-O cleavage reactions are only accessible,

Chapter 5. Decomposition of Ethanol over Ru
49
if the adsorbate in the IS has at least one unsaturated C center. It shall further be illustrated
that there is a correlation between the formal bond order of the C-O bond and the barrier for
its cleavage. The latter effect is especially pronounced for the reactivity of the highly
dehydrogenated species of the type CHkCO, k = 3–1.
The C-O cleavage steps under study can be separated into three classes based on their
ISs. There are reactions starting from (i) species that feature an adsorbate with a saturated
carbon moiety, i.e. the surface complexes of ethanol 1 or ethoxy 2. These reactions have high
barriers of at least 136 kJ mol–1
, see Figure 20. A second group of C-O cleavage reactions (ii)
features strongly dehydrogenated IS species with an adsorbate of type CHkCO, k = 3–1. In
other words, the C1 and O centers in the ISs are completely dehydrogenated as in the
structures 9, 13, and 15. The C-O scission reactions of these species also have high barriers,
ranging from 94 kJ mol–1
to 152 kJ mol–1
(Figure 20). The last group of C-O scission
reactions (iii) contains the reactions of all other species under study. The corresponding IS
structures all feature at least one unsaturated C center. The barriers associated with the
reactions of group (iii) are at most 80 kJ mol–1
, i.e. lower than the barriers for reactions of
groups (i) and (ii), see Figure 20. The lowest barrier for a C-O cleavage step under study is
33 kJ mol–1
and is calculated for the C-O scission of surface hydroxyethylidene, CH3COH 6,
a reaction from group (iii).
Analyzing the TSs of C-O cleavage, one notes that the kinetically accessible reactions of
group (iii) are characterized by TS structures, which feature C-Ru distances of less than
Figure 20: Ranges of reaction barriers Ea associated with the C-O cleavage [(i)–(iii), red]
and the C-C cleavage reactions [(iv)–(vi), blue] for different types of ISs. The classification
of the reactions is introduced in Section 5.3.3. Note that the C-O cleavage reactions have
been sorted by the decreasing hydrogen content in the ISs. For comparison, the range of the
barriers associated with the competing dehydrogenation reactions in shown in black.

Chapter 5. Decomposition of Ethanol over Ru
50
~240 pm. Therefore, the carbonaceous fragment is close enough to the Ru surface to interact
with it in the TS. In contrast, long C-Ru distances, over 265 pm, are found in the TS
structures associated with the kinetically inaccessible reactions of group (i): TS1-CO and
TS2-CO. As group (i) is characterized by reactants with saturated C centers, it seems likely
that the presence of unsaturated C centers, as found in the IS of the reactions of group (iii), is
a prerequisite for accessible C-O cleavage barriers. However, the barrier heights do not
correlate with the numbers of removed H atoms, as shown by the high barriers of the
reactions of group (ii), i.e. by the C-O cleavage of strongly dehydrogenated species.
In the following, the C-O bond lengths in ISs containing unsaturated C1 centers shall be
compared. The C-O bond distance in the ISs roughly increases with the increasing number of
H atoms at the C1-O moiety hence with the decrease of the formal C-O bond order. This can
be illustrated on the example of the C-O distances in the adsorption complexes of CH3CO 9,
128 pm, CH3CHO 5, 135 pm, and CH3CHOH 3, 148 pm. The barriers for the C-O cleavage
of these three intermediates rise with the formal bond order: Ea(3-CO) = 55 kJ mol–1
,
Ea(5-CO) = 80 kJ mol–1
, and Ea(9-CO) = 94 kJ mol–1
. The correlation between increasing
C-O bond order and increasing activation barriers is also in line with the rather high barriers
for reactions of group (ii), Ea > 94 kJ mol–1
. Recall that the ISs of these latter reactions are
characterized by a fully dehydrogenated C1-O moiety and thus feature a formal C-O bond
order of 2, the highest value for intermediates considered in this study. A similar correlation
between bond orders and cleavage barriers has been reported for the catalytic dissociation of
CO and O2;215-218,230
these reactions are kinetically less favorable than the corresponding
reactions of hydrogenated CO and O2, respectively.
C-C cleavage. Similar to the discussion of C-O scission above, a (qualitative) correlation
between the saturation of the carbon moieties and the C-C cleavage barriers will be discussed
here. Based on the ISs, C-C scission reactions can also be classified in three groups,
distinguishing reactions with ISs (iv) where both C centers are saturated (1-CC, 2-CC; Ea >
200 kJ mol–1
); (v) where only one C center is saturated (x-CC, x = 3–7, 9; Ea from
92 kJ mol–1
to 135 kJ mol–1
); and (vi) where both C centers are unsaturated (x-CC, x = 8,
11–16; Ea between 38 kJ mol–1
and 104 kJ mol–1
). This classification reflects that the C-C
cleavage barriers roughly decrease with the increasing number of dehydrogenated C-centers
in the IS structure, Figure 20. A similar relation between the number of H atoms and the
reaction barrier has been reported for the C-C coupling of CHk species; the highest barriers
were calculated for coupling steps involving methyl.231

Chapter 5. Decomposition of Ethanol over Ru
51
The C-Ru distances of C-C scission TSs have also been analyzed in analogy to the
investigation of the C-O cleavage. In reactions involving a substrate with unsaturated C
centers, groups (v) and (vi), C-Ru distances of 240 pm or shorter are calculated, indicating
that the C centers are bound or almost bound to the Ru surface. In contrast, C1-Ru distances
larger than 250 pm are determined only in the TSs associated with group (iv), TS1-CC and
TS2-CC. Similar to the situation for C-O cleavage reactions, the longest C-Ru distances in
the TS structures are associated with reactions featuring the highest C-C cleavage barriers. In
contrast to the C-O bond lengths, the C-C distances in the IS structures do not change
significantly when the number of H atoms of the adsorbate is varied, as long as the number of
unsaturated C atoms remains constant. For IS structures that have one or two fully saturated
C centers, i.e. ISs for the reactions of groups (iv) or (v), C-C distances of 151±1 pm are
calculated. In intermediates dehydrogenated at both C centers, i.e. ISs of group (vi) reactions,
one finds C-C = 142±1 pm with the exception of surface adsorbed CCO 16, where C-C =
133 pm. Therefore, different from the situation of C-O cleavages, low C-C bond breaking
barriers are associated with IS structures with shorter C-C bonds.
It has been shown above that the C-C cleavage barriers decrease with the degree of
saturation (going along with shorter C-C bonds in ISs). A similar trend has also been reported
for the C-C scission of symmetric species described by the formula CHkCHk,
k = 0–2, on Pd(111).227
Summing up for the C-C scission, C-C barrier heights correlate best
with the number of unsaturated C centers, whereas, different from C-O cleavage reactions,
the barrier heights of C-C scission do not even roughly correlate with the C-C bond distance
in the ISs.
For most intermediates, the C-C cleavage barrier is comparable or higher than the
competing C-O scission barrier (Figure 19). Only for the highly dehydrogenated species 13
and 15 is C-C cleavage clearly kinetically favored over C-O bond breaking. The preference
of the C-C scission over the C-O cleavage in 13 and 15 is related to two trends discussed
above: (i) C-O cleavage barriers increase with dehydrogenation at the C1-O moiety, and (ii)
C-C scission barriers decrease with increasing number of unsaturated C centers in the IS.
5.3.4. Reaction Pathways
With the energetics of the individual reactions steps discussed in the preceding sections, the
most likely reaction pathways can be derived by following the reactions with the lowest
barrier for each intermediate. This most likely path leads to the formation of ketene, which is
a precursor for the C-C scission to yield CO and methylene. In addition, the lowest path that

Chapter 5. Decomposition of Ethanol over Ru
52
leads to C-O cleavage will be addressed. Both pathways are illustrated in Figure 21.
Most likely pathway. The reaction pathway starts with the adsorption complex of
ethanol 1, for which only dehydrogenation steps are likely to occur. The competing C-C and
C-O cleavage reactions are associated with barriers that are by at least 76 kJ mol–1
higher
than the highest dehydrogenation barrier, 91 kJ mol–1
for reaction 1-3. The
thermodynamically and kinetically most favored reaction of 1 is the dehydrogenation 1-2 at
O to yield ethoxy, Er = -58 kJ mol–1
and Ea = 69 kJ mol–1
. The most likely reactions for
adsorbed ethoxy 2 is also a dehydrogenation step, the reaction 2-5 at C1 with Ea =
77 kJ mol–1
that yields ethanal in a weakly endothermic process.
The C-O and C-C cleavage barriers for adsorbed ethanal 5 are 80 kJ mol–1
and
103 kJ mol–1
, respectively. Thus, for the first time along this reaction route, either step may
be considered kinetically accessible. C-O cleavage 5-CO yielding ethylidene and O is a
Figure 21: Energy profile for the most likely pathways leading to C-C cleavage and to C-O
cleavage, respectively. The bars represent minimum structures, arcs stand for TSs. The
numbers at the arcs denote the reaction barriers Ea (red) and reaction energies Er (black), in
kJ mol–1
. All energies are referenced to ethanol in the gas phase and a clean Ru(0001)
surface. TS structures of the involved reactions are also shown. Black: C, red: O, white: H,
cyan: Ru.

Chapter 5. Decomposition of Ethanol over Ru
53
strongly exothermic process, Er = -91 kJ mol–1
, thermodynamically favored over all possible
dehydrogenation reactions of 5, for which Er have been determined to be -55 kJ mol–1
or less
exothermic. However, neither the C-O scission nor the C-C cleavage of 5 is likely because
the dehydrogenation reactions of 5 exhibit significantly lower barriers, 12 kJ mol–1
(5-9) and
32 kJ mol–1
(5-10) for the C-H scission at C1 and C2, respectively. The reaction route till here
is analogous to the reaction path reported for 1-propanol reforming on Pt.17
After three dehydrogenation steps on Ru, first at O, then twice at C1, the reaction
pathway arrives at the intermediate acetyl 9, which features H atoms only at C2. Yet, also for
this structure, the kinetically most preferred reaction is the further dehydrogenation 9-13 with
a barrier of 58 kJ mol–1
. Alternative reactions are associated with activation barriers that are
at least 20 kJ mol–1
higher.
Along the reaction path discussed here, acetyl 9 is the first intermediate of type CHkCO
and thus the first IS for a reaction of group (ii), as defined above when discussing C-O
scission reactions in Section 5.3.3. As mentioned there, C-O cleavage barriers for this group
of reactions are high due to the high order of the C-O bond. Thus, with Ea(9-CO) =
94 kJ mol–1
, this is the first time that the of C-O scission barrier is higher than the
corresponding C-O cleavage barrier for a preceding intermediate along the reaction pathway.
Prior to 9, the C-O scission barriers have been falling steadily, from 167 kJ mol–1
to
80 kJ mol–1
(Table 3).
The barrier for the dehydrogenation of the next intermediate, ketene 13, to yield ketenyl
15, is relatively high, 72 kJ mol–1
, and is comparable to the barriers for the dehydrogenation
at the ethyl group in the structures 1 or 2. The activation energy required for the C-O scission
follows the increasing trend just mentioned and rises to 103 kJ mol–1
. The most facile
transformation of 13 is the cleavage of the C-C bond, with Ea =38 kJ mol–1
, yielding
methylene and CO. This barrier is by at least 56 kJ mol–1
lower than the C-C scission barriers
for any preceding intermediate along this pathway. This is in line with ketene being the first
intermediate where both carbon centers are dehydrogenated, a prerequisite for easy C-C bond
breaking, as discussed in Section 5.3.3.
Similar to C-C bond breaking in ethylene on Pd227
and the decomposition of glycerol or
glycol on Pt,78,82,91,93
the cleavage of the ethanol C-C bond on Ru(0001) is only accessible if
the reactant is first dehydrogenated several times. Although C-O bond scission over Ru(0001)
is favored over C-C cleavage for the majority of intermediates derived from ethanol
dehydrogenation, the most likely reaction pathway for ethanol on Ru terrace sites leads to the

Chapter 5. Decomposition of Ethanol over Ru
54
scission of the C-C bond and the formation of CO. This is a consequence of the
dehydrogenation barriers being lower than the barriers of C-O cleavage which ultimately
leads to the formation of highly dehydrogenated species such as ketene 13, which favor C-C
cleavage, Figure 20. The highest barrier along the most likely pathway discussed thus far is
determined for the dehydrogenation at the ethyl group of ethoxy, 2-5. That reaction features a
barrier of 77 kJ mol–1
and yields ethanal as product.
As mentioned in Chapter 4, the decomposition of alcohols may proceed via the
intermediate formation of carboxylic acids. The formation of carboxylic acids via OH
insertion into acetyl or its derivatives, have been discussed for the reactions on various
metals,19,76,88,89,94-96
thus the corresponding reaction on Ru has also been considered here. In
line with the oxophilic character of Ru, the transfer of hydroxyl from the metal surface to the
acetyl moiety to yield acetic acid is a relatively endothermic process, Er = 70 kJ mol–1
, with a
moderate barrier, 79 kJ mol–1
. The reverse exothermic reaction has a barrier of only
9 kJ mol–1
. Thus, should acetic acid be formed, it is expected to decompose immediately to
acetyl and OH. Therefore, the formation of acetic acid (and subsequent decarboxylation) can
be ruled out as a relevant pathway for the decomposition of ethanol on Ru.
Pathway to C-O cleavage. As mentioned previously, the majority of intermediates favor
the C-O cleavage over the C-C cleavage. Thus, it is of interest to identify in a similar fashion
the most likely reaction pathway leading to C-O scission, and to evaluate, whether it may co-
exist, as a side reaction, with the C-C cleavage pathway. The C-O cleavage pathway requires
the formation of a key intermediate, for which the C-O cleavage is the most preferred
reaction. A potential candidate for the key intermediate is structure 6, surface
hydroxyethylidene, CH3COH, which features a C-O cleavage barrier of only 33 kJ mol–1
, the
lowest C-O cleavage barrier for all intermediates under study. The C-O cleavage yielding
ethylidyne (CH3C) and OH is the kinetically most favored reaction for 6. However, the
dehydrogenation of 6 at the hydroxyl group and at C2 are only slightly disfavored, with Ea of
43 kJ mol–1
and 53 kJ mol–1
, respectively.
To further evaluate whether a C-O cleavage pathway via the intermediate 6 is possible, it
has to be clarified whether the formation of 6 from adsorbed ethanol 1 is kinetically and
thermodynamically accessible. As both the oxygen center and C2 of 6 are saturated,
dehydrogenation of 1 may only occur at C1 (1-3) in order to yield 6. Such a reaction has been
reported to be the preferred reaction on close-packed Pd.75
On Ru(0001), the barrier for this
reaction is 91 kJ mol–1
, i.e. by 22 kJ mol–1
and 14 kJ mol–1
higher than the barriers for the

Chapter 5. Decomposition of Ethanol over Ru
55
competing dehydrogenation reactions at O (1-2) and at C2 (1-4) of ethanol, respectively. The
product of the dehydrogenation 1-3 at C1, 1-hydroxyethyl 3, has to be dehydrogenated
further at C1 to yield 1-hydroxyethylidene 6. The barrier of this step, 35 kJ mol–1
, is slightly
higher than the barrier for the competing dehydrogenation at C2 of structure 3, 29 kJ mol–1
.
Other transformations of 3 are associated with higher barriers, 55 kJ mol–1
or more. Finally,
the most favorable reaction of 6 is the C-O cleavage. Among all possible reactions for 6, this
transformation is the most exothermic reaction, Er = -110 kJ mol–1
, and has the lowest barrier,
Ea = 33 kJ mol–1
.
The highest barrier along this C-O cleavage pathway, as illustrated in Figure 21, is the
initial dehydrogenation 1-3 of ethanol at C2 with Ea = 91 kJ mol–1
. This value is only
14 kJ mol–1
higher than the barrier of reaction 2-5, the highest barrier along the most likely
pathway leading to C-C cleavage. However, the competition among the reactions of ethanol,
in particular between the thermo-neutral reaction 1-3 and the kinetically preferred exothermic
reaction 1-2 (dehydrogenation at O), Ea = 79 kJ mol–1
and Er = -58 kJ mol–1
, directs the most
likely pathway toward the C-C cleavage.
Possible alternative pathways leading to C-O cleavage may proceed via intermediates of
the most likely pathway that can be hydrogenated to yield the adsorption complex of
hydroxyethylidene 6 or of 1-hydroxyethyl 3, which can be dehydrogenated to form 6. 6 and 3
may be formed via the hydrogenation at the O center of adsorbed acetyl 9 and ethanal 5.
However, these reactions, reversed 6-9 and reversed 3-5, are rather endothermic, Er >
48 kJ mol–1
, and also kinetically challenged with Ea > 100 kJ mol–1
. Therefore two-fold
dehydrogenation of ethanol at C1 as shown in Figure 21 seems to be the only reasonable
pathway that leads to the formation of intermediate 6 and the successive C-O cleavage,
ultimately yielding the adsorbates ethylidyne and hydroxyl.
5.4. Conclusions
The study described in this chapter shows that the most likely pathway for ethanol
decomposition on Ru(0001) starts with four successive dehydrogenation steps: one time at
the OH group, twice at the C1 center, and one time at C2, to yield the adsorption complex of
ketene CH2CO. This intermediate ultimately undergoes C-C bond scission to yield CO and
methylene. Thus, C-O cleavage from a species other than CO, as discussed in Section 5.1 as a
possible pathway for the alkane formation, seems unlikely over the close-packed Ru(0001)
surface. It is more likely that the alkanes are formed in a FT-type mechanism from CO,
methylene and surface hydrogen, all products of the most favored decomposition pathway
Chapter 5. Decomposition of Ethanol over Ru
56
discussed in Section 5.3.4.
The identified reaction pathway leading to C-C cleavage is supported by the
experimental observation that ethanol processing with H2 over Ru mainly yields CO and
CH4,68
both products that can only be formed if a C-C cleavage step occurs. Aqueous phase
processing of glycerol with excess H2 mainly produces glycol, a C-C cleavage product, and
propylene glycol, a species obtained from C-O cleavage, in the ratio of approximately 2:1,
and some methane.61,62
This experiment indicates that C-C cleavage is preferred over the C-O
cleavage when oxygenates are brought to reaction over Ru. On the other hand, these
experimental results also show that C-O cleavage is a side reaction which competes with C-C
cleavage. The product spectrum observed in the experiment61,62
is thus in line with the results
of the present study.
The results of the current chapter also demonstrate that C-O scission is favored over C-C
cleavage for a large number of intermediates. Thus Ru does have the potential to cleave the
C-O bond of ethanol if the formation of highly dehydrogenated species as ketene can be
avoided. In order to avoid the formation of such highly dehydrogenated species one would
need to the control the selectivity of the dehydrogenation steps to enhance the formation of
moderately dehydrogenated intermediates which exhibit C-O scission as the most likely
reaction, e.g. intermediate 6, the adsorption complex of hydroxyethylidene. A possibility to
influence the distribution of the formed intermediates is to vary the size of the catalyst
particles because, in this way, the availability of the various types of surface sites on a
catalyst will be changed. It is for instance known that the ethanol decomposition pathway on
a close-packed Rh surface77,80
differs from the reaction at Rh step sites.81
While the close-
packed surface models, as also used in the present study, are suitable for studying the
reactions on wide, flat facets of large catalyst particles; reactions on small particles, which
feature more defect sites, seem to be described better by stepped surface models. It may also
be interesting to explore how the ethanol decomposition pathway, derived here for the
Ru(0001) model surface, is affected by the presence of stepped defect sites and whether the
presence of steps can enhance the formation of moderately dehydrogenated intermediates.

57
Chapter 6 Hydrodeoxygenation of Guaiacol over Ru
6.1. Introduction
The preceding chapters dealt with the processing of aliphatic oxygenates. The present chapter
focuses on reactions of aromatic oxygenates which can be derived from lignin by pyrolysis.
As mentioned in Section 2.2, such pyrolysis products often contain too many oxygen
functionalities to be suitable for the direct usage as fuel.110,128
Therefore, the pyrolysis
products have to be upgraded in a hydrodeoxygenation (HDO) step, in which the O groups
are partially removed. This chapter addresses the Ru-catalyzed HDO of aromatic oxygenates
and follows in part the presentation of the results in Ref 232.
Experimental works on this topic have used, among others, guaiacol (2-methoxyphenol),
a typical product of lignin pyrolysis, to study the reactions of aromatic oxygenates.26-29
These
studies showed that, in the presence of hydrogen, guaiacol can be transformed over carbon-
supported Ru nanoclusters to phenol27-29
or benzene26
. The reactions are typically carried out
at temperatures between 523 K and 673 K26-29
and at varying pressures.26-29
While the
processes at 1 bar mainly yields phenol,27-29
benzene has been reported as the main product
for the reaction under 40 bar pressure.26
The difference in the total pressure is mainly a result
of the difference in H2 pressure.26-29
Based on experimental observations, it has been suggested that the HDO of guaiacol
proceeds via the intermediates catechol and phenol,26,28
similar to the mechanism originally
proposed for the reaction on CoMo and NiMo alloys.102,103
Yet, the detailed mechanism of
the HDO process, especially the atomistic processes at the catalyst surface, are not well
understood. This is partly related to the fact that theoretical works on the HDO of aromatic
species are still rare. Only a small number of computational works have addressed the
elementary reactions of HDO, e.g. the very recently published studies of the process on flat
surfaces of Ru,137,138
, Pt139
, Pd140
and Fe.140
For some time, the majority of theoretical works
addressing HDO only examined the adsorption of reactants on the catalyst.28,112,121,129
A
related reaction which has been investigated computationally is the dissociation of arylic

Chapter 6. Hydrodeoxygenation of Guaiacol over Ru
58
ethers via C-O bond cleavage over Ni based catalysts or acidic catalysts.141,142
In this thesis, the HDO of guaiacol over a Ru surface is first modeled using a close-
packed Ru(0001) surface, similar to the study presented in Chapter 5. This should deliver an
overview of the potential energy surface for guaiacol HDO and allow the identification of the
rate-limiting reactions. In a second step, it will be examined how the presence of step sites on
the Ru catalyst influences the overall kinetics of the HDO process. It is expected that the
presence of such structural defect sites will facilitate the reaction as shown for various Ru-
catalyzed processes.220,231,233
Using the computationally determined energetics, an
interpretation of the experiments26-29
will be provided with special focus on the pressure
dependent selectivity for the formation of phenol and benzene.
Figure 22: Structure formulas of all adsorbates under study. The structures are first sorted
by the number of C atoms, then by the number of O atoms, and finally by the number of H
atoms. An asterisk indicates the bond of a (poly-) radical site to the metal surface.

Chapter 6. Hydrodeoxygenation of Guaiacol over Ru
59
6.2. Nomenclature
The adsorption complexes of all aromatic substrate species under study will be denoted by
labels x, x = 1–22 (Figure 22). Note that the labels used in this chapter are independent of
those introduced in Chapter 5. Labels of the form xgp denote the species x in the gas phase.
For ease of reading, no identifiers have been introduced for non-aromatic fragments like
Figure 23: Reaction network of guaiacol HDO. Bold black arrows denote the main reaction
pathway discussed in Section 6.3.1.5. The kinetically accessible alternative pathways are
marked by thin black arrows. Numerical values at the arrows denote Gibbs free energies of
reaction (black) and of activation (red) at 673 K and 1 bar for the reactions on Ru(0001).
Species that are not on a kinetically accessible pathway are shown in gray.

Chapter 6. Hydrodeoxygenation of Guaiacol over Ru
60
OCHk or CHk. Reactions from an IS x to a product y (and a non-aromatic fragment) will be
denoted as x-y, the corresponding TS as x_y.
Figure 23 provides an overview of all species and the reaction network under study.
Table 4 displays the calculated Gibbs free energies of reaction Gr and of activation Ga for all
surface reactions studied. The reactions are shown in the direction of the bond cleavage,
although some reactions may occur in reverse direction along the reaction pathways to be
discussed later on.
For the discussion of the reactions at the step site, some extension to the present
nomenclature rules is required. These will be introduced when dealing with those reactions in
Section 6.3.2.
6.3. Results and Discussion
This section will start with the results obtained by modeling the Ru catalyst with the close-
packed Ru(0001) surface. First, some structural aspects of the adsorption complexes under
study will be discussed. Subsequently, the energetic properties of pertinent elementary
Table 4: Calculated Gibbs free energies of reaction Gr and Gibbs free energies of
activation Ga for the reactions under study on Ru(0001) at 673 K. The reactions are
presented in the direction of the bond cleavage.a All values in kJ mol
–1.
IS O-H Calkyl-H Calkyl-O Caryl-O(H) Caryl-OR
P Gr Ga P Gr Ga P Gr Ga P Gr Ga P Gr Ga
1 2+H -66 45 3+H -13 56 14+CH3 -110 167b 9+OH -19 115 18+OCH3 -38 100
2 4+H -5 65 15+CH3 -74 9+O -24 174 19+OCH3 -14 135
3 4+H -58 39 5+H -43 13 14+CH2 -105 48 10+OH -11 121 18+OCH2 -14 138
4 6+H -46 9 15+CH2 -76 56 10+O -24 198 19+OCH2 3 155
5 6+H -61 28 7+H -34 48 14+CH -134 31 11+OH -7 125 18+OCH -29 87
6 8+H -36 50 15+CH -103 47 11+O -17 177 19+OCH -9 95
8 15+C -52 77 12+O -21 197 19+CO -94 92
13 14+H -79 27
14 15+H -30 63 19+OH 12 130
18+O -18 181
15 19+O -30 106
Caryl-H 184
16 17+H -69 29 P Gr Ga 21+OH -5 124
17 19+H 53 103 21+O -7 185
19 22+O -67 138
20 21+H 34 82
a For each reaction, the initial state (IS) and the cleavage product (P) are listed; in some
cases various products have been examined. b
Estimated; see Section 6.3.1.2.

Chapter 6. Hydrodeoxygenation of Guaiacol over Ru
61
reactions on the Ru terrace will be addressed to work out general trends for Ga and Gr. Based
on these results, the most likely reaction pathways as well as their rate-limiting steps are
determined. In a second part, the kinetic and thermodynamic properties of the rate-limiting
steps are re-evaluated for Ru catalysts with defects, using the stepped S3-Ru(101̄5) and
S4-Ru(101̄5) surfaces as models. The discussion in the present section will focus on the
Gibbs free energies evaluated for 673 K and 1 bar, i.e. for the reaction conditions reported in
Ref 27, if not stated otherwise. The sub-sections 6.3.1.3 and 6.3.1.4 will illustrate that
variation of temperature and pressure within the range of values reported for the experiment
(523 K to 673 K; 1 bar to 40 bar)26-29
does not change the overall picture of the
thermodynamic and kinetic properties of the HDO process. For comparison, the temperature
and pressure independent reaction energies Er and activation energies Ea for the surface
reactions are provided in Table 5. Note that this study does not consider C-C cleavage steps,
in view of the stability of aromatic ring systems.
Table 5: Calculated reaction energies Er and activation energies Ea of the surface reactions
understudy on Ru(0001). The reactions are presented in the direction of the bond
cleavage.a All values in kJ mol
–1.
IS O-H Calkyl-H Calkyl-O Caryl-O(H) Caryl-OR
P Er Ea P Er Ea P Er Ea P Er Ea P Er Ea
1 2+H -62 51 3+H -11 62 14+CH3 -104 171b 9+OH -14 115 18+OCH3 -33 102
2 4+H -5 69 15+CH3 -64 9+O -22 180 19+OCH3 -7 143
3 4+H -55 49 5+H -34 21 14+CH2 -91 58 10+OH -7 120 18+OCH2 -5 145
4 6+H -34 20 15+CH2 -58 67 10+O -21 207 19+OCH2 15 168
5 6+H -55 37 7+H -22 61 14+CH -127 35 11+OH 1 128 18+OCH -13 95
6 8+H -27 63 15+CH -93 58 11+O -13 177 19+OCH 7 107
8 15+C -45 82 12+O -19 205 19+CO -72 101
13 14+H -72 47
14 15+H -21 78 19+OH 20 135
18+O -14 184
15 19+O -28 106
Caryl-H 185
16 17+H -68 37 P Er Ea 21+OH -2 124
17 19+H 66 118 21+O -3 189
19 22+O -58 149
20 21+H 40 92
a For each reaction, the initial state (IS) and the cleavage product (P) are listed.
b Estimated; see discussion in Section 6.3.1.2.

Chapter 6. Hydrodeoxygenation of Guaiacol over Ru
62
6.3.1. Adsorption and Reactions on Close-Packed Ru(0001)
6.3.1.1. Adsorption Geometries
This section addresses the most stable adsorption complexes formed by selected
intermediates of guaiacol HDO on Ru(0001) (Figure 24). Preferred adsorption geometries of
the various functional groups determined for the adsorbate structures will be identified here.
The prototypic species of an aromatic C6 ring is benzene that forms the adsorption
complex 20, a system, which is also well characterized by experiment.234-236
The GGA
calculations of the present work indicate that benzene prefers to adsorb at hcp sites, i.e., with
the center of the C6 ring over an hcp-hollow site. Every second C center of benzene binds to a
top site, C-Ru ~218 pm, while the other three centers are located over fcc-hollow sites with
notably longer C-Ru distances, 257–278 pm. This leads to a corrugated structure of the
adsorbed C6 ring. For easier orientation and discussion of the structure, an average plane for
Figure 24: Top view on the optimized structures of all considered minimum state adsorption
complexes on Ru(0001). Black: C, red: O, white: H, cyan: Ru. For the sake of a clearer
view, the Ru-Ru bonds are displayed as sticks.

Chapter 6. Hydrodeoxygenation of Guaiacol over Ru
63
the carbon ring shall be introduced here. This average plane is defined by a least-squares fit
to the locations of the six carbon centers of the adsorbed benzene ring. The average plane is
oriented parallel to the Ru(0001) surface. The C atoms on top and hollow sites are located
3 pm below and above the average plane, respectively. Different from the structure of
benzene in the gas phase, the six H atoms in the benzene adsorption complex 20 are not in the
average plane defined by the C atoms. Rather, the C-H bonds are pointing away from the
metal surface. The C-H bonds associated with the hollow site C atoms form angles of 14–15°
with the average plane of the C atoms. Larger angles, 22–23°, are found for those C-H bonds
at the top adsorbed C centers. The distortion of the planar geometry of benzene upon
adsorption on the Ru surface can be rationalized with the rehybridization of the C centers.
The structure of the adsorption complex and the calculated adsorption energy Eads of -136 kJ
mol‒1
are consistent with earlier results from GGA-DFT calculations236
and LEED
experiments.234-236
Note that the hollow-adsorbed structure is not typical for benzene
adsorbed on all close-packed metal surfaces. Besides Ru, preferred adsorption at hollow sites
Figure 24 (continued)

Chapter 6. Hydrodeoxygenation of Guaiacol over Ru
64
has only been calculated for Group 11 metals where the adsorption energies Eads at GGA
level are calculated to be -5 kJ mol‒1
or less exothermic.237,238
Adsorption energies
comparable to the Eads value computed here for benzene on Ru(0001) have been reported for
the close-packed surfaces of Pt,145,239
Pd,147,240,241
and Rh;240
these energies range from
117 kJ mol‒1
to 145 kJ mol‒1
. Note that the value of -136 kJ mol‒1
for Eads on Ru is shown
here for easier comparison with earlier studies, which only reported adsorption energies. In
anticipation of the up-coming Section 6.3.1.4 it is mentioned already here that the inclusion
of entropy is necessary for a reasonable description of the adsorption and desorption
processes under typical HDO process conditions.
The presence of OH and OCH3 substituents at the C6 ring does not affected the
preference of the aromatic ring for hollow sites on the Ru(0001) surface. Adsorbed
guaiacol 1, catechol 13 and phenol 16 (Figure 24) also favor the adsorption over hcp or fcc
sites. However, the presence of OH and / or OCH3 has an influence on the adsorption
energies Eads. Adsorption becomes less exothermic with increasing number of substituents
featuring oxygen centers (benzene 20: -136 kJ mol‒1
, phenol 16: -130 kJ mol‒1
, catechol 13:
-116 kJ mol‒1
, guaiacol 1: -107 kJ mol‒1
), in line with results reported for group 10
metals.241-244
This trend is still present if Gibbs free energies of adsorption Gads are considered
instead of Eads as will be shown in Section 6.3.1.4. The O centers of the OH and OCH3
moieties in the adsorption complexes 1, 13, and 16 hardly interact with the Ru surface, as
indicated by Ru-O distances of 246 pm or longer, albeit Ru is known to be oxophilic.212
The
Caryl-O bonds in the mentioned adsorption complexes are tilted away from the Ru(0001)
surface, by 11–35°, similar to the C-H bonds in the adsorption complex of benzene 20.
Similarly tilted Caryl-O bonds have been reported for phenol on Pt, Ni, and Rh.150,242-244
Even if the OCHk group at aromatic substrates is dehydrogenated and thus forms a bond
with the Ru surface, as in the adsorption complexes 3, 5, or 7 (Figure 24), the preference for
hollow sites by the aromatic C6 ring remains unchanged. In the structures of 3, 5, and 7, the
dehydrogenated, aliphatic C center adsorbs at top, bridge, and hollow sites of the Ru(0001)
surface, respectively. This is remarkable, as previous calculations, including those discussed
in Chapter 5, have shown that all isolated CHk species, k = 0–3, prefer hollow sites on
Ru(0001).221,245
This difference between isolated CHk species and OCHk groups in aromatic
adsorbates is related to the competition between the OCHk and the aromatic ring for the
preferred adsorption sites.
A dehydrogenated aromatic C center as in the surface complex of phenyl 21, is another

Chapter 6. Hydrodeoxygenation of Guaiacol over Ru
65
structural motif encountered several times in this study. As notable in structure 21 (Figure 24)
the dehydrogenated aromatic C adsorbs preferentially at hollow sites. This invokes a slight
shift of the center of the C6 ring in 21 towards a bridge site, by 45 pm. On the close-packed
surface of Ru, the C6 ring of phenyl in structure 21 lies essentially parallel to the metal
surface. At variance, phenyl was calculated to adsorb upright or tilted on the Cu(100) and
Pt(111) surfaces.145,149
Another recurring functional group is the C-O moiety of oxo groups at the aromatic C6
ring as in the adsorption complex of phenolate 17. In structure 17, the C6 ring is at an hcp
site, the C-O moiety adsorbs to the neighboring fcc site. In particular, the C atom is close to
the center of the fcc site, while the O center interacts in top fashion with one Ru atom of the
fcc site. The corresponding Ru-O distance, 212 pm, indicates a significantly stronger metal-O
interaction than in the absorption complex of phenol 16, the hydrogenated analogue with
Ru-O = 267 pm. An alternative conformer for the adsorption complex of phenolate 17 with
the oxo group over hollow or bridge sides could not be identified. In general, oxo
functionalities at aromatic rings seem to prefer the local geometry as described for structure
17. Similar local geometries are also determined for other adsorption structures featuring an
oxo group, among others the structures 2, 4, and 6 (Figure 24). However, there are other
surface complexes, like catecholate 15 or 2-oxyphenyl 19, in which the intrinsic structures of
the adsorbate prevent oxo groups to interact with the Ru(0001) surface in the preferred
fashion.
In the adsorption complex 15 of catecholate (Figure 24), which features two vicinal oxo
groups, one O adsorbs at the preferred top site, while the second O center can only be located
over a less favorable bridge site (or rather a skewed top site). The resulting unequal Ru-O
distances at this bridge site, 231 pm and 245 pm, as well as the fact that the center of the
aromatic ring in 15 is shifted by 58 pm from the center of a hollow site (Figure 24), indicate
that the adsorbate structure is under strain. The strain can be rationalized by the competition
between the two oxo groups and the aromatic ring for their respective ideal adsorption sites.
The C-O distances also reflect the presence of strain in the adsorption complex 15. The
distances C-Otop = 131 pm and C-Obridge = 135 pm indicate that the latter bond is more
activated. Similarly, the surface structure of 2-oxyphenyl 19 exhibits strain, as the
dehydrogenated C center and the oxo group in ortho position compete for optimum sites. As
the former adsorbs at a preferred hollow site, the C-O moiety of the oxo group is forced to
align along a bridge site (Figure 24). This atypical local geometry around the C-O moiety has

Chapter 6. Hydrodeoxygenation of Guaiacol over Ru
66
not been found for any other adsorption complex under study.
Finally, a more exotic structure shall be addressed, namely the adsorption complex of
benzyne 22 (Figure 24) which is included as a possible intermediate in the reaction network
(Figure 23). Benzyne formally derives from the further dehydrogenation of phenyl at ortho
position to the dehydrogenated C. At variance with the surface structure of phenyl, the
benzyne moiety in 22 is located over a hollow site, with the ring oriented perpendicular to
the Ru surface. Similar benzyne adsorption complexes have previously been identified
computationally on Pt(111) and Cu(100).145,149
6.3.1.2. Energetics of Reactions
The energetics, in particular the Gr and Ga values of the reactions under study, is discussed in
this section (Table 4). For the discussion the reactions are grouped, based on the bond being
broken, into six categories: bond cleavages of (i) O–H, (ii) Calkyl–H, (iii) Caryl–H,
(iv) Calkyl–O, (v) Caryl–OH, and (vi) Caryl–OCHk. To facilitate comparison with earlier works
which often report only electronic energies E instead of Gibbs free energies G, the electronic
energies will be mentioned where appropriate (Table 5).
O–H cleavage. The dehydrogenation of an OH group at aromatic C6 rings has been
studied for the species 1, 3, 5, 13, 14 and 16, which differ only in the substituent in ortho
position to the OH group. The corresponding reactions, 1-2, 3-4, 5-6, 13-14, 14-15, and
16-17, are all determined to be exothermic. With the exception of 14-15, which will be
discussed separately, all reactions have similar energetic properties (Table 4). The calculated
Gibbs free energies of reaction Gr are in the range from -58 kJ mol‒1
to -79 kJ mol‒1
. The
exothermic character of these reactions is related to the formation of a stable bond between
an O center and the surface of an oxophilic metal, Ru. The corresponding barriers Ga are
between 28 kJ mol‒1
and 45 kJ mol‒1
. Hence the O-H scission reactions addressed here can be
considered as easily accessible under the typical HDO conditions, 523‒673 K and
1‒40 bar.26-29
The reactions have in common that the OH group in the corresponding ISs does
not interact with the Ru surface (or does so only weakly), while the oxo group of the product
adsorbs at a top site. The similarity in the Gr and Ga values can be rationalized by the fact that
the various substituents in ortho position hardly affect the local structure around the hydroxyl
group where the actual reaction occurs.
In order to compare with similar reactions, the reaction energies Er and activation
energies Ea of the above mentioned reactions (1-2, 3-4, 5-6, 13-14, and 16-17) should be
introduced (Table 5). The values for Er lie between -55 kJ mol‒1
and -72 kJ mol‒1
; these
Chapter 6. Hydrodeoxygenation of Guaiacol over Ru
67
values are slightly less exothermic than the corresponding Gr values, -58÷-79 kJ mol‒1
. The
activation energies Ea are generally higher than the Gibbs free energies of activation (Ga:
28‒45 kJ mol‒1
) and fall in the range from 37 kJ mol‒1
to 51 kJ mol‒1
.These values are
somewhat lower than Ea results of 69 kJ mol‒1
and 63 kJ mol‒1
reported for the O-H scission
of phenol on Pt(111) and Rh(111), respectively.150
The activation energies Ea for the dehydrogenation at the OH substituents of aromatic
compounds are slightly lower than the Ea reported for aliphatic OH groups
(42‒78 kJ mol‒1
);246
see also Chapter 5. A direct comparison between the thermodynamic
properties for aromatic and aliphatic O-H cleavage steps is not straightforward. The reaction
energies Er for the cleavage of aliphatic O-H groups scatter much stronger, from -22 kJ mol‒1
to -64 kJ mol‒1
(cf. Chapter 5),246
than the Er or Gr values associated with the scission of
aromatic O-H groups.
Reaction 14-15 has a higher barrier (63 kJ mol‒1
) and is less exothermic (-30 kJ mol‒1
)
than the other aromatic OH cleavage reactions on Ru mentioned above. This difference can
be related to the structure of product 15. At variance with all other O-H cleavage steps
discussed above, the O center of the OH group adsorbs at an unfavorable bridge site upon
dehydrogenation, which is related to the competition between the two oxo functionalities in
the product 15. As discussed in Section 6.3.1.1, this atypical adsorption geometry for the oxo
group in 15 comes along with structural strain which renders the reaction 14-15 slightly less
favorable than the other O-H scission steps discussed before.
Calkyl–H cleavage. This category addresses the dehydrogenation at the methoxy group.
These reactions can be divided into two groups, based on the IS structure. There is either a
hydroxyl group (1-3, 3-5, 5-7) in ortho position to the OCHk moiety (k = 3–1) being
dehydrogenated, or an oxo group (2-4, 4-6, 6-8). Similar to the O-H cleavage reactions
discussed above, the influence of the substituent in ortho position on the energetics is
negligible. The Gr and Ga values of analogous reactions in the two groups differ by at most 9
kJ mol‒1
. The barriers Ga for the removal of the first H atom from the methoxy group are
determined to be 56 kJ mol–1
(1-3) and 65 kJ mol–1
(2-4). The corresponding values for Gr are
slightly exothermic, -13 kJ mol–1
and -5 kJ mol–1
, respectively. The C-H scission for the
second hydrogen, 3-5 and 4-6, is both kinetically and thermodynamically more favored, with
Gr of -43 kJ mol–1
and -46 kJ mol–1
, respectively, and Ga of at most 13 kJ mol
–1. The third
and last dehydrogenation steps leading to the formation of a ‒OC moiety (5-7, 6-8) are
associated with barriers of 48 kJ mol–1
and 50 kJ mol–1
, respectively, that are slightly lower
Chapter 6. Hydrodeoxygenation of Guaiacol over Ru
68
than those of the first dehydrogenation step 1-3 (56 kJ mol–1
) and 2-4 (65 kJ mol–1
). These
reactions are exothermic as well, by -34 kJ mol–1
and -36 kJ mol–1
, respectively.
The Gibbs free energies of reaction presented here indicate a picture that differs from the
situation for ethanol dehydrogenation on Ru(0001) as discussed in Chapter 5. Recall that the
first dehydrogenation at the ethyl moiety of ethanol was determined to be endothermic. In
contrast, the thermodynamic properties for the reactions at the methoxy group of guaiacol
presented here resemble more the potential energy surface reported for methane
dehydrogenation on Ru(0001), whose first three dehydrogenation steps are all
exothermic.221,222,245
Note that the O center in the OCHk (k =0–3) group of the aromatic
species studied here does not interact at all with the Ru surface, whereas the O-Ru interaction
plays an important role in the case of ethanol (cf. Chapter 5). This may rationalize why the
thermodynamic properties for the reaction at the guaiacol methoxy group resembles those for
the reaction of methane, which does not contain any oxygen centers.
As mentioned before, the barriers associated with the removal of the first H from the
methoxy group (1-3, 2-4) are higher than those for the dehydrogenation at an already
dehydrogenated ‒OCH2 moiety (3-5, 4-6). This can be rationalized by noting that in the IS
structures 1 and 2, the methyl group interacts only weakly with the surface, thus the methyl
C-H bonds are essentially not activated. At variance, in structures 3 and 4 the aliphatic C
atom binds notably to the Ru surface. This argument is supported by results of earlier
computational studies on the reactions of aliphatic species on Ru; the highest
dehydrogenation barriers were determined for the reaction at saturated C moieties (cf.
Chapter 5).221,223
Caryl-H cleavage. The prototypical Caryl–H cleavage reaction is the dehydrogenation
20-21 of adsorbed benzene to form adsorbed phenyl 21, which is an endothermic process, Gr
= 34 kJ mol–1
with a barrier of 82 kJ mol–1
. Slightly higher values are obtained when
thermodynamic corrections are not considered: Er = 40 kJ mol–1
and Ea = 92 kJ mol–1
(Table
5). Analogous reactions on other transition metal surfaces have been reported to be
endothermic as well, Er of 75 kJ mol–1
and 71 kJ mol–1
have been determined for the
reactions on Pt(111)145
and Cu(100),149
respectively. A noteworthy fact is that the adsorption
complex of the product phenyl on Ru shows a different structure than the corresponding
complexes on Pt and Cu. As mentioned in Section 6.3.1.1, the phenyl moiety lies flat on the
Ru(0001) surface (Figure 24), but is adsorbed upright or tilted on the surfaces Cu(100) and
Pt(111). The second reaction in this category is reaction 17-19, the dehydrogenation in ortho

Chapter 6. Hydrodeoxygenation of Guaiacol over Ru
69
position to the oxo group of phenolate. This reaction is both thermodynamically (Gr =
53 kJ mol–1
) and kinetically (Ga = 103 kJ mol–1
) less favored than 20-21 (Table 4). This can
be rationalized by the strained structure of the product 19, which was addressed in Section
6.3.1.1.
Calkyl-O cleavage. This category of reactions comprises the cleavages of the HkC-O bond
with k = 0–3 (Table 4). Similar to the Calkyl-H cleavage reactions, the Calkyl-O scissions can
also be divided into two groups, recognizing that the ISs have either a hydroxyl substituent or
an oxo group in ortho position to the OCHk group. The former group of reactions yields
adsorbed hydrogen catecholate 14 as product, whereas the latter group leads to the formation
of surface catecholate 15.
For the reactions yielding 14, the bond scission barrier Ga decreases with k, from
167 kJ mol–1
estimated for 1-14 (k = 3),* to 48 kJ mol
–1 for 3-14 (k = 2), and 31 kJ mol
–1 for
5-14 (k = 1). The corresponding Gr values are generally strongly exothermic, ranging from
-105 kJ mol–1
(3-14) to -134 kJ mol–1
(5-14), but do not show any obvious correlation with k.
The analogous reactions from the group yielding catecholate 15 are less exothermic than the
reactions yielding 14, by 29–36 kJ mol–1
(Table 4). This is related to the steric strain due to
the two oxo groups in the product structure 15; cf. Section 6.3.1.1. In line with the less
exothermic Gr values for the reactions of the oxo-substituted ISs (yielding 15), the barriers of
4-15 and 6-15 are also higher than those of the reactions of the OH-substituted reactants
(yielding 14), by 8 kJ mol–1
(4-15 vs. 3-14) and 16 kJ mol–1
(6-15 vs.5-14). Reaction 2-15 has
been omitted, as it is expected to be a kinetically inaccessible reaction with a barrier larger
than Ga(1-14) = 167 kJ mol–1
. Similar to the reactions of the first group yielding 14, the
barriers for the reactions of the oxo-substituted ISs yielding 15, the cleavage of the HC-O
bond (6-15) is kinetically easier accessible than the scission of the H2C-O bond (4-15). In
addition, reaction 8-15 has been studied. The corresponding IS has no H at the aliphatic C
center (k = 0). For this reaction, Ga = 77 kJ mol–1
has been calculated, i.e. the barrier of 8-15
is higher than those for 4-15 and 6-15. Therefore, the barriers of the Calkyl-O cleavages do not
* The force on the TS structure 1_14 could only be converged to 2.7×10
–4 eV, i.e. slightly
above the standard convergence criteria of 2.0×10⁻⁴
eV. The corresponding structure shows
two imaginary vibrational modes: 547i cm–1
for the stretching mode of the methoxy C-O
bond, and a significantly smaller frequency of 96i cm–1
related to the movement of the methyl
group towards the Ru surface. The barrier of Ga =167 kJ mol–1
is estimated under the
assumption that this structure is a reasonable approximation for the “real” TS structure. Due
to the small residual forces, the error on Ga introduced by the above mentioned
approximation is expected to be negligible.

Chapter 6. Hydrodeoxygenation of Guaiacol over Ru
70
fall synchronously with the decreasing value of k. Instead, there is a minimum at k = 1. A
similar trend with a rough minimum has also been found for the activation energies Ea
associated with the C-O cleavage of ethanol and its dehydrogenation products on Ru(0001)
(cf. Chapter 5).
Caryl-O(H) cleavage. The removal of an oxo or a hydroxyl group from the aromatic C6
ring will be addressed here. These reactions are generally characterized by barriers higher
than 100 kJ mol–1
(Table 4). With the exceptions of the reactions 15-19 and 19-22, which will
be discussed separately, a clear trend can be identified. Cleavage reactions of Caryl-OH bonds
are associated with barriers ranging from 115 kJ mol–1
to 130 kJ mol–1
, whereas removal of
an oxo group is kinetically even less favored, with barriers between 174 kJ mol–1
and
198 kJ mol–1
. At variance, thermodynamics tends to prefer the removal of an oxo group over
the elimination of an OH group. All reactions eliminating an oxo group are exothermic, with
Gr from -7 kJ mol–1
to -24 kJ mol–1
. On the other hand, the analogous OH removal reactions
from an O-hydrogenated intermediate are less exothermic or even endothermic in all cases
where the data allow a direct comparison (Table 4).
In the special case of the reaction 15-19, there are two oxo groups in the IS structure 15.
As mentioned in Section 6.3.1.1, one catecholate oxo group is adsorbed at a top, the other at a
bridge site. The barrier associated with the removal of the top-adsorbed O is 184 kJ mol–1
,
well comparable to values found for other oxo removal steps (2-9, 4-10, 6-11, 8-12, 14-18,
17-21) in which the pertinent oxygen center is also attached to a top site. The C-O scission
barrier associated with O at the bridge site is by 78 kJ mol–1
lower, Ga = 106 kJ mol–1
.
Obviously, the local geometry around the oxo group to be eliminated notably affects the
barrier height. This is a consequence of the strain in the adsorbate moiety of 15 leading to a
stronger activation of the C-Obridge bond as discussed in Section 6.3.1.1.
The second special case, 19-22, also involves an IS structure that is under strain. The IS
19 is the only adsorption complex under study, in which a dehydrogenated, aromatic C center
in the C6 ring competes with the oxo group for the ideal adsorption site on the Ru surface (cf.
Section 6.3.1.1). In addition, the product structure, the adsorption complex of benzyne 22, is
the only surface structure in this study which features a C6 moiety oriented upright on the
metal surface (Figure 24). Gr of -67 kJ mol–1
and the barrier of 138 kJ mol–1
indicate that this
reaction is both thermodynamically and kinetically more favorable than the “typical” oxo
removal steps discussed above, 2-9, 4-10, 6-11, 8-12, 14-18, and 17-21. Obviously reaction
19-22 is not comparable to these oxo-removal steps.

Chapter 6. Hydrodeoxygenation of Guaiacol over Ru
71
Caryl-OR cleavage. Similar to the Caryl-O(H) cleavage just discussed, this category of
reactions also has rather high barriers, between 87 kJ mol–1
and 155 kJ mol–1
. Although the
Ga values for the Caryl-OR cleavage tend to be lower than the barriers associated with the
Caryl-O(H) cleavage, the scission of any Caryl-O bond is still kinetically challenging,
irrespective of the substitution pattern at the O center. Similar to the Calkyl-O cleavage, the
nature of the substituent in ortho position to the OCHk group of the ISs has a notable effect
on the energetics.
For ISs with an OH group in ortho position, one yields intermediate 18 as the product of
exothermic reactions, with Gr from -14 kJ mol–1
to -38 kJ mol–1
. The corresponding barriers
fall into the range from 87 kJ mol–1
to 138 kJ mol–1
. Neither Gr nor Ga show a clear
correlation with the number of H centers at the aliphatic C. However, the highest barrier is
calculated for the least exothermic reaction 3-18 with R = CH2. The reactions of the
intermediates featuring an oxo group instead of the OH group yield the strained structure 19
as product (cf. Section 6.3.1.1). Such reactions are thermodynamically and kinetically less
favored than the analogue reactions yielding 18. The Ga for the reactions forming 19 range
from 92 kJ mol–1
to 155 kJ mol–1
, i.e. are by at least by 8 kJ mol–1
higher than the barriers of
the reactions starting from the corresponding O-hydrogenated ISs. With the exception of
reaction 8-19, all reactions yielding 19 are weakly exothermic or thermo-neutral. 8-19 is a
rather exothermic reaction, -94 kJ mol–1
; note that it involves the formation of the relatively
stable side product CO. Similar to the situation of Calkyl-O cleavages, the general preference
for reactions of intermediates with an OH group (x-18) over the reactions of their
O-dehydrogenated analogues (x-19) is related to the structural strain in the product 19.
6.3.1.3. Comment on the Temperature and Pressure Dependency
The reactions discussed above and displayed in Table 4 are all reactions of species adsorbed
on a Ru surface. When evaluating the Gibbs free energies of such species, one can treat, as a
rough approximation, the frustrated translation modes and frustrated rotation modes as
harmonic vibrational modes.188,189
Therefore, the translational contribution to the entropy, the
only pressure dependent term in the Gibbs free energy, is set to zero. Thus, the Gr and Ga
values for surface reactions are independent of the pressure. In contrast, for the evaluation of
the Gibbs free energies of gas phase species, which can move and rotate freely, it is not
possible to treat the rotational and translational modes as vibrational modes. Therefore, the
energetics of adsorption processes, which are discussed separately in the next section, is
pressure dependent.

Chapter 6. Hydrodeoxygenation of Guaiacol over Ru
72
Whereas the energetics of the surface reactions is independent of the pressure, it does
depend on the temperature. As various experimental works on guaiacol HDO have been
performed at temperatures between 523 K and 673 K,26-29
it is appropriate to ask whether Gr
and Ga values evaluated for 673 K (Table 4) still give a reasonable description of the HDO
experiments done at lower temperatures. Table 6 shows Gr and Ga evaluated for 523 K, which
deviate by at most 5 kJ mol–1
from the corresponding values at 673 K. Thus, the Gibbs free
energies of the surface reactions under study depend only weakly on the temperature.
Therefore, the energetics evaluated for surface reactions at 673 K can be used safely for the
interpretation of reactions at somewhat lower temperatures. At variance, the adsorption
processes, which involve species in the gas phase, behave differently: their corresponding
Gibbs free energies depend more strongly on the temperature, as the discussion in the next
section will show.
6.3.1.4. Adsorption Processes
As already mentioned, adsorption processes are pressure dependent, as the Gibbs free energy,
in particular, the translational contribution to the entropy, of gas phase species is pressure
Table 6: Calculated Gibbs free energies of reaction Gr and Gibbs free energies of
activation Ga at 523 K for reactions on Ru(0001).a All values in kJ mol
–1.
IS O-H Calkyl-H Calkyl-O Caryl-O(H) Caryl-OR
P Gr Ga P Gr Ga P Gr Ga P Gr Ga P Gr Ga
1 2+H -68 43 3+H -16 53 14+CH3 -111 164b 9+OH -19 113 18+OCH3 -38 99
2 4+H -8 62 15+CH3 -74 9+O -24 173 19+OCH3 -13 134
3 4+H -60 37 5+H -44 12 14+CH2 -104 46 10+OH -11 119 18+OCH2 -13 137
4 6+H -47 8 15+CH2 -74 56 10+O -24 198 19+OCH2 5 155
5 6+H -62 25 7+H -34 48 14+CH -133 31 11+OH -6 124 18+OCH -26 87
6 8+H -37 50 15+CH -101 48 11+O -17 176 19+OCH -6 96
8 15+C -51 76 12+O -22 197 19+CO -89 93
13 14+H -80 27
14 15+H -31 61 19+OH 13 128
18+O -18 179
15 19+O -30 104
Caryl-H 182
16 17+H -72 27 P Gr Ga 21+OH -6 122
17 19+H 53 103 21+O -7 184
19 22+O -65 140
20 21+H 32 81
a For each reaction, the initial state (IS) and the cleavage product (P) are listed.
b Estimated; see Section 6.3.1.2.

Chapter 6. Hydrodeoxygenation of Guaiacol over Ru
73
dependent. The temperature dependency of the Gibbs free energy of adsorption Gads will be
briefly addressed here. Upon adsorption, an adsorbate is limited in its rotational and
translational degrees of freedom, which leads to a significant decrease in entropy. In the case
of guaiacol, the entropy change Sads associated with the adsorption process is as large as
-156 J K–1
mol–1
. As the Gibbs free energy of adsorption is calculated as Gads = Hads - SadsT,
with Hads and T being the adsorption enthalpy and the temperature, respectively, a large value
(in absolute terms) for Sads directly leads to a strong temperature dependency of Gads.
Table 7 shows Gads values for all closed-shell intermediates under study, evaluated at
pertinent reaction conditions (523 K, 673 K; 1 bar, 40 bar). At 673 K and 1 bar, the
adsorption of guaiacol and catechol on the Ru(0001) surface yielding the surface structures 1
and 13 are endothermic processes, while the adsorption of phenol and benzene forming 16
and 20 are slightly exothermic. These results indicate that all four aromatic structures
considered can easily desorb from the Ru surface. The importance of considering the entropy
for the adsorption processes can be illustrated best by comparing Gads with the adsorption
energy Eads (Table 7). In contrast to the Gads values, the Eads results for the species under
study are -107 kJ mol–1
or more exothermic, which may misleadingly suggest that the
adsorbates can hardly desorb. The data in Table 7 further show that Gads becomes
thermodynamically more favorable at lower temperature and higher pressures. Thus, within
the considered temperature and pressure range, the most exothermic values of Gads are
calculated for 523 K and 40 bar, between -23 kJ mol–1
and -53 kJ mol–1
. The values in Table
7 indicate that the desorption of the aromatic adsorbates is thermodynamically accessible at
all reaction conditions relevant for the HDO process.
There is one final issue to be commented on in this section. Despite Gads depending
strongly on temperature and pressure, the relative order of the Gads values does not change,
Table 7: Calculated adsorption energies Eads and Gibbs free energies of adsorption Gads of
relevant adsorbates, in kJ mol–1
.
Eads Gads
523 K, 1 bar 523 K, 40 bar 673 K, 1 bar 673 K, 40 bar
1 guaiacol -107 -7 -23 21 0
13 catechol -116 -14 -30 16 -5
16 phenol -130 -32 -48 -4 -25
20 benzene -136 -37 -53 -10 -30

Chapter 6. Hydrodeoxygenation of Guaiacol over Ru
74
independent of the reaction conditions. The adsorption becomes more favorable in the order
guaiacol, catechol, phenol, benzene. The same trend is also found for Eads, as mentioned in
Section 6.3.1.1.
6.3.1.5. Reaction Pathways
This section presents possible pathways that are derived from the Gibbs free energies
discussed in the preceding sections. The discussion starts with the most likely pathway
(Figure 25) which has been deduced by choosing for each intermediate the reaction with the
lowest activation barrier. In the second part of this section, alternative pathways that are
kinetically accessible are discussed. These alternative pathways feature barriers that are
Figure 25: Gibbs free energy profile at 673 K and 1 bar for the most likely reaction pathway
on Ru(0001). Intermediate states are represented by bars, TS states by arches. Numerical
values at the arcs denote the Gibbs free energies of activation (red) and of reaction (black).
Also shown are Gibbs free energies of reaction and of activation for hydrogenation steps
that yield catechol and phenol.

Chapter 6. Hydrodeoxygenation of Guaiacol over Ru
75
slightly higher (typically by up to 10 kJ mol–1
) than those of the most likely pathway. Recall
that the discussion refers to reactions at 673 K and 1 bar. The TS structures involved in the
discussed pathways are displayed in Figure 26.
The most likely pathway. Starting from gas phase guaiacol 1gp and an empty Ru(0001)
surface, the initial step of this pathway is the endothermic formation of the adsorption
complex of guaiacol 1 on the metal surface, with Gads = -21 kJ mol–1
. For adsorption complex
1, only two reactions with Ga < 100 kJ mol–1
have been identified, the exothermic
Figure 26: Top view on the optimized structures of all adsorption complexes of TS
structures encountered along the reaction pathways on Ru(0001) discussed in Section
6.3.1.5. Black: C, red: O, white: H, cyan: Ru. For the sake of a clearer view, the Ru-Ru
bonds are displayed as sticks. The blue background highlights the cleaving / forming bond.

Chapter 6. Hydrodeoxygenation of Guaiacol over Ru
76
dehydrogenation reactions at the hydroxyl group (1-2, Ga = 45 kJ mol–1
) and at the methyl
group (1-3, Ga = 56 kJ mol–1
). The most preferred reaction is the O-H scission to form
adsorbed guaiacolate 2, a process that stabilizes the system by -66 kJ mol–1
. Note that this is
not the most exothermic reaction of 1. The most exothermic reaction of 1 is the removal of
the methyl group (1-14) with Gr = -110 kJ mol–1
. However, this reaction can be considered as
kinetically hindered due to the high estimated barrier of around 170 kJ mol–1
. Due to the
relatively low lying barrier for the reaction 1-3, an alternative pathway proceeding with 3 will
be discussed later. After the dehydrogenation at the hydroxyl group, the most likely pathway
continues with two consecutive exothermic dehydrogenation steps at the methyl group, 2-4
and 4-6, with barriers of 65 kJ mol–1
and 9 kJ mol–1
, respectively. All other reactions for
intermediate 2 can be ruled out as possible side reactions due to their high barriers, Ga ≥
135 kJ mol–1
.
The dehydrogenation at the methyl group 2-4 activates the bonds at the aliphatic
substituent in the product structure 4. This is not only reflected in the low barrier of the
further dehydrogenation as just mentioned. The barrier of the H2C-O bond cleavage (4-15)
can also be considered as accessible, 56 kJ mol–1
. Recall the high barrier of ~170 kJ mol–1
for
the H3C-O bond scission (1-14), i.e. the analogue reaction at the saturated methoxy group.
The barriers for all cleavage reactions of any Caryl-O bond in 4 were calculated far above
100 kJ mol–1
, and thus need not be considered as side reactions (Table 4).
The most likely pathway thus proceeds with the formation of 6 from 4. At the stage of 6,
the reactions with the lowest barriers are 6-8, the removal of the (last) H from the aliphatic
carbon center, Ga = 50 kJ mol–1
, and 6-15, the cleavage of the Calkyl-O bond, Ga =
47 kJ mol–1
. All other reactions of intermediate 6 are kinetically hindered due to their
significantly higher barriers of at least 95 kJ mol–1
. Structure 6 is the first intermediate along
this pathway, for which the Calkyl-O scission is kinetically competitive to the Calkyl-H scission.
In view of the slightly lower barrier of the Calkyl-O scission and its significantly stronger
exothermicity, Gr = -103 kJ mol–1
, 6 will likely react to form catecholate in reaction 6-15.
The alternative path proceeding with the less exothermic dehydrogenation step 6-8, Gr =
-36 kJ mol–1
, will be discussed later on.
There are two possible reactions for adsorbed catecholate 15: rehydrogenation at one O
site 15-14 (reversed 14-15) or reaction 15-19, the cleavage of the Caryl-O bond. The two
reactions have comparable barriers, 93 kJ mol–1
and 106 kJ mol–1
, respectively. The
kinetically slightly more preferred hydrogenation step is endothermic by 30 kJ mol–1
,

Chapter 6. Hydrodeoxygenation of Guaiacol over Ru
77
whereas the C-O cleavage step is exothermic, by -30 kJ mol–1
. After a second endothermic
hydrogenation step with a high barrier (reversed 13-14, Gr = 79 kJ mol–1
, Ga = 106 kJ mol–1
)
and the exothermic desorption (Gdes = -16 kJ mol–1
), the rehydrogenation path ultimately
leads to the formation of catechol in the gas phase 13gp (Figure 25), the primary intermediate
product observed in experiment.26,27
Due to the endothermic nature of the overall reaction
from 15 to 13gp, this reaction is most likely only a side reaction for 15. Thus, the more
preferred reaction for 15 is the C-O cleavage 15-19 to form 2-oxyphenyl on the Ru surface.
The corresponding intermediate product 19 can either be rehydrogenated at the aromatic ring
(reverse 17-19) to form the adsorption complex of phenolate 17 or undergo a second C-O
cleavage step 19-22 to form benzyne. Although thermodynamics slightly favors 19-22,
Gr(19-17) = -53 kJ mol–1
vs. Gr (19-22)= -67 kJ mol–1
, the reaction is ruled out due to the
significantly higher barrier, Ga(19-17) = 50 kJ mol–1
vs. Ga(19-22) = 138 kJ mol–1
. Therefore,
the main reaction path continues with the formation of phenolate 19-17.
Adsorbed phenolate 17 is a very stable species which renders any transformation a
challenge. The rehydrogenation at the oxygen, with Gr = 69 kJ mol–1
and Ga = 98 kJ mol–1
,
yields adsorbed phenol 16, which in return can desorb in a quasi thermo-neutral process. This
is the most preferred reaction for 17, as the only alternative reaction is 17-21, the thermo-
neutral C-O cleavage, which features a very high barrier of 185 kJ mol–1
.
Thus the calculated results predict that the HDO of guaiacol over Ru(0001) ends with the
formation of phenol, which agrees with the experiment over Ru/C, carried out under H2
pressures below 1 bar.27-29
However, as benzene is observed as product under elevated H2
pressure of around 40 bar,26
a further reaction of the C-O cleavage product phenyl 21 to
benzene 20 should be included in the current discussion, despite of the high barrier associated
with the formation of 21. The final step from phenyl to benzene is the exothermic
rehydrogenation 21-20 (reversed 20-21) at the C6 ring, Gr = -34 kJ mol–1
, which has a barrier
of 48 kJ mol–1
. After its formation, the benzene adsorbate can easily desorb from the
Ru(0001) surface in a weakly endothermic step.
Because of the high C-O cleavage barrier for phenolate (17-21), it is reasonable to
consider an alternative mechanism, in which phenolate is hydrogenated to form phenol
(reverse 16-17) before the C-O bond cleaves to yield phenyl and OH in reaction 16-21, which
has a lower barrier of 124 kJ mol–1
(Figure 27). However, 16_21, the highest lying TS for this
alternative mechanism, is by 193 kJ mol–1
less stable than the phenolate adsorption complex
17. Thus TS 16_21 is of comparable stability as TS 17_21 which is by 185 kJ mol–1
less

Chapter 6. Hydrodeoxygenation of Guaiacol over Ru
78
stable than structure 17. Therefore, one can conclude that the C-O cleavage mechanism via
the intermediate formation of surface phenol 16 is as unfavorable as the “direct” scission of
the C-O bond via reaction 17-21. Recall also that once phenol is formed on the Ru(0001)
surface, it would rather desorb in a thermo-neutral process than undergo the C-O cleavage
reaction with a high barrier.
The main reaction path discussed above is consistent with the mechanism formulated by
Laurent and Delmon for the reaction of guaiacol over CoMo and NiMo alloys,102,103
which
has recently also been suggested for the reaction on Ru.26
The present study revealed details
of the reactions at the Ru surface which previously have not been addressed. Indeed, the
Calkyl-O bond cleaves prior to the two Caryl-O bonds. However, the cleavage steps do not
occur from guaiacol, catechol and phenol as originally suggested,102,103
but from the
adsorption complexes formed by their dehydrogenated analogues which are significantly
more stable. Due to their radical nature, the dehydrogenated species are unable to desorb and
thus cannot be detected in the product mixture. Another aspect, which has not been covered
in the original mechanism,102,103
is the activation of the methoxy group prior to the actual
cleavage of the Calkyl-O bond. The aliphatic C center is not removed as a methyl group
because the cleavage of the C-O bond is kinetically accessible only after the CH3 group has
Figure 27: Gibbs free energy profile at 673 K for the two pathways possible for the
cleavage of the phenolate C-O bond on Ru(0001), as discussed in Section 6.3.1.5. Layout as
in Figure 25.

Chapter 6. Hydrodeoxygenation of Guaiacol over Ru
79
been dehydrogenated, which allows the formation of a bond between the C center and the
catalyst surface leading to the activation of the Calkyl-O bond.
Alternative pathways. As mentioned above, in the initial step, guaiacol does not
necessarily have to be dehydrogenated at the OH group (1-2). The dehydrogenation step 1-3
at the methoxy group is also accessible (Figure 28) as the associated barrier is only by
11 kJ mol–1
higher than the barrier of 1-2. As on the most likely pathway, the methoxy group
is activated by the removal of the first H in reaction 1-3. The methoxy group continues to
dehydrogenate (3-5) yielding intermediate 5 which features an –OCH moiety. The Gibbs free
energy profile of the reactions from 1 to 5 (Figure 28) is similar to the profile from 2 to 6
discussed for the most likely pathway (Figure 25). Ga and Gr of the corresponding reactions
differ by only 9 kJ mol–1
or less. Intermediate 5 may undergo two reactions. One option is the
dehydrogenation 5-6 at the OH group, yielding 6 (Figure 28), an intermediate on the main
reaction pathway. The highest barrier along the discussed reaction path from 1 via 3 to 6 is
56 kJ mol–1
, even slightly lower than the highest barrier, 65 kJ mol–1
, on the path discussed as
Figure 28: Gibbs free energy profile at 673 K for reaction pathways on Ru(0001) via
intermediate 3, which are alternatives to the most likely path shown in Figure 25. Lay-out as
in Figure 25. For easier comparison, a part of the most likely pathway shown in Figure 25 is
displayed here in gray.

Chapter 6. Hydrodeoxygenation of Guaiacol over Ru
80
the most likely route (1 via 2 to 6, Figure 25). However, as visible from Figure 28, the first
reaction of the most likely pathway, 1-2, is by -53 kJ mol–1
more exothermic than 1-3, the
initial step of the alternative pathway discussed here. In consequence, the stationary points
along the main path are always more stable than or nearly degenerated (2_4 vs. 3_5) with the
stationary points along the alternative path.
The second kinetically accessible reaction for 5 is the strongly exothermic scission of the
Calkyl-O bond 5-14, Gr = -134 kJ mol–1
; its barrier, 31 kJ mol–1
, is comparable to that of 5-6
(Figure 28). As addressed in Section 6.3.1.2, reaction 5-14 is both thermodynamically and
kinetically more favored than the analogous reaction 6-15, which is part of the most likely
pathway. The only difference between 5-14 and 6-15 is that the IS and the product in 5-14
feature an OH group, while the IS and product of 6-15 is dehydrogenated, displaying an oxo
group. As 5-14 is kinetically easily accessible, the competing reaction 5-7, the removal of the
last H form the OCH group, which features a barrier of 61 kJ mol–1
, is unlikely to occur.
Recall that the removal of the last H from the Calkyl center of 6 (6-8) was discussed to be
competitive to the Calkyl-O scission step 6-15 of the most likely pathway.
As discussed in the context of the most likely pathway, the surface complex of hydrogen
catecholate 14 obtained from Calkyl-O bond scission can either be hydrogenated at the oxo
group to form surface catechol 13, which can desorb, or it can dehydrogenate at the
remaining OH group to form catecholate 15 that continues to react as described for the most
likely reaction path.
A similar reaction path as the one described above was proposed in a computational
study addressing HDO of guaiacol over Ru137
where species 5 was proposed to occur as
intermediate on the main pathway.137
Then, instead of continuing with the cleavage of the
Calkyl-O bond 5-14 as shown here in Figure 28, the Caryl-O bond cleavage 5-18 was suggested
to occur, which is reported to require an activation energy Ea of 102 kJ mol–1
,137
slightly
higher than the Ga and Ea values of 87 kJ mol–1
and 95 kJ mol–1
, respectively, calculated in
the present study. Recall that reaction 5-18 has been ruled out in the discussion of the present
work, in view of to the significantly lower barrier, only 28 kJ mol–1
, determined for the
competing reaction 5-14.
Along the most likely pathway, there is a second intermediate besides guaiacol 1 which
does not have a single clearly preferred reaction. Also intermediate 6 is associated with two
reactions of similar barriers, the Calkyl-O scission 6-15, as discussed for the main pathway,
and the less exothermic removal of the last H from the aliphatic carbon center, reaction 6-8

Chapter 6. Hydrodeoxygenation of Guaiacol over Ru
81
(Figure 29). Three reactions may be discussed for the corresponding product 8. The
kinetically most favored reaction 8-15 is the cleavage of the Calkyl-O bond with Ga =
77 kJ mol–1
and Gr = -52 kJ mol–1
. The difference between this alternative path and the most
likely path is only the precursor for the Calkyl-O cleavage step, intermediate 6 with the singly
hydrogenated –OCH moiety or intermediate 8 with the completely dehydrogenated –OC
moiety. Experiment could help with discriminating the two variants if the surface species
were analyzed, e.g., by RAIRS (reflection-absorption infrared spectroscopy).
Another reaction to be considered for 8 is 8-19, the scission of the Caryl-OC bond which
is by 42 kJ mol–1
more exothermic than 8-15, but kinetically less favorable due to the higher
activation barrier of 92 kJ mol–1
. This less likely route would lead to the direct formation of
intermediate 19, which is an intermediate of the most likely pathway. Note that neither the
surface complexes of catecholate 15 nor any of its O-hydrogenated analogues 13 or 14 is
formed on that pathway, which seems to contradict the experimental detection of catechol as
Figure 29: Gibbs free energy profile at 673 K for reaction pathways on Ru(0001) starting
from intermediate 6, which are alternative to the most likely path shown in Figure 25. Lay-
out as in Figure 25. For easier comparison, a part of the most likely pathway shown in
Figure 25 is displayed here in gray. The Gibbs free energies associated with the
intermediates 15 and 19 in the alternative path in black differ from those values shown for
the main path in gray. This is related to a variation of the side products. On the alternative
path, 15 is co-adsorbed with C and H, 19 with CO and H. On the main path, 15 is co-
adsorbed with methine, 19 with methine and O. The Gibbs free energies required for
converting these co-products into each other are also shown.
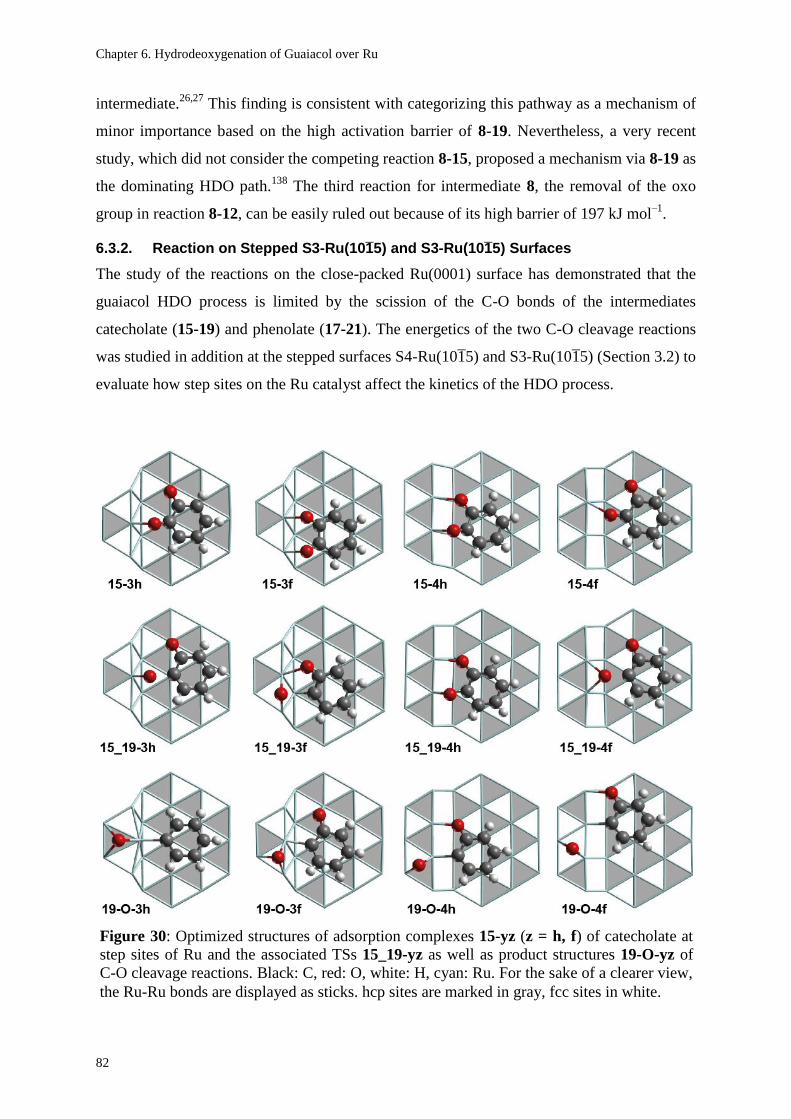
Chapter 6. Hydrodeoxygenation of Guaiacol over Ru
82
intermediate.26,27
This finding is consistent with categorizing this pathway as a mechanism of
minor importance based on the high activation barrier of 8-19. Nevertheless, a very recent
study, which did not consider the competing reaction 8-15, proposed a mechanism via 8-19 as
the dominating HDO path.138
The third reaction for intermediate 8, the removal of the oxo
group in reaction 8-12, can be easily ruled out because of its high barrier of 197 kJ mol–1
.
6.3.2. Reaction on Stepped S3-Ru(101̄5) and S3-Ru(101̄5) Surfaces
The study of the reactions on the close-packed Ru(0001) surface has demonstrated that the
guaiacol HDO process is limited by the scission of the C-O bonds of the intermediates
catecholate (15-19) and phenolate (17-21). The energetics of the two C-O cleavage reactions
was studied in addition at the stepped surfaces S4-Ru(101̄5) and S3-Ru(101̄5) (Section 3.2) to
evaluate how step sites on the Ru catalyst affect the kinetics of the HDO process.
Figure 30: Optimized structures of adsorption complexes 15-yz (z = h, f) of catecholate at
step sites of Ru and the associated TSs 15_19-yz as well as product structures 19-O-yz of
C-O cleavage reactions. Black: C, red: O, white: H, cyan: Ru. For the sake of a clearer view,
the Ru-Ru bonds are displayed as sticks. hcp sites are marked in gray, fcc sites in white.

Chapter 6. Hydrodeoxygenation of Guaiacol over Ru
83
Subsequently, the adsorption complexes of catecholate and phenolate at step sites and
their stability are discussed. Afterwards, the energetics of the C-O scission steps, also in the
context of the complete HDO process, is addressed. The presented Gibbs free energies refer
here again to reactions at 673 K. As adsorption processes are not studied in this section, all
energetic properties are independent of the pressure.
6.3.2.1. Extension to Nomenclature Rules
In order to address the reactions and structures at step sites, the nomenclature introduced in
Section 6.2 will be extended. Recall that identifiers of type x and xgp (x = 1 to 22) refer to
adsorption complexes on Ru(0001) and structures in the gas phase of the corresponding
adsorbates. The complexes of catecholate (Figure 30) and phenolate (Figure 31) at step sites
will be referred by identifiers of the form x-yz (x = 15, 17). y can be 3 or 4 indicating that the
Figure 31: Optimized structures of adsorption complexes 17-yz (z = h, f) of phenolate at
step sites of Ru and the associated TS 17_21-yz as well as product structures 21-O-yz of
C-O cleavage reactions. Black: C, red: O, white: H, cyan: Ru. For the sake of a clearer view,
the Ru-Ru bonds are displayed as sticks. hcp sites are marked in gray, fcc sites in white.

Chapter 6. Hydrodeoxygenation of Guaiacol over Ru
84
complex is located at an S3 type or an S4 type step, respectively. The location of the center of
the C6 ring at an hcp or an fcc site is indicated by z = h, f, respectively.
The step-site variant of the C-O cleavage reactions of catecholate 15-19 and of phenolate
17-21 discussed in this section will be referred to as 15-19-yz and 17-21-yz. The
corresponding TSs are labeled as 15_19-yz (Figure 30) and 17_21-yz (Figure 31),
respectively. The various product structures are referred to as 19-O-yz (Figure 30) and
21-O-yz (Figure 31). The identifier O indicates that an oxygen atom is co-adsorbed with the
cleavage product 2-oxyphenyl (19-O-yz) or phenyl (19-O-yz). The labels designate the IS
state, the associated C-O cleavage TS, and the corresponding product structure. However, the
yz labels do not necessarily imply the position of the C6 ring in the TS and the product
structures correctly, as the C6 ring may move during C-O cleavage.
As indicated in Figure 32a on the example of the C-O cleavage of catecholate, the C-O
cleavage at a step site is studied as a process of three phases: (i) diffusion of the reactant from
its most stable adsorption site on a terrace (15, 17) to a step site yielding the adsorption
complexes x-yz (x = 15, 17); (ii) the actual C-O cleavage yielding the product structure of
type 19-O-yz or 21-O-yz, in which the scission products are co-adsorbed at the step; and (iii)
diffusion of the C-O cleavage products to their most stable adsorption sites at formally
infinite separation on a Ru(0001) surface. The corresponding changes in the Gibbs free
Figure 32: a) Schematic representation of the definitions of the free energy values Gt-s,
GC-O, Gs-t, Ga,t, and Ga,s on the example of the C-O scission of catecholate at step sites.
b) Schematic representation of the processes considered for the C-O scission of phenolate at
step sites.

Chapter 6. Hydrodeoxygenation of Guaiacol over Ru
85
energy associated with the three phases are referred to as Gt-s, GC-O, and Gs-t, respectively
(Figure 32). Note that GC-O can be understood as the direct Gibbs free energy of reaction for
the C-O cleavage step according to the definition in Section 3.4. For the C-O cleavage step,
two different types of activation barriers will be discussed (Figure 32). One is the direct
barrier Ga,s that is the difference between the Gibbs free energies of a TS and of the directly
preceding local minimum state at the step site. The other type of barrier is Ga,t, calculated as
the difference between the Gibbs free energies of a TS at a step site and the IS at the terrace
site: Ga,t = Gt-s + Ga,s. As Ga,t is always referred to the IS at the terrace site, differences in Ga,t
directly reflect differences in stability of isomeric TS structures.
6.3.2.2. Adsorption of Catecholate and Phenolate at Step Sites
Four adsorption complexes each at step sites have been identified for catecholate (Figure 30)
and phenolate (Figure 31). In each of these structures, the C6 ring is adsorbed on the lower
terrace while at least one C-O moiety is bonded to the edge of the ascending step. The present
study only considers such structures as the scission of carbon monoxide and its hydrogenated
derivatives at structurally comparable Ru step sites have been reported to yield product
structures in which the O center is localized at the upper terrace while the C moiety remains
at the lower terrace.97,247-249
The following discussion starts with the structurally less complex
phenolate adsorption complexes 17-yz, and later on will be extended to the catecholate
complexes 15-yz.
The four identified phenolate complexes differ significantly in their stability, as notable
from the large range, from -9 kJ mol–1
to +57 kJ mol–1
, spanned by the associated Gt-s values
(Table 8). In the two more stable structures 17-4h and 17-3f, characterized by Gt-s values of
-9 kJ mol–1
and 16 kJ mol–1
, the C atom of the C-O group is located over a hollow site
(Figure 31), similar to the structure of the phenolate complex 17 on a terrace, discussed in
Section 6.3.1.1 (Figure 24). Gt-s for the other two, less stable phenolate complexes 17-3h and
17-4f at step sites are 30 kJ mol–1
and 57 kJ mol–1
(Table 8). In these latter structures, the C-O
carbon center binds to a top site (Figure 31).
The different stability of the various step-site complexes of phenolate can be partially
related to the distortion of the adsorbate structure relative to the structure of phenolate in the
gas phase. Table 8 shows the elongation of the C-O bond relative to the gas phase structure as
well as the O-C-C6 angle between the C-O bond vector and the C6 plane that is defined by a
least-squares fit to the positions of the atoms in the C6 ring. The more stable complexes 17-4h
and 17-3f feature shorter C-O bonds and smaller O-C-C6 angles than the less stable structures
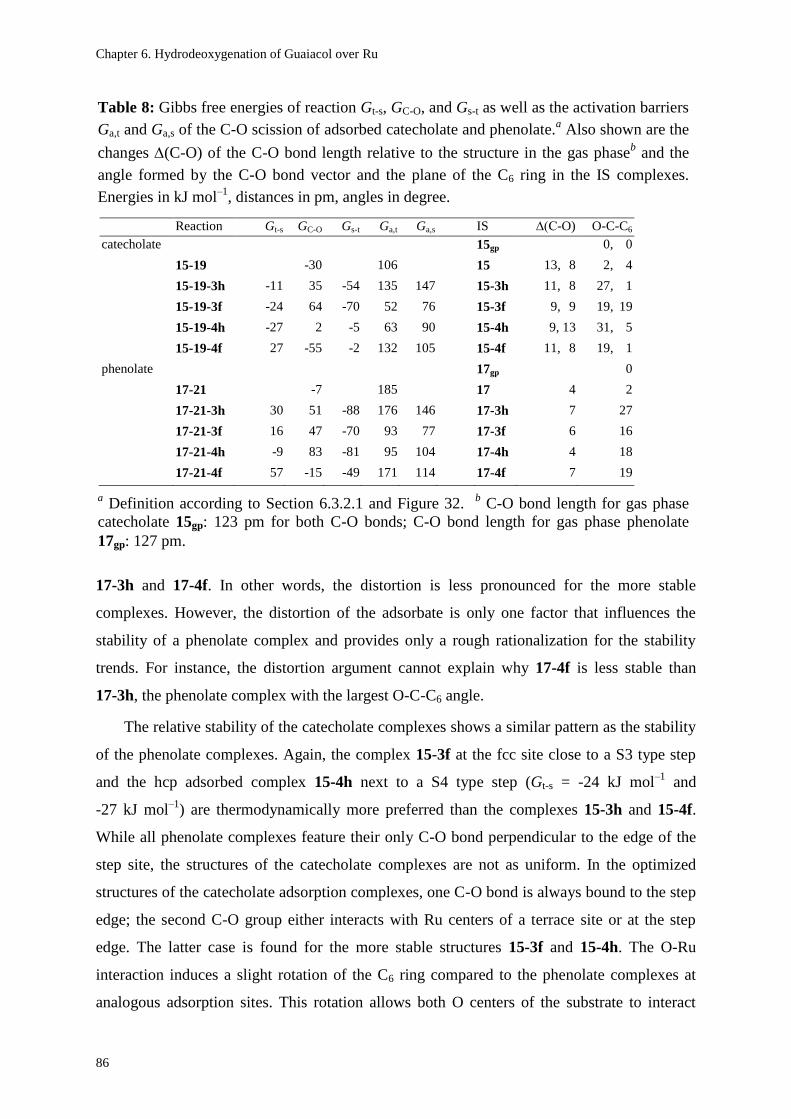
Chapter 6. Hydrodeoxygenation of Guaiacol over Ru
86
17-3h and 17-4f. In other words, the distortion is less pronounced for the more stable
complexes. However, the distortion of the adsorbate is only one factor that influences the
stability of a phenolate complex and provides only a rough rationalization for the stability
trends. For instance, the distortion argument cannot explain why 17-4f is less stable than
17-3h, the phenolate complex with the largest O-C-C6 angle.
The relative stability of the catecholate complexes shows a similar pattern as the stability
of the phenolate complexes. Again, the complex 15-3f at the fcc site close to a S3 type step
and the hcp adsorbed complex 15-4h next to a S4 type step (Gt-s = -24 kJ mol–1
and
-27 kJ mol–1
) are thermodynamically more preferred than the complexes 15-3h and 15-4f.
While all phenolate complexes feature their only C-O bond perpendicular to the edge of the
step site, the structures of the catecholate complexes are not as uniform. In the optimized
structures of the catecholate adsorption complexes, one C-O bond is always bound to the step
edge; the second C-O group either interacts with Ru centers of a terrace site or at the step
edge. The latter case is found for the more stable structures 15-3f and 15-4h. The O-Ru
interaction induces a slight rotation of the C6 ring compared to the phenolate complexes at
analogous adsorption sites. This rotation allows both O centers of the substrate to interact
Table 8: Gibbs free energies of reaction Gt-s, GC-O, and Gs-t as well as the activation barriers
Ga,t and Ga,s of the C-O scission of adsorbed catecholate and phenolate.a Also shown are the
changes (C-O) of the C-O bond length relative to the structure in the gas phaseb and the
angle formed by the C-O bond vector and the plane of the C6 ring in the IS complexes.
Energies in kJ mol–1
, distances in pm, angles in degree.
Reaction Gt-s GC-O Gs-t Ga,t Ga,s IS ∆(C-O) O-C-C6
catecholate 15gp 0, 0
15-19 -30 106 15 13, 8 2, 4
15-19-3h -11 35 -54 135 147 15-3h 11, 8 27, 1
15-19-3f -24 64 -70 52 76 15-3f 9, 9 19, 19
15-19-4h -27 2 -5 63 90 15-4h 9, 13 31, 5
15-19-4f 27 -55 -2 132 105 15-4f 11, 8 19, 1
phenolate 17gp 0
17-21 -7 185 17 4 2
17-21-3h 30 51 -88 176 146 17-3h 7 27
17-21-3f 16 47 -70 93 77 17-3f 6 16
17-21-4h -9 83 -81 95 104 17-4h 4 18
17-21-4f 57 -15 -49 171 114 17-4f 7 19
a Definition according to Section 6.3.2.1 and Figure 32.
b C-O bond length for gas phase
catecholate 15gp: 123 pm for both C-O bonds; C-O bond length for gas phase phenolate
17gp: 127 pm.

Chapter 6. Hydrodeoxygenation of Guaiacol over Ru
87
with the Ru atoms at the step edge. In the less stable catecholate complexes 15-3h and 15-4f,
only one O center interacts with the step edge, while the other O center binds to a top site on
the terrace. The C atom carrying the O center at the terrace site adsorbs over a hollow site,
similar to the complex of phenolate 17 at terrace sites (Figure 24). Recall that such a structure
with the C-O carbon center over a hollow site was discussed to be the most preferred
adsorption geometry for aromatic C-O groups on close-packed Ru surfaces (Section 6.3.1.1).
It has been attempted to relate the stability of the various catecholate complexes to the
distortion of the adsorbate geometry, as done for the phenolate complexes. However, the data
in Table 8 do not show any obvious correlation between the stability and the distortion of the
catecholate adsorbates.
6.3.2.3. Energetics of the C-O Cleavage Process at Step Sites
Table 8 provides an overview of the energetics of the various C-O cleavage reactions at step
sites. The Ga,t values indicate that the lowest lying TSs of catecholate C-O scission are
associated with the reactions 15-19-3f (Ga,t = 52 kJ mol–1
) and 15-19-4h (63 kJ mol–1
) which
proceed via the energetically low lying catecholate complexes 15-3f and 15-4h. The
corresponding TS structures 15_19-3f and 15_19-4h are by 53 kJ mol–1
and 43 kJ mol–1
,
respectively, more stable than 15_19, the TS of the analogous reaction on Ru(0001). A
discussion of the reaction pathways via the reactions 15-19-3h and 15-19-4f will be omitted
in view of their high barriers Ga,t ≥132 kJ mol–1
.
The kinetically more accessible C-O cleavage reactions 15-19-3f and 15-19-4h start with
the exothermic formation of the catecholate complexes 15-3f and 15-4h at step sites that are
of similar stability, Gt-s = -24 kJ mol–1
and -27 kJ mol–1
, respectively. The direct barriers Ga,s
of the actual C-O cleavages at a step site are 76 kJ mol–1
for 15-19-3f and 90 kJ mol–1
for
15-19-4h, indicating that reaction 15-19-3f is kinetically slightly preferred. While the
kinetically more preferred pathway is associated with GC-O = 64 kJ mol–1
, the C-O cleavage
on the alternative path 15-19-4h is thermo-neutral and thus thermodynamically preferred. The
difference in GC-O is related to the interaction of the O atoms with the metal centers at the
step edge. During the thermo-neutral C-O cleavage in reaction 15-19-4h, both O atoms
remain bound to the step edge (Figure 30). In contrast, in the endothermic C-O scission
15-19-3f, both O centers are bound to the step edge in the IS 15-3f and the TS 15-19-3f, but
not in the corresponding product structure 19-O-3f (Figure 30). The missing interaction
between the not reacting C-O group and the step edge in the product structure 19-O-3f
rationalizes the destabilization of that structure with respect to 19-O-4h, the C-O cleavage

Chapter 6. Hydrodeoxygenation of Guaiacol over Ru
88
product of the thermo-neutral C-O cleavage of 15-19-4h. When discussing the GC-O values,
one should keep in mind that the product structures 19-O-3f and 19-O-4h are local minimum
structures that are directly reached from the TSs. In other words, the co-adsorbed
2-oxophenyl and O moieties in those structures are not necessarily in their most preferred
adsorption geometry. Rather, diffusion of these molecular fragments to their most stable
adsorption sites on a Ru terrace entails (in part considerable) stabilization, as indicated by the
Gs-t values of -70 kJ mol–1
(15-19-3f) and -5 kJ mol–1
(15-19-4h, Table 8).
On a close-packed Ru terrace, the C-O cleavage product 2-oxophenyl can undergo
rehydrogenation in an exothermic process with a barrier of 52 kJ mol–1
to yield phenolate, as
discussed in Section 6.3.1.5. This reaction directly leads to the second C-O scission reaction
under study. Also for phenolate, the reactions 17-21-3f and 17-21-4h are kinetically preferred
compared to the reaction 17-21 on a terrace, as can be seen from the Ga,s values around
95 kJ mol–1
(Table 8). At variance, similar to the reaction 17-21 on a terrace, the reactions
17-21-3h and 17-21-4f can be considered as kinetically inaccessible and thus will be omitted
in the following discussion. The diffusion of phenolate 17 adsorbed on a terrace to the step
sites to form 17-3f or 17-4h is characterized by Gt-s of 16 kJ mol–1
and -9 kJ mol–1
,
respectively. The Gt-s values show that diffusion of phenolate from the terrace to the step sites
is generally thermodynamically less favored than the corresponding process of catecholate
(Table 8). One can rationalize this by the strained structure of the adsorption complex 15 of
catecholate on the terrace (Section 6.3.1.1). This strain is released by the diffusion to the step
site, which renders the diffusion of catecholate to the step site a thermodynamically favorable
process. At variance, there is no such effect for the diffusion of phenolate, as the adsorption
complex 17 of phenolate on a terrace site is not under strain.
The actual cleavage of the phenolate C-O bond is associated with direct barriers Ga,t of
77 kJ mol–1
(17-21-3f) and 104 kJ mol–1
(17-21-4h), comparable to the values for catecholate.
Both C-O cleavage steps are endothermic processes with GC-O = 47 kJ mol–1
and 83 kJ mol–1
,
respectively. The product species phenyl and O are again considerably stabilized by their
diffusion to the preferred adsorption sites on a Ru(0001) surface. The phenyl formed can
easily be rehydrogenated to form the experimentally observed benzene26
as discussed in
Section 6.3.1.5.
Although the lowest Ga,s values of catecholate (76 kJ mol–1
, 15-19-3f) and phenolate
(77 kJ mol–1
, 17-21-3f) agree very well, there are some differences between the reactions of
the two types of adsorbates that are worth commenting on. One issue is the relative stability

Chapter 6. Hydrodeoxygenation of Guaiacol over Ru
89
of the IS complexes at step sites. While the catecholate complexes 15-3f and 15-4h are of
similar stability, the phenolate complex 17-4h is by 25 kJ mol–1
more stable than its isomer
17-3f. The difference between catecholate and phenolate may be related to the orientation of
the aromatic substrates. While the two catecholate complexes display slight differences in the
orientation of the C6 ring (Figure 30), the C6 moiety in both phenolate complexes show the
same orientation (Figure 31). A second issue to be addressed here are the Gibbs free energies
GC-O of the actual C-O cleavage step which are notably endothermic for both reactions of
phenolate, 17-21-3f and 17-21-4h. At variance, only one reaction of catecholate, 15-17-3f, is
endothermic while the other one, 15-17-4h, is thermo-neutral. As previously discussed, the
different energetics of the reactions of catecholate can be related to the interaction (or the
absence of it) between the spectator (not reacting) C-O group and the Ru centers at the step
edge. In the case of phenolate, there is no second C-O group that is able to interact with the
Ru step and thus induce such a difference in GC-O.
Inspection of all TS structures at step sites reveals that energetically low-lying TSs, as
characterized by the Ga,t values, feature the C center of the cleaving C-O bond over a (three-
fold) hollow site. In contrast, all TSs with the C atom over a (one-fold) top site are
energetically inaccessible. In other words, in the more stable TS structures, more metal atoms
are coordinated to the adsorbate. This is in line with what has been discussed for the N2
scission on Ru233
where more Ru centers are involved in the TS at a step site than at a terrace
site and thus help to stabilize the N centers that become under-coordinated upon bond
scission.233
In that case, the improved stabilization of the TS at a step site has been discussed
as the reason for the lower barrier of the reaction at the step.233
A similar argument can be
used to rationalize why steps on a Ru catalyst are able to decrease the C-O scission barrier as
illustrated on the example of phenolate. Similar to the situation of N2 scission,233
in the C-O
cleavage TS of phenolate 17_21 on a terrace site (Figure 26) the C and the O centers interact
with two neighboring bridge sites. These bridge sites share a common Ru atom which
induces a repulsive interaction that destabilizes the TS.250
In the structure of the step-site TSs
17_21-3f and 17_21-4h (Figure 31), the hollow site of the C center does not share any atoms
with the top or the bridge site to which the O is bound. In consequence, repulsive interactions
are absent, which leads to the stabilization of the TS structures and decreases the
corresponding activation barrier.
In summary, on a Ru catalyst with step sites, C-O cleavage of catecholate and phenolate
can proceed with direct barriers Ga,s of 76 kJ mol–1
and 77 kJ mol–1
, respectively. Thus, not

Chapter 6. Hydrodeoxygenation of Guaiacol over Ru
90
only the C-O cleavage of catecholate, but also the scission of the phenolate C-O bond is
kinetically accessible (Figure 33), in agreement with the formation of benzene in the Ru-
catalyzed guaiacol HDO experiment under elevated H2 pressure.26
Figure 33 shows the
energetics of the C-O cleavage steps in the context of the most likely reaction pathway on
Ru(0001) discussed in Section 6.3.1.3 (Figure 25). Figure 33 also shows that on a Ru surface
with steps and terrace sites, the rate of the guaiacol HDO process is controlled by the kinetics
of the scission of the aromatic Caryl-O bonds, consistent with the experimental observation of
catechol and phenol as intermediates and products.26,27
It is not necessary to discuss how the presence of steps affect the energetics of the other
reactions involved in guaiacol HDO, as all reactions on Ru(0001) other than Caryl-O cleavage
Figure 33: Gibbs free energy profile for the most preferred C-O cleavage of catecholate and
phenolate on an fcc site at a S3 type step. The Ga,s and GC-O values are displayed as red and
black numbers, respectively. In addition, Gibbs free energies of diffusion Gt-s and Gs-t are
shown. The Gibbs free energy profile for the most likely guaiacol HDO path on Ru(0001) is
shown in the background, see Figure 25.
Chapter 6. Hydrodeoxygenation of Guaiacol over Ru
91
are associated with barriers of 65 kJ mol–1
or lower (Figure 33). If the steps increase the
barrier associated with any of these other reactions, these transformation will rather occur on
the terraces with barriers of at most 65 kJ mol–1
. Turned around, if steps have a barrier
decreasing effect for these reactions, the corresponding barriers would have to be lower than
65 kJ mol–1
, the maximum value for a non-Caryl-O-cleavage step on Ru terrace sites. In that
case, these barriers would also be lower than Ga,s(15-19-3f) = 76 kJ mol–1
, the lowest barrier
associated with the Caryl-O cleavage at Ru step sites. Hence, independent of how the presence
of steps affects the barriers of the non-Caryl-O-cleavage reactions, one may safely assume that
these reactions are not likely to have a significant impact on the overall HDO kinetics.
6.3.2.4. Interpretation of the Experimental Results
With the C-O cleavage reactions at step sites of Ru one is able to rationalize the formation of
benzene. However, the arguments presented thus far are not able to explain how the H2
pressure affects the selectivity of the reactions, mentioned in the introduction (Section 6.1),
with phenol or benzene as final products.26-29
One possibility would be that hydrogen plays a
role in the mechanism for the C-O cleavage of phenolate, as benzene formation is only
observed when the HDO process is carried out under elevated hydrogen pressure of around
40 bar.26
However, there is no evidence for such a mechanism that may rationalize the
experimental finding.138
Yet, there is the possibility that hydrogen only plays an “indirect”
role for the Caryl-O cleavage as elaborated in the following.
The results discussed in the present chapter show that the cleavage of the phenolate C-O
bond, which is necessary for the formation of benzene, is only possible at step sites of a Ru
catalyst. In contrast, catecholate may undergo C-O scission at steps and on the terrace site of
Ru. From these results and the experimental observation that benzene only forms at 40 bar H2
pressure,26
one may speculate that Ru step sites are only available under elevated hydrogen
pressure. It is possible that carbon depositions form at step sites under lower H2 pressure,
which ultimately leads to the blocking of the only sites that are catalytically active for the
C-O cleavage of phenolate. Formation of carbon deposits during the HDO process may be
assumed to be reduced or even inhibited at elevated H2 pressure, similar to the situation
reported for the methanation process and for steam reforming over Ni.251
This hypothesis is supported by the fact that the experimental studies on guaiacol HDO
mention coke formation as a possible reason for the deactivation of the catalyst.26,27,29
Analysis of the published experimental data indicates that the deactivation proceeds faster at
lower H2 pressure. In the experiment at 1 bar H2 pressure yielding phenol, the guaiacol
Chapter 6. Hydrodeoxygenation of Guaiacol over Ru
92
conversion rate drops continuously from 100% at the start of the process to about 30% after 3
to 4 hours time on stream.27
In contrast, in the experiment at 40 bar yielding benzene, in
which the formation of carbon deposition is assumed to be inhibited, the conversion rate
drops within the first two hours time on stream from initially 50% to about 35% but stays
constant for the next 4 hours.26
It is well known that carbonaceous species tend to form at step sites of metal
surfaces,73,248,252-255
which in return may lead to the inhibition of catalytic reactions.248,252-254
In the particular case of Ru-catalyzed reactions, TPD (temperature programmed desorption)
experiments have demonstrated that C atoms at steps suppress the scission of carbon
monoxide,248,253
which is kinetically accessible only at step sites.219,248,253
However, carbon
depositions do not generally lead to a reduced catalytic activity; for instance, the
hydrogenation of olefins on Pd benefits from the presence carbon depositions.256,257
The
assumption that an elevated H2 pressure can reduce carbon deposition is supported by
experimental studies which report that Ni or Ru based catalysts can be regenerated with H2,
once they are deactivated due to coke formation.251,258
6.4. Conclusions
This computational study provides substantial new insight into the mechanism of the Ru-
catalyzed HDO of guaiacol. It was shown that the reactions at the aliphatic side groups (OH,
methoxy) of guaiacol follow similar patterns as the reactions of ethanol studied in Chapter 5.
Also for guaiacol, the dehydrogenation at the aliphatic carbon activates the Calkyl-O bond, so
that its scission becomes kinetically easily accessible. This rationalizes the formation of
catechol as an experimentally observed intermediate of guaiacol HDO on Ru.26,27
A very
recent work139
has shown that the formation of catechol in guaiacol HDO over Pt28,29,111,116,117
follows a comparable reaction pattern.139
It was further shown that the overall kinetics of the Ru-catalyzed guaiacol HDO is
determined by the cleavage of the Caryl-O bonds, in particular the C-O scission of the
intermediates catecholate and phenolate. The calculations modeling the crucial C-O scission
reaction at terrace sites and at step sites demonstrated that the reaction of catecholate may
occur on terrace sites and at step sites. At variance, the C-O scission of phenolate is only
kinetically accessible at steps.
Based on this new insight, this study provides a rationalization for the experimentally
observed H2 pressure dependency of the product selectivity of guaiacol HDO where the
elevated H2 pressure is crucial for the availability of step sites that otherwise are poisoned at

Chapter 6. Hydrodeoxygenation of Guaiacol over Ru
93
low H2 pressure. In other words, at low H2 pressure, the reaction can only occur at terrace
sites where the catecholate C-O scission is associated with a barrier of 106 kJ mol–1
whereas
the cleavage of the phenolate C-O bond, ultimately leading to the formation of benzene, is
hindered due to a high barrier of 185 kJ mol–1
. At variance, under elevated H2 pressure, the
HDO reaction can also occur at step sites which allows the C-O scission of both catecholate
and phenolate to proceed with decreased barriers of 76 kJ mol–1
and 77 kJ mol–1
, respectively.
Of course, this interpretation is merely a hypothesis based on computational results. A
confirmation by new experiments is highly desirable, e.g., by experiments that address the
reaction on Ru single crystals with clearly defined surface structures, whose steps sites can
selectively be blocked by thermal decomposition of deposited ethylene or CO.248,253


95
Chapter 7 Benchmark of DFT Strategies to Address van der Waals Interactions in Zeolites
7.1. Introduction
As mentioned in Chapter 1, zeolites are of eminent importance for various technical
applications,30,31
e.g., as catalyst for the conversion of methanol or ethanol to hydrocarbons as
outlined in Section 2.3. Therefore, zeolites and their chemical properties have been the
subject of many studies applying quantum chemical methods and models.14,259
There are
some specific issues that need to be accounted for when modeling zeolites. One issue is the
correct description of the zeolite framework and its structural and electronic properties. The
other and more challenging issue is the reasonable treatment of van der Waals (vdW)
interactions between the zeolite framework and the adsorbates, which are incorrectly
described by standard semi-local exchange-correlation functionals.48
A possible DFT-based
approach for reliably describing vdW interactions in zeolites is the hybrid MP2:DFT
approach proposed by Sauer and co-workers.37,40
In this approach, one evaluates the
difference between the MP2 energy and the DFT energy for zeolite cluster models of varying
sizes. Those energy differences are then extrapolated to clusters of infinite size and
transferred as a reliable correction to the DFT energy calculated for a periodic model.37
However, this method is computationally very demanding which limits its applicability as a
routine method. A more economic alternative is to use QM/MM (quantum
mechanics/molecular mechanics) methods in which only the reactive center is represented by
quantum mechanical methods, while its surrounding is described by a force field that ideally
accounts for vdW interactions. A QM/MM method that features periodic boundary conditions
is the QM-Pot method;260,261
it will be addressed in the discussion of the present chapter.
Many other QM/MM methods have been developed for cluster model calculations, e.g., the
ONIOM method („our own n-layered integrated molecular orbital and molecular
mechanics“)262
or the covEPE scheme (covalent elastic polarizable environment).263
Also

Chapter 7. Benchmark of DFT Strategies to Address van der Waals Interactions in Zeolites
96
these methods have been successfully applied for investigating various processes in
zeolites.264-267
This chapter follows the presentation of Ref 268 where a benchmark study was carried
out on the performance of selected DFT-based computational methods for weak interactions
of various adsorbates in zeolites cavities. This work examined how well adsorption processes
are described in H-ZSM5 and Silicalite, both zeolites of MFI structure type. In this study, a
3D periodical model is used to evaluate the adsorption energies of alkanes, alcohols, and
water at the PBE-D249
level and with the vdW-DF2 functional.50
As addressed in the methods
section in Section 3.1, the PBE-D2 approach is a special case of the DFT-D2 scheme that
accounts for vdW interactions by adding an empirical correction term to the energy at the
PBE-DFT level.49
At variance, vdW-DF2 denotes an exchange-correlation functional with a
non-local correlation part that does not employ empirical parameters.50
As vdW interactions
are known to play an important role in adsorption processes in zeolites,32-35,37-45
the
comparison of calculated adsorption energies with experimental data32-36
allows one to judge
how well the explored methods describe the vdW interactions.
Several studies have been reported in which adsorption energies for zeolite systems have
been evaluated using the DFT-D approach,39-44,46,47
i.e. the DFT-D2 method or its more
refined variant referred as “DFT-D3”.269
Cluster models and periodic models have been
applied to study the adsorption of water,40,41,43,44
alcohols,40,41,43,44
nitriles,44
olefins,39,40,42
aromatics,42
and alkanes46,47
in zeolites. However, no work has systematically compared the
interactions of alkanes as alcohols as done in this work. At variance with DFT-D, the
vdW-DF2 functional is not yet a routine method for modeling adsorbates in zeolites.
7.2. Results and Discussion
This study reports the computed adsorption energies for a set of test molecules, for which
experimental data are available: C3 to C6 n-alkanes, water, and primary C1 to C3 alcohols. The
resulting adsorption complexes will be illustrated with the cluster extracts as shown in Figure
34. The following discussion starts with the calculated adsorption energies Eads obtained with
the PBE-D2 approach. Recall that the PBE-D2 approach allows a straightforward analysis of
the dispersive interaction, as mentioned in Section 3.1. The additive correction, the D2 term,
in the energies at PBE-D2 level can be interpreted as the energy contribution arising from the
vdW interactions. Subsequently, the results calculated with the vdW-DF2 functional will be
discussed. The experimental works this study refers to report adsorption enthalpies
Hads,32-36
whereas the calculations of this work yield adsorption energies Eads. Formally, the
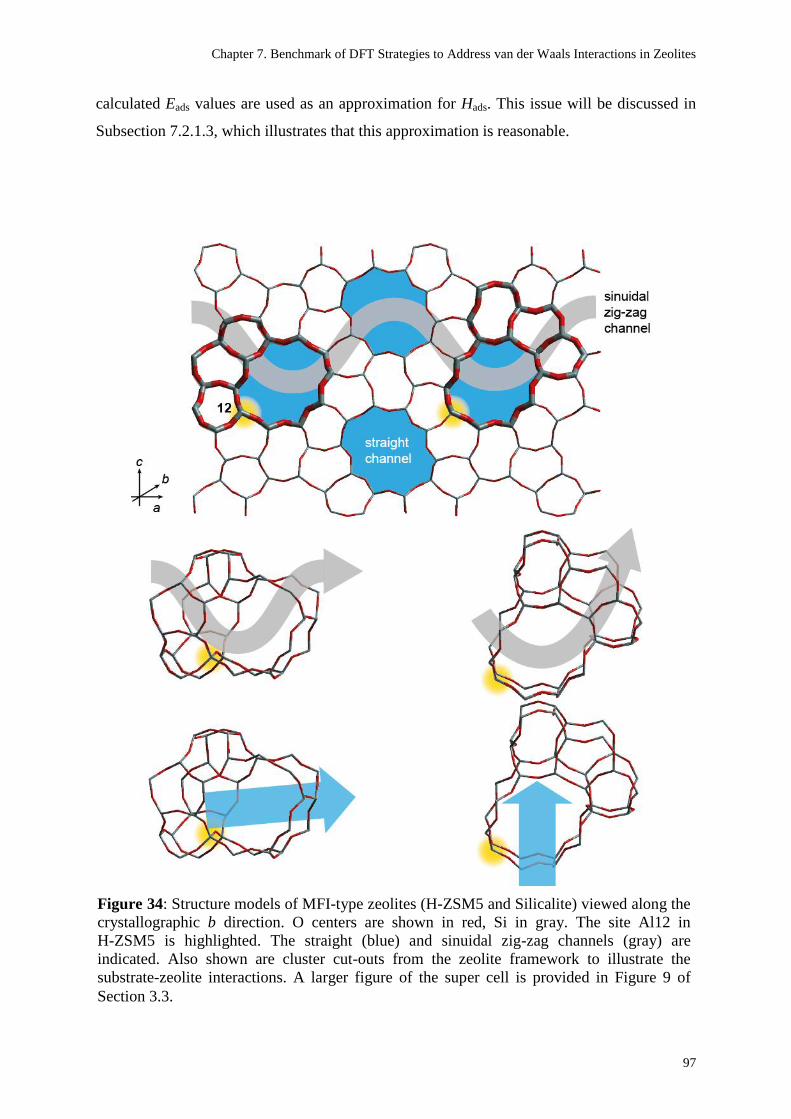
Chapter 7. Benchmark of DFT Strategies to Address van der Waals Interactions in Zeolites
97
calculated Eads values are used as an approximation for Hads. This issue will be discussed in
Subsection 7.2.1.3, which illustrates that this approximation is reasonable.
Figure 34: Structure models of MFI-type zeolites (H-ZSM5 and Silicalite) viewed along the
crystallographic b direction. O centers are shown in red, Si in gray. The site Al12 in
H-ZSM5 is highlighted. The straight (blue) and sinuidal zig-zag channels (gray) are
indicated. Also shown are cluster cut-outs from the zeolite framework to illustrate the
substrate-zeolite interactions. A larger figure of the super cell is provided in Figure 9 of
Section 3.3.

Chapter 7. Benchmark of DFT Strategies to Address van der Waals Interactions in Zeolites
98
7.2.1. Adsorption Energies from PBE-D2 Calculations
7.2.1.1. Adsorption of Alkanes
Two types of adsorption geometries have been considered for each alkane in MFI type
zeolites: the “S conformation” and the “Z conformation”, in which the alkane is oriented
along a straight channel and along a sinuidal zig-zag channel, respectively (Figure 35). The
calculated value Eads of propane in the straight channel of Silicalite, -43 kJ mol–1
, agrees well
with the experimental result,36
-38 kJ mol–1
(Table 9 and Figure 36a). Similar agreement
between theory and experiment is also found for n-hexane in S conformation. The calculated
and the experimental32
results for the adsorption energy / enthalpy are -75 kJ mol–1
and
-72 kJ mol–1
, respectively. Experimental data for n-butane and n-pentane adsorption in
Silicalite are not available. The calculated results for the S conformers agree quite well with
the available experimental data. The adsorption of all alkanes under study is calculated to be
more exothermic in the zig-zag channel (Z conformation). The differences in Eads for the two
conformers are between 5 kJ mol–1
and 24 kJ mol–1
. Therefore, the adsorption energies
calculated for the most stable adsorption position of each alkane overestimate the
experimental values by more than 20 kJ mol–1
(Table 9 and Figure 36a). It is unlikely that the
discrepancy between theory and experiment is due to differences in coverage, as experiments
have demonstrated that the adsorption enthalpies for alkanes in both Silicalite and H-ZSM5
are independent of the coverage.32,33
The calculated Eads values for alkanes in H-ZSM5 are very similar to those in Silicalite,
consistent with the experimental finding (cf. ∆Eads in Table 9 and Eads in Table 10). The
largest difference ∆Eads (in absolute terms) between calculated Eads for the same adsorbate in
the two zeolites is about 10 kJ mol–1
. This difference has been determined for propane in Z
conformation and n-butane in S and Z conformation. For propane and n-butane in Z
conformation, the adsorption in H-ZSM5 is slightly more favored, the difference is mainly
related to the difference in the PBE contributions Eads,PBE to the adsorption energies. On the
other hand, butane oriented along the straight channel (S conformation) is more stable in
Silicalite than in H-ZSM5, which is mainly related to a change in the dispersion part Eads,D2 of
the calculated adsorption energy.
As shown in Table 10, two sets of experimental data have been reported for the
adsorption enthalpies of C3 to C6 n-alkanes in H-ZSM5; corresponding values in the two sets
differ by 5–10 kJ mol–1
.32,33,35
The adsorption energies calculated at the PBE-D2 level
overestimate the results of the earlier experiment32,33
by 17−25 kJ mol–1
. The discrepancy to

Chapter 7. Benchmark of DFT Strategies to Address van der Waals Interactions in Zeolites
99
Figure 35: Sketches of adsorption complexes of n-hexane in Silicalite and H-ZSM5 in S and
Z conformation. Structures are optimized at PBE-D2 level. Selected interatomic distances
are shown in pm. The zeolite framework is represented as sticks, hexane is displayed in a
ball-and-stick representation. Black: C, white: H. Al sites of the zeolite highlighted in
yellow.
Table 9: Comparison of experimentally determined adsorption enthalpies Hads with
calculated adsorption energies Eads for n-alkanes in Silicalite (kJ mol–1
).a
Conformationb Hads Eads
c ΔEads
c
Exp. vdW-DF2 PBE-D2 PBE D2 vdW-DF2 PBE-D2
propane S -38d -50 -43 10 -53 -5 -2
Z -75 -59 2 -62 8 -9
butane S -69 -68 -3 -64 0 10
Z -82 -73 6 -79 3 -10
pentane S -83 -69 9 -78 8 1
Z -105 -85 19 -103 7 -6
hexane S -72e -109 -78 21 -98 -6 2
Z -112 -102 23 -125 -5 -2
a Eads,PBE and Eads,D2 denote the two contributions of the adsorption energy calculated at the
PBE-D2 level. ΔEads is the difference between adsorption energies in H-ZSM5 and in
Silicalite: ΔEads = Eads(H-ZSM5) - Eads(Silicalite). b Adsorbates oriented along a straight
(S) and a sinuidal zig-zag (Z) channel. c This work.
d Ref 36, T = 273–232 K.
e Ref 32,
T = 373 K.

Chapter 7. Benchmark of DFT Strategies to Address van der Waals Interactions in Zeolites
100
the more recent measurements35
is even larger, 25−32 kJ mol–1
. Similarly to the situation in
Silicalite, Eads evaluated for alkanes in the thermodynamically less favored straight channels
of H-ZSM5 agree very well, within 0−7 kJ mol–1
, with the reference of the earlier
experiment.32,33
These results suggest that the DFT-D2 method tends to overestimate the exothermicity of
alkane adsorption in zeolites. A similar trend has previously been reported for the adsorption
of olefinic and aromatic species in both all-Si and Al-substituted zeolites.39,42
Interestingly,
adsorption energies obtained with the QM-Pot method mentioned in Section 7.1 also
Figure 36: Calculated values Eads for various adsorbates in Silicalite and in H-ZSM5: a)
n-alkanes in Silicalite b) n-alkanes in H-ZSM5 c) alcohols and water in Silicalite d) alcohols
and water in H-ZSM5. Results for adsorption complexes with the adsorbate in Z
conformation are marked by continuous lines; those in S conformation are marked by
dashed lines. Experimental adsorption enthalpies are shown where available. a
Ref 36. b Ref
32. c Ref 35.
d Ref 33.
e Ref 34.

Chapter 7. Benchmark of DFT Strategies to Address van der Waals Interactions in Zeolites
101
overestimate the experimental data, but agree well with the results of the present study.35
The
differences between Eads for adsorption complexes in Z conformation calculated at the
QM-Pot level and the corresponding values at PBE-D2 level are at most 5 kJ mol–1
.35
A
theoretical study addressing the cracking of alkanes in H-ZSM5 reported adsorption energies
for alkanes in the sinuidal zig-zag channel, obtained from periodic DFT calculations at the
PBE-D2 level.46
Although those methods46
differ only in minor ways from the method used
in the present work, the reported adsorption energies46
are by 11 kJ mol–1
to 20 kJ mol–1
less
exothermic than the results of the current study (Table 10). In fact, the results of these
previous PBE-D2 calculations46
agree better with experiment than the values of the present
work. However, the geometries of the adsorption complexes reported in Ref 46 show some
differences to the structures optimized for this thesis; the alkane moieties are located closer to
the spacious area at the channel intersection.46
In light of the results of the present study, it
seems reasonable to assume that those earlier geometries46
do not represent the most stable
minimum structures.
The interaction of alkanes with the lattice of both Silicalite (Table 9) and H-ZSM5
(Table 10) is dominated by the dispersion contribution Eads,D2, which amounts to more than
90% of the total adsorption energy Eads,PBE-D2 at the PBE-D2 level. The PBE contribution
Eads,PBE is typically thermo-neutral or endothermic and becomes more endothermic with
increasing size of the alkane.
The structures of the alkane adsorption complexes in Silicalite and H-ZSM5 are
Table 10: Comparison of experimentally determined adsorption enthalpies Hads with
calculated adsorption energies Eads for n-alkanes in H-ZSM5 (kJ mol–1
).a
Conformationb Hads Eads Eads
c
Exp.d Exp.
e QM-Pot
f PBE-D2
g vdW-DF2 PBE-D2 PBE D2
propane S -41 -46±1 -52 -55 -46 -3 -43
Z -63 -48 -67 -68 -8 -61
butane S -52 -58±1 -65 -69 -58 -2 -56
Z -84 -63 -87 -83 -4 -79
pentane S -63 -70±1 -85 -80 -69 4 -74
Z -96 -80 -97 -91 10 -101
hexane S -72 -82±1 -101 -92 -75 17 -93
Z -106 -92 -118 -104 22 -126
a Eads,PBE and Eads,D2 denote the two contributions of the adsorption energy calculated at the
PBE-D2 level. b Adsorbates oriented along a straight (S) and a sinuidal zig-zag (Z)
channel. c This work.
d Ref 35, T = 301–400 K, Si/Al = 35.
e Refs 32 and 33, T = 323 K,
Si/Al = 35. f Ref 35, periodical model.
g Ref 46, periodical model.

Chapter 7. Benchmark of DFT Strategies to Address van der Waals Interactions in Zeolites
102
illustrated on the example of n-hexane, the largest alkane under study (Figure 35). The closest
distances from a hydrogen atom of an alkane Halkane to an oxygen center of the zeolite
framework Ozeo is 238 pm for alkanes in Silicalite and 231 pm in H-ZSM5. These Ozeo-Halkane
distances, both determined for hexane located in the straight channel, are substantially shorter
than the sum of the van der Waals radii of O and H, 272 pm.270
The shortest Ozeo-Halkane
distances determined for the adsorption complexes formed by the smaller alkanes under study
are in the range 249–276 pm, i.e. also smaller than or comparable to the sum of the van der
Waals radii of O and H. Not unexpectedly, for the majority of the studied alkane adsorption
complexes in the straight channel of H-ZSM5, the shortest Ozeo-Halkane distance involves an O
center bound to an Al center.
Figure 37: Sketches of the adsorption complexes of water and 1-propanol in Silicalite and
H-ZSM5. Structures are optimized at the PBE-D2 level. Selected interatomic distances are
shown in pm. The zeolite framework is represented as sticks, the adsorbates are displayed in
a ball-and-stick representation. Black: C, red: O, white: H. Al sites of the zeolite highlighted
in yellow.

Chapter 7. Benchmark of DFT Strategies to Address van der Waals Interactions in Zeolites
103
7.2.1.2. Adsorption of Alcohols and Water
The calculated adsorption energy for a single water molecule in Silicalite (Table 11 and
Figure 37a), -38 kJ mol–1
, and in H-ZSM5 zeolite (Table 12 and Figure 37c), -93 kJ mol–1
,
agree with the experiment within the corresponding error margins, -30±15 kJ mol–1
and
-90±10 kJ mol–1
.34
The relatively large experimental error for the adsorption in Silicalite was
rationalized by the formation of water clusters inside the zeolite.34
This is consistent with the
adsorption energy calculated for a water dimer in Silicalite (Table 12 and Figure 37b), which
is found to be slightly more exothermic than the value for a single adsorbed water,
-43 kJ mol–1
per adsorbed water molecule; also this result agrees, within the corresponding
error margin, with the experiment.
The computed adsorption energies for methanol, ethanol and 1-propanol in the straight
channel of Silicalite (“S conformation”, see the structure of 1-propanol in Figure 37d) are
generally by 10−20 kJ mol–1
less exothermic than the corresponding experimental values
(Table 11). However, similarly to the situation for alkanes and the results of a previous
computational study on alcohol adsorption,41
the calculations indicate that alcohols in the zig-
zag channel of the zeolite (“Z conformation”, Figure 37e) are by about 20 kJ mol–1
more
stable than the corresponding adsorption complexes in S conformation. Thus, the computed
Eads values for alcohols in the more favored zig-zag channels of Silicalite agree well with the
Table 11: Comparison of experimentally determined adsorption enthalpies Hads with
calculated adsorption energies Eads for water and alcohols in Silicalite (kJ mol–1
).a
Conf.b Hads
c Eads
d Eads
e ΔEads
e
Exp. PBE-D2 vdW-DF2 PBE-D2 PBE D2 vdW-DF2 PBE-D2
water -30±15 -32 -38 -11 -26 -40 -55
dimer -43 -18 -25
methanol S -65±10 -33 -46 -46 -9 -37
Z -42 -48 -66 -22 -44 -47 -52
ethanol S -70±10 -43 -60 -58 -14 -44
Z -55 -65 -81 -20 -61 -50 -55
dimer -77 -25 -53
1-propanol S -90±10 -57 -71 -73 -15 -58
Z -69 -93 -93 -11 -82 -53 -58
dimer -81 -13 -68
a Eads,PBE and Eads,D2 denote the two contributions of the adsorption energy calculated at the
PBE-D2 level. ΔEads is the difference between adsorption energies in H-ZSM5 and in
Silicalite: ΔEads = Eads(H-ZSM5) - Eads(Silicalite). b Adsorbates oriented along a straight
(S) and sinuidal a zig-zag (Z) channel and as water / alcohol dimer. c Ref 34, T = 350 K.
d Ref 41, periodical model.
e This work.

Chapter 7. Benchmark of DFT Strategies to Address van der Waals Interactions in Zeolites
104
experiments.34
The difference between theory at the PBE-D2 level and experiment is only
1 kJ mol–1
for methanol, 11 kJ mol–1
for ethanol, and 3 kJ mol–1
for 1-propanol, i.e. below or
comparable to the experimental error of ±10 kJ mol–1
(Table 11).34
In analogy to the water
dimer, the formation of alcohol dimers in Silicalite has also been considered for ethanol and
1-propanol (Figure 37f). The Eads value per adsorbate molecule is calculated to be slightly
less exothermic, at most by 12 kJ mol–1
, than the corresponding value for the adsorption
complexes in Z conformation (Table 11). Also here, the difference between the adsorption
energies (per adsorbate molecule) for an adsorbed alcohol dimer and a single alcohol
molecule in Z conformation is comparable to the experimental error, indicating that the
alcohols may form dimers in Silicalite.
In the most stable geometry of the studied alcohol molecules in H-ZSM5 (Table 12,
Figure 37h), the hydrocarbon chains of the alcohols point to the zig-zag channel (“Z
conformation”), while the hydroxyl group of the alcohols simultaneously acts as proton
acceptor for the proton of the zeolite OH group at the Al12-O-Si12' site and as proton donor
for an oxygen center of the zeolite framework. Eads values calculated at the PBE-D2 level for
these adsorption complexes agree well with the reported experimental Hads values;34
the
differences are at most 6 kJ mol–1
, i.e., comparable to experimental uncertainty (Table 12).
The alcohol molecules in H-ZSM5 can also adsorb with the carbon moiety oriented towards
the straight channel (S conformation). These structures are calculated to be by 16–19 kJ mol–1
less stable than their isomers in Z conformation. The adsorption energies computed in this
Table 12: Comparison of experimentally determined adsorption enthalpies Hads with
calculated adsorption energies Eads for alkanes in H-ZSM5 (kJ mol–1
).a
Conformationb Hads Eads
c Eads
d
Exp.e PBE-D2
f PBE-D2 vdW-DF2 PBE-D2 PBE D2
water -90 ± 10 -87 -72 -93 -75 -18
methanol S -115 ± 5 -108 -113 -89 -102 -70 -32
Z -116 -95 -118 -82 -36
ethanol S -130 ± 5 -124 -125 -110 -117 -71 -47
Z -132 -115 -135 -78 -58
1-propanol S -145 ± 5 -140 -135 -115 -131 -70 -61
Z -147 -133 -151 -72 -78
a Eads,PBE and Eads,D2 denote the two contributions of the adsorption energy calculated at the
PBE-D2 level. b Adsorbates oriented along a straight (S) and a sinuidal zig-zag (Z) channel.
c Ref 41, periodical model.
d This work.
e Ref 34, T = 400 K, Si/Al =25 (estimated from Al
bulk content of 630 μmol/g). f Ref 44, cluster model, T = 400 K.

Chapter 7. Benchmark of DFT Strategies to Address van der Waals Interactions in Zeolites
105
study are in good agreement with data obtained from earlier calculations using a periodical
model and the same method, PBE-D2.40,41,44
The formation of hydrogen bonds by adsorbed alcohols and water is reflected in the
density functional term Eads,PBE of the calculated adsorption energies Eads,PBE-D2 (Table 11 and
Table 12). For adsorption complexes in H-ZSM5, the pure DFT contribution is significant,
from -70 kJ mol–1
to -81 kJ mol–1
; in most cases it represents the dominating term of
Eads,PBE-D2. In Silicalite, where framework OH groups are missing, the values of Eads,PBE are
significantly less exothermic, ranging from -9 kJ mol–1
to -25 kJ mol–1
. The Eads,PBE
contributions for alcohol and water molecules in Silicalite and H-ZSM5 can be considered as
independent of the size of the adsorbate; at variance, Eads,D2, the empirical dispersion term,
increases notably with the size of the adsorbate. For the largest alcohol molecule under study,
1-propanol, Eads,D2 is even slightly more exothermic than Eads,PBE, -78 kJ mol–1
vs.
-72 kJ mol–1
, taking the values calculated for the H-ZSM5 adsorption complex in the most
stable Z configuration.
In the less stable S conformers of the adsorption complexes formed by methanol, ethanol
and 1-propanol in H-ZSM5 (Figure 37g), the alcohol OH group interacts with the zeolite
proton Hzeo at the Al12-O-Si12' site. In these structures, the oxygen center of the alcohol
Oalcohol is bound via a hydrogen bond to the OH group of the zeolite, with Oalcohol-Hzeo
distances of 135−140 pm. These bonds are quite a bit longer than the Ozeo-Hzeo distances
within the bridging hydroxyl groups of the zeolite framework, 109−111 pm. The difference
between these two types of O-H distances decreases with the size of the alcohol molecule,
from 31 pm (for methanol) to 24 pm (for 1-propanol), consistent with the higher proton
affinity of heavier alcohols.41
In the adsorption complexes in S conformation, the proton
Halcohol of the alcohol hydroxyl group does not interact with the zeolite framework.
In the more stable Z conformation for alcohols in H-ZSM5, exemplarily depicted for
1-propanol in Figure 37g, the alcohol OH group is protonated by the zeolite’s acidic hydroxyl
group, as indicated by the Oalcohol-Hzeo distances of 102−103 pm. These distances are shorter
than the corresponding Ozeo-Hzeo distances of 164−166 pm, which shows that the proton Hzeo
has been transferred from the zeolite to the alcohol. The proton of the alcohol hydroxyl group
Halcohol interacts with a further Ozeo center adjacent to Al12 with Ozeo-Halcohol distances of
127−139 pm, which are significantly longer than the Oalcohol-Halcohol bonds, 111−117 pm.
Thus, the adsorption complexes in Z conformation represent a positively charged
alkyloxonium ion that interacts with a deprotonated, negatively charged Al-O-Si moiety

Chapter 7. Benchmark of DFT Strategies to Address van der Waals Interactions in Zeolites
106
originating from the bridging hydroxyl group at Al12-O-Si12'.
7.2.1.3. Comparison of Adsorption Enthalpies and Adsorption Energies
As mentioned previously, the computed data presented in this work are adsorption energies
Eads derived from electronic energies. Technically speaking, it is not correct to compare those
values with the experimentally determined adsorption enthalpies Hads, as the energies Eads
Figure 38: Enthalpy values Hads calculated at the PBE-D2 level for selected systems at
various temperatures (black crosses). For comparison, the experimental values are shown in
red. Experimental errors are given where available. The dashed black line denotes the
calculated adsorption energy Eads. See Table 13 for the numerical results.

Chapter 7. Benchmark of DFT Strategies to Address van der Waals Interactions in Zeolites
107
neglect the contribution of the internal energy to Hads. However, both computational and
experimental methods are associated with uncertainties. As long as the contribution of the
internal energy is not significantly larger than the uncertainties of the methods, Hads can be
approximated by Eads as done in the present work.
To estimate the contribution of the internal energy, Hads has been evaluated
computationally for the Z conformers of the adsorption complexes of water, 1-propanol and
n-hexane in Silicalite and H-ZSM5 (Table 13 and Figure 38). The adsorption enthalpies have
been evaluated for temperatures T between 0 K and 500 K, a range that covers all
temperatures considered in the corresponding experiments.32-35
In case of the oxygen containing adsorbates, water and 1-propanol, the difference
between calculated Hads at experimental T and Eads is slightly smaller than the experimental
uncertainty, < 10 kJ mol–1
. This justifies the exclusive focus on Eads in this study. As visible
from Figure 38 the calculated enthalpy results agree slightly better with the experiment than
the straightforwardly calculated energies.
In the case of the n-hexane adsorption complexes, the difference between computed Hads
(at the temperature of the experiment) and Eads is 11 kJ mol–1
in Silicalite and 7 kJ mol–1
in
H-ZSM5. The differences are comparable to the values calculated for water and 1-propanol,
but larger than the experimental uncertainty of 1 kJ mol–1
.32,33
Also in the case of n-hexane
adsorption complexes, the experimental Hads is closer to the calculated Hads than to Eads.
However, neglecting the thermal corrections is not likely to be the main reason for the poor
agreement between experiment and theory at PBE-D2 level. As shown in Figure 38, the Hads
Table 13: Comparison of the calculated adsorption energies with calculated and
experimentally determined adsorption enthalpies (kJ mol–1
) at temperature T (K).a
Zeolite Adsorbate Conformationb Eads Hads T
PBE-D2 PBE-D2 Exp
Silicalite water -38 -28 -30 ± 15c 350
c
1-propanol Z -93 -84 -90 ± 10c 350
c
n-hexane Z -102 -91 -72 ± 1d 373
d
H-ZSM5 water -93 -90 -90 ± 10c 400
c
1-propanol Z -151 -148 -145 ± 5c 400
c
n-hexane Z -104 -97 -82 ± 1e 323
e
-97 -96 -72f 301 – 400
f
a Calculated values evaluated at PBE-D2 level.
b Adsorbates oriented along the sinuidal
zig-zag (Z) channel. c Ref 34.
d Ref 32.
e Refs 32 and 33.
f Ref 35.

Chapter 7. Benchmark of DFT Strategies to Address van der Waals Interactions in Zeolites
108
values calculated for adsorption complexes of n-hexane are still by 15–19 kJ mol–1
more
exothermic than the experimental reference.32,33,35
Thus, also in the case of the alkane
adsorption complexes, the discussion of calculated Eads results instead of Hads values does not
bias the interpretation of the results.
7.2.2. Adsorption Energies from vdW-DF2 Calculations
As the non-local correlation functional of type vdW-DF2196
is designed to account also for
vdW interactions, the adsorption energies have also been evaluated with this functional using
the same model and otherwise the same computational procedure as described for the
calculations with the PBE-D2 method. Where necessary, the adsorption energies at the
vdW-DF2 level will be referred as Eads,vdW-DF2 in order to distinguish them from the results at
the PBE-D2 level, Eads,PBE-D2.
7.2.2.1. Adsorption of Alkanes
This section will start with the adsorption complexes formed by n-alkanes in Silicalite.
Eads,vdW-DF2 = -75 kJ mol–1
has been calculated for the propane complex in Z conformation,
i.e. the computed value is by 37 kJ mol–1
more exothermic than the experiment. The
corresponding values for n-hexane are -112 kJ mol–1
and 40 kJ mol–1
, respectively (Table 9).
For adsorption complexes in S conformation, the value of Eads,vdW-DF2 for propane and
n-hexane are -50 kJ mol–1
and -109 kJ mol–1
, respectively. Thus, similarly to the PBE-D2
approach, the alkane-zeolite interaction of propane and n-hexane oriented along the straight
channel (S conformation) is calculated to be weaker than for the isomers in Z conformation
(Table 9). Different from the results at the PBE-D2 level, even the less exothermic
Eads,vdW-DF2 values associated with the adsorption complexes in S conformation overestimate
the measured exothermicity.32,36
The vdW-DF2 results for the interaction of n-alkanes with H-ZSM5 (Table 10) also
overestimate the exothermicity of the adsorption processes when the most stable adsorption
complexes in Z conformation are considered. The overestimation ranges from 26 kJ mol–1
to
46 kJ mol–1
or 21 kJ mol–1
to 36 kJ mol–1
, depending on the experimental reference.32,33,35
Eads,vdW-DF2 values for n-alkanes oriented along the straight channel (S conformation) are by
12−26 kJ mol–1
less exothermic than those in the zig-zag channel (Z conformation). In
general, the difference between theory an experiment increases with the size of the molecule
(Figure 36b). Similar to the situation in Silicalite, the Eads,vdW-DF2 values calculated for both
the Z conformers and the S conformers of the alkane adsorption complexes in H-ZSM5 are
more exothermic than the experimental reference. Comparable to the results at PBE-D2 level,

Chapter 7. Benchmark of DFT Strategies to Address van der Waals Interactions in Zeolites
109
the Eads,vdW-DF2 associated with the adsorption complexes in S conformation agree better with
the experiment than the values for the complexes in Z conformation do. However, the
differences between Eads,vdW-DF2 for the S conformers and the experimental references32,33
are
about 10 kJ mol–1
at best. Recall that the PBE-D2 results Eads,PBE-D2 for the analog structures
are at most 7 kJ mol–1
less exothermic than the experimentally determined Hads values from
the same references (Refs 32 and 33) as used for assessing the vdW-DF2 results.
7.2.2.2. Adsorption of Alcohols and Water
For most studied oxygen-containing adsorbates in Silicalite, the adsorption energies
calculated at the vdW-DF2 level agree very well with the measured adsorption enthalpies, as
can be seen from Table 11. With the exception of methanol, the differences between
Eads,vdW-DF2 and the experimental data are less than 5 kJ mol–1
, significantly smaller than the
uncertainty of the experiment which is estimated at 10 kJ mol–1
or more.34
Only for methanol,
Eads,vdW-DF2 = -48 kJ mol–1
, the adsorption is calculated noticeably less exothermic than the
corresponding experimental reference, -65±10 kJ mol–1
. The vdW-DF2 adsorption energies
of water and alcohols in H-ZSM5 zeolite (Table 12) are more exothermic, by 12–20 kJ mol–1
,
than the experimental values. The largest deviations are determined for the systems with the
smallest adsorbates, methanol and water.
7.2.3. Comparison of the Two Types of Zeolites
The calculated adsorption energies allow one to determine the differences ΔEads between the
adsorption energies in Silicalite and in H-ZSM5 (Table 10 and Table 12). The difference is
mainly related to the formation of strong hydrogen bonds (especially for water and alcohols)
in H-ZSM5, which contains acidic OH groups. The calculated results for alkanes do not
exhibit a general trend whether adsorption in H-ZSM5 or Silicalite is more exothermic (Table
10). Both at PBE-D2 level and at vdW-DF2 level, the absolute values of ΔEads for alkane
adsorption complexes are 10 kJ mol–1
or smaller (Table 10). In contrast, ΔEads for complexes
formed by water or alcohols are, as expected, significantly larger, 40–53 kJ mol–1
(PBE-D2)
and 52–58 kJ mol–1
(vdW-DF2), in favor of H-ZSM5 (Table 12).
To estimate the contribution of the hydrogen bond in alcohol adsorption complexes to
the overall adsorption energy, Eads values calculated for molecules with the same number of
“heavy” atoms are compared, i.e., ethanol vs. propane as well as 1-propanol vs. n-butane
(Figure 39). In the most stable adsorption geometries, the interaction of H-ZSM5 with an
alcohol of formula CkH2k+1OH (k = 2, 3) is by ~68 kJ mol–1
(PBE-D2) and ~47 kJ mol–1
(vdW-DF2) more exothermic than the interaction between H-ZSM5 and the corresponding

Chapter 7. Benchmark of DFT Strategies to Address van der Waals Interactions in Zeolites
110
alkane of formula Ck+1H2k+4. Analysis of the PBE and D2 contributions shows that the
PBE-D2 approach mainly attributes the difference between the adsorption energies of
alcohols and of alkanes, i.e., the strength of the hydrogen bonds, to the difference in Eads,PBE
(Figure 39). In contrast, for the compared pairs of adsorbates with the same number of
“heavy” atoms, the Eads,D2 contributions do not differ by more than 3 kJ mol–1
.
For the adsorption in Silicalite, the calculations at PBE-D2 level and at vdW-DF2 level
give somewhat different results. The PBE-D2 results indicate a more exothermic adsorption
of the alcohols, by ~20 kJ mol–1
. Similarly to the situation in H-ZSM5, the stronger
exothermicity for the alcohol adsorption is related to the more exothermic Eads,PBE term. At
variance to the PBE-D2 results for adsorption complexes in Silicalite, results obtained with
the vdW-DF2 method do not exhibit a clear trend. The Eads,vdW-DF2 value for n-butane is by
11 kJ mol–1
less exothermic than the corresponding value for 1-propanol. In contrast,
Eads,vdW-DF2 associated with the propane adsorption complex is by 10 kJ mol–1
more
exothermic than the value for the adsorption complex of ethanol. The reason for this is not
fully understood. However, it may be related to the finding that compared to the experiment,
the vdW-DF2 method underestimates the exothermicity of alcohol adsorption while it
Figure 39: Comparison of calculated Eads values for alkane and alcohol molecules with
equal number of heavy (non-H) atoms. The displayed energies refer to the most stable
conformer of each adsorbate in Silicalite and on HZSM-5. The numerical values shown are
the differences [Eads(CkH2k+1OH) - Eads(Ck+1H2k+4)], between Eads calculated for the alcohol
and for the alkane in the same zeolite. The bars and values in red denote the results at the
PBE-D2 level, the hatched area represents the contribution of the dispersive correction
Eads,D2 to Eads,PBE-D2. Note that the dispersive correction Eads,D2 can be larger than Eads,PBE-D2.
The PBE contribution Eads,PBE to Eads,PBE-D2 corresponds to the difference between the
PBE-D2 result and the D2 contribution and is not explicitly marked. The results at the
vdW-DF2 level are shown in black.

Chapter 7. Benchmark of DFT Strategies to Address van der Waals Interactions in Zeolites
111
overestimates the heat of adsorption for alkanes. As a result, Eads,vdW-DF2 for alkanes and for
alcohols in Silicalite come closer than the corresponding Eads,PBE-D2 values do. This may lead
to variations in the order of the Eads,vdW-DF for alkanes and alcohols. Similarly, the difference
in Eads,vdW-DF2 for alcohols and alkanes with the same number of heavy atoms in H-ZSM5 is
also generally smaller than the difference between the corresponding PBE-D2 values.
7.2.4. Analysis of PBE-D2 Adsorption Energies and Comparison with vdW-DF2 Results
As discussed in the preceding Sections 7.2.1 and 7.2.2, both approaches tested to account for
weak interactions in zeolites, either by adding an empirical correction term (PBE-D2), or by a
non-local correlation component of the functional (vdW-DF2), yielded results in acceptable
agreement with experimental adsorption enthalpies of alcohols and water. However,
adsorption energies of n-alkanes in both Silicalite and H-ZSM5 were notably overestimated,
by 17–32 kJ mol–1
(PBE-D2) and 21–46 kJ mol–1
(vdW-DF2). Within the PBE-D2 approach
(Table 9 and Table 10), the exothermic adsorption of alkanes in zeolites is essentially a result
of the dispersion contribution Eads,D2, while the pure DFT contribution Eads,PBE is in most
cases negligible or repulsive. In other words, single-point calculations at the pure PBE level
on the optimized PBE-D2 geometries, would describe the adsorption of alkanes in both
Silicalite and H-ZSM5 as a thermodynamically unfavorable or thermo-neutral process. Only
the adsorption complex of propane in H-ZSM5 in Z conformation displays a small
exothermic contribution from the PBE-DFT energy, Eads,PBE = -8 kJ mol–1
, to the total
adsorption energy Eads,PBE-D2. Yet, even in this case, Eads,PBE is only 11% of Eads,PBE-D2. In
other words, the GGA contribution is mostly repulsive and prevents potential adsorbates to
come too close to the zeolite walls.
To reach a more detailed understanding of the two methods applied for describing the
dispersive interactions between the adsorbate and the zeolite framework, it is worth
examining how Eads,PBE-D2 and its components, Eads,D2 and Eads,PBE, vary when an adsorbate is
moved inside the zeolite. For this purpose, Eads,PBE-D2 values have been evaluated for various
structural arrangements where the adsorbate is shifted by ∆ from its equilibrium position
(Figure 40). The value Eads,PBE-D2 and its components at ∆ = 0 corresponds to the values
shown in Tables 9–12, which had been obtained by geometry optimizations at the PBE-D2
level. When evaluating Eads,PBE-D2 for ∆ ≠ 0, the adsorbate is rigidly moved from the position
in the reference structure (∆ = 0) by ∆ along the c-axis. The zeolite framework (including the
OH groups in HZSM-5) was kept fixed in the positions optimized for ∆ = 0. The analysis as
described above has been done for adsorption complexes of n-hexane in the straight and the

Chapter 7. Benchmark of DFT Strategies to Address van der Waals Interactions in Zeolites
112
zig-zag channels of Silicalite as well as for the adsorption complexes of water and 1-propanol
(S conformation) in H-ZSM5 (Figure 40). The S conformer of 1-propanol in H-ZSM5 is
chosen here instead of the more stable Z conformer, as in the latter structure the zeolite
proton is transferred to the alcohol to form an alkyloxonium ion. In that case, the variation of
the adsorption energy will be affected by the implied charge separation, making an
interpretation of the data less straightforward. For comparison, vdW-DF2 adsorption energies
have also been evaluated in single-point fashion at the same geometries (Figure 40). In other
words, the values Eads,vdW-DF2 at ∆ = 0 do not correspond the values discussed in Section 7.2.2,
as ∆ = 0 refers to the minimum structure optimized at the PBE-D2 level.
Figure 40: Adsorption energies Eads from PBE-D2 (red, solid line) and vdW-DF2
calculations (black) for shifts ∆ of the adsorbate along the crystallographic c-axis away from
the minimum position determined at the PBE-D2 level. Negative values of ∆ indicate a shift
of the adsorbate towards the wall of a channel. The PBE (dotted) and D2 contributions
(dashed) to Eads,PBE-D2 are also shown. Experimental Hads values are indicated. a) n-hexane (S
conformation) in Silicalite, b) n-hexane (Z) in Silicalite, c) water in H-ZSM5, d) 1-propanol
(S) in H-ZSM5.

Chapter 7. Benchmark of DFT Strategies to Address van der Waals Interactions in Zeolites
113
Figures 40a and 40b show the analysis for the largest alkane under study, n-hexane, in
Silicalite. The PBE contribution Eads,PBE is, for both S and Z conformers, always repulsive. At
variance, the dispersion contribution is attractive and remains essentially constant over the
range of ∆ studied. For values |∆| < 40 pm, Eads,D2 varies by at most by 10%. For water and
1-propanol in H-ZSM5 (Figures 40c and 40d), the Eads,D2 contribution also remains
essentially constant in the range of shifts ∆ studied. It is not surprising that the value Eads,D2
for water, about -20 kJ mol–1
, is (in absolute values) relatively small compared to the other
systems under study, where Eads,D2 values are -60 kJ mol–1
or even more exothermic. This is a
direct consequence of the different sizes of the adsorbate molecules. In contrast to n-hexane
in Silicalite, the Eads,PBE contributions for 1-propanol and water in H-ZSM5 are attractive over
a range of ∆ values that vary by more than 200 pm. This behavior is related to the hydrogen
bonds between the zeolite and the adsorbates.
The four adsorption systems in MFI type zeolites displayed in Figure 40 show that the
empirical correction Eads,D2 to the adsorption energy is largely independent of how the
adsorbate is located within a channel. The dispersion term Eads,D2 is a large, quasi constant,
additive correction to the potential energy surface calculated at the PBE level. Note that for
alkanes in Silicalite, whose GGA-DFT contribution to Eads,PBE-D2 is repulsive over the
complete range of ∆, the PBE-D2 approach fails to predict adsorption energies with chemical
accuracy. In contrast, for water and alcohols in H-ZSM5, where Eads,PBE is attractive for a
large range of ∆ values, the Eads,PBE-D2 values agree well with experiment.
For the adsorption systems of n-hexane in Silicalite, the total adsorption energies
calculated with the PBE-D2 and the vdW-DF2 approaches give quite similar results when the
adsorbate molecules are moved in the channel. In other words, the vdW-DF2 functional with
its non-local correlation part yields adsorption energies similar to the result that one gets
when one applies the empirical D2 type dispersion correction to the GGA-PBE functional.
Recall that the PBE-D2 and vdW-DF2 energies reported here are evaluated at the identical
geometries, i.e. for a unit cell size optimized at the PBE-D2 level. In other words, adsorption
energies consistently determined at the vdW-DF2 level may deviate more from the results
consistently determined at the PBE-D2 level.
7.2.5. General Comments
In view of the fact that the dispersion term dominates the attractive interaction in the
adsorption complexes under study, it is worth commenting on its origin. According to the
original parameterization of the DFT-D2 method,49
the Si-C interaction is the strongest of all

Chapter 7. Benchmark of DFT Strategies to Address van der Waals Interactions in Zeolites
114
pair-wise interactions that occur in adsorption complexes of alkanes in Silicalite. This
specific interaction is still significant at large interatomic distances where contributions from
other atom pairs (O-H, O-C, and Si-H) are already negligible. This feature of the DFT-D2
approach is to some extend incompatible with the general perception of the chemistry of
zeolites, where the framework oxygen centers exhibit a large polarizability due to their
partially anionic character. Therefore, the O centers are expected to contribute the strongest
of all elements to the dispersive interactions. In contrast, the polarizability of the silicon
centers, and thus their contribution to dispersive interactions, is expected to be rather limited
in view of their cationic character.259,271
This discrepancy between the DFT-D2
parameterization and the expected chemical behavior of zeolites is not surprising because the
empirical interaction parameters of the DFT-D2 approach are obtained, among others, from
the polarizability α for isolated atomic species,49
a quantity which approximately increases
proportional to the volume of an atom.272
However, it seems necessary to account also for the
“physical” (less than “formal”) charges of the atomic centers within a molecule or solid, to
obtain reliable parameters for the empirical correction. Theoretical studies have demonstrated
that the electrostatic potential in zeolite cavities is best reproduced by O centers with a charge
of 0.6–1.0 e, depending on the level of theory.263,273,274
Auger electron spectroscopy has
demonstrated for such systems that the polarizability (or rather the polarizability volume) of
the O centers, 1.2 Å3, is indeed significantly larger than that of Si centers, 0.38 Å
3.271,275
There are some more elaborate methods to account for dispersive interactions, e.g. the
DFT-D3 variant, recently developed by Grimme and co-workers,269
or a related correction
scheme proposed by Tkatchenko and Scheffler (TS-vdW)276
which accounts for the chemical
environment of a system. It is of interest to know whether such methods allow a more
accurate description of the vdW interactions in zeolites than the DFT-D2 and the vdW-DF2
approaches do. In the context of this thesis, both the DFT-D3 methods (as PBE-D3) and the
TS-vdW method were used to evaluate the adsorption energy for the Z conformer of
n-hexane in Silicalite in single-point fashion using the geometries optimized at the PBE-D2
level. However, results of these two approaches did not improve the PBE-D2 adsorption
energy. Note that within the TS-vdW method the polarizability of the zeolite Si centers is
determined to be larger than the polarizability of zeolite O centers. Seemingly, both the
DFT-D2 approach and the TS-vdW method suffer from a similar issue.
Next, a comment on the overall accuracy of the computational approaches applied in this
study is given. In case of the PBE-D2 method, the failure to deliver results of chemical

Chapter 7. Benchmark of DFT Strategies to Address van der Waals Interactions in Zeolites
115
accuracy for the systems examined may be related to the parameterization procedures used to
generate the empirical inter-atomic interaction parameters.49
The results of the present study
suggest that proper modeling of the adsorption of saturated hydrocarbons in zeolites (as well
as on other silicate surfaces) requires a specific parameterization. However, it is a non-trivial
task to obtain suitable reference values for such a parameterization strategy; currently high-
level multi-reference calculations with sufficiently flexible basis sets for zeolites still require
far too much computational resources and the database of reliable experimental values simply
is not large enough.
At variance with the PBE-D2 approach, the usage of non-local correlation functionals
like vdW-DF2 is a non-empirical approach to address dispersive interactions. Such
functionals have originally been designed to address layered systems, such as graphite,277
and
were later on generalized to all kinds of systems as in the vdW-DF2 variant employed in this
work.196,278
Despite of the claim to address all kinds of chemical systems, the accuracy of the
vdW-DF2 approach was so far mainly assessed for molecular systems.196
The only system
with a porous material considered is the interaction of H2 with aromatic C6 rings in MOFs
(metal organic frameworks), which is not really comparable to the interactions in zeolites. It
seems that the vdW-DF2 approach, despite the claim of universal applicability, has a problem
with silicates, as recent studies report that the exothermicity of the adsorption of methane on
quartz279
as well as of the adsorption of C1 to C3 alkanes in Chabazite280
are also
overestimated. While the vdW-DF2 functional is not able to describe reliably the adsorption
of alkanes in zeolites, one should not necessarily dismiss non-local correlation functionals as
unsuitable for describing zeolites. It seems worthwhile to consider other non-local correlation
functional, e.g. optB88-vdW,50
which are based on an exchange functional that has been
optimized for use in combination with the non-local correlation part.50
One should also keep in mind that the interaction of alkanes (simple but rather unreactive
species) in general is hard to describe. This is also notable from the benchmark calculations
carried out to evaluate the accuracy of the DFT-D2 and the vdW-DF2 methods.49,196
The
DFT-D2 method overestimates the formation energy of a methane dimer by 0.25 kJ mol–1
(or
11%), as judged by the more accurate RI-MP2 results. One may argue that the relative error
is only high as the absolute values of the target quantity are small, only -2.34 kJ mol–1
(DFT-D2) and -2.09 kJ mol–1
(RI-MP2), respectively.49
However, this error increases with the
size of the system. The formation energy of a butane dimer is overestimated even stronger by
the DFT-D2 method, both in absolute and relative terms: 3.89 kJ mol–1
and 32%,49
Chapter 7. Benchmark of DFT Strategies to Address van der Waals Interactions in Zeolites
116
respectively, compared to MP2 results.281
The formation energy of a methane dimer at the
vdW-DF2 level has also been compared to CCSD(T) results.196,282,283
The vdW-DF2 results
overestimate the formation energy by 0.68 kJ mol–1
(30%). These findings are in line with
our results where the exothermic interaction of alkanes with a zeolite wall is generally
overestimated. Recently it has been pointed out that the vdW-DF2 approach as well as the
empiric dispersion correction (in the more recent DFT-D3 fashion) yield binding energies
which deviate on average from the values at the CCSD(T) level by approximately 7% and
12% (in absolute terms), respectively.284
For the special case of pure vdW dominated
interactions, the deviation of the vdW-DF2 values from the CCSD(T) is similar to the general
case, 7%, while the error of the DFT-D3 results is about 15%.284
7.3. Conclusions
The present study addressed the performance of periodic density functional calculations using
a gradient-corrected density functional with empirical dispersion corrections (PBE-D2) and a
non-local correlation functional (vdW-DF2). It has been explored how well the two
approaches describe the adsorption processes of water, alcohols and alkanes in Silicalite and
H-ZSM5. The adsorption energies of water and alcohol molecules calculated at the PBE-D2
level agree in acceptable fashion with the experimental values. In contrast, adsorption
energies of n-alkanes in both the all-Si zeolite and the Al-substituted zeolite were
significantly overestimated, by 21 kJ mol−1
or more.
Analysis of the PBE-D2 results showed that the pure DFT component Eads,PBE and the
empirical dispersion term Eads,D2 give rather different contributions to the total adsorption
energies Eads,PBE-D2. The attractive interaction of alkanes with the zeolite lattice is almost
exclusively due to the empirical dispersion term, whereas the GGA-DFT part is mainly
repulsive, preventing the adsorbates to come too close to the zeolite walls. Adsorption
energies obtained with the vdW-DF2 method are comparable to those of the PBE-D2 method,
with the latter results agreeing slightly better with experiment in most cases.
The two tested approaches reproduce available experimental adsorption enthalpies of
alkanes in Silicalite and H-ZSM5 only in a limited fashion, and certainly not at chemical
accuracy. In consequence, with either of the evaluated methods, modeling of chemical
reactions that involve alkanes and oxygenates in zeolites will result in a systematic over-
stabilization of the deoxygenated species. The PBE-D2 approach may be amenable to more
accurate results if the empirical dispersion correction is based on atomic polarizabilities that
are more adequate for silicates. For the vdW-DF2 approach (or rather the non-local

Chapter 7. Benchmark of DFT Strategies to Address van der Waals Interactions in Zeolites
117
correlation approach), benchmarking of further functionals together with more fundamental
revision and re-evaluation of the method seems necessary to render such functionals useful
for describing chemical transformations in zeolites.


119
Chapter 8 Summary
This thesis addressed the conversion of biomass derived feedstock by heterogeneous catalysis
and related chemical processes. On the one hand periodic DFT calculations at the GGA level
were used to study reaction mechanisms that are involved in the metal-catalyzed processing
of organic oxygenates. On the other hand this thesis also presented a benchmark study to
evaluate how well DFT-based methods such as the DFT-D2 approach and the vdW-DF2
functional are able to describe dispersive interactions, which play an important role for the
chemistry of zeolites and zeolite catalyzed reactions.
The application results of this thesis were presented in four chapters. Chapter 4 dealt
with the alkane formation pathways in the aqueous phase processing of 1-propanol over Pt
and is focused on the effect of Pt step sites on these reactions. The alcohol-hydrogenolysis
pathway, which under neutral conditions is the dominating mechanism of alkane formation, is
only weakly affected by the presence of steps. Both at steps and on terrace sites, the alcohol-
hydrogenolysis mechanism proceeds via the intermediate 1-hydroxypropyl, which is derived
from the dehydrogenation of propanol at C1. The rate-limiting step here is the C-O cleavage
of 1-hydroxypropyl. On a Pt terrace, this step is associated with a barrier of 105 kJ mol–1
. The
presence of steps decreases the barrier only slightly, to 97 kJ mol–1
. The effect of the steps on
the hydrogenation of propylene, which has previously been determined to be the rate-limiting
step of the acidic dehydration-hydrogenation mechanism on Pt(111), has also been
considered. Step sites lower the direct barrier of propylene hydrogenation from 85–97
kJ mol–1
to around 50 kJ mol–1
. However, it is not clear whether the reaction really prefers to
occur at step sites, as the reaction at the steps involves, in contrast to the reaction on terrace
sites, energetically high lying ISs. An explicit modeling of the kinetics may help to solve this
issue. Despite of this open question, the results presented here provide, together with earlier
works, a complete overview over the reaction network of the aqueous phase processing of
1-propanol on Pt. The high selectivity for the reforming pathway on Pt is related to the
kinetically easily accessible dehydrogenation at C1 and at the OH group, which leads to the
formation of propionyl, the key intermediate of the reforming pathway. The complete

Chapter 8. Summary
120
dehydrogenation at the C1-O moiety strengthens the C-O bond, as the single bond in
propanol formally becomes a double bond, which hinders the C-O cleavage required for
alkane formation.
Chapter 5 showed a systematic study of the decomposition of ethanol on the closed-
packed Ru(0001) surface. The C-O cleavage was shown to be both thermodynamically and
kinetically more favored than the analogue reaction on Pt. Therefore, the formation of C-O
bonds, e.g. the OH insertion into surface acyl groups (R-C=O), which is essential for the
aqueous phase processing of alcohols on Pt, are not favored. Despite of these differences
between the reactions on Ru and Pt, the reaction pathways on both metals are not
fundamentally different. Similar to the reactions of 1-propanol on Pt(111), ethanol also
dehydrogenates various times before it ultimately undergoes C-C cleavage. In particular, the
preferred ethanol decomposition pathway on Ru(0001) proceeds via the intermediate ketene
whose C-C bond cleaves with a relatively low barrier of only 38 kJ mol–1
to form carbon
monoxide and methylene on the Ru surface. The highest barrier along this path is calculated
at 77 kJ mol–1
; it is associated with the dehydrogenation at the C1 center of the intermediate
ethoxy. This indicates that the alkanes observed in experiments on the aqueous phase
processing of alcohols over Ru are most likely formed from methylene, CO and surface
hydrogen in a reaction similar to the Fischer-Tropsch process, for which Ru is known to be
catalytic active. The “direct” C-O cleavage without the preceding C-C scission requires the
formation of 1-hydroxyethylidene. This species is associated with a C-O cleavage barrier of
only 33 kJ mol–1
. However, the formation of 1-hydroxyethylidene, the key intermediate for
the direct C-O cleavage pathway, is not favored as the competing undesired dehydrogenation
at the hydroxyl group is a strongly exothermic reaction with an easily accessible barrier of
around 70 kJ mol–1
. At variance, the dehydrogenation of ethanol at C1, which is required for
the formation of 1-hydroxyethylidene, has a higher barrier of 91 kJ mol–1
and thus is less
favored than the dehydrogenation at the OH group.
Having studied the comparably simple system of ethanol on Ru, Chapter 6 addressed the
Ru-catalyzed hydrodeoxygenation of guaiacol. A most likely reaction path was proposed
based on a systematic exploration of the potential energy surface, together with various
alternative kinetically also accessible pathways. The proposed main reaction path proceeds
via the formation of the key intermediates catecholate and phenolate; this finding is
consistent with the experimental detection of catechol and phenol as intermediate products.
The rate-limiting steps of the HDO process are cleavage reactions of the Caryl-O bonds of

Chapter 8. Summary
121
catecholate and phenolate. At terrace sites, only the Caryl-O bond scission of catecholate,
associated with a barrier of 106 kJ mol–1
, can be considered as kinetically accessible. At
variance, the Caryl-O cleavage barrier of 185 kJ mol–1
for phenolate indicates that this reaction
is strongly hindered. The difference in the activation barrier for the reactions of catecholate
and phenolate is related to the strained structure of the catecholate surface complex on the
close-packed Ru surface. At step sites, both Caryl-O cleavage steps are more easily accessible;
they are associated with barriers of only 76 kJ mol–1
and 77 kJ mol–1
, respectively. Based on
the calculated results, this thesis proposed a possible rationalization for the experimental
observation that benzene is only formed under elevated H2 pressure, while
hydrodeoxygenation at reduced H2 pressure mainly yields phenol. The availability of step
sites on the Ru catalyst is likely linked to the H2 pressure, as at high H2 pressure step sites can
be kept free of carbon depositions, which otherwise would poison the only site of a Ru
catalyst that is active in the Caryl-O scission of phenolate.
Chapter 7 focuses on quantum chemical tools to explore catalytic processes, rather than
on the catalytic processes themselves. The performance of the DFT-D2 approach in the PBE-
D2 variant and of the vdW-DF2 functional for representing dispersive interactions in MFI
type zeolites has been evaluated. Both methods describe the adsorption of water and short-
chain, primary alcohols reasonably well. In these systems, the adsorption process is
dominated by the formation of hydrogen bonds between the adsorbate and the zeolite
framework, while the contribution of the dispersive interactions to the adsorption energy is
mostly of minor importance. The differences between theoretically determined adsorption
energies and the experimental references are either smaller or comparable to the uncertainty
of the experiment, which is 5–15 kJ mol–1
. However, both methods under study show the
general tendency to overestimate the exothermicity of alkane adsorption. Discrepancies
between theory and experiment of up to 46 kJ mol−1
demonstrate that “chemical accuracy” is
not reachable for such adsorption interactions, which are dominated by dispersive
interactions. Therefore, in such calculations, unfunctionalized hydrocarbons tend to be over-
stabilized with respect to functionalized species such as oxygenates. This is an important
issue to be kept in mind when one intends to deal with reactions involving both
functionalized and unfunctionalized species like the transformation of ethanol to higher
hydrocarbons.
In summary, this thesis, via its application results, provided new insight into the
mechanistic details of metal-catalyzed transformations of aliphatic and aromatic oxygenates.
Chapter 8. Summary
122
Especially the work on guaiacol hydrodeoxygenation has been one of the first detailed studies
addressing the reaction network of metal-catalyzed hydrodeoxygenation of aromatics. The
usage of stepped surfaces as catalyst models allowed taking into account the effect of the
catalyst surface topology, amending the simplifications of flat surface models which still are
very popular. The method-oriented work, evaluating recently proposed DFT-based methods
for representing dispersive interactions, showed that, despite of notable methodological
progress, a reliable description of reactions in zeolites, e.g. for biomass processing, is still
challenging issue.
123
Appendix: List of Abbreviations
AH alcohol hydrogenolysis
AP aqueous phase
BEP Brønsted-Evans-Polanyi (relation)
CCSD(T) coupled-cluster with singles, doubles and perturbative triples
CN coordination number
covEPE covalent elastic polarizable environment (scheme)263
D2, DFT-D2 Empirical dispersion correction to DFT methods49
D3, DFT-D3 Empirical dispersion correction to DFT methods269
DFT density functional theory
DH dehydration-hydrogenation
DOS density of states
exp experiment
fcc face-centered cubic
FT Fischer-Tropsch (synthesis)
GGA generalized gradient approximation
hcp hexagonal close-packed
HDO hydrodeoxygenation
H-ZSM5 proton form of Zeolite Socony Mobil-5
IS initial state
LEED low-energy electron diffraction
MFI structure type ZSM-five
MOF metal-organic framework
NEB nudged elastic band
ONIOM „our own n-layered integrated molecular orbital and molecular
mechanics“ (method)262
optB88-vdW non-local correlation van der Waals density functional based on the
optimized Becke 88 type exchange functional50

Appendix
124
PAW projector-augmented wave (method)
PBE Perdew-Burke-Ernzerhof type GGA functional191,192
PW91 Perdew-Wang type GGA functional190
QM/MM quantum mechanics/molecular mechanics
RAIRS reflection-absorption infrared spectroscopy
RI-MP2 resolution of identity second-order Møller-Plesset perturbation theory
SCF self-consistent field
Si/Al molar silicon to aluminum ratio in mol/mol
T temperature
TPD temperature programmed desorption
TS transition state
TS-vdW Tkatchenko-Scheffler vdW correction scheme276
VASP Vienna Ab initio Simulation Package
vdW van der Waals
vdW-DF2 non-local correlation van der Waals density functional196
WGS water gas shift

125
References
1. Shafiee, S.; Topal, E., Energ Policy 2009, 37, 181-189.
2. Sorrell, S.; Miller, R.; Bentley, R.; Speirs, J., Energ Policy 2010, 38, 4990-5003.
3. Chapman, I., Energ Policy 2014, 64, 93-101.
4. Hallock Jr, J. L.; Wu, W.; Hall, C. A. S.; Jefferson, M., Energy 2014, 64, 130-153.
5. Miller, R. G.; Sorrell, S. R., Phil Trans R Soc A 2014, 372, 20130179-27.
6. Davis, S. C.; Diegel, S. W.; Boundy, R. G., Transportation Energy Data Book. 33rd ed.;
2014. http://cta.ornl.gov/data/tedb33/Edition33_Full_Doc.pdf (accessed 06.08.2014).
7. Matar, S.; Hatch, L. F., Chemistry of Petrochemical Processes. 2nd ed.; Gulf
Professional Publishing: Houston, Texas, USA, 2000.
8. Stanier, C.; Hutchinson, J., A Sustainable Global Society - How Can Materials
Chemistry Help? - A white paper from the Chemical Sciences and Society Summit
(CS3) 2010 http://www.rsc.org/images/sustainable-global-society-full-report_tcm18-
221431.pdf (accessed 06.08.2014).
9. Bull, T. E., Science 1999, 285, 1209.
10. Serrano-Ruiz, J. C.; Luque, R.; Sepulveda-Escribano, A., Chem Soc Rev 2011, 40,
5266-5281.
11. Bozell, J. J.; Petersen, G. R., Green Chem 2010, 12, 539-554.
12. Chheda, J. N.; Huber, G. W.; Dumesic, J. A., Angew Chem Int Ed 2007, 46, 7164-7183.
13. Greeley, J.; Norskov, J. K.; Mavrikakis, M., Annu Rev Phys Chem 2002, 53, 319-348.
14. Nachtigall, P.; Sauer, J., Chapter 20 Applications of quantum chemical methods in
zeolite science. In Introduction to Zeolite Molecular Sieves, Studies in Surface Science
and Catalysis, Čejka, J.; van Bekkum, H.; Corma, A.; Schüth, F., Eds. Elsevier:
Amsterdam, 2007; Vol. 168, pp 701-736.
15. Nørskov, J. K.; Abild-Pedersen, F.; Studt, F.; Bligaard, T., Proc Natl Acad Sci USA
2011, 108, 937-943.
16. Wawrzetz, A.; Peng, B.; Hrabar, A.; Jentys, A.; Lemonidou, A. A.; Lercher, J. A., J
Catal 2010, 269, 411-420.

References
126
17. Basaran, D.; Genest, A.; Rösch, N., J Catal 2012, 287, 210-213.
18. Başaran, D., Theoretical Studies of Catalytic Transformations of Hydrocarbons over
Transition Metals. PhD Thesis, Technische Universität München, Munich, Germany,
2013.
19. Basaran, D.; Genest, A.; Lercher, J. A.; Rösch, N., ACS Catal 2013, 3, 1730-1738.
20. Chiu, C.-c., Density Functional Studies on Catalysis on Noble Metal Surfaces. Master
Thesis, Technische Universität München, Munich, Germany, 2010.
21. Chiu, C.-c.; Genest, A.; Rösch, N., ChemCatChem 2013, 5, 3299-3308.
22. Davda, R. R.; Shabaker, J. W.; Huber, G. W.; Cortright, R. D.; Dumesic, J. A., Appl
Catal B-Environ 2003, 43, 13-26.
23. Davda, R. R.; Shabaker, J. W.; Huber, G. W.; Cortright, R. D.; Dumesic, J. A., Appl
Catal B-Environ 2005, 56, 171-186.
24. Alonso, D. M.; Bond, J. Q.; Dumesic, J. A., Green Chem 2010, 12, 1493-1513.
25. Guo, N.; Caratzoulas, S.; Doren, D. J.; Sandler, S. I.; Vlachos, D. G., Energy Environ
Sci 2012, 5, 6703-6716.
26. Chang, J.; Danuthai, T.; Dewiyanti, S.; Wang, C.; Borgna, A., ChemCatChem 2013, 5,
3041-3049.
27. Boonyasuwat, S.; Omotoso, T.; Resasco, D. E.; Crossley, S. P., Catal Lett 2013, 143,
783-791.
28. Sun, J.; Karim, A. M.; Zhang, H.; Kovarik, L.; Li, X. S.; Hensley, A. J.; McEwen, J.-S.;
Wang, Y., J Catal 2013, 306, 47-57.
29. Gao, D.; Schweitzer, C.; Hwang, H. T.; Varma, A., Ind Eng Chem Res 2014, 53,18658-
18667.
30. van Bokhoven, J. A., In Ordered Porous Solids Recent Advances and Prospects,
Valtchev, V.; Mintova, S.; Tsapatsis, M., Eds. Elsevier: 2009; pp 651-668.
31. Bellussi, G.; Mizia, F.; Calemma, V.; Pollesel, P.; Millini, R., Micropor Mesopor Mat
2012, 164, 127-134.
32. Eder, F.; Lercher, J. A., Zeolites 1997, 18, 75-81.
33. Eder, F.; Stockenhuber, M.; Lercher, J. A., J Phys Chem B 1997, 101, 5414-5419.
34. Lee, C. C.; Gorte, R. J.; Farneth, W. E., J Phys Chem B 1997, 101, 3811-3817.
35. De Moor, B. A.; Reyniers, M.-F.; Gobin, O. C.; Lercher, J. A.; Marin, G. B., J Phys
Chem C 2011, 115, 1204-1219.
36. Hampson, J. A.; Rees, L. V. C., J Chem Soc Faraday T 1993, 89, 3169-3176.
37. Tuma, C.; Sauer, J., Phys Chem Chem Phys 2006, 8, 3955-3965.

Refereces
127
38. De Moor, B. A.; Reyniers, M.-F.; Sierka, M.; Sauer, J.; Marin, G. B., J Phys Chem C
2008, 112, 11796-11812.
39. Kerber, T.; Sierka, M.; Sauer, J., J Comput Chem 2008, 29, 2088-2097.
40. Svelle, S.; Tuma, C.; Rozanska, X.; Kerber, T.; Sauer, J., J Am Chem Soc 2009, 131,
816-825.
41. Nguyen, C. M.; Reyniers, M.-F.; Marin, G. B., Phys Chem Chem Phys 2010, 12, 9481-
9493.
42. Hansen, N.; Kerber, T.; Sauer, J.; Bell, A. T.; Keil, F. J., J Am Chem Soc 2010, 132,
11525-11538.
43. Nguyen, C. M.; Reyniers, M.-F.; Marin, G. B., J Phys Chem C 2011, 115, 8658-8669.
44. Van der Mynsbrugge, J.; Hemelsoet, K.; Vandichel, M.; Waroquier, M.; Van
Speybroeck, V., J Phys Chem C 2012, 116, 5499-5508.
45. Zazza, C.; Sanna, N.; Rutigliano, M.; Cacciatore, M.; Palma, A., Comp Theor Chem
2011, 967, 191-198.
46. Tranca, D. C.; Hansen, N.; Swisher, J. A.; Smit, B.; Keil, F. J., J Phys Chem C 2012,
116, 23408-23417.
47. Sukrat, K.; Tunega, D.; Aquino, A. J. A.; Lischka, H.; Parasuk, V., Theor Chem Acc
2012, 131, 1-12.
48. Cohen, A. J.; Mori-Sánchez, P.; Yang, W., Chem Rev 2011, 112, 289-320.
49. Grimme, S., J Comput Chem 2006, 27, 1787-1799.
50. Klimeš, J.; Bowler, D. R.; Michaelides, A., Phys Rev B 2011, 83, 195131-13.
51. Ma, F.; Hanna, M. A., Bioresource Technol 1999, 70, 1-15.
52. Cortright, R. D.; Davda, R. R.; Dumesic, J. A., Nature 2002, 418, 964-967.
53. Shabaker, J. W.; Davda, R. R.; Huber, G. W.; Cortright, R. D.; Dumesic, J. A., J Catal
2003, 215, 344-352.
54. Huber, G. W.; Shabaker, J. W.; Dumesic, J. A., Science 2003, 300, 2075-2077.
55. Shabaker, J. W.; Huber, G. W.; Davda, R. R.; Cortright, R. D.; Dumesic, J. A., Catal
Lett 2003, 88, 1-8.
56. Davda, R. R.; Dumesic, J. A., Angew Chem Int Ed 2003, 42, 4068-4071.
57. Shabaker, J. W.; Huber, G. W.; Dumesic, J. A., J Catal 2004, 222, 180-191.
58. Shabaker, J. W.; Simonetti, D. A.; Cortright, R. D.; Dumesic, J. A., J Catal 2005, 231,
67-76.
59. Huber, G. W.; Chheda, J. N.; Barrett, C. J.; Dumesic, J. A., Science 2005, 308, 1446-
1450.

References
128
60. Huber, G. W.; Shabaker, J. W.; Evans, S. T.; Dumesic, J. A., Appl Catal B-Environ
2006, 62, 226-235.
61. Maris, E. P.; Davis, R. J., J Catal 2007, 249, 328-337.
62. Maris, E. P.; Ketchie, W. C.; Murayama, M.; Davis, R. J., J Catal 2007, 251, 281-294.
63. Geboers, J. A.; Van de Vyver, S.; Ooms, R.; Op de Beeck, B.; Jacobs, P. A.; Sels, B. F.,
Catal Sci Tech 2011, 1, 714-726.
64. Van de Vyver, S.; Geboers, J.; Jacobs, P. A.; Sels, B. F., ChemCatChem 2011, 3, 82-94.
65. Weingarten, R.; Conner, W. C.; Huber, G. W., Energy Environ Sci 2012, 5, 7559-7574.
66. Huber, G. W.; Cortright, R. D.; Dumesic, J. A., Angew Chem Int Ed 2004, 43, 1549-
1551.
67. Santen, R. A. v.; Neurock, M.; Shetty, S. G., Chem Rev 2009, 110, 2005-2048.
68. Ferrin, P.; Simonetti, D.; Kandoi, S.; Kunkes, E.; Dumesic, J. A.; Nørskov, J. K.;
Mavrikakis, M., J Am Chem Soc 2009, 131, 5809-5815.
69. Kua, J.; Goddard, W. A., J Am Chem Soc 1999, 121, 10928-10941.
70. Zhang, C. J.; Hu, P., J Chem Phys 2001, 115, 7182-7186.
71. Alcalá, R.; Mavrikakis, M.; Dumesic, J. A., J Catal 2003, 218, 178-190.
72. Davda, R. R.; Alcalá, R.; Shabaker, J.; Huber, G.; Cortright, R. D.; Mavrikakis, M.;
Dumesic, J. A., 11 DFT and experimental studies of C-C and C-O bond cleavage in
ethanol and ethylene glycol on Pt catalysts. In Studies in Surface Science and Catalysis,
Anpo, M.; Onaka, M.; Hiromi, Y., Eds. Elsevier: Amsterdam, 2003; Vol. 145, pp 79-
84.
73. Yudanov, I. .; Matveev, A. .; Neyman, K. M.; R sch, N., J Am Chem Soc 2008, 130,
9342-9352.
74. Ferrin, P.; Nilekar, A. U.; Greeley, J.; Mavrikakis, M.; Rossmeisl, J., Surf Sci 2008,
602, 3424-3431.
75. Li, M.; Guo, W.; Jiang, R.; Zhao, L.; Shan, H., Langmuir 2009, 26, 1879-1888.
76. Zope, B. N.; Hibbitts, D. D.; Neurock, M.; Davis, R. J., Science 2010, 330, 74-78.
77. Li, M.; Guo, W.; Jiang, R.; Zhao, L.; Lu, X.; Zhu, H.; Fu, D.; Shan, H., J Phys Chem C
2010, 114, 21493-21503.
78. Liu, B.; Greeley, J., J Phys Chem C 2011, 115, 19702-19709.
79. Grabow, L. C.; Mavrikakis, M., ACS Catal 2011, 1, 365-384.
80. Choi, Y.; Liu, P., Catal Today 2011, 165, 64-70.
81. Zhang, J.; Cao, X. M.; Hu, P.; Zhong, Z.; Borgna, A.; Wu, P., J Phys Chem C 2011,
115, 22429-22437.

Refereces
129
82. Liu, B.; Greeley, J., Top Catal 2012, 55, 280-289.
83. Studt, F.; Abild-Pedersen, F.; Wu, Q.; Jensen, A. D.; Temel, B.; Grunwaldt, J.-D.;
Nørskov, J. K., J Catal 2012, 293, 51-60.
84. Palo, D. R.; Dagle, R. A.; Holladay, J. D., Chem Rev 2007, 107, 3992-4021.
85. Klier, K., Methanol Synthesis. In Advances in Catalysis, Eley, D. D.; Pines, H.; Weisz,
P. B., Eds. Academic Press: New York, 1982; Vol. 31, pp 243-313.
86. Sutton, J. E.; Vlachos, D. G., Ind Eng Chem Res 2014, DOI: 10.1021/ie5043374.
87. Sutton, J. E.; Panagiotopoulou, P.; Verykios, X. E.; Vlachos, D. G., J Phys Chem C
2013, 117, 4691-4706.
88. Wang, H.-F.; Liu, Z.-P., J Am Chem Soc 2008, 130, 10996-11004.
89. Ma, Y.; Hernández, L.; Guadarrama-Pérez, C.; Balbuena, P. B., J Phys Chem A 2012,
116, 1409-1416.
90. Wang, J.-H.; Lee, C. S.; Lin, M. C., J Phys Chem C 2009, 113, 6681-6688.
91. Chen, Y.; Salciccioli, M.; Vlachos, D. G., J Phys Chem C 2011, 115, 18707-18720.
92. Liu, B.; Greeley, J., Phys Chem Chem Phys 2013, 15, 6475-6485.
93. Salciccioli, M.; Vlachos, D. G., ACS Catal 2011, 1, 1246-1256.
94. Wang, H.-F.; Liu, Z.-P., J Phys Chem C 2007, 111, 12157-12160.
95. Wang, E. D.; Xu, J. B.; Zhao, T. S., J Phys Chem C 2010, 114, 10489-10497.
96. Zhang, J.; Zhong, Z.; Cao, X. M.; Hu, P.; Sullivan, M. B.; Chen, L., ACS Catal 2014, 4,
448-456.
97. Nørskov, J. K.; Bligaard, T.; Logadottir, A.; Bahn, S.; Hansen, L. B.; Bollinger, M.;
Bengaard, H.; Hammer, B.; Sljivancanin, Z.; Mavrikakis, M.; Xu, Y.; Dahl, S.;
Jacobsen, C. J. H., J Catal 2002, 209, 275-278.
98. Roy, S.; Mpourmpakis, G.; Hong, D.-Y.; Vlachos, D. G.; Bhan, A.; Gorte, R. J., ACS
Catal 2012, 2, 1846-1853.
99. Ishimoto, R.; Jung, C.; Tsuboi, H.; Koyama, M.; Endou, A.; Kubo, M.; Del Carpio, C.
A.; Miyamoto, A., Appl Catal A-Gen 2006, 305, 64-69.
100. Ahmed, F.; Nagumo, R.; Miura, R.; Suzuki, A.; Tsuboi, H.; Hatakeyama, N.; Takaba,
H.; Miyamoto, A., J Phys Chem C 2011, 115, 24123-24132.
101. Ahmed, F.; Miura, R.; Hatakeyama, N.; Takaba, H.; Miyamoto, A.; Salahub, D. R., J
Phys Chem C 2013, 117, 5051-5066.
102. Laurent, E.; Delmon, B., Appl Catal A-Gen 1994, 109, 77-96.
103. Laurent, E.; Delmon, B., Appl Catal A-Gen 1994, 109, 97-115.
104. Elliott, D. C.; Hart, T. R., Energ Fuel 2008, 23, 631-637.

References
130
105. Wildschut, J.; Mahfud, F. H.; Venderbosch, R. H.; Heeres, H. J., Ind Eng Chem Res
2009, 48, 10324-10334.
106. Yakovlev, V. A.; Khromova, S. A.; Sherstyuk, O. V.; Dundich, V. O.; Ermakov, D. Y.;
Novopashina, V. M.; Lebedev, M. Y.; Bulavchenko, O.; Parmon, V. N., Catal Today
2009, 144, 362-366.
107. Zhao, C.; Kou, Y.; Lemonidou, A. A.; Li, X.; Lercher, J. A., Angew Chem Int Ed 2009,
48, 3987-3990.
108. Zakzeski, J.; Bruijnincx, P. C. A.; Jongerius, A. L.; Weckhuysen, B. M., Chem Rev
2010, 110, 3552-3599.
109. Carlson, T. R.; Cheng, Y.-T.; Jae, J.; Huber, G. W., Energy Environ Sci 2011, 4, 145-
161.
110. Mortensen, P. M.; Grunwaldt, J. D.; Jensen, P. A.; Knudsen, K. G.; Jensen, A. D., Appl
Catal A-Gen 2011, 407, 1-19.
111. Nimmanwudipong, T.; Runnebaum, R. C.; Block, D. E.; Gates, B. C., Energ Fuel 2011,
25, 3417-3427.
112. Badawi, M.; Paul, J.-F.; Cristol, S.; Payen, E., Catal Comm 2011, 12, 901-905.
113. Zhao, C.; He, J.; Lemonidou, A. A.; Li, X.; Lercher, J. A., J Catal 2011, 280, 8-16.
114. He, Z.; Wang, X., Catal Sustain Energy 2012, 1, 28-53.
115. Lee, C. R.; Yoon, J. S.; Suh, Y.-W.; Choi, J.-W.; Ha, J.-M.; Suh, D. J.; Park, Y.-K.,
Catal Comm 2012, 17, 54-58.
116. Nimmanwudipong, T.; Aydin, C.; Lu, J.; Runnebaum, R.; Brodwater, K.; Browning,
N.; Block, D.; Gates, B., Catal Lett 2012, 142, 1190-1196.
117. Runnebaum, R. C.; Nimmanwudipong, T.; Block, D. E.; Gates, B. C., Catal Sci Tech
2012, 2, 113-118.
118. Bykova, M. V.; Ermakov, D. Y.; Kaichev, V. V.; Bulavchenko, O. A.; Saraev, A. A.;
Lebedev, M. Y.; Yakovlev, . А., Appl Catal B-Environ 2012, 113–114, 296-307.
119. Ben, H.; Mu, W.; Deng, Y.; Ragauskas, A. J., Fuel 2013, 103, 1148-1153.
120. Mortensen, P. M.; Grunwaldt, J.-D.; Jensen, P. A.; Jensen, A. D., ACS Catal 2013, 3,
1774-1785.
121. Badawi, M.; Paul, J.-F.; Payen, E.; Romero, Y.; Richard, F.; Brunet, S.; Popov, A.;
Kondratieva, E.; Gilson, J.-P.; Mariey, L.; Travert, A.; Maugé, F., Oil Gas Sci Technol
– Rev IFP 2013, 68, 829-840.
122. Wang, X.; Rinaldi, R., Angew Chem Int Ed 2013, 52, 11499-11503.

Refereces
131
123. Jongerius, A. L.; Bruijnincx, P. C. A.; Weckhuysen, B. M., Green Chem 2013, 15,
3049-3056.
124. Nie, L.; de Souza, P. M.; Noronha, F. B.; An, W.; Sooknoi, T.; Resasco, D. E., J Mol
Catal A-Chem 2014, 388–389, 47-55.
125. Anex, R. P.; Aden, A.; Kazi, F. K.; Fortman, J.; Swanson, R. M.; Wright, M. M.;
Satrio, J. A.; Brown, R. C.; Daugaard, D. E.; Platon, A.; Kothandaraman, G.; Hsu, D.
D.; Dutta, A., Fuel 2010, 89, Supplement 1, S29-S35.
126. Mohan, D.; Pittman, C. U.; Steele, P. H., Energ Fuel 2006, 20, 848-889.
127. Huber, G. W.; Iborra, S.; Corma, A., Chem Rev 2006, 106, 4044-4098.
128. Resasco, D. E.; Crossley, S., AIChE J 2009, 55, 1082-1089.
129. Moon, J.-S.; Kim, E.-G.; Lee, Y.-K., J Catal 2014, 311, 144-152.
130. Ben, H.; Ferguson, G. A.; Mu, W.; Pu, Y.; Huang, F.; Jarvis, M.; Biddy, M.; Deng, Y.;
Ragauskas, A. J., Phys Chem Chem Phys 2013, 15, 19138-19142.
131. Wan, H.; Chaudhari, R. V.; Subramaniam, B., Top Catal 2012, 55, 129-139.
132. Jin, S.; Xiao, Z.; Li, C.; Chen, X.; Wang, L.; Xing, J.; Li, W.; Liang, C., Catal Today,
2014, 234, 125-132.
133. Bui, V. N.; Toussaint, G.; Laurenti, D.; Mirodatos, C.; Geantet, C., Catal Today 2009,
143, 172-178.
134. Ohta, H.; Kobayashi, H.; Hara, K.; Fukuoka, A., Chem Comm 2011, 47, 12209-12211.
135. Girgis, M. J.; Gates, B. C., Ind Eng Chem Res 1991, 30, 2021-2058.
136. Furimsky, E., Catal Today 2013, 217, 13-56.
137. Lu, J.; Heyden, A., Theoretical Study of the Liquid-phase Deoxygenation of Guaiacol
into Aromatic Chemicals over Ru Surfaces. At 23rd North American Catalysis Society
Meeting, Louisville, Kentucky, USA.
https://nam.confex.com/nam/2013/webprogram/Paper7915.html (accessed June 11,
2014).
138. Lu, J.; Heyden, A., J Catal 2015, 321, 39-50.
139. Lee, K.; Gu, G. H.; Mullen, C. A.; Boateng, A. A.; Vlachos, D. G., ChemSusChem
2015, 8, 315-322.
140. Hensley, A.; Wang, Y.; McEwen, J.-S., ACS Catal 2015, 5, 523-536.
141. He, J.; Zhao, C.; Mei, D.; Lercher, J. A., J Catal 2014, 309, 280-290.
142. He, J.; Lu, L.; Zhao, C.; Mei, D.; Lercher, J. A., J Catal 2014, 311, 41-51.
143. Hensley, A. J. R.; Hong, Y.; Zhang, R.; Zhang, H.; Sun, J.; Wang, Y.; McEwen, J.-S.,
ACS Catal 2014, 4, 3381-3392.

References
132
144. Mittendorfer, F.; Hafner, J., J Phys Chem B 2002, 106, 13299-13305.
145. Saeys, M.; Reyniers, M.-F.; Neurock, M.; Marin, G. B., J Phys Chem B 2003, 107,
3844-3855.
146. Saeys, M.; Reyniers, M. F.; Neurock, M.; Marin, G. B., J Phys Chem B 2004, 109,
2064-2073.
147. Morin, C.; Simon, D.; Sautet, P., Surf Sci 2006, 600, 1339-1350.
148. Ghiringhelli, L. M.; Caputo, R.; Delle Site, L., Phys Rev B 2007, 75, 113403-4.
149. Lesnard, H.; Bocquet, M.-L.; Lorente, N., J Am Chem Soc 2007, 129, 4298-4305.
150. Honkela, M. L.; Bjork, J.; Persson, M., Phys Chem Chem Phys 2012, 14, 5849-5854.
151. Yoon, Y.; Rousseau, R.; Weber, R. S.; Mei, D.; Lercher, J. A., J Am Chem Soc 2014,
136, 10287-10298.
152. Inoue, T.; Itakura, M.; Jon, H.; Oumi, Y.; Takahashi, A.; Fujitani, T.; Sano, T.,
Micropor Mesopor Mat 2009, 122, 149-154.
153. Song, Z.; Takahashi, A.; Mimura, N.; Fujitani, T., Catal Lett 2009, 131, 364-369.
154. Ermakov, R. V.; Plakhotnik, V. A., Pet Chem 2008, 48, 1-5.
155. Inaba, M.; Murata, K.; Saito, M.; Takahara, I., Green Chem 2007, 9, 638-646.
156. Gayubo, A. G.; Alonso, A.; Valle, B.; Aguayo, A. T.; Olazar, M.; Bilbao, J., Fuel 2010,
89, 3365-3372.
157. Gayubo, A. G.; Alonso, A.; Valle, B.; Aguayo, A. T.; Bilbao, J., Appl Catal B-Environ
2010, 97, 299-306.
158. Goto, D.; Harada, Y.; Furumoto, Y.; Takahashi, A.; Fujitani, T.; Oumi, Y.; Sadakane,
M.; Sano, T., Appl Catal A-Gen 2010, 383, 89-95.
159. Inaba, M.; Murata, K.; Saito, M.; Takahara, I., React Kinet Catal Lett 2006, 88, 135-
141.
160. Derouane, E. G.; Nagy, J. B.; Dejaifve, P.; van Hooff, J. H. C.; Spekman, B. P.;
Védrine, J. C.; Naccache, C., J Catal 1978, 53, 40-55.
161. Anderson, J. R.; Foger, K.; Mole, T.; Rajadhyaksha, R. A.; Sanders, J. V., J Catal
1979, 58, 114-130.
162. Johansson, R.; Hruby, S.; Rass-Hansen, J.; Christensen, C., Catal Lett 2009, 127, 1-6.
163. Stöcker, M., Micropor Mesopor Mat 1999, 29, 3-48.
164. Stöcker, M., Micropor Mesopor Mat 2005, 82, 257-292.
165. Haw, J. F.; Song, W.; Marcus, D. M.; Nicholas, J. B., Acc Chem Res 2003, 36, 317-326.
166. Olsbye, U.; Svelle, S.; Bjørgen, M.; Beato, P.; Janssens, T. V. W.; Joensen, F.; Bordiga,
S.; Lillerud, K. P., Angew Chem Int Ed 2012, 51, 5810-5831.

Refereces
133
167. Lesthaeghe, D.; Horré, A.; Waroquier, M.; Marin, G. B.; Van Speybroeck, V., Chem
Eur J 2009, 15, 10803-10808.
168. Inaba, M.; Murata, K.; Takahara, I.; Inoue, K.-i., J Chem Technol Biot 2011, 86, 95-
104.
169. Gayubo, A. G.; Alonso, A.; Valle, B.; Aguayo, A. T.; Bilbao, J., AIChE J 2012, 58,
526-537.
170. Kresse, G.; Hafner, J., Phys Rev B 1993, 47, 558-561.
171. Kresse, G.; Hafner, J., Phys Rev B 1994, 49, 14251-14269.
172. Kresse, G.; Furthmüller, J., Comp Mater Sci 1996, 6, 15-50.
173. Kresse, G.; Furthmüller, J., Phys Rev B 1996, 54, 11169-11186.
174. Blöchl, P. E., Phys Rev B 1994, 50, 17953-17979.
175. Kresse, G.; Joubert, D., Phys Rev B 1999, 59, 1758-1775.
176. Jónsson, H.; Mills, G.; Jacobsen, K. W., Nudged elastic band method for finding
minimum energy paths of transitions. In Classical And Quantum Dynamics In
Condensed Phase Simulations, World Scientific: Singapore, 1998; pp 385-404.
177. Henkelman, G.; Jónsson, H., J Chem Phys 2000, 113, 9978-9985.
178. Henkelman, G.; Uberuaga, B. P.; Jónsson, H., J Chem Phys 2000, 113, 9901-9904.
179. Sheppard, D.; Terrell, R.; Henkelman, G., J Chem Phys 2008, 128, 134106-10.
180. Sheppard, D.; Henkelman, G., J Comput Chem 2011, 32, 1769-1771.
181. Sheppard, D.; Xiao, P.; Chemelewski, W.; Johnson, D. D.; Henkelman, G., J Chem
Phys 2012, 136, 074103-8.
182. Chaffey-Millar, H.; Nikodem, A.; Matveev, A. V.; Krüger, S.; Rösch, N., J Chem
Theory Comput 2012, 8, 777-786.
183. Nikodem, A.; Matveev, A. V.; Zheng, B.-X.; Rösch, N., J Chem Theory Comput 2012,
9, 588-599.
184. Henkelman, G.; Jónsson, H., J Chem Phys 1999, 111, 7010-7022.
185. Olsen, R. A.; Kroes, G. J.; Henkelman, G.; Arnaldsson, A.; Jónsson, H., J Chem Phys
2004, 121, 9776-9792.
186. Heyden, A.; Bell, A. T.; Keil, F. J., J Chem Phys 2005, 123, 224101-14.
187. Kästner, J.; Sherwood, P., J Chem Phys 2008, 128, 014106-6.
188. McQuarrie, D. A.; Simon, J. D., Molecular Thermondynamics. University Science
Books: Sausalito, 1999.
189. Chang, C.-R.; Zhao, Z.-J.; Köhler, K.; Genest, A.; Li, J.; Rösch, N., Catal Sci Tech
2012, 2, 2238-2248.

References
134
190. Perdew, J. P.; Wang, Y., Phys Rev B 1992, 45, 13244-13249.
191. Perdew, J. P.; Burke, K.; Ernzerhof, M., Phys Rev Lett 1996, 77, 3865-3868.
192. Perdew, J. P.; Burke, K.; Ernzerhof, M., Phys Rev Lett 1997, 78, 1396-1396.
193. Methfessel, M.; Paxton, A. T., Phys Rev B 1989, 40, 3616-3621.
194. Monkhorst, H. J.; Pack, J. D., Phys Rev B 1976, 13, 5188-5192.
195. Moskaleva, L. V.; Chen, Z.-X.; Aleksandrov, H. A.; Mohammed, A. B.; Sun, Q.;
Rösch, N., J Phys Chem C 2009, 113, 2512-2520.
196. Lee, K.; Murray, É. D.; Kong, L.; Lundqvist, B. I.; Langreth, D. C., Phys Rev B 2010,
82, 081101-4.
197. VASP manual, http://cms.mpi.univie.ac.at/vasp/guide/node124.html. (accessed
28.08.2013).
198. VASP manual, http://cms.mpi.univie.ac.at/vasp/guide/node161.html. (accessed
19.08.2014).
199. Baerlocher, C.; McCusker, L. B., Database of Zeolite Structures: http://www.iza-
structure.org/databases/. (accessed 16.04.2012).
200. Schröder, K.-P.; Sauer, J.; Leslie, M.; Richard, C.; Catlow, A., Zeolites 1992, 12, 20-
23.
201. Valcárcel, A.; Ricart, J. M.; Clotet, A.; Illas, F.; Markovits, A.; Minot, C., J Catal 2006,
241, 115-122.
202. Yang, M.-L.; Zhu, Y.-A.; Fan, C.; Sui, Z.-J.; Chen, D.; Zhou, X.-G., Phys Chem Chem
Phys 2011, 13, 3257-3267.
203. Zhao, Z.-J.; Moskaleva, L. .; Aleksandrov, H. A.; Basaran, D.; R sch, N., J Phys
Chem C 2010, 114, 12190-12201.
204. Alcala, R.; Greeley, J.; Mavrikakis, M.; Dumesic, J. A., J Chem Phys 2002, 116, 8973-
8980.
205. Greeley, J.; Mavrikakis, M., J Am Chem Soc 2004, 126, 3910-3919.
206. Michaelides, A.; Hu, P., J Am Chem Soc 2001, 123, 4235-4242.
207. Wang, J. G.; Hammer, B., J Chem Phys 2006, 124, 184704-7.
208. Karp, E. M.; Campbell, C. T.; Studt, F.; Abild-Pedersen, F.; Nørskov, J. K., J Phys
Chem C 2012, 116, 25772-25776.
209. Michel, C.; Goltl, F.; Sautet, P., Phys Chem Chem Phys 2012, 14, 15286-15290.
210. Grabow, L. C.; Gokhale, A. A.; Evans, S. T.; Dumesic, J. A.; Mavrikakis, M., J Phys
Chem C 2008, 112, 4608-4617.

Refereces
135
211. Carey, F. A.; Sundberg, R. J., Advanced Organic Chemistry, Part A: Structures and
Mechanisms. Fifth Edition ed.; Springer Science+Business Media, LLC: New York,
2008.
212. Bligaard, T.; Nørskov, J. K.; Dahl, S.; Matthiesen, J.; Christensen, C. H.; Sehested, J., J
Catal 2004, 224, 206-217.
213. Chiu, C.-c.; Genest, A.; Rösch, N., Top Catal 2013, 56, 874-884.
214. Dry, M. E., Catal Today 2002, 71, 227-241.
215. Ojeda, M.; Li, A.; Nabar, R.; Nilekar, A. U.; Mavrikakis, M.; Iglesia, E., J Phys Chem
C 2010, 114, 19761-19770.
216. Ojeda, M.; Nabar, R.; Nilekar, A. U.; Ishikawa, A.; Mavrikakis, M.; Iglesia, E., J Catal
2010, 272, 287-297.
217. Zhuo, M.; Tan, K. F.; Borgna, A.; Saeys, M., J Phys Chem C 2009, 113, 8357-8365.
218. Inderwildi, O. R.; Jenkins, S. J.; King, D. A., J Phys Chem C 2008, 112, 1305-1307.
219. Shetty, S.; Jansen, A. P. J.; van Santen, R. A., J Am Chem Soc 2009, 131, 12874-12875.
220. Shetty, S.; Jansen, A. P. J.; van Santen, R. A., J Phys Chem C 2008, 112, 14027-14033.
221. Ciob c , I. M.; Frechard, F.; van Santen, R. A.; Kleyn, A. W.; Hafner, J., Chem Phys
Lett 1999, 311, 185-192.
222. Ciob c , I. M.; Frechard, F.; van Santen, R. A.; Kleyn, A. W.; Hafner, J., J Phys Chem
B 2000, 104, 3364-3369.
223. Ciobica, I. M.; van Santen, R. A., J Phys Chem B 2002, 106, 6200-6205.
224. Morgan, G. A.; Sorescu, D. C.; Zubkov, T.; Yates, J. T., J Phys Chem B 2004, 108,
3614-3624.
225. Ge, Q.; Neurock, M.; Wright, H. A.; Srinivasan, N., J Phys Chem B 2002, 106, 2826-
2829.
226. Basaran, D.; Aleksandrov, H. A.; Chen, Z.-X.; Zhao, Z.-J.; Rösch, N., J Mol Catal A-
Chem 2011, 344, 37-46.
227. Chen, Z.-X.; Aleksandrov, H. A.; Basaran, D.; R sch, N., J Phys Chem C 2010, 114,
17683-17692.
228. Moskaleva, L. .; Chen, Z.- .; Aleksandrov, H. A.; Mohammed, A. B.; Sun, .;
R sch, N., J Phys Chem C 2009, 113, 2512-2520.
229. Moskaleva, L. .; Aleksandrov, H. A.; Basaran, D.; Zhao, Z.-J.; R sch, N., J Phys
Chem C 2009, 113, 15373-15379.
230. Ford, D. C.; Nilekar, A. U.; Xu, Y.; Mavrikakis, M., Surf Sci 2010, 604, 1565-1575.
231. Liu, Z.-P.; Hu, P., J Am Chem Soc 2002, 124, 11568-11569.

References
136
232. Chiu, C.-c.; Genest, A.; Borgna, A.; Rösch, N., ACS Catal 2014, 4, 4178-4188.
233. Dahl, S.; Logadottir, A.; Egeberg, R. C.; Larsen, J. H.; Chorkendorff, I.; Törnqvist, E.;
Nørskov, J. K., Phys Rev Lett 1999, 83, 1814-1817.
234. Stellwag, C.; Held, G.; Menzel, D., Surf Sci 1995, 325, L379-L384.
235. Braun, W.; Held, G.; Steinrück, H. P.; Stellwag, C.; Menzel, D., Surf Sci 2001, 475, 18-
36.
236. Held, G.; Braun, W.; Steinrück, H.-P.; Yamagishi, S.; Jenkins, S.; King, D., Phys Rev
Lett 2001, 87, 216102-4.
237. Schravendijk, P.; van der Vegt, N.; Delle Site, L.; Kremer, K., ChemPhysChem 2005,
6, 1866-1871.
238. Bilić, A.; Reimers, J. R.; Hush, N. S.; Hoft, R. C.; Ford, M. J., J Chem Theory Comput
2006, 2, 1093-1105.
239. Saeys, M.; Reyniers, M.-F.; Marin, G. B.; Neurock, M., J Phys Chem B 2002, 106,
7489-7498.
240. Morin, C.; Simon, D.; Sautet, P., J Phys Chem B 2004, 108, 5653-5665.
241. Orita, H.; Itoh, N., Appl Catal A-Gen 2004, 258, 17-23.
242. Delle Site, L.; Alavi, A.; Abrams, C. F., Phys Rev B 2003, 67, 193406-3.
243. Tan, Y. P.; Khatua, S.; Jenkins, S. J.; Yu, J. Q.; Spencer, J. B.; King, D. A., Surf Sci
2005, 589, 173-183.
244. Bonalumi, N.; Vargas, A.; Ferri, D.; Baiker, A., J Phys Chem B 2006, 110, 9956-9965.
245. Herron, J. A.; Tonelli, S.; Mavrikakis, M., Surf Sci 2013, 614, 64-74.
246. Sinha, N. K.; Neurock, M., J Catal 2012, 295, 31-44.
247. Ciobica, I. M.; van Santen, R. A., J Phys Chem B 2003, 107, 3808-3812.
248. Vendelbo, S. B.; Johansson, M.; Mowbray, D. J.; Andersson, M. P.; Abild-Pedersen, F.;
Nielsen, J. H.; Nørskov, J. K.; Chorkendorff, I., Top Catal 2010, 53, 357-364.
249. Li, H.; Fu, G.; Xu, X., Phys Chem Chem Phys 2012, 14, 16686-16694.
250. Mortensen, J. J.; Morikawa, Y.; Hammer, B.; Nørskov, J. K., J Catal 1997, 169, 85-92.
251. Bartholomew, C. H., Catal Rev 1982, 24, 67-112.
252. Schauermann, S.; Hoffmann, J.; Johánek, V.; Hartmann, J.; Libuda, J.; Freund, H.-J.,
Angew Chem Int Ed 2002, 41, 2532-2535.
253. Zubkov, T.; Morgan Jr, G. A.; Yates Jr, J. T.; Kühlert, O.; Lisowski, M.; Schillinger,
R.; Fick, D.; Jänsch, H. J., Surf Sci 2003, 526, 57-71.
254. Baumer, M.; Libuda, J.; Neyman, K. M.; Rösch, N.; Rupprechter, G.; Freund, H.-J.,
Phys Chem Chem Phys 2007, 9, 3541-3558.

Refereces
137
255. Kozlov, S. M.; Cabeza, G. F.; Neyman, K. M., Chem Phys Lett 2011, 506, 92-97.
256. Schauermann, S.; Nilius, N.; Shaikhutdinov, S.; Freund, H.-J., Acc Chem Res 2012, 46,
1673-1681.
257. Freund, H. J.; Nilius, N.; Risse, T.; Schauermann, S., Phys Chem Chem Phys 2014, 16,
8148-8167.
258. Trimm, D. L., Catal Rev 1977, 16, 155-189.
259. van Santen, R. A.; van de Graaf, B.; Smit, B., Chapter 10 Introduction to zeolite theory
and modelling. In Introduction to Zeolite Science and Practice, Studies in Surface
Science and Catalysis, van Bekkum, H.; Flanigen, E. M.; Jacobs, P. A.; Jansen, J. C.,
Eds. Elsevier: Amsterdam, 2001; Vol. 137, pp 419-466.
260. Sierka, M.; Sauer, J., Faraday Discuss 1997, 106, 41-62.
261. Sauer, J.; Sierka, M., J Comput Chem 2000, 21, 1470-1493.
262. Svensson, M.; Humbel, S.; Froese, R. D. J.; Matsubara, T.; Sieber, S.; Morokuma, K., J
Phys Chem 1996, 100, 19357-19363.
263. Nasluzov, V. A.; Ivanova, E. A.; Shor, A. M.; Vayssilov, G. N.; Birkenheuer, U.;
Rösch, N., J Phys Chem B 2003, 107, 2228-2241.
264. Namuangruk, S.; Pantu, P.; Limtrakul, J., J Catal 2004, 225, 523-530.
265. McCann, D. M.; Lesthaeghe, D.; Kletnieks, P. W.; Guenther, D. R.; Hayman, M. J.;
Van Speybroeck, V.; Waroquier, M.; Haw, J. F., Angew Chem Int Ed 2008, 47, 5179-
5182.
266. Vayssilov, G. N.; Petrova, G. P.; Shor, E. A. I.; Nasluzov, V. A.; Shor, A. M.; Petkov,
P. S.; Rösch, N., Phys Chem Chem Phys 2012, 14, 5879-5890.
267. Dinda, S.; Govindasamy, A.; Genest, A.; Rösch, N., J Phys Chem C 2014, 118, 25077-
25088.
268. Chiu, C.-c.; Vayssilov, G. N.; Genest, A.; Borgna, A.; Rösch, N., J Comput Chem
2014, 35, 809-819.
269. Grimme, S.; Antony, J.; Ehrlich, S.; Krieg, H., J Chem Phys 2010, 132, 154104-19.
270. Bondi, A., J Phys Chem 1964, 68, 441-451.
271. Pellenq, R. J. M.; Nicholson, D., In-Crystal Oxygen Polarizability For Porous And
Non-Porous Materials. In Studies in Surface Science and Catalysis, J. Rouquerol;
Rodríguez-Reinoso, F.; Sing, K. S. W.; Unger, K. K., Eds. Elsevier: Amsterdam, 1994;
Vol. 87, pp 31-39.
272. Atkins, P.; Friedman, R., Molecular Quantum Mechanics, Fourth Edition. Oxford
University Press Inc.: New York, 2005; p 413.

References
138
273. Van Genechten, K. A.; Mortier, W. J.; Geerlings, P., J Chem Phys 1987, 86, 5063-
5071.
274. Sherwood, P.; H. de Vries, A.; J. Collins, S.; P. Greatbanks, S.; A. Burton, N.; A.
Vincent, M.; H. Hillier, I., Faraday Discuss 1997, 106, 79-92.
275. Pellenq, R. J. M.; Nicholson, D., J Chem Soc Faraday T 1993, 89, 2499-2508.
276. Tkatchenko, A.; Scheffler, M., Phys Rev Lett 2009, 102, 073005-4.
277. Rydberg, H.; Dion, M.; Jacobson, N.; Schröder, E.; Hyldgaard, P.; Simak, S. I.;
Langreth, D. C.; Lundqvist, B. I., Phys Rev Lett 2003, 91, 126402-4.
278. Dion, M.; Rydberg, H.; Schröder, E.; Langreth, D. C.; Lundqvist, B. I., Phys Rev Lett
2004, 92, 246401-4.
279. Hermann, J.; Bludsky, O., J Chem Phys 2013, 139, 034115-6.
280. G ltl, F.; Grüneis, A.; Bučko, T.; Hafner, J., J Chem Phys 2012, 137, 114111-17.
281. Tsuzuki, S.; Honda, K.; Uchimaru, T.; Mikami, M., J Chem Phys 2006, 124, 114304-7.
282. Takatani, T.; Hohenstein, E. G.; Malagoli, M.; Marshall, M. S.; Sherrill, C. D., J Chem
Phys 2010, 132, 144104-5.
283. Jurecka, P.; Sponer, J.; Cerny, J.; Hobza, P., Phys Chem Chem Phys 2006, 8, 1985-
1993.
284. Tkatchenko, A.; DiStasio, R. A., Jr.; Car, R.; Scheffler, M., Phys Rev Lett 2012, 108,
236402-5.