quarterly competition review
TRANSCRIPT
South Africa has high data prices compared to other countries globally. The parliamentary portfolio committee on telecommunications and postal services conducted a two day hearing in September (2016) to investigate the high data prices in South Africa. In these hearings the South African mobile network operators (MNOs) submitted that the primary reason for high data costs was the “spectrum crunch” in large urban areas. Spectrum crunch is the lack of sufficient wireless frequency spectrum needed to support a growing number of consumer devices which include cell phones, radios and televisions. Reallocation of spectrum is largely determined by government regulation, and limited access to additional spectrum compels the MNOs to spend more on physical network infrastructure which is more costly, thereby increasing the price of data. A recent study conducted by the research organisation, Tariffic,
established that South Africa’s contract data prices, for example, are 134% higher than the average of the lowest contract data prices in Kenya, Australia and BRICS member countries Brazil, Russia, India and China. However, the analysis focuses more on the price of data without taking into consideration other
factors such as the cost structures of MNOs. This article contributes to these debates by comparing South African data prices with those in other
countries, and assessing whether there are cost differentials which might explain the differences, as a first step towards understanding the high prices of data. South African price and cost structures are compared to those in Nigeria and Ghana primarily as these countries have the cheapest data prices in Africa and therefore serve as suitable benchmarks to establish possible reasons for the higher data prices. Comparators in Kenya
This article compares South African data prices with those in other countries, and
assesses whether there are cost differentials
which might explain the
differences.
Q U A R T E R LY C O M P E T I T I O N R E V I E W
April 2017 Issue 2017/01
Data must fall: Evidence from MTN SA, Nigeria and Ghana
Page 1
Understanding economic activity in Johannesburg
Page 5
Reflection on the ArcelorMittal settlement
Page 8
D A T A M U S T F A L L : E V I D E N C E F R O M M T N S A , N I G E R I A A N D G H A N A
IN THIS ISSUE… Data must fall: Evidence from MTN South Africa, Ghana and Nigeria….……….1 —————————————— Understanding economic activity in Johannesburg…. 5 —————————————— Reflection on the ArcelorMittal settlement…...8 —————————————— Competition Authority of Kenya (CAK) rules on USSD pricing………………..…...…11 —————————————— Regulatory standoff between POTRAZ and MNOs in Zimbabwe …………………..12 _________________________ Quarterly competition case update………………..……...14 _________________________
3rd ANNUAL COMPETITION
AND ECONOMIC
REGULATION (ACER) WEEK
SOUTHERN AFRICA:
BOOKINGS NOW OPEN, SEE
FLYER ON PAGE 13
Nicholas Nhundu & Farisai Chin’anga

and Rwanda are also considered to a lesser extent. We use MTN Africa as a case study firm given that it is present as a market leader in each of the three countries under review.
In South Africa MTN controls approximately 34% of the market share of subscribers, whereas in Nigeria and Ghana it holds 45% and 52%, respectively. Moreover, MTN is the only MNO which operates across the 3 countries under review which allows for consistency in the definitions of cost centres and accounting principles, making comparisons easier and clearer. MTN is also a listed firm which means its information is publicly available in addition to the availability of disaggregated data across the three countries.
Pricing and revenue
The average prepaid price
of data in South Africa
compared to average prices
in Nigeria, Ghana, Kenya
and Rwanda is given below
(Figure 1). The prices were
calculated as the average
price for one gigabyte of 30-
day prepaid data charged
by a number of MNOs in
each country including
MTN.1
The results show that South African prices are significantly higher than the benchmarks utilised with prices (R153) that are more than double or 164% higher than prices in Ghana (R58), and almost five times those in Nigeria (R32). South African prices are also significantly higher than those in Kenya (R66) and Rwanda (R21).
Page 2 Q U A R T E R L Y C O M P E T I T I O N R E V I E W
An analysis of MTN revenue streams across Nigeria, Ghana and South Africa (Table 1) confirms relatively high prices in South Africa. In the 2015 financial year MTN South Africa made more data revenue than MTN Nigeria and MTN Ghana combined. Important to note here is the fact that MTN South Africa has approximately 31 million subscribers overall whereas MTN Nigeria and MTN Ghana had 61 million and 16 million subscribers, respectively, as at 31 December 2015. Data revenue per subscriber
is also significantly higher for
MTN South Africa than MTN
Nigeria and MTN Ghana. On
average MTN South Africa
makes 182% more in data
revenue per subscriber than
Nigeria and Ghana.
1. Data prices were sourced from the following MNO websites as at 6 January 2017 : Ghana - MTN Ghana website, Vodafone website, Tigo website and Airtel website. Nigeria - Airtel website, Etisat website, Globacom website, MTN Nigeria website and VISAfone website South Africa – Vodacom website, MTN South Africa website, Cell C website
Figure 1: Average price of 1-gig 30-day prepaid data (December 2016)
Source: MNO websites1

Page 3 I S S U E 2 0 1 7 / 0 1
Total MTN Revenue (R’ Millions)
Average Revenue per MTN subscriber (Rand)
South Africa Nigeria Ghana South Africa Nigeria Ghana
Data revenue 12 709 10 113 2 418 415 165 149
Total revenue 40 038 51 942 7 903 1 309 848 488
Table 1: MTN revenues for 2015 financial year
Source: Own calculation from MTN Group 2015 annual report (data sheets)
Cost analysis
The actual costs of delivering a gigabyte of bandwidth remain difficult to assess in the telecommunications industry across the world. MNOs claim that it is difficult to calculate the specific costs of delivering bandwidth since the costs vary based on the type of technology being utilised, the user’s location and the time of the day. Consequently, because the actual costs are not clear it is
difficult for users to assess whether they are being charged a reasonable price. However, the big price differentials across countries could be indicative of the extent of market power that a player has in each country. In the cost assessment below
(Table 2), only costs per
subscriber are analysed to
ensure comparability amongst
the three countries. Shared
costs have been apportioned
between voice and data
based on the ratio of data
revenue as to total revenue
of the respective countries.
Total costs per subscriber
of R112 in South Africa are
relatively higher than those
in Nigeria (R65) and Ghana
(R57). This is partly as
result of high salaries and
wages that are paid in
South Africa which are on
average three times higher
than what is paid in Nigeria
and Ghana based on the
annual reports. There are
also different spectrum
assignments across the
Total costs (R’ Millions) Costs per subscriber (Rand)
South Africa Nigeria Ghana South Africa Nigeria Ghana
Overhead absorption rate2 32% 27% 31% 32% 27% 31%
Network costs 1 174 1 908 453 38 31 28
Other data related costs 2 251 2 097 467 74 34 29
Total 3 425 4 006 921 112 65 57
Table 2: MTN costs for 2015 financial year
Notes: Other data related costs include staff costs, marketing costs, and other operating expenditure which also include
administrative costs, fuel, electricity/generators to power network towers etc, and costs of value added services offered
e.g. balance check, top up, buying data off airtime, SMS lotteries etc.
Source: MTN Group 2015 annual report (data sheets)
2. Overhead absorption rate is based on revenue (data revenue as a percentage of total revenue)

three countries, different
types of data 3G/4G, and
different usage between
voice and data services.
Nevertheless the key
question is whether those
costs are high enough to
justify prices that are (on
average) more than twice
the amount that is charged
in Nigeria and Ghana? To
assess this further we
look at profit margins
across the three countries
(Figure 2).
Although South Africa has
higher costs per
subscriber than Nigeria
and Ghana, on average
South African margins (73%)
are 22% higher than Nigeria
(60%) and Ghana (62%). The
implication of this is that
MTN’s 1-gig data prices in
South Africa could decrease
by 33% if a similar average
margin of around 60% is
applied.
Page 4 I S S U E 2 0 1 7 / 0 1
Figure 2: Internet data margins 2015 financial year
Note: Profit margins calculated using data revenue per subscriber (Table 1) and total costs
per subscriber (Table 2)
Source: MTN Group 2015 annual report (data sheets)
Competition dynamics
Competition dynamics in each
country also affect
differentials in pricing.
Although the Nigeria and
Ghana telecoms markets can
be defined as concentrated,
there is significant rivalry
amongst the players which
has seen intense competition
resulting in a significant drop
in prices of services as
players innovate and adopt
the latest technology. In
Nigeria none of the MNOs
operating in the country have
a dominant position in the
internet data market. Ghana
has one of the most
competitive mobile bandwidth
industries in Africa, with a
population of 25 million
people that is serviced by six
operators.
This contrasts with South
African telecoms industry
which has a higher C3
concentration ratio (97%)
relative to Nigeria (84%) and
Ghana (82%). Other than a
relatively high concentrated
industry in South Africa, there
is also an issue of low levels
of competitive rivalry amongst
the key players. The first
movers in South African
mobile telecommunications,
Vodacom and MTN gained
significant market power,
constructed extensive
networks and set prices in a
relatively weak regulatory
environment. They continue to
reap the benefits of this, and
challenger firms have
struggled to grow their market
share because the playing
field is not level. Moreover
barriers to entry and
expansion are high which
prohibits the proliferation of
new players in the sector.
Conclusion
Although South Africa has
higher total costs relative to
Nigeria and Ghana, company
margins show that on average
South African margins are on
average 22% higher than
Nigeria and Ghana.
Competition dynamics within
each country partly explain the
different prices being charged,
suggesting that there would be
benefits to greater rivalry in
the South African market
where there is low competitive
rivalry amongst the lead
MNOs.

The manufacturing sector plays a pivotal role in the development and growth of an economy due to its forward and backward linkages with other sectors. Economic activity in Johannesburg can also lead to benefits across southern Africa (“the region”) where firms in Johannesburg are key suppliers. To maximise the gains from the linkages, it is important to have an understanding of the nature of economic activity and the operational challenges that firms face. The Centre for Competition, Regulation and Economic Development (CCRED) research on the nature of industrial activity in the City of Johannesburg provided important insights on industrial activity, firm performance and constraints to growth and
competitiveness for firms in Johannesburg. With the exception of the inner city survey of Johannesburg that was carried out in 1995, further
research using primary data to explore economic activity in this region has been relatively limited. Administrative, enterprise and investment climate surveys
1
regularly carried out are often
skewed by the head office effect
2 and do not equip
metropolitans and municipalities with adequate information to design business growth interventions. The CCRED survey contributes to filling this gap and supporting the development of evidence-based interventions.
The research process entailed three approaches: census, survey and in-depth interviews. The census collected basic information regarding existing businesses in Johannesburg as there was no reliable record of businesses to survey. The survey of the industrial areas was carried out between 2015 and 2016.
3 The response rate
was 34% with 5214 firms
responding. In order to corroborate the survey findings, 45 in-depth interviews were undertaken with selected manufacturing and manufacturing-related firms.
Nature of industrial activity Since the 1995 survey economic activity in Johannesburg, which largely comprised manufactures such as clothing, printing and publishing, and jewellery and diamond cutting, has evolved somewhat towards more
U N D E R S T A N D I N G E C O N O M I C A C T I V I T Y I N J O H A N N E S B U R G
Page 5 Q U A R T E R L Y C O M P E T I T I O N R E V I E W
Insights from CCRED surveys of firms in
Johannesburg
Lauralyn Kaziboni
“To maximise the
gains from the linkages, it is
important to have an understanding of the nature of
economic activity and the operational
challenges that firms face.”
1. Administrative data from official government sources, such as StatsSA (based on sampling frame called business sampling frame to conduct Large Sample Surveys conducted 3 – 5 years, and annual and quarterly surveys) and SARS (based on the company income tax (CIT) database containing information on businesses registered as tax payers). Enterprise surveys such as the Greater Johannes-burg Metropolitan Council survey undertaken in 1999 of 325 large manufacturing firms; National Enterprise Survey (NES) of over 1400 enterprises nationally across a number of sectors also in 1999; World Bank Investment Climate Assessment (ICA) of 2008 covering a sample of 1,056 business establishments. 2. The head office effect occurs when volume and sales of a particular company are recorded at the head office and not where manu-facturing is taking place. This gives the impression that there is manufacturing of a certain product occurring in Johannesburg, whereby in actual fact this is not the case. 3. The City of Johannesburg identifies 28 industrial nodes in the City. During the course of the survey, it was established that the de-marcations do not take into account the growth of these nodes, with some manufacturing sprawling beyond the identified borders. 4. There is variation in the responses by question, and it would be important for the reader to access the full report for more details.

sophisticated manufacturing. The shift was largely driven by the then growing mining sector. Technologically advanced manufacturing of machinery and equipment, fabricated metal products, furniture, machinery and equipment, and plastic products supported mining and mining-related firms in the City. The decline of mining activity in Johannesburg has seen firms supplying this industry being negatively affected. These firms would require assistance to enter alternative markets in other SADC countries where mining has shown stronger growth. Manufacturing activity in Johannesburg varies by industrial node. The largest sectors in the industrial nodes identified from the census are manufacturing of machinery and equipment; wood and wood products; electrical machinery and equipment; iron and steel; and furniture and jewellery. These are also the sectors which responded the most to the survey indicating minimal response bias. While some industrial nodes have a clear specialisation, in the case of Nancefield (furniture), Devland (food production) and Strijdom Park (machinery and equipment), other nodes are diverse. For example, Marlboro and Wynberg have an assortment of products being manufactured. Johannesburg has a significant concentration (approximately 85%) of small businesses employing fewer than 200 employees and with an annual turnover of less
than R50 million. 50% of firms have been located at their current premises for less than 10 years, and 65% of these have been there for less than five years. This stresses the importance of regular firm
monitoring. Despite the difference in size of the firms which responded to the survey, firm performance was not dependent on firm size.
Firm performance between 2013 and 2015 The economic climate in South Africa has been challenging for the past three years, with economic growth averaging at 1.7% between 2013 and 2015. During this period, the value of the rand was volatile and significantly devalued against the dollar. The volatility meant it was challenging for firms to anticipate costs and to price accordingly. Importers of key essential inputs experienced an increase in cost of inputs, while some exporters of goods made unexpected gains. Nonetheless, firms surveyed were performing better than anticipated measured in terms of changes in annual revenue. Less than 25% of the firms recorded a decline in annual revenue, 33% were stable and 43% reported some growth. The main reasons for poor performance amongst firms that reported contraction or static growth were weak customer demand and lost sales to foreign and domestic
competitors (linked to cheaper imports). Other reasons cited included the weak economic climate as customers opted for cheaper alternatives, including cheaper imports, as a result of lower disposable income. Improving firm growth and competitiveness The information collected demonstrates that there is a relationship between performance and capacity utilisation where firms utilising capacity by more than 75% were likely to be growing and firms at 50% capacity utilisation or less, were less likely to grow. Firms that exhibited growth were investing in new production processes, machinery and equipment, development of new products and increasing export competitiveness. The explanations for better performance with higher capacity utilisation and investment appear to be straightforward. Higher capacity utilisation lowers unit costs which increases competitiveness. Investments are akin to innovation where firms are able to produce new or better products through better manufacturing processes thus becoming more competitive and meeting consumer needs. However, acquiring machinery and equipment requires financing such that access to finance, especially government incentives, would assist firms in improving performance and competitiveness. This is especially important given that these are small firms who find it difficult to access private financing.
Page 6 I S S U E 2 0 1 7 / 0 1
“Nonetheless, firms surveyed were
performing better than anticipated. Less than
25% of the firms recorded a decline in annual revenue, 33% were stable and 43%
reported some growth.”

Access to reliable power supply is expected to improve once the Medupi and Kusile power stations
come online, which when finished will each supply 4800 MW of capacity. The onus will be on the local governments to ensure that substations are maintained to ensure reliable provision of electricity and
avoid unnecessary (or unplanned) disruptions. To curb some of the losses from power outages, many firms have purchased generators, which is an added expense. The most sought-after skills in the manufacturing sector are engineers, production managers and artisans. Firms are struggling particularly to find and recruit artisans. Many firms feel that there is a ‘disconnect’ between skills required in the manufacturing sector and the skills obtained through Technical and Vocational Education and Training (TVET) colleges and SETA-accredited courses. In light of these challenges, the majority (70%) of firms hire people without the required skills and provide training. However, firms are likely to under-invest in training as there is always the risk that trained employees will move to other companies. This is indicative of a basic market failure which is inhibiting employment creation.
Significant differences in performance and capacity utilisation were identified in the sectoral-grouping analysis. CCRED research corroborates the fact that the differentials in the sector-grouping growth dynamics are partly influenced by the demand in the region. Furniture, food, cement and rubber products were more likely to be growing compared to fabricated metal products, machinery and equipment and plastic products. Furniture, food, cement and rubber are in high demand due to rapid urbanisation in the region which also drives demand for food and construction products.
5 The
drop in commodity prices had an adverse impact on the mining industry which resulted in lower demand of mining-related products and thus poor performance of firms manufacturing fabricated metal products, machinery and equipment and plastic products. Public services provision and skills Though the weakness of the economy more broadly negatively affects firms’ growth, there are various location issues that either increase firms’ costs or reduce the efficiency of their operations. These include, but are not limited to, intermittent electricity supply, poor road infrastructure, poor provision of public transport, crime, and lack of technical skills.
The ability of firms to match shift patterns with fluctuations in customer demand is key for firms since transport availability affects operational efficiency and productivity. Improvements in the reliability and flexibility of public transport would lower these costs and allow firms to increase production and performance. Public transport is important in light of the fact that most employees use minibus taxis to commute to and from work which do not have flexible operating hours. Companies generally do not provide transport to employees though some firms offer subsidised transport on night shifts in the event of transport strikes or other public transport interruptions. In general, the considerable investment in public transport within the City, appears to be falling short of business needs. Importance of firm-level surveys Firm-level surveys are key instruments for understanding economic activity at a local and provincial level. They provide key insights into firms’ operating environment and challenges that administrative and enterprise surveys would otherwise miss. This tool then equips local governments to design interventions that are critical to the growth and development of not only the manufacturing sector, but all other spheres of industry and the entire economy. The next iterations of the survey will assist policy makers to determine the impact of interventions and monitor business performance over time.
Page 7
“Many firms feel that there is a ‘disconnect’
between skills re-quired in the manu-facturing sector and the skills obtained
through colleges. In light of these chal-lenges, the majority (70%) of firms hire people without the required skills and
provide training.”
5. Countries in the region have been experiencing high GDP growth with Zambia and Mozambique, both of which imports significant volumes of goods from South Africa, being expected to grow at 6.6% and 8.1%, respectively, in 2016.
Q U A R T E R L Y C O M P E T I T I O N R E V I E W

On 17 November 2016, the South African Competition Tribunal (“Tribunal”) confirmed a settlement agreement reached between the Competition Commission and ArcelorMittal South Africa Ltd (AMSA) with regards to AMSA’s involvement in the long steel and scrap metal cartels. The settlement covered four complaints against AMSA, three of which involved collusion in flat steel, long steel and scrap metal markets and the other on excessive pricing of flat steel products. AMSA agreed to pay an administrative penalty of R1.5 billion, the largest penalty to be imposed on a single firm in South Africa. In addition, AMSA also agreed to a pricing remedy to address competition concerns relating to its pricing policy which included a five year limit to its earnings before interest and tax (EBIT) margin to a cap of 10% for flat steel products sold in South Africa and a commitment to R4.5 billion capital expenditure over the next five years. Although the AMSA settlement is the biggest in the history of competition enforcement in South Africa,
the fine appears small given the impact of AMSA’s conduct on the rest of the economy (12% of long steel turnover in 2008). The price of steel as an important intermediate product into sectors such as construction and metal fabrication has significant implications on the competitiveness and price of domestic production of a range of metal products in steel dependent sectors. The R1.5 billion administrative penalty The literature on settlement programmes indicates that they generate clear and significant benefits both to competition authorities and respondent firms. First, they reduce legal costs for both the respondent firms and competition authorities. This process allows for speedy resolution of the case outside the formal litigation route thereby saving both competition authorities and respondent firms financial resources. An added advantage for competition authorities is that settlement reduces the time period between case inception and
final decision, and helps the authority gain additional information which can support the prosecution of remaining respondents. The process enables the respondent firm’s management, particularly when management and ownership may have changed since the period of the conduct, to conclude the matter. Competition authorities have strong incentives to settle since it reduces continued consumer harm due to continued anti-competitive conduct.
For settlement programmes to work all parties involved must
see the benefits of settling rather than going through the formal litigation process. This is one of the reasons why fines under settlements are lower
than administrative penalties charged when cases are formally litigated in court. However, to enable deterrence, the size of fines under settlement needs to also be sufficiently high relative to the gains from the conduct and not just in monetary terms, just as with penalties in contested cases, to ensure deterrence of future conduct.
R E F L E C T I O N O N T H E A R C E L O R M I T T A L S E T T L E M E N T
Page 8 Q U A R T E R L Y C O M P E T I T I O N R E V I E W
Review of the ArcelorMittal settlement
Tatenda Zengeni
“However, fines are generally far lower than the
actual harm that arises from the
conduct.”

However, fines are generally far lower than the actual harm that arises from the conduct. The R1.5 billion penalty in the AMSA settlement covered two cases in which AMSA admitted to its violation of the Act. In the long steel and scrap metals complaints AMSA admitted that it engaged in anti-competitive conduct that contravened section 4(1)(b) of the Act. AMSA is thus guilty of multiple contraventions, each of which is presumed harmful and would have warranted a high penalty on its own. Steel is a crucial intermediate product into other sectors such as construction and manufacturing. Therefore its pricing has important implications for the competitiveness of other downstream industries. The high cost of steel due to import parity pricing was cited by mining capital equipment manufacturers as one of the challenges facing local manufacturers.
1 It results in
increased product costs which local firms have to either absorb, or pass on to the customer which further erodes their competitiveness relative to imported products.
Another important consideration in the case is that ArcelorMittal is a repeat offender (including outside South Africa) and in several markets over an extended period of time. In the European Union, there are specific provisions in the legislation for punishing repeat offenders. For instance in a 2011 pre-stressing steel cartel case, ArcelorMittal’s fine was increased by 60% above the normal fine since it was a repeat offender. In South Africa, higher penalties may be applied on specific or affected turnover of the firm as long as the overall fine amount is not larger than 10% of the total turnover of the entity. The practice in recent cases and in terms of the Commission’s fining guidelines has been a penalty of around 15-30% of affected turnover before a multiplier for duration is applied. As such, the competition authorities could have sought higher penalties above 10% in the long steel and scrap metals matters. For
example, AMSA’s long steel turnover in 2008 (case was first referred in 2009) was R12.9 billion based on annual reports. Therefore, a penalty even marginally above 10% of long steel turnover alone (say, 15%) would have been larger than the agreed penalty for multiple cases settled and well below 10% of total turnover of around R40 billion in 2008. This simple example suggests significant discounting of the settlement penalty agreed with AMSA. Pricing remedy on flat steel products On pricing commitments, AMSA agreed to maintain an EBIT margin of not more than 10% per year (which may be exceeded to a maximum of up to 15% if the raw material basket spread is more than $350/ton) for a period of five years on all flat steel products produced at Vanderbijlpark and sold in South Africa. Figure 1 below tracks EBIT margin performance for AMSA’s flat steel activities since 2005. AMSA only had a positive EBIT margin averaging about 26% between 2005
Page 9 I S S U E 2 0 1 7 / 0 1
Figure 1: Earnings Before Interest and Tax (EBIT) for flat steel
Source: AMSA annual reports
1. ‘Gauteng Machinery and Equipment Strategy, 2016 – 2019’. CCRED unpublished report.
and 2008. It started experiencing a negative EBIT margin since 2009 and again from 2011. The main reason stated by the company for its poor performance was intense competition from cheap Chinese imports. China has experienced an oversupply of steel since 2009 which has led to a sharp drop in steel prices around the world. Furthermore, China is alleged to be exporting its products at below cost of production resulting in many countries around the world imposing duties to protect domestic industries. In South Africa, ITAC imposed a 10% duty in 2015 on all imported steel. In this regard, it is worth
noting that the 10% margin cap is significantly lower than the margins of above 20% that AMSA earned in the mid-2000s prior to the influx of Chinese imports, and significantly greater than margins earned from 2009. The imposition of a duty by ITAC may contribute to positive margins for AMSA going forward although now capped at the agreed level of 10%. An important question is whether AMSA’s margins could reasonably be expected to exceed 10% in the coming years, and as such whether the cap of 10% is potentially set too high.
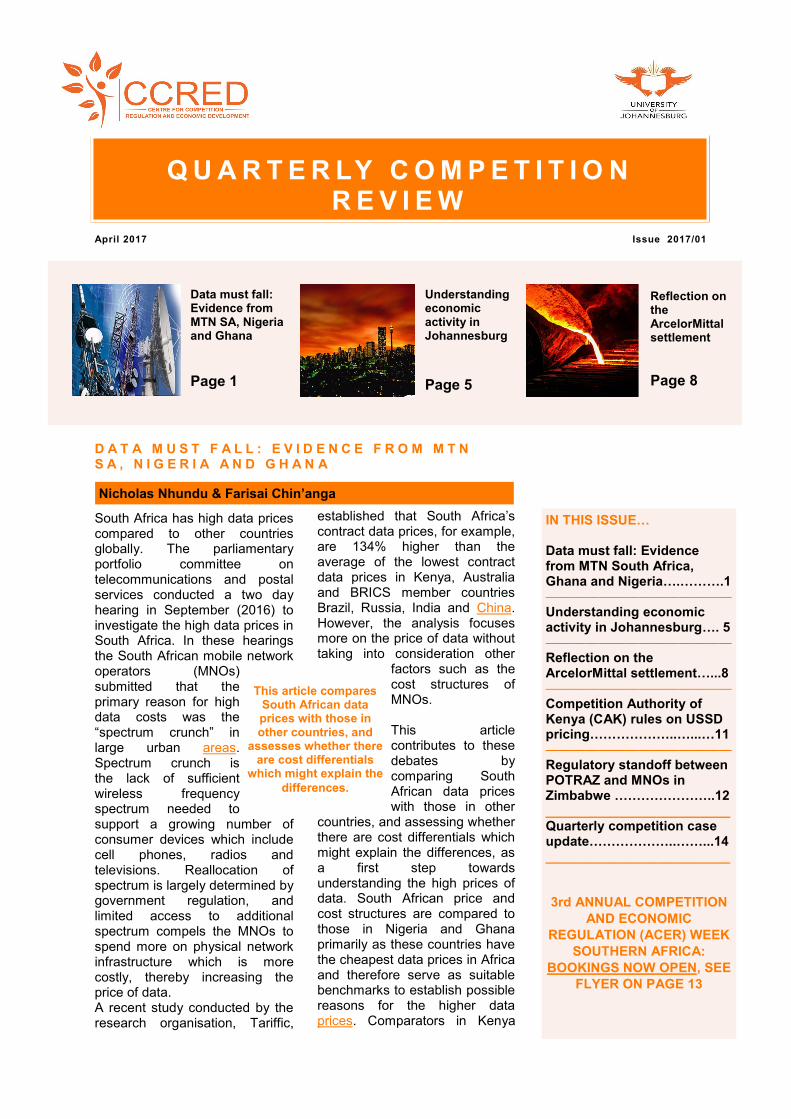
Capital investment AMSA also committed to R4.5 billion capital expenditure over the next five years as part of the settlement. This translates to about R900 million per year. An assessment of AMSA’s average capital expenditure for the past six years (see Figure 2) indicates that AMSA has been investing an average of R1.5 billion per year. The figure is about R600 million more than the average of R900 million that the firm has committed to in the settlement with the Commission. The capital investment agreed to by AMSA already falls short of what the
Page 10 I S S U E 2 0 1 7 / 0 1
Figure 2: ArcelorMittal capital expenditure
Source: AMSA annual reports
company is already investing to improve its efficiency. Therefore, while the commitment appears large in monetary terms, it appears to be generous on the part of the competition authorities. The commitment made is not indicative of an effort on the part of AMSA to mitigate some of the harm caused by the conduct on downstream consumers in particular, nor is it sufficiently punitive. Conclusion Although settlements are generally seen as encouraging firms to admit anti-competitive conduct through the offer of a lower
penalty, the case above shows that AMSA’s fine is low when considering the impact of steel prices on the rest of the economy. However, determining the level of fines in settlement cases is not easy and the authorities will have considered the strength of evidence available for successfully prosecuting AMSA in a contested hearing. Nonetheless, it is expected that the Commission’s case would have been sufficiently strong given information received from other firms that have settled the same cases prior to AMSA, and the confirmations provided
by AMSA as well. If this was the case, it does not appear that the administrative penalties agreed in settlement and the additional investment commitments are sufficiently large to deter conduct and send a message that firms that contravene the Act will be punished severely. However, it is worth noting that the Commission would have considered the very poor financial performance of ArcelorMittal and the industry in recent years as a mitigating factor, perhaps at the expense of accounting fully for economic harm caused.
The Competition Authority of Kenya has ordered all mobile money service providers, including Safaricom, to disclose all mobile money service fees payable by consumers for USSD (unstructured supplementary service data) based transactions. The new regulations which were introduced late in 2016, require customers to be informed of all fees prior to the completion of a transaction. This directive comes following concerns over lack of transparency in billing of customers, as well as allegations of Safaricom charging high fees for mobile money services. The intervention is part of an effort by the authority to promote price awareness and product comparisons in the mobile money market particularly given competition concerns that have previously arisen in the provision of USSD in Kenya and other markets. These concerns typically relate to potential abuses of market power by dominant mobile network operators (MNO). In 2013, Zimbabwe’s largest
MNO initially refused to allow banks access to its mobile money service platform (EcoCash) and later Econet charged banks far more for accessing its USSD service than it cost to provide the service.
Recent positive developments in Kenya are that Safaricom will lower its USSD charges for financial transactions through its network. Under a signed agreement between
the CAK and Safaricom, the mobile operator is expected to cut prices from between Sh2 and Sh5 per USSD session and occasionally as high as Sh10, down to just Sh1 (about $0.01). This decision to reduce USSD rates comes after a market inquiry commissioned by the CAK and undertaken by a team which included economists from CCRED. The inquiry was driven by concerns over USSD pricing structures which prevented effective competition between financial institutions and
Safaricom’s mobile money (M-Pesa) service. Disclosure and transparency of pricing and information availability is an important part of the competitive process in most markets. In mobile money or telecoms services, it allows consumers to switch between mobile money service providers or competing networks. As such the service providers face competitive pressure to maintain lower prices and/or better range and quality of services to retain customers.
Competition issues in mobile money service provision can be heightened in a market where there is an incumbent with significant market power and the market is not
contestable due to consumer inertia. Therefore enabling competition on the demand side through regulation that encourages transparency in prices and customer switching can have a positive impact on competition.
C O M P E T I T I O N A U T H O R I T Y O F K E N Y A ( C A K ) R U L E S O N U S S D P R I C I N G
Page 11 Q U A R T E R L Y C O M P E T I T I O N R E V I E W
New rules issued for USSD pricing in Kenya
Maria Nkhonjera
New regulations
require customers to
be informed of all fees prior to completion of mobile money transactions
CAK has driven Safaricom to lower USSD
rates following market inquiry

The Postal and Telecommunications Regulatory Authority of Zimbabwe (POTRAZ) set floor prices for data and voice services including promotional packages, effective in January 2017. The floor prices are set at $0.12 per minute for voice services, and $0.02 per megabyte for data. Initially data prices were below $0.01 per megabyte.
The floor prices are said to be aimed at ensuring the sustainability of the industry by addressing the apparent under-pricing of data and voice services as a result of price wars. The standoff resulted from a wide consumer outcry that led to blame-shifting between MNOs and government regarding who proposed the floor prices, which were in some cases set above the prevailing price levels. The Minister of ICT has since suspended the tariff increases.
In spite of who had initially proposed the floor prices, this is a setback to achieving a
competitive telecoms industry especially if the floor prices are above competitive prices currently or in future as costs and demand shift. The intervention is likely to negate some of the gains from previous regulatory changes aimed at improving competitive outcomes in the industry in Zimbabwe, including interventions that reduced rates charged to banks for USSD access.
More recently POTRAZ proposed a compulsory sharing of the network infrastructure, in recognition of the need to manage the high costs of infrastructure rollout particularly for new entrants. It may be the case that MNOs had experienced rising costs which necessitated higher prices in the market, although it would be expected that the MNOs themselves would raises tariffs such that increases would reflect their respective cost structures which are largely different.
R E G U L A T O R Y S T A N D O F F B E T W E E N P O T R A Z A N D M O B I L E N E T W O R K O P E R A T O R S I N Z I M B A B W E
Page 12 Q U A R T E R L Y C O M P E T I T I O N R E V I E W
Floor prices introduced for voice and data
services
Teboho Bosiu

Page 14
Quarterly competition case update - Mergers and acquisitions
Country Target Acquirer Status
Botswana
70% issued shares of Safari Adventure Company (Pty) Ltd in Hana-ven (Pty) Ltd
Soren Lindstrom Safari (Pty) Ltd
Approved
Global Holdings Botswana (Pty) Ltd
PST Sales and Distribution (Pty) Ltd
Approved
25% shareholding in PST and Distribution Sales
Imperial Capital Ltd Approved with conditions
Poultry assets from Bokomo Botswana (Pty) Ltd
Amigear Ventures (Pty) Ltd Approved
50% shares in Cottesloe Consultants (Pty) Ltd
Amigear Ventures (Pty) Ltd Approved
19.91% of the shares in Vivo Energy Holding B.V.
Vitol Africa B.V. Approved
50% of the issued shares in Bidvest Bakery Solutions
Puratos Group NV Approved
100% shares in Kwena Concrete Products (Pty) Ltd
Steelbase (Pty) Ltd Approved
Packo (Pty) Ltd Rhodes Food Group (Pty) Ltd Approved
Buildezee Adhesives Botswana (Pty) Ltd
Saint-Gobain Development Sub-Saharan Africa Ltd
Approved
Brand activation business of Expo Botswana and its business assets
CA Sales Holdings (Pty) Ltd Approved
Kwikot (Pty) Ltd Aktiebolaget Electrolux (Publ) Approved
51% shareholding in First Sun Alliance Insurance Brokers
Tiny Kgatlwane; Tebatso Lekalake; Kgaotsang Matthews and Keneilwe Mere
Approved
Legit Botswana Business Newco Approved
All the manufacturing assets of Can Manufacturers
Nampak Products Ltd and Newco
Approved with conditions
Capital in Fox (Pty) Ltd and Tyrepro Botswana (Pty)
Harshadkumar Patel, the principal controller and shareholder of the Motovac Group of Companies
Approved
Joy Global Incorporation Komatsu America Corporation
Approved
71.23% of the issued share capital of Imara Holdings Ltd
FWA Financial Ltd Approved
Assets of Messina Copper (Botswana) (Pty) Ltd
Leboam Holdings (Pty) Ltd Approved
The Competition Authority found that the merger in which Universal House (Pty) Ltd acquired 28.73% was likely to result in the prevention or substantial lessening of competition. Having already been implemented without prior notification, the Authority directed the parties to dispose of the 28.73% shares to an entity or person(s) with no business interests affiliated in any way with the acquiring entity, within 3 months from the decision date.
Kenya
Business, assets and liabilities of Habib Bank Ltd in Kenya
Diamond Trust Bank Kenya Ongoing
Gulf African Petroleum Corporation (Gapco)
Total Kenya Approved with conditions
Real IPM Kenya (Thika) Biobest Ongoing
Hashi Energy Ltd Lake Oil Ltd Ongoing
Dan Pharmacie Goodlife Pharmacy Approved 49.99% stake in Servair HNA Group Approved
I S S U E 2 0 1 7 / 0 1

Page 15
Namibia Pointbreak and Ebank FNB Approved
South Africa
Pakco Rhodes Food Group Approved with conditions
Synergy Income Fund Ltd Arrowhead Properties Ltd Approved with conditions
Kouga Wind Farm (RF) Pty Ltd, Rustmo1 Solar Farm (RF) Pty Ltd and Slimsun (RF) Pty Ltd
TriAlpha Investment Vehicle Approved
Kalagadi Manganese (Pty) Ltd Kgalagadi Alloys (Pty) Ltd Approved
Standard General Insurance Company
Guardrisk Life Approved
Platchro Holdings Precrete Holdings Approved
Kagiso Tiso Holdings Kagiso Capital Approved
JAB Dried Fruit Products The Bruce Fruit Approved
Aldwych Power Holdings, Aldwych International, Cabeolica SA and Cenpower Generation Company
Holdco, DevCo and AssetCo Approved
Boxlee (Pty) Ltd and Pride Pak Packaging
Corruseal Group Prohibited
Hitachi Koki KKR & Co. LP Approved
Cornastone Enterprise Systems (Pty) Ltd
EOH Mthombo (Pty) Ltd Approved
Joy Global Inc Komatsu America Corp Approved
RMB-SI Investment (Pty) Ltd Swanvest 120 (Pty) Ltd Approved
Feedem Pitseng (Pty) Ltd and Cristal Solutions (Pty) Ltd
Extolite (Pty) Ltd Approved
ETG Inputs Holdco Ltd
Government Employees Pension Fund (GEPF)
Approved
Zendai Development (South Africa) (Pty) Ltd, Zendai Investment Management (South Africa) (Pty) Ltd and Zendai Capital (Pty) Ltd
JR 209 Investments (Pty) Ltd Approved
ADT Security Fidelity Security Services Approved
Tanzania Brookside Dairy Tanzania Danone Approved
Zimbabwe
Edcon Parentco Approved with conditions
Msasa Bricks Beta Tiles Approved
Lease of Four Service Stations
Total Zimbabwe Approved
Brandcorp Holdings Bidvest Group Approved
Pembani Oil Vele Petroport Holdings SA Approved
Datlabs Zimbabwe Pharmaceuticals Ongoing
Global Anaesthetic Portfolio of AstraZeneca AB and AstraZeneca UK
Aspen Global Incorporated Approved
Q U A R T E R L Y C O M P E T I T I O N R E V I E W

Page 16
Quarterly competition case update - Main enforcement cases
Country Case summary
Egypt
The Egyptian Competition Authority has referred seven medical supply companies for prosecution for colluding to offer identical prices in tenders offered to government and to University hospitals.
Kenya
Following a market inquiry into the pricing of Unstructured Supplementary Service Data (USSD) used to carry out mobile financial transactions, the Competition Authority of Kenya (CAK) has compelled Safaricom, the dominant mobile money provider in Kenya to lower prices charged to third parties for USSD services and to make these charges transparent.
The CAK has dismissed a case brought by the Kenya Taxi Cab Association (KTCA) in which it claimed that Uber’s pricing was an abuse of dominance and petitioned that Uber be forced to set minimum charges. The CAK however found that Uber’s revenue market share of 30.63% and fleet stake of 28.6% is below the threshold required to make a player dominant. Additionally, it found that Uber prices of Sh42 a kilometre were above the Sh15.16 required for a taxi operator to break-even, making it profitable enough to attract entrants.
The CAK has granted Kenya Wine Agencies Ltd (Kwal) a five-year exclusive deal to import and distribute brands made by South African brewer Distell expiring in 2019 having started in 2014. Distell brands account for 50% of Kwal sales.
South Africa
The Competition Commission has referred a car carrier company‚ Kawasaki Kisen Kaisha Ltd for prosecution to the Tribunal for colluding on a tender for transportation of Toyota vehicles between 2001 and 2013. The company is accused of price fixing‚ market division and collusive tendering on different routes including South Africa to Europe‚ North Africa and the Caribbean Islands via Europe‚ West Africa‚ East Africa and the Red Sea by sea.
The Competition Commission raided 9 fresh produce market agents in Johannesburg, later extending its investigations to agents in Cape Town and Durban following reports from the Department of Agriculture, Forestry and Fisheries of cartel conduct in freshly produced fruit and vegetables.
Unilever South Africa and Sime Darby Hudson Knight have been referred to the Competition Tribunal for collusion following an investigation that showed that the two companies divided markets for the manufacture and supply of specific types of bakery and cooking products of particular customers across the country.
Three recruitment firms: Human Communications (Pty) Ltd‚ Kone Staffing (Pty) Ltd and Jobvest (Pty) Ltd have been referred to the Competition Tribunal for prosecution for price fixing, market division and collusive tendering. All three firms were found to have agreed to the prices that were quoted to their clients.
The Competition Tribunal upheld the Competition Commission’s finding that two manufacturers of regular high density polyethylene (HDPE) pipes (Dawn Consolidated Holdings through its subsidiary DPI Plastics Pty Ltd, and Sangio Pipes Pty Ltd) colluded to divide markets between 2007 and 2012. The Tribunal found that in a shareholders’ agreement Dawn undertook not to manufacture HDPE piping for as long as it or its associates held shares in Sangio.
The Competition Commission reached an agreement with Citibank N.A. following the bank’s participation in a forex trading cartel from 2007. Citibank N.A. and its competitors had colluded on prices for bids, offers and bid-offer spreads for the spot trades in relation to currency trading involving the US Dollar / Rand currency pair. Citibank N.A. has agreed to pay an administrative penalty of R69 500 860 for its role in the cartel. The referral against the remaining will be heard by the Tribunal.
The Competition Tribunal confirmed a settlement agreement between the Competition Commission and Blinkwater Mills (Pty) Ltd in which Blinkwater agreed to pay a fine of R10 million for colluding with other maize milling firms to fix the price of milled white maize as well as the dates when the new pricing would be implemented between 1999 and 2007. The penalty amounts to 5% of the company’s annual turnover for the year ending 2007 and is payable in 3 instalments within a year.
I S S U E 2 0 1 7 / 0 1

1st Floor 6 Sturdee Avenue Rosebank Johannesburg 2196
Tel: 011 559 7510 Email: [email protected] Website: www.competition.org.za
WE HAVE MOVED!
@CCRED_UJ @CCRED-UJ @CCREDuj2011
RESEARCH, TEACHING AND ADVICE ON COMPETITION, REGULATION AND
INDUSTRIAL DEVELOPMENT IN AFRICA