quarterly inflation report - bnr: home · saar seasonally adjusted annual rate. 2 contents ... the...
TRANSCRIPT
National Bank of Rwanda
QUARTERLY INFLATION REPORT
WP02/2016Q2
Kigali, September 2016

1
LIST OF ACCRONYMS
IMF International Monetary Fund
OECD Organization for Economic Co-operation and Development
EIU Economists Intelligence Unit
WEO World Economic Outlook
WB World Bank
CIEA Composite Index of Economic Activities
SAAR Seasonally Adjusted Annual Rate

2
CONTENTS
LIST OF ACCRONYMS ............................................................................................................... 1
EXECUTIVE SUMMARY ............................................................................................................. 3
1. EXTERNAL ENVIRONMENT .................................................................................................. 6
1.1. Global economic activities ......................................................................................................... 6
1.2. Fiscal and Monetary policies and international financial markets ....................................................... 7
1.3. Global inflation developments and outlook ................................................................................... 7
1.4. International commodity prices ................................................................................................... 8
2. THE DOMESTIC ECONOMY .................................................................................................. 8
2.1. Domestic demand and output ..................................................................................................... 8
2.2. Financial Sector developments ................................................................................................. 14
2.2.1 Interest rate developments ...................................................................................................... 14
2.2.2 Exchange rate developments .................................................................................................. 14
2.3. Fiscal spending ...................................................................................................................... 16
2.4. Previous monetary policy stance ............................................................................................... 16
2.5. Inflation developments ............................................................................................................ 16
3. INFLATION OUTLOOK ......................................................................................................... 18
3.1 Domestic aggregate demand ..................................................................................................... 18
3.2 Supply shock ......................................................................................................................... 19
3.3 Exchange rate developments ..................................................................................................... 19
3.4 Global and regional inflationary pressures ................................................................................... 19
3.5 International commodity prices ................................................................................................. 20
3.6. Inflation forecasts .................................................................................................................. 20
3
EXECUTIVE SUMMARY
The quarterly Inflation report presents the National Bank of Rwanda’s assessment of the current and future
macroeconomic developments influencing inflation. The inflation forecasts are one of the inputs to the
Monetary Policy Committee (MPC) decision making process.
In 2016Q2, the global economy continued to face headwinds, including weaker growth among advanced
economies and persistently low commodity prices as well as lackluster global trade and capital flows.
However, conditions remained markedly challenging for commodity exporters which continued to struggle
to adjust to the new era of depressed prices whereas commodity importers remained broadly resilient. In
this context, the Rwandan economy remained generally robust, growing by 6.5% in real terms during the
first half of 2016 from 7.4% of the same period in 2015 as real GDP growth in 2016Q2 dropped to 5.4%
compared to 7.2% of the same period in 2015, mainly constrained by the reduced performance of the
agriculture sector and the contraction in the industry sector. Going forward, the trend of the real Composite
Index of Economic Activities (CIEA) and total turnovers indicate that the Rwandan economy may slightly
improve in 2016Q3. During the first two months of 2016Q3, total turnovers increased by 14.4%, up from
11.0% registered in the corresponding period of 2015Q3 whereas the real CIEA grew by 11.2% from
10.3% during the same period.
Despite the observed decline in year-on-year growth for outstanding credit to the private sector to 19.6%
and 21.5% in August and July 2016 respectively from 26.9% and 27.3% realized in the same months of
2015, monetary policy broadly remains supportive. The decline in outstanding credit was largely due to the
increase in short-term lending and thus the stock of credit is expected to rise following the increase in new
authorized loans by 11.5% in the first eight months of 2016, up from 9.8% recorded in the same period of
last year.
In line with the structural problem of a persistent trade deficit and the recent increase in the demand for
foreign exchange by some big strategic investment projects under the Private-Public Partnership (PPP)
framework, pressures on the FRW has been increasing, thus raising the pass through to domestic prices.
In 2016Q2 headline inflation went up to 4.9% on average from 4.5% recorded in 2016Q1. This increase
was mostly reflected in transport inflation, reaching 7.3% from 4.6% during the same period. Though food
inflation continued to reduce in 2016Q2, the effect from the jump in prices for vegetables that took place in
2015Q4 did not die out completely and was even exacerbated by an even bigger jump in June and July that
has persisted up to August. The surge in core inflation from 2.8% in 2016Q1 to 3.8% in 2016Q2 came in
anticipation of the announced increase in external common tariff of some food products classified as core
namely imported oils and sugar as well as from the exchange rate effect. In addition, inflation of other local
core products such as milk products edged up in 2016Q2 due to the dry season. Imported inflation

4
continued to hike in 2016Q2 to reach 4.0% on average from 2.1% in 2016Q1 and this trend continued in
July and August. Imported inflation was mostly driven by transport costs which were affected by purchase
of vehicles and imported food inflation which bounced up to 2.3% from 1.1% during the same period
following the levy applied on processed food imported from the EAC region that do not meet the
originality conditions. Domestic inflation slightly reduced but remained high in 2016Q2 at 5.2% from 5.3%
as a result of the slowdown in food inflation in April and May.
Looking ahead, the main risks to the inflation outlook remain the volatile and weather-dependent food
prices and the growing exchange rate pressures. Although some mild downward pressures may come from
the reduction in local pump prices, upward pressures will continue to come from the effect of the increase
in tariffs for products such as sugar, imported cooking oils, cement, clothing and footwear. Additional
upward pressures will also continue to come from the level shifts in local bus fares and in education fees, as
well as from the increase in prices of soft drinks produced by Bralirwa. In view of the above upside and
downside risks, inflation is expected to lie between 5.6% and 6.6% in September 2016 and between 5.2%
and 6.2% in December 2016.

5
ACKNOWLEDGEMENTS
A team from the Monetary Policy & Research Department, spearheaded by the Modeling and
forecasting division, prepared the 2016Q2 inflation report with notable contribution from Mr.
Mathias KARANGWA (Manager, Modeling & forecasting division) & Mr. MWENESE Bruno
(Senior Economist, Modeling & forecasting division) whereas Prof. Kasai NDAHIRIWE (Director,
Monetary policy and Research Department) edited and reviewed the report.
6
1. EXTERNAL ENVIRONMENT
1.1. Global economic activities
The world economy lost momentum in the first
half of 2016. It is estimated to have grown by
2.9% in 2016H1 lower than the April and July
2016 IMF projections. This sluggishness is
mainly observed in advanced economies and
Sub-Saharan Africa while emerging markets
economies in Asia and Europe showed relatively
positive economic growth.
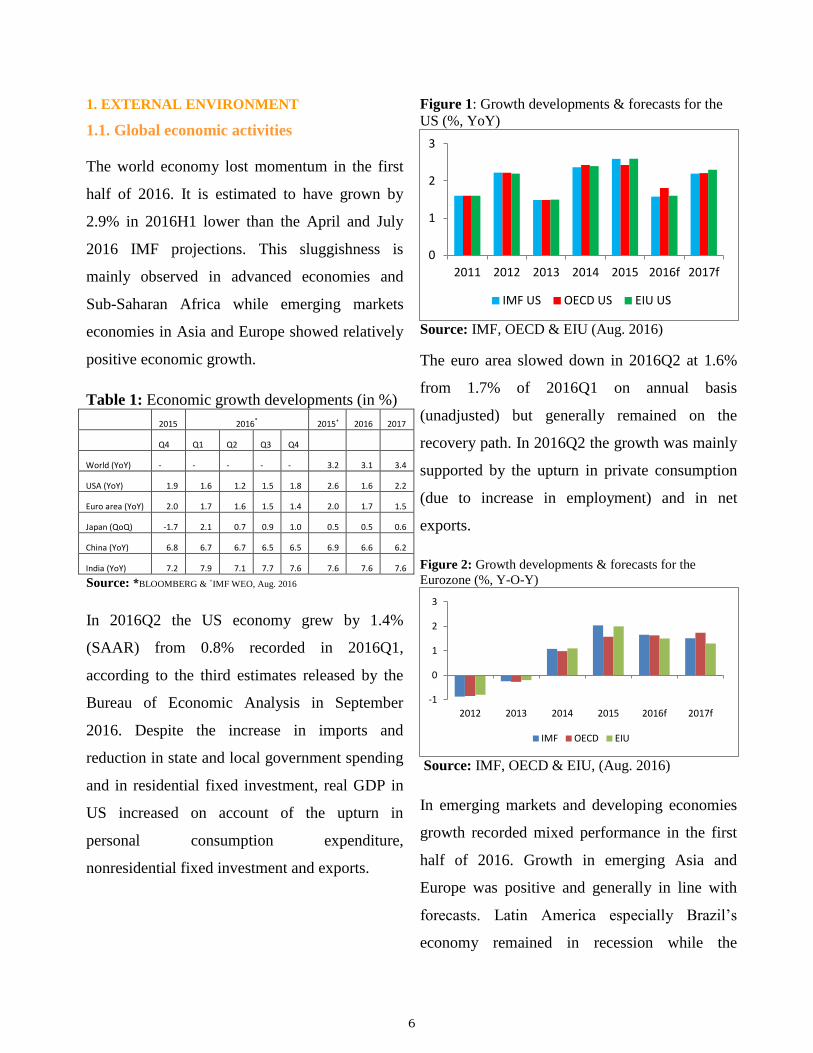
Table 1: Economic growth developments (in %)
2015 2016* 2015+ 2016 2017
Q4 Q1 Q2 Q3 Q4
World (YoY) - - - - - 3.2 3.1 3.4
USA (YoY) 1.9 1.6 1.2 1.5 1.8 2.6 1.6 2.2
Euro area (YoY) 2.0 1.7 1.6 1.5 1.4 2.0 1.7 1.5
Japan (QoQ) -1.7 2.1 0.7 0.9 1.0 0.5 0.5 0.6
China (YoY) 6.8 6.7 6.7 6.5 6.5 6.9 6.6 6.2
India (YoY) 7.2 7.9 7.1 7.7 7.6 7.6 7.6 7.6
Source: *BLOOMBERG & +IMF WEO, Aug. 2016
In 2016Q2 the US economy grew by 1.4%
(SAAR) from 0.8% recorded in 2016Q1,
according to the third estimates released by the
Bureau of Economic Analysis in September
2016. Despite the increase in imports and
reduction in state and local government spending
and in residential fixed investment, real GDP in
US increased on account of the upturn in
personal consumption expenditure,
nonresidential fixed investment and exports.
Figure 1: Growth developments & forecasts for the
US (%, YoY)
Source: IMF, OECD & EIU (Aug. 2016)
The euro area slowed down in 2016Q2 at 1.6%
from 1.7% of 2016Q1 on annual basis
(unadjusted) but generally remained on the
recovery path. In 2016Q2 the growth was mainly
supported by the upturn in private consumption
(due to increase in employment) and in net
exports.
Figure 2: Growth developments & forecasts for the
Eurozone (%, Y-O-Y)
Source: IMF, OECD & EIU, (Aug. 2016)
In emerging markets and developing economies
growth recorded mixed performance in the first
half of 2016. Growth in emerging Asia and
Europe was positive and generally in line with
forecasts. Latin America especially Brazil’s
economy remained in recession while the
0
1
2
3
2011 2012 2013 2014 2015 2016f 2017f
IMF US OECD US EIU US
-1
0
1
2
3
2012 2013 2014 2015 2016f 2017f
IMF OECD EIU
7
economic activity in Sub-Saharan Africa
weakened as Nigeria entered into a recession and
the South African economy remained flat.
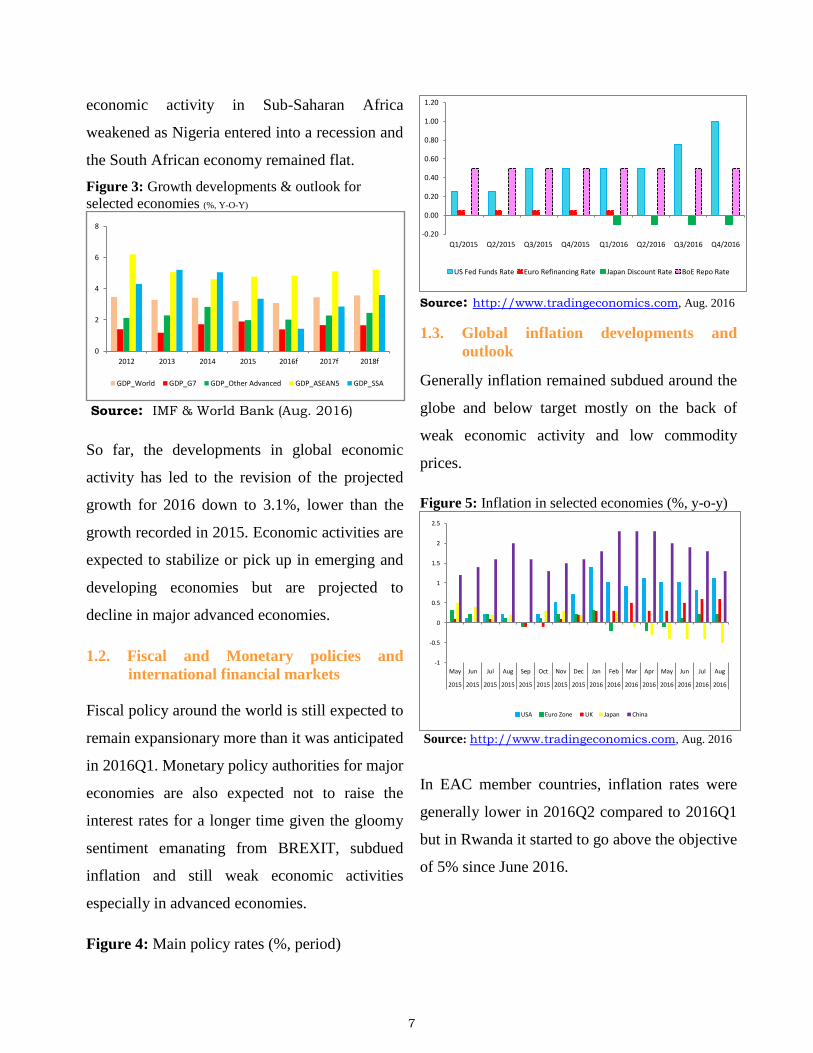
Figure 3: Growth developments & outlook for
selected economies (%, Y-O-Y)
Source: IMF & World Bank (Aug. 2016)
So far, the developments in global economic
activity has led to the revision of the projected
growth for 2016 down to 3.1%, lower than the
growth recorded in 2015. Economic activities are
expected to stabilize or pick up in emerging and
developing economies but are projected to
decline in major advanced economies.
1.2. Fiscal and Monetary policies and
international financial markets
Fiscal policy around the world is still expected to
remain expansionary more than it was anticipated
in 2016Q1. Monetary policy authorities for major
economies are also expected not to raise the
interest rates for a longer time given the gloomy
sentiment emanating from BREXIT, subdued
inflation and still weak economic activities
especially in advanced economies.
Figure 4: Main policy rates (%, period)
Source: http://www.tradingeconomics.com, Aug. 2016
1.3. Global inflation developments and
outlook
Generally inflation remained subdued around the
globe and below target mostly on the back of
weak economic activity and low commodity
prices.
Figure 5: Inflation in selected economies (%, y-o-y)
Source: http://www.tradingeconomics.com, Aug. 2016
In EAC member countries, inflation rates were
generally lower in 2016Q2 compared to 2016Q1
but in Rwanda it started to go above the objective
of 5% since June 2016.
0
2
4
6
8
2012 2013 2014 2015 2016f 2017f 2018f
GDP_World GDP_G7 GDP_Other Advanced GDP_ASEAN5 GDP_SSA
-0.20
0.00
0.20
0.40
0.60
0.80
1.00
1.20
Q1/2015 Q2/2015 Q3/2015 Q4/2015 Q1/2016 Q2/2016 Q3/2016 Q4/2016
US Fed Funds Rate Euro Refinancing Rate Japan Discount Rate BoE Repo Rate
-1
-0.5
0
0.5
1
1.5
2
2.5
May Jun Jul Aug Sep Oct Nov Dec Jan Feb Mar Apr May Jun Jul Aug
2015 2015 2015 2015 2015 2015 2015 2015 2016 2016 2016 2016 2016 2016 2016 2016
USA Euro Zone UK Japan China

8
Table 2: Inflation in EAC countries (%, YoY)
RWANDA UGANDA KENYA TANZANIA BURUNDI
Aug-2015 3.0 4.8 5.8 6.4 4.2
Sept-15 3.7 7.2 6.0 6.1 4.1
Oct-15 2.9 8.8 6.7 6.3 5.6
Nov-15 4.8 9.1 7.3 6.6 5.8
Dec-15 4.5 9.3 8.0 6.8 7.1
Jan-16 4.5 7.6 7.8 6.5 6.3
Feb-16 4.4 7.7 6.8 5.6 6.7
Mar-16 4.6 6.2 6.5 5.4 4.3
Apr-16 4.7 5.1 5.3 5.1 2.6
May-16 4.6 5.4 5.0 5.2 2.7
Jun-16 5.5 5.9 5.8 5.5 3.9
Jul-16 6.9 5.1 6.4 5.1 3.9
Source: Country Bureaus of Statistics (Aug. 2016)
1.4. International commodity prices
Generally, in 2016Q2 commodity prices showed
a small recovery reflected in fuel products and
non-fuels commodities as well. Despite high
uncertainty around oil prices, the IMF still
projects that oil prices are likely to gradually and
slightly increase in the second half of 2016.
Figure 6: Oil prices’ developments ($/barrel)
Source: IMF, WEO Database (Aug. 2016)
Food prices went up between 2016Q1 and
2016Q2 and are expected to remain above their
2016Q1 level in 2016Q3. Coffee prices also
increased in 2016Q2 and are projected to remain
around the same level towards the end of 2016
but tea prices dropped and are likely to remain
below their 2016Q1 level in the 2016H2.
Figure 7: Non-oil prices developments (%, YoY)
Source: IMF, WEO Database (Aug. 2016)
2. THE DOMESTIC ECONOMY
2.1. Domestic demand and output
In 2016Q2, global economic performance
remained sluggish as Emerging market and
developing economies (EMDEs) continued to
face headwinds, including weaker growth among
advanced economies and persistently low
commodity prices, as well as lackluster global
trade and capital flows.
However, divergences between commodity
exporters and importers persisted. Conditions
remained markedly challenging for commodity
exporters, which continued to struggle to adjust
to the new era of depressed prices. In contrast,
0
50
100
150
2012 2013 2014 2015 2016f 2017f 2018f 2019f 2020f
Brent, WTI, and the DF (US$ /b)
Brent (US$ /b)
DF (US$ /b)
WTI (US$/b)
-40
-20
0
20
40
60
80
Apr-15 Jun-15 Aug-15 Oct-15 Dec-15 Feb-16 Apr-16 Jun-16 Aug-16
Coffee Arabicas, US cents/ poundCoffee Robusta, US cents/poundTea, Mombasa, US cents/ kg
9
commodity importers remained broadly resilient
to headwinds, although the expected growth
windfall from low energy prices has been
surprisingly modest.
Despite the above global headwinds, the
Rwandan economy remained generally robust,
with nominal GDP at current market prices
estimated at RWF 1,549 billion in the second
quarter of 2016, up from RWF 1,428 billion in
the same quarter of 2015. In real terms, growth
of the Rwandan economy slightly slowed to
6.5% during the first half of 2016 from 7.4% of
the same period in 2015.
Growth in real GDP dropped to 5.4% in 2016Q2
compared to 7.2% of the same period in 2015
and 7.6% in 2016Q1, mainly constrained by the
reduced performance of the agriculture sector
and the contraction in the industry sector.
The service sector grew by 9% in 2016Q2 from
6% in 2015Q2 and 8% in 2016Q1. The main
driver of the good performance in services was
trade and transport services, which grew on
annual basis by 12% in 2016Q2 from 5% in the
same period of 2015 while growth in other
services stagnated at 7% during the same period.
Growth in trade and transport services was
buoyed by the robust performance in both
wholesale and retail trade and in transport
services. Wholesale and retail trade grew by 13%
in 2016Q2 from 5% in 2015Q2 whereas growth
in transport services reached 6%, up from 4%
during the same period.
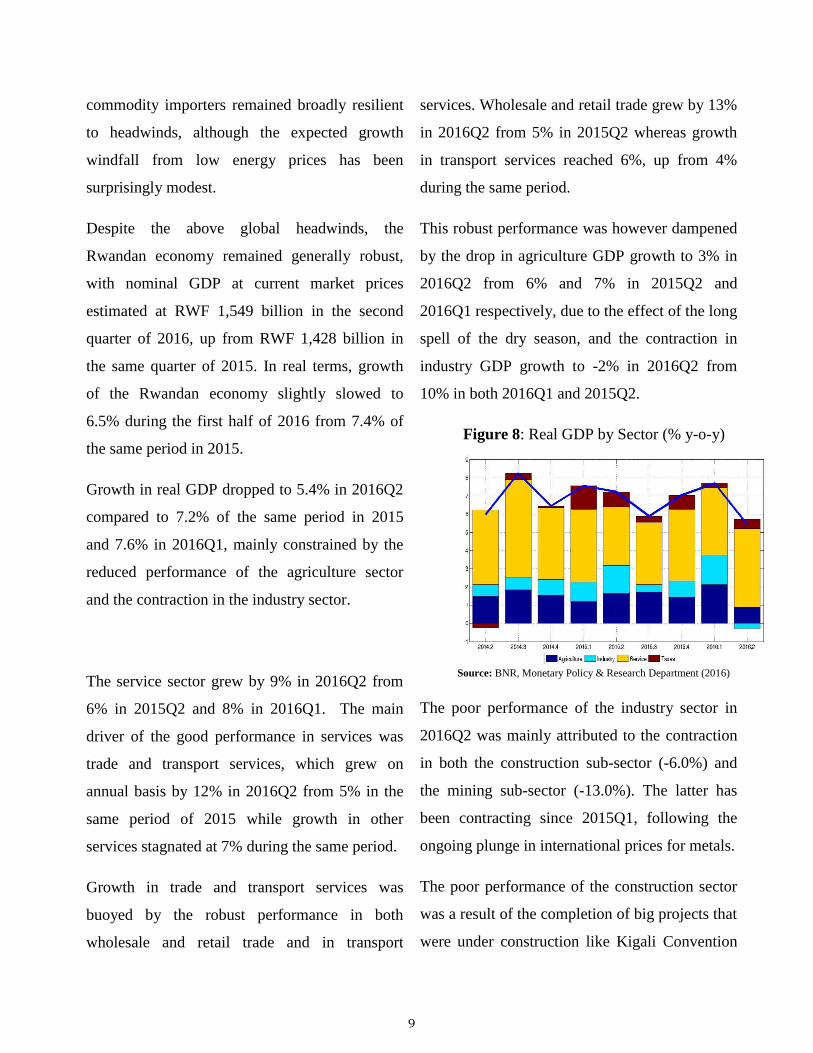
This robust performance was however dampened
by the drop in agriculture GDP growth to 3% in
2016Q2 from 6% and 7% in 2015Q2 and
2016Q1 respectively, due to the effect of the long
spell of the dry season, and the contraction in
industry GDP growth to -2% in 2016Q2 from
10% in both 2016Q1 and 2015Q2.
Figure 8: Real GDP by Sector (% y-o-y)
Source: BNR, Monetary Policy & Research Department (2016)
The poor performance of the industry sector in
2016Q2 was mainly attributed to the contraction
in both the construction sub-sector (-6.0%) and
the mining sub-sector (-13.0%). The latter has
been contracting since 2015Q1, following the
ongoing plunge in international prices for metals.
The poor performance of the construction sector
was a result of the completion of big projects that
were under construction like Kigali Convention

10
Center (KCT), Marriott hotel and roads which
required huge importation of construction
materials mostly in 2015. This led to low imports
of construction materials in the first half of 2016
(-30.6%), in line with the observed contraction in
construction activities in 2016Q2.
From the expenditure account, the observed
slowdown in real GDP growth in 2016Q2 was
mainly due to gross capital formation whose
growth slowed to 8.9% in 2016Q2 from 22.3% in
2016Q1 as gross fixed capital formation slowed
to 9.5% from 22.2% and inventories contracted
by 15.4% after growing by 12.5% during the
same period.
The slowdown in gross fixed capital formation
resulted from construction, which after growing
by 13.3% in the previous quarter, contracted by
6.5% in 2016Q2 following the phasing out of the
aforementioned construction projects.
Growth in total final consumption rose from
3.3% in 2016Q1 to 4.5% in 2016Q2 following
the recovery in private consumption from -3.0%
to 2.2% that helped to offset the slowdown in
government consumption from 23.2% to 18.7%
during the same period.
Generally, despite the improvement in private
consumption from 3.3% in 2016Q1 to 4.5% in
2016Q2, growth in domestic demand slowed to
5.5% in 2016Q2 from 7.8% in the previous
quarter following the slowdown in gross capital
formation recorded in 2016Q1.
Exports of goods and services grew by 16.7% in
2016Q2 from 7.8% in the previous quarter while
imports of goods and services rose by 10.6%
from 8.4% during the same period. As a result,
the trade deficit expanded by 5.8% in 2016Q2,
down from 8.5% recorded in the previous
quarter.
Figure 9: Real GDP by expenditure (% y-o-y)
Source: BNR, Monetary Policy & Research Department (2016)
In line with the leading economic indicators,
Rwanda’s economic performance in 2016Q3 is
expected to be higher than in 2016Q2. In annual
terms, total turnovers in the first two months of
2016Q3 increased by 14.4% up from 11.0%
registered in the corresponding period of
2015Q3, with declining contribution from
services and growing contribution from the
industry sector turnovers.
The big increase in service sector turnovers
observed in June is partly linked with the five
meetings hosted by Rwanda, in which at least
2800 delegates attended. The number of
meetings and delegates went on gradually

11
reducing in subsequent months
(http://www.rcb.rw/mice-calendar-events/).
Figure 10: Total turnovers (%, YoY)
Source: BNR, Monetary Policy & Research Department (2016)
Though the construction sub-sector was not
doing well in 2016Q2, growth in its turnovers
hiked from 4.1% in June to a remarkable 33.6%
and 69.0% in July and August 2016 respectively
compared to 19.6%, 7.0% and 12.7% recorded
during the same months in 2015.
The turnovers for the construction sector
significantly increased during the first two
months of 2016Q3 as a result of the ongoing
construction of roads and the turnovers
declaration of works done in the previous
quarters. This is evidenced, for instance, by a
high increase in turnovers of two construction
companies that grew by 532.8% and 76.4%,
having a combined share of 31.6% in July –
August 2016 of the total turnovers of the
construction sub-sector.
The performance of the mining sector remains
constrained by the ongoing slump in international
commodity prices. Following the reconstruction
of Mukungwa 1 and Kivuwatt hydro-power
plants, the turnovers for the energy sector is
expected to remain high going forward.
Figure 11: Industry turnovers
Source: BNR, Monetary Policy & Research Department (2016)
Growth in the service sector turnovers slid from
21% in June 2016 to 13.6% and 9.0% in July and
August respectively. This decline was mainly
due to the reduced performance in trade services,
especially retail and wholesale trade. Growth in
trade services eased from 20.7% in June to
20.2% and 5.2% in July and August 2016
respectively.
Figure 11: Services’ turnovers
Source: BNR, Monetary Policy & Research Department (2016)

12
The real CIEA, which is highly correlated with
real GDP (figure 13), grew by 11.2% in the first
two months of 2016Q3, up from 10.3% recorded
in the corresponding period of 2015Q3,
confirming that the economy is likely to improve
in the third quarter of 2016.
Figure 13: The trend of real CIEA (%, q-o-q)
Source: BNR Monetary Policy & Research Department (2016)
Owing to a prudent monetary policy
implemented by BNR, money supply (M3) grew
by 10.6% y-o-y in 2016Q2, lower than 19.2%
recorded in the previous quarter and 17.0% in
2015Q2.
From the liability side, the deceleration in broad
money (M3) growth was mainly due to the
decline in transferable deposits, whose growth
eased to 8.6% y-o-y in 2016Q2 from 32.5% of
the same period in 2015 and 31.5% in 2016Q1.
Growth in foreign currency deposits improved to
12.2% in 2016Q2, after contracting by 10.7%
during the same period in 2015. Other deposits
recorded growth of 12.1% in 2016Q2 compared
to 9.9% in the previous quarter but remained
below 21.4% recorded in 2015Q2. Due to the
low level of economic activities, currency in
circulation grew by 11.6% in 2016Q2 from
16.2% of the previous quarter.
Figure 14: M3 from the liability side (%, y-o-y)
Source: BNR, Monetary Policy & Research Department (2016)
From the asset side, the deceleration in M3
growth was mainly caused by the significant
drop in growth of net domestic assets (NDA) to
27.4% in 2016Q2 from 55.4% of the previous
quarter and 71.3% in 2015Q2. This drop more
than offset the ease in the contraction of net
foreign assets (NFA) to 9.6% from 13.1% and
15.5% during the same period.
The deceleration in the growth of NDA was
mainly due to the fall in in credit to the private
sector and net credit to the government. In
2016Q2, growth in credit to the private sector
declined to 22.4% from 27.3% of the previous
quarter and 26.0% in 2015Q2. While the growth
in central government credit eased to 15.0% in
2016Q2 from 33.7% in 2016Q1, central
government deposits grew by 18.0% from -5.0%
13
during the same period, leading to an
improvement in central government net credit.
Figure 15: M3 from the asset side (%, y-o-y)
Source: BNR, Monetary Policy & Research Department (2016)
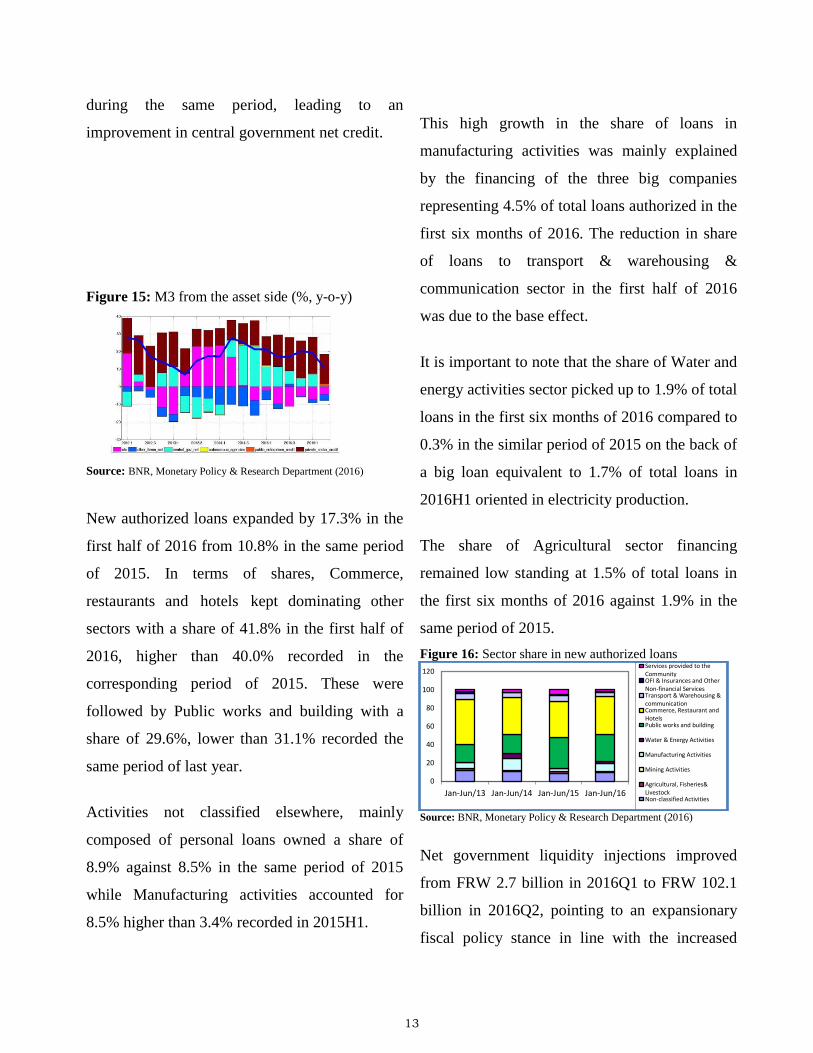
New authorized loans expanded by 17.3% in the
first half of 2016 from 10.8% in the same period
of 2015. In terms of shares, Commerce,
restaurants and hotels kept dominating other
sectors with a share of 41.8% in the first half of
2016, higher than 40.0% recorded in the
corresponding period of 2015. These were
followed by Public works and building with a
share of 29.6%, lower than 31.1% recorded the
same period of last year.
Activities not classified elsewhere, mainly
composed of personal loans owned a share of
8.9% against 8.5% in the same period of 2015
while Manufacturing activities accounted for
8.5% higher than 3.4% recorded in 2015H1.
This high growth in the share of loans in
manufacturing activities was mainly explained
by the financing of the three big companies
representing 4.5% of total loans authorized in the
first six months of 2016. The reduction in share
of loans to transport & warehousing &
communication sector in the first half of 2016
was due to the base effect.
It is important to note that the share of Water and
energy activities sector picked up to 1.9% of total
loans in the first six months of 2016 compared to
0.3% in the similar period of 2015 on the back of
a big loan equivalent to 1.7% of total loans in
2016H1 oriented in electricity production.
The share of Agricultural sector financing
remained low standing at 1.5% of total loans in
the first six months of 2016 against 1.9% in the
same period of 2015.
Figure 16: Sector share in new authorized loans
Source: BNR, Monetary Policy & Research Department (2016)
Net government liquidity injections improved
from FRW 2.7 billion in 2016Q1 to FRW 102.1
billion in 2016Q2, pointing to an expansionary
fiscal policy stance in line with the increased
0
20
40
60
80
100
120
Jan-Jun/13 Jan-Jun/14 Jan-Jun/15 Jan-Jun/16
Services provided to theCommunityOFI & Insurances and OtherNon-financial ServicesTransport & Warehousing &communicationCommerce, Restaurant andHotelsPublic works and building
Water & Energy Activities
Manufacturing Activities
Mining Activities
Agricultural, Fisheries&LivestockNon-classified Activities
14
fiscal spending towards the end of the fiscal year.
Looking ahead, net government injections are
expected to remain low, constraining aggregate
demand and suppressing demand-side
inflationary pressures.
Figure 17: Government net liquidity injection (FRW Billions)
Source: NBR, Monetary Policy & Research Department (2016)
2.2. Financial Sector developments
2.2.1 Interest rate developments
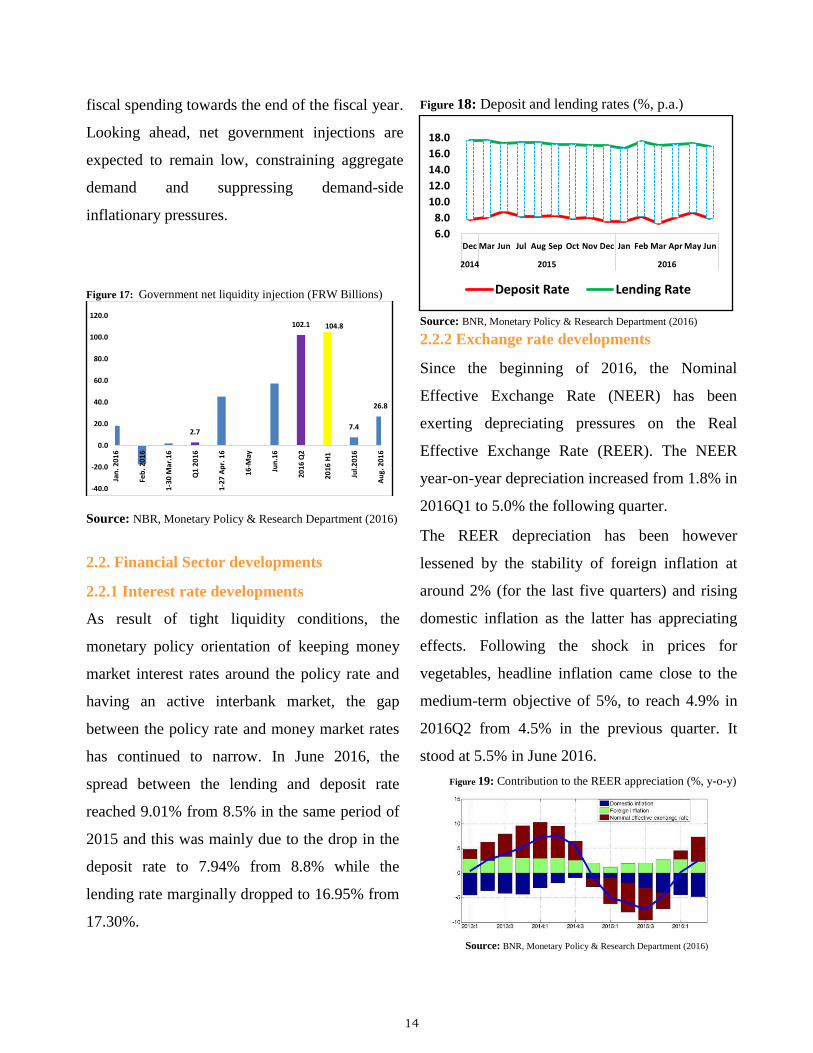
As result of tight liquidity conditions, the
monetary policy orientation of keeping money
market interest rates around the policy rate and
having an active interbank market, the gap
between the policy rate and money market rates
has continued to narrow. In June 2016, the
spread between the lending and deposit rate
reached 9.01% from 8.5% in the same period of
2015 and this was mainly due to the drop in the
deposit rate to 7.94% from 8.8% while the
lending rate marginally dropped to 16.95% from
17.30%.
Figure 18: Deposit and lending rates (%, p.a.)
Source: BNR, Monetary Policy & Research Department (2016)
2.2.2 Exchange rate developments
Since the beginning of 2016, the Nominal
Effective Exchange Rate (NEER) has been
exerting depreciating pressures on the Real
Effective Exchange Rate (REER). The NEER
year-on-year depreciation increased from 1.8% in
2016Q1 to 5.0% the following quarter.
The REER depreciation has been however
lessened by the stability of foreign inflation at
around 2% (for the last five quarters) and rising
domestic inflation as the latter has appreciating
effects. Following the shock in prices for
vegetables, headline inflation came close to the
medium-term objective of 5%, to reach 4.9% in
2016Q2 from 4.5% in the previous quarter. It
stood at 5.5% in June 2016.
Figure 19: Contribution to the REER appreciation (%, y-o-y)
Source: BNR, Monetary Policy & Research Department (2016)
2.7
102.1 104.8
7.4
26.8
-40.0
-20.0
0.0
20.0
40.0
60.0
80.0
100.0
120.0
Jan
. 201
6
Feb
. 201
6
1-30
Mar
.16
Q1
20
16
1-27
Ap
r. 1
6
16-M
ay
Ju
n.1
6
2016
Q2
2016
H1
Ju
l.201
6
Au
g. 2
016
6.0
8.0
10.0
12.0
14.0
16.0
18.0
Dec Mar Jun Jul Aug Sep Oct Nov Dec Jan Feb Mar Apr May Jun
2014 2015 2016
Deposit Rate Lending Rate

15
During the first half of 2016, the Rwandan Franc
(FRW) has been under relative pressure resulting
mainly from the widening mismatch between
imports and exports as well as the decline in
commodity prices. As a result, relative to
December 2015, the FRW depreciation against
the USD reached 4.8% end June 2016 compared
to 3.6% in June 2015.
In the same period, the FRW appreciated by
5.0% versus the GBP and depreciated by 6.6%
against the EURO. It also depreciated by 6.1%,
3.7% and 3.3% against the Kenyan shilling, the
Ugandan shilling and the Tanzanian shilling
respectively, while it appreciated by 3.7% versus
the Burundian franc.
Exchange rate pressures are largely linked to the
structural problem a persistent trade deficit given
that Rwanda is up to now a net importer, largely
exporting low-priced primary commodities and
importing high-value imports.
In 2016, the current account is projected to
deteriorate further and offset the expected
increase in the financial account. Thus, the
overall BOP deficit is projected to widen from
USD 28.6 million in 2015 to USD 96.6 million.
Figure 20: The BOP decomposition (Millions USD)
Source: BNR, statistics department (2016)
The current account deficit is expected to widen
from USD 1194.02 million in 2015 to USD
1338.04 million in 2016, growing by 12.1%. The
widening of the current account deficit is mainly
due to the increase in the trade deficit, net
services and personal income.
Figure 21: The current account (Million USD)
Source: BNR, statistics department (2016)
The trade deficit is projected to widen by 25.2%
in 2016, rising from USD 1113.861 million in
2015 to USD 1393.505 million in 2016. Imports
are expected to edge up by 13.3%, from USD
1917.43 million in 2015 to USD 2173.098
million in 2016. During the same period, exports
are projected to grow by 6.3%, rising from USD
683.672 million to USD 726.751 million. Until
now, commodity prices have remained low as
global demand continues to falter and supply for
some commodities has been quite high.

16
Figure 22: Evolution of the trade balance (USD, millions)
Source: BNR, statistics department (2016)
The major source of current account deficit
financing is the expected increase in other
investments, from USD 490.6 million in 2015 to
USD 738.5 million in 2016. Direct investments
are projected to grow by 6.3% in 2016, rising
from USD 333.0 million in 2015 to USD 353.9
million in 2016.
Figure 23: The financial account (Million USD)
Source: BNR, statistics department (2016)
2.3. Fiscal spending
From the expenditure account, growth in
government expenditure slowed from 23.2% in
2016Q1 to 18.7% in 2016Q2. This, coupled with
the expected decline in net government liquidity
injections may have negative consequences on
economic growth in 2016Q3.
2.4. Previous monetary policy stance
In view of the current liquidity shortage, growing
exchange rate pressures and rising but still
subdued inflationary pressures, BNR decided to
keep the KRR at 6.5%. Downside factors are
mainly slowing economic growth and the
somewhat declining financing of the economy by
the banking sector.
On the upside, rising inflation and growing
exchange rate pressures are some of the key
considerations. To counter-balance these
opposing forces, the MPC judged that it is
appropriate to maintain its monetary policy
stance in 2016Q3.
Figure 24: The Key Repo Rate in Rwanda
Source: Monetary Policy & Research Department (2016)
2.5. Inflation developments
In 2016Q2 headline inflation went up to 4.9% on
average from 4.5% recorded in 2016Q1. This
increase was mostly reflected in transport
inflation reaching 7.3% from 4.6% during the
same period.
Though food inflation continued to reduce in
2016Q2, the effect from the jump in vegetables
5.9
6.1
6.3
6.5
6.7
6.9
7.1
7.3
7.5
17
that took place in 2015Q4 did not die out
completely and was even exacerbated by another
jump in June and July and persisted up to
August. Housing inflation slightly increased to
3.2% from 3.0% but was not big enough to offset
the pressures from food and transport.
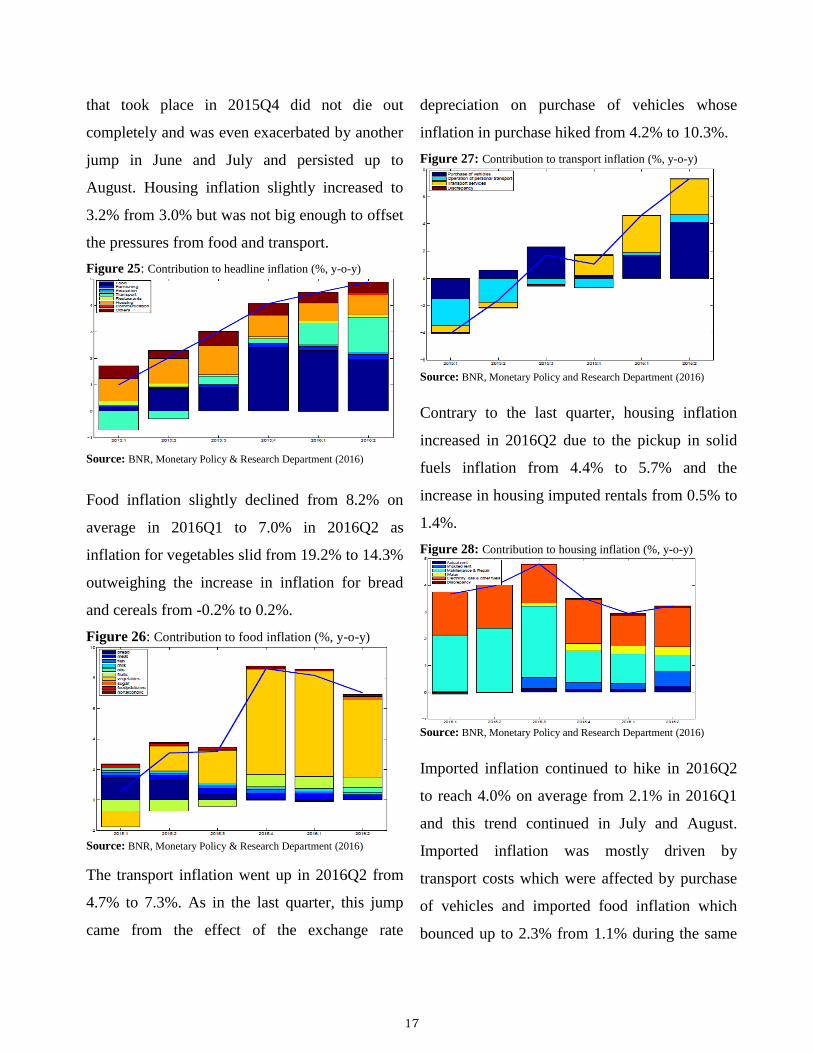
Figure 25: Contribution to headline inflation (%, y-o-y)
Source: BNR, Monetary Policy & Research Department (2016)
Food inflation slightly declined from 8.2% on
average in 2016Q1 to 7.0% in 2016Q2 as
inflation for vegetables slid from 19.2% to 14.3%
outweighing the increase in inflation for bread
and cereals from -0.2% to 0.2%.
Figure 26: Contribution to food inflation (%, y-o-y)
Source: BNR, Monetary Policy & Research Department (2016)
The transport inflation went up in 2016Q2 from
4.7% to 7.3%. As in the last quarter, this jump
came from the effect of the exchange rate
depreciation on purchase of vehicles whose
inflation in purchase hiked from 4.2% to 10.3%.
Figure 27: Contribution to transport inflation (%, y-o-y)
Source: BNR, Monetary Policy and Research Department (2016)
Contrary to the last quarter, housing inflation
increased in 2016Q2 due to the pickup in solid
fuels inflation from 4.4% to 5.7% and the
increase in housing imputed rentals from 0.5% to
1.4%.
Figure 28: Contribution to housing inflation (%, y-o-y)
Source: BNR, Monetary Policy and Research Department (2016)
Imported inflation continued to hike in 2016Q2
to reach 4.0% on average from 2.1% in 2016Q1
and this trend continued in July and August.
Imported inflation was mostly driven by
transport costs which were affected by purchase
of vehicles and imported food inflation which
bounced up to 2.3% from 1.1% during the same

18
period following the levy applied on processed
food imported from the EAC region that do not
meet the originality conditions.
Figure 29: Contribution to imported inflation (%, y-o-y)
Source: BNR, Monetary Policy and Research Department (2016)
Domestic inflation slightly reduced but remained
high in 2016Q2 at 5.2% from 5.3% as a result of
the slowdown in food inflation in April and May.
Figure 30: Contribution to domestic inflation (%, y-o-y)
Source: BNR, Monetary Policy and Research Department (2016)
Core inflation edged up for the second quarter in
row from 2.8% in 2016Q1 to 3.8% in 2016Q2
and it increased again in July and August. The
surge in core inflation came in anticipation of the
announced increase in external common tariff of
some food products classified as core namely
imported oils and sugar. In addition, inflation of
other local core products such as milk products
edged up in 2016Q2 due to the dry season.
Figure 31: Contribution to headline inflation by volatility (%, y-o-y)
Source: BNR, Monetary Policy and Research Department (2016)
3. INFLATION OUTLOOK
3.1 Domestic aggregate demand
Domestic demand1 slowed to 5.5% in 2016Q2
from 7.8% in the previous quarter as growth in
gross capital formation slowed to 8.9% from
22.3% in 2016Q1. Going forward, the prudent
monetary policy stance adopted by BNR is
expected to induce further increase in new
authorized loans in 2016Q3 though this may not
be enough to ease liquidity conditions especially
if government spending does not improve.
3.1.1 The Composite Index of Economic
Activities and turnovers
The trend of the real CIEA and total turnovers
indicate that the Rwandan economy is likely to
slightly improve in 2016Q3 compared to the
same period in 2015. Total turnovers in the first
two months of 2016Q3 increased by 14.4% up
1 Domestic Demand is defined as the sum of Consumption
(C), Investment (I) and Government Expenditure (G)
19
from 11.0% registered in the corresponding
period of 2015Q3 whereas the real CIEA grew
by 11.2% from 10.3% during the same period.
3.1.2 Credit to Private Sector
The observed decline in year-on-year growth for
outstanding credit to the private sector to 19.6%
and 21.5% in August and July 2016 respectively
from 26.9% and 27.3% realized in the same
months of 2015 was largely due to the increase in
short-term lending. During the first eight months
of 2016, the share of short term loans in total
new authorized loans reached 43.5%, up from
38.7% recorded in the same period of 2015.
The stock of credit is however expected to rise
following the increase in new authorized loans
by 11.5% in the first eight months of 2016, up
from 9.8% recorded in the same period of last
year.
3.2 Supply shock
Following the effect of the prolonged dry season,
food prices have remained quite elevated in
2016. Though food inflation continued to reduce
in 2016Q2, the effect from the jump in prices for
vegetables that took place in November 2015 did
not die out completely and was even exacerbated
by another jump in June and July that has
persisted up to August. Looking ahead, food
prices are expected to ease in the coming months
following the resumption of the rainy season.
3.3 Exchange rate developments
In addition to the longstanding structural problem
of a persistent trade deficit, the recent exchange
rate pressures have been amplified by the high
demand for foreign exchange by big projects
under the Public-Private Partnership (PPP)
framework. As a result, relative to December
2015, the FRW depreciation against the USD
reached 4.8% end June 2016 compared to 3.6%
in June 2015.
In the same period, the FRW appreciated by
5.0% versus the GBP and depreciated by 6.6%
against the EURO. It also depreciated by 6.1%,
3.7% and 3.3% against the Kenyan shilling, the
Ugandan shilling and the Tanzanian shilling
respectively, while it appreciated by 3.7% versus
the Burundian franc.
The increasing depreciation of the FRW against
currencies of major trading partners, especially in
the region, has led the NEER year-on-year
depreciation to increase from 1.8% in 2016Q1 to
5.0% the following quarter, significantly
contributing to the rise in the REER depreciation
from 0.14% to 2.5% during the same period.
These developments have important implications
on inflation and on competitiveness.
3.4 Global and regional inflationary pressures
Generally, inflation remained subdued around the
globe and below target, mostly on the back of
weak economic activity and low commodity
prices.

20
In EAC member countries, inflation rates were
generally lower in 2016Q2 compared to 2016Q1
but in Rwanda it started to go above the objective
of 5% since June 2016, following an adverse
supply shock.
3.5 International commodity prices
In 2016Q2, prices for both fuel and non-fuels
commodities showed a small recovery. The IMF
expects oil prices to gradually and slightly
increase in the second half of 2016. Food prices
also went up between 2016Q1 and 2016Q2 and
are expected to remain above their 2016Q1 level
in 2016Q3. While coffee prices also increased in
2016Q2 and are projected to remain around the
same level towards the end of 2016, tea prices
dropped and are likely to remain below their
2016Q1 level in the 2016H2. Therefore, this may
continue to have adverse implications on
exchange rate developments whereas the effect
on inflation is expected to remain muted.
3.6. Inflation forecasts
Looking ahead, the main risks to the inflation
outlook remain the volatile and weather-
dependent food prices and the growing exchange
rate pressures. Although some mild downward
pressures may come from the reduction in local
pump prices, upward pressures will continue to
come from the effect of the increase in tariffs for
products such as sugar, imported cooking oils,
cement, clothing and footwear.
Additional upward pressures will also continue to
come from the level shifts in local bus fares and
in education fees, as well as from the increase in
prices of soft drinks produced by Bralirwa.
In view of the above upside and downside risks,
inflation is expected to lie between 5.6% and
6.6% in September 2016 and between 5.2% and
6.2% in December 2016.
Figure 32: Inflation fan chart
Source: BNR, Monetary Policy & Research Department (2016)
*********************************
*************************
******************
0
1
2
3
4
5
6
7
8
Apr-16 Jun-16 Aug-16 Oct-16 Dec-16

21
************
******
***
22
KN 6 AVENUE 4, P.O. Box 531 Kigali
Tel. :( 250)252 574282, Fax: (250) 252 577391
Email: [email protected]
Web: www.bnr.rw
Swift code: BNRWRWRW