quarterly results q2 2018 · isk 2,085 million in the first half of 2018 (-13% yoy) • sales of...
TRANSCRIPT
Quarterly Results Q2 2018Presentation, August 23, 2018
Finnur Oddsson, CEO
ScheduleResults
Operational Highlights
Financials
Outlook

Key Financial Information
Q2 2018 1H 2018
Revenue ISK 3,731 million 3.4% YOY ISK 7,512 million -1.2% YOY
Gross profit ISK 1,010 million 27.1% YTD ISK 1,917 million 25.5% YTD
Net income (loss) ISK 15 million 0.4% YTD ISK (11) million -0.1% YTD
EBITDA ISK 235 million 6.3% YTD ISK 336 million 4.5% YTD
Operational Highlights
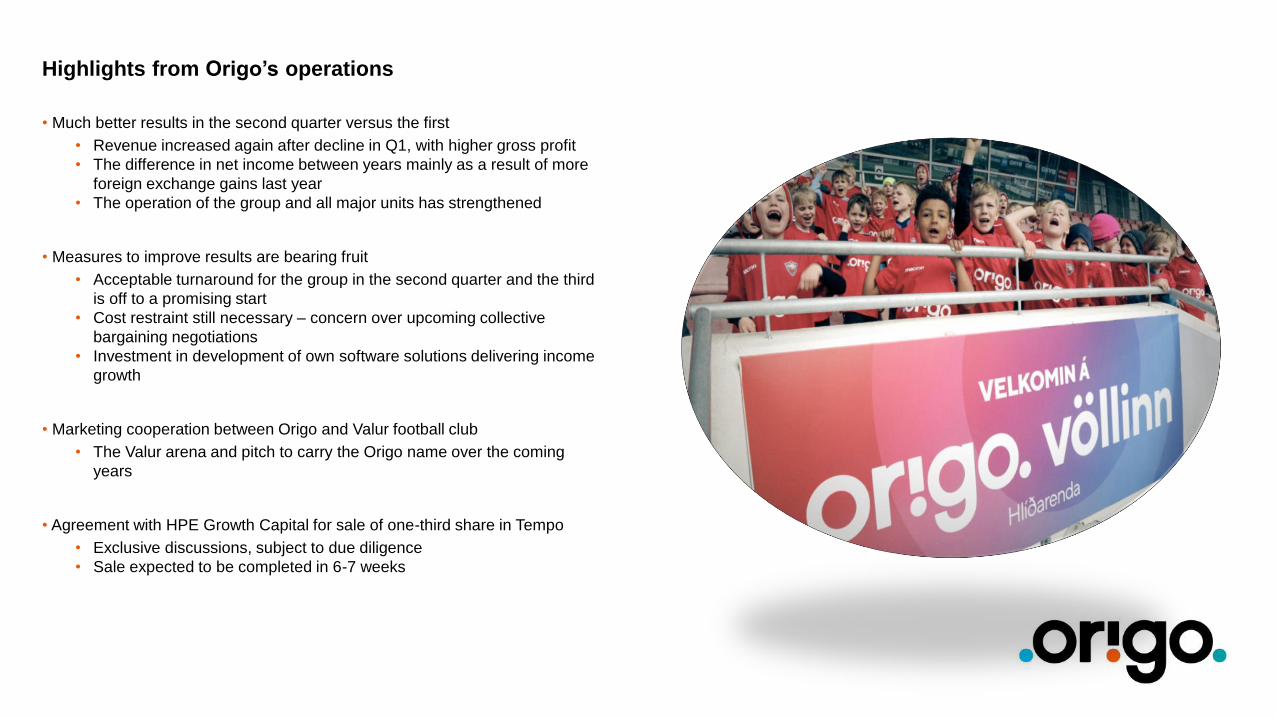
Highlights from Origo’s operations
• Much better results in the second quarter versus the first
• Revenue increased again after decline in Q1, with higher gross profit
• The difference in net income between years mainly as a result of more
foreign exchange gains last year
• The operation of the group and all major units has strengthened
• Measures to improve results are bearing fruit
• Acceptable turnaround for the group in the second quarter and the third
is off to a promising start
• Cost restraint still necessary – concern over upcoming collective
bargaining negotiations
• Investment in development of own software solutions delivering income
growth
• Marketing cooperation between Origo and Valur football club
• The Valur arena and pitch to carry the Origo name over the coming
years
• Agreement with HPE Growth Capital for sale of one-third share in Tempo
• Exclusive discussions, subject to due diligence
• Sale expected to be completed in 6-7 weeks
Viðskiptalausnir Hugbúnaðarlausnir

Operational highlights
• End-User Solutions had revenues of ISK 1,199 million in Q2 (20% YoY)
and ISK 2,249 million in the first half of 2018 (8% YoY)
• Considerable demand for Lenovo computer equipment
• 60% increase in sales of Sony televisions and cameras
• Good growth in sales of Bose and NEC audio and visual solutions
• 80% increase in on-line store sales between years
• Focus on strong marketing, digital development and improved user
experience delivering results
• Continued good outlook
• Operation and Infrastructure had revenues of ISK 959 million in Q2 and
ISK 2,085 million in the first half of 2018 (-13% YoY)
• Sales of services and solutions lower than projected
• The main reason is lower sales of Infrastructure equipment and
lower revenue from service contracts
• Increased demand for services and support
• The project pipeline has been strengthening in recent months and
the outlook for the unit is good
End-User Solutions Operation and Infrastructure Business Solutions Software Solutions

End-User Solutions Operation and Infrastructure Business Solutions Software Solutions
Operational Highlights
• Business Solutions had revenues of ISK 354 million in Q2 (41% YoY)
and ISK 744 million in the first half of 2018 (45% YoY)
• Broader target market and large increase in number of customers
• Revenue growth across the unit and better results than last year
• Increased demand for solutions for financial services companies
• Dynamics NAV solutions, Timian purchasing system and Kjarni human
resource system part of the solution offering
• Significant opportunities in the sale of the SAP S/4HANA business
solution
• The project pipeline is good, as is the outlook for the second half of
the year
• Software Solutions had revenues of ISK 475 million in Q2 (-3% YoY) and
ISK 917 million in the first half of 2018 (-6% YoY)
• Operations were performed well in Q2, with revenue up significantly
from Q1
• Robust demand for software consultants and sales of software
licenses strong in Q2
• Demand for the unit’s new products, Caren and CCQ, was good
• Growing interest in security solutions and related consultancy
• Origo chosen as IBM’s partner of the year for security solutions
• The CCQ quality management solution was a finalist at the IBM
Beacon Awards for innovative work, held at the THINK conference in
Las Vegas
• The project pipeline is good and the outlook is promising

Applicon Tempo
Operational highlights
• Applicon SE had revenues of SEK 22 million (-2% YoY) in Q2 and SEK
45 million in the first half (-6% YoY)
• Good demand for Applicon’s services in Sweden
• Revenue was down slightly in the period due to a decline in sales
of third party software licenses and more time spent on developing
new solutions that will add to the solution offering
• Staff has increased by 8%
• Applicon has established itself as a leading provider of solutions
for medium-sized banks and financial services companies
• Results have been below expectations but the outlook for the
second half of the year is good

Tempo
Operational highlights
• Tempo had revenues of USD 5 million (IFRS USD 4.8 million) in Q2 (28%
YoY) and USD 9.7 million in the first half of the year (17% YoY)
• The 12 month running revenue is USD 20.7 million (30% YoY)
• Cloud solution and subscription revenue on the rise
• Subscription revenue from Tempo Cloud up 37%
• For the first time, Cloud solution revenue exceeded 40% of total
income
• The number of customers is growing, they are using Tempo more and there
are more first-time users
• Customers now total 11,822 across 120 countries
• Sales to enterprise clients continue to increase, now 39% of revenue
• Average income from each customer continues to increase due to
price increases and cross selling
• The renewals/retention ratio has never been higher
• Trials up year-on-year
• Sale increase at resellers, now totaling 140 worldwide
1H revenue (in USD million)

Tempo
Operational highlights (cont.)
• Product development is the foundation for new revenue streams
• Development of Tempo solutions for other popular cloud solutions (including Zendesk
and Trello) well underway
• Tempo will introduce new services at the Atlassian Summit in September – new
revenue streams in the coming months
• Additions designed to make it easier for customers to implement and use Tempo
solutions, increasing the likelihood that they will renew subscriptions and licenses
• Tempo sale process
• Agreement reached on due diligence and exclusive discussions with HPE Growth
Capital
• The proposed sale is for a one-third stake in Tempo
• Total worth of Tempo estimated at 62.5 mUSD.
• HPE will provide Tempo with considerable funds for development and growth
• HPE is a global investment company that specializes in investments in fast growing IT
companies
• Strong team led by one of the owners of HPE, Manfred Krikke
• Both parties have the goal of accelerating the growth and development of Tempo
• Continued ownership of the majority of Tempo will greatly benefit Origo shareholders
• The outlook for Tempo is good with revenue growth expected to remain similar to or exceed
the levels seen in the last quarter

Financials

Key Financial Information for the First Half of 2018
RevenueISK 7,512 million
EBITDAISK 336 million
EBITDA%4.5%
Gross profit%25.5%
Payroll and related costs/revenue
43.4%
Operating costs/ revenue
25.5%
Working capital ratio1.16
Equity ratio39.8%
DSO26
Inventory turnover5.3
Cash at end of periodISK 176 million
Profit for period/ revenue
(0.1%)
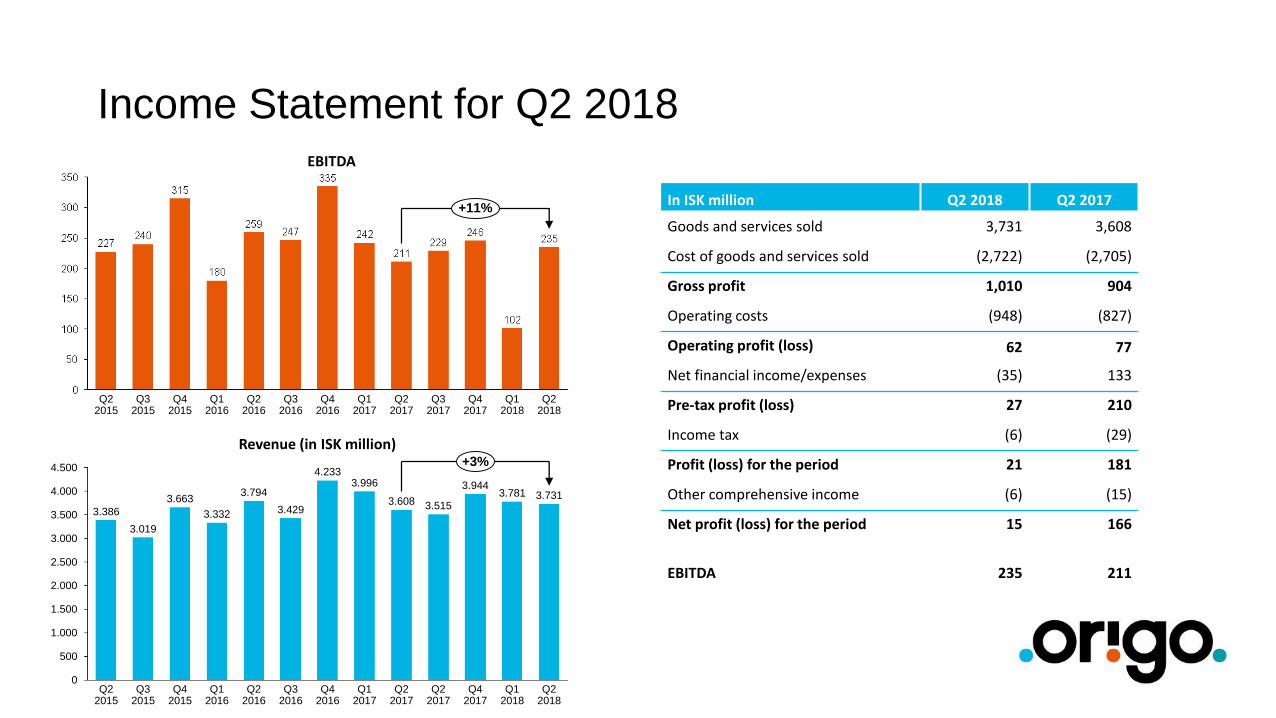
Income Statement for Q2 2018
In ISK million Q2 2018 Q2 2017
Goods and services sold 3,731 3,608
Cost of goods and services sold (2,722) (2,705)
Gross profit 1,010 904
Operating costs (948) (827)
Operating profit (loss) 62 77
Net financial income/expenses (35) 133
Pre-tax profit (loss) 27 210
Income tax (6) (29)
Profit (loss) for the period 21 181
Other comprehensive income (6) (15)
Net profit (loss) for the period 15 166
EBITDA 235 211
1.500
0
2.500
2.000
500
1.000
3.000
3.500
4.000
4.500
Q4 2015
Q1 2016
Q2 2017
Q2 2016
3.794
Q3 2016
3.019
Q1 2017
Q2 2017
Q2 2015
4.233
Q3 2015
3.781
Q4 2017
Q1 2018
Q2 2018
3.386 3.4293.663
3.5153.332
3.608
3.996 3.9443.731
Q4 2016
+3%
Revenue (in ISK million)
Q1 2016
Q3 2015
Q2 2016
Q4 2015
Q2 2015
Q3 2016
Q4 2016
Q1 2017
Q2 2017
Q3 2017
Q4 2017
Q1 2018
Q2 2018
+11%
EBITDA
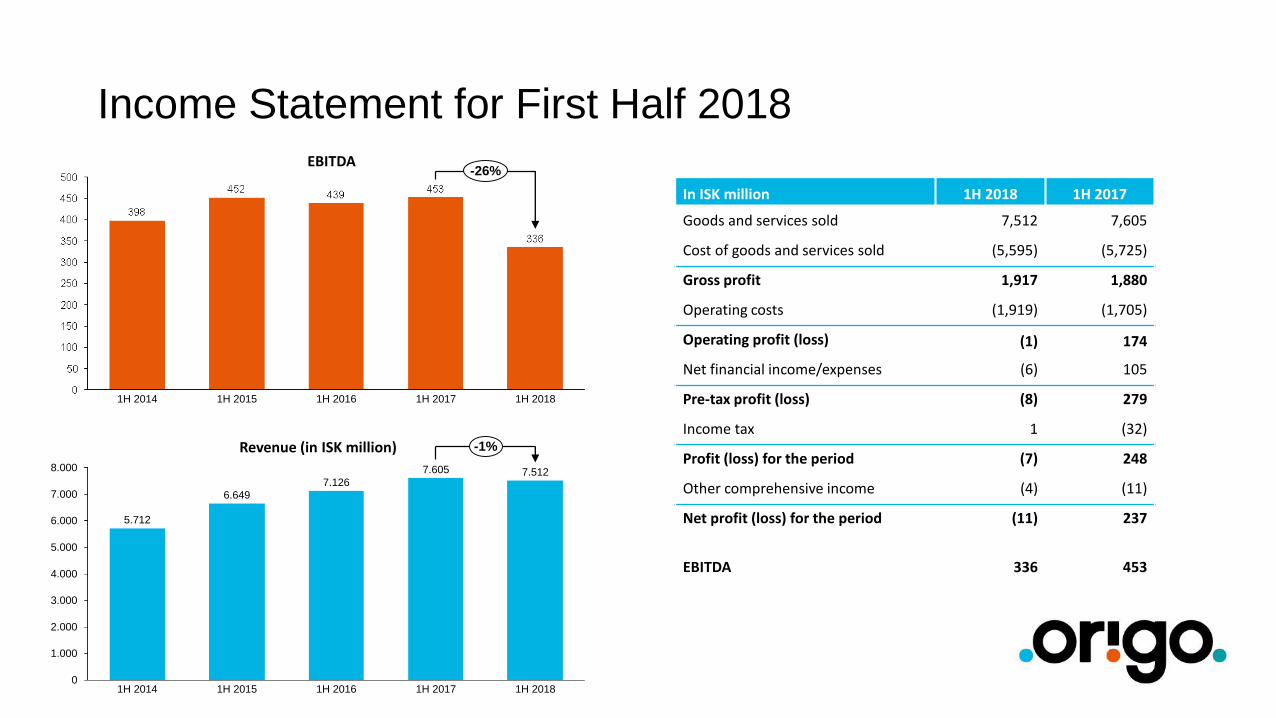
Income Statement for First Half 2018
In ISK million 1H 2018 1H 2017
Goods and services sold 7,512 7,605
Cost of goods and services sold (5,595) (5,725)
Gross profit 1,917 1,880
Operating costs (1,919) (1,705)
Operating profit (loss) (1) 174
Net financial income/expenses (6) 105
Pre-tax profit (loss) (8) 279
Income tax 1 (32)
Profit (loss) for the period (7) 248
Other comprehensive income (4) (11)
Net profit (loss) for the period (11) 237
EBITDA 336 453
0
6.000
7.000
5.000
2.000
1.000
3.000
4.000
8.000
5.712
6.649
1H 2014 1H 2015 1H 2016 1H 2017
7.126
7.605
1H 2018
7.512
-1%Revenue (in ISK million)
1H 2014 1H 2015 1H 20171H 2016 1H 2018
-26%EBITDA

Balance Sheet
In ISK million 30.06.2018 31.12.2017
Fixed assets 3,954 3,817
Current assets 3,036 3,218
Total assets 6,990 7,035
Equity 2,779 2,928
Long-term liabilities 1,598 1,637
Short-term liabilities 2,612 2,470
Total equity and liabilities 6,990 7,035
17,9%20,1%
28,0% 29,5% 30,8%32,5% 33,7%
39,7%
43,8% 45,2%41,6% 41,8%
39,8%
0%
5%
10%
15%
20%
25%
30%
35%
40%
45%
50%
Equity ratio
1,26 1,28
1,521,46 1,41 1,39 1,42 1,42 1,47 1,52
1,301,20 1,16
0
0,2
0,4
0,6
0,8
1
1,2
1,4
1,6
Working Captial Ratio

Cash Flow
In ISK million1.1.-30.06.
20181.1.-30.06.
2017
Cash from operations 201 332
Investing activities (387) (354)
Financing activities 69 (292)
(Decrease) increase in cash (117) (314)
Effect of changes in foreign exchange rates on cash
(4) (8)
Cash at beginning of year 297 872
Cash at end of period 176 550
274
470
966
135
506
765
1.267
329 332
196
688
183 201
Cash from operations (ISK million)
163
282
123
483
550
176
Second quarter cash comparison(ISK million)
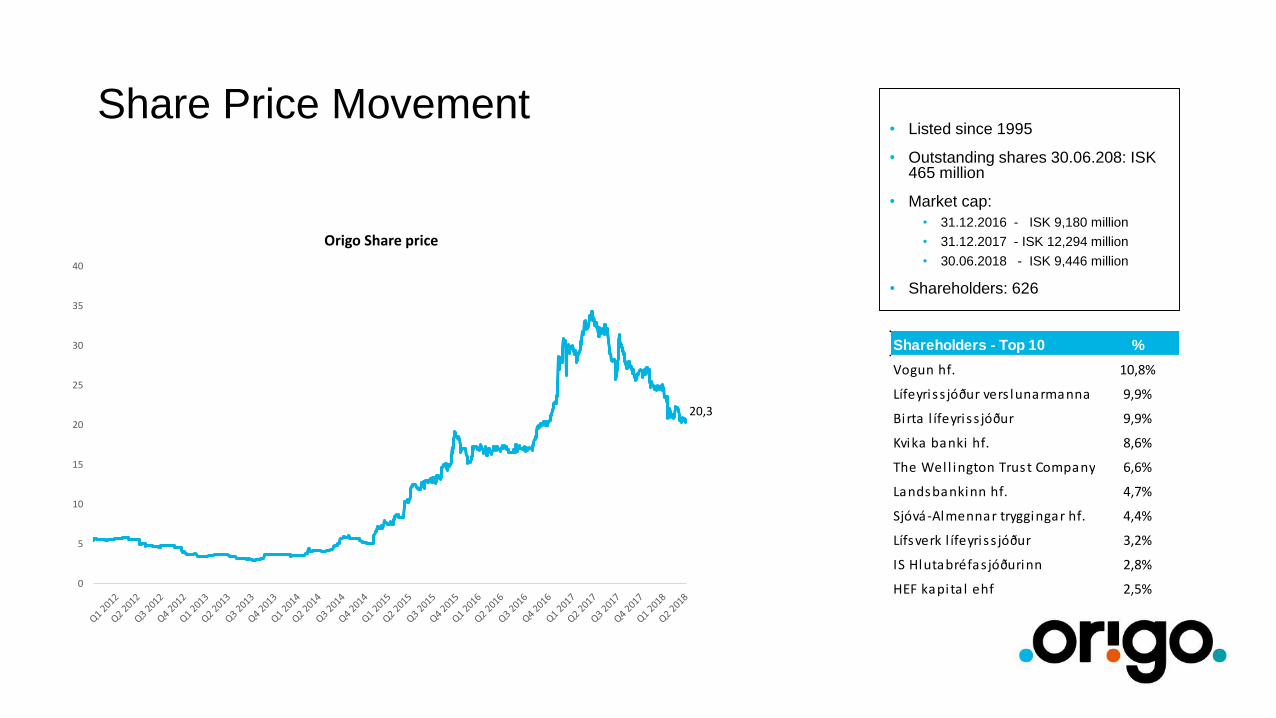
Share Price Movement• Listed since 1995
• Outstanding shares 30.06.208: ISK 465 million
• Market cap:
• 31.12.2016 - ISK 9,180 million
• 31.12.2017 - ISK 12,294 million
• 30.06.2018 - ISK 9,446 million
• Shareholders: 626
20,3
0
5
10
15
20
25
30
35
40
Origo Share price
Shareholders - Top 10 %
Vogun hf. 10,8%
Lífeyriss jóður vers lunarmanna 9,9%
Birta l ífeyriss jóður 9,9%
Kvika banki hf. 8,6%
The Wel l ington Trust Company Na 6,6%
Landsbankinn hf. 4,7%
Sjóvá-Almennar tryggingar hf. 4,4%
Lífsverk l ífeyriss jóður 3,2%
IS Hlutabréfas jóðurinn 2,8%
HEF kapita l ehf 2,5%
Outlook
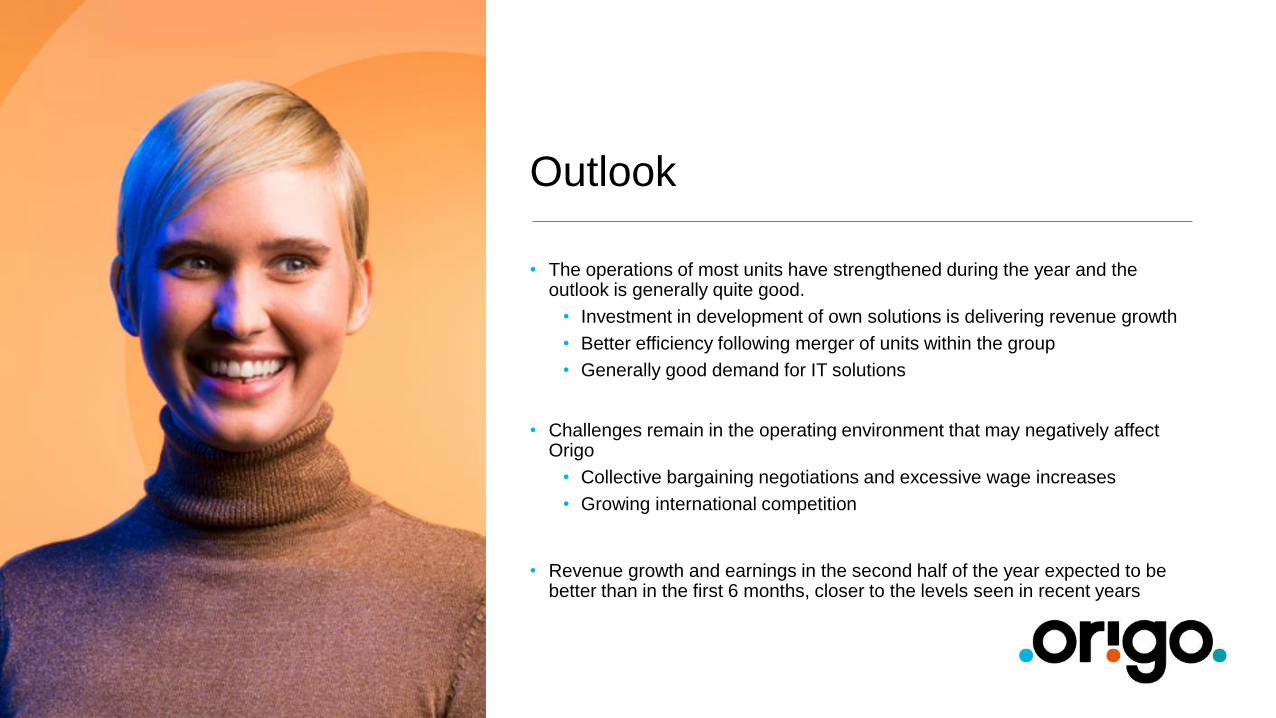
Outlook
• The operations of most units have strengthened during the year and the outlook is generally quite good.
• Investment in development of own solutions is delivering revenue growth
• Better efficiency following merger of units within the group
• Generally good demand for IT solutions
• Challenges remain in the operating environment that may negatively affect Origo
• Collective bargaining negotiations and excessive wage increases
• Growing international competition
• Revenue growth and earnings in the second half of the year expected to be better than in the first 6 months, closer to the levels seen in recent years
Questions?
Disclaimer
Forward-looking statements contained in this presentation may be based on management’s current estimates and expectations, and not on facts that may be verified after its publication. Such statements are inherently uncertain.
We therefore caution the reader that there are a variety of factors that could cause business conditions and results to differ materially from what is contained in our forward-looking statements, and that we do not undertake to update any forward-looking statements.
These forward-looking statements speak only as of the date of this presentation and are qualified in their entirety by this cautionary statement.
