quarterly securities report for the three-month period ... · 8/11/2020 · steel product, and the...
TRANSCRIPT

Quarterly Securities Report
for the Three-Month Period Ended June 30, 2020
English translation of certain items disclosed in the Quarterly Securities Report for the
three-month period ended June 30, 2020, which were filed with the Director-General of
the Kanto Local Finance Bureau of the Ministry of Finance of Japan on August 11, 2020.
Mitsui & Co., Ltd.

CONTENTS
Page
1. Overview of Mitsui and Its Subsidiaries ………………………………………………………………… 2
1. Selected Financial Data …………………………………………………………………………………. 2
2. Business Overview ……………………………………………………………………………………… 2
2. Operating and Financial Review and Prospects ………………………………………………………... 3
1. Risk Factors ……………………………………………………………………………………………… 3
2. Management’s Discussion and Analysis of Financial Position, Operating Results and Cash Flows …… 3
3. Material Contracts ……………………………………………………………………………………….. 13
3. Condensed Consolidated Financial Statements ………………………………………………………… 14
As used in this report, “Mitsui” is used to refer to Mitsui & Co., Ltd. (Mitsui Bussan Kabushiki Kaisha), “we”, “us”, and “our” are used to indicate Mitsui & Co., Ltd. and subsidiaries, unless otherwise indicated.
- 1 -

1. Overview of Mitsui and Its Subsidiaries
1. Selected Financial Data
As of or for the periods ended June 30, 2020 and 2019 and as of or for the year ended March 31, 2020
In millions of Yen, except amounts per share and other
Three-month period ended
June 30, 2020
Three-month period ended
June 30, 2019
As of or for the year ended
March 31, 2020
Consolidated financial data Revenue ¥ 1,521,768 1,633,120 6,885,033 Gross profit ¥ 189,707 209,231 839,423 Profit for the period attributable to owners of the parent ¥ 62,557 125,036 391,513 Comprehensive income for the period attributable to owners of the parent ¥ 160,312 30,648 (259,448) Total equity attributable to owners of the parent ¥ 3,870,727 4,233,942 3,817,677 Total assets ¥ 11,486,047 12,209,440 11,806,292 Basic earnings per share attributable to owners of the parent (Yen) ¥ 36.92 71.94 226.13 Diluted earnings per share attributable to owners of the parent (Yen) ¥ 36.90 71.88 225.98 Equity attributable to owners of the parent ratio % 33.70 34.68 32.34 Cash flows from operating activities ¥ 164,040 127,879 526,376 Cash flows from investing activities ¥ (108,538) (110,503) (185,230) Cash flows from financing activities ¥ (88,241) 22,111 (204,561) Cash and cash equivalents at end of period ¥ 1,041,388 987,662 1,058,733
(Notes) 1. The consolidated financial statements have been prepared on the basis of International Financial Reporting Standards (IFRS).
2. Revenue does not include consumption taxes.
2. Business Overview
In each business area including Iron & Steel Products, Mineral & Metal Resources, Energy, Machinery & Infrastructure, Chemicals, Lifestyle and Innovation & Corporate Development, the Company and its consolidated subsidiaries engage in a diversified range of services, including trading, manufacturing, transport, and financial services involving various commodities, making full use of the global office network, which is centering on the Company, a general trading company, with its ability to gather information. The Company and its consolidated subsidiaries furthermore engage in a wide range of initiatives that include development of natural resources and infrastructure projects, and business investment in relation to the environment, new technologies, next-generation power and healthcare.
There has been no significant change in our business for the three-month period ended June 30, 2020.
- 2 -

2. Operating and Financial Review and Prospects
1. Risk Factors
For the three-month period ended June 30, 2020, there is no significant change in risk factors which were described on our Annual Securities Report for the year ended March 31, 2020.
2. Management’s Discussion and Analysis of Financial Position, Operating Results and Cash Flows
This quarterly securities report contains forward-looking statements about Mitsui and its consolidated subsidiaries. These forward-looking statements are based on Mitsui’s current assumptions, expectations and beliefs in light of the information currently possessed by it and involve known and unknown risks, uncertainties and other factors. Such risks, uncertainties and other factors may cause Mitsui’s actual consolidated financial position, consolidated operating results or consolidated cash flows to be materially different from any future consolidated financial position, consolidated operating results or consolidated cash flows expressed or implied by these forward-looking statements.
Forward-looking statements were made as of June 30, 2020, unless otherwise indicated.
(1) Operating EnvironmentIn the three-month period ended June 30, 2020, despite signs of improvement in China, the global economyexperienced a rapid drop in internal and external demand and the growth rate decreased significantly due tothe spread of infections of COVID-19 in major developed countries, such as the U.S., and emerging anddeveloping countries excluding China. However, the global economy appears to have made it out of its worstperiod and be moving toward recovery as the economy has bottomed out with the resumption of economicactivities.
In the U.S., consumer spending, which took a major hit due to the lockdown at the start of the period, showed signs of bottoming out due to the subsequent resumption of economic activities, economic measures, etc., and employment is gradually improving. On the other hand, there appears to be a second wave of infections and there are concerns over its impact. In Europe, although economic activities have resumed due to the easing of restrictions against going outside and the effects of economic measures are gradually appearing, the situation seems to be improving at a sluggish pace. In Japan, consumer spending has bottomed out due to the lifting of the state of emergency and economic measures and the economy is expected to improve in the future. However, the pace of improvement is likely to be gradual. In emerging countries, manufacturing activities in China continue to resume, and the economy is recovering with signs of a pickup in consumption and investments. On the other hand, there are concerns regarding the economic outlook of Russia and Brazil as they are suffering from a fall in the price of crude oil, and Brazil in particular is experiencing a serious outbreak of infections.
Considering that COVID-19 continues to spread depending on the country and region, careful attention should be given to the possibility that the global economy may deteriorate again.
- 3 -
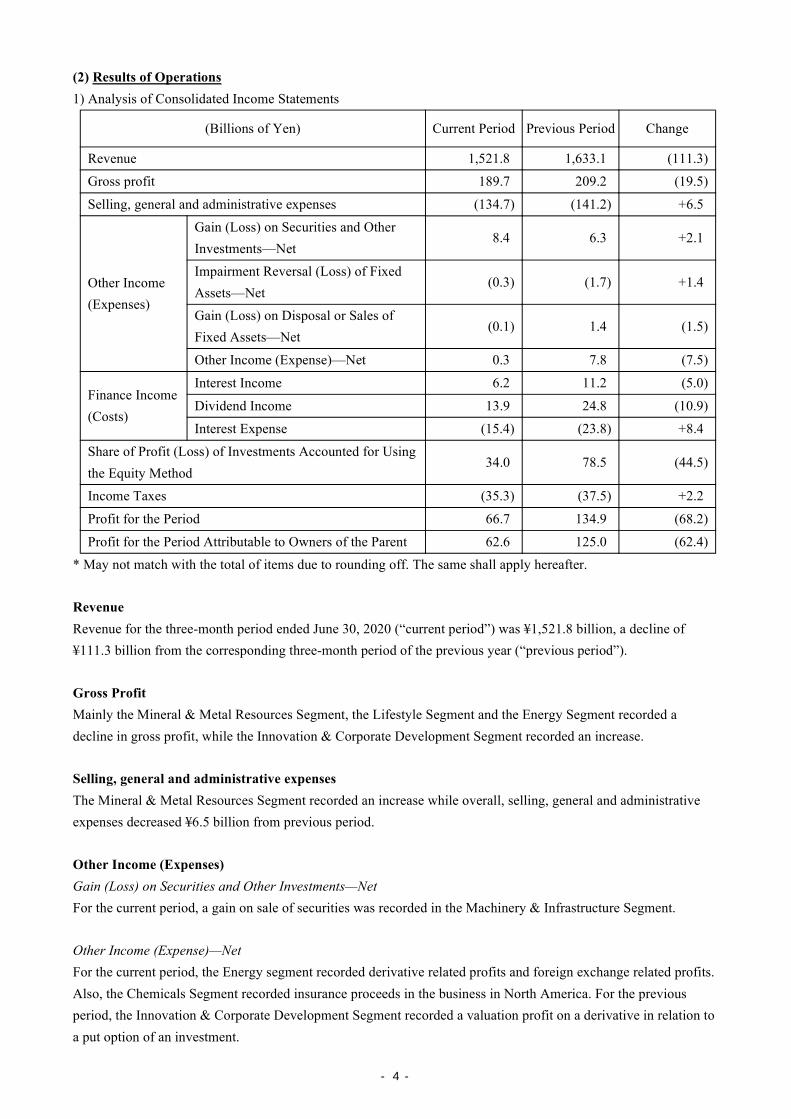
(2) Results of Operations1) Analysis of Consolidated Income Statements
(Billions of Yen) Current Period Previous Period Change
Revenue 1,521.8 1,633.1 (111.3)
Gross profit 189.7 209.2 (19.5)
Selling, general and administrative expenses (134.7) (141.2) +6.5
Other Income (Expenses)
Gain (Loss) on Securities and Other Investments—Net
8.4 6.3 +2.1
Impairment Reversal (Loss) of Fixed Assets—Net
(0.3) (1.7) +1.4
Gain (Loss) on Disposal or Sales of Fixed Assets—Net
(0.1) 1.4 (1.5)
Other Income (Expense)—Net 0.3 7.8 (7.5)
Finance Income (Costs)
Interest Income 6.2 11.2 (5.0)
Dividend Income 13.9 24.8 (10.9)
Interest Expense (15.4) (23.8) +8.4
Share of Profit (Loss) of Investments Accounted for Using the Equity Method
34.0 78.5 (44.5)
Income Taxes (35.3) (37.5) +2.2
Profit for the Period 66.7 134.9 (68.2)
Profit for the Period Attributable to Owners of the Parent 62.6 125.0 (62.4)
* May not match with the total of items due to rounding off. The same shall apply hereafter.
Revenue
Revenue for the three-month period ended June 30, 2020 (“current period”) was ¥1,521.8 billion, a decline of ¥111.3 billion from the corresponding three-month period of the previous year (“previous period”).
Gross Profit
Mainly the Mineral & Metal Resources Segment, the Lifestyle Segment and the Energy Segment recorded a decline in gross profit, while the Innovation & Corporate Development Segment recorded an increase.
Selling, general and administrative expenses
The Mineral & Metal Resources Segment recorded an increase while overall, selling, general and administrative expenses decreased ¥6.5 billion from previous period.
Other Income (Expenses)
Gain (Loss) on Securities and Other Investments—Net For the current period, a gain on sale of securities was recorded in the Machinery & Infrastructure Segment.
Other Income (Expense)—Net For the current period, the Energy segment recorded derivative related profits and foreign exchange related profits. Also, the Chemicals Segment recorded insurance proceeds in the business in North America. For the previous period, the Innovation & Corporate Development Segment recorded a valuation profit on a derivative in relation to a put option of an investment.
- 4 -

Finance Income (Costs)
Dividend Income
Mainly the Energy Segment recorded a decrease.
Share of Profit (Loss) of Investments Accounted for Using the Equity Method
Mainly the Energy Segment, the Machinery & Infrastructure Segment, the Lifestyle Segment and the Iron and Steel Products Segment recorded a decline.
Income Taxes
Income taxes for the current period were ¥35.3 billion, a decline of ¥2.2 billion from ¥37.5 billion for the previous period. The effective tax rate for the current period was 34.6%, an increase of 12.8 points from 21.8% for the previous period. The major factors for the increase were an increase of a valuation allowance against a deferred tax asset and an increase in the tax burden due to resource-related high rate taxes in the Energy segment.
Profit for the Period Attributable to Owners of the Parent
Impacts caused by a decrease in demand and a fluctuation in commodity price due to the spread of COVID-19 were included. As a result, profit for the period attributable to owners of the parent was ¥62.6 billion, a decline of ¥62.4 billion from the previous period.
- 5 -

2) Operating Results by Operating Segment
The business of the infrastructure of next-generation electric power, which was a part of the Machinery & Infrastructure Segment was transferred to the Energy Segment, effective April 1, 2020. In accordance with the aforementioned changes, the operating segment information for the previous period has been restated to conform to the current period presentation.
Iron & Steel Products Segment (Billions of Yen) Current Period Previous Period Change
Profit for the period attributable to owners of the parent (1.3) 1.5 (2.8)
Gross profit 5.4 6.4 (1.0)
Profit (loss) of equity method investments (1.9) 2.9 (4.8)
Dividend income 0.7 1.0 (0.3)
Selling, general and administrative expenses (5.6) (6.7) +1.1
Others 0.1 (2.1) +2.2
・ Profit (loss) of equity method investments decreased mainly due to the following factor:- For the current period, associated companies, which process and sell automotive steel products, reported a
decrease of profit mainly due to the lower operating time and slow sales caused by a decline in demand forsteel product, and the impact of foreign exchange fluctuations.
Mineral & Metal Resources Segment (Billions of Yen) Current Period Previous Period Change
Profit for the period attributable to owners of the parent 32.2 49.0 (16.8)
Gross profit 50.3 61.8 (11.5)
Profit (loss) of equity method investments 13.4 16.3 (2.9)
Dividend income 2.5 2.2 +0.3
Selling, general and administrative expenses (10.4) (8.1) (2.3)
Others (23.6) (23.2) (0.4)
・ Gross profit declined mainly due to the following factor:- Coal mining operations in Australia reported a decline of ¥13.9 billion mainly due to lower coal sales prices.
・ Selling, general and administrative expenses increased mainly due to the following factor:- For the current period, an impairment loss of ¥4.1 billion for doubtful debt was posted, reflecting the revisions
to our various assumptions regarding the Moatize mine business in Mozambique.
- 6 -

Energy Segment (Billions of Yen) Current Period Previous Period Change
Profit for the period attributable to owners of the parent 3.5 40.4 (36.9)
Gross profit 25.6 34.3 (8.7)
Profit (loss) of equity method investments 5.7 22.1 (16.4)
Dividend income 2.1 12.9 (10.8)
Selling, general and administrative expenses (11.1) (11.0) (0.1)
Others (18.8) (17.9) (0.9)
・ Gross profit declined mainly due to the following factors:- Mitsui Oil Exploration Co., Ltd. reported a decrease of ¥16.0 billion mainly due to lower oil and gas prices and
decrease in production.- Mitsui E&P USA LLC reported a decrease of ¥3.4 billion mainly due to lower gas prices.- Business division at the Headquarters reported an increase due to good performance in the LNG trading
business.・ Profit (loss) of equity method investment declined mainly due to the following factors:
- Mitsui E&P Mozambique Area 1 Limited reported a decrease of ¥11.9 billion due to the recognition of deferredtax assets, in accordance with the Final Investment Decision for the project for the previous period.
- Japan Australia LNG (MIMI) Pty. Ltd. reported a decrease mainly due to lower oil and gas prices.・ Dividends from six LNG projects (Qatargas 1, Oman, Qatargas 3, Sakhalin II, Abu Dhabi and Equatorial Guinea)
were ¥2.1 billion in total, a decrease of ¥10.3 billion from the previous period.・ In addition to the above, the following factor also affected results:
- Mitsui Oil Exploration Co., Ltd. reported an increase of ¥5.1 billion due to derivative related profits at itsoverseas subsidiary and foreign exchange related profits.
Machinery & Infrastructure Segment (Billions of Yen) Current Period Previous Period Change
Profit for the period attributable to owners of the parent 18.5 17.3 +1.2
Gross profit 26.7 30.1 (3.4)
Profit (loss) of equity method investments 17.3 25.8 (8.5)
Dividend income 1.6 1.7 (0.1)
Selling, general and administrative expenses (29.2) (31.7) +2.5
Others 2.1 (8.6) +10.7
・ Profit (loss) of equity method investments declined mainly due to the following factor:- For the previous period, investments in gas distribution companies in Brazil recorded a profit reflecting the
refund of service tax payments through arbitrations.・ In addition to the above, the following factor also affected results:
- For the current period, a gain on sale of IPP business in North America was recorded.
- 7 -

Chemicals Segment (Billions of Yen) Current Period Previous Period Change
Profit for the period attributable to owners of the parent 6.3 4.1 +2.2
Gross profit 29.9 31.8 (1.9)
Profit (loss) of equity method investments 0.9 3.5 (2.6)
Dividend income 1.1 1.4 (0.3)
Selling, general and administrative expenses (23.4) (25.8) +2.4
Others (2.2) (6.8) +4.6
・ Others include the following factor:- For the current period, insurance proceeds were recorded in the business in North America.
Lifestyle Segment (Billions of Yen) Current Period Previous Period Change
Profit for the period attributable to owners of the parent (5.6) 7.6 (13.2)
Gross profit 27.8 36.6 (8.8)
Profit (loss) of equity method investments (3.8) 4.5 (8.3)
Dividend income 2.2 2.3 (0.1)
Selling, general and administrative expenses (31.7) (36.4) +4.7
Others (0.1) 0.6 (0.7)
・Gross profit declined mainly due to the following factor:- For the current period, subsidiaries, whose businesses are fashion, food and distribution, reported a decrease of
profit due to the closure of stores and decrease in demand for commercial ingredients for the food serviceindustry caused by the state of emergency and curfew.
・ Profit (loss) of equity method investment declined mainly due to the following factor:- For the current period, associated companies, whose businesses are food, fashion and services, reported a
decrease of profit due to curfew and self-restraint.
- 8 -
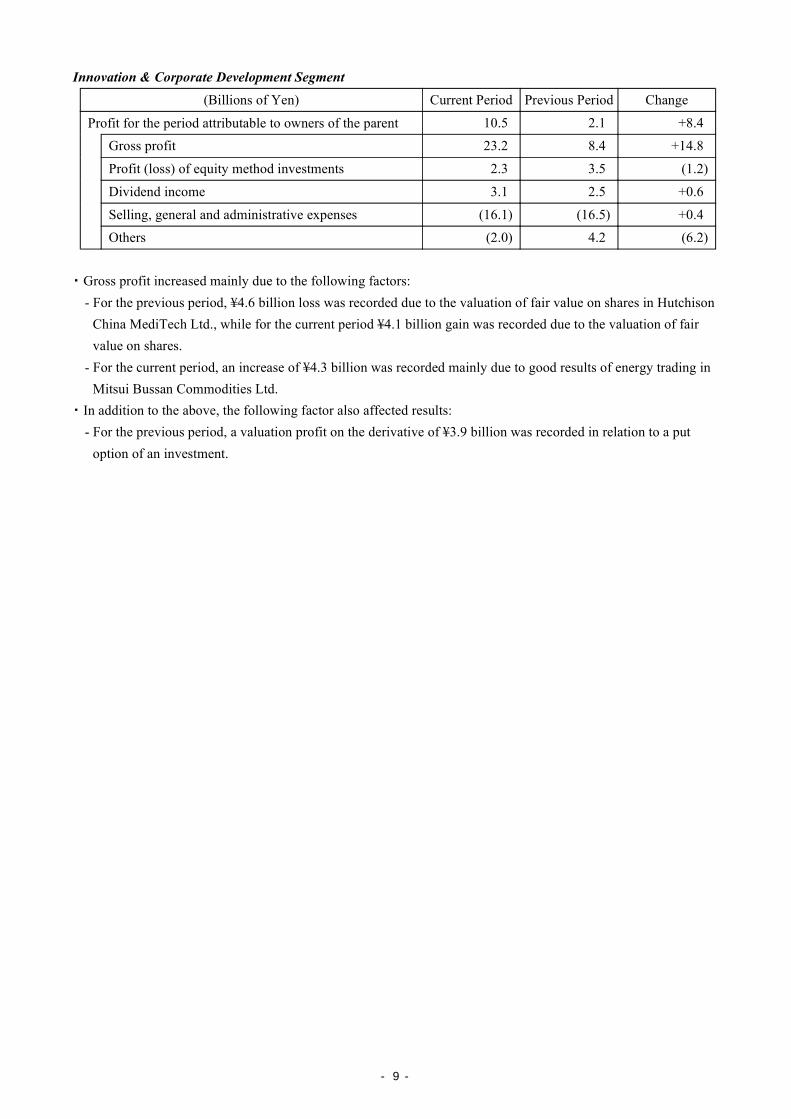
Innovation & Corporate Development Segment (Billions of Yen) Current Period Previous Period Change
Profit for the period attributable to owners of the parent 10.5 2.1 +8.4
Gross profit 23.2 8.4 +14.8
Profit (loss) of equity method investments 2.3 3.5 (1.2)
Dividend income 3.1 2.5 +0.6
Selling, general and administrative expenses (16.1) (16.5) +0.4
Others (2.0) 4.2 (6.2)
・ Gross profit increased mainly due to the following factors:- For the previous period, ¥4.6 billion loss was recorded due to the valuation of fair value on shares in Hutchison
China MediTech Ltd., while for the current period ¥4.1 billion gain was recorded due to the valuation of fairvalue on shares.
- For the current period, an increase of ¥4.3 billion was recorded mainly due to good results of energy trading inMitsui Bussan Commodities Ltd.
・ In addition to the above, the following factor also affected results:- For the previous period, a valuation profit on the derivative of ¥3.9 billion was recorded in relation to a put
option of an investment.
- 9 -

(3) Financial Condition and Cash Flows
1) Financial Condition
(Billions of yen) June 30, 2020 March 31, 2020 Change
Total Assets 11,486.0 11,806.3 (320.3)
Current Assets 3,768.1 4,124.4 (356.3)
Non-current Assets 7,717.9 7,681.9 +36.0
Current Liabilities 2,342.5 2,701.1 (358.6)
Non-current Liabilities 5,019.4 5,044.3 (24.9)
Net Interest-bearing Debt 3,534.9 3,486.7 +48.2Total Equity Attributable to Owners of the Parent
3,870.7 3,817.7 +53.0
Net Debt-to-Equity Ratio (times) 0.91 0.91 0.00
(*) “Net Debt-to-Equity Ratio” (“Net DER”) is comprised of “net interest bearing debt” divided by total equity attributable to owners of the parent. We define “net interest bearing debt” as follows: - calculate Interest-bearing debt by excluding lease liability from short-term debt and long-term debt.- calculate net interest bearing debt by subtracting cash and cash equivalents and time deposits with maturities
within one year after three months from interest bearing debt
Assets
Current Assets: ・ Cash and cash equivalents declined by ¥17.3 billion.・ Trade and other receivables declined by ¥162.4 billion, mainly due to lower market prices and decreases in
trading volume in the Energy Segment and the Chemicals Segment.・ Other financial assets declined by ¥137.7 billion, mainly due to market volatility and decreases in trading
volume of derivative trading in the Energy Segment and the Innovation & Corporate Development Segment.
Non-current Assets: ・ Investments accounted for using the equity method declined by ¥54.6 billion, mainly due to the following
factors:- An increase of ¥34.0 billion corresponding to the profit of equity method investments for the current period,
despite a decline of ¥59.0 billion due to dividends received from equity accounted investees; and- A decline due to a fair value valuation of shares in Arctic LNG 2 Project in Russia through Japan Arctic
LNG.・ Other investments increased by ¥92.4 billion, mainly due to the following factor:
- Mainly as a result of higher share prices, fair value on financial assets measured at FVTOCI increased by¥97.1 billion.
・ Property, plant and equipment increased by ¥30.7 billion, mainly due to the following factors:- An increase of ¥40.5 billion (including foreign exchange translation profit of ¥32.3 billion) at iron ore
mining operations in Australia; and- A decline of ¥14.7 billion (including foreign exchange translation loss of ¥1.7 billion) at the oil and gas
projects other than the U.S. shale gas and oil projects
- 10 -

Liabilities
Current Liabilities: ・ Current portion of long-term debt increased by ¥36.2 billion, mainly due to a reclassification to current
maturities.・ Trade and other payables declined by ¥111.4 billion, corresponding to the decline in trade and other
receivables.・ Other financial liabilities declined by ¥277.4 billion, mainly due to corresponding decline in other financial
assets, payments on account payable-other at the integrated development project in the 2, Otemachi 1-ChomeDistrict and decreases in the precious metal lease business in the Innovation & Corporate DevelopmentSegment.
Non-current Liabilities: ・ Long-term debt, less the current portion, declined by ¥27.6 billion.
Total Equity Attributable to Owners of the Parent ・ Retained earnings decreased by ¥51.8 billion.・ Other components of equity increased by ¥97.0 billion, mainly due to the following factors:
- Financial assets measured at FVTOCI increased by ¥70.0 billion; and- Foreign currency translation adjustments increased by ¥58.9 billion, mainly reflecting the appreciation of
the Australian dollar against the Japanese Yen, despite the depreciation of the U.S. dollar and the Brazilianreal.
・ Treasury stock which is a subtraction item in shareholders' equity decreased by ¥7.7 billion, mainly due to thecancellation of the stock for ¥46.7 billion, despite share buy-back for ¥39.1 billion.
2) Cash Flows(Billions of yen) Current Period Previous Period Change
Cash flows from operating activities 164.0 127.9 +36.1
Cash flows from investing activities (108.5) (110.5) +2.0
Free cash flow 55.5 17.4 +38.1
Cash flows from financing activities (88.2) 22.1 (110.3)
Effect of exchange rate changes on cash and cash equivalents etc.
15.4 (7.9) +23.3
Change in cash and cash equivalents (17.3) 31.6 (48.9)
Cash Flows from Operating Activities
(Billions of Yen) Current Period Previous Period Change
Cash flows from operating activities a 164.0 127.9 +36.1
Cash flows from change in working capital b 37.4 (28.0) +65.4
Repayments of lease liabilities c (15.8) (13.5) (2.3)
Core operating cash flow a-b+c 110.8 142.4 (31.6)
- 11 -

・ Net cash from an increase or a decrease in working capital, or changes in operating assets and liabilities for thecurrent period was ¥37.4 billion of net cash inflow. Repayments of lease liabilities for the current period was¥15.8 billion of cash outflow. Core operating cash flow, cash flows from operating activities without both netcash from an increase or a decrease in working capital and repayments of lease liabilities, for the current periodamounted to ¥110.8 billion. From current period, in order to reflect a regular cash generation output fromoperating activities more appropriately, repayments of lease liabilities have been deducted. In conformity withthis change, Core operating cash flow for the previous period has been restated.- Net cash inflow from dividend income, including dividends received from equity accounted investees, for
the current period totaled ¥49.3 billion, a decline of ¥26.4 billion from ¥75.7 billion for the previous period.- Depreciation and amortization for the current period was ¥63.0 billion, an increase of ¥2.5 billion from
¥60.5 billion for the previous period.
The following table shows core operating cash flow by operating segment.
(Billions of Yen) Current Period Previous Period Change
Iron & Steel Products 1.6 0.2 +1.4
Mineral & Metal Resources 41.9 57.7 (15.8)
Energy 36.4 58.7 (22.3)
Machinery & Infrastructure 12.9 18.2 (5.3)
Chemicals 15.7 6.5 +9.2
Lifestyle 3.6 7.4 (3.8)
Innovation & Corporate Development 12.7 (2.1) +14.8
All Other and Adjustments and Eliminations (14.0) (4.2) (9.8)
Consolidated Total 110.8 142.4 (31.6)
Cash Flows from Investing Activities
・ Net cash outflows that corresponded to investments in equity accounted investees (net of sales of investmentsin equity accounted investees) were ¥2.2 billion, though there was a sale of IPP business in North America as amain cash inflow factor.
・ Net cash outflows that corresponded to purchases of property, plant, and equipment (net of sales of thoseassets) were ¥78.8 billion, mainly due to the following factors:- An expenditure for the integrated development project in the 2, Otemachi 1-Chome District for
¥36.6 billion; and- An expenditure for iron ore mining operations in Australia for ¥11.1 billion.
・ Net cash outflows that corresponded to purchases of investment property (net of sales of those assets) were¥34.6 billion, mainly due to an expenditure for the integrated development project in the 2, Otemachi 1-ChomeDistrict for ¥30.6 billion.
Cash Flows from Financing Activities
・ Net cash inflows from net change in short-term debt were ¥2.6 billion, net cash inflows from net change inlong-term debt were ¥32.6 billion, and cash outflow from repayments of lease liabilities were ¥15.8 billion.
・ The cash outflow from the purchases of treasury stock was ¥39.1 billion.・ The cash outflow from payments of cash dividends was ¥68.3 billion.
- 12 -

(4) Management IssuesFor the three-month period ended June 30, 2020, there is no significant change in management issues. We maintainour profit forecast attributable to owners of the parent of ¥180.0 billion and core operating cash flow forecast of¥400.0 billion for the year ending March 31, 2021, as announced together with the results of the year ended March31, 2020. No updates have been made to these forecasts.
(5) Research & DevelopmentThere are no contracts for which disclosure is required.
3. Material Contracts
There are no contracts for which disclosure is required.
- 13 -

3. Condensed Consolidated Financial Statements
Condensed Consolidated Statements of Financial Position
Mitsui & Co., Ltd. and subsidiaries
June 30, 2020 and March 31, 2020
Millions of Yen
June 30, 2020
March 31, 2020
ASSETS Current Assets:
Cash and cash equivalents ……………………………………………… ¥ 1,041,388 ¥ 1,058,733
Trade and other receivables ………………………………..………….. 1,460,096 1,622,501
Other financial assets (Note 13) ………………………………………… 425,171 562,899
Inventories (Note 13) …………………………………………………… 533,957 553,861
Advance payments to suppliers …………………………………………… 156,385 167,250 Other current assets ……………………………………………………..… 151,129 159,175
Total current assets …………………………………………………… 3,768,126 4,124,419 Non-current Assets: Investments accounted for using the equity method .........………………… 2,826,363 2,880,958 Other investments (Note 13) …………………………….................……… 1,576,752 1,484,422 Trade and other receivables(Note 13) ……………………………...……… 411,076 422,423 Other financial assets (Note 13) …………………………………………… 169,255 186,010 Property, plant and equipment (Note 6) ………………………………… 2,152,059 2,121,371 Investment property ……………………………………………………… 259,849 251,838 Intangible assets ………………………………………………................… 192,732 195,289 Deferred tax assets ………………………………………………………… 51,538 58,908 Other non-current assets …………………………………………………… 78,297 80,654
Total non-current assets ……………………………………………… 7,717,921 7,681,873 Total assets ……………………………………………………..…… ¥ 11,486,047 ¥ 11,806,292
- 14 -

Condensed Consolidated Statements of Financial Position—(Continued)
Mitsui & Co., Ltd. and subsidiaries
June 30, 2020 and March 31, 2020
Millions of Yen
June 30, 2020
March 31, 2020
LIABILITIES AND EQUITY Current Liabilities: Short-term debt ……………………………………………………….…… ¥ 303,173 ¥ 297,458Current portion of long-term debt (Note 8) ……………………………… 436,097 399,904Trade and other payables ..…………………………………..…………… 1,025,096 1,136,504 Other financial liabilities (Notes 12 and 13) ……………………….……… 349,604 626,963 Income tax payables …………………………………………………..…… 48,760 46,206 Advances from customers …………………………………………….…… 109,435 133,247 Provisions ……………………………………………………..………… 26,420 25,844 Other current liabilities ………………………………………………..…… 43,909 34,984
Total current liabilities …………………………………………..…… 2,342,494 2,701,110 Non-current Liabilities: Long-term debt, less current portion (Notes 8 and 13) ………………… 4,201,551 4,229,218 Other financial liabilities (Notes 12 and 13) ……………………………… 96,995 105,279 Retirement benefit liabilities ……………………………………………… 41,186 39,956 Provisions ………………………………………………………………… 230,189 228,173 Deferred tax liabilities …………………………………………………..… 421,113 412,971 Other non-current liabilities ……………………………………………..… 28,330 28,653
Total non-current liabilities ………………………………..………… 5,019,364 5,044,250 Total liabilities ……………………………………………..………… 7,361,858 7,745,360
Equity: Common stock …………………………………………………..………… 341,776 341,776 Capital surplus ……………………………………………………..……… 402,742 402,652 Retained earnings …………………………………………………..……… 3,310,530 3,362,297 Other components of equity (Note 9) ………………………………...…… (126,877) (223,910) Treasury stock ………………………………………………………..…… (57,444) (65,138) Total equity attributable to owners of the parent …………………….…… 3,870,727 3,817,677 Non-controlling interests …………………………………………….…… 253,462 243,255
Total equity ………………………………………………………..… 4,124,189 4,060,932 Total liabilities and equity …………………………………….…… ¥ 11,486,047 ¥ 11,806,292
- 15 -

Condensed Consolidated Statements of Income and Comprehensive Income
Condensed Consolidated Statements of Income
Mitsui & Co., Ltd. and subsidiaries
For the Three-Month Periods Ended June 30, 2020 and 2019
Millions of Yen
Three-month period ended June 30, 2020
Three-month period ended June 30, 2019
Revenue (Notes 4, 5 and 13)………………………………………………………………………… ¥ 1,521,768 ¥ 1,633,120 Cost…………………………………………………………………………………………………… (1,332,061) (1,423,889) Gross Profit (Note 4)………………………………………………………………………………… 189,707 209,231 Other Income (Expenses): Selling, general and administrative expenses ……………………………………………………… (134,708) (141,243) Gain (loss) on securities and other investments-net ………………………………………………… 8,427 6,310 Impairment reversal (loss) of fixed assets-net……………………………………………………… (305) (1,695) Gain (loss) on disposal or sales of fixed assets-net ……………………………………………… (97) 1,366 Other income (expense)-net…………………………………………………………………………… 282 7,772
Total other income (expenses) ………………………………………………… (126,401) (127,490) Finance Income (Costs): Interest income …………………………………………………………………………………… 6,218 11,183 Dividend income ………………………………………………………………………………… 13,896 24,766 Interest expense …………………………………………………………………………………… (15,433) (23,760)
Total finance income (costs) …………………………………………………… 4,681 12,189
Share of Profit (Loss) of Investments Accounted for Using the Equity Method (Notes 4 and 14) 34,003 78,473
Profit before Income Taxes ……………………………………………………………………… 101,990 172,403 Income Taxes ………………………………………………………………………………………… (35,327) (37,519) Profit for the Period ……………………………………………………………………………… ¥ 66,663 ¥ 134,884 Profit for the Period Attributable to: Owners of the parent (Note 4)………………………………………………………………………… ¥ 62,557 ¥ 125,036 Non-controlling interests ………………………………………………………………………… 4,106 9,848
Yen Earnings per Share Attributable to Owners of the Parent (Note 11): Basic ……………………………………………………………………………………………… ¥ 36.92 ¥ 71.94 Diluted …………………………………………………………………………………………… ¥ 36.90 ¥ 71.88
- 16 -

Condensed Consolidated Statements of Income and Comprehensive Income—(Continued)
Condensed Consolidated Statements of Comprehensive Income
Mitsui & Co., Ltd. and subsidiaries
For the Three-Month Periods Ended June 30, 2020 and 2019
Millions of Yen
Three-month period ended June 30, 2020
Three-month period ended June 30, 2019
Comprehensive Income: Profit for the period ……………………………………………………………………………… ¥ 66,663 ¥ 134,884 Other comprehensive income :
Items that will not be reclassified to profit or loss: Financial assets measured at FVTOCI …………………………………………………… 97,758 21,468 Remeasurements of defined benefit pension plans ……………………………………… (1,374) (131) Share of other comprehensive income of investments accounted for using the equity method ……………………………………………………………………… (16,031) (503)
Income tax relating to items not reclassified ……………………………………………… (9,247) (4,393) Items that may be reclassified subsequently to profit or loss:
Foreign currency translation adjustments ………………………………………………… 72,176 (33,923) Cash flow hedges ………………………………………………………………………… 3,275 (7,103) Share of other comprehensive income of investments accounted for using the equity method ……………………………………………………………………… (40,096) (80,370)
Income tax relating to items that may be reclassified …………………………………… (887) 1,550 Total other comprehensive income …………………………………………………………… 105,574 (103,405)
Comprehensive Income for the Period ………………………………………………………… ¥ 172,237 ¥ 31,479 Comprehensive Income for the Period Attributable to: Owners of the parent ……………………………………………………………………………… ¥ 160,312 ¥ 30,648 Non-controlling interests ………………………………………………………………………… 11,925 831
- 17 -

Condensed Consolidated Statements of Changes in Equity
Mitsui & Co., Ltd. and subsidiaries
For the Three-Month Periods Ended June 30, 2020 and 2019
Millions of Yen
Attributable to owners of the parent
Common Stock
Capital Surplus
Retained Earnings (Note 10)
Other
Components of Equity (Note 9)
Treasury Stock Total
Non- controlling Interests
Total Equity
Balance as at April 1, 2019 ¥ 341,482 ¥ 387,335 ¥ 3,078,655 ¥ 463,270 ¥ (7,576) ¥ 4,263,166 ¥ 267,142 ¥ 4,530,308 Cumulative effect of changes in
accounting policies …….……. (5,306) (5,306) (5,306)
Balance as at April 1, 2019 after changes in accounting policies
341,482 387,335 3,073,349 463,270 (7,576) 4,257,860 267,142 4,525,002
Profit for the period ..……………… 125,036 125,036 9,848 134,884 Other comprehensive income
for the period …………………… (94,388) (94,388) (9,017) (103,405)
Comprehensive income for the period ……………………… 125,036 (94,388) 30,648 831 31,479
Transaction with owners: Dividends paid to owners of
the parent ………………………… (69,524) (69,524) (69,524)
Dividends paid to non-controlling interest shareholders .……………
(4,482) (4,482)
Acquisition of treasury stock ……… (3) (3) (3) Equity transactions with
non-controlling interest shareholders ..……………………
15,499 (538) 14,961 1,567 16,528
Transfer to retained earnings ………… 844 (844) - - Balance as at June 30, 2019 ¥ 341,482 ¥ 402,834 ¥ 3,129,705 ¥ 367,500 ¥ (7,579) ¥ 4,233,942 ¥ 265,058 ¥ 4,499,000
Millions of Yen
Attributable to owners of the parent
Common Stock
Capital Surplus
Retained Earnings (Note 10)
Other
Components of Equity (Note 9)
Treasury Stock Total
Non- controlling Interests
Total Equity
Balance as at April 1, 2020 ¥ 341,776 ¥ 402,652 ¥ 3,362,297 ¥ (223,910) ¥ (65,138) ¥ 3,817,677 ¥ 243,255 ¥ 4,060,932
Profit for the period ..……………… 62,557 62,557 4,106 66,663 Other comprehensive income
for the period …………………… 97,755 97,755 7,819 105,574
Comprehensive income for the period ……………………… 62,557 97,755 160,312 11,925 172,237
Transaction with owners: Dividends paid to owners of
the parent ………………………… (68,301) (68,301) (68,301)
Dividends paid to non-controlling interest shareholders .……………
(1,129) (1,129)
Acquisition of treasury stock ……… (39,067) (39,067) (39,067) Sales of treasury stock ..…………… (16) (23) 39 0 0 Cancellation of treasury stock...…… (46,722) 46,722 - - Equity transactions with
non-controlling interest shareholders ..……………………
106 0 106 (589) (483)
Transfer to retained earnings ………… 722 (722) - - Balance as at June 30, 2020 ¥ 341,776 ¥ 402,742 ¥ 3,310,530 ¥ (126,877) ¥ (57,444) ¥ 3,870,727 ¥ 253,462 ¥ 4,124,189
- 18 -

Condensed Consolidated Statements of Cash Flows
Mitsui & Co., Ltd. and subsidiaries
For the Three-Month Periods Ended June 30, 2020 and 2019
Millions of Yen
Three-month period ended June 30, 2020
Three-month period ended June 30, 2019
Operating Activities: Profit for the period ……………………………………………………………………………… ¥ 66,663 ¥ 134,884 Adjustments to reconcile profit for the period to cash flows from operating activities:
Depreciation and amortization …………………………………………………………… 63,018 60,537 Change in retirement benefit liabilities …………………………………………………… (398) 367 Loss allowance…………………………………………………………………………… 7,953 3,625 (Gain) loss on securities and other investments—net …………………………………… (8,427) (6,310) Impairment (reversal) loss of fixed assets—net …………………………………………… 305 1,695 (Gain) loss on disposal or sales of fixed assets—net ……………………………………… 97 (1,366) Interest Income, dividend income and interest expense ……………………………… (12,835) (10,860) Income taxes ……………………………………………………………………………… 35,327 37,519 Share of (profit) loss of investments accounted for using the equity method …………… (34,003) (78,473) Valuation (gain) loss related to contingent considerations and others …………………… (3,656) (2,809) Changes in operating assets and liabilities:
Change in trade and other receivables ………………………………………………… 225,662 50,966 Change in inventories ………………………………………………………………… 24,209 (49,495) Change in trade and other payables …………………………………………………… (123,169) (76,767) Other—net ……………………………………………………………………………… (89,302) 47,279
Interest received …………………………………………………………………………… 14,923 11,064 Interest paid ……………………………………………………………………………… (17,451) (25,385) Dividends received ………………………………………………………………………… 49,339 75,747 Income taxes paid ………………………………………………………………………… (38,212) (45,610) Income taxes refunded …………………………………………………………………… 3,997 1,271 Cash flows from operating activities ……………………………………………………… 164,040 127,879
Investing Activities: Change in time deposits …………………………………………………………………………… (677) (5,701) Investments in equity accounted investees ……………………………………………………… (21,353) (29,268) Proceeds from sales of investments in equity accounted investees……………………………… 19,142 5,915 Purchases of other investments …………………………………………………………………… (7,053) (12,117) Proceeds from sales and maturities of other investments ………………………………………… 6,905 5,835 Increases in loan receivables ……………………………………………………………………… (1,617) (17,081) Collections of loan receivables …………………………………………………………………… 9,583 6,635 Purchases of property, plant and equipment……………………………………………………… (82,076) (61,848) Proceeds from sales of property, plant and equipment…………………………………………… 3,245 1,022 Purchases of investment property ………………………………………………………………… (34,637) (3,895)
Cash flows from investing activities ……………………………………………………… (108,538) (110,503) Financing Activities: Change in short-term debt ………………………………………………………………………… 2,601 131,543 Proceeds from long-term debt …………………………………………………………………… 195,133 198,085 Repayments of long-term debt …………………………………………………………………… (162,561) (229,711) Repayments of lease liabilities (Notes 2 and 4) ………………………………………………… (15,796) (13,541) Purchases and sales of treasury stock …………………………………………………………… (39,067) (3) Dividends paid …………………………………………………………………………………… (68,301) (69,524) Transactions with non-controlling interests shareholders ………………………………………… (250) 5,262
Cash flows from financing activities ……………………………………………………… (88,241) 22,111 Effect of Exchange Rate Changes on Cash and Cash Equivalents …………………………… 15,394 (7,932) Change in Cash and Cash Equivalents ………………………………………………………… (17,345) 31,555 Cash and Cash Equivalents at Beginning of Period …………………………………………… 1,058,733 956,107 Cash and Cash Equivalents at End of Period ………………………………………………… ¥ 1,041,388 ¥ 987,662
- 19 -
“Interest income, dividend income and interest expense”, “Interest received”, “Interest paid” and “Dividends received” of Condensed
Consolidated Statements of Cash Flows include not only interest income, dividend income and interest expense that are included in
“Finance Income (Costs)” of Condensed Consolidated Statements of Income, but also interest income, dividend income, interest
expense that are included in Revenue and Cost respectively and cash flows related with them.
- 20 -

Notes to Condensed Consolidated Financial Statements
Mitsui & Co., Ltd. and subsidiaries
1. REPORTING ENTITY
Mitsui & Co., Ltd. (the “Company”) is a company incorporated in Japan. Condensed Consolidated Financial Statements of the Company have a quarterly closing date as of June 30 and comprises the financial statements of the Company and its subsidiaries (collectively, the “companies”), and the interests in associated companies and joint ventures (collectively, the “equity accounted investees”).
The companies, as sogo shosha or general trading companies, are engaged in business activities, such as trading in various commodities, financing for customers and suppliers relating to such trading activities worldwide, and organizing and coordinating industrial projects through their worldwide business networks.
The companies conduct sales, export, import, offshore trades and manufacture of products in the areas of “Iron & Steel Products,” “Mineral & Metal Resources,” “Energy,” “Machinery & Infrastructure,” “Chemicals,” “Lifestyle,” and “Innovation & Corporate Development,” while providing general services for retailing, information and communications, technical support, transportation, and logistics and financing.
In addition to the above, the companies are also engaged in the development of natural resources such as oil and gas, and iron and steel raw materials and in strategic business investments in new areas such as information technology, renewable energy, and environmental solution business.
2. BASIS OF CONDENSED CONSOLIDATED FINANCIAL STATEMENTS
Ⅰ. BASIS OF PREPARATION
Condensed Consolidated Financial Statements have been prepared in accordance with International Accounting Standard No.34 (“IAS34”) and not all information required in Consolidated Financial Statements as of the end of fiscal year is included. Therefore, Condensed Consolidated Financial Statements should be used with Consolidated Financial Statements of the previous fiscal year.
Ⅱ. USE OF ESTIMATES AND JUDGMENTS
The preparation of Condensed Consolidated Financial Statements requires management to make judgments based on assumptions and estimates that affect the application of accounting policies and the reported amounts of assets, liabilities, income and expenses. Actual results could differ from these judgments based on assumptions and estimates.
The judgments based on assumptions and estimates which could affect the accompanying Condensed Consolidated Financial Statements are the same as those of the previous fiscal year. No significant changes have been made to the estimation of the impact relating to the spread of COVID-19 for the three-month period ended June 30, 2020.
- 21 -

Ⅲ. SIGNIFICANT ACCOUNTING POLICIES
Significant accounting policies applied in the Condensed Consolidated Financial Statements for the period ended June 30, 2020 are the same as those applied in the Consolidated Financial Statements of the previous fiscal year except for the following.
The companies applied the following new standards for Condensed Consolidated Financial Statements from April 1, 2020.
IFRS Title Summaries
IFRS 3 Business Combinations (amended in October 2018)
Amendment of definition of a business
Impacts from the application of IFRS 3 "Business Combinations" amended in October 2018 on the Condensed Consolidated Financial Statements are immaterial.
IV. CHANGES IN PRESENTATION
(Condensed Consolidated Statements of Cash Flows)
“Repayments of lease liabilities”, which was included in “Repayments of long-term debt” for the three-month period ended June 2019 is separately presented from the three-month period ended June 2020 in order to indicate the calculation of Core Operating Cash Flow whose formula has been altered from April 1,2020. Condensed Consolidated Statements of Cash Flows for the three-month period ended June 2019 is reclassified to conform to this change in presentation. As a result, the amount of ¥(243,252) million for the three-month period ended June 2019, which was presented in “Repayments of long-term debt” within “Cash Flows from Financing Activities” in the Condensed Consolidated Statements of Cash Flows for the three-month period ended June 2019 has been reclassified and presented as ¥(229,711) million for “Repayments of long-term debt” and as ¥(13,541) million for “Repayments of lease liabilities”.
3. BUSINESS COMBINATIONS
For the three-month period ended June 30, 2020
No material business combinations were completed during the three-month period ended June 30, 2020.
For the three-month period ended June 30, 2019
No material business combinations were completed during the three-month period ended June 30, 2019.
- 22 -
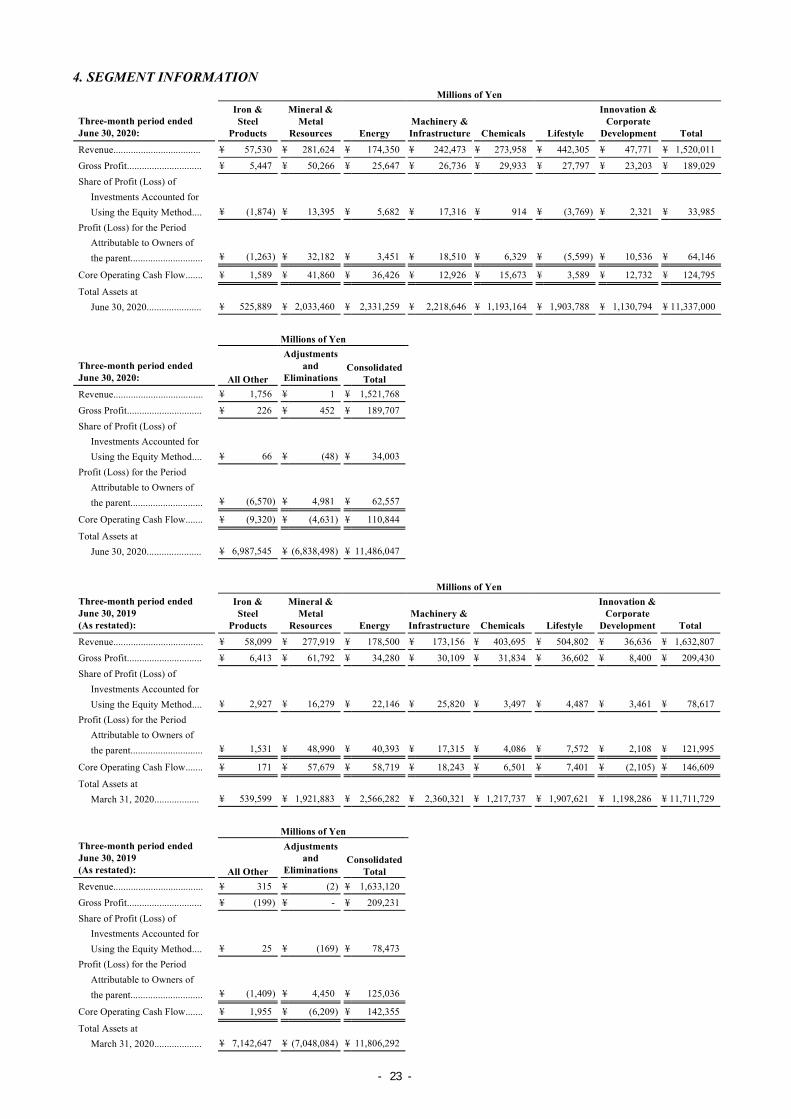
4. SEGMENT INFORMATIONMillions of Yen
Three-month period ended June 30, 2020:
Iron & Steel
Products
Mineral & Metal
Resources Energy Machinery & Infrastructure
Chemicals Lifestyle
Innovation & Corporate
Development Total Revenue................................... ¥ 57,530 ¥ 281,624 ¥ 174,350 ¥ 242,473 ¥ 273,958 ¥ 442,305 ¥ 47,771 ¥ 1,520,011 Gross Profit.............................. ¥ 5,447 ¥ 50,266 ¥ 25,647 ¥ 26,736 ¥ 29,933 ¥ 27,797 ¥ 23,203 ¥ 189,029 Share of Profit (Loss) of
Investments Accounted for Using the Equity Method.... ¥ (1,874) ¥ 13,395 ¥ 5,682 ¥ 17,316 ¥ 914 ¥ (3,769) ¥ 2,321 ¥ 33,985 Profit (Loss) for the Period
Attributable to Owners of the parent............................. ¥ (1,263) ¥ 32,182 ¥ 3,451 ¥ 18,510 ¥ 6,329 ¥ (5,599) ¥ 10,536 ¥ 64,146
Core Operating Cash Flow....... ¥ 1,589 ¥ 41,860 ¥ 36,426 ¥ 12,926 ¥ 15,673 ¥ 3,589 ¥ 12,732 ¥ 124,795 Total Assets at
June 30, 2020...................... ¥ 525,889 ¥ 2,033,460 ¥ 2,331,259 ¥ 2,218,646 ¥ 1,193,164 ¥ 1,903,788 ¥ 1,130,794 ¥ 11,337,000
Millions of Yen
Three-month period ended June 30, 2020: All Other
Adjustments and
Eliminations Consolidated
Total Revenue.................................... ¥ 1,756 ¥ 1 ¥ 1,521,768 Gross Profit.............................. ¥ 226 ¥ 452 ¥ 189,707 Share of Profit (Loss) of
Investments Accounted for Using the Equity Method.... ¥ 66 ¥ (48) ¥ 34,003 Profit (Loss) for the Period
Attributable to Owners of the parent............................. ¥ (6,570) ¥ 4,981 ¥ 62,557
Core Operating Cash Flow....... ¥ (9,320) ¥ (4,631) ¥ 110,844 Total Assets at
June 30, 2020...................... ¥ 6,987,545 ¥ (6,838,498) ¥ 11,486,047
Millions of Yen Three-month period ended June 30, 2019 (As restated):
Iron & Steel
Products
Mineral & Metal
Resources Energy Machinery & Infrastructure
Chemicals Lifestyle
Innovation & Corporate
Development Total Revenue.................................... ¥ 58,099 ¥ 277,919 ¥ 178,500 ¥ 173,156 ¥ 403,695 ¥ 504,802 ¥ 36,636 ¥ 1,632,807 Gross Profit.............................. ¥ 6,413 ¥ 61,792 ¥ 34,280 ¥ 30,109 ¥ 31,834 ¥ 36,602 ¥ 8,400 ¥ 209,430 Share of Profit (Loss) of
Investments Accounted for Using the Equity Method.... ¥ 2,927 ¥ 16,279 ¥ 22,146 ¥ 25,820 ¥ 3,497 ¥ 4,487 ¥ 3,461 ¥ 78,617 Profit (Loss) for the Period
Attributable to Owners of the parent............................. ¥ 1,531 ¥ 48,990 ¥ 40,393 ¥ 17,315 ¥ 4,086 ¥ 7,572 ¥ 2,108 ¥ 121,995
Core Operating Cash Flow....... ¥ 171 ¥ 57,679 ¥ 58,719 ¥ 18,243 ¥ 6,501 ¥ 7,401 ¥ (2,105) ¥ 146,609 Total Assets at
March 31, 2020.................. ¥ 539,599 ¥ 1,921,883 ¥ 2,566,282 ¥ 2,360,321 ¥ 1,217,737 ¥ 1,907,621 ¥ 1,198,286 ¥ 11,711,729
Millions of Yen Three-month period ended June 30, 2019 (As restated): All Other
Adjustments and
Eliminations Consolidated
Total Revenue.................................... ¥ 315 ¥ (2) ¥ 1,633,120
Gross Profit.............................. ¥ (199) ¥ - ¥ 209,231Share of Profit (Loss) of
Investments Accounted for Using the Equity Method.... ¥ 25 ¥ (169) ¥ 78,473 Profit (Loss) for the Period
Attributable to Owners of the parent............................. ¥ (1,409) ¥ 4,450 ¥ 125,036
Core Operating Cash Flow....... ¥ 1,955 ¥ (6,209) ¥ 142,355 Total Assets at
March 31, 2020................... ¥ 7,142,647 ¥ (7,048,084) ¥ 11,806,292
- 23 -

Notes:(1)“All Other” includes of the Corporate Staff Unit which provides financing services and operations services to the companies and affiliated companies. Total Assets of “All Other” at June 30, 2020 and March 31, 2020 includes cash, cash equivalents and time deposits related to financing activities, and assets of the Corporate Staff Unit and certain subsidiaries related to the above services.
(2)Transfers between reportable segments are made at cost plus a markup.(3)Profit (Loss) for the Period Attributable to Owners of the parent of “Adjustments and Eliminations”
includes income and expense items that are not allocated to specific reportable segments, andeliminations of intersegment transactions.
(4)Formerly, Core Operating Cash Flow was calculated by eliminating the sum of the “Changes inOperating Assets and Liabilities” from “Cash Flows from Operating Activities” as presented in theCondensed Consolidated Statements of Cash Flows. From the three-month period ended June 30, 2020,it is calculated by additionally deducting the “Repayments of lease liabilities” as presented in the “CashFlows from Financing Activities”. In accordance with this change, Core Operating Cash Flow for thethree-month period ended June 30, 2019 has been restated.
(5)In order to accelerate our multifaceted, flexible initiatives that combine various kinds of knowledgefrom different business domains, the business of next-generation electric power was transferred fromthe “Machinery & Infrastructure” segment to the “Energy” segment, in conjunction with the creation ofthe Energy Solutions Business Unit in “Energy” segment, from the three-month period ended June 30,2020. In accordance with this change, the segment information for the three-month period ended June30, 2019 has been restated to conform to the current period presentation.
5. REVENUE
Among "Revenue", the disaggregation of revenue recognized from contracts with customers by product segment is as follows. The following categories are same as in Note.4 "Segment Information". Please refer to Note.4 ”Segment information“ for the details of the restatement for the three-month period ended June 30, 2019. Revenue other than revenue recognized from contracts with customers includes revenue related to lease and financial instruments, etc.
Millions of Yen
Three-month period ended June 30, 2020
Iron & Steel
Products
Mineral & Metal
Resources Energy
Machinery &
Infrastructure Chemicals Lifestyle
Innovation & Corporate
Development All Others Total
Revenue recognized from contracts with customers
¥ 55,406 ¥ 225,799 ¥ 113,827 ¥ 226,389 ¥ 268,028 ¥ 352,823 ¥ 32,449 ¥ 1,795 ¥ 1,276,516
Millions of Yen
Three-month period ended June 30, 2019:
Iron & Steel
Products
Mineral & Metal
Resources Energy
Machinery &
Infrastructure Chemicals Lifestyle
Innovation & Corporate
Development All Others Total Revenue recognized from contracts with customers
¥ 56,101 ¥ 225,695 ¥ 132,261 ¥ 147,374 ¥ 398,301 ¥ 382,547 ¥ 30,318 ¥ 844 ¥ 1,373,441
6. ACQUISITONS AND DISPOSALS OF PROPERTY, PLANT AND EQUIPMENT
The amount of acquisitions of property, plant and equipment for the three-month period ended June 30, 2020 was ¥55,957 million and the amount of disposals was not material.The amount of acquisitions of property, plant and equipment for the three-month period ended June 30, 2019 was¥68,983 million and the amount of disposals was not material.
- 24 -

7. IMPAIRMENT LOSSES AND REVERSALS OF IMPAIRMENT LOSSES FOR ASSETS
The amounts of impairment losses for assets for the three-month period ended June 30, 2020 and 2019 were not material. The amounts of reversals of impairment losses for assets for the three-month period ended June 30, 2020 and 2019 were not material.
8. ISSUES AND REPAYMENTS OF BONDS
The total amount of repaid bonds for the three-month period ended June 30, 2020 was none. The total amount of issued bonds for the three-month period ended June 30, 2020 was none.
The total amount of repaid bonds for the three-month period ended June 30, 2019 was none. The total amount of issued bonds for the three-month period ended June 30, 2019 was none.
- 25 -

9. EQUITY
Changes in other components of equity for the three-month periods ended June 30, 2020 and 2019 were as follows:
Millions of Yen
Three-month period ended June 30, 2020
Three-month period ended June 30, 2019
Financial Assets Measured at FVTOCI:
Balance at beginning of period ………………………………… ¥ 7,479 ¥ 356,498Increase (decrease) during the period …………………………… 72,354 17,439Transfer to retained earnings …………………………………… (2,345) (1,053)
Balance at end of period ………………………………………… ¥ 77,488 ¥ 372,884Remeasurements of Defined Benefit Pension Plans:
Balance at beginning of period ………………………………… ¥ - ¥ -
Increase (decrease) during the period …………………………… (1,623) (209)
Transfer to retained earnings …………………………………… 1,623 209
Balance at end of period ………………………………………… ¥ - ¥ -
Foreign Currency Translation Adjustments: Balance at beginning of period ………………………………… ¥ (177,143) ¥ 124,506
Increase (decrease) during the period …………………………… 58,987 (95,748)
Balance at end of period ………………………………………… ¥ (118,156) ¥ 28,758
Cash Flow Hedges:
Balance at beginning of period ………………………………… ¥ (54,246) ¥ (17,734)
Increase (decrease) during the period …………………………… (31,963) (16,408)
Balance at end of period ………………………………………… ¥ (86,209) ¥ (34,142)
Total:
Balance at beginning of period ………………………………… ¥ (223,910) ¥ 463,270
Increase (decrease) during the period …………………………… 97,755 (94,926)
Transfer to retained earnings …………………………………… (722) (844)
Balance at end of period ………………………………………… ¥ (126,877) ¥ 367,500
- 26 -

10. DIVIDENDS
During the three-month periods ended June 30, 2020 and 2019, the Company paid dividends of ¥40 per share (total dividend of ¥68,301 million) and ¥40 per share (total dividend of ¥69,524 million), respectively.
11. EARNINGS PER SHARE
The following is a reconciliation of basic earnings per share attributable to owners of the parent to diluted earnings per share attributable to owners of the parent for the three-month periods ended June 30, 2020 and 2019:
Three-month Period Ended June 30, 2020 Three-month Period Ended June 30, 2019
Profit (numerator)
Shares (denominator)
Per share amount
Profit (numerator)
Shares (denominator)
Per share amount
Millions of Yen
In Thousands Yen Millions of
Yen In
Thousands Yen
Basic earnings per share attributable to owners of the parent:
¥ 62,557 1,694,435 ¥ 36.92 ¥ 125,036 1,738,073 ¥ 71.94
Effect of dilutive securities: Adjustment of effect of:
Dilutive securities of associated companies. (5) - (12) -
Stock options …………………… - 907 - 1,183Diluted earnings per share attributable to owners of the parent:
¥ 62,552 1,695,342 ¥ 36.90 ¥ 125,024 1,739,256 ¥ 71.88
- 27 -

12. CONTINGENT LIABILITIES
Ⅰ. GUARANTEES
The companies provide various types of guarantees for the benefit of third parties and related parties principally to enhance their credit standings, and would be required to execute payments if a guaranteed party failed to fulfill its obligation with respect to a borrowing or trade payable.
The table below summarizes the maximum potential amount of future payments, amount outstanding and recourse provisions/collateral of the companies’ guarantees as of June 30, 2020 and March 31, 2020. The maximum potential amount of future payments represents the amount without consideration of possible recovery under recourse provisions or from collateral held or pledged that the companies could be obliged to pay if there were defaults by guaranteed parties. Such amounts bear no relationship to the anticipated losses on these guarantees and indemnifications and, in the aggregate, they greatly exceed anticipated losses. The companies evaluate risks involved for each guarantee through an internal screening procedure before issuing a guarantee and regularly monitor outstanding positions and record adequate allowance to cover losses expected from probable performance under these agreements. The companies believe that the likelihood of performing guarantees which would materially affect the consolidated financial position, operating results, or cash flows of the companies is remote at June 30, 2020.
Millions of Yen
Maximum potential
amount of future
payments
Amount outstanding
(a)
Recourse provisions/ Collateral
(b)
Net amount outstanding
(a)-(b)
June 30, 2020
Type of guarantees: Financial guarantees
Guarantees for third parties …………………
¥ 93,955 ¥ 55,730 ¥ 1,946 ¥ 53,784
Guarantees for investments accounted for using the equity method ………………
1,089,114 785,482 110,302 675,180
Performance guarantees
Guarantees for third parties …………………
39,534 37,453 19,383 18,070
Guarantees for investments accounted for using the equity method ………………
65,129 59,190 1,730 57,460
Total ……………… ¥ 1,287,732 ¥ 937,855 ¥ 133,361 ¥ 804,494
- 28 -

Millions of Yen
Maximum potential
amount of future
payments
Amount outstanding
(a)
Recourse provisions/ Collateral
(b)
Net amount outstanding
(a)-(b)
March 31, 2020
Type of guarantees: Financial guarantees
Guarantees for third parties …………………
¥ 95,085 ¥ 56,037 ¥ 2,018 ¥ 54,019
Guarantees for investments accounted for using the equity method ………………
1,101,608 779,288 93,005 686,283
Performance guarantees
Guarantees for third parties …………………
38,831 36,333 19,146 17,187
Guarantees for investments accounted for using the equity method ………………
65,591 59,646 1,747 57,899
Total ……………… ¥ 1,301,115 ¥ 931,304 ¥ 115,916 ¥ 815,388
Guarantees for third parties
The companies guarantee, severally or jointly with others, indebtedness of certain customers and suppliers in the furtherance of their trading activities. Most of these guarantees outstanding as of June 30, 2020 and March 31, 2020 will expire through 2027.
Guarantees for investments accounted for using the equity method
The companies, severally or jointly with others, issue guarantees for investments accounted for using the equity method for the purpose of furtherance of their trading activities and enhancement of their credit for securing financing. Most of these guarantees outstanding as of June 30, 2020 and March 31, 2020 will expire through 2031.
The table below summarizes the maximum potential amount of future payments for the companies’ guarantees by the remaining contractual period as of June 30, 2020 and March 31, 2020.
Millions of Yen
June 30, 2020 March 31, 2020
Within 1 year ……………………………… ¥ 534,228 ¥ 523,950
After 1 to 5 years …………………………… 212,455 223,538
After 5 years ……………………………… 541,049 553,627
Total …………………………………… ¥ 1,287,732 ¥ 1,301,115
- 29 -

Ⅱ. LITIGATION
Various claims and legal actions are pending against the companies in respect of contractual obligations and other matters arising from the conduct of the companies’ businesses. Appropriate provision has been recorded for the estimated loss on claims and legal actions. In the opinion of management, any additional liabilities will not materially affect the consolidated financial position, operating results, or cash flows of the companies.
(TAXATION ON CAPITAL GAIN IN INDIA)
Earlyguard Limited (“EG”), a UK subsidiary of Mitsui & Co., Ltd., received a tax payment notice dated January 21, 2020 which requested payment of 24 billion Indian Rupees (¥37 billion) from Indian tax authority. The taxable income of this notice is the capital gain on sales of Finsider International Company Limited (a UK company that owned 51% of Sesa Goa, an Indian iron ore company) shares held by EG in April 2007. Although EG treated the capital gain properly according to the tax laws at that time, the tax payment notice has been issued. The company does not expect a significant impact on our consolidated financial position, operating results and cash flow at this stage.
13. FAIR VALUE MEASUREMENT
IFRS 13 “Fair Value Measurement” defines fair value as the price that would be received to sell an asset or paid to transfer a liability in an orderly transaction between market participants at the measurement date. IFRS 13 establishes the fair value hierarchy that may be used to measure fair value, which is provided as follows. The companies recognize transfers of assets or liabilities between levels of the fair value hierarchy as of the end of each reporting period when the transfers occur.
Level 1:
Quoted prices (unadjusted) in active markets for identical assets or liabilities.
Level 2:
Inputs other than quoted prices included within level 1 that are observable for the assets or liabilities, either directly or indirectly. Level 2 inputs include the following:
- Quoted prices for similar assets or liabilities in active markets- Quoted prices for identical or similar assets or liabilities in markets that are not active- Inputs other than quoted prices that are observable for the assets or liabilities- Inputs that are derived principally from or corroborated by observable market data by correlation or other means
Level 3:
Unobservable inputs for the assets or liabilities.
(1) Valuation techniques
Primary valuation techniques used for each financial instrument and non-financial asset measured at fair value are as follows:
Trades and other receivables
- Trades and other receivables other than measured at amortized cost are measured at fair value.
- 30 -

- Trades and other receivables other than measured at amortized cost are measured at fair value principally usingthe discounted cash flow method and other appropriate valuation techniques considering various assumptions,including expected future cash flows and discount rates reflecting the related risks of the customer. They areclassified as level 3, considering the degree to which the inputs are observable in the relevant markets.
Other Investments
- Other investments other than measured at amortized cost are measured at fair value.- Publicly-traded other investments are measured using quoted market prices in an active market and classified as
level 1.- Non-marketable other investments are measured at fair value principally using the discounted cash flow method,
the market comparison approach and other appropriate valuation techniques considering various assumptions,including expected future cash flows and discount rates reflecting the related risks of the investee.They are classified as level 3, considering the degree to which the inputs are observable in the relevant markets.
Derivative Instruments
- Derivative instruments mainly consist of derivative commodity instruments and derivative financial instruments.- Exchange-traded derivative commodity instruments measured using quoted market prices in an active market are
classified as level 1. Certain derivative commodity instruments measured using observable inputs of the quotedprices obtained from markets, financial information providers, and brokers, are classified as level 2. Also, thederivative commodity instruments measured using unobservable inputs are classified as level 3.
- Derivative financial instruments are mainly measured by discounted cash flow analysis using foreign exchangeand interest rates or quoted prices currently available for similar types of agreements and are classified as level 2.
Inventories
- Inventories acquired with the purpose of being sold in the near future and a profit from fluctuations in price aremeasured at fair value based on quoted prices with certain adjustment and classified as level 2. The amounts ofcosts to sell as of June 30, 2020 and March 31, 2020 were not material.
(2) Valuation process
The valuation process involved in level 3 measurements for each applicable asset and liability is governed by the model validation policy and related procedures pre-approved by appropriate personnel. Based on the policy and procedures, the personnel determine the valuation model to be utilized to measure each asset and liability at fair value. We engage independent external experts of valuation to assist in the valuation process for certain assets over a specific amount, and their results of valuations are reviewed by the responsible personnel of the Company. All of the valuations, including those performed by the external experts, are reviewed and approved by the responsible personnel of the Company.
- 31 -
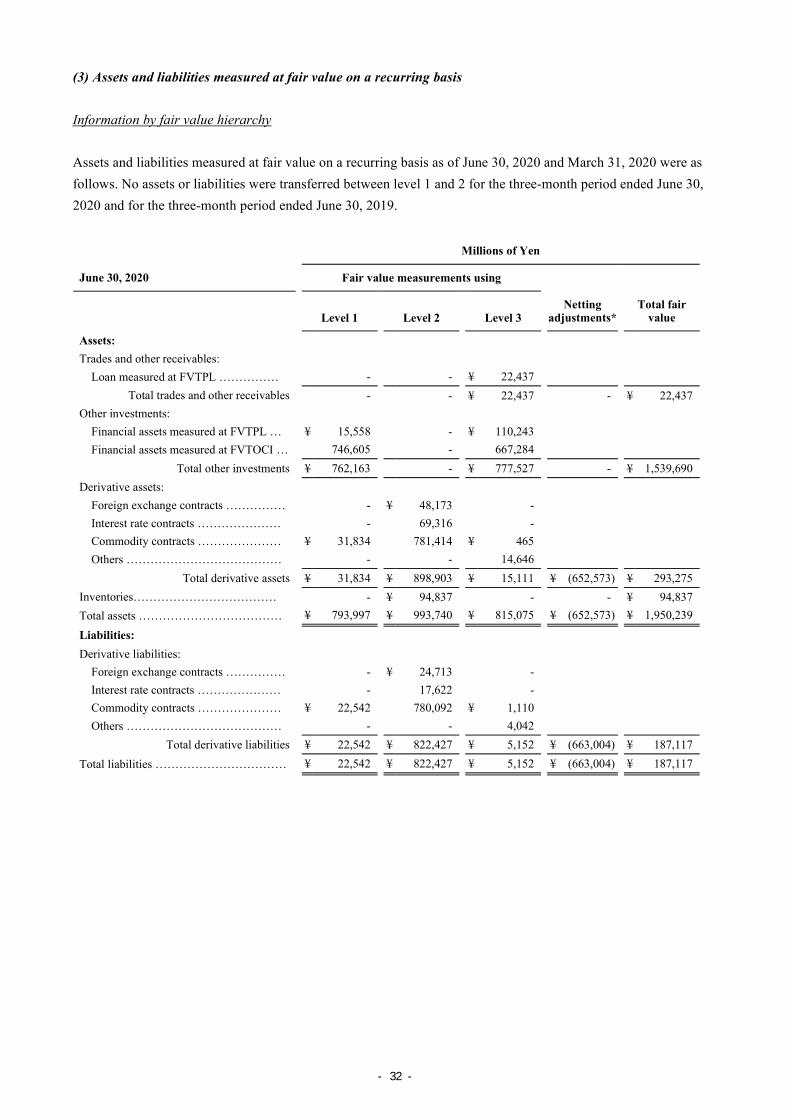
(3) Assets and liabilities measured at fair value on a recurring basis
Information by fair value hierarchy
Assets and liabilities measured at fair value on a recurring basis as of June 30, 2020 and March 31, 2020 were as follows. No assets or liabilities were transferred between level 1 and 2 for the three-month period ended June 30, 2020 and for the three-month period ended June 30, 2019.
Millions of Yen
June 30, 2020 Fair value measurements using
Level 1 Level 2 Level 3 Netting adjustments*
Total fair value
Assets: Trades and other receivables:
Loan measured at FVTPL …………… - - ¥ 22,437 Total trades and other receivables - - ¥ 22,437 - ¥ 22,437
Other investments: Financial assets measured at FVTPL … ¥ 15,558 - ¥ 110,243Financial assets measured at FVTOCI … 746,605 - 667,284
Total other investments ¥ 762,163 - ¥ 777,527 - ¥ 1,539,690Derivative assets:
Foreign exchange contracts …………… - ¥ 48,173 - Interest rate contracts ………………… - 69,316 - Commodity contracts ………………… ¥ 31,834 781,414 ¥ 465 Others ………………………………… - - 14,646
Total derivative assets ¥ 31,834 ¥ 898,903 ¥ 15,111 ¥ (652,573) ¥ 293,275 Inventories……………………………… - ¥ 94,837 - - ¥ 94,837 Total assets ……………………………… ¥ 793,997 ¥ 993,740 ¥ 815,075 ¥ (652,573) ¥ 1,950,239
Liabilities: Derivative liabilities:
Foreign exchange contracts …………… - ¥ 24,713 - Interest rate contracts ………………… - 17,622 - Commodity contracts ………………… ¥ 22,542 780,092 ¥ 1,110 Others ………………………………… - - 4,042
Total derivative liabilities ¥ 22,542 ¥ 822,427 ¥ 5,152 ¥ (663,004) ¥ 187,117 Total liabilities …………………………… ¥ 22,542 ¥ 822,427 ¥ 5,152 ¥ (663,004) ¥ 187,117
- 32 -

Millions of Yen
March 31, 2020 Fair value measurements using
Level 1 Level 2 Level 3 Netting adjustments*
Total fair value
Assets: Trades and other receivables:
Loan measured at FVTPL …………… - - ¥ 22,698 Total trades and other receivables - - ¥ 22,698 - ¥ 22,698
Other investments: Financial assets measured at FVTPL … ¥ 14,564 - ¥ 115,940Financial assets measured at FVTOCI … 645,455 - 671,358
Total other investments ¥ 660,019 - ¥ 787,298 - ¥ 1,447,317Derivative assets:
Foreign exchange contracts …………… - ¥ 72,829 - Interest rate contracts ………………… - 68,559 - Commodity contracts ………………… ¥ 46,845 1,461,687 ¥ 515 Others ………………………………… - - 13,901
Total derivative assets ¥ 46,845 ¥ 1,603,075 ¥ 14,416 ¥ (1,162,685) ¥ 501,651 Inventories ……………………………… - ¥ 105,482 - - ¥ 105,482Total assets ……………………………… ¥ 706,864 ¥ 1,708,557 ¥ 824,412 ¥ (1,162,685) ¥ 2,077,148
Liabilities: Derivative liabilities:
Foreign exchange contracts …………… - ¥ 37,517 - Interest rate contracts ………………… - 18,910 - Commodity contracts ………………… ¥ 38,445 1,430,142 ¥ 2,083 Others ………………………………… - - 8,422
Total derivative liabilities ¥ 38,445 ¥ 1,486,569 ¥ 10,505 ¥ (1,176,048) ¥ 359,471 Total liabilities …………………………… ¥ 38,445 ¥ 1,486,569 ¥ 10,505 ¥ (1,176,048) ¥ 359,471
*Amounts of netting adjustments include the net amount when, and only when, the companies currently have alegally enforceable right to set off the recognized amounts, and intend either to settle on a net basis or to realizethe asset and settle the liability simultaneously.
- 33 -

Reconciliation of assets measured at fair value on a recurring basis using significant unobservable inputs
(Level 3)
The balance at beginning of period of the loan measured at FVTPL was ¥22,698 million and the balance of period of it was ¥22,437 million for the three-month period ended June 30, 2020. The balance at beginning of period of the loan measured at FVTPL was ¥22,415 million and the balance of period of it was ¥21,769 million for the three-month period ended June 30, 2019. There was no material movement other than its exchange rate change during the three-month period ended June 30, 2020 and 2019.
The reconciliation of financial assets measured at FVTPL for the three-month period ended June 30, 2020 and 2019 were as follows:
Millions of Yen
Three-month period ended June 30, 2020
Three-month period ended June 30, 2019
Balance at beginning of period ................ ¥ 115,940 ¥ 111,504Gains (losses) ....................................... (4,531) 1,696Purchases .............................................. 5,020 5,226 Sales ..................................................... (6,112) (6,035) Transfers into Level 3 .......................... - - Transfers out of Level 3 ....................... - - Others (Note) ...................................... (74) (2,880)
Balance at end of period ........................... ¥ 110,243 ¥ 109,511Net change in unrealized gains (losses) still held at end of period
¥ (4,585) ¥ 1,547
Note: “Others” includes the effect of changes in foreign exchange rates (including in the foreign currency translation adjustments) and in scope of consolidation.
Gains (losses) related to financial assets measured at FVTPL (“FVTPL gains (losses)”) were included in “Revenue” and “Gain (loss) on securities and other investments-net”.
- 34 -

The reconciliation of financial assets measured at FVTOCI for the three-month period ended June 30, 2020 and 2019 were as follows:
Millions of Yen
Three-month period ended June 30, 2020
Three-month period ended June 30, 2019
Balance at beginning of period ................ ¥ 671,358 ¥ 762,857Other comprehensive income................ (10,761) 8,452Purchases .............................................. 2,374 4,050 Sales ..................................................... (1,834) (1,084) Transfers into Level 3 .......................... - - Transfers out of Level 3 (Note1) ........ - (2,175) Others (Note2) .................................... 6,147 (2,316)
Balance at end of period ........................... ¥ 667,284 ¥ 769,784
Note 1:“Transfers out of Level 3” is due to the transfer into Level 1 as the initial public offering of the shares. Note 2:“Others” includes the effect of changes in scope of consolidation.
Other comprehensive income related to financial assets measured at FVTOCI was included in “Financial assets measured at FVTOCI” and "Foreign currency translation adjustmnet" in Condensed Consolidated Statements of Comprehensive Income.
Quantitative information about level 3 fair value measurements
Information about valuation techniques and significant unobservable inputs used for level 3 assets measured at fair value on a recurring basis as of June 30, 2020 and March 31, 2020 were as follows:
June 30, 2020 Valuation Technique Principal
Unobservable Input Range
Financial assets measured at FVTOCI
Income approach Discount rate 6.3% ~ 17.5%
March 31, 2020 Valuation Technique Principal
Unobservable Input Range
Financial assets measured at FVTOCI
Income approach Discount rate 6.2% ~ 13.3%
In addition to the above, the price of crude oil is one of the significant unobservable inputs used in measuring the fair value of non-marketable equity securities related to LNG business. The Company forecasts that Brent Crude price will be in a range of US$30/bbl to US$80/bbl, considering the recent declined market price reflecting the impact of COVID-19 and the failure to reach agreement by OPEC Plus to cut oil production, and based on several third parties’ mid-long term forecasts.
Information about sensitivity to changes in significant unobservable inputs
For recurring fair value measurements of financial assets measured at FVTOCI using the income approach, increases (decreases) in discount rates would result in a lower (higher) fair value.
- 35 -

(4) Fair value of non-current financial assets and liabilities
The fair values of non-current receivables with floating rates, including long-term loans receivable, and long-term debt with floating rates approximately equal their respective carrying amounts. The fair values of non-current receivables with fixed rate and long-term debt with fixed rate are estimated by discount cash flow analysis, using interest rates currently available for similar types of loans, accounts receivable and borrowings with similar terms and remaining maturities. The fair values of financial instruments as of June 30, 2020 and March 31, 2020 were as follows. The fair values of current financial assets and current financial liabilities are not disclosed because the carrying amounts reasonably approximate their fair values.
Millions of Yen
June 30, 2020 March 31, 2020
Carrying amount
Fair value
Carrying amount
Fair value
Other investments measured at amortized cost
¥ 37,062 ¥ 37,701 ¥ 37,105 ¥ 37,553
Non-current receivables Trade and other receivables and Other financial assets (*) .……………………
580,311 580,331 608,433 608,433
Non-current liabilities Long-term debts, less current portion and Other financial liabilities (*) ……………
¥ 4,298,546 ¥ 4,357,684 ¥ 4,334,497 ¥ 4,399,197
(*)The fair values of Other financial assets and Other financial liabilities approximate their respective carrying amounts.
Trade and other receivables include loans receivable. Long-term debts include borrowings and bonds.
14. RECOVERABILITY OF DEFERRED TAX ASSETS IN MITSUI E&P MOZAMBIQUE AREA 1LIMITED ACCOUNTED FOR USING THE EQUITY METHOD
In the three-month period ended June 30, 2019, the Company, together with its business partners, made a final investment decision on the Mozambique LNG project through Mitsui E&P Mozambique Area 1 Limited, its joint venture in the Energy Segment which owns an interest in the LNG project. Due to this final investment decision, the joint venture recognized deferred tax assets mainly for the exploration expenses occurred in prior years, and gain of ¥13,158 million have been recognized in “Share of Profit (Loss) of Investments Accounted for Using the Equity Method” in Condensed Consolidated Statements of Income for the three-month period ended June 30, 2019.
15. THE FIRE INCIDENT OF INTERCONTINENTAL TERMINALS COMPANY LLC
On March 17, 2019 (US time) a fire began at the Deer Park tank terminal of Intercontinental Terminals Company LLC (“ITC”), a wholly owned U.S. subsidiary of Mitsui & Co., Ltd. The Deer Park tank terminal is located in the outskirts of Houston, Texas. The fire partially damaged tanks owned by ITC. ITC has resumed its operation after discussions with related authorities. Harris County Fire Marshal's Office released its final report with respect to the fire incident on December 6, 2019 (US time) and the report classified the fire as accidental, while not specifying the cause of the fire. The cause of the fire is still under investigation by other relevant authorities.
The profit and loss related to this incident recognized in the three-month period ended June 30, 2020 and 2019, and the outstanding balance of related provision as of June 30, 2020 are immaterial.
- 36 -

There are multiple lawsuits that have been brought against ITC in relation to this incident. These lawsuits are at the early stages and the ultimate outcome of these lawsuits is not expected to have significant impact on our consolidated financial position, operating results and cash flow.
16. SUBSEQUENT EVENTS
The Issuance of New Shares under the Remuneration System of Share Performance-Linked Restricted Stock
At a meeting held on July 10, 2020, the Board of Directors of the Company resolved to issue new shares under the remuneration system of share performance-linked restricted stock, and the payment of new shares have been completed on August 7, 2020. The details are as follows.
(1) Type and number of shares issued : Ordinary shares in Mitsui & Co., Ltd., 384,602 shares(2) Issue price : 1,585 yen per share
(3) Total value of issue : 609,594,170 yen
(4) Pay-in date : August 7, 2020
(5) Categories and numbers of persons eligible for allocations, numbers of shares allocated :Directors (excluding external director) 9 persons, 201,752 shares Managing Officers 28 persons, 182,850 shares
Introduction of Share-Based Compensation Plan for Employees At a meeting held on July 31, 2020, the Board of Directors of the Company resolved the introduction of a share-based compensation plan for employees (Stock grant trust for employees, the "Plan"). Objectives of the introduction of the Plan are that diverse employees continue to work for "Transformation and Growth" together with its management based on the Medium-term Management Plan 2023 announced in May 2020, and further strengthen our commitment to enhancing our corporate value over the medium-to-long term. Cash entrusted for the acquisition of the shares is ¥6,900 million. Trust period is planned from August 2020 to the end of August 2023.
17. AUTHORIZATION OF THE ISSUE OF CONDENSED CONSOLIDATED FINANCIAL STATEMENTS
The issue of Condensed Consolidated Financial Statements was authorized by Tatsuo Yasunaga, Representative Director, President and CEO, and Takakazu Uchida, Representative Director, Executive Vice President and CFO, on August 11, 2020.
- 37 -