quarto trim size: 174mm x 240mm - pdfs.semanticscholar.org
TRANSCRIPT

Inte
rnatio
nal Jo
urn
al of P
rod
uc
tivity and
Pe
rform
anc
e M
anag
em
en
tV
olu
me
67 N
um
be
r 7 20
18e
me
raldp
ub
lishin
g.c
om
www.emeraldinsight.com/loi/ijppm
Volume 67 Number 7 2018ISSN 1741-0401
Volume 67 Number 7 2018
International Journal of
Productivity and Performance Management
International Journal of
Productivity and Performance Management
The official journal of the World
Confederation of Productivity Science
Quarto trim size: 174mm x 240mm
Number 7
1089 Editorial advisory board
1090 Editorial
1091 Implementation of environmental management practices in the Ghanaian mining and manufacturing supply chainsSamuel Famiyeh and Amoako Kwarteng
1113 The relationship between management characteristics and firm innovationMahdi Salehi, Mahmoud Lari DashtBayaz and Samaneh Mohammadi Moghadam
1132 Improving public sector service delivery: a developing economy experienceEbenezer Adaku, Kwasi Amoako-Gyampah, Seth Nii Anang Lomotey, Charles Teye Amoatey and Samuel Famiyeh
1147 Impact of workplace bullying on employee outcomes: a study of Indian managerial employeesArpana Rai and Upasna Agarwal
1171 Forced distribution systems and attracting top talentStephanie J. Thomason, Amy Brownlee, Amy Beekman Harris and Hemant Rustogi
1192 USA Triathlon: a 2010–2015 case study of financial performance using effectiveness indicators and efficiencyPeter Omondi-Ochieng
1214 Performance measurement and management systems as IT artefacts: characterising, contextualising and valuing their effective use in SMEsMarie Marchand and Louis Raymond
1234 Experimenting lean dynamic performance management systems design in SMEsCarmine Bianchi, Graham Winch and Federico Cosenz

Certificate Number 1985ISO 14001
ISOQAR certified Management System,awarded to Emerald for adherence to Environmental standard ISO 14001:2004.
International Journal of Productivity and Performance Managementis indexed and abstracted in:ABI InformBusiness Source Alumni Edition/Complete/Complete:
Government Edition/Corporate/Corporate Plus/Elite/Main Edition/Premier
Cabell’s Directory of Publishing Opportunities in Management and Marketing
Education Research Complete/Education SourceEmerald Management ReviewsErgonomics AbstractsINSPECProQuestPsycINFOSafetyLitTechnicalEducation and Training AbstractsTOC Premier (EBSCO)
International Journal of Productivity and Performance Management addresses new tools, developments and reflective analyses related to approaches designed to improve individual, group and organisational performance in and across all forms of organisations.
Emerald Publishing LimitedHoward House, Wagon Lane, Bingley BD16 1WA, United KingdomTel +44 (0) 1274 777700; Fax +44 (0) 1274 785201E-mail [email protected] more information about Emerald’s regional offices please go to http://www.emeraldgrouppublishing.com/officesCustomer helpdesk :Tel +44 (0) 1274 785278; Fax +44 (0) 1274 785201E-mail [email protected], subscription and missing claims enquiries:E-mail [email protected] +44 (0) 1274 777700; Fax +44 (0) 1274 785201
Missing issue claims will be fulfilled if claimed within six months of date of despatch. Maximum of one claim per issue.Hard copy print backsets, back volumes and back issues of volumes prior to the current and previous year can be ordered from Periodical Service Company. Tel +1 518 537 4700; E-mail [email protected] For further information go to www.periodicals.com/emerald.html
Reprints and permissions serviceFor reprint and permission options please see the abstract page of the specific article in question on the Emerald web site (www.emeraldinsight.com), and then click on the “Reprints and permissions” link. Or contact:E-mail [email protected] Publisher and Editors cannot be held responsible for errors or any consequences arising from the use of information contained in this journal; the views and opinions expressed do not necessarily reflect those of the Publisher and Editors, neither does the publication of advertisements constitute any endorsement by the Publisher and Editors of the products advertised.
No part of this journal may be reproduced, stored in a retrieval system, transmitted in any form or by any means electronic, mechanical, photocopying, recording or otherwise without either the prior written permission of the publisher or a licence permitting restricted copying issued in the UK by The Copyright Licensing Agency and in the USA by The Copyright Clearance Center. Any opinions expressed in the articles are those of the authors. Whilst Emerald makes every effort to ensure the quality and accuracy of its content, Emerald makes no representation implied or otherwise, as to the articles’ suitability and application and disclaims any warranties, express or implied, to their use.
Emerald is a trading name of Emerald Publishing LimitedPrinted by CPI Group (UK) Ltd, Croydon, CR0 4YY
CO-EDITORSDr Luisa Huaccho HuatucoSenior Lecturer in Operations Management, University of York, UKE-mail [email protected] Nicky ShawSenior Lecturer in Operations Management, Leeds University Business School, UKE-mail [email protected]
EDITORIAL ASSISTANTJennifer WebsterE-mail [email protected]
REGIONAL EDITOR – EUROPEDr Cláudia S Sarrico Technical University of Lisbon, Portugal
ISSN 1741-0401© 2018 Emerald Publishing Limited
Quarto trim size: 174mm x 240mm
Guidelines for authors can be found at:www.emeraldgrouppublishing.com/ijppm.htm

EDITORIAL ADVISORY BOARD
Dr Rabiul AhasanUniversity of Oulu, Finland
Professor Jiju AntonyHeriot-Watt University, UK
Umit Sezer BititciHeriot Watt University, UK
Dr Thomas F. BurgessLeeds University Business School, UK
Dr Yu-wang ChenThe University of Manchester, UK
Dr Andre A. de WaalMaastricht School of Management,The Netherlands
Dr Jacky HollowayNorthampton Business School, UK
Dr Kepa MendibilUniversity of Strathclyde, UK
Professor Low Sui PhengNational University of Singapore, Singapore
Professor Zoe RadnorLeicester University, UK
Dr Nick RichSwansea University, UK
Associate Professor Sanjay Kumar SinghAbu Dhabi University, United Arab Emirates
Professor Amrik SohalMonash University, Australia
Professor Karen SpensHanken School of Economics, Finland
Professor Eileen van AkenVirginia Tech, USA
Professor Li ZhengTsinghua University, People’s Republic ofChina
International Journal ofProductivity and Performance
ManagementVol. 67 No. 7, 2018
p. 1089r Emerald Publishing Limited
1741-0401
1089
Editorialadvisory
board
Quarto trim size: 174mm x 240mm

Editorial
Welcome to the seventh issue of IJPPM this year. We have eight thought-provoking anddiverse papers in this issue ranging with studies in Ghana, Iran, India, the USA, Canada andItaly, using a broad variety of methods.
Famiyeh and Kwarteng provide insights into the implementation of environmentalmanagement practices (EMP) in Ghana. They used a survey questionnaire collected from219 managers either in manufacturing or extracting industries. Employing factor analysis, thefindings supported that regulative andmimetic institutional pressure have a significant influenceon EMP whereas normative institutional pressure did not have a significant influence.
Salehi, Lari Dashtbayaz and Mohammadi study the relationship between managementcharacteristics and firm innovation in Tehran Stock Exchange-listed companies. Using datafrom 125 companies, descriptive-correlational design and panel data regression models wereapplied. They found that managerial entrenchment has a negative effect on innovation,whereas managerial ability could foster innovation; surprisingly neither agency cost noroverconfidence has a significant effect.
Adaku, Amoako-Gyampah, Kwasi, Lomotey, Amoatey and Famiyeh provide anotherstudy in Ghana, this time with the Pension Trust Company. They used extensive data (oldsystem: 14,400 claims and new system: 41,600 claims) in two types of programmes andcompared them statistically. They found that the new system has reduced processing timeby 20 per cent. This is quite an improvement.
Rai and Agarwal investigate the topic of workplace bullying and its influence oninnovative work behaviour. Using data from 835 managerial employees in India, they foundthat workplace bullying is negatively related to workplace innovation and positively relatedto neglect. Based on their findings, they provide useful recommendations to managers.
Sticking with the workplace, Thomason, Brownlee, Beekman and Rustogi studiedindividuals’ attraction to different performance appraisal types using a five-factor model ofpersonality types and applying a forced distribution ranking system (FDRS). Theysurveyed 148 students on graduate-level business courses in the USA. Their findingssuggest that FDRS are attractive to those with high levels of psychological entitlement andlow levels of conscientiousness, which contrasts with the existing research.
Ochieng presents a case study of financial performance in the non-profit context ofUS Triathlon. He shows that financial performance is related to both financialeffectiveness and financial efficiency; this is particularly important in contexts wherefinancial resources are unreliable.
Marchand and Raymond’s article studies performance measurement and managementsystems as IT artefacts using the Burton-Jones and Grange’s (2013) theoretical framework.Their work is applied to 16 SMEs in Canada and findings indicate that transparentinteraction enables representational fidelity, which in turn enables informed action. Thiscontributes to both the performance management and IS literatures.
Finally, our reflective practice article by Bianchi, Winch and Consenz presents worksupporting entrepreneurial capabilities by incorporating individual attributes into organisationroutines associated with lean dynamic performance management systems in small and microenterprises in Italy. Their approach contrasts four organisation types: artisan, new companystart-up, established firm and micro-giant company, and utilises system dynamics modelling.
As you can see, again another varied and interesting content to our seventh issue.We hope you enjoy!
Nicky E. Shaw and Luisa Delfa Huaccho Huatuco
International Journal ofProductivity and PerformanceManagementVol. 67 No. 7, 2018pp. 1090-1090© Emerald Publishing Limited1741-0401DOI 10.1108/IJPPM-07-2018-0258
1090
IJPPM67,7
Quarto trim size: 174mm x 240mm

Implementation of environmentalmanagement practices in the
Ghanaian mining andmanufacturing supply chains
Samuel Famiyeh and Amoako KwartengGhana Institute of Management and Public Administration, Accra, Ghana
AbstractPurpose – The purpose of this paper is to understand the driving forces of environmental managementpractices in mining and manufacturing firms using data from Ghana.Design/methodology/approach – Prior exploratory factor analysis and structural equation modeling,based on questionnaire survey data, were used to study the driving forces of environmental managementpractices in the extractive and manufacturing firms using institutional theory.Findings – Environmental management practices by organizations in Ghana are driven by regulatory andthe mimetic pressures. Normative pressure has no significant effect on environmental management practices.The authors found no difference between the extractive and the manufacturing sectors as far as the resultsare concerned.Research limitations/implications – The results indicate the importance of regulatory bodies indeveloping good environmental policies that are implemented and monitored in order to achieve improvedenvironmental performance. Effective implementation of environmental policies is likely to motivate other firmsto mimic the actions of implementing organizations. One limitation of this work is the use of data from Ghana. Itis important for other researchers to assess these relationships using data from a wider geographical area.Practical implications – The results indicate that organizations implement environmental managementpractices as a result of coercive and mimetic pressures. In practice, it is therefore important for the regulatorybodies, such as the Environmental Protection Agency Ghana, to be very innovative in developing goodenvironmental regulations that are monitored to ensure implementation by all polluting sources. This isbecause the results indicate that the monitoring of regulations by regulatory bodies seems to be connected tothe implementation of these regulations. Such implementation is also expected to be benchmarked by otherfirms, thereby influencing the “greening” agenda in Africa.Originality/value – The study illustrates and provides some insights, and builds on the literature in thearea of green supply chain strategies for a developing country’s environment. This is one of the few studiesthat investigate the driving forces of environmental management implementation using the institutionaltheory based on data from the African business environment.Keywords Ghana, Productivity, Environmental, Coercive, Mimetic, NormativePaper type Research paper
1. IntroductionPoorly regulated manufacturing and industrial activities have resulted in seriousenvironmental problems such as global warming, ozone layer depletion, increasing wasteand pollution levels all over the world (Shukla et al., 2009; King and Lenox, 2001). Despite therapidly increasing research on companies’ environmental strategies and environmentalmanagement practices, the motivation for proactive implementation still remains unclear(Delmas and Toffel, 2004). It has been established that green practices have a positive impacton sustainability for all stakeholders (Balasubramanian and Shukla, 2017). Past researchersfocusing on investigating why organizations have implemented environmental managementpractices have concluded these initiatives are either due to pressures from regulation andcompetition (Christmann, 2000; Dean and Brown, 1995; Delmas, 2003) or sometimes thesepressures arise from non-governmental organizations (Lawrence and Morell, 1995). In thisstudy, institutional theory is used as a framework to show that governments, regulators,workers, professional associations, customers and competitors impose coercive, normative
International Journal ofProductivity and Performance
ManagementVol. 67 No. 7, 2018
pp. 1091-1112© Emerald Publishing Limited
1741-0401DOI 10.1108/IJPPM-04-2017-0095
Received 19 April 2017Revised 2 July 2017
7 August 201717 August 2017
Accepted 26 August 2017
The current issue and full text archive of this journal is available on Emerald Insight at:www.emeraldinsight.com/1741-0401.htm
1091
Environmentalmanagement
practices
Quarto trim size: 174mm x 240mm

and mimetic pressures on organizations to implement environmental management initiatives(Carroll and Delacroix, 1982), using data from Ghana.
Apart from the numerous legal regulations that establish environmental practices suchas the environmental assessment regulations, 1999, L.I.1652 (EPA Ghana, 1999); firms facepressures from different stakeholders regarding the implementation of environmentalmanagement practices, including downstream customers who prefer to buy eco-friendlyproducts (Hu and Hsu, 2010; Shukla et al., 2009). The 1999 environmental assessmentregulations 24 (1) set out by the Environmental Protection Agency (EPA) Ghana clearlystate that all organizations operating in Ghana who have their preliminary environmentalreports of environmental impact statement approved shall submit to the Agency anEnvironmental Management Plan (EMP) in respect of their operations within 18 months ofbeginning operations and thereafter every three years (EPA Ghana, 1999). The question is,apart from such formal command and control policies set up and monitored forimplementation by firms in Ghana that drive the implementation of environmentalmanagement systems, what other forces drive the implementation of environmentalmanagement practices by firms in Ghana? The purpose of this study is to answer thispressing question using data from the Ghanaian business environment.
There have been some works related to environmental management such as Tuttle andHeap (2007), Prado-Lorenzo and García-Sánchez (2010), Björklund and Forslund (2013)and Wang and Sarkis (2013) on the integration of environmental and economic issues. Tuttleand Heap (2007) provided some evidence concerning the emerging consensus, onthe importance to integrate environmental issues with economic and business issues todrive improvements in productivity and environmental impacts. Their results indicate thisintegration is very effective when environmental issues are planned as part of a total review ofthe life-cycle of products and their manufacturing and delivery processes. Prado-Lorenzo andGarcía-Sánchez (2010) investigated the effect of operation size, environmental conditions andmanagement on municipal sewerage services using data from sewerage services in somemunicipalities in Spain. The results indicated that operation size and environmentalconditions have a significant impact on efficiency, however, the management type, public orprivate, does not impact the degree of efficiency. A related work by Björklund and Forslund(2013) investigated the purposes of having environmental performance management systems(EPMS) in logistics management and how these performance measures can influence the focusof the supply chain using data from Swedish firms. They found target setting as the mostcommon purpose of implementing EPMS into logistics management. Wang and Sarkis (2013),using data from the USA, investigated whether companies’ environmental and social supplychain activities impact on financial performance. In their findings, they indicated thatintegrated sustainable supply chain management, i.e., including social and environmentalsupply chain management efforts, is positively associated with corporate financialperformance measured by return on assets and return on equity.
According to To and Tang (2014), the motivations and perceived benefits of theimplementation of ISO 14001 by organizations were studied in Macao SAR and theyidentified the main factors driving the implementation of EMS were the promotion ofenvironmental awareness among internal employees, regulatory compliance and thereduction of waste from operations. The above examples indicate some of the research workon the issue under investigation; however, most of the research findings are based on datafrom the developed world and that of Asia. This clearly indicates the need for researchinvestigating the driving forces of environmental management practices in organizationsfrom the developing economies especially, the Sub-Saharan Africa given the pressingenvironmental issues there.
The literature presents some research in the area of environmental management inSub-Saharan Africa. These include environmental literacy by Owusu et al. (2017),
1092
IJPPM67,7
small-scale mining and environmental management by Aryee et al. (2003) and extent ofstakeholder influence on environmental performance by Mensah (2014). Mensah (2014)examined the extent to which primary and secondary stakeholders influence theenvironmental performance of hotels in the Accra Metropolis of Ghana, and found thatprimary stakeholders such as customers and board of directors have significant influenceon the environmental performance of hotels while size of hotel moderates the effect ofstakeholders on the environmental performance of hotels. Our study is similar; however,different from that of Mensah (2014) in that the main theory underlying his work wasstakeholder theory and his emphasis was specific to the hotel sector. The current studyexamines the drivers of environmental management implementation using institutionaltheory as well as data from more than one industrial sector. Industries in less developedeconomies face difficult challenges because of the lack of technology, human resources,expertise, strong institutions and competition. Thus, studies that contribute to theknowledge drivers of environmental management practices of organizations in such hostileenvironments should interest researchers. The contribution of this study to the literature isvery important in that, we, first, examine the applicability of our proposed model of driversof environmental management in a less developed Sub-Saharan African country.In addition, we contribute to fostering the development of a growing body of greensupply chain management knowledge in developing countries.
The rest of the paper is structured into five main parts. First, we present the literaturereview and the research hypothesis, together with the conceptual model. This is followed bythe research method and the data collection procedures. We then present the data analysisand the main findings. We finally present the discussion, conclusions, limitations and areasfor future research in the last section.
2. Theoretical background and research hypotheses2.1 Institutional theoryInstitutional theory suggests that organizations are social systems, and is often used as atheoretical framework to explain why organizations adopt practices, policies and procedures(DiMaggio and Powell, 1983; Meyer and Rowan, 1977 cited in Scott, 2001). Institutional theorydescribes how organizations should behave (Hatch, 1997; Powell and DiMaggio, 1991; Scott,1995) and the actions to be taken in response to environmental pressures (Grewal andDharwadkar, 2002; Hoffman, 1997; Scott, 2001) that are beyond their control (Hoffman, 1977).
The theory suggests that an organization’s choices and actions are influenced by socialbehaviors, norms and values within the environment in which they operate (Selznick, 1957).This means that organizations are constrained by their environment and sometimes have toadopt and adhere to rules and practices created because of environmental pressure, whichmay not be the organization’s original intent. Meyer and Rowan (1977) stressed that to gainlegitimacy and enhance their survival; organizations have to conform to institutionalpressures within their operating environment. It is important therefore for organizations torespond to pressures from the environment, not only for the sake of resources andcustomers but also for political power and institutional legitimacy in order to achieve social,as well as economic, rewards (Carroll and Delacroix, 1982). Institutional isomorphism,according to DiMaggio and Powell (1983), occurs through three main mechanisms, namely,coercive pressure, normative pressure and mimetic pressures. We have therefore used thesethree mechanisms as our main constructs that underlie our investigation.
2.2 Literature review and the development of hypotheses2.2.1 Coercive pressures and firm’s environmental management practices. Scott (1987)claimed that organizational behavior is influenced by two primary mechanisms: imposition
1093
Environmentalmanagement
practices

and inducement. The imposition mechanism is enacted through regulatory institutionswhile inducement mechanism works through other organizations that constrain theorganization and direct its behavior (Oliver, 1991). Organizations, for instance, are forced tocomply with laws enacted by regulatory institutions by making the necessary changes intheir structure and processes in order to avoid the potential costs, uncertainty and legalliabilities for noncompliance (Clemens and Douglas, 2006; DiMaggio and Powell, 1983).
In the coercive view of institutional theory, the emphasis is placed on the conformity tolay down rules and rewards for good behavior as well as punishment for non-conformance(DiMaggio and Powell, 1983). Thus, coercive pressures may be considered as a force, apersuasion for firms to take certain actions which they did not intend to, due to pressuresarising from government regulations or laws (DiMaggio and Powell, 1983); customers(Teo et al., 2003). Grewal and Dharwadkar (2002) claimed that firms are often forced intoadopting practices or actions to avoid punishment; and sanctions (Scott, 1995).
One of the key stakeholders that influence the adoption of environmental managementpractices is governmental institutions. In Ghana, such government bodies in charge ofenvironmental issues are the EPA; the ministry responsible for environment, science andtechnology; Minerals Commission; Forestry Commission; etc. These bodies are basicallyinvolved in regulating environmental issues by setting up the rules and regulations for andto monitor all polluting sources. These regulatory agencies are therefore responsible forpromulgating and enforcing these regulations, a form of coercive power. Many countries,especially in Europe, have strict environmental regulations that prohibit hazardousproducts and promote recycling and products take-back (Tibben-Lembke, 2002; Fergusonand Browne, 2001).
Researchers have established the enforcement of legislation and regulations as amotivating factor for firms’ implementation of environmental practices (Carraro et al., 1996;Delmas, 2002; Majumdar and Marcus, 2001; Rugman and Verbeke, 1998). Delmas (2002)indicated one of the key players for companies to adopt ISO 14001, is the government. In asurvey by Delmas in 2000 among European and US firms, a substantial number ofmanagers indicated they adopt measures such as ISO 14001 in their operations in their questto satisfy regulatory compliance. To and Tang (2014), in a study in Macao SAR, identifiedthe top driving forces for the adoption of environmental management practices were theencouragement of environmental issues among workers, the effective management ofoperations in order to stay in compliance and reduction of waste in operations.
Heras-Saizarbitoria et al. (2011) conducted an extensive study of the driving forces andthe benefits of implementing ISO 14001 by surveying 214 Spanish companies. They foundthat the most highly rated benefit was compliance with environmental laws and regulations,followed by environmental effectiveness improvement, less environmental problems andimproving customer satisfaction. Williamson et al. (2006) used empirical research into theenvironmental practices of 31 manufacturing small- and medium-sized enterprises (SMEs)and found that “business performance” and “regulation” considerations drive theenvironmental behavior of the enterprises.
Jennings and Zandbergen (1995) were among the first researchers who applied theinstitutional theory to explain the adoption of environmental management practices in theorganization, and indicated coercive forces, prescribed in the form of regulations andregulatory enforcement, have been the main driving forces of environmental management.Based on data from the wine industry in New Zealand, Dodds et al. (2013) found that thestrong drivers for environmental sustainability initiatives are organizations concern aboutthe state of the environment and social responsibility, followed by requirements forexporting and protection of agricultural land. Zailani et al. (2012) using data from 132 EMS-ISO-14001 – certified manufacturing firms in Malaysia, found a strong relationship between
1094
IJPPM67,7
environmental regulations and incentive as a driver of eco-design initiatives inorganizations surveyed. These regulations and incentives also seem to driveenvironmental performance of the firms. In a study by Tate et al. (2011), concerning thedriving forces of supplier adoption of environmental practices in the USA based oninstitutional theory analysis, they identified supplier adoption of environmental practices ismore likely in the presence of coercive, normative and mimetic pressures. Cordano (1993) isof the view that the increasing levels of penalties, fines and legal costs have driven theimportance for companies to comply with environmental regulations. Lampe et al. (1991)also indicate the need for firms to stay ahead of environmental regulations in order to avoidvery expensive capital refits.
Building on regulatory or coercive pressure from institutional theory, the followinghypothesis is proposed:
H1. Regulatory or coercive institutional pressure will influence the implementation ofenvironmental management practices by firms in Ghana.
2.2.2 Normative pressures and firm’s environmental management practices. Normativepressure refers to pressure that stems from professionalization, which has to do with thecollective efforts by individuals of similar occupation to describe the ways and processes oftheir work and also establish a legitimate cognitive base for their occupational autonomy(Cheng and Yu, 2008; DiMaggio and Powell, 1983; Larson, 1991). A study conducted byKollman and Prakash (2002) in two countries in Europe and the USA indicated why countrieshave different rates of EMS certification. They found out that the decision on whether to go forcertification and the kind of standard, either ISO 14001 or EMAS, was basically influenced bythe pressures from stakeholders in the various industry associations, in addition to regionalchamber of commerce, suppliers and regulators. In a survey of 63 Brazilian companies fromthe chemical, mechanical and electronic industries, Gavronski et al. (2008) identified foursources driving the implementation of environmental management practices: reaction topressures from the external stakeholders; proactive in expectation of future business concerns;legal concerns; and internal influences. Heide and John (1992) argued that when personnelwithin an organization aim to achieve the results of the same expectations, these expectationswill become shared norms, which in turn influence organization attitudes toward themaintenance of relationship networks, and curtail behaviors that promote individual goals.Firms are pressured to conform to the shared norms and assure personnel in the field of itscommitment to maintain procedural legitimacy (Zsidisin et al., 2005). In a survey of 209manufacturers of Pearl River Delta in China, by Ye et al. (2013), the results indicated thatinstitutional pressures including government pressure, customer pressure and competitorpressure have a statistically significant positive influence on top managers’ posture towardreverse logistics implementation. Using data from the hotel sector in Ghana, Mensah (2014)indicated that customers, as well as the board of directors, had a more significant influence onthe environmental performance of hotels. However, this relationship seems to be moderatedby the size of the hotel. Zailani et al. (2012), based on data from firms in Malaysia, indicated astrong relationship between customer pressures and design of ecologically friendly products.
Competitive pressures sometimes force firms to implement environmental programs(e.g. environmentally friendly programs, green products and environmental marketingprograms) without studying the impacts it would have on the firm ( Jennings andZandbergen, 1995). Building on the normative pressure from the institutional theoryperspectives, the following hypothesis is proposed:
H2. Normative institutional pressure will influence the implementation of environmentalmanagement practices by firms in Ghana.
1095
Environmentalmanagement
practices
2.2.3 Mimetic pressures and firm’s environmental management practices. In addition tocoercive and normative pressures, firms may also be under pressure to mimic practices thatsuccessful leading firms have adopted. Moreover, in an effort to establish qualitymanagement standards, firms are forced to respond to customer requirements andmaintain customer–supplier relationships (Anderson et al., 1999). According to DiMaggioand Powell (1983), a mimetic process occurs when an organization models itself on otherthriving organizations within an uncertain environment. Organizations tend to modelthemselves after other organizations they believe are well managed and able to survive in acompetitive environment.
Corporate managers, for fear of regulations and customer dissatisfaction, are more likelynot to take actions that are detrimental to the reputation of the company, especially whenmarkets become more competitive, and the issue of customer satisfaction becomes relativelymore important (Bansal and Clelland, 2004; Singhapakdi et al., 2001). This is normally verysuitable when consumers place a premium on environmentally friendly products. In suchsituations, it is imperative for competing firms to mimic or benchmark themselves byimplementing environmental or green management practices in order to stay in thecompetition. In developing a new theoretical proposition regarding how suppliers who arenot early adopters are influenced to adopt environmental practices, Tate et al. (2011)concluded that supplier adoption of environmental practices is more likely if coercive,normative and mimetic institutional forces are in play. In a work focusing on theinstitutional perspective on the adoption of green information systems and technology,Chen et al. (2011) concluded that the mimetic and coercive pressures significantly drivegreen information system and technology adoption. They indicated, in particular, outcome-based imitation and imposition-based coercion represent major institutional processes.According to Chu et al. (2017), mimetic pressures drawn from the concept of institutionalpressure have a positive significant impact on the performance of top managers, this impacttends to significantly affect the practices of green supply chain management and firmperformance. Firms turn to follow the footsteps of successful competitors; this statementwas found to be true by Yang (2016) who in his research found that firms mimic theenvironmental practices that successful leading firms have adopted in order to enhancetheir corporate image. Building on mimetic pressure from institutional theory, the followinghypothesis is proposed:
H3. Mimetic institutional pressure will influence the implementation of environmentalmanagement practices by firms in Ghana.
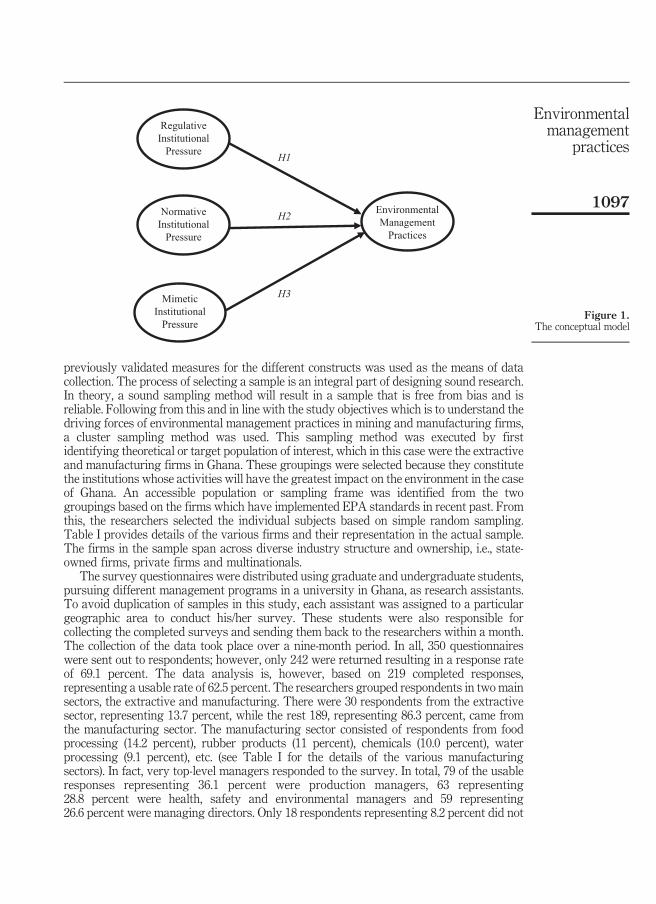
Figure 1 summarizes the hypotheses of this study in a conceptual model. The hypothesizedrelationships between the constructs are all indicated as positive (+).
3. Material and methods3.1 Data collection and samplingIn this study, we targeted the use of respondents involved in decision making at the top ofthe organization and also in decisions making related to the environment. Theserespondents are referred to as key informants because they normally report on relationshipsbetween their organizations and other organizations and are not reporting on their personalfeelings or behavior (Van Weele and van Raaij, 2014). Miles and Arnold (1991) applaud theuse of informants in the collection of research data, as they are of the view that informantssuch as top managers, managing directors, production managers were always willing andable to provide insight into their own underlying business orientations through a writtenself-administered survey instrument. These respondents were therefore responding onbehalf of their organizations and not their personal emotions. A questionnaire made up of
1096
IJPPM67,7
previously validated measures for the different constructs was used as the means of datacollection. The process of selecting a sample is an integral part of designing sound research.In theory, a sound sampling method will result in a sample that is free from bias and isreliable. Following from this and in line with the study objectives which is to understand thedriving forces of environmental management practices in mining and manufacturing firms,a cluster sampling method was used. This sampling method was executed by firstidentifying theoretical or target population of interest, which in this case were the extractiveand manufacturing firms in Ghana. These groupings were selected because they constitutethe institutions whose activities will have the greatest impact on the environment in the caseof Ghana. An accessible population or sampling frame was identified from the twogroupings based on the firms which have implemented EPA standards in recent past. Fromthis, the researchers selected the individual subjects based on simple random sampling.Table I provides details of the various firms and their representation in the actual sample.The firms in the sample span across diverse industry structure and ownership, i.e., state-owned firms, private firms and multinationals.
The survey questionnaires were distributed using graduate and undergraduate students,pursuing different management programs in a university in Ghana, as research assistants.To avoid duplication of samples in this study, each assistant was assigned to a particulargeographic area to conduct his/her survey. These students were also responsible forcollecting the completed surveys and sending them back to the researchers within a month.The collection of the data took place over a nine-month period. In all, 350 questionnaireswere sent out to respondents; however, only 242 were returned resulting in a response rateof 69.1 percent. The data analysis is, however, based on 219 completed responses,representing a usable rate of 62.5 percent. The researchers grouped respondents in two mainsectors, the extractive and manufacturing. There were 30 respondents from the extractivesector, representing 13.7 percent, while the rest 189, representing 86.3 percent, came fromthe manufacturing sector. The manufacturing sector consisted of respondents from foodprocessing (14.2 percent), rubber products (11 percent), chemicals (10.0 percent), waterprocessing (9.1 percent), etc. (see Table I for the details of the various manufacturingsectors). In fact, very top-level managers responded to the survey. In total, 79 of the usableresponses representing 36.1 percent were production managers, 63 representing28.8 percent were health, safety and environmental managers and 59 representing26.6 percent were managing directors. Only 18 respondents representing 8.2 percent did not
H1
H2
H3
RegulativeInstitutional
Pressure
NormativeInstitutional
Pressure
MimeticInstitutional
Pressure
EnvironmentalManagement
Practices
Figure 1.The conceptual model
1097
Environmentalmanagement
practices
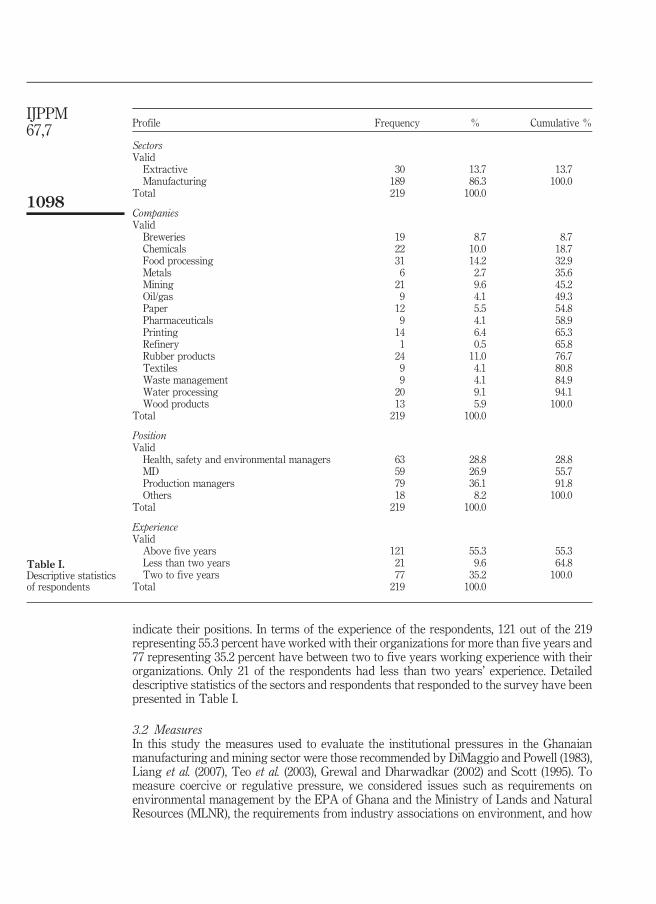
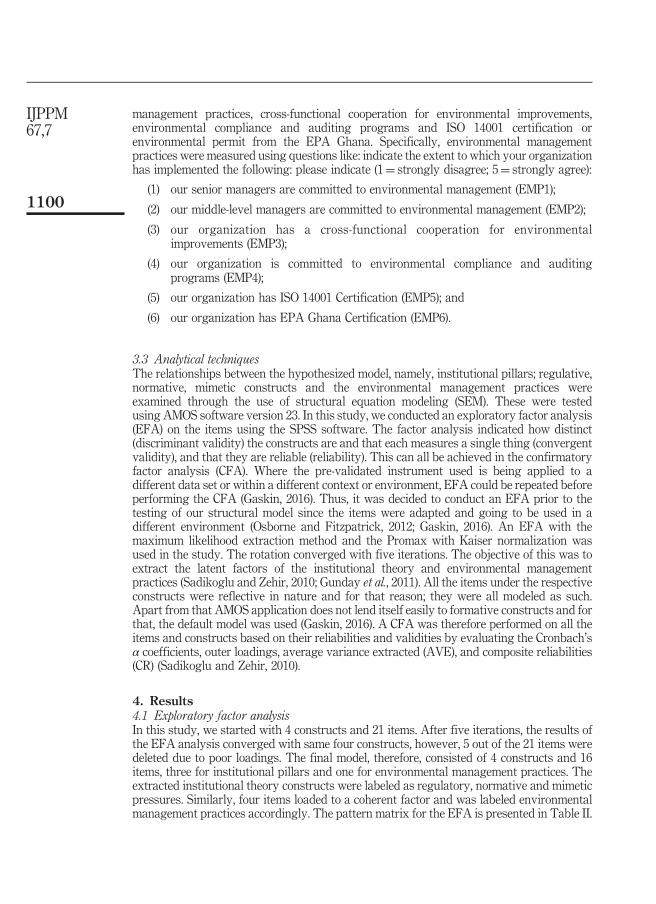
indicate their positions. In terms of the experience of the respondents, 121 out of the 219representing 55.3 percent have worked with their organizations for more than five years and77 representing 35.2 percent have between two to five years working experience with theirorganizations. Only 21 of the respondents had less than two years’ experience. Detaileddescriptive statistics of the sectors and respondents that responded to the survey have beenpresented in Table I.
3.2 MeasuresIn this study the measures used to evaluate the institutional pressures in the Ghanaianmanufacturing and mining sector were those recommended by DiMaggio and Powell (1983),Liang et al. (2007), Teo et al. (2003), Grewal and Dharwadkar (2002) and Scott (1995). Tomeasure coercive or regulative pressure, we considered issues such as requirements onenvironmental management by the EPA of Ghana and the Ministry of Lands and NaturalResources (MLNR), the requirements from industry associations on environment, and how
Profile Frequency % Cumulative %
SectorsValidExtractive 30 13.7 13.7Manufacturing 189 86.3 100.0
Total 219 100.0
CompaniesValidBreweries 19 8.7 8.7Chemicals 22 10.0 18.7Food processing 31 14.2 32.9Metals 6 2.7 35.6Mining 21 9.6 45.2Oil/gas 9 4.1 49.3Paper 12 5.5 54.8Pharmaceuticals 9 4.1 58.9Printing 14 6.4 65.3Refinery 1 0.5 65.8Rubber products 24 11.0 76.7Textiles 9 4.1 80.8Waste management 9 4.1 84.9Water processing 20 9.1 94.1Wood products 13 5.9 100.0
Total 219 100.0
PositionValidHealth, safety and environmental managers 63 28.8 28.8MD 59 26.9 55.7Production managers 79 36.1 91.8Others 18 8.2 100.0
Total 219 100.0
ExperienceValidAbove five years 121 55.3 55.3Less than two years 21 9.6 64.8Two to five years 77 35.2 100.0
Total 219 100.0
Table I.Descriptive statisticsof respondents
1098
IJPPM67,7

the competitive environment requires organizations to initiate environmental managementpractices in order to be competitive as recommended by DiMaggio and Powell (1983), Lianget al. (2007) and Teo et al. (2003). Specifically, regulative pressures were measured usingquestions like our company adopts environmental management practices for the reasonsthat: please indicate (1¼ strongly disagree; 5¼ strongly agree):
(1) the EPA of Ghana requires our firm to plan and implement environmentalmanagement practices (REG1);
(2) the industry associations in Ghana requires our firm to plan and implementenvironmental management practices (REG2);
(3) the MLNR requires our firm to plan and implement environmental managementpractices (REG3);
(4) the competitive conditions of our firm require our firm to plan and implementenvironmental management practices (REG4); and
(5) the international environmental regulation requires that our firm plan andimplement environmental management practices (REG5).
To measure the normative pressure, we considered issues like the extent of environmentalmanagement practices adopted by suppliers, customers and the extent to which governmentpromotion of environmental management practices influences the adoption of environmentalmanagement practices. This scale is largely consistent with the dimensions recommended byTeo et al. (2003) and Liang et al. (2007). Specifically, normative pressures were measured usingquestions like: our company adopts environmental management practices due to: pleaseindicate (1¼ strongly disagree; 5¼ strongly agree):
(1) the extent of environmental management practices adopted by suppliers (NORM1);
(2) the extent of environmental management practices adopted by customers (NORM2);
(3) the extent to which the government of Ghana promotes environmental managementpractices (NORM3); and
(4) the extent to which the global community promotes environmental managementpractices (NORM4).
Following Teo et al. (2003), the mimetic pressure construct was measured in terms of theperceived extent to which competitors have benefited from the implementation ofenvironmental management practices. This construct was measured by asking respondentsto assess themselves based on how they think competitors in the industry have benefitedfrom the adoption of environmental management practices. Respondents were also to assesshow their competitors are perceived as favorites in the same industry by suppliers andcustomers due to their adoption of environmental management practices (Liang et al., 2007;Teo et al., 2003). Specifically, mimetic pressures were measured using questions like: ourcompetitors who planned and implemented comprehensive environmental managementpractices; please indicate (1¼ strongly disagree; 5¼ strongly agree):
(1) have benefited (MIME1);
(2) are favorably perceived by others in the same industry (MIME2);
(3) are favorable perceived by their suppliers in the same industry (MIME3); and
(4) are favorably perceived by their customers in the same industry (MIME4).
Environmental management practices were measured according to Zhu et al. (2008). Thiswas with reference to senior- and middle-level managers’ commitment to environmental
1099
Environmentalmanagement
practices
management practices, cross-functional cooperation for environmental improvements,environmental compliance and auditing programs and ISO 14001 certification orenvironmental permit from the EPA Ghana. Specifically, environmental managementpractices were measured using questions like: indicate the extent to which your organizationhas implemented the following: please indicate (1¼ strongly disagree; 5¼ strongly agree):
(1) our senior managers are committed to environmental management (EMP1);
(2) our middle-level managers are committed to environmental management (EMP2);
(3) our organization has a cross-functional cooperation for environmentalimprovements (EMP3);
(4) our organization is committed to environmental compliance and auditingprograms (EMP4);
(5) our organization has ISO 14001 Certification (EMP5); and
(6) our organization has EPA Ghana Certification (EMP6).
3.3 Analytical techniquesThe relationships between the hypothesized model, namely, institutional pillars; regulative,normative, mimetic constructs and the environmental management practices wereexamined through the use of structural equation modeling (SEM). These were testedusing AMOS software version 23. In this study, we conducted an exploratory factor analysis(EFA) on the items using the SPSS software. The factor analysis indicated how distinct(discriminant validity) the constructs are and that each measures a single thing (convergentvalidity), and that they are reliable (reliability). This can all be achieved in the confirmatoryfactor analysis (CFA). Where the pre-validated instrument used is being applied to adifferent data set or within a different context or environment, EFA could be repeated beforeperforming the CFA (Gaskin, 2016). Thus, it was decided to conduct an EFA prior to thetesting of our structural model since the items were adapted and going to be used in adifferent environment (Osborne and Fitzpatrick, 2012; Gaskin, 2016). An EFA with themaximum likelihood extraction method and the Promax with Kaiser normalization wasused in the study. The rotation converged with five iterations. The objective of this was toextract the latent factors of the institutional theory and environmental managementpractices (Sadikoglu and Zehir, 2010; Gunday et al., 2011). All the items under the respectiveconstructs were reflective in nature and for that reason; they were all modeled as such.Apart from that AMOS application does not lend itself easily to formative constructs and forthat, the default model was used (Gaskin, 2016). A CFA was therefore performed on all theitems and constructs based on their reliabilities and validities by evaluating the Cronbach’sα coefficients, outer loadings, average variance extracted (AVE), and composite reliabilities(CR) (Sadikoglu and Zehir, 2010).
4. Results4.1 Exploratory factor analysisIn this study, we started with 4 constructs and 21 items. After five iterations, the results ofthe EFA analysis converged with same four constructs, however, 5 out of the 21 items weredeleted due to poor loadings. The final model, therefore, consisted of 4 constructs and 16items, three for institutional pillars and one for environmental management practices. Theextracted institutional theory constructs were labeled as regulatory, normative and mimeticpressures. Similarly, four items loaded to a coherent factor and was labeled environmentalmanagement practices accordingly. The pattern matrix for the EFA is presented in Table II.
1100
IJPPM67,7

Table II also presents the eigenvalues as well as the percentage variance of the factorsextracted and total variance explained.
The Kaiser–Meyer–Olkin (KMO) measure of the sampling adequacy was found to be0.883, which was greater than 0.5 indicating that the sample size is adequate for the givennumber of variables used for the factor analysis (Hutcheson and Sofroniou, 1999). Table IIIpresents the KMO and Bartlett’s test of sphericity values. Table IV presents the descriptivestatistics of the constructs used in the study.
4.1.1 Summary of EFA. The results of the EFA indicate: factor 1 as a regulative, factor 2as a normative, factor 3 as a mimetic and factor 4 as environmental management practices.
FactorItems 1 2 3 4
NORM1 0.835NORM2 0.911NORM3 0.875NORM4 0.866EMP2 0.877EMP3 0.958EMP4 0.732EMP5 0.704REG1 0.800REG3 0.942REG4 0.980REG5 0.810MIME1 0.921MIME2 0.801MIME3 0.893MIME4 0.779Eigenvalues 6.559 2.825 2.005 1.539% variance extracted 38.638 16.169 10.932 8.818Cumulative % 74.558Notes: Extraction method: maximum likelihood; rotation method: promax with Kaiser normalization;rotation converged in five iterations
Table II.EFA pattern matrix
Descriptive statistics n Minimum Maximum Mean SD
NORMATIVE 219 1 5 2.259 0.805ENVMGT 219 1 5 3.817 0.644REGULATIVE 219 1 5 4.000 0.644MIMETIC 219 1 5 3.530 0.807
Table IV.Descriptive statistics
of constructs
Kaiser–Meyer–Olkin measure of sampling adequacy 0.883
Bartlett’s test of sphericityApprox. χ2 4,936.850df 120Sig. 0.000
Table III.KMO and Bartlett’s
test of sphericity
1101
Environmentalmanagement
practices

4.2 Confirmatory factor analysisThe factor structure was tested and scales validated by conducting a CFA (Hair et al., 2010).The model consisted of 4 constructs with 16 indicator elements, see Figure 2. All theconstructs in the model consisted of four items each. Figure 2 presents the constructs andtheir items which were the basis for the CFA. Prior to the assessment of the structuralrelationships between the constructs, we assessed the quality and the fitness of themeasurement models as recommended when using CB–SEM. The study, therefore,examined the reliability of the items used, convergent and discriminant validity as well asthe general goodness of fit of the model. To conduct this quality and goodness of fitanalysis, we used the “Master Validity Tool,” an AMOS Plugin tool developed by Gaskinand Lim (2016a).
To establish convergent validity, we considered the outer loadings as well as the AVEfor items and constructs, respectively. All items had very high loadings on their respectiveconstructs, ranging between 0.7 and 0.9, indicating very high convergent validity, all above0.7 (Fornell and Larcker, 1981). Table IV, therefore, indicates that the AVE’s for allconstructs were ranging between 0.673 and 0.795, larger than the recommended thresholdvalue of 0.5 (Fornell and Larcker, 1981; Hu and Bentler, 1999). For discriminant validity,
e10.87
0.93
0.95
0.81
0.84
0.91
0.87
0.86
0.88
0.85
0.90
0.78
0.86
0.37
0.22
0.23 0.53
0.48
0.23
0.93
0.72
0.75
REG1
REG3REGULATIVE
NORMATIVE
MIMETIC
ENVMGT
REG4
REG5
NORM1
NORM2
NORM3
NORM4
MIME1
MIME2
MIME3
MIME4
EMP2
EMP3
EMP4
EMP5
e2
e4
e5
e6
e7
e8
e9
e10
e11
e12
e13
e14
e15
e16
0.37
e3
Figure 2.Constructs usedin the model anditems – confirmatoryfactor analysis
1102
IJPPM67,7
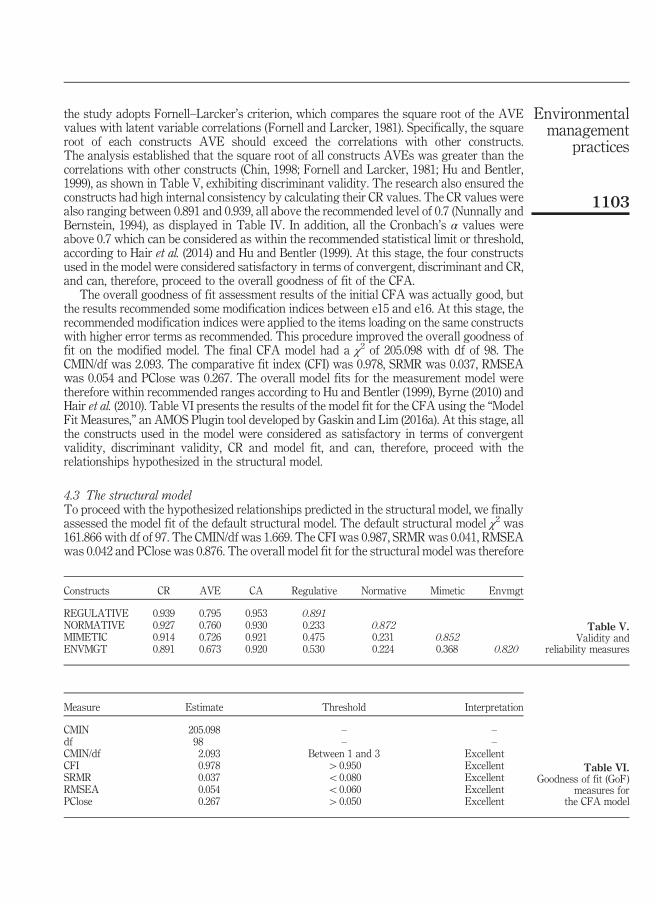
the study adopts Fornell–Larcker’s criterion, which compares the square root of the AVEvalues with latent variable correlations (Fornell and Larcker, 1981). Specifically, the squareroot of each constructs AVE should exceed the correlations with other constructs.The analysis established that the square root of all constructs AVEs was greater than thecorrelations with other constructs (Chin, 1998; Fornell and Larcker, 1981; Hu and Bentler,1999), as shown in Table V, exhibiting discriminant validity. The research also ensured theconstructs had high internal consistency by calculating their CR values. The CR values werealso ranging between 0.891 and 0.939, all above the recommended level of 0.7 (Nunnally andBernstein, 1994), as displayed in Table IV. In addition, all the Cronbach’s α values wereabove 0.7 which can be considered as within the recommended statistical limit or threshold,according to Hair et al. (2014) and Hu and Bentler (1999). At this stage, the four constructsused in the model were considered satisfactory in terms of convergent, discriminant and CR,and can, therefore, proceed to the overall goodness of fit of the CFA.
The overall goodness of fit assessment results of the initial CFA was actually good, butthe results recommended some modification indices between e15 and e16. At this stage, therecommended modification indices were applied to the items loading on the same constructswith higher error terms as recommended. This procedure improved the overall goodness offit on the modified model. The final CFA model had a χ2 of 205.098 with df of 98. TheCMIN/df was 2.093. The comparative fit index (CFI) was 0.978, SRMR was 0.037, RMSEAwas 0.054 and PClose was 0.267. The overall model fits for the measurement model weretherefore within recommended ranges according to Hu and Bentler (1999), Byrne (2010) andHair et al. (2010). Table VI presents the results of the model fit for the CFA using the “ModelFit Measures,” an AMOS Plugin tool developed by Gaskin and Lim (2016a). At this stage, allthe constructs used in the model were considered as satisfactory in terms of convergentvalidity, discriminant validity, CR and model fit, and can, therefore, proceed with therelationships hypothesized in the structural model.
4.3 The structural modelTo proceed with the hypothesized relationships predicted in the structural model, we finallyassessed the model fit of the default structural model. The default structural model χ2 was161.866 with df of 97. The CMIN/df was 1.669. The CFI was 0.987, SRMR was 0.041, RMSEAwas 0.042 and PClose was 0.876. The overall model fit for the structural model was therefore
Constructs CR AVE CA Regulative Normative Mimetic Envmgt
REGULATIVE 0.939 0.795 0.953 0.891NORMATIVE 0.927 0.760 0.930 0.233 0.872MIMETIC 0.914 0.726 0.921 0.475 0.231 0.852ENVMGT 0.891 0.673 0.920 0.530 0.224 0.368 0.820
Table V.Validity and
reliability measures
Measure Estimate Threshold Interpretation
CMIN 205.098 – –df 98 – –CMIN/df 2.093 Between 1 and 3 ExcellentCFI 0.978 W0.950 ExcellentSRMR 0.037 o0.080 ExcellentRMSEA 0.054 o0.060 ExcellentPClose 0.267 W0.050 Excellent
Table VI.Goodness of fit (GoF)
measures forthe CFA model
1103
Environmentalmanagement
practices

within the recommended ranges according to Hu and Bentler (1999), Byrne (2010), Hair et al.(2010). Table VII presents the results of the model fit for the default structural model usingthe “Model Fit Measures,” an AMOS Plugin tool developed by Gaskin and Lim (2016b).At this stage, we can confirm that the default model satisfies all the recommended qualitycriteria and now suitable to assess the relationships hypothesized in the structural model.The default model is presented in Figure 3.
4.4 The hypothesized relationshipsAfter meeting all the prescribed quality criteria for the measurement as well as the defaultmodels the last step in the CB–SEM is to analyze the structural model. These results arepresented in Table VIII. The table presents the effect of the three exogenous constructs, theinstitutional pillars on the single endogenous construct, environmental managementpractices. This estimate represents the β value (coefficient value associated withenvironmental management practices). This value assesses the relationship between a givenexogenous variable and it respective endogenous variables holding all other exogenous
e1
0.75
0.86 0.87
0.93
0.95
0.810.66
0.70
0.83 0.84
0.910.76
0.87
0.750.86
0.77
0.88
0.14
0.09
0.48
0.310.75
0.72
0.93
0.860.75
0.86
0.52
0.570.23
0.44
0.23
0.72
0.800.90
0.780.60
0.85
0.90
REG1
REGULATIVE
NORMATIVE
MIMETIC
ENVMGT
EMP5
EMP4
EMP3
EMP2
e17
e16
e15
e14
e13
REG3
REG4
REG5
NORM1
NORM2
NORM3
NORM4
MIME1
MIME2
MIME3
MIME4
e2
e3
e4
e5
e6
e7
e8
e9
e10
e11
e12
Figure 3.The default modelshowing theconstructs and theirhypothesizedrelationships
Measure Estimate Threshold Interpretation
CMIN 161.866 – –df 97 – –CMIN/df 1.669 Between 1 and 3 ExcellentCFI 0.987 W0.950 ExcellentSRMR 0.041 o0.080 ExcellentRMSEA 0.042 o0.060 ExcellentPClose 0.876 W0.050 Excellent
Table VII.Goodness of fitmeasures (Gof )for the default model
1104
IJPPM67,7
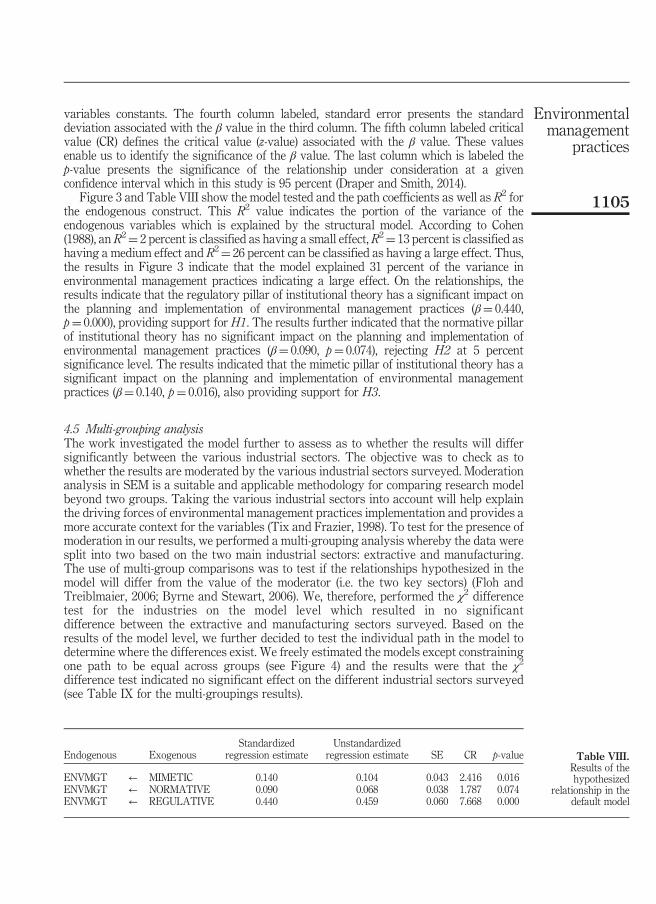
variables constants. The fourth column labeled, standard error presents the standarddeviation associated with the β value in the third column. The fifth column labeled criticalvalue (CR) defines the critical value (z-value) associated with the β value. These valuesenable us to identify the significance of the β value. The last column which is labeled thep-value presents the significance of the relationship under consideration at a givenconfidence interval which in this study is 95 percent (Draper and Smith, 2014).
Figure 3 and Table VIII show the model tested and the path coefficients as well as R2 forthe endogenous construct. This R2 value indicates the portion of the variance of theendogenous variables which is explained by the structural model. According to Cohen(1988), an R2¼ 2 percent is classified as having a small effect, R2¼ 13 percent is classified ashaving a medium effect and R2¼ 26 percent can be classified as having a large effect. Thus,the results in Figure 3 indicate that the model explained 31 percent of the variance inenvironmental management practices indicating a large effect. On the relationships, theresults indicate that the regulatory pillar of institutional theory has a significant impact onthe planning and implementation of environmental management practices (β¼ 0.440,p¼ 0.000), providing support for H1. The results further indicated that the normative pillarof institutional theory has no significant impact on the planning and implementation ofenvironmental management practices (β¼ 0.090, p¼ 0.074), rejecting H2 at 5 percentsignificance level. The results indicated that the mimetic pillar of institutional theory has asignificant impact on the planning and implementation of environmental managementpractices (β¼ 0.140, p¼ 0.016), also providing support for H3.
4.5 Multi-grouping analysisThe work investigated the model further to assess as to whether the results will differsignificantly between the various industrial sectors. The objective was to check as towhether the results are moderated by the various industrial sectors surveyed. Moderationanalysis in SEM is a suitable and applicable methodology for comparing research modelbeyond two groups. Taking the various industrial sectors into account will help explainthe driving forces of environmental management practices implementation and provides amore accurate context for the variables (Tix and Frazier, 1998). To test for the presence ofmoderation in our results, we performed a multi-grouping analysis whereby the data weresplit into two based on the two main industrial sectors: extractive and manufacturing.The use of multi-group comparisons was to test if the relationships hypothesized in themodel will differ from the value of the moderator (i.e. the two key sectors) (Floh andTreiblmaier, 2006; Byrne and Stewart, 2006). We, therefore, performed the χ2 differencetest for the industries on the model level which resulted in no significantdifference between the extractive and manufacturing sectors surveyed. Based on theresults of the model level, we further decided to test the individual path in the model todetermine where the differences exist. We freely estimated the models except constrainingone path to be equal across groups (see Figure 4) and the results were that the χ2
difference test indicated no significant effect on the different industrial sectors surveyed(see Table IX for the multi-groupings results).
Endogenous ExogenousStandardized
regression estimateUnstandardized
regression estimate SE CR p-value
ENVMGT ← MIMETIC 0.140 0.104 0.043 2.416 0.016ENVMGT ← NORMATIVE 0.090 0.068 0.038 1.787 0.074ENVMGT ← REGULATIVE 0.440 0.459 0.060 7.668 0.000
Table VIII.Results of thehypothesized
relationship in thedefault model
1105
Environmentalmanagement
practices

5. Discussion and conclusionsIn this study, we have provided some empirical evidence on the driving forces ofenvironmental management practices into organizations using institutional theory. Theresults from our study highlight relationship between the three institutional pillars, i.e.,regulative, normative and mimetic the planning and implementation of environmentalmanagement practices in Ghanaian firms. The findings indicate that firms in Ghanaincorporate environmental management practices into their operations due to forces exertedfrom the regulatory bodies as well as benchmark the initiatives of other organizations in thesame industry which have successfully planned and implemented environmentalmanagement practices into their operations. These findings corroborate those of Delmas(2002), Tate et al. (2011), Williamson et al. (2006), To and Tang (2014) and Heras-Saizarbitoriaet al. (2011). In a survey by Delmas (2001) among European and US firms, a substantialnumber of managers indicated they adopt measures such as ISO 14001 environmentalmanagement systems in their operations in the quest to satisfy regulatory compliance.Heras-Saizarbitoria et al. (2011) also conducted an extensive literature review concerning the
e11
1
1
1
1
1
1
1
1
1
1
1
1
11
1
1
1
1
1
1
v1_2
a1_2
a2_2
a3_2
a4_2
a5_2
a6_2
a7_2
a9_2
vvv3_2
ccc3_2
b2_2
b1_2
ccc2_2
vvv2_2
ccc1_2
b3_2
vvv1_2
vv1_2
a12_2
a11_2
v13_2
v14_2
v15_2a_2
v16_2
a10_2
a8_2
v2_2
v3_2
v4_2
v5_2
v6_2
v7_2
v8_2
v9_2
v10_2
v11_2
v12_2
e2
e3
e4
e5
e6
e7
e8
e9
e10
e11
e12
e14
e13
e15
e16
e17
REG1
REG3
REG4
REG5
NORM1
NORM2
NORM3
NORM4
MIME1
MIME2
MIME3
MIME4
REGULATIVE
NORMATIVE
MIMETIC
ENVMGT
EMP5
EMP4
EMP3
EMP2
Figure 4.Default multi-groupings model
Path df CMIN p-values
Unconstrained model 15 9.011 0.877Regulative – Envt Mgt Pract 1 1.034 0.309Normative – Envt Mgt Pract 1 0.094 0.759Mimetic – Envt Mgt Pract 1 2.556 0.110
Table IX.Multi-groupingsresults
1106
IJPPM67,7
motivations for and benefits of implementing ISO 14001 environmental managementsystems and surveyed 214 Spanish companies. They found that the most highly ratedbenefit was compliance with environmental laws and regulations, followed byenvironmental effectiveness improvement, less environmental problems and improvingcustomer satisfaction. Williamson et al. (2006) used empirical research into theenvironmental practices of 31 manufacturing SMEs and found that “businessperformance” and “regulation” considerations drive the environmental behavior of theenterprises. Also, in a study to understand the transaction cost and institutional drivers ofsupplier adoption of environmental practices in the USA, Tate et al. (2011) found thatinstitutional theory analysis reveals that supplier adoption of environmental practices ismore likely if coercive, normative and mimetic institutional forces are in play.
In addition to coercive pressures, the results also indicated that organizations in Ghanaalso mimic practices that successful leading firms have adopted in terms of environmentalmanagement practices. This finding is consistent with that of Anderson et al. (1999),Henriques and Sadorsky (1996) and Khanna and Anton (2002). Our results also confirmthose of DiMaggio and Powell (1983) and Jennings and Zandbergen (1995). DiMaggio andPowell (1983) posit that a mimetic process occurs when an organization models itself onother organizations in an uncertain environment. Organizations tend to model themselvesafter other organizations they believe are well managed and able to survive in a competitiveenvironment. According to Jennings and Zandbergen (1995), firms sometimes implementprograms (e.g. environmentally friendly programs, green products and environmentalmarketing programs) without studying the impacts, but rather due to competitive pressure.
The results, however, contradict with the findings of Kollman and Prakash (2002) whoexamined why the UK, Germany and US companies adopt an EMS. They found in the USAthat the decision of whether to pursue certification and which standard to certify against(ISO 14001 or the European Union’s Eco-Audit and Management Scheme) was stronglyinfluenced by stakeholder pressures from industry associations in addition to regionalchambers of commerce, suppliers and regulators.
Our results indicate consistency across the various industrial, i.e., manufacturing and theextractive sectors surveyed based on the multi-grouping analysis. This is might be due tothe fact that both the manufacturing and the extractive sectors are highly regulated by theEPA Ghana based on Act, 203, 1994 and the L.I 1652, 1999. Over the years, the Ghanaianbusiness environment has been regulated by the Environmental Protection Council (EPC).The main objective then was to advise the government on environmental issues. However,since 2004, the EPC was converted to the EPA, operating as a public agency that can sueand be sued, thereby strengthening environmental regulations in the country.
6. Implications, limitations and future researchThe results indicate that organizations implement environmental management practices asa result of coercive and mimetic pressures. The implication is that it is important forregulatory bodies such as the EPA Ghana to actually develop effective and efficientenvironmental policies that are implemented and monitored in order to achieve improvedenvironmental performance. This is because the finding has indicated that one of the maindriving forces of environmental management practices implementation is the regulatorypillar. It is important therefore for the EPA Ghana to plan and guide the effectiveimplementation of policies as well as monitoring on all sectors including manufacturing andthe extractive sectors. Another implication from the findings of this work is the need forregulatory bodies to continually monitor polluting firms to make sure they are planning andimplementing policies related to the environment since the effective implementation of thesepolicies will motivate other firms to mimic the actions of the implementing firms. The resultsalso indicate the importance of educating industrial associations on the importance of
1107
Environmentalmanagement
practices

integrating environmental issues into manufacturing and service delivery to enable them toplay an active role in achieving sustainable development.
One limitation of this work is the use of data only from Ghana. It is important for otherresearchers to assess these relationships using data from other geographical areas. In anattempt to operationalize the environmental management practices construct, the researchdeveloped and used only one construct based on previously validated items. The inclusionof other constructs could be interesting for future research. This could provide valuableknowledge about the link between these institutional pillars and other categories ofenvironmental management practices to obtain a more in-depth view of the relationship.Future studies can also consider the relationship between the three institutional pillars andcorporate social responsibility initiatives.
References
Anderson, S.W., Daly, J.D. and Johnson, M.F. (1999), “Why firms see IS 9000 certification: regulatorycompliance or competitive advantage”, Production and Operations Management, Vol. 8 No. 1,pp. 28-43.
Aryee, B.N.A., Ntibery, B.K. and Atorkui, E. (2003), “Trends in the small-scale mining of preciousminerals in Ghana: a perspective on its environmental impact”, Journal of Cleaner Production,Vol. 11 No. 2, pp. 131-140.
Balasubramanian, S. and Shukla, V. (2017), “Green supply chain management: an empiricalinvestigation on the construction sector”, Supply Chain Management: An International Journal,Vol. 22 No. 1, pp. 58-81.
Bansal, P. and Clelland, I. (2004), “Talking trash: legitimacy, impression management, andunsystematic risk in the context of the natural environment”, Academy of Management Journal,Vol. 47 No. 1, pp. 93-103.
Björklund, M. and Forslund, H. (2013), “The purpose and focus of environmental performancemeasurement systems in logistics”, International Journal of Productivity and PerformanceManagement, Vol. 62 No. 3, pp. 230-249.
Byrne, B.M. (2010), Structural Equation Modeling with AMOS: Basic Concepts, Applications, andProgramming, 2nd ed., Routledge, New York, NY.
Byrne, B.M. and Stewart, S.M. (2006), “Teacher’s corner: the MACS approach to testing for multigroupinvariance of a second-order structure: a walk through the process”, Structural EquationModeling, Vol. 13 No. 2, pp. 287-321.
Carraro, C., Katsoulacos, Y. and Xepapadeas, A. (Eds) (1996), Environmental Policy and MarketStructure, Kluwer, Boston, MA.
Carroll, G.R. and Delacroix, J. (1982), “Organizational mortality in the newspaper industries ofArgentina and Ireland: an ecological approach”, Administrative Science Quarterly, Vol. 27 No. 2,pp. 169-198.
Chen, A.J., Watson, R.T., Boudreau, M. and Karahanna, E. (2011), “An institutional perspectiveon the adoption of green IS & IT”, Australasian Journal of Information Systems, Vol. 17 No. 1,pp. 5-27.
Cheng, H.-L. and Yu, C.-M.J. (2008), “Institutional pressures and initiation of internationalization:evidence from Taiwanese small and medium-sized enterprises”, International Business Review,Vol. 17 No. 3, pp. 331-348.
Chin, W.W. (1998), “Commentary: issues and opinion on structural equation modeling”,MIS Quarterly,Vol. 22 No. 1, pp. vii-xvi.
Christmann, P. (2000), “Effects of “best practices” of environmental management on cost advantage:the role of complementary assets”, Academy of Management Journal, Vol. 43 No. 4,pp. 663-680.
1108
IJPPM67,7
Chu, S.H., Yang, H., Lee, M. and Park, S. (2017), “The impact of institutional pressures on green supplychain management and firm performance: top management roles and social capital”,Sustainability, Vol. 9 No. 5, pp. 764-785.
Clemens, B. and Douglas, T.J. (2006), “Does coercion drive firms to adopt ‘voluntary’ green initiatives.Relationships among coercion, superior firm resources, and voluntary green initiatives”, Journalof Business Research, Vol. 59 No. 4, pp. 483-491.
Cohen, J. (1988), Statistical Power Analysis for the Behavioral Sciences, 2nd ed., Academic Press,New York, NY.
Cordano, M. (1993), “Making the natural connection: justifying investment in environmentalinnovation”, Proceedings of the International Association for Business and Society, pp. 530-537.
Dean, T.J. and Brown, R.L. (1995), “Pollution regulation as a barrier to new firm entry: initialevidence and implications for future research”, Academy of Management Journal, Vol. 38 No. 1,pp. 288-303.
Delmas, M. (2001), “Stakeholders and competitive advantage: the case of ISO 14001”, Production andOperations Management, Vol. 10 No. 3, pp. 343-358.
Delmas, M. (2002), “The diffusion of environmental management standards in Europe and the UnitedStates: an institutional perspective”, Policy Sciences, Vol. 35 No. 1, pp. 91-119.
Delmas, M. (2003), “In search of ISO: an institutional perspective on the adoption of internationalmanagement standards”, Working Paper No. 1784, Stanford Graduate School of Business,Stanford, CA.
Delmas, M. and Toffel, M.W. (2004), “Stakeholders and environmental management practices: aninstitutional framework”, Business Strategy and the Environment, Vol. 13 No. 4, pp. 209-222.
DiMaggio, P.J. and Powell, W.W. (1983), “The iron cage revisited: Institutional isomorphism andcollective rationality in organizational fields”, American Sociological Review, Vol. 48 No. 2,pp. 147-160.
Dodds, R., Graci, S., Ko, S. and Walker, L. (2013), “What drives environmental sustainability in theNew Zealand wine industry?: an examination of driving factors and practices”, InternationalJournal of Wine Business Research, Vol. 25 No. 3, pp. 164-184.
Draper, N.R. and Smith, H. (2014), Applied Regression Analysis, Vol. 326, John Wiley & Sons,New York, NY.
EPA Ghana (1999), available at: http://extwprlegs1.fao.org/docs/pdf/gha78169.pdf (accessedFebruary 11, 2017).
Ferguson, N. and Browne, J. (2001), “Issues in end-of-life product recovery and reverse logistics”,Production Planning & Control, Vol. 12 No. 5, pp. 534-547.
Floh, A. and Treiblmaier, H. (2006), “What keeps the e-banking customer loyal? A multigroup analysisof the moderating role of consumer characteristics on e-loyalty in the financial service industry”,Journal of Electronic Commerce Research, Vol. 7 No. 2, pp. 97-110.
Fornell, C. and Larcker, D.F. (1981), “Evaluating structural equation models with unobservablevariables and measurement error”, Journal of Marketing Research, Vol. 18 No. 1, pp. 39-50.
Gaskin, J. (2016), “Exploratory factor analysis”, Gaskination’s StatWiki, available at: http://statwiki.kolobkreations.com (accessed January 10, 2017).
Gaskin, J. and Lim, J. (2016a), “Master validity tool”, AMOS Plugin, Gaskination’s StatWiki.
Gaskin, J. and Lim, J. (2016b), “Model fit measures”, AMOS Plugin, Gaskination’s StatWiki.
Gavronski, J., Ferrer, G. and Paiva, E.L. (2008), “ISO 14001 certification in Brazil: motivations andbenefits”, Journal of Cleaner Production, Vol. 16 No. 1, pp. 87-94.
Grewal, R. and Dharwadkar, R. (2002), “The role of the institutional environment in marketingchannels”, Journal of Marketing, Vol. 66 No. 3, pp. 82-97.
Gunday, G., Ulusoy, G., Kilic, K. and Alpkan, L. (2011), “Effects of innovation types on firmperformance”, International Journal of Production Economics, Vol. 133 No. 2, pp. 662-676.
1109
Environmentalmanagement
practices
Hair, J.F., Black, W.C., Babin, B.J. and Anderson, R.E. (2010), Multivariate Data Analysis, 7th ed.,Prentice Hall, NJ.
Hair, J.F., Hult, G.T.M., Ringle, C.M. and Sarstedt, M. (2014), A Primer on Partial Least SquaresStructural Equation Modeling (PLS-SEM), Sage, Thousand Oaks, CA.
Hatch, M.J. (1997), Organizational Theory: Modern, Symbolic, and Postmodern Perspectives,Oxford University Press, New York, NY.
Heide, J.B. and John, G. (1992), “Do norms matter in marketing relationships?”, Journal of Marketing,Vol. 56 No. 2, pp. 32-44.
Henriques, I. and Sadorsky, P. (1996), “The determinants of an environmentally responsive firm: anempirical approach”, Journal of Environmental Economics and Management, Vol. 30 No. 3,pp. 381-395.
Heras-Saizarbitoria, I., Landin, G.A. and Molina-Azorin, J.F. (2011), “Do drivers matter for the benefitsof ISO 14001?”, International Journal of Operations & Production Management, Vol. 31 No. 2,pp. 192-215.
Hoffman, A.J. (1997), From Heresy to Dogma: An Institutional History of Corporate Environmentalism,New Lexington Press, San Francisco, CA.
Hoffman, M.L. (1977), “Moral internalization: current theory and research”, Advances in ExperimentalSocial Psychology, Vol. 10, Academic Press, pp. 85-133.
Hu, A.H. and Hsu, C.W. (2010), “Critical factors for implementing green supply chain practice: anempirical study of electrical and electronic industries in Taiwan”,Management Research Review,Vol. 33 No. 6, pp. 586-608.
Hu, L. and Bentler, P.M. (1999), “Cutoff criteria for fit indexes in covariance structure analysis:conventional criteria versus new alternatives”, Structural Equation Modeling, Vol. 6 No. 1,pp. 1-55.
Hutcheson, G. and Sofroniou, N. (1999), The Multivariate Social Scientist, Sage Publications, London.
Jennings, P.D. and Zandbergen, P.A. (1995), “Ecologically sustainable organizations: an institutionalapproach”, Academy of Management Review, Vol. 20 No. 4, pp. 1015-1052.
Khanna, M. and Anton, W.Q. (2002), “Corporate environmental management: regulatory and market-based pressures”, Land Economics, Vol. 78 No. 4, pp. 539-558.
King, A.A. and Lenox, M.J. (2001), “Does it really pay to be green? An empirical study of firmenvironmental and financial performance”, Journal of Industrial Ecology, Vol. 5 No. 1, pp. 105-116.
Kollman, K. and Prakash, A. (2002), “EMS-based environmental regimes as club goods: examiningvariations in firm level adoption of ISO 14001 and EMAS in UK, US, and Germany”, PolicySciences, Vol. 35 No. 1, pp. 43-67.
Lampe, M., Ellis, S.R. and Drummond, C.K. (1991), “What companies are doing to meet environmentalprotection responsibilities: balancing legal, ethical, and profit concerns”, Proceedings of theInternational Association for Business and Society, Vol. 2, pp. 1053-1073.
Larson, A. (1991), “Partner networks: leveraging external ties to improve entrepreneurial performance”,Journal of Business Venturing, Vol. 6 No. 3, pp. 173-189.
Lawrence, A.T. and Morell, D. (1995), “Leading-edge environmental management: motivation,opportunity, resources, and processes”, in Collins, D. and Starik, M. (Eds), Special ResearchVolume of Research in Corporate Social Performance and Policy, Sustaining the NaturalEnvironment: Empirical Studies on the Interface Between Nature and Organizations, JAI Press,Greenwich, CT, pp. 99-126.
Liang, H., Saraf, N., Hu, Q. and Xue, Y. (2007), “Assimilation of enterprise systems: the effect ofinstitutional pressures and the mediating role of top management”,MIS Quarterly, Vol. 31 No. 1,pp. 59-87.
Majumdar, S.K. and Marcus, A.A. (2001), “Rules versus discretion the productivity consequences offlexible regulation”, Academy of Management Journal, Vol. 44 No. 1, pp. 170-179.
1110
IJPPM67,7

Mensah, I. (2014), “Stakeholder pressure and hotel environmental performance in Accra, Ghana”,Management of Environmental Quality: An International Journal, Vol. 25 No. 2, pp. 227-243.
Meyer, J.W. and Rowan, B. (1977), “Institutionalized organizations: formal structure as myth andceremony”, American Journal of Sociology, Vol. 83 No. 2, pp. 340-363.
Miles, M.P. and Arnold, D.R. (1991), “The relationship between marketing orientation andentrepreneurial orientation”, Entrepreneurship Theory and Practice, Vol. 15 No. 4, pp. 49-65.
Nunnally, J.C. and Bernstein, I.H. (1994), Psychometric Theory, 3rd ed., McGraw-Hill, New York, NY.
Oliver, C. (1991), “Strategic responses to institutional processes”, Academy of Management Review,Vol. 16 No. 1, pp. 145-179.
Osborne, J.W. and Fitzpatrick, D.C. (2012), “Replication analysis in exploratory factor analysis: what itis and why it makes your analysis better”, Practical Assessment, Research & Evaluation, Vol. 17No. 15, pp. 1-8.
Owusu, G.M.Y., Kwakye, T.O., Welbeck, E.E. and Ofori, C.G. (2017), “Environmental literacy ofbusiness students in Ghana”, International Journal of Sustainability in Higher Education, Vol. 18No. 3, pp. 415-435.
Powell, W.W. and DiMaggio, P.J. (1991), The New Institutionalism in Organizational Analysis,University of Chicago Press, Chicago, IL.
Prado-Lorenzo, J.M. and García-Sánchez, I.M. (2010), “Effect of operation size, environmentalconditions, and management on municipal sewerage services”, International Journal ofProductivity and Performance Management, Vol. 59 No. 3, pp. 206-228.
Rugman, A.M. and Verbeke, A. (1998), “Corporate strategies and environmental regulations: anorganizing framework”, Strategic Management Journal, Vol. 19 No. 4, pp. 363-375.
Sadikoglu, E. and Zehir, C. (2010), “Investigating the effects of innovation and employee performanceon the relationship between total quality management practices and firm performance: anempirical study of Turkish firms”, International Journal of Production Economics, Vol. 127 No. 1,pp. 13-26.
Scott, W.R. (1987), “The adolescence of institutional theory”, Administrative Science Quarterly, Vol. 32No. 4, pp. 493-511.
Scott, W.R. (1995), Institutions, and Organizations, Sage, Thousand Oaks, CA.
Scott, W.R. (2001), Institutions and Organizations, 2nd ed., Sage, Thousand Oaks, CA.
Selznick, P. (1957), Leadership in Administration: A Sociological Perspective, Harper & Row, New York, NY.
Shukla, A.C., Deshmukh, S.G. and Kanda, A. (2009), “Environmentally responsive supply chains:learning from the Indian auto sector”, Journal of Advances in Management Research, Vol. 6 No. 2,pp. 154-171.
Singhapakdi, A., Karande, K., Rao, C.P. and Vitell, S.J. (2001), “How important are ethics and socialresponsibility? A multinational study of marketing professionals”, European Journal ofMarketing, Vol. 35 Nos 1/2, pp. 133-152.
Tate, W.L., Dooley, K.J. and Ellram, L.M. (2011), “Transaction cost and institutional drivers of supplieradoption of environmental practices”, Journal of Business Logistics, Vol. 32 No. 1, pp. 6-16.
Teo, H.H., Wei, K.K. and Benbasat, I. (2003), “Predicting intention to adopt inter-organizationallinkages: an institutional perspective”, MIS Quarterly, Vol. 27 No. 1, pp. 19-49.
Tibben-Lembke, R.S. (2002), “Life after death: reverse logistics and the product life cycle”, InternationalJournal of Physical Distribution & Logistics Management, Vol. 32 No. 3, pp. 223-244.
Tix, A.P. and Frazier, P.A. (1998), “The use of religious coping during stressful life events: main effects,moderation, and mediation”, Journal of Consulting and Clinical Psychology, Vol. 66 No. 2,pp. 411-422.
To, W.M. and Tang, N.F.M. (2014), “The adoption of ISO 14001 environmental management systems inMacao SAR, China”, Management of Environmental Quality: An International Journal, Vol. 25No. 2, pp. 244-256.
1111
Environmentalmanagement
practices
Tuttle, T. and Heap, J. (2007), “Green productivity: moving the agenda”, International Journal ofProductivity and Performance Management, Vol. 57 No. 1, pp. 93-106.
Van Weele, A.J. and van Raaij, E.M. (2014), “The future of purchasing and supply management research:about relevance and rigor”, Journal of Supply Chain Management, Vol. 50 No. 1, pp. 56-72.
Wang, Z. and Sarkis, J. (2013), “Investigating the relationship of sustainable supply chain managementwith corporate financial performance”, International Journal of Productivity and PerformanceManagement, Vol. 62 No. 8, pp. 871-888.
Williamson, D., Lynch-Wood, D. and Ramsay, J. (2006), “Drivers of environmental behaviour inmanufacturing SMEs and the implications for CSR”, Journal of Business Ethics, Vol. 67 No. 3,pp. 317-330.
Yang, C.S. (2016), “Evaluating the use of alternative maritime power in Taiwan”, Maritime BusinessReview, Vol. 1 No. 3, pp. 208-224.
Ye, F., Zhao, X., Prahinski, C. and Li, Y. (2013), “The impact of institutional pressures, top managers’posture and reverse logistics on performance – evidence from China”, International Journal ofProduction Economics, Vol. 143 No. 1, pp. 132-143.
Zailani, S.H.M., Eltayeb, T.K., Hsu, C. and Tan, K.C. (2012), “The impact of external institutional driversand internal strategy on environmental performance”, International Journal of Operations &Production Management, Vol. 32 No. 6, pp. 721-745.
Zhu, Q., Sarkis, J. and Lai, K.H. (2008), “Confirmation of a measurement model for green supply chainmanagement practices implementation”, International Journal of Production Economics, Vol. 111No. 2, pp. 261-273.
Zsidisin, G.A., Melnyk, S.A. and Ragatz, G.L. (2005), “An institutional theory perspective of businesscontinuity planning for purchasing and supply management”, International Journal ofProduction Research, Vol. 43 No. 16, pp. 3401-3420.
Further reading
Hair, J.F., Ringle, C.M. and Sarstedt, M. (2011), “PLS-SEM: indeed, a silver bullet”, Journal of MarketingTheory and Practice, Vol. 19 No. 2, pp. 139-151.
Hair, J.F., Sarstedt, M., Ringle, C.M. and Mena, J.A. (2012), “An assessment of the use of partial leastsquares structural equation modeling in marketing research”, Journal of the Academy ofMarketing Science, Vol. 40 No. 3, pp. 414-433.
Hart, S.L. (1995), “A natural-resource-based view of the firm”, Academy of Management Review, Vol. 20No. 4, pp. 986-1014.
Nehrt, C. (1996), “Timing and intensity effects of environmental investments”, Strategic ManagementJournal, Vol. 17 No. 7, pp. 535-547.
Psomas, E. and Fotopoulos, C. (2010), “Total quality management practices and results in food companies”,International Journal of Productivity and Performance Management, Vol. 59 No. 7, pp. 668-687.
Russo, M.V. and Fouts, P.A. (1997), “A resource-based perspective on corporate environmentalperformance and profitability”, Academy of Management Journal, Vol. 40 No. 3, pp. 534-559.
Sharma, S. and Vredenburg, H. (1998), “Proactive corporate environmental strategy and thedevelopment of competitively valuable organizational capabilities”, Strategic ManagementJournal, Vol. 19 No. 6, pp. 729-753.
Corresponding authorSamuel Famiyeh can be contacted at: [email protected]
For instructions on how to order reprints of this article, please visit our website:www.emeraldgrouppublishing.com/licensing/reprints.htmOr contact us for further details: [email protected]
1112
IJPPM67,7

The relationship betweenmanagement characteristics and
firm innovationMahdi Salehi and Mahmoud Lari DashtBayazDepartment of Economics and Administrative Sciences,Ferdowsi University of Mashhad, Mashhad, Iran, and
Samaneh Mohammadi MoghadamDepartment of Economics and Administrative Sciences, Qaenat Branch,
Islamic Azad University, Gaenat, Iran
AbstractPurpose – The purpose of this paper is to assess the relationship between some management features(management capability, management entrenchment, agency costs and overconfidence) and the innovation ofcompanies listed on the Tehran Stock Exchange.Design/methodology/approach – The study carried out during 2009–2015. A total of 125 companieswere selected from eight industries as the sample of study using the method of systematic elimination.A descriptive-correlational design was used in this study and panel data regression models were employed fordeveloping the relationship between research variables.Findings – The obtained results indicated that managerial ability could foster innovation, while managerialentrenchment could stifle innovation and agency costs and overconfidence have no effect on innovation.Originality/value – The current study is almost the first project which focuses on the managementcharacteristics and firm innovation in developing countries.Keywords Innovation, Overconfidence, Agency costs, Managerial entrenchment, Managerial capabilityPaper type Research paper
1. IntroductionThe development of market economy along with the international economy has intensified thecompetition among business enterprises, accelerated product update processes and broadenedthe scope of research and development activities, more than ever, to survive and develop thebusiness enterprises. Research and development is vital for manufacturing new products,possessing new markets and consequently increasing a firm profitability (Yang-hai, 2010).
Many scholars were concerned about the relationship between the board of directors and afirm performance and agency theory is one of the most significant issues in this field.According to this theory, supervision of managerial activities is the most important duty ofthe board to preserve the interests of shareholders and it is expected that such surveillanceimproves the performance of the desired firm. From agency theory point of view, thesignificance of corporate governance is implicit in the conflict of interests between managersand shareholders. In other words, corporate governance is working as a mechanism, whichaligned the objectives of managers with that of the shareholders and caused corporateperformance improvement (Fooladi and Zaleha, 2012). The global competition, which islaunched basically as of the 1980s has led the companies to concentrate on business strategies,especially innovation. Innovation is defined as the development of a novel method with theaim of creating freshness in the economy. Innovation can be regarded as a tool for convertingknowledge to a business value (Gandhi et al., 2011; Zehir et al., 2015). Innovation is the mainprerequisite for competition in the twenty-first century. Growing competition, extremeenvironmental agitations, technological alterations, and environmental uncertaintieshave made the organizations promote innovation as a leading section of their strategies
International Journal ofProductivity and Performance
ManagementVol. 67 No. 7, 2018
pp. 1113-1131© Emerald Publishing Limited
1741-0401DOI 10.1108/IJPPM-05-2017-0126
Received 21 May 2017Revised 4 September 2017
Accepted 21 September 2017
The current issue and full text archive of this journal is available on Emerald Insight at:www.emeraldinsight.com/1741-0401.htm
1113
Managementcharacteristics
Quarto trim size: 174mm x 240mm

( Jimenez-Jimenez et al., 2008). Abdulai Mahmoud and Hinson (2012) categorized theinnovation into three general classes of innovation in product, innovation in process andinnovation in management. Tomeasure the innovation, companies often spend from the fundsof research and developments (Chakraborty et al., 2014). Although a research anddevelopment fund is among investment decisions taken by the companies, such costs have apeculiar characteristic, which make them significantly different from other investmentdecisions. In contrast to tangible investments, such as capital expenditure, the implicit data inresearch and development costs not only comprise the tangible ones, but reflect intangibleinformation concerning future cash flows (Chen et al., 2014).
On the other hand, it is proven that innovation, as one of the most important componentsof competitiveness, could improve the performance of companies. In fact, the reason whycompanies use the innovation is to achieve better business performance and to increase thecompetitiveness (Gunday et al., 2011). Based on different reasons (such as, a need formanufacturing new product, use of organizational methods and the creation of a character,better market performance and better understanding the customers), we could substantiatethat innovation is one of the basic strategies of each company, in that innovation today is anessential tool for entering new markets, increasing the existing market share and enhancingcompetitive advantages. Such a great concentration on innovation is the result of morecompetitiveness in national and international markets. These facts indicate that innovation isan essential component of organizational strategies (Karlsson and Tavassoli, 2016). When theinnovation flow is no longer operational in a company, the economic structure will beabandoned in a passive situation and its growth will be limited. Therefore, innovation plays asignificant role in creating a difference between the performance of various companies andeven countries. Companies that develop innovations frequently and quickly enjoy from ahigh-quality staff, pay more and provide special future plans for them. Hence, the impact ofinnovation on performance comprises a variety of aspects from sales and market share toprofitability and efficiency (Gandhi et al., 2011). Innovation enables the company to createvalue for itself and to preserve its competitive advantages in today’s chaotic and complexsituation. In general, innovation not only causes the company to utilize the current resourcesappropriately and improve its value and efficiency, but brings some intangible assets to thecompany. Companies with higher innovations are more successful in responding customers’needs and are more capable of achieving the leading performance and more profitability.Innovation is vital for implementing operational efficiency and increasing the quality ofservices (Wang and Wang, 2012). The experimental evidences revealed that the boardcharacteristics, including size and independence, in addition to performance, could affect theinnovative activities, as well (Chouaibi et al., 2010; Zhao andWen, 2011). Studies on innovationhave been on two main topics, so far. Some were concerned about the effect of innovation onmarket value (i.e. Connolly and Hirschey, 2005; Bae and Kim, 2003) and some were on therealization of effective factors, such as cash flow, corporate size, industry classification, etc., oninnovation (Cumming and MacIntosh, 2000). The focus of the present study is on the latter,such that, the effect of some other factors of board characteristics (such as, entrenchment,agency costs, competency and overconfidence) on innovation is assessed companies listed onthe Tehran Stock Exchange. Thus, the research question is proposed as follows:
RQ1. To some extent do the board characteristics could affect the innovation ofcompanies listed on the Tehran Stock Exchange?
2. Theoretical issues, related literature and hypotheses development2.1 The relationship between management competency and firm innovationThe significance of innovation as one of the most important determining factors oforganizational performance is approved (Sun, 2015). More specifically, innovative activities
1114
IJPPM67,7
are conducted in order to reach market objectives and production, including improvingproduct quality, controlling production costs, increasing market share, accessing newmarkets, production flexibility, etc (Anderson et al., 2014; Bigliardi and Galati, 2016).Innovation could motivate the company to achieve high competitive standards and hold theposition. Since innovative activities could strengthen both executive and technologicalinnovations of a company, they could fuel growth and profitability (Nicolau andSanta-María, 2013).
In Van de Ven points of view, four problems contribute to innovation management:
(1) Human problem: people in companies are more concentrated on their daily routinesand this could bring about less attention to development and production of newideas. The question rises here is that whether the leadership intervention couldcenter the attention of organization members to innovative activities instead of dailyroutines or not (Nicolau and Santa-María, 2013).
(2) Process problem: although the concept of new ideas may be considered as anindividual activity, it should be noted that implementing new ideas ask for acollective effort to reach a broader and better admissibility (Nicolau andSanta-María, 2013).
(3) Structure problem: ideas may derive from different sections of a company. Thus,various resources and missions should be undertaken to implement an innovativeidea. So, the question here is that how we could gather such “components” togetherto achieve a “complete one” (Nicolau and Santa-María, 2013).
(4) Strategic problem: there is a consensus about the effect of organizational leadershipon innovation, especially when the company should adopt an alternative method todeal with current affairs (Nicolau and Santa-María, 2013).
According to Kelley et al. (2011), companies use the performance-based evaluation inselecting their project managers and those would be appointed, who first, are experiencedenough and second are well equipped with the required skills for innovation. Vaccaro et al.(2012) indicated that due to the leading role of management in an organization, it couldcontribute significantly to innovation management. Lampikoski (2012) declared that theinterface company, due to its investment on management abilities, could benefit from greeninnovations and gain stable competitive advantages, because management abilities allowedthe company to direct the required research plans, realize investment opportunities andrevolutionize the carpet industry. Yuan (2013) assessed the effect of CEO’s prior experienceson firm innovation in active American companies in the biotechnological industry andfound that a certain type of experience is not necessarily effective on innovation, but a set ofexperience could contribute to the issue.
Fitjar et al. (2013) by working on Norwegian companies reported that intellectualmanagers and good relationship with international companies could affect the corporateinnovation, significantly. Boermans and Roelfsema (2013) stated that work experience hasno significant effect on the innovation of Indian companies and among the variables ofeducational record the one that is related to foreign trade has only a significant effect on firminnovation. Chen (2014) reported that the level of education and work experience related toCEO industry has a positive effect on innovation in these countries. Furthermore, CEOpower could modify such relationship, positively, such that, by introducing a competentCEO, managers with human capital allocate more resources for innovative activities.Custodio et al. (2015) declared that managers that picked up general managerial skillsduring their career come up with more innovations and recorded more inventions, in thatmanagers are equipped with some skills which are used for the revival of failed innovationprojects. Finally, Sariol and Abebe (2017) found that powerful CEOs are more inclined
1115
Managementcharacteristics

toward pursuing exploratory innovations, such that there is a positive relationship betweenCEO power and exploratory innovations:
H1. There is a significant relationship between management competencies andfirm innovation.
2.2 The relationship between management entrenchment and firm innovationDriver and Guedes (2012) described the possibility of existence of a relationship betweenthe mechanisms of corporate governance (and as a result management entrenchment) andthe costs of research and development through three channels and said that first, corporategovernance could decrease the cost of investment in long-term projects and by uncertaintycould become like innovative investment. Second, corporate governance could reduceself-interested behaviors. The third channel, however, nullifies the effect of corporategovernance on research and development and cancels out the advantages of alignment ofinterests between managers and shareholders. This is due to the fact that some scholars,such as Aghion and Tirole (1997) introduce over-monitoring as one of the dangerous factorsthat reduce management autonomy. Since owners prefer liquid assets to uncertain assets,the interests of owners and shareholders are in conflict with innovative investments. At thenational level, macro-corporate governance, like legally developed systems and financialdevelopment outweighed the agency costs and this is where the investment efficiencyenhances in research and development activities (Chu et al., 2016).
The existence of information asymmetry between managers and other beneficiaries isone way to facilitate the entrenchment. The strategic position of managers enables them tocontrol the information access and limit the access of others. Managers behave in a wayto further the information asymmetry between themselves and other beneficiaries and tofacilitate their discretionary behaviors. Managers by investing in assets, which are moreinformed of, extend the information asymmetry. This could make the information andunderstanding of them more complicated for shareholders and potential managers.Accordingly, shareholders become more dependent and this is where discretionarybehaviors are provided for managers. Investing in innovative activities is among thoseinvestments that increase the information asymmetry, in that research and development(R&D) comprises a huge bulk of knowledge, which is hard to transfer and this could limitthe control of shareholders on the behaviors of shareholders. Therefore, it is predictedthat the increase in research and development costs could facilitate managemententrenchment (Dhaoui and Jouini, 2011).
Xiao (2010) indicated that when overinvestment is probable in a company, therelationship between protecting the rights of shareholders and investing in research anddevelopment activities becomes negative. Hillier et al. (2011) expressed that an effectivesupport is provided for investors in countries with advanced financial systems and powerfulcorporate control mechanisms are less sensitive to local cash flows for the costs of researchand development. Further, those mechanisms of corporate governance, which simplify theinvestment in the fields of research and development include, protecting minorityshareholders, proper law enforcement, bank-based financial system and effective boardcontrol. According to the results of this study, we could conclude that the mechanisms ofcorporate governance are of the utmost importance in investing in research anddevelopment. Humphery-Jenner (2011) by expressing that managers are risk-averse ingeneral and over risk-aversion could decrease shareholders’ wealth evaluated the impact ofanti-control measures of managers on innovative activities and value creation. The obtainedresults showed that anti-control measures may encourage the managers to create value,increase innovation and at the same time enhance agency differences derived frommanagement entrenchment. Driver and Guedes (2012) noticed that corporate governance
1116
IJPPM67,7

could bring about more decrease of research and development activities (either forindividual indices or for collective ones).
Chemmanur and Tian (2013) revealed that companies with more anti-control measuresare more innovative, as well. They justified such an effect by saying that the increase ofanti-control measures could alleviate short-term pressures from the market side onmanagers and allow them to concentrate solely on long-term value creation. Aghion et al.(2013) reported that institutional ownership could lead to the growth of innovation. Theydeclared that the positive effect of institutional ownership on innovation is due to jobconcerns of managers, such that institutional ownership could elevate managers’motivationfor innovation, because risky projects lower their professional risk.
Bingxiang et al. (2014) declared that there is a negative and significant relationshipbetween managerial entrenchment and research and development. Their results indicatedthat such a negative relationship could be inhibited through increase of managerialcompensation and ownership concentration, though the increase of board dependence couldintensify such a relationship. Chakraborty et al. (2014) discovered that the increase ofanti-control managerial measures could reduce the number inventions and awards.However, this negative relationship was evident in low-tech industries. Such a relationshipis not statistically significant in high-tech industries. Hasan et al. (2015) declared that moreappropriate corporate governance may higher the costs of research and development. Theirresults illustrated that the relationship between corporate governance and research anddevelopment become stronger, especially in countries with weaker governance.Finally, Amore and Bennedsen (2016) reported that companies with weak governancedesign less green innovations. This negative relationship between weak corporategovernance and green innovation become stronger, especially in companies with smallerinstitutional ownership:
H2. There is a significant relationship between managerial entrenchment and firminnovation.
2.3 The relationship between agency cost and firm innovationAccording to the agency theory introduced by Jensen and Meckling in 1976, the principal(shareholder) appoints the agent to run a company. Obviously, it is logical to imagine thatmanagers follow certain objectives, which are basically different from that of theshareholders. In fact, instead of maximizing the wealth of shareholders, they pursue theirown interests. Shareholders are more willing to see that the manager makes some decisions,which elevate the stock value, while the manager is intended to increase the business of thecompany and his/her interest, which does not necessarily increase the stock value (Ammariet al., 2016). The agency theory predicts that the existing differences between theshareholder and manager could lead to agency costs and this, in turn, is detrimental toshareholder’s value (Chang et al., 2016). Information asymmetry and conflict of interest aretwo major factors, which cause agency costs (Zhang and Cao, 2015). Information asymmetryin financial markets means that one of the parties to the deal has better information than theother. Theoretical models foresee that the quality of higher disclosure could decrease theinformation asymmetry between the involved parties in the capital market andconsequently lower the capital cost (Bhattacharya et al., 2013). Conflict of interest amongmanagers and shareholders, especially in the time of entrenchment, is more intensified(Elyasiani and Zhang, 2015).
Firm innovation contributes significantly to the stability and value enhancement.Investing in innovative activities, however, entails more risk, compared with investing incapital expenditures, in that such investments are mostly subject to failure (Bhagat andWelch, 1995). Innovation is time-consuming and this is the salient feature of investment,
1117
Managementcharacteristics
which could cause the cash flow deriving from such investments to be longer than thetenure of managers (Gibbons and Murphy, 1992). Therefore, risk-averse managers may notbe leaning toward investment in innovation. In total, companies with no innovation wouldlose their market value (Chakraborty et al., 2014).
Agency costs would lower the investment value in research and development and woulddecline its functionality, as well. For example, when an information asymmetry existsbetween managers and shareholders, managers are more inclined toward self-interestedefforts, rather than performing efficient research and development activities. Thus, agencycosts could increase uncertainty in innovation activities (Chu et al., 2016).
O’Connor et al. (2013) carried out a research on the sensitivity of research anddevelopment costs about financial market frictions. They believed that in the world withoutfriction, all companies will pursue investment projects with positive net present value. So,the level of research and development costs will not be influenced by the CEO compensation.By agency costs, however, companies would not be able or are not willing to follow allinvestment projects. Hence, companies with considerable agency costs will spend less onresearch and development:
H3. There is a significant relationship between agency costs and firm innovation.
2.4 The relationship between managerial overconfidence and firm innovationStudies conducted on the realization of contributing factors to research and developmentcosts can be classified into two groups. A group of them are concerned about some externalfactors, including market system, state behavior, right of ownership and the other group isabout the internal factors, like management characteristics, firm size, business performance,capital structure, profitability and corporate governance mechanisms, which affect the costsof research and development. Most of such research studies suffer from a major defect, thatis, managers’ irrational behaviors. However, most of the economic resources approved thatpeople are not usually logical and factors, involving loss aversion, time preference andoverconfidence could bring about some shortcomings in the process of decision making(Yong-hia, 2010). As declared by scholars, three factors contribute significantly to theoverconfidence of managers: the illusion of control, a high degree of commitment toparticular outcomes, abstract reference points. Managers believe that the situation is undercontrol. Moreover, they are fully committed to the firm performance, in that their wealth andtheir value of human capital are different from the firms’ share price. Finally, investmentdecisions of a company are complicated and their prosperity is under the influence of severalfactors. Under the influence of abstract reference points, financial managers are prone toexaggeration and overestimation in evaluating their capabilities to realize lucrativeinvestment opportunities (Chen et al., 2014). Many conducted studies emphasized on theways the managers’ overconfidence may affect the investment decisions.
Malmendier and Tate (2005) by concentrating on future cash flows (as one of the sourcesoverconfidence) indicated experimentally that managerial overconfidence could causeinvestment decision bias (merger and acquisition). According to the findings of Ben-Davidet al. (2012), compared with other managers, overconfident managers are more inclinedtoward investment activities. Galasso and Simcoe (2011) expressed that overconfidentmanagers (who concede less possibility for bankruptcy) are more enthusiasticabout innovative activities. Such an impact is increasing in competitive industries, aswell. Yong-hia (2010) showed that managerial overconfidence has some positive effects onresearch and development costs. Shanhui et al. (2013) indicated that managerialoverconfidence has some positive and significant effects on investment in innovativeactivities, such that this impact is only existed in high-tech industries and companies withstate ownership. Herz et al. (2014) stated that the relationship between managerial
1118
IJPPM67,7
overconfidence and innovation is more complicated than those results, which are obtained inprior studies. They claimed that how overconfidence affects the innovation depends on thetype of managerial overconfidence. Their results illustrated that judgmental overconfidencehas negative effect on innovation:
H4. There is significant relationship between managerial overconfidence and firminnovation.
3. Research methodologyThe present study is practical in terms of objective and descriptive-correlational in terms ofmethod. Type of data used in this study was quantitative and even the qualitative variables,such as managerial overconfidence, managerial entrenchment, etc., were turned intoquantitative using innovative models and methods in similar foreign studies and wereapplied in the research models. The statistical population comprises all listed companies onthe Tehran Stock Exchange active in one of the following industries:
(1) automotive and parts;
(2) pharmaceutical;
(3) cement, lime and plaster;
(4) chemicals;
(5) food, except sugar;
(6) basic metals;
(7) rubber and plastic; and
(8) machineries and equipment.
The statistical sample of study is selected using systematic removal sampling and based onthe following criteria:
(1) being listed in Tehran Stock Exchange before the fiscal year of 2009;
(2) having financial year-end on March 20;
(3) having no change in their fiscal years during the period of study (2009–2015);
(4) having presented the required information for calculating research variables; and
(5) not being affiliated with holding, investing, and insurance companies.
Given the above-mentioned criteria, a total of 125 companies were selected as the sample ofstudy. The highest frequency was related to “Automotive and parts” industry with 21companies and the lowest was for “rubber and plastic” industry and “machineries andequipment” industries, each with nine companies.
3.1 Research model and definition of variablesThe research model designed concerning the hypotheses of the study as follows:
INNO ¼ a0þb1MANABIþb2MANENTþb3AGENCYþb4OVER
þb5SIZEþb6IOþb7BHþb8LEVþe;
where INNO is innovation, MANABI is managerial ability, MANENT is managerialentrenchment, AGENCY is agency costs, OVER is overconfidence, SIZE is firm size, IO isinstitutional ownership, BH is substantial ownership and LEV is financial leverage.
1119
Managementcharacteristics
Desired regression coefficients are b1, b2, b3 and b4, which are corresponding to theresearch hypotheses. Statistical hypotheses related to each regression coefficient proposedas follows:
H 0 : bi ¼ 0
H 1 : bia0
(; i ¼ 1; 2; 3; 4:
H0 hypothesis expresses that there is no significant relationship between respectiveindependent variable and firm innovation. It is obvious that in case of rejection of H0hypothesis, the respective hypothesis with the regression coefficient being tested is rejected,as well.
In this paper, innovation has the role of dependent variable. To measure innovationbased on Chakraborty et al. (2014), the following index is used:
INNO ¼ CITATIONSþ INNOVATIONAVERAGE
;
where, CITAIONS is the number of awards, INNOVATION is the number of registeredinventions and AVERAGE is the average number of awards and registered inventions inthe related year-industry.
In this study, four variables of managerial ability, managerial entrenchment, managerialoverconfidence and agency costs were used as independent variables:
(1) Managerial ability (MANABI): Demerjian et al. (2012) method is employed toexamine the managerial ability. In this method, first, the amount of firm efficiency iscalculated as follows:
EFFICIENCY ¼ SALESCOGSþSGAþPPEþOPLEASEþRDþGOODWILLþ INTAN
;
where EFFCIENCY is the firm efficiency, SALES is the amount of sales, COGS is thecost of goods sold, OPLEASE is the cost of operating lease, RD is the cost of researchand development, PPE is the property, machinery and equipment value, INTAN isintangible net assets, GOODWILL is the purchased goodwill and SGA is general,office and sales costs. Then, a part of firm efficiency, which is controlled by itsintrinsic features, is isolated from management ability using the followingregression model and the residuals are defined as management ability:
EFFICIENCY ¼ a0þa1SIZEþa2MARKETSHþa3FCFþa4AGEþa5FCIþe;
where SIZE is the firm size (natural logarithm of assets), MARKETSH is the marketshare (the proportion of sales to total sales in the related industry), FCF: free cashflow marker (1 for year-companies with positive cash flows, otherwise 0), AGE is thefirm age (natural logarithm of number of differences of current year from the yearthe firm established) and FCI is export marker (1 for companies with export,otherwise 0).
(2) Managerial entrenchment (MANENT): to measure the managerial entrenchment,principal component analysis (PCA) technique of Lin et al. (2014) was used based onthe following four variables: CEO ownership, CEO duality, board compensation andCEO tenure. Using the PCA, the above said variables of corporate governance aresummarized in a numeric index.
1120
IJPPM67,7

(3) Agency costs (AGENCY): according to Wellalage and Locke (2011), the followingthree indices are used for evaluating agency costs:
SATA ¼ SALES=TA
OESA ¼ OE=SALES
GAESA ¼ GAE=SALES;
where SATA is the asset turnover ratio, OESA is operating costs to sales ratio,GAESA is general and office costs to sales ratio, SALES is sales, TA is total assets,OE is operational costs and GAE is general and office costs.
(4) Overconfidence (OVER): according to Duellman et al. (2015), the ratio of capitalexpenditure to total assets is used to establish managerial overconfidence, such that,if the ratio is higher than the industry median that company suffers from managerialoverconfidence. In such a case, the OVER variable is equal to 1, otherwise 0. In otherwords, the overconfidence variable is used as a marker in the research model.
In order to omit the effect of other variables, which may affect the relationshipbetween independent variables and the dependent ones, the effect of the following variablesis monitored:
• Firm size (SIZE): natural logarithm of total assets.
• The percentage of institutional shareholders (IO): a proportion of total shares, whichare available for institutional shareholders (such as banks, insurances, etc.).
• The percentage of major shareholders (BH): a proportion of shares available forshareholders with more than 5 percent of the company shares.
• Financial leverage (LEV): total debts to total asset ratio.
4. The resultsThe analysis of research hypotheses conducted in descriptive and inferential level. In thedescriptive level, some statistical indices like mean and standard deviation were used and ininferential level, the test of correlation coefficient and regression coefficients were used in RSoftware. Table I displays the descriptive indices of research variable. By comparing themean and median values of innovation index (INNO), we could realize that the statisticaldistribution is skewed to the right side. In other words, the number of companies with a highrate of innovation is extremely less than those with a low rate of innovation. Moreaccurately, most companies have medium or lower than medium innovation rate.
One of the basic hypotheses in regression models is the lack of co-linearity amongdescriptive variables, otherwise the regression coefficients are skewed and this could affectt-test statistics and consequently the test results. Correlation coefficients test could be usedfor this purpose. Correlation coefficients have different types. To evaluate more accurately,both Pearson and Spearman correlation coefficient is used. The former is calculatedaccording to the actual values of variables; while the latter is achieved using the observationranks and is more stable against outlier observations (Table II).
In this table, among the descriptive variables, the Pearson and Spearman correlationcoefficients were shown above and under the main diameter. Based on these coefficients, allcorrelational coefficients, except the correlation coefficient between two variables ofinstitutional ownership and major ownership, were small and less than 0.5. Therefore, if it isassumed that linearity is going to cause a problem among descriptive variables (affect theresults of hypothesis testing), it is due to the linearity between variables of institutional and
1121
Managementcharacteristics

major ownership. To control and evaluate the issue, regression models of the study areestimated once by considering the institutional ownership and once without the variable.The results obtained from the analysis of research hypotheses are presented as follows.
According to the results obtained from Table III, the relationship between managementability (MANABI) and managerial entrenchment (MANENT) and firm innovation issignificant at 0.1 error level (sig.o0.1). However, the relationship between managerialoverconfidence (OVER) and firm innovation is not significant (sig. W0.05). Moreover, fornone of the sales on asset (SATA), operating expenses on sales (OESA) and general andoffice expenses on sales (GAESA) indices do the agency costs have a significant relationshipwith firm innovation (sig. W0.05). Given that, H1 and H2 are accepted, but H3 and H4 isrejected. It is noteworthy that according to the results of F-Limer and Hausman tests, themethod of equal effects was used for estimating the hypothesis model. Further, F-statisticsindicates that all estimated models were significant (sig.o0.1) and only a tiny percentage ofthe variance of the dependent variable is elucidated by the existing descriptive variables inthe model (R2¼ 2 percent). Finally, based on Durbin–Watson statistic, there is no serialcorrelation among model residuals (1.5oDWo2.5).
The results achieved from research model fitting were depicted in Table IV afterremoving the co-linearity. According to the results of F-Limer test, after removingco-linearity, the method of equal effects was also used for research model fitting. As can beseen, after co-linearity removal (setting the IO variable aside), fairly similar results wereachieved, such that the relationship between management ability and managerialentrenchment and firm innovation is significant at 0.1 error level and the relationship ofother independent variables with innovation is not considered as significant (sig. W0.05).Hence, after co-linearity removal, the H1 and H2 are accepted and H3 and H4 are rejected.
5. ConclusionThe main objective of the present study is to evaluate the relationship between some of themanagement characteristics and a firm innovation. The characteristics used in this projectfor management are capability, entrenchment, agency costs and overconfidence. Innovationis the dependent variable of this study, which is measured by the ratio of the number ofletter of appreciation received by the company to the average letter of appreciation of the
Variable Sig. Max. Mean Median Min. SD
Innovation INNO 6/146 1/000 0/612 0/000 1/206Firm efficiency EFFICIENCY 4/959 0/848 0/864 0/007 0/324Firm size SIZE 14/1 14/000 13/800 10/2 1/508Market share MARKETSH 0/812 0/064 0/030 0/000 0/108Free cash flow FCF 1/000 0/859 1/000 0/000 0/349Firm age AGE 4/140 3/530 3/690 2/08 0/419Export marker FCI 1/000 0/968 1/000 0/000 0/176CEO ownership DIROWNER 36/000 0/0799 0/000 0/000 3/461CEO duality DUAL 1/000 0/333 0/000 0/000 0/472CEO compensation COMPEN 11/22 3/240 0/000 0/000 3/547CEO tenure TENURE 7/000 2/670 2/000 1/000 1/542Asset turnover ratio SATA 5/144 0/894 0/781 0/007 0/579Operating expenses to sales ratio OESA 4/472 0/830 0/858 −2/715 0/331General and office expenses to sales ratio GAESA 136/666 0/295 0/060 0/000 4/994Capital expenditure ratio CAPEX 0/283 0/036 0/025 0/000 0/040Percentage of institutional shareholders IO 100/0 70/300 80/700 0/000 27/715Percentage of major shareholders BH 99/5 72/200 77/600 0/000 20/139Financial leverage LEV 6/171 0/655 0/618 0/105 0/389
Table I.Descriptive indices ofresearch variables
1122
IJPPM67,7
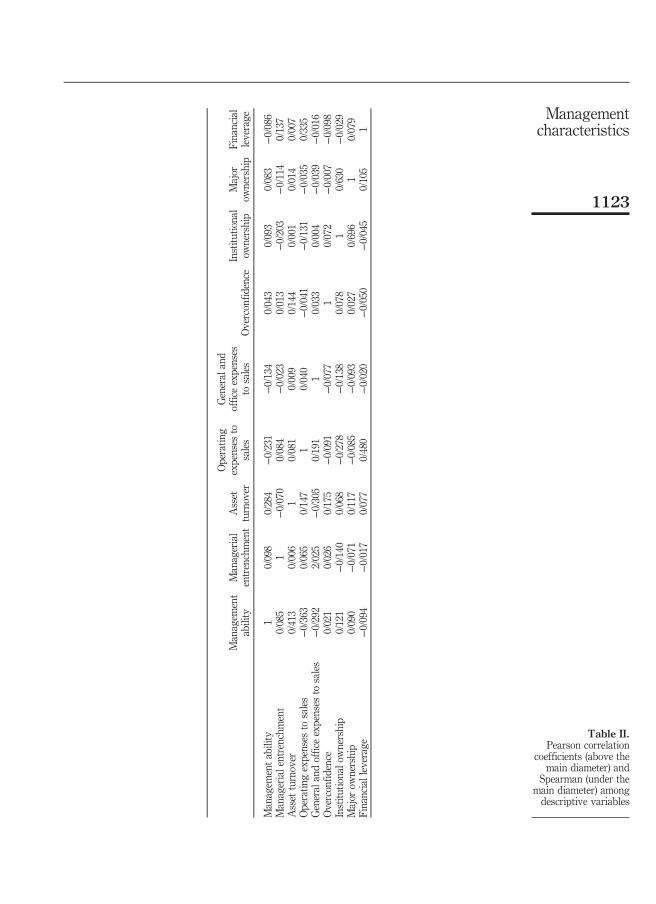
Managem
ent
ability
Managerial
entrenchment
Asset
turnover
Operatin
gexpenses
tosales
General
and
officeexpenses
tosales
Overconfid
ence
Institu
tional
ownership
Major
ownership
Financial
leverage
Managem
entability
10/098
0/284
−0/231
−0/134
0/043
0/093
0/083
−0/086
Managerialentrenchm
ent
0/085
1−0/070
0/084
−0/023
0/013
−0/203
−0/114
0/137
Asset
turnover
0/413
0/006
10/081
0/009
0/144
0/001
0/014
0/007
Operatin
gexpenses
tosales
−0/363
0/065
0/147
10/040
−0/041
−0/131
−0/035
0/335
General
andofficeexpenses
tosales
−0/292
2/025
−0/305
0/191
10/033
0/004
−0/039
−0/016
Overconfid
ence
0/021
0/026
0/175
−0/091
−0/077
10/072
−0/007
−0/098
Institu
tionalo
wnership
0/121
−0/140
0/068
−0/278
−0/138
0/078
10/630
−0/029
Major
ownership
0/090
−0/071
0/117
−0/085
−0/093
0/027
0/696
10/079
Financialleverage
−0/094
−0/017
0/077
0/480
−0/020
−0/050
−0/045
0/105
1
Table II.Pearson correlation
coefficients (above themain diameter) and
Spearman (under themain diameter) amongdescriptive variables
1123
Managementcharacteristics
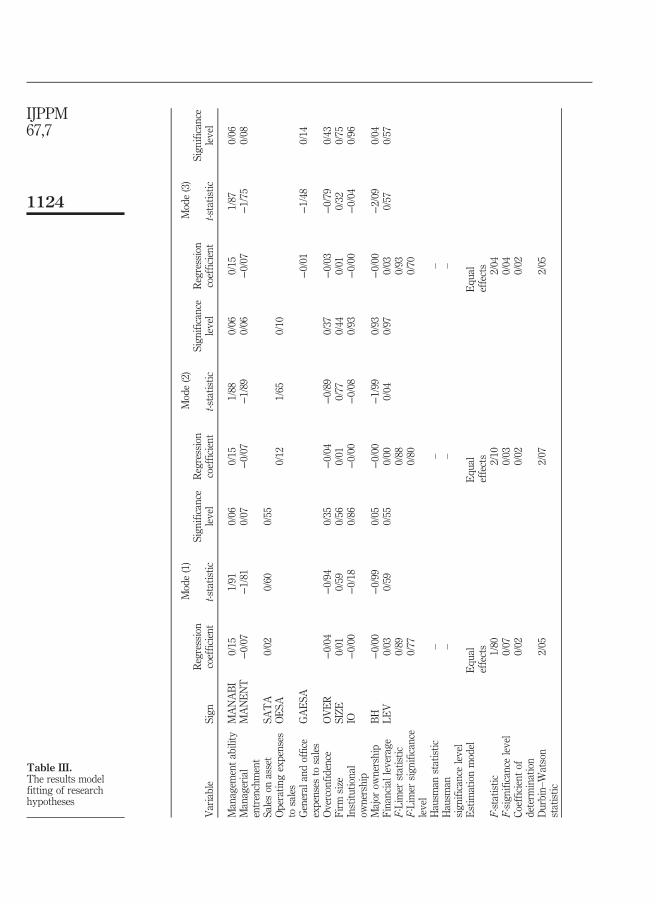
Mode(1)
Mode(2)
Mode(3)
Variable
Sign
Regression
coefficient
t-statistic
Sign
ificance
level
Regression
coefficient
t-statistic
Sign
ificance
level
Regression
coefficient
t-statistic
Sign
ificance
level
Managem
entability
MANABI
0/15
1/91
0/06
0/15
1/88
0/06
0/15
1/87
0/06
Managerial
entrenchment
MANENT
−0/07
−1/81
0/07
−0/07
−1/89
0/06
−0/07
−1/75
0/08
Saleson
asset
SATA
0/02
0/60
0/55
Operatin
gexpenses
tosales
OESA
0/12
1/65
0/10
General
andoffice
expenses
tosales
GAESA
−0/01
−1/48
0/14
Overconfid
ence
OVER
−0/04
−0/94
0/35
−0/04
−0/89
0/37
−0/03
−0/79
0/43
Firm
size
SIZE
0/01
0/59
0/56
0/01
0/77
0/44
0/01
0/32
0/75
Institu
tional
ownership
IO−0/00
−0/18
0/86
−0/00
−0/08
0/93
−0/00
−0/04
0/96
Major
ownership
BH
−0/00
−0/99
0/05
−0/00
−1/99
0/93
−0/00
−2/09
0/04
Financialleverage
LEV
0/03
0/59
0/55
0/00
0/04
0/97
0/03
0/57
0/57
F-Limer
statistic
0/89
0/88
0/93
F-Limer
sign
ificance
level
0/77
0/80
0/70
Hausm
anstatistic
––
–Hausm
ansign
ificancelevel
––
–
Estim
ationmodel
Equ
aleffects
Equ
aleffects
Equ
aleffects
F-statistic
1/80
2/10
2/04
F-sign
ificancelevel
0/07
0/03
0/04
Coefficient
ofdeterm
ination
0/02
0/02
0/02
Durbin–
Watson
statistic
2/05
2/07
2/05
Table III.The results modelfitting of researchhypotheses
1124
IJPPM67,7

Mode(1)
Mode(2)
Mode(3)
variable
Sig.
Regression
coefficient
t-statistic
Sign
ificance
level
Regression
coefficient
t-statistic
Sign
ificance
level
Regression
coefficient
t-statistic
Sign
ificance
level
Managem
entability
MANABI
0/15
1/91
0/06
0/15
1/88
0/06
0/15
1/87
0/06
Managerial
entrenchment
MANENT
−0/07
−1/82
0/07
−0/07
−1/90
0/06
−0/07
−1/75
0/08
Saleson
asset
SATA
0/02
0/59
0/56
Operatin
gexpenses
tosales
OESA
0/12
1/65
0/10
General
andoffice
expenses
tosales
GAESA
−0/01
−1/49
0/14
Overconfid
ence
OVER
−0/04
−0/95
0/34
−0/04
−0/90
0/37
−0/03
−0/80
0/43
Firm
size
SIZE
0/01
0/56
0/58
0/01
0/79
0/43
0/00
0/33
0/74
Institu
tional
ownership
IO
Major
ownership
BH
−0/00
−2/76
0/01
−0/00
−2/67
0/01
−0/00
−2/78
0/01
Financialleverage
LEV
0/03
0/60
0/55
0/00
0/04
0/97
0/03
0/57
0/57
F-Limer
statistic
0/89
0/88
0/92
F-Limer
sign
ificance
level
0/780
0/810
0/72
Hausm
anstatistic
––
–Hausm
ansign
ificancelevel
––
–
Estim
ationmodel
Equ
aleffects
Equ
aleffects
Equ
aleffects
F-statistic
2/06
2/41
2/33
F-sign
ificancelevel
0/05
0/02
0/02
Coefficient
ofdeterm
ination
0/02
0/02
0/02
Durbin–
Watson
statistic
2/05
2/07
2/05
Table IV.The results of model
fitting of researchhypotheses after co-
linearity removal
1125
Managementcharacteristics

related industry. Demerjian et al.’s (2012) model was used to measure the managercapability. In this method, a part of a firm efficiency, which is not expressed by its naturalcharacteristics (including the firm size, market share, free cash flow indicator, firm age andexport indicator), is considered as manager capability. To assess managemententrenchment, according to Lin et al. (2014), we used the analysis of main componentsbased on four variables of CEO ownership, CEO duality, the board compensation and theboard tenure. To measure the agency costs, three variables of asset turnover ratio,operational costs to sales ratio and public and office costs to sales ratio are used. Finally,according to Duellman et al. (2015), capital costs ratio was used to determine the managerialoverconfidence. Moreover, four variables of firm size, the percentage of institutionalshareholders, the percentage of major shareholders and financial leverage were controlled.
The statistical population includes all companies listed in Tehran Stock Exchangeduring 2009–2015 active in “automotive and part” industry, “pharmaceutical ingredients,”“cement, lime, and plaster,” “chemicals,” “foods, except sugar,” “basic metals,” “rubber andplastic,” and “machinery and equipment.” Using the systematic elimination samplingmethod, a number of 125 companies was selected as the sample of the study. The highestfrequency was for “automotive and parts” with 21 companies and the lowest was for“rubber and plastic” and “machinery and equipment,” each with 9 companies.
Most of the required data for calculating research variables were extracted from auditedfinancial statements of companies. This information was collected via Rah Avaran NovinSoftware. However, to extract the information related to the innovation index, we referred toreports of the board activities, which are available at Codal website. The statistical methodused for testing research hypotheses is panel data regression models. In this method, weinitially investigated the statistical distribution normality of the dependent variable andlack of co-linearity among descriptive variables using the Shapiro-Wilk and correlationcoefficient tests. Then, using two other tests, namely, Limer and Hausman the appropriatemethod for estimating each regression model was established and finally, using thesignificance test of regression coefficients and t-statistic we decided whether the hypothesisis confirmed or rejected. All statistical analyses were carried out using the R Software.
To reach the objective of the study, four hypotheses were designed, each of whichdescribes the relationship between one of the independent variables and the dependent one.
The obtained results indicated that there is a significant relationship betweenmanagement ability and the innovation of companies under study, such that regarding thepositive sign of regression coefficient for the variable of management ability (MANABI) itcan be inferred that by the increase of managerial ability the number of awards (as the indexinnovation) is increased, as well. Sariol and Abebe (2017) conducted a study on the effect ofmanagement ability on the type of innovative activities (exploration and exploitation) andfound that powerful CEOs are more prone to pursue explorative innovations, such that apositive relationship exists between CEO power and explorative innovations. Further, theseresults are in line with that of the Custodio et al. (2015), Chen (2014), BarNir (2014), Fitjaret al. (2013), Lampikoski (2012), García-Morales et al. (2012), Vaccaro et al. (2012), Kelley et al.(2011), Salimzadeh et al. (2016), Najafi and Abbasi Menzeh (2015) and Mazloomi et al. (2013).The result of the present paper is in contrast with that of the Boermans and Roelfsema(2013), which assessed the impact of managerial ability on the innovation of Indiancompanies. According to the results achieved from this study, work experience has had nosignificant effect on the innovation of Indian companies. Among the variables of educationalrecord only the one that is related to foreign trade has a significant effect on firm innovation.The reason of difference may be due to the existence of different measurement methods formanagement ability. The study compared has used two indices of experience andeducational record (local/foreign trade), while the present study employed the Demircanmethod for measuring management ability. Based on the results, the increase of managerial
1126
IJPPM67,7
ability could lead to the growth of innovation in companies listed in Tehran StockExchange. Hence, the boards of companies, which are listed in Tehran Stock Exchange andare active in competitive industries should take this point into consideration that theexistence of highly capable managers is one of the factors increasing the innovation of acompany with the aim of reaching high competitive standards.
Moreover, results showed that managerial entrenchment of companies under study has asignificant relationship with the innovation. Regarding the negative sign of regressioncoefficient of managerial entrenchment (MANENT), we could conclude that the increase ofthis variable could attenuate a firm’s innovation.
Amore and Bennedsen (2016) carried out a research on the effect of corporate governanceon environmental innovations. According to their findings, companies with weakgovernance come up with fewer green innovations. Such a negative relationship isstronger between weak corporate governance and green innovation, especially whencompanies have smaller institutional ownership. The results of this study are in line withthat of the present study and the results of Hasan et al. (2015), Chakraborty et al. (2014),Bingxiang et al. (2014), Aghion et al. (2013), Chemmanur and Tian (2013), Driver and Guedes(2012), Humphery-Jenner (2011), Hillier et al. (2011), Dhaoui and Jouini (2011), Xiao (2010) andVaramesh et al. (2014). According to the obtained results, the increase of managerialentrenchment could decrease the innovation of companies listed in Tehran Stock Exchange,significantly. Hence, it is emphasized that the boards of listed companies in Tehran StockExchange, which are active in competitive industries, should benefit from strongercorporate governance mechanisms to prevent profiteer managers. Some managers maypursue their own personal interests by misusing the mechanisms of corporate governanceand adopting anti-control measures instead of dealing with innovative activities.
In addition, based on three variables of asset turnover, operating expense on sales andgeneral and office expenses on sales, there is no significant relationship between agency costand firm innovation.
Such a result is in contrast with that of the O’Connor et al. (2013), who conducted aresearch in the capital market of America and evaluated the sensitivity of research anddevelopment costs compared with the frictions of the financial market. They believed that inthe world with no friction, companies would follow all investment projects with positive netpresent value, so the level of research and development costs is not affected by CEOcompensation. However, in the presence of agency costs, a firm is not able or not willing topursue all investment projects. Therefore, companies with high agency costs incur lessexpense in research and development.
The number of conducted studies on the relationship between agency costs andinnovation is limited and we have no such a research in Iran, so far.
In the end, results showed that the managerial overconfidence in companies under studyhas no significant relationship with the amount of innovation in these companies. Regardingthe negative sign of regression coefficient of overconfidence (OVER), we realized that theincrease of managerial overconfidence would decrease the firm’s innovation. The negativerelationship between managerial overconfidence and innovation in Tehran Stock Exchangeis in contrast with the positive relationship of these two factors in Chinese capital marketreported by Yong-hai (2010). Shanhui et al. (2013), Hirshleifer et al. (2012), Galasso andSimcoe (2011) and Ben-David et al. (2010) have also noticed a positive relationship betweenmanagerial overconfidence and innovation.
The findings of Herz et al. (2014) and Chen et al. (2014) showed that managerialoverconfidence often destroys the value of research and development costs and has anegative effect on innovation. The reason why there is a contrast between the conductedstudies and the present one may be due to the difference between governing terms andconditions of companies listed on the Tehran Stock Exchange and those of other countries.
1127
Managementcharacteristics

According to the obtained results, there is no significant relationship between managerialoverconfidence and innovation in companies listed on the Tehran Stock Exchange. Thus, wemention the active companies in competitive industries that though the presence ofoverconfident managers could improve the performance of their desired companies, itactually has no effect on firm innovation.
References
Abdulai Mahmoud, M. and Hinson, R.E. (2012), “Market orientation, innovation and corporate socialresponsibility practices in Ghana’s telecommunication sector”, Social Responsibility Journal,Vol. 8 No. 3, pp. 327-346.
Aghion, P. and Tirole, J. (1997), “Formal and real authority in organizations”, Journal of PoliticalEconomy, Vol. 105 No. 1, pp. 1-29, available at: www.jstor.org/stable/2138869
Aghion, P., Van Reenen, J. and Zingales, L. (2013), “Innovation and institutional ownership”,The American Economic Review, Vol. 103 No. 1, pp. 277-304.
Ammari, A., Ayed, N.B. and Ellouze, A. (2016), “The interaction between board independence and CEOentrenchment on Tobin’s Q”, International Journal of Business & Economic Strategy, Vol. 4 No. 1,pp. 1-13.
Amore, M.D. and Bennedsen, M. (2016), “Corporate governance and green innovation”, Journal ofEnvironmental Economics and Management, Vol. 75 No. 1, pp. 54-72.
Anderson, N., Potočnik, K. and Zhou, J. (2014), “Innovation and creativity in organizations:a state-of-the-science review, prospective commentary, and guiding framework”, Journal ofManagement, Vol. 40 No. 5, pp. 1297-1333.
Bae, S.C. and Kim, D. (2003), “The effect of R&D investments on market value of firms: evidence fromthe US, Germany, and Japan”, Multinational Business Review, Vol. 11 No. 3, pp. 51-76.
BarNir, A. (2014), “Pre-venture managerial experience and new venture innovation: an opportunitycosts perspective”, Management Decision, Vol. 52 No. 10, pp. 1981-2001.
Ben-David, B.M., Chajut, E. and Algom, D. (2012), “The pale shades of emotion: a signal detectiontheory analysis of the emotional stroop task”, Scientific Research, Vol. 3 No. 7, pp. 537-541,available at: http://dx.doi.org/10.4236/psych.2012.37079
Ben-David, I., Graham, J.R. and Harvey, C.R. (2010), “Managerial miscalibration”, The Quarterly Journalof Economics, Vol. 128 No. 4, pp. 1547-1584, available at: https://doi.org/10.1093/qje/qjt023
Bhagat, S. and Welch, I. (1995), “Corporate research and development investments: internationalcomparisons”, Journal of Accounting and Economics, Vol. 19 Nos 2/3, pp. 443-470.
Bhattacharya, N., Desai, H. and Venkataraman, K. (2013), “Does earnings quality affect informationasymmetry? Evidence from trading costs”, Contemporary Accounting Research, Vol. 30 No. 2,pp. 482-516.
Bigliardi, B. and Galati, F. (2016), “Which factors hinder the adoption of open innovation in SMEs?”,Technology Analysis & Strategic Management, Vol. 28 No. 8, pp. 869-885.
Bingxiang, L., Ying, C. and Yue, L. (2014), “An empirical study on the relationship between managerialentrenchment, R&D investment and corporate governance”, Science Research Management,Vol. 7, p. 13, available at: http://en.cnki.com.cn/Article_en/CJFDTOTAL-KYGL201407013.htm
Boermans, M.A. and Roelfsema, H. (2013), “The effects of managerial capabilities on export, FDIand innovation: evidence from Indian firms”, Asian Business & Management, Vol. 12 No. 4,pp. 387-408.
Chakraborty, A., Rzakhanov, Z. and Sheikh, S. (2014), “Antitakeover provisions, managerialentrenchment and firm innovation”, Journal of Economics and Business, Vol. 72 No. 2, pp. 30-43.
Chang, K., Kang, E. and Li, Y. (2016), “Effect of institutional ownership on dividends: an agency-theory-based analysis”, Journal of Business Research, Vol. 69 No. 7, pp. 2551-2559.
Chemmanur, T.J. and Tian, X. (2013), “Do anti-takeover provisions spur corporate innovation?”, AFA2012 Chicago Meetings Paper.
1128
IJPPM67,7

Chen, H.L. (2014), “Board capital, CEO power and R&D investment in electronics firms”, CorporateGovernance: An International Review, Vol. 22 No. 5, pp. 422-436.
Chen, S.S., Ho, K.Y. and Ho, P.H. (2014), “CEO overconfidence and long-term performance followingR&D increases”, Financial Management, Vol. 43 No. 2, pp. 245-269.
Chouaibi, J., Affes, H. and Boujelbene, Y. (2010), “Characteristics of the board of directors andinvolvement in innovation activities: a cognitive perspective”, International Journal ofManagerial and Financial Accounting, Vol. 2 No. 3, pp. 240-255.
Chu, W.K., Yang, N.T. and Yang, S.Y. (2016), “Corporate governance impact on research anddevelopment”, Journal of Business Research, Vol. 69 No. 6, pp. 2239-2243.
Cumming, D.J. and MacIntosh, J.G. (2000), “The Determinants of R & D Expenditures: a study of theCanadian biotechnology industry”, Review of Industrial Organization, Vol. 17 No. 4, pp. 357-370.
Connolly, R.A. and Hirschey, M. (2005), “Firm size and the effect of R&D on Tobin’s q”,R&D Management, Vol. 35 No. 2, pp. 217-223, available at: https://doi.org/10.1111/j.1467-9310.2005.00384.x
Custodio, C., Ferreira, M.A. and Matos, P.P. (2015), “Do general managerial skills spur innovation?”,ECGI-Finance Working Paper No. 376.
Demerjian, P., Lev, B. and McVay, S. (2012), “Quantifying managerial ability: a new measure andvalidity tests”, Management Science, Vol. 58 No. 7, pp. 1229-1248.
Dhaoui, A. and Jouini, F. (2011), “R&D investment, governance and management entrenchment inFrench companies listed in SBF250”, Journal of Economic and Social Studies, Vol. 1 No. 2,pp. 5-32, doi: 10.2139/ssrn.1677446.
Driver, C. and Guedes, M.J.C. (2012), “Research and development, cash flow, agency and governance:UK large companies”, Research Policy, Vol. 41 No. 9, pp. 1565-1577.
Duellman, S., Hurwitz, H. and Sun, Y. (2015), “Managerial overconfidence and audit fees”, Journal ofContemporary Accounting & Economics, Vol. 11 No. 2, pp. 148-165.
Elyasiani, E. and Zhang, L. (2015), “CEO entrenchment and corporate liquidity management”, Journalof Banking & Finance, Vol. 54 No. 2, pp. 115-128.
Fitjar, R.D., Gjelsvik, M. and Rodríguez-Pose, A. (2013), “The combined impact of managerial andrelational capabilities on innovation in firms”, Entrepreneurship & Regional Development, Vol. 25Nos 5-6, pp. 500-520.
Fooladi, M. and Zaleha, A.S. (2012), “Board directors, audit quality and firm performance:evidence from Malaysia”, National Research & Innovation Conference for Graduate Students inSocial Sciences, Mahkota Hotel, Melaka, December 7-9.
Galasso, A. and Simcoe, T.S. (2011), “CEO overconfidence and innovation”, Management Science,Vol. 57 No. 8, pp. 1469-1484.
Gandhi, S.R., Gierliński, M., Mino, A.,Tanaka, K., Kitamura, E., Clayton, L. and Tanaka, T.U. (2011),“Kinetochore - dependent microtubule rescue ensures their efficient and sustained interactions inearly mitosis”, Developmental Cell: Kinetochore-Dependent Microtubule Rescue, Vol. 21 No. 5,pp. 920-933, doi: 10.1016/j.devcel.2011.09.006.
García-Morales, V.J., Jiménez-Barrionuevo, M.M. and Gutiérrez-Gutiérrez, L. (2012), “Transformationalleadership influence on organizational performance through organizational learning andinnovation”, Journal of Business Research, Vol. 65 No. 7, pp. 1040-1050.
Gibbons, R. and Murphy, K. (1992), “Optimal incentive contracts in the presence of career concerns:theory and evidence”, The Journal of Political Economy, Vol. 100 , June, pp. 468-505.
Gunday, G., Ulusoy, G., Kilic, K. and Alpkan, L. (2011), “Effects of innovation types on firmperformance”, International Journal of Production Economics, Vol. 133 No. 2, pp. 662-676.
Hasan, I., Raymar, S. and Song, L. (2015), “Effects of corporate and country governanceon R&D investment: evidence from emerging markets”, The Singapore Economic Review,Vol. 60 No. 1, pp. 1-17, doi: 10.1142/S0217590815500034.
1129
Managementcharacteristics

Herz, H., Schunk, D. and Zehnder, C. (2014), “How do judgmental overconfidence and overoptimismshape innovative activity?”, Games and Economic Behavior, Vol. 83 No. 1, pp. 1-23.
Hillier, D., Pindado, J., De Queiroz, V. and De La Torre, C. (2011), “The impact of country-level corporategovernance on research and development”, Journal of International Business Studies, Vol. 42No. 1, pp. 76-98.
Hirshleifer, D., Low, A. and Teoh, S.H. (2012), “Are overconfident CEOs better innovators?”, TheJournal of Finance, Vol. 67 No. 4, pp. 1457-1498, available at: https://doi.org/10.1111/j.1540-6261.2012.01753.x
Humphery-Jenner, M. (2011), “Anti-takeover provisions as a source of innovation and value creation”,European Banking Center Discussion Paper No. 2011-009.
Jimenez-Jimenez, D., Sanz Valle, R. and Hernandez-Espallardo, M. (2008), “Fostering innovation: the roleof market orientation and organizational learning”, European Journal of InnovationManagement, Vol. 11 No. 3, pp. 389-412.
Karlsson, C. and Tavassoli, S. (2016), “Innovation strategies of firms: what strategies and why?”,The Journal of Technology Transfer, Vol. 41 No. 6, pp. 1-24.
Kelley, D.J., O’Connor, G.C., Neck, H. and Peters, L. (2011), “Building an organizational capability forradical innovation: the direct managerial role”, Journal of Engineering and TechnologyManagement, Vol. 28 No. 4, pp. 249-267.
Lampikoski, T. (2012), “Green, innovative, and profitable: a case study of managerial capabilities atinterface inc”, Technology Innovation Management Review, Vol. 2 No. 11, pp. 4-12.
Lin, Y.C., Wang, Y.C., Chiou, J.R. and Huang, H.W. (2014), “CEO characteristics and internal controlquality”, Corporate Governance: An International Review, Vol. 22 No. 1, pp. 24-42.
Malmendier, U. and Tate, G. (2005), “CEO overconfidence and corporate investment”, The Journal ofFinance, Vol. 60 No. 6, pp. 2661-2700.
Mazloomi, N., Nasehifar, V. and Ehsanfar, G. (2013), “The relationship between transformationalleadership and organizational innovation in private Iranian insurance companies”, IranianJournal of Insurance Research, Vol. 28 No. 3, pp. 33-56.
Najafi, A. and Abbasi Menzeh, S. (2015), “Evaluation the effect of transformational leadership onorganizational innovation in the Iranian Supreme Audit Court and modeling of their relationshipbased on the model structural equations”, Journal of Strategic Management Studies, Vol. 58,pp. 73-100.
Nicolau, J.L. and Santa-María, M.J. (2013), “The effect of innovation on hotel market value”,International Journal of Hospitality Management, Vol. 32 No. 3, pp. 71-79.
O’Connor, M., Rafferty, M. and Sheikh, A. (2013), “Equity compensation and the sensitivity of researchand development to financial market frictions”, Journal of Banking & Finance, Vol. 37 No. 7,pp. 2510-2519.
Salimzadeh, J., Mahdi Viseh, S., Mohammadi, E. and Abedini, E. (2016), “Evaluation the effect oftransformational leadership on facilitated innovation with the mediator role of innovativeculture in Abadan Oil Refinery”, Journal of Modern Process, Vol. 53, pp. 102-114.
Sariol, A.M. and Abebe, M.A. (2017), “The influence of CEO power on explorative and exploitativeorganizational innovation”, Journal of Business Research, Vol. 73 No. 2, pp. 38-45.
Shanhui, W., Zongjun, W. and Yuan, T. (2013), “The relationship between managerial overconfidenceand technological innovation investment”, Science Research Management, Vol. 5, p. 1.
Sun, Z. (2015), “Technology innovation and entrepreneurial state: the development of China’shigh-speed rail industry”, Technology Analysis & Strategic Management, Vol. 27 No. 6,pp. 646-659.
Vaccaro, I.G., Jansen, J.J., Van Den Bosch, F.A. and Volberda, H.W. (2012), “Management innovationand leadership: the moderating role of organizational size”, Journal of Management Studies,Vol. 49 No. 1, pp. 28-51.
1130
IJPPM67,7
Varamesh, M., Yousefzadeh, N. and Parvaneh, D. (2014), “The relationship between corporategovernance and cash flows and the costs of research and development in companies listed onTehran Stock Exchange”, First National Conference on Economics, Management, andIranian-Islamic Culture, Ardebil City, January 20, available at: www.civilica.com/Paper-VALIASR01-VALIASR01_250.html
Wang, Z. andWang, N. (2012), “Knowledge sharing, innovation and firm performance”, Expert Systemswith Applications, Vol. 39 No. 10, pp. 8899-8908.
Wellalage, N.H. and Locke, S. (2011), “Agency costs, ownership structure and corporate governancemechanisms: a case study in New Zealand unlisted small companies”, Journal of BusinessSystems, Governance and Ethics, Vol. 6 No. 3, pp. 53-65.
Xiao, G. (2010), “International corporate governance and firm innovation”, available at: https://ssrn.com/abstract=1663834; http://dx.doi.org/10.2139/ssrn.1663834 (accessed November 19, 2017).
Yong-hai, Y. (2010), “Executive overconfidence and R&D expenditure – empirical evidence based ondata of small and medium-sized listed companies in China”, 2010 2nd IEEE InternationalConference Information and Financial Engineering, pp. 723-727.
Yuan, S. (2013), “The Role of CEO’s prior experience on innovation: a contingency perspective”,doctoral dissertation, Singapore University, available at: http://scholarbank.nus.edu.sg/handle/10635/49133
Zehir, C., Keskin, H., Tanriverdi, H. and Yasan, A. (2015), “The effects of the structure of the board ofdirectors on the performance of small to medium scale enterprises”, International BusinessResearch, Vol. 8 No. 12, p. 51.
Zhang, W. and Cao, L. (2015), “Family involvement, internal control and agency costs – evidences fromChina’s listed family firms”, Perspectives in Science, Vol. 7, pp. 45-51.
Zhao, X.F. and Wen, J. (2011), “Board of directors governance and technological innovation: theory andevidence”, Modern Economic Science, Vol. 3, p. 17.
Further reading
Hillman, A.J. and Dalziel, T. (2003), “Boards of directors and firm performance: integratingagency and resource dependence perspectives”, Academy of Management Review, Vol. 28 No. 3,pp. 383-396.
Van de Ven, A.H. (1986), “Central problems in the management of innovation”, Management Science,Vol. 32 No. 5, pp. 590-607.
Corresponding authorMahdi Salehi can be contacted at: [email protected]
For instructions on how to order reprints of this article, please visit our website:www.emeraldgrouppublishing.com/licensing/reprints.htmOr contact us for further details: [email protected]
1131
Managementcharacteristics
Improving public sector servicedelivery: a developingeconomy experience
Ebenezer AdakuGraduate School of Business,
Ghana Institute of Management and Public Administration, Accra, GhanaKwasi Amoako-Gyampah
Greensboro Bryan School of Business and Economics,University of North Carolina, North Carolina, USA, and
Seth Nii Anang Lomotey, Charles Teye Amoatey andSamuel Famiyeh
Graduate School of Business,Ghana Institute of Management and Public Administration, Accra, Ghana
AbstractPurpose – The Pension Trust Company (PTC) in Ghana is the sole agency responsible for the managementof the first-tier pension scheme as well as processing of claims submitted by beneficiaries for this scheme.The claim processing system at PTC was wrought with significant delays resulting in severe customerdissatisfaction and hardship to retirees. Hence, a new system – Age 54+ project – was developed to addressthe problems related to claims processing. The purpose of this paper is to report on the efficiency gains fromthe new claim processing system implemented at PTC and to use the philosophies behind the lean operationsconcept to explain the results.Design/methodology/approach – Data for this study were obtained from the benefits systemof PTC for the period 2009–2013. The data consist of a series of benefits processing time for two groups of56,000 claimants – those cleared under the Age 54+ project and those cleared under the old processingsystem. The processes of the two claim processing systems were analysed and their processingtimes compared.Findings – The new system – Age 54+ – decreased the average processing time for new claims by20 per cent. The new system is a simple approach which is driven by a “Let’s Start in Time” idea.Originality/value – The operations management literature suggests that process redesign approaches andthe implementation of continuous improvement techniques represent mechanisms for achieving performanceimprovements at governmental agencies. This study shows and discusses the redesign of a social securityscheme process using a lean operation concept of waste elimination method and application of kanban todeliver performance improvement.Keywords Ghana, Social security, Claim processing time, Lean systemsPaper type Research paper
1. IntroductionThe Ghana National Pension Act of 2008 (Act 766) stipulates a contributory three-tier pensionscheme consisting of: a mandatory basic national social security scheme; a mandatoryoccupational pension scheme; and finally, a voluntary provident fund and personal pensionscheme. In Ghana, the agency responsible for the collection of contributions and the paymentof retirement benefits under the first-tier scheme – basic national social security scheme – isthe Pension Trust Company (PTC). The second- and third-tier schemes – occupational pensionscheme and the provident fund scheme, respectively – are usually privately managed bytrustees approved by boards of organisations. This study therefore focuses on the socialsecurity scheme which is managed by PTC as it appears to be challenged by unduly longerclaim processing time.
International Journal ofProductivity and PerformanceManagementVol. 67 No. 7, 2018pp. 1132-1146© Emerald Publishing Limited1741-0401DOI 10.1108/IJPPM-05-2017-0129
Received 26 May 2017Revised 14 September 2017Accepted 21 September 2017
The current issue and full text archive of this journal is available on Emerald Insight at:www.emeraldinsight.com/1741-0401.htm
1132
IJPPM67,7
Quarto trim size: 174mm x 240mm

Globally the importance of social security and pension schemes cannot beoveremphasised as they provide two important functions within societies: a source offunds, for possible borrowing, for development initiatives and a source of income forretirees. Social security and pension schemes provide important sources of finance for boththe public and private sectors in most countries. PTC makes available to the Government ofGhana long-term loans for the financing of current and capital expenditures for nationaldevelopment. Social security schemes also serve as mechanisms by which individuals in theworkforce are assured of some level of income when they retire from the workforce. In mostsocial security systems, the contributions received from current contributors are, usually,used to provide benefits to those who are retired with the expectation that futurecontributions will also be available to support those in the workforce at that time.Consequently, Whitaker (1998) notes that it would be ideal if every member of a communitycould be protected by social security as that fosters solidarity.
Dorfman and Palacios (2012) opine that pensions and social insurance programs aim toprevent a substantial loss in consumption power as a result of old age, disability or deathand hence form an integral part of any social protection system. Rofman and Oliveri (2012)also argue that social security schemes are programs instituted by nations to transfer theresponsibility of social risks (disabilities, old age, victim of natural disasters, among others)to the state where the informal or traditional systems of social protection are insufficient ornot working properly. The PTC in Ghana is a governmental organisation and as such isfraught with inefficiencies, especially in claims processing.
Given, the benefit of social security schemes, the issue of delays in processing benefits ofclaimants or beneficiaries remains a problem, especially in most developing countries.Undue delays in benefits processing undermine the objective of social security schemes asthe claimants or beneficiaries get worse off socially and economically by such delays. PTC,in Ghana, over a long time had a problem of bad image due to delays in claim processing.Therefore, the question of interest, in this study, is whether the implementation ofoperations management (OM) lean principles and tools such as kanban and single-minuteexchange of die (SMED) can be used to bring efficiencies in the processes of governmentalorganisations. Hence, a project – Age 54+ project, based on the broad concepts of wasteelimination, standardisation, accountability and visibility (Hill, 2012) – was implemented bythe Trust to address the problem of delays and the attendant customer dissatisfaction.Consequently, this study seeks to compare the claim processing times under twoscenarios – the old claim processing system and the Age 54+ project.
The rest of the paper is organised as follows. We first provide a background of the socialsecurity scheme in Ghana and provide a brief reference on other schemes in developedcountries. Second, the theoretical background of the lean principle, which informs the Age54+ approach, is provided with special focus on public sector organisations. We then presentan analysis of the general claim processing structure at PTC. This is followed by adescription of the structure of the Age 54+ project processing system. The method andresults of the study are then presented and discussed. The study then ends with conclusionsand managerial implications for further improvement of the claim processing at PTC.
2. Social security scheme in GhanaSocial security schemes are available in most countries – both developing and developedcountries though the extent of coverage varies in both developing and developed countries.The social security legislation in Ghana was enacted in 1965 (Asibuo, 1976). The emergenceof the system was precipitated by the change in the socio-economic structure inGhana – reflected in establishment of industries, urbanisation, rural-urban migration, rapidpopulation growth and the spread of formal education – that followed the attainment ofindependence from colonial rule in 1957. Boon (2007) observed that before the institution of a
1133
Improvingpublic sector
servicedelivery

formal social security system in Ghana, the indigenous Ghanaian society had a traditionalform of social protection. The traditional form of social security, in Ghana, had been basedon the extended family system as well as one’s children to address risks from disability,sickness, loss of a key bread winner of a household, old age and victims of natural disasters.However, with the advent of globalisation, the Ghanaian society is getting westernised.An impact of this is a gradual and systematic disintegration of the extended familystructure which had been relied upon to provide the traditional social security, and thus,necessitating the need for other means of attaining social protection (Boon, 2007).
The shift away, largely, from the extended family structure to a more formal and publicregulated system in respect of social protection has been in operation for some decades nowin Ghana. However, this formal and regulated social protection system also has somesetbacks. For example, the levels of social security benefits, in Ghana, are not usuallyconnected to the prevailing economic conditions, hence, creating economic challenges forretirees. This primarily is explained by the poor and unstable macro-economic environmentand conditions in the country. The macro-economic conditions usually get worse to theextent that annual adjustments to benefits of retirees rarely provide equal andcommensurate compensations for depreciated benefits of retirees. Besides, from ademographic standpoint, the social security pension scheme in Ghana should not be indistress and must provide better benefits to retirees as the ratio of contributors tobeneficiaries stands at 40:1 (Atabugum, 1997). However, poor investment decisions by theTrust which are underpinned by political interferences coupled with the volatile economicsituation in Ghana explain the financial distress of the Trust and the disconnect between thelevels of social security benefits and the prevailing economic conditions.
In some developed countries such as Britain and New Zealand, the social securityschemes cover almost every citizen and apply to most risks. However, in Ghana, eventhough under the Provisional National Defence Council law 247, workers in both the formaland informal sectors are permitted to be part of the scheme, the scheme is largely subscribedby workers in the formal sector and covers only such contingencies as old age, invalidity,death and survivors’ benefits. Ghana has two social security schemes running concurrently– the PTC scheme and the government scheme (CAP 30). The CAP 30 scheme is funded bythe consolidated funds of the government and is targeted towards military and policeofficers and others in the security agencies (Kumado and Gockel, 2003). Under the PTCscheme, employee and employer contributions are 5.5 and 13 per cent, respectively. Theannual indexation method is the main approach for adjusting the levels of pensions paid inGhana and the Trust operates with a retirement age of 60 years.
3. The lean principle in public service organisationsMost public organisations, under the pressures of myriad stakeholders and theirexpectations, have struggled to achieve efficiency in their operations (Corrigan and Joyce,2000; Radnor and McGuire, 2004; Greiling, 2005). Historically, public services seem to belower on the ladder of efficiency relative to their counterparts in the private sector. This isbecause, for a very long time, most providers of public services have not faced the threat ofcompetition. Usually the patrons of public services are more or less captive users with littleor no choice of providers. This situation makes most public service organisations to be moresupplier driven than customer driven. And very often there are no performance metrics toguide behaviour and decision making However, recent deregulation policies in publicservices – healthcare, insurance, banking, etc. – coupled with pressures on publicexpenditures have made it imperative for managers of public service organisations toconstantly search for new and better ways of driving productivity upward while at the sametime ensuring effectiveness in meeting the needs of citizens (Lenk, 2002; Karwan andMarkland, 2006). For example, in the UK, the government has introduced reforms that
1134
IJPPM67,7

permit patients to choose where they go for medical treatments with provisions made tofollow patients with funding (Bhatia and Drew, 2006). Similarly, in Ghana, with theestablishment of the National Health Insurance Scheme in 2003, many private medicalinstitutions have been admitted to the scheme and thus provide choices for patients.
The challenges in public services and how OM principles could be used to address themhave not received much attention in OM literature. Slack et al. (2004) indicate that the gapbetween research and practice is very wide, particularly as related to the provision of publicservices, even though the share of public services in respect of gross domestic products ofcountries is significant. Hence, the application and development of OM theories to guidemanagers of public service organisations will be beneficial.
In this study, we demonstrate, using a detailed case study, how OM lean principles canbe used to ensure operational efficiency and effectiveness in the execution of the socialsecurity scheme service in Ghana.
Customers nowadays desire more from their service providers: high-quality services,efficient and reliable delivery, reasonable cost, etc. This brings to the fore the importance ofvalue creation in a supplier–customer relationship.
The fundamental thrust of lean thinking is “value” (Womack and Jones, 1996, 2003;Atkinson, 2004). Womack and Jones (2003) define “value” as the ability to deliver a productand service a customer wants with minimal time between the moment the customer asks forthe product or service and the actual delivery at an acceptable price. Hence, “value” can alsobe simply defined as the difference between expected benefit of a product or service and itscost. Value then is optimised, especially from customers’ perspective, when the margin ofdifference between benefit and cost is increased. Associated with the concept of value is, ofcourse, waste elimination where waste refers to anything that does not add value to thecustomer or client. In the case of claim processing at PTC, delays which are usuallyassociated with frequent visits to PTC offices by claimants reduce the margin of differencebetween the expected benefits of the service and the cost of it and hence take away fromvalue and lead to waste. Thus, the aim of lean is achieved, in an operating system, byeliminating waste which includes reducing process time and simplifying operations(Womack et al., 1990; Seth and Gupta, 2005; Bhatia and Drew, 2006). The presence of wastein an operation reduces the value creation effort. Russell and Taylor (1999) and Taj andMorosan (2011) define waste as anything other than the minimum amount of equipment,effort, materials, part, space and time that are needed to add value to a product or service.The principle of lean rests on some critical pillars or underlying assumptions without whichit is difficult to make lean work. Radnor and Boaden (2008) and Radnor and Osborne (2013)indicate these critical pillars as:
• specifying the value desired by the customer;
• identifying the value stream for each product or service providing that value andchallenging all of the wasteful steps;
• making the product or service flow continuously;
• introducing pull between all steps where continuous flow is impossible; and
• managing towards perfection in order to ensure that the number of steps and theamount of time and information needed to serve the customer continually falls.
Fulfilling these underlying assumptions and achieving the aim of lean require theemployment of lean methods and a toolkit. Russell and Taylor (1999) and Radnor (2010)indicate these methods and toolkits, among others, as:
• Kaizen.
• 5S (Sort, Straighten, Shine, Standardise and Sustain).
1135
Improvingpublic sector
servicedelivery
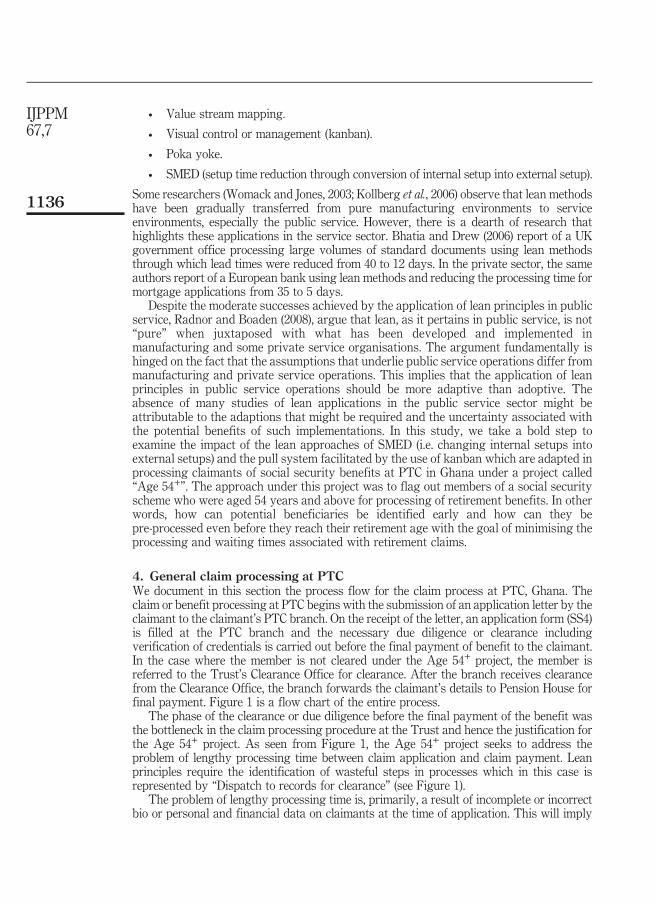
• Value stream mapping.
• Visual control or management (kanban).
• Poka yoke.
• SMED (setup time reduction through conversion of internal setup into external setup).
Some researchers (Womack and Jones, 2003; Kollberg et al., 2006) observe that lean methodshave been gradually transferred from pure manufacturing environments to serviceenvironments, especially the public service. However, there is a dearth of research thathighlights these applications in the service sector. Bhatia and Drew (2006) report of a UKgovernment office processing large volumes of standard documents using lean methodsthrough which lead times were reduced from 40 to 12 days. In the private sector, the sameauthors report of a European bank using lean methods and reducing the processing time formortgage applications from 35 to 5 days.
Despite the moderate successes achieved by the application of lean principles in publicservice, Radnor and Boaden (2008), argue that lean, as it pertains in public service, is not“pure” when juxtaposed with what has been developed and implemented inmanufacturing and some private service organisations. The argument fundamentally ishinged on the fact that the assumptions that underlie public service operations differ frommanufacturing and private service operations. This implies that the application of leanprinciples in public service operations should be more adaptive than adoptive. Theabsence of many studies of lean applications in the public service sector might beattributable to the adaptions that might be required and the uncertainty associated withthe potential benefits of such implementations. In this study, we take a bold step toexamine the impact of the lean approaches of SMED (i.e. changing internal setups intoexternal setups) and the pull system facilitated by the use of kanban which are adapted inprocessing claimants of social security benefits at PTC in Ghana under a project called“Age 54+”. The approach under this project was to flag out members of a social securityscheme who were aged 54 years and above for processing of retirement benefits. In otherwords, how can potential beneficiaries be identified early and how can they bepre-processed even before they reach their retirement age with the goal of minimising theprocessing and waiting times associated with retirement claims.
4. General claim processing at PTCWe document in this section the process flow for the claim process at PTC, Ghana. Theclaim or benefit processing at PTC begins with the submission of an application letter by theclaimant to the claimant’s PTC branch. On the receipt of the letter, an application form (SS4)is filled at the PTC branch and the necessary due diligence or clearance includingverification of credentials is carried out before the final payment of benefit to the claimant.In the case where the member is not cleared under the Age 54+ project, the member isreferred to the Trust’s Clearance Office for clearance. After the branch receives clearancefrom the Clearance Office, the branch forwards the claimant’s details to Pension House forfinal payment. Figure 1 is a flow chart of the entire process.
The phase of the clearance or due diligence before the final payment of the benefit wasthe bottleneck in the claim processing procedure at the Trust and hence the justification forthe Age 54+ project. As seen from Figure 1, the Age 54+ project seeks to address theproblem of lengthy processing time between claim application and claim payment. Leanprinciples require the identification of wasteful steps in processes which in this case isrepresented by “Dispatch to records for clearance” (see Figure 1).
The problem of lengthy processing time is, primarily, a result of incomplete or incorrectbio or personal and financial data on claimants at the time of application. This will imply
1136
IJPPM67,7
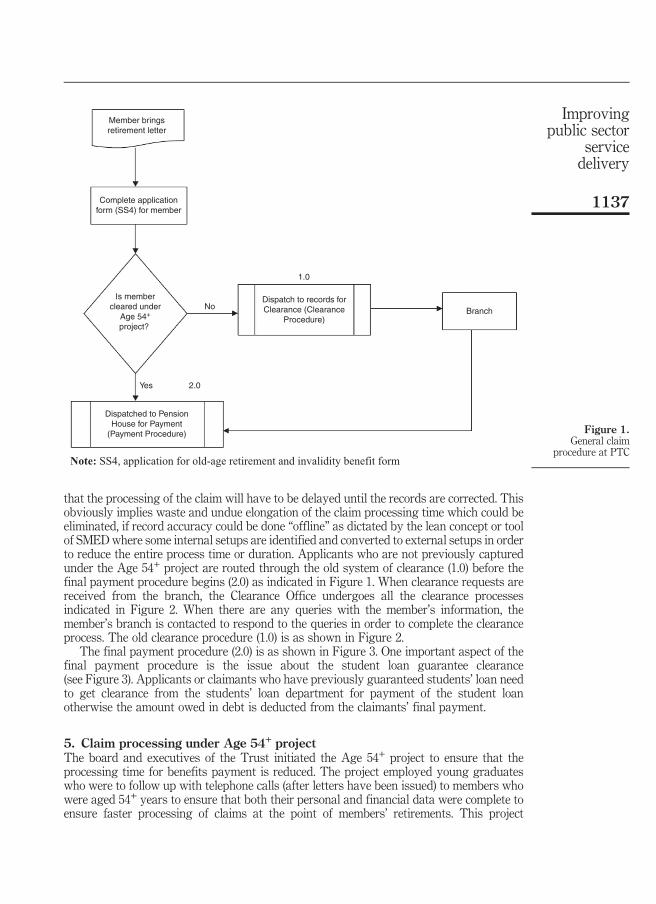
that the processing of the claim will have to be delayed until the records are corrected. Thisobviously implies waste and undue elongation of the claim processing time which could beeliminated, if record accuracy could be done “offline” as dictated by the lean concept or toolof SMED where some internal setups are identified and converted to external setups in orderto reduce the entire process time or duration. Applicants who are not previously capturedunder the Age 54+ project are routed through the old system of clearance (1.0) before thefinal payment procedure begins (2.0) as indicated in Figure 1. When clearance requests arereceived from the branch, the Clearance Office undergoes all the clearance processesindicated in Figure 2. When there are any queries with the member’s information, themember’s branch is contacted to respond to the queries in order to complete the clearanceprocess. The old clearance procedure (1.0) is as shown in Figure 2.
The final payment procedure (2.0) is as shown in Figure 3. One important aspect of thefinal payment procedure is the issue about the student loan guarantee clearance(see Figure 3). Applicants or claimants who have previously guaranteed students’ loan needto get clearance from the students’ loan department for payment of the student loanotherwise the amount owed in debt is deducted from the claimants’ final payment.
5. Claim processing under Age 54+ projectThe board and executives of the Trust initiated the Age 54+ project to ensure that theprocessing time for benefits payment is reduced. The project employed young graduateswho were to follow up with telephone calls (after letters have been issued) to members whowere aged 54+ years to ensure that both their personal and financial data were complete toensure faster processing of claims at the point of members’ retirements. This project
Member bringsretirement letter
Complete applicationform (SS4) for member
Is membercleared under
Age 54+
project?
Note: SS4, application for old-age retirement and invalidity benefit form
Dispatch to records forClearance (Clearance
Procedure)
Dispatched to PensionHouse for Payment
(Payment Procedure)
BranchNo
Yes 2.0
1.0
Figure 1.General claim
procedure at PTC
1137
Improvingpublic sector
servicedelivery
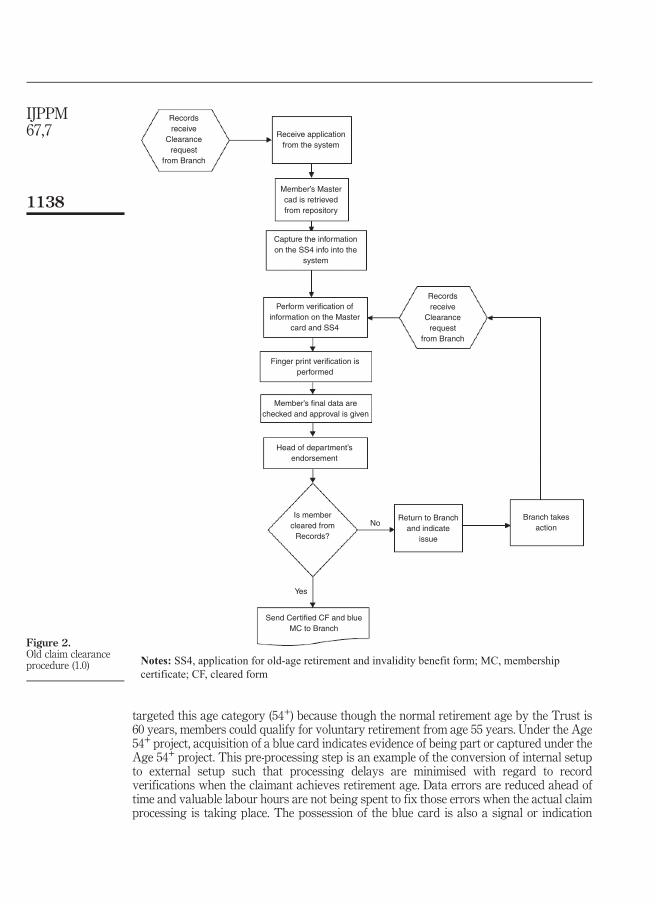
targeted this age category (54+) because though the normal retirement age by the Trust is60 years, members could qualify for voluntary retirement from age 55 years. Under the Age54+ project, acquisition of a blue card indicates evidence of being part or captured under theAge 54+ project. This pre-processing step is an example of the conversion of internal setupto external setup such that processing delays are minimised with regard to recordverifications when the claimant achieves retirement age. Data errors are reduced ahead oftime and valuable labour hours are not being spent to fix those errors when the actual claimprocessing is taking place. The possession of the blue card is also a signal or indication
Recordsreceive
Clearancerequest
from Branch
Recordsreceive
Clearancerequest
from Branch
Receive applicationfrom the system
Member’s Mastercad is retrievedfrom repository
Capture the informationon the SS4 info into the
system
Perform verification ofinformation on the Master
card and SS4
Finger print verification isperformed
Member’s final data arechecked and approval is given
Head of department’sendorsement
Is membercleared from
Records?
Return to Branchand indicate
issue
Branch takesaction
Send Certified CF and blueMC to Branch
Yes
No
Notes: SS4, application for old-age retirement and invalidity benefit form; MC, membershipcertificate; CF, cleared form
Figure 2.Old claim clearanceprocedure (1.0)
1138
IJPPM67,7

(i.e. kanban principle) that the claimant is ready to be processed for retirement benefits.The procedure for the acquisition of the blue card is as shown in Figure 4.
In order to expedite the overall claim processing time, the Trust’s system flags allmembers who turn 54 years at a particular time. These individuals are subsequentlywritten to by the Trust to initiate the blue card acquisition process. This prior clearance (inboth personal and financial data) through the blue card acquisition is essential to ensurethat by age 60 when the claimant applies for the benefits, the time required for the finalpayment to be made is considerably reduced. Again, this approach represents anapplication of the lean “kanban” system where further work in a process is visuallyindicated or signalled for prompt action to the end that waste is eliminated, and speedgained in the service delivery. Hence, by this system, a “pull” rather than a “push” systemis being encouraged by the Trust. Besides, the introduction of the Age 54+ project – sideby side with the old claim processing system – is an attempt to improve on the old claim
Capture file to the system
Check for Bio and financialdata
Send file to ComputationDepartment
Financial Data are extracted,Checklist prepared and
approved
A payment activity isgenerated
Computation is verified tocheck for accuracy
The Payroll system is updatedfor the month to include newpensioners based on banks
Receive claimfile fromBranch
Send file to student loans forclearance
Treasure and Accountsdepartment are informed tosend payments to the banksfor the individual accounts to
be credited
Figure 3.Final payment
procedure
1139
Improvingpublic sector
servicedelivery

processing system. Conceptually, the design is similar to Disneyworld’s fast pass systemwhere customers issued with a fast pass jump to the front of a queue when the appointedtime on the fast pass arrives.
6. Data and methodThe data for this study were obtained from the benefits system of PTC, Ghana, for theperiod 2009–2013. Given that the data are from one organisation, this might be considered acase study. However, as a paradigm, this study falls in the realm of a quantitative study asopposed to an interpretivist case study. At the same time, the data came from the archived
Is memberon Branch’sAge 54+ list
for the year?
No
Yes
Check for thevalidity of SSNO
Is SSNO formember?
No No
YesYes
No
Yes
Complete SS1Cfor member
CompleteDummy for
member
Send CF updatesto Records for
Clearance
Is membercleared
fromRecords?
No Return to Branchand indicate
issues
Branch takesaction
YesBranch works on
Financial Data andStudent Loan Issue
(If any)
Send Certified CFand blue MC to
Branch
Member is given his/her bluecard
Register member
Find SSNO formember
Are member’sSSNO and DOBand DJS on file?
Is memberregistered?
Add member toBranch’s List
Memberwalks to
PTC Officeor written toby the Trustto initiateprocess
Notes: SSNO, social security number; DOB, date of birth; DJS, date joined scheme; SS1C,membership information update and application for membership certificate form; CF, clearedform; MC, membership certificate
Figure 4.Blue card acquisitionprocedure
1140
IJPPM67,7

records of the organisation. Given that organisations in developing countries are often notwilling to share their records with researchers, the unit of analysis is the processing of claim.Even though the Age 54+ project commenced in 2003, data were available only from 2009 to2013. The data consist of a series of benefits processing times for two groups of 56,000claimants – those cleared under the Age 54+ project and those cleared under the oldprocessing system. Descriptive statistics involving the mean benefits processing time, theminimum and maximum processing times and standard deviations were computed andcompared for the two groups of benefits processing times. To visually ascertain theincreasing or decreasing pattern of claim processing times under the two different scenarios,trend graphs were employed. Box plots were constructed to visually ascertain the normalityor skewness of the distribution of the processing times of claimants under the Age 54+
project and those under the old processing system.Furthermore, a statistical test of difference in samples to ascertain whether or not there is
a significant difference between the benefits processing time of claimants cleared under theAge 54+ project and those under the old processing system was performed. The hypothesesof the study are indicated as follows:
H0. There is no significant difference in the benefits processing time of claimants clearedunder the Age 54+ project.
H1. There is a significant difference in the benefits processing time of claimants clearedunder the Age 54+ project.
7. ResultsThe Age 54+ project was implemented to reduce the processing time between claimlodgement date and claim payment date by correcting problems associated with bothpersonal and financial data on contributors. That is to say, mistakes and omissions inrespect of contributors’ personal and financial data are identified and fixed prior to theactual processing task when the contributor reaches the retirement age.
Descriptive analysesThe claims processed for claimants cleared under the Age 54+ project were 41,600, whereasthose processed under the old processing system were 14,400 for the five-year period from2009 to 2013. The moderate difference in data size between the Age 54+ and the oldprocessing systems is largely explained by the goal of the new claim processingsystem – Age 54+. There was an ambitious and aggressive goal to rapidly transform theclaim processing system of the Trust by deploying the Age 54+ system. However, since thedata sizes for both systems are relatively large, normality in the distribution of data isaddressed and any potential biases or skewness significantly minimised. Table I presentssome descriptive statistics of the processing time of claims for claimants cleared under theAge 54+ project and those cleared under the old processing system.
As seen from Table I, the Age 54+ project appears to have relatively reduced theamount of variations in the claim processing time (57 days) as compared to the processingtime under the old system (73 days). Besides, the maximum possible time for processing a
Claimant category Min (days) Mean (days) SD (days) Max (days)
Cleared under Age 54+ 3 73 57 854Old processing system 7 91 73 1,482
Table I.Descriptive statistics
of the processingtimes of the two
scenarios
1141
Improvingpublic sector
servicedelivery
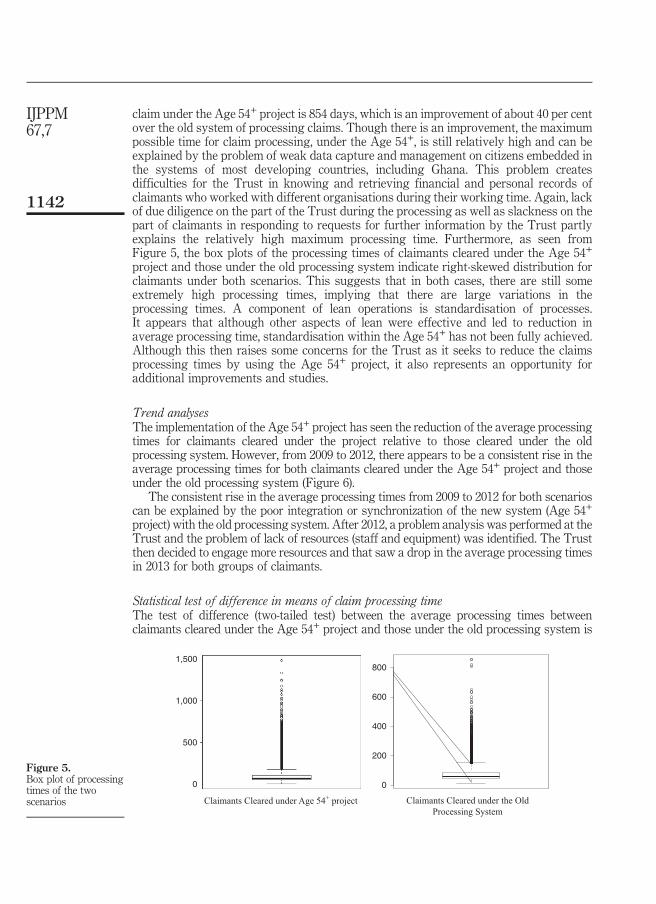
claim under the Age 54+ project is 854 days, which is an improvement of about 40 per centover the old system of processing claims. Though there is an improvement, the maximumpossible time for claim processing, under the Age 54+, is still relatively high and can beexplained by the problem of weak data capture and management on citizens embedded inthe systems of most developing countries, including Ghana. This problem createsdifficulties for the Trust in knowing and retrieving financial and personal records ofclaimants who worked with different organisations during their working time. Again, lackof due diligence on the part of the Trust during the processing as well as slackness on thepart of claimants in responding to requests for further information by the Trust partlyexplains the relatively high maximum processing time. Furthermore, as seen fromFigure 5, the box plots of the processing times of claimants cleared under the Age 54+
project and those under the old processing system indicate right-skewed distribution forclaimants under both scenarios. This suggests that in both cases, there are still someextremely high processing times, implying that there are large variations in theprocessing times. A component of lean operations is standardisation of processes.It appears that although other aspects of lean were effective and led to reduction inaverage processing time, standardisation within the Age 54+ has not been fully achieved.Although this then raises some concerns for the Trust as it seeks to reduce the claimsprocessing times by using the Age 54+ project, it also represents an opportunity foradditional improvements and studies.
Trend analysesThe implementation of the Age 54+ project has seen the reduction of the average processingtimes for claimants cleared under the project relative to those cleared under the oldprocessing system. However, from 2009 to 2012, there appears to be a consistent rise in theaverage processing times for both claimants cleared under the Age 54+ project and thoseunder the old processing system (Figure 6).
The consistent rise in the average processing times from 2009 to 2012 for both scenarioscan be explained by the poor integration or synchronization of the new system (Age 54+
project) with the old processing system. After 2012, a problem analysis was performed at theTrust and the problem of lack of resources (staff and equipment) was identified. The Trustthen decided to engage more resources and that saw a drop in the average processing timesin 2013 for both groups of claimants.
Statistical test of difference in means of claim processing timeThe test of difference (two-tailed test) between the average processing times betweenclaimants cleared under the Age 54+ project and those under the old processing system is
1,500
1,000
500
0
Claimants Cleared under Age 54+ project Claimants Cleared under the OldProcessing System
0
200
400
600
800
Figure 5.Box plot of processingtimes of the twoscenarios
1142
IJPPM67,7
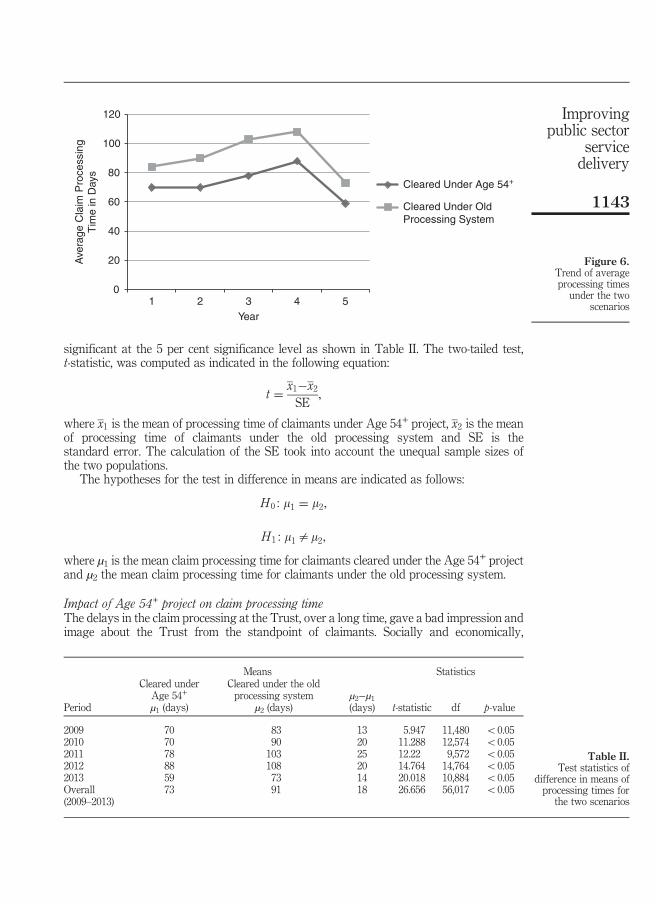
significant at the 5 per cent significance level as shown in Table II. The two-tailed test,t-statistic, was computed as indicated in the following equation:
t ¼ x1�x2SE
;
where x1 is the mean of processing time of claimants under Age 54+ project, x2 is the meanof processing time of claimants under the old processing system and SE is thestandard error. The calculation of the SE took into account the unequal sample sizes ofthe two populations.
The hypotheses for the test in difference in means are indicated as follows:
H 0 : m1 ¼ m2;
H 1 : m1am2;
where µ1 is the mean claim processing time for claimants cleared under the Age 54+ projectand µ2 the mean claim processing time for claimants under the old processing system.
Impact of Age 54+ project on claim processing timeThe delays in the claim processing at the Trust, over a long time, gave a bad impression andimage about the Trust from the standpoint of claimants. Socially and economically,
0
20
40
60
80
100
120
1 2 3 4 5
Ave
rage
Cla
im P
roce
ssin
gT
ime
in D
ays
Year
Cleared Under Age 54+
Cleared Under OldProcessing System
Figure 6.Trend of averageprocessing times
under the twoscenarios
Means Statistics
Period
Cleared underAge 54+
µ1 (days)
Cleared under the oldprocessing system
µ2 (days)µ2−µ1(days) t-statistic df p-value
2009 70 83 13 5.947 11,480 o0.052010 70 90 20 11.288 12,574 o0.052011 78 103 25 12.22 9,572 o0.052012 88 108 20 14.764 14,764 o0.052013 59 73 14 20.018 10,884 o0.05Overall(2009–2013)
73 91 18 26.656 56,017 o0.05
Table II.Test statistics of
difference in means ofprocessing times for
the two scenarios
1143
Improvingpublic sector
servicedelivery

claimants who have their benefits payment delayed as a result of the lengthy claimprocessing period become worse off economically. Such claimants, basically, have to rely ontheir little personal savings before retirement or fall on family members (including children)for upkeep before the payment of benefits by the Trust. However, with the introduction ofthe Age 54+ project, the claim processing time at the Trust was reduced for the same timeperiod of 2009–2013. Generally, from 2009 to 2013, the average claim processing time underthe Age 54+ project stands at 73 days compared to 91 days under the old processing system.This indicates a 20 per cent time savings under the Age 54+ project as compared to the oldprocessing system. At the same time, it is worthy to note that prior to the implementation ofthe Age 54+, the average processing time was 120 days (Social Security and NationalInsurance Trust, 2001), thus, the 73 days processing time represents a reduction of 47 days(i.e. 39 per cent). This reduction in processing time is highly significant and can lead to animprovement in customer satisfaction. Also, the Age 54+ project appears to havecontributed in improving on the performance of the old processing system by reducing theaverage processing time for that system from 120 to 91 days as of 2013, representing a24 per cent reduction. This improvement in the average processing time under the oldprocessing system can be explained by the absorption of pressure on the old claimprocessing system by the Age 54+ project. In other words, the efficiency of the Age 54+
project in a way eased the pressure on the available resources (labour, equipment, etc.) of theTrust and improved its capacity. This is a significant benefit in that often, processimprovement assessments fail to recognise the synergistic benefits that accrue fromimprovement projects. Furthermore, the productivity of the Age 54+ project relative to theold processing system is reflected in the higher number of claims (41,600) cleared under it ascompared to the claim (14,400) cleared under the old processing system for the same timeperiod 2009–2013. Again, from Table II, the p-values for all the mean processing times forthe years 2009–2013 are all less than 0.05. Hence, the test of difference in mean processingtimes is significant and H1 is supported. The observed data suggest a positive result of theproject as claimants cleared under the Age 54+ project relatively have shorter claimprocessing time.
8. Discussion and conclusionsThis study sought to ascertain, if the implementation of a process improvement project at apublic sector organisation in a developing country led to efficiency and productivity gainsand further to use the lean operations principles as a lens to decipher how and why theimprovements occurred. The project had a single objective of having the data (personal andfinancial) of all contributors to the Trust –with age 54 years and above – cleansed before theretirement age of 60 years so as to reduce the overall claim processing time from the date oflodgement of claim to the payment date. This adjustment in the claims process is akin to thelean concept of converting internal setups into external setups (i.e. SMED) in order to reducethe overall process time. Also, the Trust not waiting until the age of retirement beforeprocessing of retirement benefits begins but flagging and signalling members who are aged54 and above for prior processing indicates “a pull” instead of “a push” principle (i.e.kanban). This has the potential of eliminating waste and ensuring speed in claim processing.The cleansing of the data was aimed at eliminating or reducing data processing errors whenpeople feel rushed to perform activities. The evidence of having completed the Age 54+
project process is a possession of a “blue card”which is required to be submitted to a benefitofficer at the time of application for retirement benefits. With regard to lean concepts, the“blue card” represents a kanban system, in that it signals the readiness of the claimsprocessing task to accept the new claim being presented. The Age 54+ project is a simple buteffective way of responding to the excessive delays, which also represents waste accordingto lean principles, in benefits processing at the Trust. The project did not involve a drastic
1144
IJPPM67,7
change in the operation of the Trust with respect to claim processing. The philosophy whichunderpins the project is basically a “Let’s Start in Time” idea and “Let’s Reduce or Eliminateerrors prior to the Start of the Claim”. This has, on the average, reduced the claim processingtime at the Trust by 20 per cent compared to the old processing system as of 2013.
The savings of 20 per cent in the claim processing time by the Age 54+ project is asignificant accomplishment. However, there exists more potential to consolidate the gainsand to further ensure savings in the claim processing time. The success of ensuringfurther savings in the claim processing time would largely depend on improvements indata (personal and financial) capturing and management on citizens or employees which isusually a weakness embedded in developing countries’ systems. Again, such datacapturing and management systems would be beneficial, if they are digital based. Whatcould potentially help in further ensuring savings is an establishment of an onlineplatform which mediates the interactions between claimants and the Trust on aco-processing principle. Obviously, the problem of illiterates and semi-literate contributorsof the Trust poses a challenge. However, such as system has with it an advantage ofdemand management improvement by having the literate contributors as co-processorswhile the illiterate and semi-literate contributors are handled by the existing physicalinteraction system. Besides, collaboration between the Trust and human resourcedepartments and managers of organisations who have members contributing to the Trustcould further ensure more efficiency with the claim processing time. Such collaborationcould manifest in the form of education on benefits processing by personnel of the Trustfor human resource staffs as well as data and information sharing between the Trust andhuman resource departments of organisations.
References
Asibuo, S. (1976), “The evolution and administration of social security in Ghana”, unpublished MPAthesis, School of Administration, University of Ghana.
Atabugum, R. (1997), “Investment of pension funds: the case of PTC (1991–1995)”, unpublished MPAthesis, School of Administration, University of Ghana.
Atkinson, P. (2004), “Creating and implementing lean strategies”, Management Services, Vol. 48 No. 2,pp. 18-33.
Bhatia, N. and Drew, J.J. (2006), “Applying lean production to the public sector”, The McKinseyQuarterly: The Online Journal of McKinsey & Co, Vol. 3 No. 1, pp. 1-5.
Boon, E.K. (2007), “Knowledge systems and social security in Africa: a case study on Ghana”, in Boon, E.K.and Hens, L. (Eds), Indigenous Knowledge Systems and Sustainable Development: Relevance forAfrica, Kamla-Raj Enterprises, Delhi, pp. 63-76.
Corrigan, P. and Joyce, P. (2000), “Reconnecting to the public”, Urban Studies, Vol. 37 No. 10,pp. 1771-1779.
Dorfman, M. and Palacios, R. (2012), “World bank support for pensions and social security”, SocialProtection and Labor Discussion Paper No. 1208, The World Bank, Washington, DC.
Greiling, D. (2005), “Performance measurement in the public sector: the German experience”,International Journal of Productivity and Performance Management, Vol. 54 No. 7, pp. 551-567.
Hill, A.V. (2012),The Encyclopedia of OperationsManagement, Pearson Education, Upper Saddle River, NJ.
Karwan, K.R. and Markland, R.E. (2006), “Integrating service design principles and informationtechnology to improve delivery and productivity in public sector operations: the case of theSouth Carolina DMV”, Journal of Operations Management, Vol. 24 No. 4, pp. 347-362.
Kollberg, B., Dahlgaard, J.J. and Brehmer, P.-O. (2006), “Measuring lean initiatives in health careservices: issues and findings”, International Journal of Productivity and PerformanceManagement, Vol. 56 No. 1, pp. 7-24.
Kumado, K. and Gockel, A. (2003), A Study on Social Security in Ghana, Trades Union Congress, Accra.
1145
Improvingpublic sector
servicedelivery

Lenk, K. (2002), “Electronic service delivery: a driver of public sector modernization”, InformationPolity: The International Journal of Government and Democracy in the Information Age, Vol. 7Nos 2/3, pp. 87-96.
Radnor, Z. and Boaden, R. (2008), “Editorial: lean in public services – panacea or paradox?”,Public Money & Management, Vol. 28 No. 1, pp. 3-7.
Radnor, Z. and McGuire, M. (2004), “Performance management in the public sector: fact or fiction?”,International Journal of Productivity and Performance Management, Vol. 53 No. 3, pp. 245-260.
Radnor, Z. and Osborne, S.P. (2013), “Lean: a failed theory for public services?”, Public ManagementReview, Vol. 15 No. 2, pp. 265-287.
Radnor, Z.J. (2010), Review of Business Process Improvement Methodologies in Public Services,Advanced Institute of Management, London.
Rofman, R. and Oliveri, M.L. (2012), Pension Coverage in Latin America: Trends and Determinants,World Bank, Washington, DC.
Russell, R.S. and Taylor, B.W. (1999), Operations Management, 2nd ed., Prentice Hall, Upper SaddleRiver, NJ.
Seth, D. and Gupta, V. (2005), “Application of value stream mapping for lean operations and cycle timereduction: an Indian case study”, Production Planning & Control, Vol. 16 No. 1, pp. 44-59.
Slack, N., Lewis, M. and Bates, H. (2004), “The two worlds of operations management research andpractice”, International Journal of Operations and Production Management, Vol. 24 No. 4,pp. 372-387.
Social Security and National Insurance Trust (2001), “Monthly pensions report”, Social Security andNational Insurance Trust, Accra.
Taj, S. and Morosan, C. (2011), “The impact of lean operations on the Chinese manufacturingperformance”, Journal of Manufacturing Technology Management, Vol. 22 No. 2, pp. 223-240.
Whitaker, T. (1998), Principles of Social Security Financing, International Labour Office, Geneva.Womack, J.P. and Jones, D.T. (1996), Lean Thinking: Banish Waste and Create Wealth in Your
Corporation, Simon and Schuster, New York, NY.Womack, J.P. and Jones, D.T. (2003), Lean Thinking, Simon & Schuster, New York, NY.Womack, J.P., Jones, D.T. and Roos, D. (1990), The Machine that Changed the World, Rawson
Associates, New York, NY.
Corresponding authorEbenezer Adaku can be contacted at: [email protected]
For instructions on how to order reprints of this article, please visit our website:www.emeraldgrouppublishing.com/licensing/reprints.htmOr contact us for further details: [email protected]
1146
IJPPM67,7
Impact of workplace bullying onemployee outcomes: a study ofIndian managerial employees
Arpana Rai and Upasna AgarwalDepartment of Organization Behavior and Human Resource Management,
National Institute of Industrial Engineering (NITIE), Mumbai, India
AbstractPurpose – The purpose of this paper is to examine the impact of workplace bullying on innovative workbehavior and neglect with defensive silence as a mediator. The study further examines if the presence offriendship networks in the workplace can weaken the negative impact of workplace bullying.Design/methodology/approach – Data were collected through self-report questionnaires from 835full-time Indian managerial employees working in different Indian organizations.Findings – Results revealed that workplace bullying negatively related to innovative work behavior andpositively related to neglect. Defensive silence mediated bullying–outcomes relationships and effects ofworkplace bullying on proposed outcomes were weaker in the presence of high workplace friendship.Research limitations/implications – A cross-sectional design and use of self-reported questionnaire dataare few limitations of this study.Originality/value – The study extended the current research stream of workplace bullying to one of theunderrepresented developing Asian countries, India. The study also contributes in terms of its samplecharacteristics as it covers managerial employees working across different organizations.Keywords Defensive silence, Neglect, Workplace bullying, Indian managers, Workplace friendship,Innovative workplace behaviourPaper type Research paper
IntroductionWhile the focus on positive leadership dominates leadership research, a recent stream ofresearch under the label of “supervisory behavior” has shown a growing interest in the“dark side” of leadership (Schyns and Schilling, 2013, p. 138). One form of destructiveleadership behavior that is found to be widely prevalent in workplaces and has far-reachingimpacts on employees and organizations is workplace bullying (Einarsen et al., 2007; Schynsand Schilling, 2013). Workplace bullying – a form of interpersonal mistreatment – is definedas a situation in which an employee feels constantly and persistently subjected to negativebehaviors by others at work (Einarsen et al., 2011), mostly by someone at supervisoryposition (D’Cruz and Rayner, 2013; Lutgen-Sandvik et al., 2005). Workplace bullying isreported to occur on a regular basis in workplaces, with a prevalence estimated at11–18 percent (Nielsen et al., 2010) and where as much as 80 percent of the cases involve asuperior in the role as the alleged bully (Einarsen et al., 2003; Lutgen-Sandvik et al., 2007).A burgeoning amount of literature is available on outcomes of workplace bullying; bullyingis related to a wide range of employee outcomes like high intention to quit, absenteeism, loworganizational citizenship behavior, low task performance, job dissatisfaction, workdisengagement, low organizational commitment, depression, post-traumatic stress andpsychosomatic complaints) (Laschinger and Fida, 2014; Nielsen and Einarsen, 2012;Samnani and Singh, 2012). However, the literature examining the bullying–outcomesrelationship has some gaps that require further research.
A major oversight of studies examining the bullying–outcomes relationship is thatextant research has repeatedly focused on a restricted group of variables and hascompletely overlooked other important variables as outcomes of workplace bullying
International Journal ofProductivity and Performance
ManagementVol. 67 No. 7, 2018
pp. 1147-1170© Emerald Publishing Limited
1741-0401DOI 10.1108/IJPPM-05-2017-0109
Received 7 May 2017Revised 21 September 2017
13 November 2017Accepted 28 December 2017
The current issue and full text archive of this journal is available on Emerald Insight at:www.emeraldinsight.com/1741-0401.htm
1147
Workplacebullying
Quarto trim size: 174mm x 240mm

(Rai and Agarwal, 2016). For instance, innovative work behavior is one important employeeoutcome that has not been examined in the context of workplace bullying. Engaging indiscretionary behaviors like innovative work behaviors is amongst the most importantemployee contributions that is critical for determining organizational productivity andperformance (Agarwal, 2014; Agarwal et al., 2012). Similarly, limited efforts have beendirected toward examining the impact of workplace bullying on employee neglect despite itscrippling effects on organizations worldwide in terms of lost productivity and performance(Bennett and Robinson, 2003). There is ample empirical evidence suggesting that leader’sbehavior (interpersonal treatment) plays an important role in determining employees’discretionary workplace behaviors (Podsakoff et al., 2000; Yidong and Xinxin, 2013) as wellas deviant behavior (Gils et al., 2015; Mitchell and Ambrose, 2007); thus, it would be ofinterest to both researchers and practitioners to understand how bullying impacts employeeinnovative work behaviors and neglect. Building on the conservation of resources (COR)theory (Hobfoll, 2001), we argue that bullying triggers a resource loss process and as anattempt to conserve their resources, employees may lapse into low innovative workbehaviors and high neglect.
Another major oversight of studies examining the bullying–outcomes relationship is thatthe majority of studies have investigated the direct relationships between bullying and itsoutcomes (Rai and Agarwal, 2016). Little is known about why workplace bullying has theimpact that it does have and what factors are capable of mitigating the harmful effects ofworkplace bullying (Kakarika et al., 2017; Park and Ono, 2016; Rai and Agarwal, 2017a;Salin and Notelaers, 2017; Tuckey and Neall, 2014). One of the critical defining features ofworkplace bullying is power imbalance (Einarsen et al., 2011) which has been primarilyconceptualized as being derived from the perpetrator’s organizational position (Aquino andThau, 2009; Einarsen et al., 2011; Hoel and Cooper, 2001). Extant literature on destructiveleadership behavior (e.g. abusive supervisor, workplace bullying, Cole et al., 2016) suggeststhat victims of mistreatment become silent because of the fear of negative repercussionsassociated with speaking up as most of such acts are perpetrated by someone in asupervisory position (Aquino et al., 2006; Milliken et al., 2003; Pinder and Harlos, 2001).Drawing on the COR theory, we argue that bullying fosters employee silence (defensivesilence) and the inability to express their ideas/discontent can take a psychological toll onemployees (Cortina and Magley, 2003; Perlow and Williams, 2003) draining their resources(Xu et al., 2015) and resulting in undesirable attitudes and behaviors (Dedahanov et al., 2016;Festinger, 1957; Morrison and Milliken, 2000; Whiteside and Barclay, 2013).
Research suggests that getting support from different sources can serve as a buffer forreducing the negative effects of workplace mistreatment (Duffy et al., 2002; Kim et al., 2015).Employees of an organization not only interact with their supervisors but also with theircolleagues with whom they form friendship bonds. Workplace relationships, especiallywith coworkers (workplace friendship), constitute a major resource pool for employees(Chang et al., 2016; Chen et al., 2013; Halbesleben, 2006; Methot et al., 2016). In line with the“cross-domain buffer hypothesis” which suggests that support from one domain(e.g. workplace friendship-colleagues) may buffer the negative consequences of themistreatment from another domain (e.g. workplace bullying-supervisors) (Duffy et al., 2002;Wu and Hu, 2009), this study aims to examine workplace friendship as a moderator of thebullying–outcomes relationship. Qualitative studies on victims of workplace bullying havealso shown that friendships at work can alleviate the negative effects of bullying (D’Cruzand Noronha, 2011; Rai and Agarwal, 2017b). Figure 1 represents our hypothesized model.
The present study contributes to the extant literature in several ways. First, drawinginsights from COR theory (Hobfoll, 2001), this study contributes to workplace bullyingliterature by examining workplace bullying as a barrier to employee innovative workbehaviors and booster of employee neglect. Second, focusing on one of the crucial defining
1148
IJPPM67,7

feature of workplace bullying, i.e. power imbalance, this study examines defensive silence asan underlying mechanism in the bullying–outcomes relationship. Third, this studydemonstrates the interrelationships between resources across contexts and investigates themitigating role of workplace friendship in the bullying–outcomes relationship. This studyalso contributes in terms of its sample that focuses on managerial employees as well as itscontext as it extends a Western-centric literature to the Indian (Asian) context. Given thatthe managerial workforce plays a key role in the growth of an organization and makesimportant economic contributions to an organization (Quick et al., 2002; Nelson and Cooper,2007), we believe that a study exploring the factors that negatively impact managers ismuch needed.
The study has been organized as follows. The next section presents thetheoretical background and hypotheses development. The methodology and resultssections present details about the study sample, the measures used in the study,the data analyses performed and the main findings. The final section discusses theimplications for both theory and practice, the limitations of the research and the directionsfor future research.
Theoretical background and hypotheses developmentThe COR theory has been widely used to explain the outcomes of destructive leadership(Carlson et al., 2012; Harris et al., 2007; Lee and Brotheridge, 2006; Tuckey and Neall, 2014;Wheeler et al., 2010; Whitman et al., 2014; Xu et al., 2015). According to the COR theory,people have both an innate and a learned drive to obtain, retain and protect resourceswhich come in the form of objects, personal characteristics, conditions and energies(Hobfoll, 1989; Hobfoll and Freedy, 1993). Central to the COR theory are two key tenets,which consist of resource conservation and resource acquisition (Ng and Feldman, 2012)and are based on the idea that resource losses are more salient than gains, andonce resource loss occurs, individuals may struggle to conserve and protect their resourcereservoirs (Hobfoll, 2001). According to the COR theory, workplace bullying triggersa resource loss process (Tuckey and Neall, 2014) and as an attempt to protect theirresources, employees may take up defensive positions, i.e. they may withdraw themselvesfrom any efforts that are resource consuming (Hobfoll, 1989, 2001; Kiazad et al., 2014;Wheeler et al., 2010) or may even use neglect strategies to protect resources (Byrne et al.,2014; Hobfoll, 1989, 2001; Penney et al., 2011). In the following sections, building on theCOR theory, we explain the workplace bullying–outcomes (innovative work behavior andneglect) relationship. We then introduce defensive silence as a mediator and workplacefriendship as a moderator.
Defensive Silence
Innovative WorkBehaviorWorkplace
BullyingNeglect
Workplace Friendship
Note: Dotted line represents the moderating effects of workplace friendship on the workplacebullying–outcomes relationship
Figure 1.Hypothesized model
1149
Workplacebullying
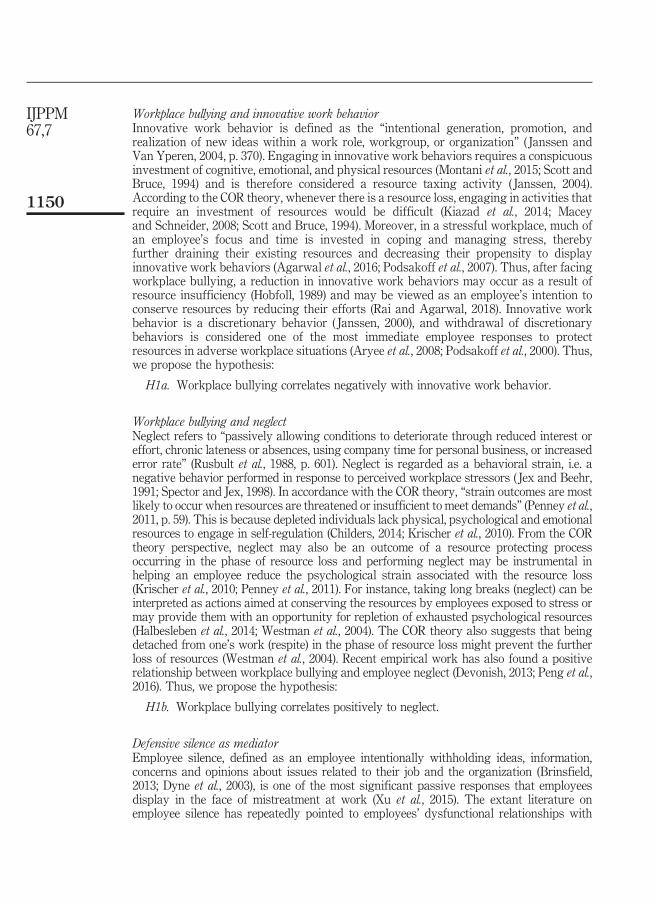
Workplace bullying and innovative work behaviorInnovative work behavior is defined as the “intentional generation, promotion, andrealization of new ideas within a work role, workgroup, or organization” ( Janssen andVan Yperen, 2004, p. 370). Engaging in innovative work behaviors requires a conspicuousinvestment of cognitive, emotional, and physical resources (Montani et al., 2015; Scott andBruce, 1994) and is therefore considered a resource taxing activity ( Janssen, 2004).According to the COR theory, whenever there is a resource loss, engaging in activities thatrequire an investment of resources would be difficult (Kiazad et al., 2014; Maceyand Schneider, 2008; Scott and Bruce, 1994). Moreover, in a stressful workplace, much ofan employee’s focus and time is invested in coping and managing stress, therebyfurther draining their existing resources and decreasing their propensity to displayinnovative work behaviors (Agarwal et al., 2016; Podsakoff et al., 2007). Thus, after facingworkplace bullying, a reduction in innovative work behaviors may occur as a result ofresource insufficiency (Hobfoll, 1989) and may be viewed as an employee’s intention toconserve resources by reducing their efforts (Rai and Agarwal, 2018). Innovative workbehavior is a discretionary behavior ( Janssen, 2000), and withdrawal of discretionarybehaviors is considered one of the most immediate employee responses to protectresources in adverse workplace situations (Aryee et al., 2008; Podsakoff et al., 2000). Thus,we propose the hypothesis:
H1a. Workplace bullying correlates negatively with innovative work behavior.
Workplace bullying and neglectNeglect refers to “passively allowing conditions to deteriorate through reduced interest oreffort, chronic lateness or absences, using company time for personal business, or increasederror rate” (Rusbult et al., 1988, p. 601). Neglect is regarded as a behavioral strain, i.e. anegative behavior performed in response to perceived workplace stressors ( Jex and Beehr,1991; Spector and Jex, 1998). In accordance with the COR theory, “strain outcomes are mostlikely to occur when resources are threatened or insufficient to meet demands” (Penney et al.,2011, p. 59). This is because depleted individuals lack physical, psychological and emotionalresources to engage in self-regulation (Childers, 2014; Krischer et al., 2010). From the CORtheory perspective, neglect may also be an outcome of a resource protecting processoccurring in the phase of resource loss and performing neglect may be instrumental inhelping an employee reduce the psychological strain associated with the resource loss(Krischer et al., 2010; Penney et al., 2011). For instance, taking long breaks (neglect) can beinterpreted as actions aimed at conserving the resources by employees exposed to stress ormay provide them with an opportunity for repletion of exhausted psychological resources(Halbesleben et al., 2014; Westman et al., 2004). The COR theory also suggests that beingdetached from one’s work (respite) in the phase of resource loss might prevent the furtherloss of resources (Westman et al., 2004). Recent empirical work has also found a positiverelationship between workplace bullying and employee neglect (Devonish, 2013; Peng et al.,2016). Thus, we propose the hypothesis:
H1b. Workplace bullying correlates positively to neglect.
Defensive silence as mediatorEmployee silence, defined as an employee intentionally withholding ideas, information,concerns and opinions about issues related to their job and the organization (Brinsfield,2013; Dyne et al., 2003), is one of the most significant passive responses that employeesdisplay in the face of mistreatment at work (Xu et al., 2015). The extant literature onemployee silence has repeatedly pointed to employees’ dysfunctional relationships with
1150
IJPPM67,7
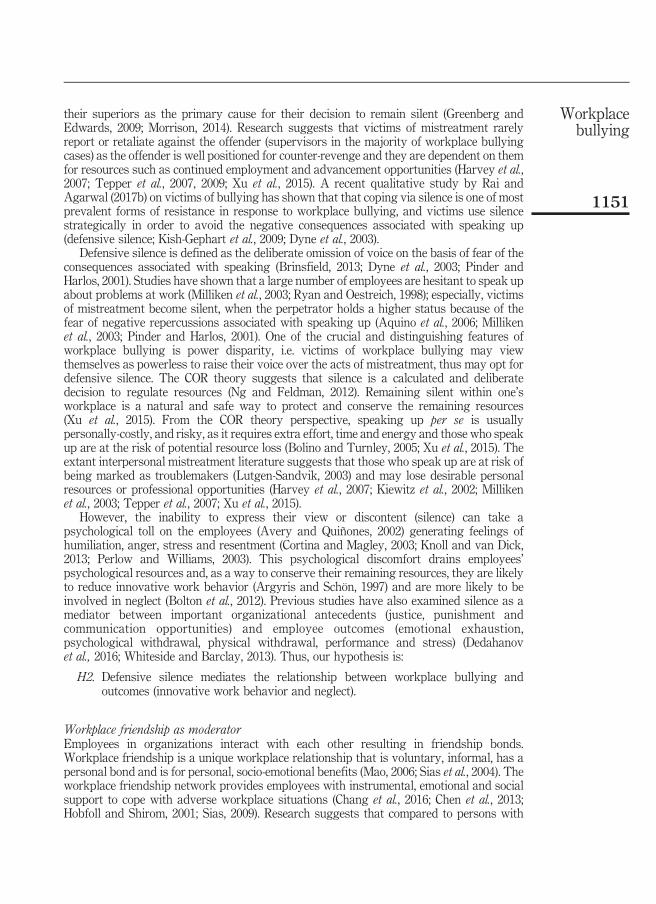
their superiors as the primary cause for their decision to remain silent (Greenberg andEdwards, 2009; Morrison, 2014). Research suggests that victims of mistreatment rarelyreport or retaliate against the offender (supervisors in the majority of workplace bullyingcases) as the offender is well positioned for counter-revenge and they are dependent on themfor resources such as continued employment and advancement opportunities (Harvey et al.,2007; Tepper et al., 2007, 2009; Xu et al., 2015). A recent qualitative study by Rai andAgarwal (2017b) on victims of bullying has shown that that coping via silence is one of mostprevalent forms of resistance in response to workplace bullying, and victims use silencestrategically in order to avoid the negative consequences associated with speaking up(defensive silence; Kish-Gephart et al., 2009; Dyne et al., 2003).
Defensive silence is defined as the deliberate omission of voice on the basis of fear of theconsequences associated with speaking (Brinsfield, 2013; Dyne et al., 2003; Pinder andHarlos, 2001). Studies have shown that a large number of employees are hesitant to speak upabout problems at work (Milliken et al., 2003; Ryan and Oestreich, 1998); especially, victimsof mistreatment become silent, when the perpetrator holds a higher status because of thefear of negative repercussions associated with speaking up (Aquino et al., 2006; Millikenet al., 2003; Pinder and Harlos, 2001). One of the crucial and distinguishing features ofworkplace bullying is power disparity, i.e. victims of workplace bullying may viewthemselves as powerless to raise their voice over the acts of mistreatment, thus may opt fordefensive silence. The COR theory suggests that silence is a calculated and deliberatedecision to regulate resources (Ng and Feldman, 2012). Remaining silent within one’sworkplace is a natural and safe way to protect and conserve the remaining resources(Xu et al., 2015). From the COR theory perspective, speaking up per se is usuallypersonally-costly, and risky, as it requires extra effort, time and energy and those who speakup are at the risk of potential resource loss (Bolino and Turnley, 2005; Xu et al., 2015). Theextant interpersonal mistreatment literature suggests that those who speak up are at risk ofbeing marked as troublemakers (Lutgen-Sandvik, 2003) and may lose desirable personalresources or professional opportunities (Harvey et al., 2007; Kiewitz et al., 2002; Millikenet al., 2003; Tepper et al., 2007; Xu et al., 2015).
However, the inability to express their view or discontent (silence) can take apsychological toll on the employees (Avery and Quiñones, 2002) generating feelings ofhumiliation, anger, stress and resentment (Cortina and Magley, 2003; Knoll and van Dick,2013; Perlow and Williams, 2003). This psychological discomfort drains employees’psychological resources and, as a way to conserve their remaining resources, they are likelyto reduce innovative work behavior (Argyris and Schön, 1997) and are more likely to beinvolved in neglect (Bolton et al., 2012). Previous studies have also examined silence as amediator between important organizational antecedents (justice, punishment andcommunication opportunities) and employee outcomes (emotional exhaustion,psychological withdrawal, physical withdrawal, performance and stress) (Dedahanovet al., 2016; Whiteside and Barclay, 2013). Thus, our hypothesis is:
H2. Defensive silence mediates the relationship between workplace bullying andoutcomes (innovative work behavior and neglect).
Workplace friendship as moderatorEmployees in organizations interact with each other resulting in friendship bonds.Workplace friendship is a unique workplace relationship that is voluntary, informal, has apersonal bond and is for personal, socio-emotional benefits (Mao, 2006; Sias et al., 2004). Theworkplace friendship network provides employees with instrumental, emotional and socialsupport to cope with adverse workplace situations (Chang et al., 2016; Chen et al., 2013;Hobfoll and Shirom, 2001; Sias, 2009). Research suggests that compared to persons with
1151
Workplacebullying

poor support systems, persons who feel supported can cope more effectively with stressfulsituations (stress-buffering hypothesis; Sloan, 2012, p. 7).
Friendship/coworker support has been treated as a resource in the COR theory (Hobfoll,1989). The COR theory suggests that availability of a resource in one distinct context cancompensate for another resource that has been drained in a separate context (Hobfoll, 1989;Bordia et al., 2014). As one of the critical actors in the workplace, coworkers with whomemployees share friendship bonds may provide psychological resources like emotionalsupport to employees by listening to their problems, being friendly and showing concernand empathy for their difficulties (Chiaburu and Harrison, 2008; Sloan, 2012). This emotionalsupport is likely to be helpful in reducing the stress caused by negative supervisorytreatment (Kim et al., 2015) and energize employees to restrain the depletion of theirresources and offset their emotional withdrawal from work (Lakey and Cohen, 2000; Lamet al., 2010; Tyler and Burns, 2008; Van Emmerik et al., 2007). More specifically, thefriendship network is considered a backstage resource that provides a mechanism tominimize distress (Lazarus and Folkman, 1984; Lazega and Pattison, 1999) by providingaccess to supportive interactions, which serve as outlets for individuals to disclose andmanage emotions (Methot et al., 2016). These support interactions provide feelings ofemotional energy and cognitive liveliness which reduce the exhaustion caused by negativeworkplace interactions (Hobfoll and Shirom, 2001; Methot et al., 2016) and contribute to apositive sense of self and increase individuals’ motivation to overcome the challenges(Hobfoll, 2002). Based on the cross-domain buffering perspective, previous studies have alsorevealed the moderating role of coworker support on the relationship between supervisorymistreatment and employee outcomes (Chiu et al., 2015; Duffy et al., 2002; Ilies et al., 2011;Hobman et al., 2009; Wu and Hu, 2009). Thus, we propose that:
H3. Workplace friendship moderates the workplace bullying and outcomes relationshipsuch that the positive and negative relationships between workplace bullying andoutcomes are weaker for employees with high workplace friendship than those withlow workplace friendship.
MethodologySampleThe study sample comprised 835 managerial employees working in different Indianorganizations. The sample consisted of 81 percent males with a mean age of 32 years(SD¼ 8) and a mean organizational tenure of 8.7 years (SD¼ 7.7). The participants wereemployed in a diverse range of sectors including manufacturing, utility, aviation, retail andtrade, information technology, telecommunications and consulting. In all, 30.8 percent of therespondents were from junior-level management, 60.2 percent of the respondents were frommiddle-level management and the others (9 percent) were senior management employees.
Study procedureBased on the classification of organizations on job portals (naukri.com, indeed, iimjobs.com),around 50 organizations located in and around India’s three major cities – Mumbai,Bangalore and Pune – were invited to participate. These cities were chosen to facilitaterepeated visits for data collection and the follow-up survey. An e-mail containing the studyobjectives and data collection procedures was sent to HR departments of the selectedorganizations. A total of 11 organizations agreed to survey their employees. Theorganizations involved were: two automobile manufacturing companies (Mumbai, Pune);two electricity utility companies (Mumbai, Pune); one gear manufacturing company (Pune);one tire manufacturing company (Mumbai); one civil aviation company (Mumbai); oneonline fashion retail company (Bangalore); one telecommunications company (Mumbai); one
1152
IJPPM67,7
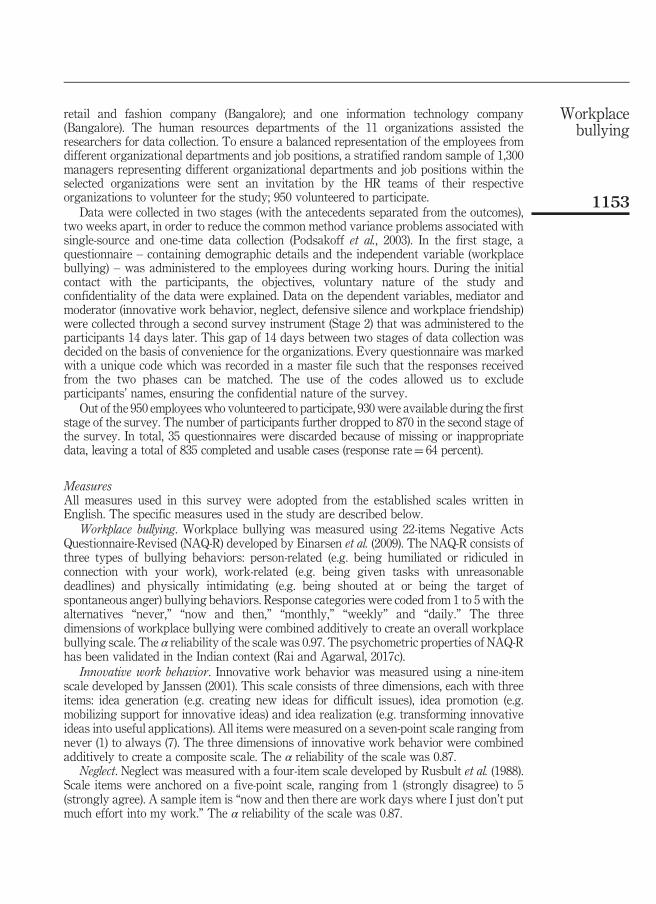
retail and fashion company (Bangalore); and one information technology company(Bangalore). The human resources departments of the 11 organizations assisted theresearchers for data collection. To ensure a balanced representation of the employees fromdifferent organizational departments and job positions, a stratified random sample of 1,300managers representing different organizational departments and job positions within theselected organizations were sent an invitation by the HR teams of their respectiveorganizations to volunteer for the study; 950 volunteered to participate.
Data were collected in two stages (with the antecedents separated from the outcomes),two weeks apart, in order to reduce the common method variance problems associated withsingle-source and one-time data collection (Podsakoff et al., 2003). In the first stage, aquestionnaire – containing demographic details and the independent variable (workplacebullying) – was administered to the employees during working hours. During the initialcontact with the participants, the objectives, voluntary nature of the study andconfidentiality of the data were explained. Data on the dependent variables, mediator andmoderator (innovative work behavior, neglect, defensive silence and workplace friendship)were collected through a second survey instrument (Stage 2) that was administered to theparticipants 14 days later. This gap of 14 days between two stages of data collection wasdecided on the basis of convenience for the organizations. Every questionnaire was markedwith a unique code which was recorded in a master file such that the responses receivedfrom the two phases can be matched. The use of the codes allowed us to excludeparticipants’ names, ensuring the confidential nature of the survey.
Out of the 950 employees who volunteered to participate, 930 were available during the firststage of the survey. The number of participants further dropped to 870 in the second stage ofthe survey. In total, 35 questionnaires were discarded because of missing or inappropriatedata, leaving a total of 835 completed and usable cases (response rate¼ 64 percent).
MeasuresAll measures used in this survey were adopted from the established scales written inEnglish. The specific measures used in the study are described below.
Workplace bullying. Workplace bullying was measured using 22-items Negative ActsQuestionnaire-Revised (NAQ-R) developed by Einarsen et al. (2009). The NAQ-R consists ofthree types of bullying behaviors: person-related (e.g. being humiliated or ridiculed inconnection with your work), work-related (e.g. being given tasks with unreasonabledeadlines) and physically intimidating (e.g. being shouted at or being the target ofspontaneous anger) bullying behaviors. Response categories were coded from 1 to 5 with thealternatives “never,” “now and then,” “monthly,” “weekly” and “daily.” The threedimensions of workplace bullying were combined additively to create an overall workplacebullying scale. The α reliability of the scale was 0.97. The psychometric properties of NAQ-Rhas been validated in the Indian context (Rai and Agarwal, 2017c).
Innovative work behavior. Innovative work behavior was measured using a nine-itemscale developed by Janssen (2001). This scale consists of three dimensions, each with threeitems: idea generation (e.g. creating new ideas for difficult issues), idea promotion (e.g.mobilizing support for innovative ideas) and idea realization (e.g. transforming innovativeideas into useful applications). All items were measured on a seven-point scale ranging fromnever (1) to always (7). The three dimensions of innovative work behavior were combinedadditively to create a composite scale. The α reliability of the scale was 0.87.
Neglect. Neglect was measured with a four-item scale developed by Rusbult et al. (1988).Scale items were anchored on a five-point scale, ranging from 1 (strongly disagree) to 5(strongly agree). A sample item is “now and then there are work days where I just don’t putmuch effort into my work.” The α reliability of the scale was 0.87.
1153
Workplacebullying

Defensive silence. Defensive silence was measured with five-item designed to measuredefensive silence from Brinsfield (2013) employee silence scale. Scale items were anchoredon a five-point scale, ranging from 1 (strongly disagree) to 5 (strongly agree). A sample itemis “I feel it is dangerous to speak up.” The α reliability of the scale was 0.90.
Workplace friendship. Workplace friendship was measured with a six-item scaledeveloped by Nielsen et al. (2000). Scale items were anchored on a five-point scale, rangingfrom 1 (strongly disagree) to 5 (strongly agree). A sample item is “I have formed a strongfriendship at organization.” The α reliability of the scale was 0.80.
Control variablesOne-way ANOVA was performed to examine differences in ratings across the 11organizations. The results showed that F-values were significant for nearly all the variables.Mean differences were expected as the 11 organizations differed in their business processesand challenges. Post hoc analyses based on Scheffe’s test were conducted to test whetherpairs of mean differences among variables formed a pattern. The results did not yield apattern that could be used for clustering organizations for further analyses.
Three demographic variables, i.e. age, gender and tenure, were used as controlsto rule out alternative explanations for the findings since they are related to the perceptionof workplace bullying (Francioli et al., 2015; Lee et al., 2013; Notelaers et al., 2011). Agewas measured as a continuous variable. Gender was modeled as a categoricalvariable. Employee job tenure was measured as years of service and was modeled as acontinuous variable.
Preliminary analysisCommon method variance. Harman’s single-factor test was utilized to investigate potentialcommon method variance among the study variables (Podsakoff et al., 2003). The basicassumption of Harman’s single-factor test is that if a substantial amount of common methodvariance is present, one general factor will account for the majority (W50 percent) of thecovariance among the variables. The results of this test showed that multiple factors wereextracted and the first factor accounted for only 28 percent of the total variance. Since nodominant general factor was found in factor analysis, the concern for common methodvariance could be partially mitigated.
We also conducted a series of confirmatory factor analyses to examine the distinctivenessof our study constructs. The proposed five-factor model (workplace bullying, innovative workbehavior, neglect, defensive silence and workplace friendship) had a good model fit(χ2¼ 2,100, df¼ 784, χ2/df¼ 2.6, goodness-of-fit index¼ 0.88, adjusted goodness-of-fitindex¼ 0.84, comparative fit index¼ 0.94, root mean square error of approximation¼ 0.04).We further examined five alternative models and compared them with the five-factor model.As shown in Table I, the five-factor model fits our data better than alternative models,suggesting that our respondents could distinguish the focal constructs clearly.
ResultsDescriptive statisticsTable II presents the descriptive statistics and intercorrelations between study variables.The zero-order correlations were all in the expected direction, indicating preliminarysupport for the hypothesized relationships.
Testing direct and mediated effects. The SPSS macro, PROCESS (Hayes, 2013; Preacherand Hayes, 2008), was used for path analysis. Workplace bullying was negatively related toinnovative work behavior (β¼−0.16, t¼−4.5, p¼ o0.001) and positively related to neglect(β¼ 0.51, t¼ 14.46, p¼ o0.001) supporting H1a and H1b, respectively. Workplace bullying
1154
IJPPM67,7

was significantly related to defensive silence (β¼ 0.43, t¼ 10.14, p¼ o0.001), and defensivesilence was significantly related to innovative work behavior (β¼−0.07, t¼−2.3, po0.001)and neglect (β¼ 0.22, t¼ 7.9, po0.001) when controlling for workplace bullying.The significant indirect effects supported the mediating role of defensive silence in thebullying–outcome relationships (H2). Additionally, after controlling for the mediator, theassociation between workplace bullying and outcomes remained significant with a drop-in βvalues – innovative work behavior (β¼−0.12, t¼−3.5, po0.001) and neglect (β¼ 0.41,t¼ 11.50, po0.001) – suggesting partial mediating effects of defensive silence inworkplace bullying–outcomes relationships. The direct and mediated effects are reported inTable III and Figure 2.
Models χ2 df χ2/df
Goodness-of-fitindex(GFI)
Adjustedgoodness-of-fit index(AGFI)
Comparativefit index(CFI)
Root meansquare error ofapproximation
(RMSEA)
One-factor model (combined allitems into one factor) 6,800 792 8.5 0.64 0.59 0.74 0.10Two-factor model (combinedworkplace bullying andworkplace friendship into onefactor and defensive silence,innovative work behavior andneglect into another factor) 5,657 791 7.1 0.70 0.67 0.81 0.08Three-factor model (combinedsilence, innovative workbehavior and neglect intoone factor) 4,714 788 6.0 0.79 0.69 0.85 0.07Four-factor model (combinedinnovative work behavior andneglect into one factor) 3,800 787 4.8 0.83 0.77 0.88 0.07Four-factor model (combinedworkplace bulling and silenceinto one factor) 2,700 786 3.4 0.84 0.81 0.90 0.05Five-factor model(hypothesized model) 2,100 784 2.6 0.88 0.84 0.94 0.04
Table I.Results of model
comparison
Variables Mean SD 1 2 3 4 5 6 7 8
1 Age 32 8 12 Gender 0.81 0.39 0.239** 13 Tenure 8.7 7.7 0.946** 0.224** 14 Workplace
bullying 1.8 0.87 −0.193** −0.024 −0.166** (0.97)5 Innovative work
behavior 4.5 0.92 0.139** 0.085* 0.140** −0.161** (0.87)6 Neglect 2.2 0.99 −0.218** −0.123** −0.174** 0.452** −0.189** (0.87)7 Defensive
silence 3.4 1.1 −0.036 −0.009 −0.045 0.347** −0.205** 0.413** (0.90)8 Workplace
friendship 2.6 1.1 0.092** 0.072* 0.074* −0.154** 0.346** −0.122** −0.130** (0.80)Notes: n¼ 835. α reliabilities are given in the parentheses. *po0.05; **po0.01; ***po0.001
Table II.Means, standarddeviations and
Pearson correlationsamong study
variables
1155
Workplacebullying

To further test the significance of indirect effect, we applied the Sobel (1982) test forindirect effects (MacKinnon et al., 2002) and a bias-corrected bootstrapped test with 5,000replications to construct a confidence interval (Preacher and Hayes, 2008). The p-value ofless than 0.05 confirmed that defensive silence plays a mediating role in workplacebullying-innovative work behavior (z¼−3.5, po0.001) and workplace bullying–neglect(z¼ 6.3, po0.001) relationships. Bootstrapping corroborated these findings asbootstrapped confidence intervals around the indirect effect did not contain zero for
Variables B SE t pInnovative work behavior regressed on workplace bullying −0.16 0.036 −4.5 0.000Neglect regressed on workplace bullying 0.51 0.035 14.46 0.000Defensive silence regressed on workplace bullying 0.43 0.042 10.14 0.000Innovative work behavior regressed on defensive silence after controllingfor workplace bullying −0.10 0.029 −2.6 0.000Neglect regressed on defensive silence after controlling forworkplace bullying 0.22 0.027 7.9 0.000Innovative work behavior regressed on workplace bullying aftercontrolling for defensive silence −0.12 0.038 −3.5 0.000Neglect regressed on workplace bullying after controlling fordefensive silence 0.41 0.036 11.50 0.000
Indirect effect and significance using Sobel test Value SE z pIndirect effects of workplace bullying on innovative work behavior −0.045 0.013 −3.5 0.0004Indirect effects of workplace bullying on neglect 0.094 0.015 6.3 0.000
Bootstrap results for indirect effect Value SELL 95%
CIUL 95%
CIIndirect effects of workplace bullying on innovative work behavior −0.045 0.013 −0.072 −0.019Indirect effects of workplace bullying on neglect 0.094 0.015 0.068 0.125Notes: n¼ 835. LL, lower limit; UL, upper limit; CI, confidence interval; p, level of significance. Bootstrapsample size¼ 5,000
Table III.Regression resultsfor direct andmediated effects
Innovative WorkBehavior
WorkplaceBullying
Neglect0.51***
–0.16***
WorkplaceBullying
Innovative WorkBehavior
Defensive Silence
Neglect0.22***
–0.10***0.43***
–0.12**
0.41***
(a)
(b)
Notes: (a) Model with direct effects; (b) model with mediated effects. *p<0.05;**p<0.01; ***p<0.001
Figure 2.Alternate models
1156
IJPPM67,7

bullying-innovative work behavior (−0.045 (−0.072; −0.019)) and bullying–neglect(0.094 (0.068; 0.12)) relationships. Taken together, these results support the mediating roleof defensive silence in workplace bullying–outcomes (innovative work behavior andneglect) relationships. The Sobel test and bootstrapping results are reported in Table III.
Testing moderation (direct effect moderation model). We followed the procedurerecommended by Aiken andWest (1991) for performing moderation (hierarchical moderatedregression analysis). The independent variables were mean centered prior to the creation ofthe interaction terms. Age, gender and tenure were used as control variables. In eachregression analysis age, gender and tenure were entered as a control variable in Step 1,followed by the main effects (independent variable and moderator) in Step 2, and theinteraction term (independent variable × moderator) in Step 3. The moderating effect issupported if the β coefficient of the interaction term is significant. The β coefficient of theinteraction term between workplace bullying and workplace friendship was significant forboth innovative work behavior (β¼ 0.07, po0.05) and neglect (β¼−0.10, po0.05), thussupporting the moderating role of workplace friendship in bullying–outcomes relationships(H3). The regression results for testing moderation are reported in Table IV and themoderation graphs are presented as Figure 3. Figure 3 shows that the slopes of therelationships between bullying and outcomes (innovative work behavior and neglect) wereshallow for employees with high workplace friendship, suggesting the mitigating role ofworkplace friendship in the bullying–outcomes relationship.
DiscussionThe purpose of the present study was to examine the workplace bullying and outcomes(innovative work behavior and neglect) relationship with defensive silence as a mediatorand workplace friendship as a moderator. As predicted, a negative relationship was foundbetween workplace bullying and innovative work behavior, and a positive relationship wasfound between workplace bullying and neglect. Though this is the first study linkingworkplace bullying and innovative work behavior, previous studies suggest that workplacebullying is negatively related to employee discretionary workplace behaviors (workengagement, organizational citizenship behavior; Einarsen et al., 2016; Park and Ono, 2016;Rodríguez-Muñoz et al., 2009). Extant literature on interpersonal mistreatment constructslike abusive supervision, incivility has also shown that supervisory mistreatment at work isa potential deterrent of employees’ discretionary workplace behaviors (Aryee et al., 2008;
Innovative work behavior NeglectStep 1 Step 2 Step 1 Step 2
Control variablesAge 0.010 0.011 −0.043* −0.041*Gender 0.21* 0.21* −0.21* −0.20*Tenure 0.01 0.01 −0.030* −0.029*
Independent variablesWorkplace bullying −0.12*** −0.13*** 0.48*** 0.47***Workplace friendship 0.20*** 0.20*** −0.019** −0.020**
Interaction termsWorkplace bullying×workplace friendship 0.07* −0.10*Adjusted R2 0.083 0.088 0.228 0.236Δ Adjusted R2 0.083 0.05 0.228 0.008F 16.11*** 14.34*** 50.0*** 43.8***Notes: n¼ 835. *po0.05; **po0.01; ***po0.001
Table IV.Moderating effects ofworkplace friendshipon the relationshipbetween workplace
bullying and outcomes
1157
Workplacebullying

Liu et al., 2012; Liu and Wang, 2013; Zellars et al., 2002). However, compared to otherdiscretionary behaviors, innovative work behavior is regarded as risky and costly ( Janssen2000; Agarwal, 2017) and is much directly related to overall organizational innovativenessand retention of sustained competitive advantage (Agarwal et al., 2012). Hence, bothacademicians and practitioners need to expend more efforts to understand how workplacebullying or any other form of mistreatment impacts employees’ innovative work behaviors.
Neglect involves behavior (like reduced efforts, chronic lateness, long breaks) that are likelyto go undetected or if detected are less likely to be punished, thus most of the employees inresponse to negative treatment at workplace are likely to involve into neglect (Tepper et al.,2009) resulting in increase in the frequency of such detrimental workplace behaviors (Lianet al., 2012; Needleman, 2008). Surveys and academic reports fromWestern organizations haveshown that workplace deviance is both common and an expensive problem for organizations(Bennett and Robinson, 2000) as 33–75 percent of all employees have been found engaged indeviant behaviors (Bennett and Robinson, 2003; Harper, 1990) and 20 percent of businesses faildue to employee neglect (Coffin, 2003). Therefore, an examination of factors promotingemployee neglect is crucial (Bennett and Robinson, 2003). Indian culture and values inculcateits citizens with morality and ethics, yet, surprisingly, Indian employees are not immune fromsuch unethical behavior (Sharma and Paluchova, 2014). The results of the study supported theproposed hypothesis that workplace bullying correlates positively with employee neglect andas much as 45 percent of employees were involved in neglect in response to workplace bullying.
Understanding the factors that contribute to employee silence has become an importantissue in organization management, given its detrimental impacts on organizations andemployees (Morrison, 2014; Morrison, 2011). Moreover, withholding critical information alsohinders the organization’s ability to timely identify the problems and correct them to preventfurther damage (Milliken and Morrison, 2003; Morrison and Milliken, 2000; Tangirala andRamanujam, 2008). Silence is one of the most important passive coping strategies ofemployees in response to mistreatment at work (Kiewitz et al., 2016; Whitman et al., 2014;Xu et al., 2015). We proposed that bullying fosters employee silence which, in turn, affectsoutcomes. The results of the study supported the mediating role of defensive silence inworkplace bullying–outcomes relationships. More specifically, we found that defensive silencepartially mediated bullying–outcomes relationships and this partial mediation suggests thatthere are some other underlying mechanisms in the bullying–outcomes relationship.
1
1.5
2
2.5
3
3.5
4
4.5
5
Low Bullying High Bullying
Inno
vativ
e w
ork
beha
viou
r
Low Workplace friendship
High Workplace friendship
(a)
1
1.5
2
2.5
3
3.5
4
4.5
5
Low Bullying High Bullying
Neg
lect
Low Workplace friendship
High Workplace friendship
(b)
Notes: (a) Moderating effect of workplace friendship on workplace bullying–innovative workbehavior relationship; (b) moderating effect of workplace friendship on the workplace bullying–neglect relationship
Figure 3.Moderating effects ofworkplace friendship
1158
IJPPM67,7

Several articles published in Forbes (2010), Habelow (2010), HBR (2013), Riordan (2013),Fast Company (2015) and Michelle Gibbings (2016) have highlighted the importance ofworkplace friendship. These articles reflect that friends at work form a strong social supportnetwork for each other and employees who report having friends at work have higher levelsof productivity and job satisfaction. We also proposed that employees having strongfriendship networks are less likely to be negatively impacted by workplace bullying. Resultsrevealed that workplace friendship attenuated the effects of workplace bullying onoutcomes such that positive and negative effects of workplace bullying on outcomes wereweaker for employees with high workplace friendship.
Theoretical contributionsThis study makes important theoretical contributions to different bodies of knowledge:workplace bullying, silence, innovative work behavior and workplace friendship. First of all,we contribute to growing research on workplace bullying by extending its range ofoutcomes by examining innovative work behavior and neglect as employees’ responses toworkplace bullying. Most notably, our study advances insights based on the COR theory forunderstanding responses to workplace bullying. The COR theory provided valuableinsights for exploring the context under which employees may decide to engage ininnovative work behavior or neglect after facing workplace bullying.
In response to the limited underlying and intervening mechanisms, another importantcontribution of the present study is that we have proposed and examined a new mediator(defensive silence) and moderator (workplace friendship) in the bullying–outcomesrelationships. This study is one of the few attempts to examine employee silence as amediator between negative workplace situations and employee outcomes. This study alsocontributes to the emerging but limited literature on the precursors of silence (Morrison,2014). Based on this study, we suggest that workplace bullying (or any other mistreatmentin the workplace) fosters silence and can be treated as an antecedent to silence. The presentstudy also makes an important contribution to the extant literature by simultaneouslytaking the negative (workplace bullying) and positive (workplace friendship) workplacerelationships into account and examining their interactive impact on employees’ outcomesfrom a resource perspective (Labianca and Brass, 2006; Venkataramani et al., 2013).These findings also advance the social ledger model (Labianca and Brass, 2006) whichsuggests that employees within an organization engage in both positive and negativeties/relationships with other organizational members and both types of ties are inextricablylinked to each other and need to be considered together in determining the employeeoutcomes (Venkataramani et al., 2013).
This study also contributes in terms of its sample composition and sample size.We conducted a survey of 835 managers in 11 Indian organizations. The dynamics ofworkplace bullying have not been thoroughly examined before among employees inmanagerial positions (Salin, 2005) despite the fact that studies have reported that managersare more likely to be victims of bullying owing to their typical work characteristics(Hoel and Cooper, 2000; (Leymann, 1992). The high pressures and high internal competitionmay increase stress and frustration and lower the threshold for aggression amongmanagers (Hoel and Cooper, 2000; Salin, 2001). Studying bullying in this neglected group ofemployees would surely widen the scope of bullying research.
Finally, this study contributes by exploring the effects of workplace bullying in a newcontext – India. Indian socio-cultural fabric, which is characterized as high on powerdistance and collectivism (Hofstede, 1980), provides strong support for examining themediating role of silence and the moderating role of workplace friendship in the workplacebullying–work outcomes relationship. Research suggests that cultures create environmentswhere silence can occur (Bowen and Blackmon, 2003; Huang et al., 2005; Verhezen, 2010).
1159
Workplacebullying

Employee silence, especially defensive silence, can be an expected part of employee behaviorin Indian organizations due to high power distance (insecurity or fear) ( Jain, 2015).Employees in high power-distance cultures like India are less inclined to challengesuperiors’ inappropriate attitudes through speaking up (Goodwin and Goodwin, 1999), as insuch cultures, speaking up can be understood as challenging the status of the manager(Porter et al., 2003) and disobeying the norms of the organization (Goodwin and Goodwin,1999). Coping via social support is especially common among collectivistic employees asthey place emphasis on interconnectedness with their social group (Sinha et al., 2000) andare more likely to express and experience other-focused emotions such as sympathy(Markus and Kitayama, 1991). For such employees, the mere perception of having sociallysupportive networks can be stress reducing, even when the social support network is notexplicitly mobilized for dealing with stress (Thoits, 1995).
Managerial implicationsThere is overwhelming support for the notion that negative work experiences not only havedeleterious effects on employee behavior (Baumeister et al., 2001; Einarsen et al., 2007) but,more importantly, the intensity of implications of negative events on work behavior is far moreintense than the effects of positive work events (Baumeister et al., 2001; Labianca and Brass,2006; Eby et al., 2010). Therefore, understanding and preventing negative interactions in theworkplace may be as important, or even more important, than understanding and enhancingpositive interactions at the workplace. Organizations are responsible for providing a safe workenvironment for employees (Einarsen et al., 2003). Management should be aware of thedetrimental effects of workplace bullying on employees and how to intervene the bullyingsituations (Salin, 2003). Given the negative impact of workplace bullying on employeesbehaviors, it is important to develop and promote approaches to prevention and interventionof bullying (Lutgen-Sandvik and Sypher, 2009). Organizations need to create a zero-toleranceculture toward workplace bullying behaviors and provide bullying-prevention training formanagers. Policies such as “zero-tolerance bullying policy at work” and “managing withrespect” should be formed, strengthened and well communicated to all the employees in theorganizations. These policies should provide clear expectations regarding workplaceinteractions and a clear channel for reporting bullying. Organizations should provide trainingfor all employees in respectful communication protocols and the consequences of notadhering to them. Management should timely monitor supervisor–subordinate interactions assupervisors’ inappropriate work behaviors can serve as a model for lower-level subordinatesthrough a trickle-down effect (Ambrose et al., 2013; Hon and Lu, 2016).
Considering that employees may be reluctant to openly report bullying incidences,anonymous reporting solutions like hotlines and mobile applications such as STOPit should beestablished. Organizations can also establish an organizational ombudsman system thatfunctions outside the traditional hierarchy to provide a mechanism for employees to sharework-related problems (Milliken et al., 2003). By establishing such a system, employees’confidentiality can be protected (Milliken et al., 2003), and individuals will not be concernedabout creating tension and harming relationships between their superiors and themselves(Dedahanov et al., 2016). Formal and informal discussion with the staff should be promoted,and timely monitoring and employee’s surveys on appropriate/acceptable workplace behaviorsshould be conducted (Mathieson et al., 2006). Management support may encourage employeesto combat bullying by refusing to accept it and by raising their voices against it (Salin, 2008).
Results suggest that employees subjected to workplace bullying are less likely to reducetheir innovative work behavior and increase neglect if they are obtaining support from theirfriends at the workplace. Managers should provide ample opportunities for employees tointeract with each other and develop strong interpersonal and informal networks (Duffy andSperry, 2012) as these networks, in turn, would provide them with necessary resources to
1160
IJPPM67,7

cope with workplace bullying and other adverse workplace situations. Organizations maybe benefited by conducting training programs for employees that can enhance their abilitiesto deal with stressors or negative emotional experiences (Diefendorff et al., 2005). Suchemployees may be better able to handle organizational adversities without being severelyaffected by them.
Limitations and future research directionsAlthough the results of this research supported the hypothesized relationships, there aresome limitations that need to be acknowledged. First, we have used a cross-sectional designwhich does not allow inferences to be drawn about the causal relationships betweenbullying and its direct and indirect outcomes. Second, all constructs were measured withself-report questionnaires from a single source. Although we collected data in two stageswith antecedents separated from outcomes that limited the possibility of common methodvariance; however, we cannot rule out this possibility. Third, our sample comprised mostlymale respondents (81 percent). In the light of the gender differences in experiences ofworkplace bullying (Salin, 2003), a more gender-balanced sample may yield different results.Future research could employ a longitudinal analysis in order to make the causalrelationships examined here more robust. From a cross-cultural perspective, a majorlimitation of the study is that the present study has been conducted with Indian employees;thus, generalizability of results to Western nations may become an issue. Similar studiesshould be carried out in contexts similar (Asian nations) and different than India (Westernnations) to enhance the generalizability of these findings.
References
Agarwal, U.A. (2014), “Linking justice, trust and innovative work behaviour to work engagement”,Personnel Review, Vol. 43 No. 1, pp. 41-73.
Agarwal, U.A., Stokes, P. and Smith, S. (2016), “Examining perceived organizational politics amongIndian managers: engagement as mediator and locus of control as moderator”, InternationalJournal of Organizational Analysis, Vol. 24 No. 3, pp. 415-437.
Agarwal, U.A., Datta, S., Blake-Beard, S. and Bhargava, S. (2012), “Linking LMX, innovative workbehaviour and turnover intentions: the mediating role of work engagement”, CareerDevelopment International, Vol. 17 No. 3, pp. 208-230.
Aiken, L.S. and West, S. (1991), “Multiple regression: testing and interpreting interactions”, Sage,London, pp. 46-54.
Ambrose, M.L., Schminke, M. and Mayer, D.M. (2013), “Trickle-down effects of supervisor perceptionsof interactional justice: a moderated mediation approach”, Journal of Applied Psychology, Vol. 98No. 4, pp. 678-689.
Aquino, K. and Thau, S. (2009), “Workplace victimization: aggression from the target’s perspective”,Annual Review of Psychology, Vol. 60, pp. 717-741.
Aquino, K., Tripp, T.M. and Bies, R.J. (2006), “Getting even or moving on? Power, procedural justice,and types of offense as predictors of revenge, forgiveness, reconciliation, and avoidance inorganizations”, Journal of Applied Psychology, Vol. 91 No. 3, pp. 653-668.
Argyris, C. and Schön, D.A. (1997), “Organizational learning: a theory of action perspective”, REIS,Nos 77/78, pp. 345-348.
Aryee, S., Sun, L.-Y., Chen, Z.X.G. and Debrah, Y.A. (2008), “Abusive supervision and contextualperformance: the mediating role of emotional exhaustion and the moderating role of work unitstructure”, Management and Organization Review, Vol. 4 No. 3, pp. 393-411.
Avery, D.R. and Quiñones, M.A. (2002), “Disentangling the effects of voice: the incremental roles ofopportunity, behavior, and instrumentality in predicting procedural fairness”, Journal of AppliedPsychology, Vol. 87 No. 1, pp. 81-86.
1161
Workplacebullying
Baumeister, R.F., Bratslavsky, E., Finkenauer, C. and Vohs, K.D. (2001), “Bad is stronger than good”,Review of General Psychology, Vol. 5 No. 4, pp. 323-370.
Bennett, R.J. and Robinson, S.L. (2000), “Development of a measure of workplace deviance”, Journal ofApplied Psychology, Vol. 85 No. 3, pp. 349-360.
Bennett, R.J. and Robinson, S.L. (2003), “The past, present, and future of workplace deviance research”,in Greenberg, J. (Ed.), Organizational Behavior: The State of the Science, Lawrence ErlbaumAssociates, Mahwah, NJ, pp. 247-281.
Bolino, M.C. and Turnley, W.H. (2005), “The personal costs of citizenship behavior: the relationshipbetween individual initiative and role overload, job stress, and work-family conflict”, Journal ofApplied Psychology, Vol. 90 No. 4, pp. 740-748.
Bolton, L.R., Harvey, R.D., Grawitch, M.J. and Barber, L.K. (2012), “Counterproductive work behavioursin response to emotional exhaustion: a moderated mediational approach”, Stress and Health,Vol. 28 No. 3, pp. 222-233.
Bordia, P., Restubog, S.L.D., Bordia, S. and Tang, R.L. (2014), “Effects of resource availability on socialexchange relationships the case of employee psychological contract obligations”, Journal ofManagement, Vol. 45 No. 5, pp. 1447-1471.
Bowen, F. and Blackmon, K. (2003), “Spirals of silence: the dynamic effects of diversity onorganizational voice”, Journal of Management Studies, Vol. 40 No. 6, pp. 1393-1417.
Brinsfield, C.T. (2013), “Employee silence motives: investigation of dimensionality and development ofmeasures”, Journal of Organizational Behavior, Vol. 34 No. 5, pp. 671-697.
Byrne, A., Dionisi, A.M., Barling, J., Akers, A., Robertson, J., Lys, R., Wylie, J., et al. (2014), “The depletedleader: the influence of leaders’ diminished psychological resources on leadership behaviors”,The Leadership Quarterly, Vol. 25 No. 2, pp. 344-357.
Carlson, D., Ferguson, M., Hunter, E. and Whitten, D. (2012), “Abusive supervision and work–familyconflict: the path through emotional labor and burnout”, The Leadership Quarterly, Vol. 23 No. 5,pp. 849-859.
Chang, H.T., Chou, Y.J., Liou, J.W. and Tu, Y.T. (2016), “The effects of perfectionism on innovativebehavior and job burnout: Team workplace friendship as a moderator”, Personality andIndividual Differences, Vol. 96, pp. 260-265.
Chen, C.Y., Mao, H.Y., Hsieh, A.T., Liu, L.L. and Yen, C.H. (2013), “The relationship among interactivejustice, leader–member exchange, and workplace friendship”, The Social Science Journal, Vol. 50No. 1, pp. 89-95.
Chiaburu, D.S. and Harrison, D.A. (2008), “Do peers make the place? conceptual synthesis and meta-analysis of coworker effects on perceptions, attitudes, OCBs, and performance”, Journal ofApplied Psychology, Vol. 93 No. 5, pp. 1082-1103.
Childers, O.K. (2014), “Because nice matters: the effects of abusive supervision on employeeinterpersonal deviance”, unpublished MA thesis, University of Houston.
Chiu, S.-F., Yeh, S.-P. and Huang, T.C. (2015), “Role stressors and employee deviance: the moderatingeffect of social support”, Personnel Review, Vol. 44 No. 2, pp. 308-324.
Coffin, B. (2003), “Breaking the silence on white collar crime”, Risk Management, Vol. 50 No. 9,pp. 8-9.
Cole, M.S., Shipp, A.J. and Taylor, S.G. (2016), “Viewing the interpersonal mistreatment literaturethrough a temporal lens”, Organizational Psychology Review, Vol. 6 No. 3, pp. 273-302.
Cortina, L.M. and Magley, V.J. (2003), “Raising voice, risking retaliation: events following interpersonalmistreatment in the workplace”, Journal of Occupational Health Psychology, Vol. 8 No. 4, pp. 247-265.
D’Cruz, P. and Noronha, E. (2011), “The limits to workplace friendship: managerialist HRM and bystanderbehaviour in the context of workplace bullying”, Employee Relations, Vol. 33 No. 3, pp. 269-288.
D’Cruz, P. and Rayner, C. (2013), “Bullying in the Indian workplace: a study of the ITES-BPO sector”,Economic and Industrial Democracy, Vol. 34 No. 4, pp. 597-619.
1162
IJPPM67,7

Dedahanov, A.T., Lee, D., Rhee, J. and Yusupov, S. (2016), “An examination of the associationsamong cultural dimensions, relational silence and stress”, Personnel Review, Vol. 45 No. 3,pp. 593-604.
Devonish, D. (2013), “Workplace bullying, employee performance and behaviors: the mediating role ofpsychological well-being”, Employee Relations, Vol. 35 No. 6, pp. 630-647.
Diefendorff, J.M., Croyle, M.H. and Gosserand, R.H. (2005), “The dimensionality and antecedents ofemotional labor strategies”, Journal of Vocational Behavior, Vol. 66 No. 2, pp. 339-357.
Duffy, M. and Sperry, L. (2012),Mobbing: Causes, Consequences, and Solutions, Oxford University Press.
Duffy, M.K., Ganster, D.C. and Pagon, M. (2002), “Social undermining in the workplace”, Academy ofManagement Journal, Vol. 45 No. 2, pp. 331-351.
Dyne, L.V., Ang, S. and Botero, I.C. (2003), “Conceptualizing employee silence and employee voice asmultidimensional constructs”, Journal of Management Studies, Vol. 40 No. 6, pp. 1359-1392.
Eby, L.T., Butts, M.M., Durley, J. and Ragins, B.R. (2010), “Are bad experiences stronger than good onesin mentoring relationships? Evidence from the protégé and mentor perspective”, Journal ofVocational Behavior, Vol. 77 No. 1, pp. 81-92.
Einarsen, S., Aasland, M.S. and Skogstad, A. (2007), “Destructive leadership behaviour: a definition andconceptual model”, The Leadership Quarterly, Vol. 18 No. 3, pp. 207-216.
Einarsen, S., Hoel, H. and Cooper, C. (2003), Bullying and Emotional Abuse in the Workplace:International Perspectives in Research and Practice, CRC Press, London.
Einarsen, S., Hoel, H. and Notelaers, G. (2009), “Measuring exposure to bullying and harassment atwork: validity, factor structure and psychometric properties of the Negative Acts Questionnaire-Revised”, Work & Stress, Vol. 23 No. 1, pp. 24-44.
Einarsen, S., Hoel, H., Zapf, D. and Cooper, C.L. (2011), “The concept of bullying and harassment atwork: the European tradition”, Bullying and Harassment in the Workplace: Developments inTheory, Research, and Practice, Vol. 2, pp. 3-40.
Einarsen, S., Skogstad, A., Rørvik, E., Lande, A.B. and Nielsen, M.B. (2016), “Climate for conflictmanagement, exposure to workplace bullying and work engagement: a moderated mediationanalysis”, The International Journal of Human Resource Management, pp. 1-22, doi: 10.1080/09585192.2016.1164216.
Fast Company (2015), “Why having friends at work is so important”, available at: www.fastcompany.com/3051290/why-having-friends-at-work-is-so-important (accessed April 18, 2016).
Festinger, L. (1957), Cognitive Dissonance theory, 1989), Primary Prevention of HIV/AIDS: PsychologicalApproaches, Sage Publications, Newbury Park, CA, available at: www.nwpublicemployeesdiversityconference.org/wpcontent/uploads/2014/09/CognitiveDissonanceTheory.doc (accessed June 20, 2016).
Francioli, L., Høgh, A., Conway, P.M., Costa, G., Karasek, R. and Hansen, A.A.M. (2015), “Do personaldispositions affect the relationship between psychosocial working conditions and workplacebullying?”, Ethics & Behavior, Vol. 26 No. 6, pp. 451-469.
Gibbings, M. (2016), “Why friendship is important in the workplace”, available at: www.michellegibbings.com/friendships-important-at-work (accessed September 30, 2017).
Gils, S., Van Quaquebeke, N., van Knippenberg, D., van Dijke, M. and De Cremer, D. (2015), “Ethicalleadership and follower organizational deviance: the moderating role of follower moralattentiveness”, The Leadership Quarterly, Vol. 26 No. 2, pp. 190-203.
Goodwin, J. and Goodwin, D. (1999), “Ethical judgments across cultures: a comparison between businessstudents from Malaysia and New Zealand”, Journal of Business Ethics, Vol. 18 No. 3, pp. 267-281.
Greenberg, J. and Edwards, M.S. (2009), Voice and Silence in Organizations, Emerald Group Publishing.
Habelow, E. (2010), “Are friendships key to workplace happiness?”, available at: www.forbes.com/2010/04/21/workplace-happiness-friendship-forbes-woman-well-being-relationship.html (accessedSeptember 20, 2017).
Halbesleben, J.R. (2006), “Sources of social support and burnout: a meta-analytic test of theconservation of resources model”, Journal of Applied Psychology, Vol. 91 No. 5, p. 1134.
1163
Workplacebullying
Halbesleben, J.R., Neveu, J.-P., Paustian-Underdahl, S.C. and Westman, M. (2014), “Getting to the ‘COR’understanding the role of resources in conservation of resources theory”, Journal ofManagement, Vol. 40 No. 5, pp. 1334-1364.
Harper, D. (1990), “Spotlight abuse – save profits”, Industrial Distribution, Vol. 79 No. 3, pp. 47-51.
Harris, K.J., Kacmar, K.M. and Zivnuska, S. (2007), “An investigation of abusive supervision as apredictor of performance and the meaning of work as a moderator of the relationship”, TheLeadership Quarterly, Vol. 18 No. 3, pp. 252-263.
Harvey, P., Stoner, J., Hochwarter, W. and Kacmar, C. (2007), “Coping with abusive supervision:The neutralizing effects of ingratiation and positive affect on negative employee outcomes”, TheLeadership Quarterly, Vol. 18 No. 3, pp. 264-280.
Hayes, A.F. (2013), Introduction to Mediation, Moderation, and Conditional Process Analysis: ARegression-Based Approach, Guilford Press, New York, NY.
Hobfoll, S.E. (1989), “Conservation of resources: a new attempt at conceptualizing stress”, AmericanPsychologist, Vol. 44 No. 3, pp. 513-524.
Hobfoll, S.E. (2001), “The influence of culture, community, and the nested-self in the stress process:advancing conservation of resources theory”, Applied Psychology, Vol. 50 No. 3, pp. 337-421.
Hofstede, G. (1980), “Motivation, leadership, and organization: do American theories apply abroad”,Organizational Dynamics, Vol. 9 No. 1, pp. 42-63.
Hobfoll, S.E. (2002), “Social and psychological resources and adaptation”, Review of General Psychology,Vol. 6 No. 4, pp. 307-324.
Hobfoll, S.E. and Freedy, J. (1993), “Conservation of resources: a general stress theory applied toburnout”, in Schaufeli, W.B., Maslach, C. and Marek, T. (Eds), Series in Applied Psychology: SocialIssues and Questions. Professional Burnout: Recent Developments in Theory and Research,Taylor & Francis, Philadelphia, PA, pp. 115-133.
Hobfoll, S.E. and Shirom, A. (2001), “Conservation of resources theory: applications to stress andmanagement in the workplace”, in Golembiewski, R.T. (Ed.), Handbook of OrganizationalBehavior, Marcel Dekker, New York, NY, pp. 57-80.
Hobman, E.V., Restubog, S.L.D., Bordia, P. and Tang, R.L. (2009), “Abusive supervision in advisingrelationships: investigating the role of social support”,Applied Psychology, Vol. 58 No. 2, pp. 233-256.
Hoel, H. and Cooper, C.L. (2000), “Destructive conflict and bullying at work”, Manchester School ofManagement, UMIST Manchester, available at: http://sites.google.com/site/qmcmonitor/Destructiveconflictandbullyingatwork.pdf (accessed June 1, 2016).
Hon, A.H. and Lu, L. (2016), “When will the trickle-down effect of abusive supervision be alleviated?The moderating roles of power distance and traditional cultures”, Cornell Hospitality Quarterly,Vol. 57 No. 4, pp. 421-433.
Hoel, H. and Cooper, C.L. (2001), “Origins of bullying”, Building a Culture of Respect-Managing Bullyingat Work, pp. 3-21.
Huang, X., Vliert, E.V. de and Vegt, G.V. der. (2005), “Breaking the silence culture: stimulation ofparticipation and employee opinion withholding cross-nationally”, Management andOrganization Review, Vol. 1 No. 3, pp. 459-482.
Ilies, R., Johnson, M.D., Judge, T.A. and Keeney, J. (2011), “A within-individual study of interpersonalconflict as a work stressor: dispositional and situational moderators”, Journal of OrganizationalBehavior, Vol. 32 No. 1, pp. 44-64.
Jain, A.K. (2015), “An interpersonal perspective to study silence in Indian organizations: investigationof dimensionality and development of measures”, Personnel Review, Vol. 44 No. 6, pp. 1010-1036.
Janssen, O. (2000), “Job demands, perceptions of effort-reward fairness and innovative workbehaviour”, Journal of Occupational and Organizational Psychology, Vol. 73 No. 3, pp. 287-302.
Janssen, O. (2001), “Fairness perceptions as a moderator in the curvilinear relationships between jobdemands, and job performance and job satisfaction”, Academy of Management Journal, Vol. 44No. 5, pp. 1039-1050.
1164
IJPPM67,7

Janssen, O. (2004), “How fairness perceptions make innovative behavior more or less stressful”, Journalof Organizational Behavior, Vol. 25 No. 2, pp. 201-215.
Janssen, O. and Van Yperen, N.W. (2004), “Employees’ goal orientations, the quality of leader-memberexchange, and the outcomes of job performance and job satisfaction”, Academy of ManagementJournal, Vol. 47 No. 3, pp. 368-384.
Jex, S.M. and Beehr, T.A. (1991), “Emerging theoretical andmethodological issues in the study of work-relatedstress”, Research in Personnel and Human Resources Management, Vol. 9 No. 31, pp. l-365.
Kakarika, M., González-Gómez, H.V. and Dimitriades, Z. (2017), “That wasn’t our deal: a psychologicalcontract perspective on employee responses to bullying”, Journal of Vocational Behavior,Vol. 100, pp. 43-55, doi: 10.1016/j.jvb.2017.02.005.
Kiazad, K., Seibert, S.E. and Kraimer, M.L. (2014), “Psychological contract breach and employeeinnovation: a conservation of resources perspective”, Journal of Occupational and OrganizationalPsychology, Vol. 87 No. 3, pp. 535-556.
Kiewitz, C., Restubog, S.L.D., Shoss, M.K., Garcia, P.R.J.M. and Tang, R.L. (2016), “Suffering in silence:investigating the role of fear in the relationship between abusive supervision and defensivesilence”, Journal of Applied Psychology, Vol. 101 No. 5, pp. 731-742.
Kiewitz, C., Hochwarter, W.A., Ferris, G.R. and Castro, S.L. (2002), “The role of psychological climate inneutralizing the effects of organizational politics on work outcomes”, Journal of Applied SocialPsychology, Vol. 32 No. 6, pp. 1189-1207.
Kim, S.L., Kim, M. and Yun, S. (2015), “Knowledge sharing, abusive supervision, and support: a socialexchange perspective”, Group & Organization Management, Vol. 40 No. 5, pp. 599-624.
Kish-Gephart, J.J., Detert, J.R., Treviño, L.K. and Edmondson, A.C. (2009), “Silenced by fear:: thenature, sources, and consequences of fear at work”, Research in Organizational Behavior, Vol. 29,pp. 163-193.
Knoll, M. and van Dick, R. (2013), “Do I hear the whistle…? A first attempt to measure four forms ofemployee silence and their correlates”, Journal of Business Ethics, Vol. 113 No. 2, pp. 349-362.
Krischer, M.M., Penney, L.M. and Hunter, E.M. (2010), “Can counterproductive work behaviors beproductive? CWB as emotion-focused coping”, Journal of Occupational Health Psychology, Vol. 15No. 2, pp. 154-166.
Labianca, G. and Brass, D.J. (2006), “Exploring the social ledger: negative relationships and negativeasymmetry in social networks in organizations”, Academy of Management Review, Vol. 31 No. 3,pp. 596-614.
Lakey, B. and Cohen, S. (2000), “Social support theory and measurement”, Social Support Measurementand Intervention: A Guide for Health and Social Scientists, pp. 29-52.
Lam, C.K., Huang, X. and Janssen, O. (2010), “Contextualizing emotional exhaustion and positiveemotional display: the signaling effects of supervisors’ emotional exhaustion and serviceclimate”, Journal of Applied Psychology, Vol. 95 No. 2, pp. 368-376.
Laschinger, H.K.S. and Fida, R. (2014), “New nurses’ burnout and workplace wellbeing: the influence ofauthentic leadership and psychological capital”, Burnout Research, Vol. 1 No. 1, pp. 19-28.
Lazarus, R.S. and Folkman, S. (1984), “Coping and adaptation”, The Handbook of Behavioral Medicine,pp. 282-325.
Lazega, E. and Pattison, P.E. (1999), “Multiplexity, generalized exchange and cooperation inorganizations: a case study”, Social Networks, Vol. 21 No. 1, pp. 67-90.
Lee, R.T. and Brotheridge, C.M. (2006), “When prey turns predatory: workplace bullying as a predictorof counteraggression/bullying, coping, and well-being”, European Journal of Work andOrganizational Psychology, Vol. 15 No. 3, pp. 352-377.
Lee, R.T., Brotheridge, C.M., Salin, D. and Hoel, H. (2013), “Workplace bullying as a genderedphenomenon”, Journal of Managerial Psychology, Vol. 28 No. 3, pp. 235-251.
Leymann, H. (1992), From Bullying To Expulsion From Working Life, Stockholm Publica, Stockholm.
1165
Workplacebullying
Lian, H., Ferris, D.L. and Brown, D.J. (2012), “Does taking the good with the bad make things worse?How abusive supervision and leader–member exchange interact to impact need satisfaction andorganizational deviance”, Organizational Behavior and Human Decision Processes, Vol. 117No. 1, pp. 41-52.
Liu, D., Liao, H. and Loi, R. (2012), “The dark side of leadership: a three-level investigation of thecascading effect of abusive supervision on employee creativity”, Academy of ManagementJournal, Vol. 55 No. 5, pp. 1187-1212.
Liu, X.-Y. and Wang, J. (2013), “Abusive supervision and organizational citizenship behaviour: issupervisor–subordinate guanxi a mediator?”, The International Journal of Human ResourceManagement, Vol. 24 No. 7, pp. 1471-1489.
Lutgen-Sandvik, P. (2003), “The communicative cycle of employee emotional abuse generation andregeneration of workplace mistreatment”,Management Communication Quarterly, Vol. 16 No. 4,pp. 471-501.
Lutgen-Sandvik, P. and Sypher, B.D. (2009), Destructive Organizational Communication: Processes,Consequences, and Constructive Ways of Organizing, Routledge.
Lutgen-Sandvik, P., Tracy, S.J. and Alberts, J.K. (2005), “Burned by bullying in the Americanworkplace: a first time study of US prevalence and delineation of bullying ‘degree’ ”, AnnualConference Western States Communication Association, San Francisco, CA.
Lutgen-Sandvik, P., Tracy, S.J. and Alberts, J.K. (2007), “Burned by bullying in the american workplace:prevalence, perception, degree and impact*”, Journal of Management Studies, Vol. 44 No. 6,pp. 837-862.
MacKinnon, D.P., Lockwood, C.M., Hoffman, J.M., West, S.G. and Sheets, V. (2002), “A comparison ofmethods to test mediation and other intervening variable effects”, Psychological Methods, Vol. 7No. 1, pp. 83-104.
Macey, W.H. and Schneider, B. (2008), “The meaning of employee engagement”, Industrial andOrganizational Psychology, Vol. 1 No. 1, pp. 3-30.
Mao, H.-Y. (2006), “The relationship between organizational level and workplace friendship”, TheInternational Journal of Human Resource Management, Vol. 17 No. 10, pp. 1819-1833.
Markus, H.R. and Kitayama, S. (1991), “Culture and the self: Implications for cognition, emotion, andmotivation”, Psychological Review, Vol. 98 No. 2, pp. 224-253.
Mathieson, S., Hanson, M. and Burns, J. (2006), “Reducing the risk of harassment in your organization”,The Way Forward: Proceeding from the 5th International on Bullying and Harassment in theWorkplace, pp. 129-131.
Methot, J.R., Lepine, J.A., Podsakoff, N.P. and Christian, J.S. (2016), “Are workplace friendships a mixedblessing? Exploring tradeoffs of multiplex relationships and their associations with jobperformance”, Personnel Psychology, Vol. 69 No. 2, pp. 311-355.
Milliken, F.J. and Morrison, E.W. (2003), “Shades of silence: emerging themes and future directionsfor research on silence in organizations”, Journal of Management Studies, Vol. 40 No. 6,pp. 1563-1568.
Milliken, F.J., Morrison, E.W. and Hewlin, P.F. (2003), “An exploratory study of employee silence: issuesthat employees don’t communicate upward and why”, Journal of Management Studies, Vol. 40No. 6, pp. 1453-1476.
Mitchell, M.S. and Ambrose, M.L. (2007), “Abusive supervision and workplace deviance and themoderating effects of negative reciprocity beliefs”, Journal of Applied Psychology, Vol. 92 No. 4,pp. 1159-1168.
Montani, F., Odoardi, C. and Battistelli, A. (2015), “Envisioning, planning and innovating: a closerinvestigation of proactive goal generation, innovative work behaviour and boundaryconditions”, Journal of Business and Psychology, Vol. 30 No. 3, pp. 415-433.
Morrison, E.W. (2011), “Employee voice behavior: integration and directions for future research”, TheAcademy of Management Annals, Vol. 5 No. 1, pp. 373-412.
1166
IJPPM67,7

Morrison, E.W. (2014), “Employee voice and silence”, Annual Review of Organizational Psychology andOrganizational Behaviour, Vol. 1 No. 1, pp. 173-197.
Morrison, E.W. and Milliken, F.J. (2000), “Organizational silence: a barrier to change and developmentin a pluralistic world”, Academy of Management Review, Vol. 25 No. 4, pp. 706-725.
Needleman, S.E. (2008), “Businesses say theft by their workers is up”, The Wall Street Journal,,December, p. B8.
Nelson, D. and Cooper, C.L. (2007), Positive Organizational Behavior, Sage, California, CA.
Ng, T.W. and Feldman, D.C. (2012), “Employee voice behavior: a meta-analytic test of the conservationof resources framework”, Journal of Organizational Behavior, Vol. 33 No. 2, pp. 216-234.
Nielsen, I.K., Jex, S.M. and Adams, G.A. (2000), “Development and validation of scores on atwo-dimensional workplace friendship scale”, Educational and Psychological Measurement,Vol. 60 No. 4, pp. 628-643.
Nielsen, M.B. and Einarsen, S.ale. (2012), “Outcomes of exposure to workplace bullying: ameta-analytic review”, Work & Stress, Vol. 26 No. 4, pp. 309-332.
Nielsen, M.B., Matthiesen, S.B. and Einarsen, S. ale. (2010), “The impact of methodological moderatorson prevalence rates of workplace bullying. A meta-analysis”, Journal of Occupational andOrganizational Psychology, Vol. 83 No. 4, pp. 955-979.
Notelaers, G., Vermunt, J.K., Baillien, E., Einarsen, S. ale and DeWitte, H. (2011), “Exploring risk groupsworkplace bullying with categorical data”, Industrial Health, Vol. 49 No. 1, pp. 73-88.
Park, J.H. and Ono, M. (2016), “Effects of workplace bullying on work engagement and health: themediating role of job insecurity”, The International Journal of Human Resource Management,doi: 10.1080/09585192.2016.1155164.
Peng, Y.-C., Chen, L.-J., Chang, C.-C. and Zhuang, W.-L. (2016), “Workplace bullying and workplacedeviance: the mediating effect of emotional exhaustion and the moderating effect of coreself-evaluations”, Employee Relations, Vol. 38 No. 5, pp. 755-769.
Penney, L.M., Hunter, E.M. and Perry, S.J. (2011), “Personality and counterproductive work behaviour:using conservation of resources theory to narrow the profile of deviant employees”, Journal ofOccupational and Organizational Psychology, Vol. 84 No. 1, pp. 58-77.
Perlow, L. and Williams, S. (2003), “Is silence killing your company?”, IEEE Engineering ManagementReview, Vol. 31 No. 4, pp. 18-23.
Pinder, C.C. and Harlos, K.P. (2001), “Employee silence: quiescence and acquiescence as responsesto perceived injustice”, Research in Personnel and Human Resources Management, Vol. 20,pp. 331-370.
Podsakoff, N.P., LePine, J.A. and LePine, M.A. (2007), “Differential challenge stressor-hindrancestressor relationships with job attitudes, turnover intentions, turnover, and withdrawalbehavior: a meta-analysis”, Journal of Applied Psychology, Vol. 92 No. 2, pp. 438-458.
Podsakoff, P.M., MacKenzie, S.B., Lee, J.-Y. and Podsakoff, N.P. (2003), “Common method biases inbehavioral research: a critical review of the literature and recommended remedies”, Journal ofApplied Psychology, Vol. 88 No. 5, pp. 879-903.
Podsakoff, P.M., MacKenzie, S.B., Paine, J.B. and Bachrach, D.G. (2000), “Organizational citizenshipbehaviors: a critical review of the theoretical and empirical literature and suggestions for futureresearch”, Journal of Management, Vol. 26 No. 3, pp. 513-563.
Porter, L.W., Allen, R.W. and Angle, H.L. (2003), “The politics of upward influence in organizations”,Organizational Influence Processes, Vol. 2, pp. 431-445.
Preacher, K.J. and Hayes, A.F. (2008), “Asymptotic and resampling strategies for assessing andcomparing indirect effects in multiple mediator models”, Behavior Research Methods, Vol. 40No. 3, pp. 879-891.
Quick, J.D., Cooper, C.L., Gavin, J.H. and Quick, J.C. (2002), “Executive health: building self-reliance forchallenging times”, International Review of Industrial and Organizational Psychology, Vol. 17,pp. 187-216.
1167
Workplacebullying

Rai, A. and Agarwal, U.A. (2016), “Workplace bullying: a review and future research directions”,South Asian Journal of Management, Vol. 23 No. 3, pp. 27-56.
Rai, A. and Agarwal, U.A. (2017a), “Linking workplace bullying and work engagement: the mediatingrole of psychological contract violation”, South Asian Journal of Human Resources Management,Vol. 4 No. 1, pp. 42-71.
Rai, A. and Agarwal, U.A. (2017b), “Exploring the process of workplace bullying in Indianorganizations: a grounded theory approach”, South Asian Journal of Business Studies, Vol. 6No. 3, pp. 247-273, doi: 10.1108/SAJBS-07-2016-0067.
Rai, A. and Agarwal, U.A. (2017c), “Exploring nature of workplace bullying and psychometricproperties of Negative Acts Questionnaire-Revised (NAQ-R) in Indian organizations”, Journal ofIndian Business Research, Vol. 9 No. 3, pp. 229-247.
Rai, A. and Agarwal, U.A. (2018), “Workplace bullying and employee silence: a moderated mediationmodel of psychological contract violation and workplace friendship”, Personnel Review, Vol. 47No. 1, pp. 226-256.
Riordan, C.M. (2013), “We all need friends at work”, available at: https://hbr.org/2013/07/we-all-need-friends-at-work (accessed September 20, 2017).
Rodríguez-Muñoz, A., Baillien, E., De Witte, H., Moreno-Jiménez, B. and Pastor, J.C. (2009),“Cross-lagged relationships between workplace bullying, job satisfaction and engagement: twolongitudinal studies”, Work & Stress, Vol. 23 No. 3, pp. 225-243.
Rusbult, C.E., Farrell, D., Rogers, G. and Mainous, A.G. (1988), “Impact of exchange variables on exit,voice, loyalty, and neglect: an integrative model of responses to declining job satisfaction”,Academy of Management Journal, Vol. 31 No. 3, pp. 599-627.
Ryan, K.D. and Oestreich, D.K. (1998), Driving Fear out of the Workplace: Creating the High-Trust,High-Performance Organization, Jossey-Bass, available at: http://psycnet.apa.org/psycinfo/1998-07530-000 (accessed August 21, 2016).
Salin, D. (2001), “Prevalence and forms of bullying among business professionals: a comparison of twodifferent strategies for measuring bullying”, European Journal of Work and OrganizationalPsychology, Vol. 10 No. 4, pp. 425-441.
Salin, D. (2003), “Ways of explaining workplace bullying: a review of enabling, motivating andprecipitating structures and processes in the work environment”, Human Relations, Vol. 56No. 10, pp. 1213-1232.
Salin, D. (2005), “Workplace bullying among business professionals: prevalence, gender differences andthe role of organizational politics”, Perspectives Interdisciplinaires Sur Le Travail et La Santé,Nos 7-3, available at: http://pistes.revues.org/3159
Salin, D. (2008), “Organisational responses to workplace harassment: an exploratory study”, PersonnelReview, Vol. 38 No. 1, pp. 26-44.
Salin, D. and Notelaers, G. (2017), “The effect of exposure to bullying on turnover intentions: the role ofperceived psychological contract violation and benevolent behaviour”, Work & Stress, Vol. 31No. 4, pp. 355-374, doi: 10.1080/02678373.2017.1330780.
Samnani, A.-K. and Singh, P. (2012), “20 years of workplace bullying research: a review of theantecedents and consequences of bullying in the workplace”, Aggression and Violent Behavior,Vol. 17 No. 6, pp. 581-589.
Schyns, B. and Schilling, J. (2013), “How bad are the effects of bad leaders? A meta-analysis ofdestructive leadership and its outcomes”, The Leadership Quarterly, Vol. 24 No. 1, pp. 138-158.
Scott, S.G. and Bruce, R.A. (1994), “Determinants of innovative behavior: a path model of individualinnovation in the workplace”, Academy of Management Journal, Vol. 37 No. 3, pp. 580-607.
Sharma, N. and Paluchova, J. (2014), “An aerial glimpse of workplace deviance in Indian serviceindustry”, Gurukul Business Review, Vol. 10, pp. 11-16.
Sias, P.M. (2009), “Social ostracism, cliques, and outcasts”, Destructive Organizational Communication:Processes, Consequences, and Constructive Ways of Organizing, pp. 145-163.
1168
IJPPM67,7
Sias, P.M., Heath, R.G., Perry, T., Silva, D. and Fix, B. (2004), “Narratives of workplace friendshipdeterioration”, Journal of Social and Personal Relationships, Vol. 21 No. 3, pp. 321-340.
Sinha, B.K., Willson, L.R. and Watson, D.C. (2000), “Stress and coping among students in India andCanada”, Canadian Journal of Behavioural Science/Revue Canadienne Des Sciences DuComportement, Vol. 32 No. 4, pp. 218-225.
Sloan, M.M. (2012), “Unfair treatment in the workplace and worker well-being: the role of coworkersupport in a service work environment”, Work and Occupations, Vol. 39 No. 1, pp. 3-34.
Sobel, M.E. (1982), “Asymptotic confidence intervals for indirect effects in structural equation models”,Sociological Methodology, Vol. 13, pp. 290-312.
Spector, P.E. and Jex, S.M. (1998), “Development of four self-report measures of job stressors and strain:interpersonal conflict at work scale, organizational constraints scale, quantitative workloadinventory, and physical symptoms inventory”, Educational Publishing Foundation, available at:http://psycnet.apa.org/journals/ocp/3/4/356/ (accessed May 4, 2017.
Tangirala, S. and Ramanujam, R. (2008), “Employee silence on critical work issues: the cross leveleffects of procedural justice climate”, Personnel Psychology, Vol. 61 No. 1, pp. 37-68.
Tepper, B.J., Moss, S.E., Lockhart, D.E. and Carr, J.C. (2007), “Abusive supervision, upwardmaintenance communication, and subordinates’ psychological distress”, Academy ofManagement Journal, Vol. 50 No. 5, pp. 1169-1180.
Tepper, B.J., Carr, J.C., Breaux, D.M., Geider, S., Hu, C. and Hua, W. (2009), “Abusive supervision,intentions to quit, and employees’ workplace deviance: a power/dependence analysis”,Organizational Behavior and Human Decision Processes, Vol. 109 No. 2, pp. 156-167.
Thoits, P.A. (1995), “Stress, coping, and social support processes: where are we? What next?”, Journal ofHealth and Social Behavior, pp. 53-79.
Tuckey, M.R. and Neall, A.M. (2014), “Workplace bullying erodes job and personal resources: between-andwithin-person perspectives”, Journal of Occupational Health Psychology, Vol. 19 No. 4, pp. 413-424.
Tyler, J.M. and Burns, K.C. (2008), “After depletion: the replenishment of the self’s regulatoryresources”, Self and Identity, Vol. 7 No. 3, pp. 305-321.
Van Emmerik, I.H., Euwema, M.C. and Bakker, A.B. (2007), “Threats of workplace violence and thebuffering effect of social support”, Group & Organization Management, Vol. 32 No. 2,pp. 152-175.
Venkataramani, V., Labianca, G.J. and Grosser, T. (2013), “Positive and negative workplacerelationships, social satisfaction, and organizational attachment”, Journal of Applied Psychology,Vol. 98 No. 6, pp. 1028-1039.
Verhezen, P. (2010), “Giving voice in a culture of silence: from a culture of compliance to a culture ofintegrity”, Journal of Business Ethics, Vol. 96 No. 2, pp. 187-206.
Westman, M., Hobfoll, S.E., Chen, S., Davidson, O.B. and Laski, S. (2004), “Organizational stressthrough the lens of conservation of resources (COR) theory”, Research in Occupational Stress andWell Being, Vol. 4, pp. 167-220.
Wheeler, A.R., Halbesleben, J.R. and Shanine, K. (2010), “Eating their cake and everyone else’s cake, too:resources as the main ingredient to workplace bullying”, Business Horizons, Vol. 53 No. 6,pp. 553-560.
Whiteside, D.B. and Barclay, L.J. (2013), “Echoes of silence: employee silence as a mediatorbetween overall justice and employee outcomes”, Journal of Business Ethics, Vol. 116 No. 2,pp. 251-266.
Whitman, M.V., Halbesleben, J.R. and Holmes, O. (2014), “Abusive supervision and feedback avoidance:the mediating role of emotional exhaustion”, Journal of Organizational Behavior, Vol. 35 No. 1,pp. 38-53.
Wu, T.-Y. and Hu, C. (2009), “Abusive supervision and employee emotional exhaustion dispositionalantecedents and boundaries”, Group & Organization Management, Vol. 34 No. 2, pp. 143-169.
1169
Workplacebullying
Xu, A.J., Loi, R. and Lam, L.W. (2015), “The bad boss takes it all: how abusive supervision andleader–member exchange interact to influence employee silence”, The Leadership Quarterly,Vol. 26 No. 5, pp. 763-774.
Yidong, T. and Xinxin, L. (2013), “How ethical leadership influence employees’ innovative work behavior:a perspective of intrinsic motivation”, Journal of Business Ethics, Vol. 116 No. 2, pp. 441-455.
Zellars, K.L., Tepper, B.J. and Duffy, M.K. (2002), “Abusive supervision and subordinates’organizational citizenship behavior”, Journal of Applied Psychology, Vol. 87 No. 6, pp. 1068-1076.
Further reading
Baron, R.M. and Kenny, D.A. (1986), “The moderator–mediator variable distinction in socialpsychological research: conceptual, strategic, and statistical considerations”, Journal ofPersonality and Social Psychology, Vol. 51 No. 6, pp. 1173-1182.
Peeters, G. (1971), “The positive-negative asymmetry: on cognitive consistency and positivity bias”,European Journal of Social Psychology, Vol. 1 No. 4, pp. 455-474.
Taylor, S.E. (1991), “Asymmetrical effects of positive and negative events: the mobilization-minimization hypothesis”, Psychological Bulletin, Vol. 110 No. 1, pp. 67-85.
About the authorsArpana Rai is Doctoral Student in Organization Behavior and Human Resource Management atNational Institute of Industrial Engineering (NITIE), Mumbai.
Upasna Agarwal is Associate Professor in Organization Behavior and Human ResourceManagement at NITIE. She works in the area of psychological contract, trust, innovative workbehavior, work engagement and work–life interface. Upasna Agarwal is the corresponding author andcan be contacted at: [email protected]
For instructions on how to order reprints of this article, please visit our website:www.emeraldgrouppublishing.com/licensing/reprints.htmOr contact us for further details: [email protected]
1170
IJPPM67,7
Forced distribution systems andattracting top talent
Stephanie J. Thomason, Amy Brownlee and Amy Beekman HarrisDepartment of Management, The University of Tampa,
Tampa, Florida, USA, andHemant Rustogi
Department of Marketing, The University of Tampa, Tampa, Florida, USA
AbstractPurpose – The purpose of this paper is to test how an individual’s attractiveness to three types of appraisalsystems relates to self-rated psychological entitlement and ethics; and constructs rated by others of:conscientiousness, extraversion and agreeableness.Design/methodology/approach – A sample of 148 students in graduate-level business courses andmatching close friends/significant others were surveyed. Data were analyzed using hierarchical regressionand path analysis.Findings – Path analysis indicated acceptable fit for the overall model of attractiveness to three appraisal types.Practical implications – Advocates of forced distribution ranking systems (FDRS) suggest that suchsystems stimulate a high-talent culture and that achievers and strong performers are attracted to FDRS.In contrast, the findings suggest that FDRS are attractive to individuals with high levels of psychologicalentitlement and low levels of conscientiousness.Originality/value – Advocates of FDRS and prior research have indicated that such systems reduceleniency bias and stimulate a high-performance and high-talent culture in which honesty is expected and poorperformance is not tolerated. Others have found that high achievers and high performers are likely to findsuch systems attractive. The present study suggests that one downside of FDRS is its attractiveness toworkers with low levels of conscientiousness and higher levels of psychological entitlement, which are twopersonality traits associated with lower levels of performance and a variety of negative outcomes.Keywords Performance management, Ethics, Conscientiousness, Performance appraisal, Agreeableness,Talent management, Entitlement, Extraversion, Five factor model of personality,Forced distribution ranking systems, Subordinate influence ethicsPaper type Research paper
1. IntroductionAttracting top talent in organizations is an important component of human resourceselection practices and overall organizational success (Chapman et al., 2005). Managing,developing and retaining top talent is additionally important, as talent management is acritical business strategy for achieving a competitive distinction. Chapman et al. (2005)conducted a meta-analytic study of the factors impacting the attractiveness oforganizations and found that a variety of job and organizational characteristics wererelevant. Often-cited characteristics include pay level, advancement opportunities andbenefits (Del Vecchio et al., 2007). Less cited characteristics include performance appraisalsystems (cf. Chapman et al., 2005), despite being one of the most important humanresource practices (Boswell and Boudreau, 2002). Additionally, employee perceptions ofperformance appraisal systems are related to critical outcomes, such as job satisfaction,commitment and turnover intentions (Cawley et al., 1998; Kuvaas, 2006), so understandingthese perceptions is important.
Attraction to performance appraisal systems varies between individuals as a function oftheir personalities and cognitive abilities (Blume et al., 2013), which can be explained underthe framework of person-organization fit. Person-environment fit refers to the “compatibilitybetween an individual and a work environment that occurs when their characteristics arewell-matched” (Kristof-Brown et al., 2005, p. 281). Under this framework, strong fit is
International Journal ofProductivity and Performance
ManagementVol. 67 No. 7, 2018
pp. 1171-1191© Emerald Publishing Limited
1741-0401DOI 10.1108/IJPPM-06-2017-0141
Received 12 June 2017Revised 15 November 2017Accepted 30 December 2017
The current issue and full text archive of this journal is available on Emerald Insight at:www.emeraldinsight.com/1741-0401.htm
1171
Forceddistribution
systems
Quarto trim size: 174mm x 240mm

achieved when individual and organizational characteristics and practices are congruent(Kristof, 1996; Blume et al., 2013).
Blume and colleagues (2013) distinguished three types of performance appraisalsystems: a forced distribution rating system (FDRS) in which employees are evaluatedrelative to one another, a standards-based system in which employees are evaluated on ascale against pre-determined standards of performance and a group-based system in whichemployees are evaluated by the performance of their work unit. The authors found that highcognitive ability individuals were significantly, positively attracted to organizations usingan FDRS and significantly, negatively to one using a group-based system. Alternately,collectivism and core self-evaluations corresponded positively to the attractiveness oforganizations using a standards-based system. Core self-evaluations are fundamentalevaluations that individuals make about themselves and their functioning within theirenvironment ( Judge et al., 2003). Collectivism also corresponded positively with perceptionsof the attractiveness of a group-based system. Noting that individuals of high cognitiveability are attracted to FDRS as Blume et al. (2013) found, the authors provided support forusing such systems. Yet of the three types, FDRS have been the most controversial.
FDRS are often used by organizations as a means of eliminating leniency bias inperformance evaluations by forcing managers to rank employees relative to one another(Blume et al., 2013; Boehle, 2008). FDRS can be defined as a “performance-based evaluationsystem in which employees are ranked against each other based on a particular scheme ordesign” (Osborne and McCann, 2004, p. 6). FDRS further provide a transparent way ofletting employees know where they stand relative to their coworkers (Ramanathan, 2015).
As an example of an FDRS, Jack Welch implemented a 20/70/10 “vitality curve” decadesago at General Electric (Welch and Byrne, 2001) as a means of identifying the “top 20%” ofemployees for an A ranking, a “vital 70%” of employees for a B ranking and the “bottom10%” of employees for a C ranking. Two consecutive “C” evaluations often resulted interminations (Welch and Byrne, 2001), while those in the top 2 groups received significant(A) or solid (B) raise differentials. Under Jack Welch’s reign from 1981 to 2001, GeneralElectric’s value increased by $300bn (Nisen, 2015). Perhaps, such success led to thepopularity and adoption of FDRS by other firms, such as Microsoft, Cisco, Intel andGoldman Sachs (Guralnik et al., 2004). FDRS have been termed “rank and yank” systems,yet Jack Welch prefers the less pejorative term of “differentiation” (Welch, 2013).
Despite support by some practitioners, not everyone considers FDRS beneficial toorganizations. In recent years, a handful of Fortune 500 organizations has eliminated theFDRS, including General Electric (Nisen, 2015), Amazon (Sahadi, 2015), HCL Technologies,Microsoft (Ramanathan, 2015), Adobe, among others (Ramirez, 2013). Some consider thesystems to be dysfunctional, hazardous to an organization’s health and detrimental to anorganization’s culture (e.g. Pfeffer and Sutton, 2000; Pfeffer, 2001). Once the “poor performers”have been eliminated using FDRS, stronger performers may shift into the C category,generating animosity toward the system and dysfunctional competition between coworkers.
FDRS may further be challenged due to fairness perceptions. Buckingham and Goodall(2015) noted that FDRS may be subject to idiosyncratic rater effects, speaking more to anevaluator’s characteristics than to the target employees. Schleicher et al. (2009) examinedFDRS from the raters’ perspective, finding that raters considered FDRS to be more difficultand less fair than traditional performance appraisal formats, such as an absolute,standards-based system. Roch et al. (2007) examined FDRS from the ratees’ perspective, alsofinding that such systems are perceived as less fair than their absolute standards-basedcounterparts. Their sample included a mix of MBA, undergraduate business, graduatepsychology and undergraduate psychology students.
Despite claims that FDRS generate unhealthy competition, lead to contaminatedrankings due to rater biases and may be ineffective in assessing the performance of
1172
IJPPM67,7

talent-rich, knowledge-driven workforces, 21 percent of Fortune 500 and mid-size firmscontinue to use FDRS (Sahadi, 2015). Strong performance increases at General Electric(Nisen, 2015) and the attraction of such systems to people of high cognitive abilities(Blume et al., 2013), however, may contribute to the justification for such systems. Blumeand colleagues (2013) posited that those with high cognitive ability would expect toperform well under such systems and may be inclined to favor organizations rewardinghigh achievement.
Cognitive ability is not the only factor relevant within the workplace that is likely topredict one’s inclination to favor one appraisal system over another. Other relevantpersonality and attitudinal characteristics may also relate to preferences for other typesof performance appraisal systems. Accordingly, the present study offers further insight onthe individual-level characteristics that correspond to perceptions of the attractiveness ofthree performance appraisal systems (cf. Staw, 1986; Roch et al., 2007; Blume et al., 2013).Specifically, we examine whether self-perceptions of psychological entitlement, others’perceptions of conscientiousness, extraversion and agreeableness, and self-perceptions ofsubordinates’ upward influence pro-organizational and self-serving tactics correspond topreferences for these three types of performance appraisal systems.
We chose to focus on psychological entitlement due to its prevalence in the Millennialworkplace and relationship to a variety of negative interpersonal behaviors (Campbell et al.,2004). We chose conscientiousness, extraversion and agreeableness due to theirrelationships to job performance (Barrick and Mount, 1991), status-striving (cf. Barricket al., 2002, 2013) and working cooperatively, respectively (LePine and Van Dyne, 2001).These personality traits have also been distinguished by the motivational tendencies ofgetting along and getting ahead (Hogan and Holland, 2003). We chose self-serving andpro-organizational upward influence tactics due to both a lack of research on upwardinfluence tactics and their correspondence to ethics and the “ugly underbelly of behavior inorganizations” (Ralston and Pearson, 2010, p. 150.). We further chose those two variablesbecause they most closely corresponded to getting along (pro-organizational upwardinfluence tactics) and getting ahead (self-serving behaviors).
Our study has relevance to organizations seeking to become employers of choice, byattracting, managing, developing and retaining top performers with personality andattitudinal characteristics likely to shore up the strategic objectives of the firm. Byidentifying performance appraisal systems likely to attract such individuals, organizationscan better align themselves among their competitors in the hunt for talent. As notedin a meta-analysis of 66 studies, managers need to invest in programs to increase andretain human capital, as superior human capital generate better firm-level performance(Crook et al., 2011).
In the next section, we examine the extant literature on performance appraisal systemsand the aforementioned personality and ethics variables. We integrate the social exchangeaspect of equity theory to hypothesize relationships between individual characteristics andattractiveness perceptions of several performance appraisal systems. We next test ourhypotheses in the third section and offer implications of results.
2. Hypotheses development2.1 Performance appraisal systemsPerformance management can be defined as “a continuous process of identifying,measuring, and developing the performance of individuals and teams and aligningperformance with the strategic objectives of an organization” (Aguinis, 2009, p. 2). Formalperformance appraisal systems are components of performance management systems(Aguinis and Pierce, 2008) and are aligned with high-performance work practices, whichhave been linked to corporate financial performance (Huselid et al., 2005). Performance
1173
Forceddistribution
systems

appraisal is the “systematic description of an employee’s strengths and weaknesses,” whichis typically conducted once per year (Aguinis and Pierce, 2008, p. 140). To distinguish theperformance of employees through performance appraisals, organizations use a variety ofmeans in which one or more raters, such as a subordinate, superior, peer or customer,evaluates the performance of a ratee. Bernardin et al. (1998) and Bernardin andRussell (2013) offered several prescriptions for effective performance management andappraisal. They noted that evaluators should strive for as much precision in definingand measuring performance dimensions as is possible; link performance dimensions tointernal and external customer requirements; use multiple raters; and incorporate themeasurement of situational constraints. Attention to these prescriptions may reduce thelikelihood of litigation, which is often the result of contested performance appraisals(Bernardin and Russell, 2013).
Evaluation formats typically used in performance evaluations are of two general types:absolute and relative (Cascio, 1991). The primary distinction between the two types is thestandard of comparison used, with relative formats requiring raters to appraise individualsrelative to one another and absolute formats requiring raters to appraise individualsagainst a standard (Roch et al., 2007). Two meta-analytic studies that have investigated thedifference between relative evaluation formats, such as the FDRS, and absolute formatsfound that relative formats had higher correlations with quantitative ability, generalmental ability, production quantity, sales volume, perceptual speed and spatial/mechanicalability (Heneman, 1986; Nathan and Alexander, 1988). Such findings indicate that relativeformats may be better positioned to capture job performance than absolute formats, sincethese criteria represent either different components of performance, such as productionquantity, or determinants of performance, such as general mental ability (Roch et al., 2007).So, despite the trends noted at the outset indicate that the use of FDRS has beendiscontinued by some organizations, the validity of relative ranking approaches maywarrant their continued use.
Advocates of FDRS have further offered other benefits to this relative approach, such asthe mitigation of subjectivity biases. These biases include leniency, in which evaluators tendto give higher evaluations to ratees than they objectively deserve, or compression, in whichlittle differentiation between ratees is prevalent (Berger et al., 2013). Partially attributable tothe prevalence of leniency bias and other related biases, Jack Welch and others haveadvocated the use of FDRS in organizations (Meisler, 2003). Anecdotal evidence of leniencybias exists. Forced distribution “usually presents raters with a limited number of categories(usually three to seven) and requires (or forces) the rater to place a designated portion of theratees into each category” (Bernardin and Russell, 2013, p. 249).
FDRS are used to achieve several purposes. At one extreme, organizations usethis information to terminate poorly performing employees at the low end of theperformance category, while at another, organizations collect the information forrecord-keeping purposes only, with no administrative outcomes (Schleicher et al., 2009).In between, organizations use these appraisals to determine promotions or demotions,different levels of compensation or different assignments (Schleicher et al., 2009). Moststudies examine FDRS used for administrative purposes (e.g. promotions, raises), ratherthan non-administrative purposes (e.g. research, development) ( Jawahar and Williams,1997), as the former is more likely to be of concern to managers and subordinates due toleniency bias.
Absolute systems, such as a standards-based or group-based systems, are also used inorganizations (Staw, 1986; Roch et al., 2007; Blume et al., 2013). The standards-based systemrequires raters to make comparisons of ratees’ performance to particular standards ofexpected performance. Standards could be based on specific qualitative or quantitativemeasures, which are derived from the tasks, duties and responsibilities of a job as defined in
1174
IJPPM67,7

its job description. Quantitative measures are objective and could include a specific dollaramount of sales, number of absences or errors and productivity levels, while qualitativemeasures are more subjective and could include customer satisfaction scores. Another typeof performance appraisal system is a group-based system, in which raters makecomparisons of a group of ratees’ performances to established organizational goals.Organizational goals may speak to benchmarks of sales, profitability, productivity or otherspecific objectives.
Organizational goals may further include an attention to talent management by focusingon talent with characteristics that may positively impact engagement and performance.These include psychological entitlement, conscientiousness, extraversion, agreeableness,self-serving upward influence behaviors and pro-organizational behaviors.
2.2 Psychological entitlementPsychological entitlement (PES) can be defined as a “stable and pervasive sense that onedeserves more and is entitled to more than others” (Campbell et al., 2004, p. 31). Stemmingfrom the literature in narcissism, entitlement is often at the heart of many discussionsregarding the distribution of resources. Since the 1970s, the topic has become increasinglyprevalent in all walks of life, impacting academics, workplaces and society (e.g. Campbellet al., 2004; Twenge and Foster, 2008; Harvey and Martinko, 2009). At issue within theliterature on the PES is whether individuals deserve the outcomes to which they feel theyare entitled (Feather, 1999) as oftentimes entitlement perceptions are based on unbalancedassessments of reciprocity (Harvey and Martinko, 2009). In other words, individuals mayfeel entitled to positive outcomes in the workplace despite lagging inputs. Individuals withhigher levels of PES have been linked to a variety of self-serving and selfish behaviors, suchas lower levels of empathy, greater game playing and interpersonal aggression, and feelingsthat they deserve higher salaries than fellow coworkers (Campbell et al., 2004). Entitlementperceptions have also been found to correspond to political behavior, coworker abuse(Harvey and Harris, 2010), perceptions of abusive supervision, organizational deviance andupward undermining (Harvey et al., 2014).
Entitled individuals have a consistent, positive view of themselves and prefer to betreated as special or unique in social settings (Snow et al., 2001). They further believe thatthey are due certain rewards and compensation and are likely to block out any informationthat contradicts that view (Snow et al., 2001). They apply a self-serving cognitive bias whenassessing the performance of others (Harvey and Martinko, 2009). Accordingly and inaccordance with the social exchange aspect of equity theory, such individuals may feelentitled to high-performance appraisal evaluations when compared with their peers just asthey feel entitled to more pay than their peers (cf. Campbell et al., 2004). Accordingly, wepropose the following hypothesis:
H1. Individual-level PES will be positively related to the attractiveness of anorganization utilizing an FDRS.
2.3 The five factor model (FFM) of personalityJudge et al. (2002) identified a consensus suggesting that the FFM of personality can beused to describe some of the most important aspects of personality. The FFM consists ofconscientiousness, agreeableness, extraversion, neuroticism and openness to experience(Costa and McCrae, 1992). Conscientiousness refers to dutifulness, achievement-strivingand competence. Agreeableness relates the tendency to be trustworthy, empathetic andtenderminded. Extraversion relates to the tendency to be sociable, warm andassertive. Neuroticism relates to a variety of negative characteristics, such as anxiety,
1175
Forceddistribution
systems

insecurity and hostility. Openness to experience refers to being imaginative,nonconforming and autonomous.
Considerable research over the past few decades on the FFM has helped to develop abetter understanding of the way the factors of the FFM influence the types of job settingsindividuals prefer and seek (Mount et al., 2005; Barrick et al., 2013). Barrick et al. (2013) usedthe theory of purposeful work behavior to suggest that individuals strive to naturallyexpress their personality traits to achieve their higher-order goals. As an example, Barricket al. (2013) noted that highly extraverted employees who are ambitious and dominant arepredisposed to choosing goals that fulfill their desire to exert power and influence overothers. Barrick et al. (2002) found that conscientious individuals choose goals related to theirtendency to strive for achievement; extraverted individuals choose goals related to statusstriving; and agreeable individuals choose goals related to communion striving.
Hogan and Holland (2003) differentiated the FFM domains by the two motivationaldimensions of “getting ahead” or “getting along.” The authors notes that “people always live(work) in groups, and groups are always structured in terms of status hierarchies” (p. 100).Accordingly, two broad motive patterns can distinguish individuals by their desire to getalong with others in groups or to get ahead of others to achieve status. Getting alongdomains are conscientiousness (people with predictable behavior), emotional stability(people who are more positive) and agreeableness (people who have more empathy forothers). The authors also characterized emotional stability as a getting ahead domain(people who are more confident), along with extraversion (people who are ambitious) andopenness to experience (people who are curious and eager to learn). Oh and Berry (2008)confirmed these conceptualizations and added that extraversion could also be considered agetting along domain, noting its impersonal components, while conscientiousness could alsobe considered a getting ahead domain, noting its achievement-striving components.
We make the case that these two broad motivational tendencies of getting along andgetting ahead may correspond to preferences for relative, standards-based or group-basedperformance appraisal systems. Relative systems such as the FDRS, characterized bydistinctions between high and low performers, are likely to appeal to individuals focused ongetting ahead, while standards-based or group-based systems may appeal to individualscharacterized by getting along motivational traits.
Due to the achievement-striving nature of conscientiousness and its strong relationshipswith all aspects of job performance (e.g. Barrick and Mount, 1991; Ones et al., 2007), wefollow Oh and Berry’s (2008) conceptualization of conscientiousness as a getting aheaddomain. Based on this conceptualization, one could make the supposition that individualswith greater levels of conscientiousness may find FDRS in organizations to be attractive.FDRS foster competition between individuals and those striving to advance and achievemay find such systems attractive. The social exchange aspect of equity theory additionallysuggests that such individuals will be pleased with greater rewards reaped under systemsin which their performance is so well distinguished:
H2. Conscientiousness (as rated by significant others/close friends) will be positivelyrelated to the attractiveness of an organization utilizing an FDRS.
Extraversion is a second personality factor of the FFM that may relate to the attractivenessof an FDRS. Extraverted individuals’ confidence that their social reputations, ability tointeract positively and assertive nature may bode well in a comparison-based performanceappraisal system. Furthermore, the status-striving nature of extraversion and the tendencyof extraverted individuals to strive for power and influence (cf. Barrick et al., 2002; Barricket al., 2013) suggest that extraverted individuals may find FDRS attractive. Status seekingmay facilitate “getting ahead” (Hogan et al., 1985), feelings of superiority (Barrick et al., 2002)and/or the attraction of social attention (Ashton et al., 2002). Furthermore, as Bendersky and
1176
IJPPM67,7

Shah (2013) have posited, extraverted individuals who work in groups may initially sendhigher status signals to others, but over time group members may instead perceive suchindividuals as self-interested and self-aggrandizing. Blume and colleagues (2013) assertedthat “more extraverted individuals might be more attracted to [forced distribution rankingsystems] if they believe their assertiveness and interpersonal interactions will enable themto make good first impressions and positively influence others’ perceptions” (p. 374). Thesocial exchange aspect of equity theory further underscores the way an FDRS, which welldistinguishes high performers, may appeal to such status-strivers. Therefore, the followinghypothesis is offered:
H3. Extraversion (as rated by significant others/close friends) will be positively relatedto the attractiveness of an organization utilizing an FDRS.
Agreeableness is a third domain of the FFM of personality. Agreeableness includes facets oftrust, altruism, tender-mindedness and compliance (Costa and McCrae, 1992). Agreeableindividuals tend to be passive, conforming (Costa and McCrae, 1992), cooperative ininterpersonal settings (LePine and Van Dyne, 2001), valuing conflict-free, harmoniousrelationships (Randall and Sharples, 2012) and getting along motivational dimensions(Hogan and Holland, 2003). Such individuals seem likely to be accepting of group-basedperformance appraisal systems and less likely to be accepting of systems that pitindividuals against one another. Accordingly, we posit the following:
H4. Agreeableness (as rated by significant others/close friends) will be negatively relatedto the attractiveness of an organization utilizing an FDRS.
H5. Agreeableness (as rated by significant others/close friends) will be positively relatedto the attractiveness of an organization utilizing a group-based performanceappraisal system.
We did not hypothesize relationships with the other two factors of the FFM (openness toexperience and emotional stability), since these dimensions capture more personalcharacteristics (e.g. depression and anxiety or curiosity and broadmindedness) rather thaninterpersonal, relational characteristics (cf. Barrick and Mount, 1991).
2.4 Subordinate influence ethics (SIE) scaleThe SIE scale focuses on upward influence and the ethical tactics that individuals may useto influence superiors to advance in the workplace. Ralston and Pearson (2010) identifiedfour types of influence behaviors used to get ahead: self-serving behaviors;pro-organizational behaviors; maliciously intended behaviors; and impressionmanagement behaviors. Within the present context, we focus on two of the four upwardinfluence behaviors: self-serving behaviors and pro-organizational behaviors. These twotypes correspond to the motivational dimensions of getting along (pro-organizationalbehaviors) and getting ahead (self-serving behaviors).
Self-serving upward influence behaviors exemplify an agency theory interpretation ofhuman behavior (Fama, 1980) in that the individual puts his or her own interests above theinterests of the organization or others. Such individuals seem likely to be motivated to getahead of others within an organizational setting. Similar to the aforementioned gettingahead motivations, such individuals may consider FDRS an attractive way to bedistinguished. Equity theory further suggests such individuals will view the socialexchange under an FDRS to be fair.
Examples of getting ahead behaviors from the SIE scale include: “use their network offriends to discredit a person competing with them for a possible promotion,” “identifyand work for an influential supervisor who could help them get an advancement” and
1177
Forceddistribution
systems

“take credit for a good job that was done by their subordinates” (Ralston and Pearson, 2010).Such competitive, getting ahead types of behaviors seem consistent with the preference for acompetitive type of performance evaluation system, such as the FDRS. Therefore, we offerthe following hypothesis:
H6. Self-serving advancement strategies will be positively related to the attractiveness ofan organization utilizing an FDRS.
Pro-organizational upward influence behaviors are behaviors that tend to be acceptable toorganizations, and sanctioned by organizations. Such behaviors are likely to bepracticed by good organizational citizens motivated by the tendency to get along. Withinthe SIE, items assessing pro-organizational upward influence behaviors include thefollowing: “demonstrate ability to get the job done,” “help subordinates develop their skills”and “maintain good working relationships with other employees” (Ralston and Pearson,2010). These getting along types of behaviors seem consistent with the preference for anon-competitive, standards-based performance appraisal system, so we offer thefollowing hypothesis:
H7. Pro-organizational advancement strategies will be positively related to the attractivenessof an organization utilizing a standards-based performance appraisal system.
3. Methods3.1 Sample and proceduresThe participants of the study consisted of a sample of 148 graduate-level studentsenrolled in MBA courses and 148 matched pairs of close friends or significant others(average age¼ 32.2; 80 males; 70.9 percent with supervisory work experience; 87.2 percentwith work experience; 103 US citizens). Students were enrolled in a medium-sized privateuniversity in the southeastern region of the USA. They were asked to complete the first halfof a questionnaire voluntarily in class. This portion of the survey contained the survey itemsrepresenting the attractiveness scales of the three types of performance appraisal systemsas detailed in the Blume et al. (2013) study. Also included were the items from the PESdeveloped by Campbell et al. (2004) and the items from the SIE scale developed by Ralstonand Pearson (2010). Participants were also asked to complete demographic questions alongwith several questions relating to work experience. Administrators then asked them to codethat survey and the second half of the survey for matching purposes. Administrators askedthem to ask a close friend, relative or a significant other to complete the second half of thesurvey, which consisted of the personality items from the version of the FFM of personality( John and Srivastava, 1999). In total, administrators distributed 163 surveys, yet 15 werenot retained as the matched sample surveys were not returned, yielding a sample size of148 matched pairs of individuals. Respondents who returned the surveys were given extraor course credit.
3.2 Measures3.2.1 Attractiveness of the performance appraisal systems. Following the descriptionsdeveloped in Blume et al. (2013), each of the three types of performance appraisal systemswas characterized by a description of three companies: one that utilized the FDRS, one thatutilized the standards-based system and one that utilized the group-based system.Participants were given the description, along with a list of bullets from the Blume et al.(2013) study with the “proponents’ beliefs” about the system, along with the “detractors’beliefs” about the same system. These beliefs followed a description of the administrativeoutcomes (pay raises) awarded to ratees for various levels of performance (cf. Jawahar and
1178
IJPPM67,7
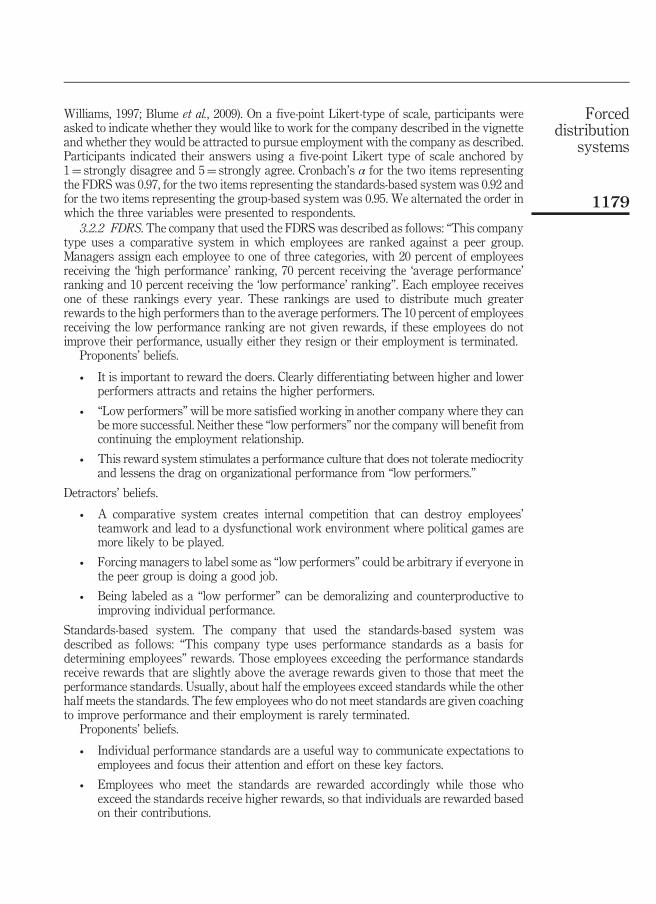
Williams, 1997; Blume et al., 2009). On a five-point Likert-type of scale, participants wereasked to indicate whether they would like to work for the company described in the vignetteand whether they would be attracted to pursue employment with the company as described.Participants indicated their answers using a five-point Likert type of scale anchored by1¼ strongly disagree and 5¼ strongly agree. Cronbach’s α for the two items representingthe FDRS was 0.97, for the two items representing the standards-based system was 0.92 andfor the two items representing the group-based system was 0.95. We alternated the order inwhich the three variables were presented to respondents.
3.2.2 FDRS. The company that used the FDRS was described as follows: “This companytype uses a comparative system in which employees are ranked against a peer group.Managers assign each employee to one of three categories, with 20 percent of employeesreceiving the ‘high performance’ ranking, 70 percent receiving the ‘average performance’ranking and 10 percent receiving the ‘low performance’ ranking”. Each employee receivesone of these rankings every year. These rankings are used to distribute much greaterrewards to the high performers than to the average performers. The 10 percent of employeesreceiving the low performance ranking are not given rewards, if these employees do notimprove their performance, usually either they resign or their employment is terminated.
Proponents’ beliefs.
• It is important to reward the doers. Clearly differentiating between higher and lowerperformers attracts and retains the higher performers.
• “Low performers” will be more satisfied working in another company where they canbe more successful. Neither these “low performers” nor the company will benefit fromcontinuing the employment relationship.
• This reward system stimulates a performance culture that does not tolerate mediocrityand lessens the drag on organizational performance from “low performers.”
Detractors’ beliefs.
• A comparative system creates internal competition that can destroy employees’teamwork and lead to a dysfunctional work environment where political games aremore likely to be played.
• Forcing managers to label some as “low performers” could be arbitrary if everyone inthe peer group is doing a good job.
• Being labeled as a “low performer” can be demoralizing and counterproductive toimproving individual performance.
Standards-based system. The company that used the standards-based system wasdescribed as follows: “This company type uses performance standards as a basis fordetermining employees” rewards. Those employees exceeding the performance standardsreceive rewards that are slightly above the average rewards given to those that meet theperformance standards. Usually, about half the employees exceed standards while the otherhalf meets the standards. The few employees who do not meet standards are given coachingto improve performance and their employment is rarely terminated.
Proponents’ beliefs.
• Individual performance standards are a useful way to communicate expectations toemployees and focus their attention and effort on these key factors.
• Employees who meet the standards are rewarded accordingly while those whoexceed the standards receive higher rewards, so that individuals are rewarded basedon their contributions.
1179
Forceddistribution
systems
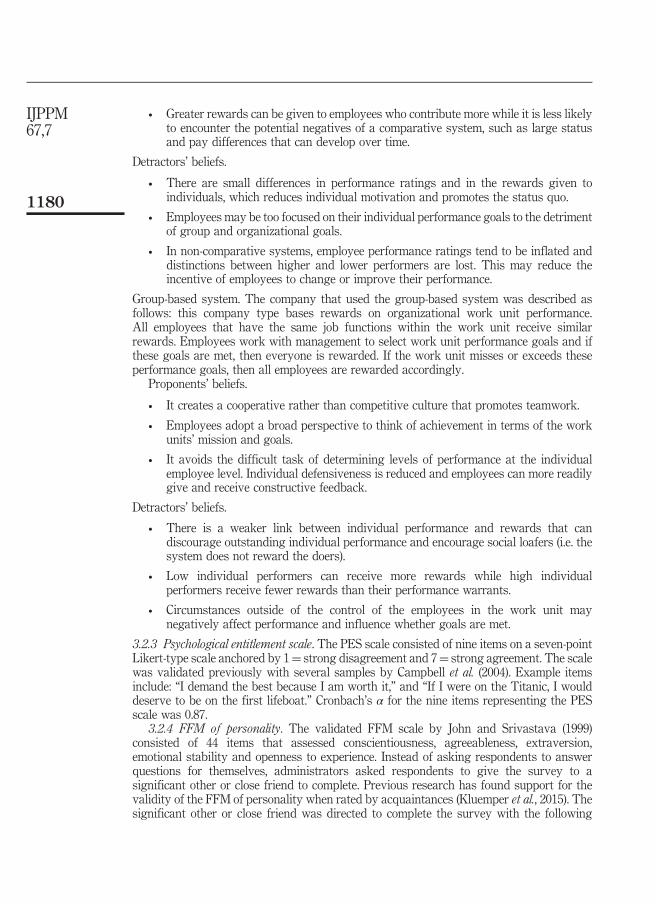
• Greater rewards can be given to employees who contribute more while it is less likelyto encounter the potential negatives of a comparative system, such as large statusand pay differences that can develop over time.
Detractors’ beliefs.
• There are small differences in performance ratings and in the rewards given toindividuals, which reduces individual motivation and promotes the status quo.
• Employees may be too focused on their individual performance goals to the detrimentof group and organizational goals.
• In non-comparative systems, employee performance ratings tend to be inflated anddistinctions between higher and lower performers are lost. This may reduce theincentive of employees to change or improve their performance.
Group-based system. The company that used the group-based system was described asfollows: this company type bases rewards on organizational work unit performance.All employees that have the same job functions within the work unit receive similarrewards. Employees work with management to select work unit performance goals and ifthese goals are met, then everyone is rewarded. If the work unit misses or exceeds theseperformance goals, then all employees are rewarded accordingly.
Proponents’ beliefs.
• It creates a cooperative rather than competitive culture that promotes teamwork.
• Employees adopt a broad perspective to think of achievement in terms of the workunits’ mission and goals.
• It avoids the difficult task of determining levels of performance at the individualemployee level. Individual defensiveness is reduced and employees can more readilygive and receive constructive feedback.
Detractors’ beliefs.
• There is a weaker link between individual performance and rewards that candiscourage outstanding individual performance and encourage social loafers (i.e. thesystem does not reward the doers).
• Low individual performers can receive more rewards while high individualperformers receive fewer rewards than their performance warrants.
• Circumstances outside of the control of the employees in the work unit maynegatively affect performance and influence whether goals are met.
3.2.3 Psychological entitlement scale. The PES scale consisted of nine items on a seven-pointLikert-type scale anchored by 1¼ strong disagreement and 7¼ strong agreement. The scalewas validated previously with several samples by Campbell et al. (2004). Example itemsinclude: “I demand the best because I am worth it,” and “If I were on the Titanic, I woulddeserve to be on the first lifeboat.” Cronbach’s α for the nine items representing the PESscale was 0.87.
3.2.4 FFM of personality. The validated FFM scale by John and Srivastava (1999)consisted of 44 items that assessed conscientiousness, agreeableness, extraversion,emotional stability and openness to experience. Instead of asking respondents to answerquestions for themselves, administrators asked respondents to give the survey to asignificant other or close friend to complete. Previous research has found support for thevalidity of the FFM of personality when rated by acquaintances (Kluemper et al., 2015). Thesignificant other or close friend was directed to complete the survey with the following
1180
IJPPM67,7

statement: “You see your significant other or friend as someone who” – example itemsassessing conscientiousness include: “is a reliable worker” and “does things efficiently.”Cronbach’s α for the nine items representing conscientiousness was 0.84. Example itemsassessing agreeableness include: “is generally trusting” and “has a forgiving nature.”Cronbach’s α for the nine items representing agreeableness was 0.81. Example itemsassessing extraversion include “is outgoing, sociable” and “has an assertive personality.”Cronbach’s α for the eight items representing extraversion was 0.80. Example itemsassessing neuroticism include “can be moody” and “gets nervous easily.” Cronbach’s α forthe eight items representing neuroticism was 0.68. Example items assessing openness toexperience include “is inventive” and “values artistic, aesthetic experiences. Cronbach’s α forthe ten items representing openness was 0.76.
3.2.5 SIE Scale. The validated SIE scale by Ralston and Pearson (2010) consisted of24 items on an eight-point scale derived to assess self-serving behaviors,pro-organizational behaviors, maliciously intended behaviors or image managementbehaviors. We excluded image management items from the analyses, since this variabledid not emerge in numerous cultural contexts when assessed by Ralston and Pearson(2010, p. 162), who determined image management is not “cross-culturally relevant,” sothey deleted image management from their three dimension structure. We retainedmalicious intentions in the model to retain Ralston and Pearson’s (2010) three dimensionstructure, though we did not hypothesize relationships with this variable. Participantsused an EIGHT-point Likert-type of scale anchored by 1¼ extremely unacceptable and8¼ extremely acceptable. Participants were asked to indicate “how ethically acceptableyou think that your coworkers would consider each strategy as a means of influencingsuperiors.” For the present study, we used two of these behaviors: self-serving andpro-organizational behaviors. Example items for self-serving behaviors include: “spreadrumors about someone or something that stands in the way of their advancement” and“try to influence the boss to make a bad decision, if that decision would help him getahead.” Cronbach’s α for the six items representing the self-serving advancementstrategies scale was 0.87. Example items for pro-organizational behaviors include“demonstrate the ability to get the job done” and “behave in a manner that is seen asappropriate in the company.” Cronbach’s α for the six items representing thepro-organizational advancement strategies scale was 0.64.
4. ResultsTable I presents the means, standard deviations and reliability coefficients of the studyvariables. To determine whether any demographic items correlated to the outcomevariables, we ran correlational analyses with dummy variables representing gender, UScitizenship and current employment, along with age, years of full-time work experience andyears of supervisory experience. The US citizenship dummy variable was the onlysignificant correlate of the standards-based (r¼−0.27, po0.01, mean for US citizens¼ 3.50,SD¼ 0.88, n¼ 103; mean for non-US citizens¼ 4.02, SD¼ 0.88, n¼ 44), so we controlled forthat variable accordingly. Overall, results suggested that non-US citizens were moreattracted to the standards-based appraisal systems.
To test H1–H4 and H6, which proposed that psychological entitlement,conscientiousness, extraversion and self-serving strategies would positively relate, andagreeableness would negatively relate to the attractiveness of an FDRS, we ran ahierarchical regression equation. No outliers beyond three standard deviations wereidentified and the variance inflation factors never exceeded 1.64, which is well below thecritical level of 10, considered dubious by Myers (1990). Overall, results suggested that themodel offered an explanation for 11 percent of the variance in the attractiveness of an FDRS.
1181
Forceddistribution
systems

Mean
SDA1P
ABIPA
C1PA
PES
SSMI
POExtra
Cons
Agree
Open
Neuro
A1P
A2.98
1.25
B1P
A3.66
0.9
−0.14
C1PA
2.97
1.12
−0.24
0.03
PES
3.49
1.16
0.20
0.18
−0.06
SS2.19
1.3
0.14
−0.09
−0.08
0.02
MI
1.32
0.72
0.06
−0.05
0.00
0.09
0.57
PO7.1
0.86
0.01
0.02
0.07
−0.05
−0.29
−0.37
Extra
3.62
0.74
−0.02
−0.19
0.08
−0.06
−0.05
−0.12
0.20
Cons
4.16
0.64
−0.21
−0.13
0.01
−0.13
−0.10
−0.17
0.14
0.07
Agree
4.02
0.65
−0.09
−0.09
−0.02
−0.10
−0.12
−0.08
0.16
0.18
0.29
Openn
ess
3.62
0.55
−0.07
−0.10
0.02
−0.04
−0.10
−0.03
0.11
0.20
0.26
0.18
Neuro
2.59
0.78
0.03
0.01
0.04
0.07
0.22
0.18
0.19
−0.29
−0.33
−0.39
0USCit
0.7
0.46
−0.05
−0.27
−0.05
−0.34
−0.01
−0.20
0.04
0.17
0.26
0.01
−0.07
−0.05
Notes
:A1P
Ais
themeanof
thetw
oite
msrepresentin
gtheattractiv
enessof
anFD
RS;
B1P
Ais
themeanof
thetw
oitem
srepresenting
theattractiveness
ofa
standa
rds-ba
sedperforman
ceappraisalsystem;C
1PAisthemeanof
thetw
oite
msrepresenting
theattractiveness
ofagroup-ba
sedperforman
ceappraisalsystem;
PESisthemeanof
thepsycho
logicalentitlementitems;SS
isthemeanof
theself-serving
strategies
forad
vancem
ent;MIisthemeanof
themalicious
intentions
item
s;PO
isthemeanof
thesixpro-orga
nizatio
nalstrategiesforad
vancem
ent;Extra
isthemeanof
theextrav
ersion
items;Co
nsisthemeanof
theconscientio
usness
item
s;Agree
isthemeanof
theagreeablenessitem
s;Openn
essisthemeanof
theop
enness
toexperience
item
s;Neuro
isthemeanof
theneuroticismitem
s;andUSCitisthe
dummyvariab
lerepresenting
USA
citizenship.*C
oefficientsof
0.17
orgreatersign
ificant
atthe0.05
level(tw
o-tailedtest);**coeffic
ientsof
0.21
orgreatersign
ificant
atthe0.01
level(tw
o-tailedtest)
Table I.Means, standarddeviations,correlations andreliability coefficientsof study variables
1182
IJPPM67,7
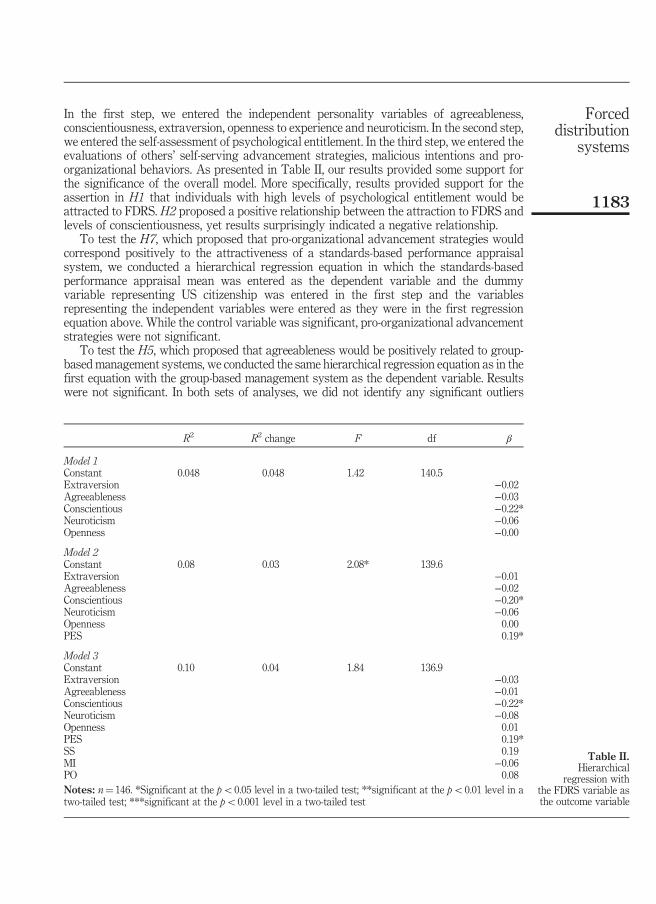
In the first step, we entered the independent personality variables of agreeableness,conscientiousness, extraversion, openness to experience and neuroticism. In the second step,we entered the self-assessment of psychological entitlement. In the third step, we entered theevaluations of others’ self-serving advancement strategies, malicious intentions and pro-organizational behaviors. As presented in Table II, our results provided some support forthe significance of the overall model. More specifically, results provided support for theassertion in H1 that individuals with high levels of psychological entitlement would beattracted to FDRS. H2 proposed a positive relationship between the attraction to FDRS andlevels of conscientiousness, yet results surprisingly indicated a negative relationship.
To test the H7, which proposed that pro-organizational advancement strategies wouldcorrespond positively to the attractiveness of a standards-based performance appraisalsystem, we conducted a hierarchical regression equation in which the standards-basedperformance appraisal mean was entered as the dependent variable and the dummyvariable representing US citizenship was entered in the first step and the variablesrepresenting the independent variables were entered as they were in the first regressionequation above. While the control variable was significant, pro-organizational advancementstrategies were not significant.
To test the H5, which proposed that agreeableness would be positively related to group-based management systems, we conducted the same hierarchical regression equation as in thefirst equation with the group-based management system as the dependent variable. Resultswere not significant. In both sets of analyses, we did not identify any significant outliers
R2 R2 change F df β
Model 1Constant 0.048 0.048 1.42 140.5Extraversion −0.02Agreeableness −0.03Conscientious −0.22*Neuroticism −0.06Openness −0.00
Model 2Constant 0.08 0.03 2.08* 139.6Extraversion −0.01Agreeableness −0.02Conscientious −0.20*Neuroticism −0.06Openness 0.00PES 0.19*
Model 3Constant 0.10 0.04 1.84 136.9Extraversion −0.03Agreeableness −0.01Conscientious −0.22*Neuroticism −0.08Openness 0.01PES 0.19*SS 0.19MI −0.06PO 0.08Notes: n¼ 146. *Significant at the po0.05 level in a two-tailed test; **significant at the po0.01 level in atwo-tailed test; ***significant at the po0.001 level in a two-tailed test
Table II.Hierarchical
regression withthe FDRS variable asthe outcome variable
1183
Forceddistribution
systems
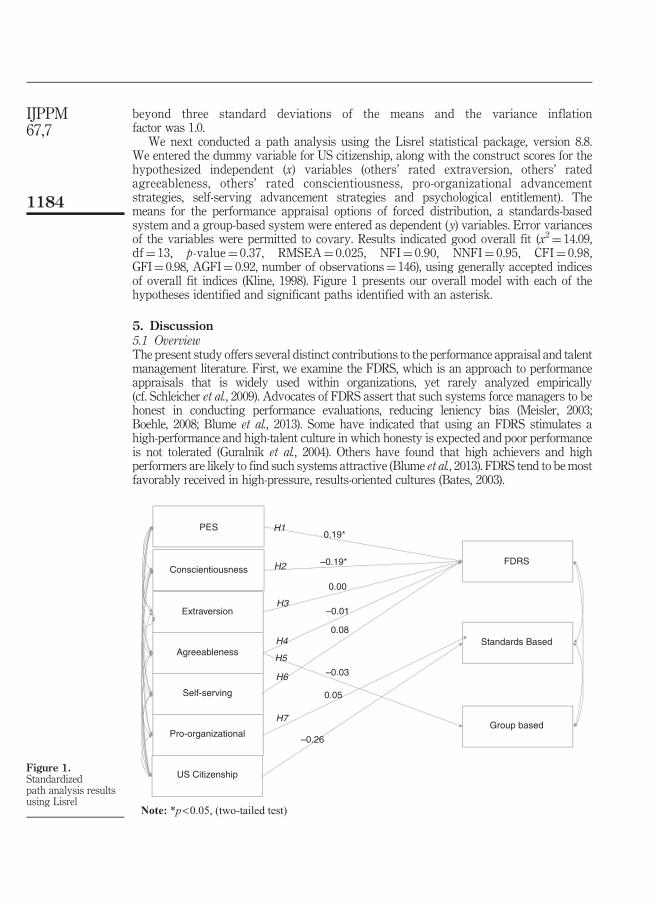
beyond three standard deviations of the means and the variance inflationfactor was 1.0.
We next conducted a path analysis using the Lisrel statistical package, version 8.8.We entered the dummy variable for US citizenship, along with the construct scores for thehypothesized independent (x) variables (others’ rated extraversion, others’ ratedagreeableness, others’ rated conscientiousness, pro-organizational advancementstrategies, self-serving advancement strategies and psychological entitlement). Themeans for the performance appraisal options of forced distribution, a standards-basedsystem and a group-based system were entered as dependent (y) variables. Error variancesof the variables were permitted to covary. Results indicated good overall fit (x2¼ 14.09,df¼ 13, p-value¼ 0.37, RMSEA¼ 0.025, NFI¼ 0.90, NNFI¼ 0.95, CFI¼ 0.98,GFI¼ 0.98, AGFI¼ 0.92, number of observations¼ 146), using generally accepted indicesof overall fit indices (Kline, 1998). Figure 1 presents our overall model with each of thehypotheses identified and significant paths identified with an asterisk.
5. Discussion5.1 OverviewThe present study offers several distinct contributions to the performance appraisal and talentmanagement literature. First, we examine the FDRS, which is an approach to performanceappraisals that is widely used within organizations, yet rarely analyzed empirically(cf. Schleicher et al., 2009). Advocates of FDRS assert that such systems force managers to behonest in conducting performance evaluations, reducing leniency bias (Meisler, 2003;Boehle, 2008; Blume et al., 2013). Some have indicated that using an FDRS stimulates ahigh-performance and high-talent culture in which honesty is expected and poor performanceis not tolerated (Guralnik et al., 2004). Others have found that high achievers and highperformers are likely to find such systems attractive (Blume et al., 2013). FDRS tend to be mostfavorably received in high-pressure, results-oriented cultures (Bates, 2003).
PES
FDRS
Standards Based
Group based
H10.19*
–0.19*
0.00
–0.01
0.08
–0.03
0.05
–0.26
H2
H3
H4
H5
H6
H7
Conscientiousness
Extraversion
Agreeableness
Self-serving
Pro-organizational
US Citizenship
Note: *p<0.05, (two-tailed test)
Figure 1.Standardizedpath analysis resultsusing Lisrel
1184
IJPPM67,7
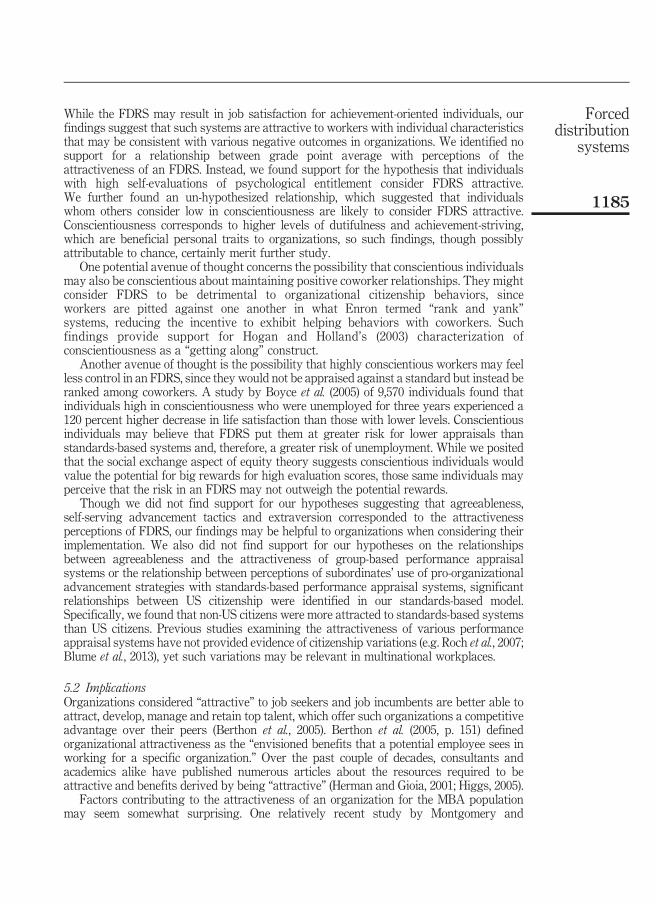
While the FDRS may result in job satisfaction for achievement-oriented individuals, ourfindings suggest that such systems are attractive to workers with individual characteristicsthat may be consistent with various negative outcomes in organizations. We identified nosupport for a relationship between grade point average with perceptions of theattractiveness of an FDRS. Instead, we found support for the hypothesis that individualswith high self-evaluations of psychological entitlement consider FDRS attractive.We further found an un-hypothesized relationship, which suggested that individualswhom others consider low in conscientiousness are likely to consider FDRS attractive.Conscientiousness corresponds to higher levels of dutifulness and achievement-striving,which are beneficial personal traits to organizations, so such findings, though possiblyattributable to chance, certainly merit further study.
One potential avenue of thought concerns the possibility that conscientious individualsmay also be conscientious about maintaining positive coworker relationships. They mightconsider FDRS to be detrimental to organizational citizenship behaviors, sinceworkers are pitted against one another in what Enron termed “rank and yank”systems, reducing the incentive to exhibit helping behaviors with coworkers. Suchfindings provide support for Hogan and Holland’s (2003) characterization ofconscientiousness as a “getting along” construct.
Another avenue of thought is the possibility that highly conscientious workers may feelless control in an FDRS, since they would not be appraised against a standard but instead beranked among coworkers. A study by Boyce et al. (2005) of 9,570 individuals found thatindividuals high in conscientiousness who were unemployed for three years experienced a120 percent higher decrease in life satisfaction than those with lower levels. Conscientiousindividuals may believe that FDRS put them at greater risk for lower appraisals thanstandards-based systems and, therefore, a greater risk of unemployment. While we positedthat the social exchange aspect of equity theory suggests conscientious individuals wouldvalue the potential for big rewards for high evaluation scores, those same individuals mayperceive that the risk in an FDRS may not outweigh the potential rewards.
Though we did not find support for our hypotheses suggesting that agreeableness,self-serving advancement tactics and extraversion corresponded to the attractivenessperceptions of FDRS, our findings may be helpful to organizations when considering theirimplementation. We also did not find support for our hypotheses on the relationshipsbetween agreeableness and the attractiveness of group-based performance appraisalsystems or the relationship between perceptions of subordinates’ use of pro-organizationaladvancement strategies with standards-based performance appraisal systems, significantrelationships between US citizenship were identified in our standards-based model.Specifically, we found that non-US citizens were more attracted to standards-based systemsthan US citizens. Previous studies examining the attractiveness of various performanceappraisal systems have not provided evidence of citizenship variations (e.g. Roch et al., 2007;Blume et al., 2013), yet such variations may be relevant in multinational workplaces.
5.2 ImplicationsOrganizations considered “attractive” to job seekers and job incumbents are better able toattract, develop, manage and retain top talent, which offer such organizations a competitiveadvantage over their peers (Berthon et al., 2005). Berthon et al. (2005, p. 151) definedorganizational attractiveness as the “envisioned benefits that a potential employee sees inworking for a specific organization.” Over the past couple of decades, consultants andacademics alike have published numerous articles about the resources required to beattractive and benefits derived by being “attractive” (Herman and Gioia, 2001; Higgs, 2005).
Factors contributing to the attractiveness of an organization for the MBA populationmay seem somewhat surprising. One relatively recent study by Montgomery and
1185
Forceddistribution
systems

Ramus (2011) found that MBA students look for organizations that offer an intellectualchallenge. The study further found that MBA students are willing to forgo financial benefitsto work for a socially responsible organization with a good reputation. One way to achieve agood reputation is through talent management.
Talent management is a business strategy that corresponds to an organization’scommitment to attracting, developing, managing and retaining talented employees.Motivating and engaging employees through performance management is one component.Performance evaluations in some organizations are significantly important for motivatingstaff, communicating and aligning organizational goals, enhancing positive relationshipsbetween superiors and subordinates, and developing positive attitudes and behaviors(Ahmed et al., 2013).
Research firm CEB estimates that a company of 10,000 employees typically spends $35mon performance evaluations annually (Cunningham, 2015). Furthermore, CEB has found that95 percent of managers are dissatisfied with the way their companies conduct performancereviews, while 90 percent of human resource managers in firms have indicated that suchreviews do not accurately assess performance (Cunningham, 2015). Such findings aredisturbing, given the primary goal of many organizations in crafting performance appraisalsystems is to improve individual and organizational performance (Ahmed et al., 2013).
A recent study by Gallup (Clifton, 2017) found that only 33 percent of US employees areactively engaged; 51 percent are “just there” and 16 percent are actively disengaged withmalicious intentions to destroy what the most engaged employees are building. Aftercommenting on these findings, Jim Clifton called on companies to be more disruptive bychucking forced ranking systems and annual reviews and replacing them with morefrequent coaching sessions.
A small number of firms have been experimenting with simpler, more informal appraisalsystems characterized by more frequent, motivational conversations between managers andsubordinates (Kauflin, 2017). Some of the companies that have made these changes haverecently been ranked on the Forbes’ list of the happiest companies in which to work. The mainpremise behind these no ratings plans is that offering more immediate feedback to workersand encouraging and coaching good behaviors by playing to employee strengths enhancesperformance (Sahadi, 2015). Lisa Barry, the global talent, performance and rewards leader forDeloitte Touche Tohmatsu, suggests that FDRS are no longer useful in the context oftalent-rich, knowledge-driven workforces. FDRS work better for lower level positions (DeloitteCIO Journal, 2014). Despite such assertions and as noted at the outset, 21 percent of Fortune500 and mid-size firms continue to use FDRS (Sahadi, 2015).
Our results provide insight into why some organizations may have stopped using FDRSand why others may be dissatisfied with the system. While energizing employees to performat higher levels through competitive systems such as the FDRS may create a competitiveatmosphere that elevates the performance of all employees, an equally plausible outcome isthe creation of a cutthroat environment where potential good ideas are never brought tolight for fear of not being able to establish quantifiable results in an evaluation cycle. Enronprovides a good example of the latter with its well-known rank and yank evaluation system,illustrating the perils of pushing employees to focus on getting ahead in the short term at theexpense of other stakeholders (Gibney, 2005). In an era in which businesses have come tovalue corporate responsibility and sustainability, developing human resource systems thatpromote the values of employees who can simultaneously get along and get ahead well intothe foreseeable future is important.
5.3 Limitations and suggestions for future researchWhile our study offered several important implications to organizations determiningthe attractiveness of various methods of performance appraisal, several limitations should
1186
IJPPM67,7
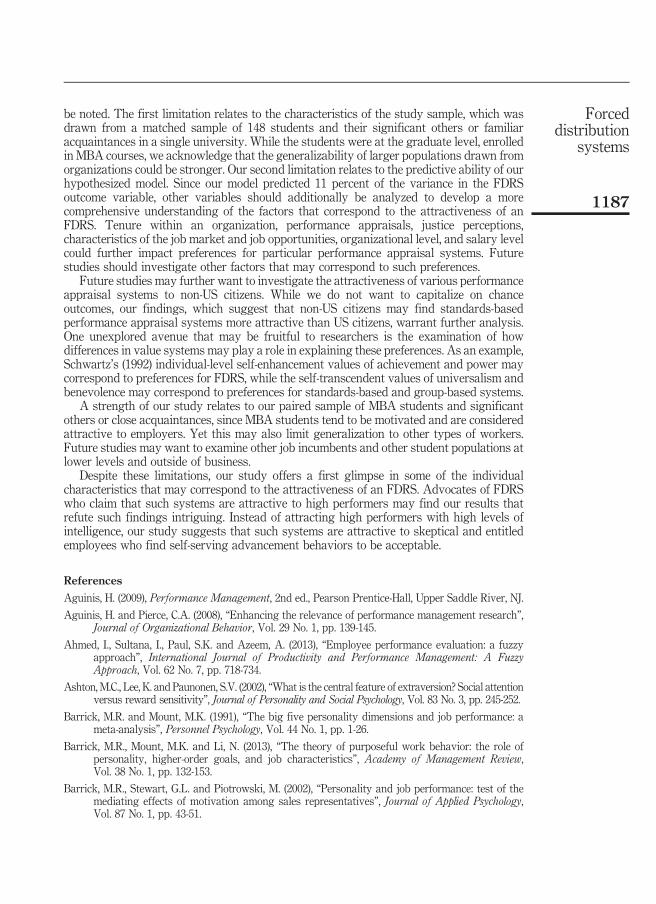
be noted. The first limitation relates to the characteristics of the study sample, which wasdrawn from a matched sample of 148 students and their significant others or familiaracquaintances in a single university. While the students were at the graduate level, enrolledin MBA courses, we acknowledge that the generalizability of larger populations drawn fromorganizations could be stronger. Our second limitation relates to the predictive ability of ourhypothesized model. Since our model predicted 11 percent of the variance in the FDRSoutcome variable, other variables should additionally be analyzed to develop a morecomprehensive understanding of the factors that correspond to the attractiveness of anFDRS. Tenure within an organization, performance appraisals, justice perceptions,characteristics of the job market and job opportunities, organizational level, and salary levelcould further impact preferences for particular performance appraisal systems. Futurestudies should investigate other factors that may correspond to such preferences.
Future studies may further want to investigate the attractiveness of various performanceappraisal systems to non-US citizens. While we do not want to capitalize on chanceoutcomes, our findings, which suggest that non-US citizens may find standards-basedperformance appraisal systems more attractive than US citizens, warrant further analysis.One unexplored avenue that may be fruitful to researchers is the examination of howdifferences in value systems may play a role in explaining these preferences. As an example,Schwartz’s (1992) individual-level self-enhancement values of achievement and power maycorrespond to preferences for FDRS, while the self-transcendent values of universalism andbenevolence may correspond to preferences for standards-based and group-based systems.
A strength of our study relates to our paired sample of MBA students and significantothers or close acquaintances, since MBA students tend to be motivated and are consideredattractive to employers. Yet this may also limit generalization to other types of workers.Future studies may want to examine other job incumbents and other student populations atlower levels and outside of business.
Despite these limitations, our study offers a first glimpse in some of the individualcharacteristics that may correspond to the attractiveness of an FDRS. Advocates of FDRSwho claim that such systems are attractive to high performers may find our results thatrefute such findings intriguing. Instead of attracting high performers with high levels ofintelligence, our study suggests that such systems are attractive to skeptical and entitledemployees who find self-serving advancement behaviors to be acceptable.
References
Aguinis, H. (2009), Performance Management, 2nd ed., Pearson Prentice-Hall, Upper Saddle River, NJ.
Aguinis, H. and Pierce, C.A. (2008), “Enhancing the relevance of performance management research”,Journal of Organizational Behavior, Vol. 29 No. 1, pp. 139-145.
Ahmed, I., Sultana, I., Paul, S.K. and Azeem, A. (2013), “Employee performance evaluation: a fuzzyapproach”, International Journal of Productivity and Performance Management: A FuzzyApproach, Vol. 62 No. 7, pp. 718-734.
Ashton, M.C., Lee, K. and Paunonen, S.V. (2002), “What is the central feature of extraversion? Social attentionversus reward sensitivity”, Journal of Personality and Social Psychology, Vol. 83 No. 3, pp. 245-252.
Barrick, M.R. and Mount, M.K. (1991), “The big five personality dimensions and job performance: ameta-analysis”, Personnel Psychology, Vol. 44 No. 1, pp. 1-26.
Barrick, M.R., Mount, M.K. and Li, N. (2013), “The theory of purposeful work behavior: the role ofpersonality, higher-order goals, and job characteristics”, Academy of Management Review,Vol. 38 No. 1, pp. 132-153.
Barrick, M.R., Stewart, G.L. and Piotrowski, M. (2002), “Personality and job performance: test of themediating effects of motivation among sales representatives”, Journal of Applied Psychology,Vol. 87 No. 1, pp. 43-51.
1187
Forceddistribution
systems
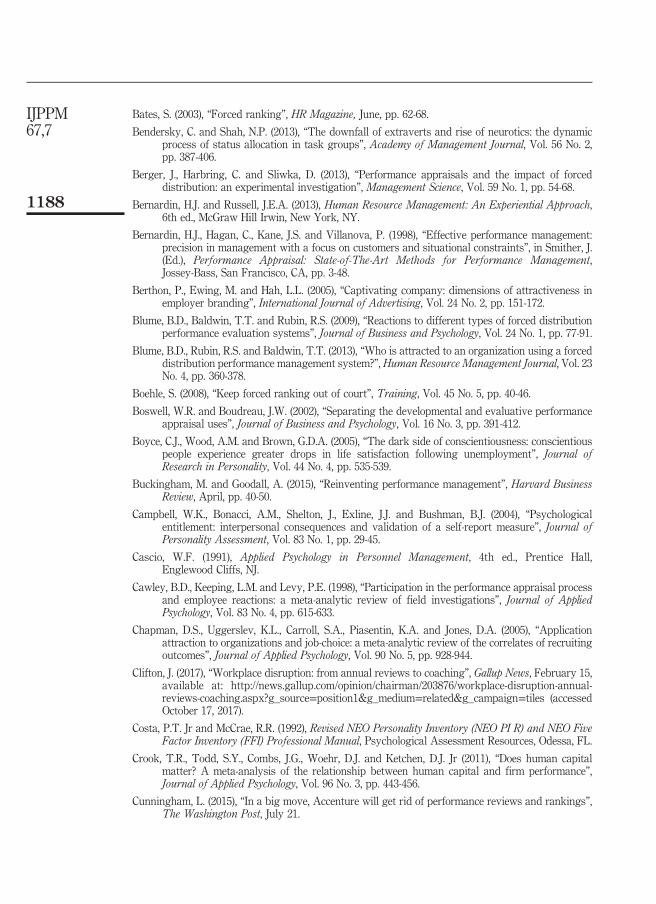
Bates, S. (2003), “Forced ranking”, HR Magazine, June, pp. 62-68.
Bendersky, C. and Shah, N.P. (2013), “The downfall of extraverts and rise of neurotics: the dynamicprocess of status allocation in task groups”, Academy of Management Journal, Vol. 56 No. 2,pp. 387-406.
Berger, J., Harbring, C. and Sliwka, D. (2013), “Performance appraisals and the impact of forceddistribution: an experimental investigation”, Management Science, Vol. 59 No. 1, pp. 54-68.
Bernardin, H.J. and Russell, J.E.A. (2013), Human Resource Management: An Experiential Approach,6th ed., McGraw Hill Irwin, New York, NY.
Bernardin, H.J., Hagan, C., Kane, J.S. and Villanova, P. (1998), “Effective performance management:precision in management with a focus on customers and situational constraints”, in Smither, J.(Ed.), Performance Appraisal: State-of-The-Art Methods for Performance Management,Jossey-Bass, San Francisco, CA, pp. 3-48.
Berthon, P., Ewing, M. and Hah, L.L. (2005), “Captivating company: dimensions of attractiveness inemployer branding”, International Journal of Advertising, Vol. 24 No. 2, pp. 151-172.
Blume, B.D., Baldwin, T.T. and Rubin, R.S. (2009), “Reactions to different types of forced distributionperformance evaluation systems”, Journal of Business and Psychology, Vol. 24 No. 1, pp. 77-91.
Blume, B.D., Rubin, R.S. and Baldwin, T.T. (2013), “Who is attracted to an organization using a forceddistribution performance management system?”, Human Resource Management Journal, Vol. 23No. 4, pp. 360-378.
Boehle, S. (2008), “Keep forced ranking out of court”, Training, Vol. 45 No. 5, pp. 40-46.
Boswell, W.R. and Boudreau, J.W. (2002), “Separating the developmental and evaluative performanceappraisal uses”, Journal of Business and Psychology, Vol. 16 No. 3, pp. 391-412.
Boyce, C.J., Wood, A.M. and Brown, G.D.A. (2005), “The dark side of conscientiousness: conscientiouspeople experience greater drops in life satisfaction following unemployment”, Journal ofResearch in Personality, Vol. 44 No. 4, pp. 535-539.
Buckingham, M. and Goodall, A. (2015), “Reinventing performance management”, Harvard BusinessReview, April, pp. 40-50.
Campbell, W.K., Bonacci, A.M., Shelton, J., Exline, J.J. and Bushman, B.J. (2004), “Psychologicalentitlement: interpersonal consequences and validation of a self-report measure”, Journal ofPersonality Assessment, Vol. 83 No. 1, pp. 29-45.
Cascio, W.F. (1991), Applied Psychology in Personnel Management, 4th ed., Prentice Hall,Englewood Cliffs, NJ.
Cawley, B.D., Keeping, L.M. and Levy, P.E. (1998), “Participation in the performance appraisal processand employee reactions: a meta-analytic review of field investigations”, Journal of AppliedPsychology, Vol. 83 No. 4, pp. 615-633.
Chapman, D.S., Uggerslev, K.L., Carroll, S.A., Piasentin, K.A. and Jones, D.A. (2005), “Applicationattraction to organizations and job-choice: a meta-analytic review of the correlates of recruitingoutcomes”, Journal of Applied Psychology, Vol. 90 No. 5, pp. 928-944.
Clifton, J. (2017), “Workplace disruption: from annual reviews to coaching”, Gallup News, February 15,available at: http://news.gallup.com/opinion/chairman/203876/workplace-disruption-annual-reviews-coaching.aspx?g_source=position1&g_medium=related&g_campaign=tiles (accessedOctober 17, 2017).
Costa, P.T. Jr and McCrae, R.R. (1992), Revised NEO Personality Inventory (NEO PI R) and NEO FiveFactor Inventory (FFI) Professional Manual, Psychological Assessment Resources, Odessa, FL.
Crook, T.R., Todd, S.Y., Combs, J.G., Woehr, D.J. and Ketchen, D.J. Jr (2011), “Does human capitalmatter? A meta-analysis of the relationship between human capital and firm performance”,Journal of Applied Psychology, Vol. 96 No. 3, pp. 443-456.
Cunningham, L. (2015), “In a big move, Accenture will get rid of performance reviews and rankings”,The Washington Post, July 21.
1188
IJPPM67,7

Deloitte CIO Journal (2014), “It’s official: forced ranking is dead”, available at: http://deloitte.wsj.com/cio/2014/06/10/its-official-forced-ranking-is-dead/ (accessed June 12, 2017).
Del Vecchio, D., Jarvis, C.B., Klink, R.R. and Dineen, B.R. (2007), “Leveraging brand equity to attracthuman capital”, Vol. 18 No. 3, pp. 149-164.
Fama, E.F. (1980), “Agency problems and the theory of the firm”, Journal of Political Economy, Vol. 88No. 2, pp. 288-307.
Feather, N.T. (1999), “Judgments of deservingness: studies in the psychology of justice andachievement”, Personality and Social Psychology Review, Vol. 3 No. 2, pp. 86-107.
Gibney, A. (2005), “Enron: the smartest guys in the room”, available at: https://freedocumentaries.org/documentary/enron-the-smartest-guys-in-the-room (accessed June 12, 2017).
Guralnik, O., Rozmarin, E. and So, A. (2004), “Forced distribution: is it right for you?”, Human ResourceDevelopment Quarterly, Vol. 15 No. 3, pp. 339-345.
Harvey, P. and Harris, K.J. (2010), “Frustration-based outcomes of entitlement and the influence ofsupervisor communication”, Human Relations, Vol. 63 No. 11, pp. 1639-1660.
Harvey, P. and Martinko, M.J. (2009), “An empirical examination of the role of attributions inpsychological entitlement and its outcomes”, Journal of Organizational Behavior, Vol. 30 No. 4,pp. 459-476.
Harvey, P., Harris, K.J., Gillis, W.E. and Martinko, M.J. (2014), “Abusive supervision and the entitledemployee”, The Leadership Quarterly, Vol. 25 No. 2, pp. 204-217.
Heneman, R. (1986), “The relationship between supervisory ratings and results-oriented measures ofperformance: a meta-analysis”, Personnel Psychology, Vol. 39 No. 4, pp. 811-826.
Herman, R.E. and Gioia, J.L. (2001), “Helping your organization become an employer of choice”,Employment Relations Today, Vol. 28 No. 2, pp. 63-78.
Higgs, M. (2005), “You can pay to be an employer of choice?”, Employee Benefits, Vol. 18, December.
Hogan, J. and Holland, B. (2003), “Using theory to evaluate personality and job performance relations: asocioanalytic perspective”, Journal of Applied Psychology, Vol. 88 No. 1, pp. 100-112.
Hogan, R., Jones, W. and Cheek, J.M. (1985), “Socioanalytic theory: an alternative to armadillopsychology”, in Schlenker, B.R. (Ed.), The Self and Social Life, McGraw Hill, New York, NY,pp. 175-198.
Huselid, M.A., Becker, B.E. and Beatty, R.W. (2005), The Workforce Scorecard: Managing HumanCapital to Execute Strategy, Harvard Business School Press, Boston, MA.
Jawahar, I.M. and Williams, C.R. (1997), “Where all the children are above average: the performanceappraisal purpose effect”, Personnel Psychology, Vol. 50 No. 4, pp. 905-925.
John, O.P. and Srivastava, S. (1999), “The Big Five trait taxonomy: history, measurement, andtheoretical perspectives”, in Pervin, L.A. and John, O.P. (Eds), Handbook of Personality: Theoryand Research, 2nd ed., Guilford, New York, NY, pp. 102-138.
Judge, T.A., Bono, J.E., Ilies, R. and Gerhardt, M.W. (2002), “Personality and leadership: a qualitativeand quantitative review”, Journal of Applied Psychology, Vol. 87 No. 4, pp. 765-780.
Judge, T.A., Erez, A., Bono, J.E. and Thoresen, C.J. (2003), “The core self-evaluations scale: developmentof a measure”, Journal of Applied Psychology, Vol. 56 No. 2, pp. 303-331.
Kauflin, J. (2017), “Hate performance reviews? Good news. They’re getting shorter and simpler”, Forbes,March 9.
Kline, R.B. (1998), Principles and Practices of Structural Equation Modeling, Guilford, New York, NY.
Kluemper, D.H., McLarty, B.D. and Bing, M.N. (2015), “Acquaintance ratings of the Big Five personalitytraits: incremental validity beyond and interactive effects with self-reports in the prediction ofworkplace deviance”, Journal of Applied Psychology, Vol. 100 No. 1, pp. 237-248.
Kristof, A.L. (1996), “Person-organization fit: an integrative review of its conceptualizations,measurement and implications”, Personnel Psychology, Vol. 49 No. 1, pp. 1-49.
1189
Forceddistribution
systems
Kristof-Brown, A.L., Zimmerman, R.D. and Johnson, E.C. (2005), “Consequences of individuals’ fit at work:a meta-analysis of person–job, person–organization, person–group, and person–supervisor fit”,Personnel Psychology, Vol. 58 No. 2, pp. 281-342.
Kuvaas, B. (2006), “Performance appraisal satisfaction and employee outcomes: mediating andmoderating roles of work behavior”, International Journal of Human Resource Management,Vol. 17 No. 3, pp. 504-522.
LePine, J. and Van Dyne, L. (2001), “Voice and cooperative behavior as contrasting forms of contextualperformance: evidence of differential relationships with team effectiveness criteria”, Journal ofApplied Psychology, Vol. 86 No. 2, pp. 326-336.
Meisler, A. (2003), “Dead man’s curve”, Workforce, July, pp. 44-49.
Montgomery, D.B. and Ramus, C.A. (2011), “Calibrating MBA job preferences in the 21st century”,Academy of Management Learning and Education, Vol. 10 No. 1, pp. 9-26.
Mount, M.K., Barrick, M.R., Scullen, S.M. and Rounds, J. (2005), “Higher-order dimensions of the BigFive personality traits and the Big Six vocational interests types”, Personality Psychology, Vol. 58No. 2, pp. 447-478.
Myers, R. (1990), Classical and Modern Regression with Applications, 2nd ed., Duxbury Press,Boston, MA.
Nathan, B.R. and Alexander, R.A. (1988), “A comparison of criteria for test validation: a meta-analyticinvestigation”, Personnel Psychology, Vol. 41 No. 3, pp. 517-535.
Nisen, M. (2015), “Why GE had to kill its annual performance appraisals after three decades”, availableat: http://qz.com/428813/ge-performance-review-strategy-shift/ (accessed June 10, 2017).
Oh, I. and Berry, C.M. (2008), “The five-factor model of personality and managerial performance:validity gains through the use of 360 degree performance ratings”, Journal of Applied Psychology,Vol. 94 No. 6, pp. 1498-1513.
Ones, D.S., Dilchert, S., Viswesvaran, C. and Judge, T.A. (2007), “In support of personality assessmentin organizational settings”, Personnel Psychology, Vol. 60 No. 4, pp. 995-1027.
Osborne, T. and McCann, L.A. (2004), “Forced ranking and age-related employment discrimination”,Human Rights, Vol. 31 No. 2, pp. 6-10.
Pfeffer, J. (2001), “Fighting the war for talent is hazardous to your organization’s health”,Organizational Dynamics, Vol. 29 No. 4, pp. 248-259.
Pfeffer, J. and Sutton, R.I. (2000), The Knowing–Doing Gap: How Smart Companies Turn Knowledgeinto Action, Harvard Business School Press, Boston, MA.
Ralston, D.A. and Pearson, A. (2010), “The cross-cultural evolution of the subordinate influence ethicsmeasure”, Journal of Business Ethics, Vol. 96 No. 1, pp. 149-168.
Ramanathan, A. (2015), “Time’s up for the bell curve?”, available at: www.livemint.com/Leisure/BxT5P4rKYApgPPePC8DfuI/Times-up-for-the-bell-curve.html (accessed June 12, 2017).
Ramirez, J.C. (2013), “Rethinking the review: after fifty years of debate, has the time finally come tochuck the review?”, HR Online, available at: www.hreonline.com/HRE/view/story.jhtml?id=534355695 (accessed June 12, 2017).
Randall, R. and Sharples, D. (2012), “The impact of rater agreeableness and rating context on theevaluation of poor performance”, Journal of Occupational and Organizational Psychology, Vol. 85No. 1, pp. 42-59.
Roch, S.G., Sternburgh, A.M. and Caputo, P.M. (2007), “Absolute vs relative performance ratingformats: implications for fairness and organizational justice”, International Journal of Selectionand Assessment, Vol. 15 No. 3, pp. 302-316.
Sahadi, J. (2015), “Amazon workforce raises dread of ‘rank and yank’ reviews, CNN: money”,available at: http://money.cnn.com/2015/08/17/news/amazon-performance-review/ (accessedJune 12, 2017).
Schleicher, D.J., Bull, R.A. and Green, S.G. (2009), “Rater reactions to forced distribution ratingsystems”, Journal of Management, Vol. 35 No. 4, pp. 899-927.
1190
IJPPM67,7
Schwartz, S.H. (1992), “Universals in the content and structure of values: theoretical advances andempirical tests in 20 countries”, Advances in Experimental Social Psychology, Vol. 25 No. 1,pp. 1-65.
Snow, J.N., Kern, R.M. and Curlette, W.L. (2001), “Identifying personality traits associated with attritionin systematic training for effective parenting groups”, The Family Journal: Counseling andTherapy for Couples and Families, Vol. 9 No. 2, pp. 102-108.
Staw, B.M. (1986), “Organizational psychology and the pursuit of the happy/productive worker”,California Management Review, Vol. 28 No. 4, pp. 40-53.
Twenge, J. and Foster, J. (2008), “Mapping the scale of the narcissism epidemic: increases in narcissism2002-2007 within ethnic groups”, Journal of Research in Personality, Vol. 42 No. 6, pp. 1619-1622.
Welch, J. (2013), “Jack Welch: ‘rank and yank.’ That’s not how it’s done. Using ‘differentiation’ alignsemployee performance with an organization’s mission and values”, The Wall Street Journal,November, pp. 325-341.
Welch, J. and Byrne, J.A. (2001), Jack: Straight from the Gut, Warner Business Books, New York, NY.
Further reading
Adams, J.S. (1963), “Towards an understanding of inequity”, The Journal of Abnormal and SocialPsychology, Vol. 67 No. 5, pp. 422-436.
Corresponding authorStephanie J. Thomason can be contacted at: [email protected]
For instructions on how to order reprints of this article, please visit our website:www.emeraldgrouppublishing.com/licensing/reprints.htmOr contact us for further details: [email protected]
1191
Forceddistribution
systems

USA TriathlonA 2010–2015 case study of financial
performance using effectiveness indicatorsand efficiencyPeter Omondi-Ochieng
Department of Kinesiology, University of Louisiana at Lafayette,Lafayette, Louisiana, USA
AbstractPurpose – The purpose of this paper is to examine the 2010–2015 financial performance (FP) of thenational non-profit USA Triathlon (UST) using financial effectiveness (FE) indicators and financialefficiency (FY) ratios.Design/methodology/approach – Archival data were used together with a case study method. FP wasevaluated by net income; FE was indicated by total assets and total revenues, while FY was examined byprogram services ratios and support services ratios.Findings – On average, the FP of the organization was positive ($2,100,591 net income per year), FE wasmoderate (66 percent increases in assets and revenues) and the FY was mixed (80 percent revenues spent onprogram services with an impressive return on asset of 14 percent).Research limitations/implications – By using case study method, the results may not be generalizable toother national non-profit sports organizations with non-financial objectives.Practical implications – The results revealed that overall FP is a product of both FE and FY, making thestudy valuable to managers who are often faced with unreliable financial resources.Originality/value – The study utilized both FE and FY measures to evaluate the FPs of UST – a majorshortfall in similar studies.Keywords Financial performance, Non-profit organization, Financial efficiency, Financial effectivenessPaper type Research paper
1. IntroductionFounded in 1982, USA Triathlon (UST) is the national governing body for the sport oftriathlon, making it responsible for the conduct and administration of duathlone, aquathlone,aquabike, Winter triathlon, off-road triathlon and paratriathlon in the USA. UST sanctionsmore than 4,300 races and connects with nearly 500,000 members annually. UST providesleadership and support to elite athletes, coaches and race directors on the grassroots level andthose competing at the international level. The mission of UST “is to grow and inspirethe triathlon community,” and its vision is “to provide the resources required for all in thetriathlon community to reach their full potential.” UST has three core values: we value ourmembers and other constituents; we value safety, fairness, motivation and achievement incompetition; and we value fitness and health through exercise, the spirit of competitivenessand the pursuit of excellence – the multisport lifestyle (www.teamusa.org).
UST, as most NNSOs, constantly faces organizational performance (OP) pressurescompounded by small budgets and unreliable donations which make it challenging to fulfilltheir vision and mission objectives. OP is the combined measurement of effectiveness andefficiency so as to ascertain the degree to which desired goals are attained (Kumar andGulati, 2009; Mouzas, 2006). The components of OP represents an index of botheffectiveness and efficiency used to quantify overall performance of organizations. Specificto NNSOs, OP can be divided into two broad categories – on-field and off-field performances(Table I).
As indicated in Table I, on-field performances can be measured by win–loss records,world rankings and number of medals, amongst others, while off-field performances may be
International Journal ofProductivity and PerformanceManagementVol. 67 No. 7, 2018pp. 1192-1213© Emerald Publishing Limited1741-0401DOI 10.1108/IJPPM-09-2017-0240
Received 29 September 2017Revised 10 December 2017Accepted 6 January 2018
The current issue and full text archive of this journal is available on Emerald Insight at:www.emeraldinsight.com/1741-0401.htm
1192
IJPPM67,7
Quarto trim size: 174mm x 240mm
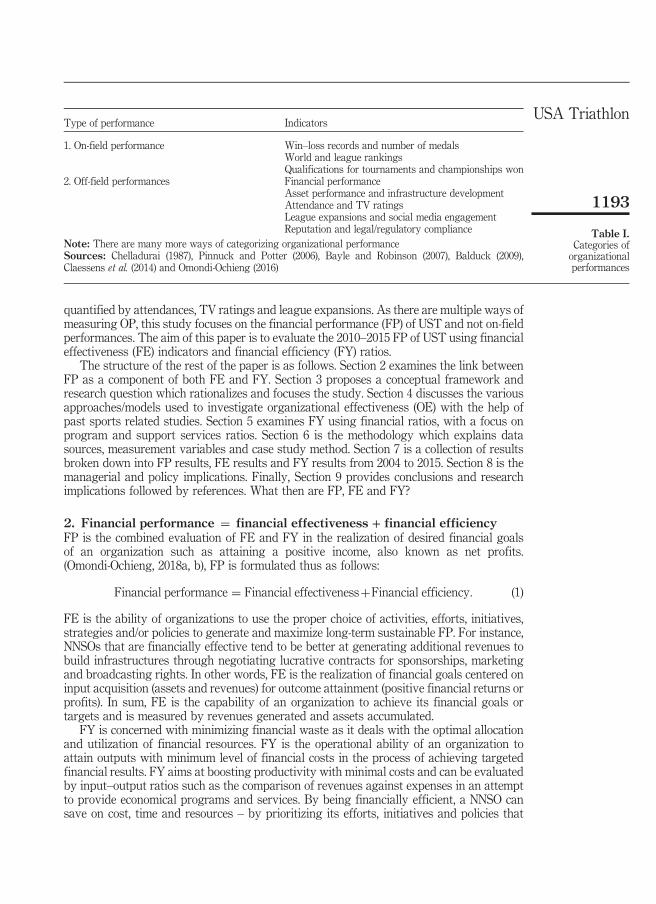
quantified by attendances, TV ratings and league expansions. As there are multiple ways ofmeasuring OP, this study focuses on the financial performance (FP) of UST and not on-fieldperformances. The aim of this paper is to evaluate the 2010–2015 FP of UST using financialeffectiveness (FE) indicators and financial efficiency (FY) ratios.
The structure of the rest of the paper is as follows. Section 2 examines the link betweenFP as a component of both FE and FY. Section 3 proposes a conceptual framework andresearch question which rationalizes and focuses the study. Section 4 discusses the variousapproaches/models used to investigate organizational effectiveness (OE) with the help ofpast sports related studies. Section 5 examines FY using financial ratios, with a focus onprogram and support services ratios. Section 6 is the methodology which explains datasources, measurement variables and case study method. Section 7 is a collection of resultsbroken down into FP results, FE results and FY results from 2004 to 2015. Section 8 is themanagerial and policy implications. Finally, Section 9 provides conclusions and researchimplications followed by references. What then are FP, FE and FY?
2. Financial performance ¼ financial effectiveness + financial efficiencyFP is the combined evaluation of FE and FY in the realization of desired financial goalsof an organization such as attaining a positive income, also known as net profits.(Omondi-Ochieng, 2018a, b), FP is formulated thus as follows:
Financial performance ¼ Financial effectivenessþFinancial efficiency: (1)
FE is the ability of organizations to use the proper choice of activities, efforts, initiatives,strategies and/or policies to generate and maximize long-term sustainable FP. For instance,NNSOs that are financially effective tend to be better at generating additional revenues tobuild infrastructures through negotiating lucrative contracts for sponsorships, marketingand broadcasting rights. In other words, FE is the realization of financial goals centered oninput acquisition (assets and revenues) for outcome attainment (positive financial returns orprofits). In sum, FE is the capability of an organization to achieve its financial goals ortargets and is measured by revenues generated and assets accumulated.
FY is concerned with minimizing financial waste as it deals with the optimal allocationand utilization of financial resources. FY is the operational ability of an organization toattain outputs with minimum level of financial costs in the process of achieving targetedfinancial results. FY aims at boosting productivity with minimal costs and can be evaluatedby input–output ratios such as the comparison of revenues against expenses in an attemptto provide economical programs and services. By being financially efficient, a NNSO cansave on cost, time and resources – by prioritizing its efforts, initiatives and policies that
Type of performance Indicators
1. On-field performance Win–loss records and number of medalsWorld and league rankingsQualifications for tournaments and championships won
2. Off-field performances Financial performanceAsset performance and infrastructure developmentAttendance and TV ratingsLeague expansions and social media engagementReputation and legal/regulatory compliance
Note: There are many more ways of categorizing organizational performanceSources: Chelladurai (1987), Pinnuck and Potter (2006), Bayle and Robinson (2007), Balduck (2009),Claessens et al. (2014) and Omondi-Ochieng (2016)
Table I.Categories oforganizationalperformances
1193
USA Triathlon

enhance overall program and services efficiencies. Another purpose of this study is toanalyze the FY of UST using program service ratios and support services ratios from2010 to 2015.
3. Conceptual framework and research questionsThis study argues that sustainable FP is the ultimate goal of most NNSOs as captured byFE and FY in a three-stage conceptual framework (Figure 1). The prescriptive frameworkstresses the inter-correlation between the two components in assessing the FP of NNSOsbased on the following reasons. First, FE relates to the ability of a NNSO to acquire neededbut scarce financial resources such as assets and revenues. Second, upon acquiring thescarce financial resources, the resources can be utilized efficiently in providing operationalservices and programs at low costs – as increasingly demanded by donors who stressfinancial accountability, thrift and transparency. Additionally, rising competition forrevenues, medals and international recognition has pushed NNSOs to attempt to be botheffective and efficient – a very difficult endeavor to accomplish. The major issues addressedin this study is to ascertain whether UST has been both financially effective and financiallyefficient from 2010 to 2015.
Through the development of a conceptual framework that links FP to FY and FE(Figure 1) is a broader way of analyzing, monitoring and adhering to what may lead to therealization of the mission and vision of a NNSO. The framework can enable sports managersto identify the function of each component, thus having the ability to change, adopt or takecorrective action/s when needed. The present study attempts to provide answers to thefollowing five research questions:
RQ1. Was UST financially effective as indicated by its ability to generate revenues from2010 to 2015?
RQ2. Was UST financially effective as indicated by its ability to accumulate assets from2010 to 2015?
RQ3. Was UST financially efficient in delivering its programs as indicated by itsprogram service ratios from 2010 to 2015?
RQ4. Was UST financially efficient in delivering its services as indicated by its supportservices ratios from 2010 to 2015?
RQ5. Did the FP of UST improve as indicated by yearly net income from 2010 to 2015?
• Asset Accumulation• Revenue Generation
FinancialEffectiveness
• Program Services Ratio• Support Services Ratio• Return on Assets
FinancialEfficiency
• Net income
FinancialPerformance
Note: Designed by authorSources: Kumar and Gulati (2009), Mouzas (2006) and Greenlee andBukovinsky (1998)
Figure 1.Linking financialperformance tofinancial effectivenessand financialefficiency
1194
IJPPM67,7

By answering the five questions, this paper presents a framework for the application of FEand FY in measuring the FP of UST from 2010 to 2015. Few studies have seldom evaluatedthe performance of NNSOs based on the combined impacts of FY and FE, with the majorityof studies dealing with the issues of effectiveness but neglecting efficiency (see Fabianic,1984; Frisby, 1986; Chelladurai et al., 1987; Chelladurai and Haggerty, 1991; Wolfe et al.,2002; Winand et al., 2010). The purpose of this paper is to evaluate the FP of a NNSO usingFE indicators and FY ratios from 2004 to 2015.
4. OE approachesOE is the degree of successfully producing intended, desired or expected results. Thedefinitions of OE can vary based on specific missions, visions of NNSOs and theapproaches/models utilized (Windad et al., 2014). Other related terms used to describe OEinclude achievements, success, excellence and performance, amongst others. The aim of thissection is to explain the six basic approaches/models commonly applied to researching OE,namely – goal, internal process and systems resources, multiple contingency, competingvalues and multidimensional approaches (Table II).
4.1 Goal model of OEThe first way of examining OE is the goal model which is the extent to which goals areaccomplished (Price, 1968; Scott, 1977). Pertaining to NNSOs, indicators of the goal modelare the realization of financial targets and the winning of Olympic medals (Table III).
Previous studies have stressed the advantageous uses and applications of the goal modelin sports research as: it helps in clearly communicating the purpose and direction of theorganization; it assists in sharpening decision making by providing an unambiguous basis forjudging success or failure; and it is a means for self-management as it helps set standards forwinning and pay (Frisby, 1986; Wolfe et al., 2002; Omondi-Ochieng, 2013). In the first study,Frisby (1986) examined whether or not there was a relationship between 29 Canadian nationalsports governing body’s ability to acquire scarce resources and to transform their inputs into
Model/approach Effectiveness defined as Indicators/Metrics
1. Goal model Ability of an organization toachieve desired goalsExtent to which goals areaccomplished
Realization of financial goalsOlympic medals wonMembership numbers
2. Internal process model Extent to which employeesare satisfied, committed, andmotivated
High employee moraleHigh organizational cohesion
The smooth internalfunctioning of an organization
Number of strikesCoach/Team turnover rates
3. Systems resources model The ability of an organizationto acquire scares resources
Number of professional playersNumber of stadiums
4. Multiple constituency model Extent to which allconstituents are satisfied
Fairness and equitable diversitySatisfaction with program/services quality
5. Competing values model The extent to which anorganization maintainsstability and control whilebeing adoptable and flexible
Innovativeness and R&DAdaptive change and flexibility
6. Multidimensional model Success in all the above Holistic index of all above indicatorsNote: Alternative words as approaches, models and/or perspective have been used to describe OESources: Papadimitriou and Taylor (2000), Shilbury and Moore (2006), Rocha and Turner (2008), Wolfe et al.(2002) and Omondi-Ochieng (2013)
Table II.Approaches/models
of organizationaleffectiveness
1195
USA Triathlon
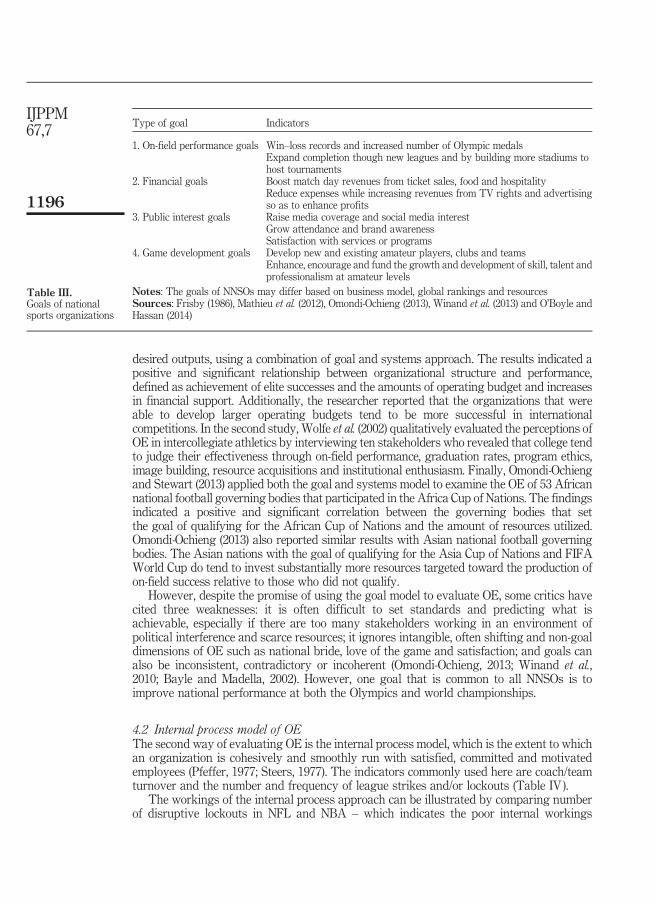
desired outputs, using a combination of goal and systems approach. The results indicated apositive and significant relationship between organizational structure and performance,defined as achievement of elite successes and the amounts of operating budget and increasesin financial support. Additionally, the researcher reported that the organizations that wereable to develop larger operating budgets tend to be more successful in internationalcompetitions. In the second study, Wolfe et al. (2002) qualitatively evaluated the perceptions ofOE in intercollegiate athletics by interviewing ten stakeholders who revealed that college tendto judge their effectiveness through on-field performance, graduation rates, program ethics,image building, resource acquisitions and institutional enthusiasm. Finally, Omondi-Ochiengand Stewart (2013) applied both the goal and systems model to examine the OE of 53 Africannational football governing bodies that participated in the Africa Cup of Nations. The findingsindicated a positive and significant correlation between the governing bodies that setthe goal of qualifying for the African Cup of Nations and the amount of resources utilized.Omondi-Ochieng (2013) also reported similar results with Asian national football governingbodies. The Asian nations with the goal of qualifying for the Asia Cup of Nations and FIFAWorld Cup do tend to invest substantially more resources targeted toward the production ofon-field success relative to those who did not qualify.
However, despite the promise of using the goal model to evaluate OE, some critics havecited three weaknesses: it is often difficult to set standards and predicting what isachievable, especially if there are too many stakeholders working in an environment ofpolitical interference and scarce resources; it ignores intangible, often shifting and non-goaldimensions of OE such as national bride, love of the game and satisfaction; and goals canalso be inconsistent, contradictory or incoherent (Omondi-Ochieng, 2013; Winand et al.,2010; Bayle and Madella, 2002). However, one goal that is common to all NNSOs is toimprove national performance at both the Olympics and world championships.
4.2 Internal process model of OEThe second way of evaluating OE is the internal process model, which is the extent to whichan organization is cohesively and smoothly run with satisfied, committed and motivatedemployees (Pfeffer, 1977; Steers, 1977). The indicators commonly used here are coach/teamturnover and the number and frequency of league strikes and/or lockouts (Table IV ).
The workings of the internal process approach can be illustrated by comparing numberof disruptive lockouts in NFL and NBA – which indicates the poor internal workings
Type of goal Indicators
1. On-field performance goals Win–loss records and increased number of Olympic medalsExpand completion though new leagues and by building more stadiums tohost tournaments
2. Financial goals Boost match day revenues from ticket sales, food and hospitalityReduce expenses while increasing revenues from TV rights and advertisingso as to enhance profits
3. Public interest goals Raise media coverage and social media interestGrow attendance and brand awarenessSatisfaction with services or programs
4. Game development goals Develop new and existing amateur players, clubs and teamsEnhance, encourage and fund the growth and development of skill, talent andprofessionalism at amateur levels
Notes: The goals of NNSOs may differ based on business model, global rankings and resourcesSources: Frisby (1986), Mathieu et al. (2012), Omondi-Ochieng (2013), Winand et al. (2013) and O’Boyle andHassan (2014)
Table III.Goals of nationalsports organizations
1196
IJPPM67,7
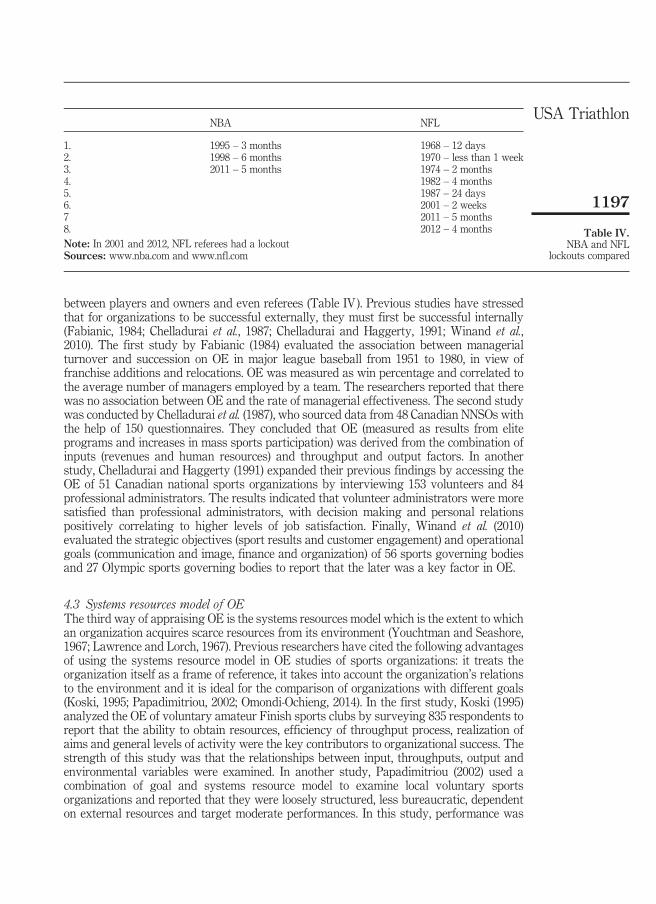
between players and owners and even referees (Table IV ). Previous studies have stressedthat for organizations to be successful externally, they must first be successful internally(Fabianic, 1984; Chelladurai et al., 1987; Chelladurai and Haggerty, 1991; Winand et al.,2010). The first study by Fabianic (1984) evaluated the association between managerialturnover and succession on OE in major league baseball from 1951 to 1980, in view offranchise additions and relocations. OE was measured as win percentage and correlated tothe average number of managers employed by a team. The researchers reported that therewas no association between OE and the rate of managerial effectiveness. The second studywas conducted by Chelladurai et al. (1987), who sourced data from 48 Canadian NNSOs withthe help of 150 questionnaires. They concluded that OE (measured as results from eliteprograms and increases in mass sports participation) was derived from the combination ofinputs (revenues and human resources) and throughput and output factors. In anotherstudy, Chelladurai and Haggerty (1991) expanded their previous findings by accessing theOE of 51 Canadian national sports organizations by interviewing 153 volunteers and 84professional administrators. The results indicated that volunteer administrators were moresatisfied than professional administrators, with decision making and personal relationspositively correlating to higher levels of job satisfaction. Finally, Winand et al. (2010)evaluated the strategic objectives (sport results and customer engagement) and operationalgoals (communication and image, finance and organization) of 56 sports governing bodiesand 27 Olympic sports governing bodies to report that the later was a key factor in OE.
4.3 Systems resources model of OEThe third way of appraising OE is the systems resources model which is the extent to whichan organization acquires scarce resources from its environment (Youchtman and Seashore,1967; Lawrence and Lorch, 1967). Previous researchers have cited the following advantagesof using the systems resource model in OE studies of sports organizations: it treats theorganization itself as a frame of reference, it takes into account the organization’s relationsto the environment and it is ideal for the comparison of organizations with different goals(Koski, 1995; Papadimitriou, 2002; Omondi-Ochieng, 2014). In the first study, Koski (1995)analyzed the OE of voluntary amateur Finish sports clubs by surveying 835 respondents toreport that the ability to obtain resources, efficiency of throughput process, realization ofaims and general levels of activity were the key contributors to organizational success. Thestrength of this study was that the relationships between input, throughputs, output andenvironmental variables were examined. In another study, Papadimitriou (2002) used acombination of goal and systems resource model to examine local voluntary sportsorganizations and reported that they were loosely structured, less bureaucratic, dependenton external resources and target moderate performances. In this study, performance was
NBA NFL
1. 1995 – 3 months 1968 – 12 days2. 1998 – 6 months 1970 – less than 1 week3. 2011 – 5 months 1974 – 2 months4. 1982 – 4 months5. 1987 – 24 days6. 2001 – 2 weeks7 2011 – 5 months8. 2012 – 4 monthsNote: In 2001 and 2012, NFL referees had a lockoutSources: www.nba.com and www.nfl.com
Table IV.NBA and NFL
lockouts compared
1197
USA Triathlon

only indicates as number of athletic programs and number of sports offered by the clubs.Finally, Omondi-Ochieng (2014) examined how Asian national football teams acquiredeconomic resources to advance their national teams through the Asia Cup. The resultsindicated that nations that regularly qualified for the tournament tend to apportion largerfinancial resources toward national football success through the construction of trainingfacilities and the building of expensive stadiums to host major football tournaments.
However, critics of the systems resources model do point that real OE may becamouflaged in organizations that benefit from guaranteed government funding, such asnational sports federations and that some resource-rich organizations may still fail due to themisuse of resources or corruption (Chelladurai and Haggerty, 1991; Omondi-Ochieng, 2014).
4.4 Multiple constituency model of OEThe fourth way of gauging OE is the multiple constituency model, which is the extent towhich all stakeholders or clients’ needs are satisfied (Connolly et al., 1980). Indicators of theuses of this approach include diversity programs and gender equity initiatives, such as therepresentation of women at the Olympics. As shown in Table V, the voice of women isslowly being heard as illustrated by the rise in participation numbers – there were 49women’s sports events in 2014, compared to 26 in 1992.
Previous researchers have noted that sports organizations cannot work in a vacuum asthey must positively engage their stakeholders (attendees, social media fans, thegovernment, corporate sponsors, teams, clubs and governing bodies) to become effective(Vail, 1986; Papadimitriou and Taylor, 2000). In the first study, Vail (1986) evaluated33 national sports organizations with the help of 140 questionnaires to report that OE waslargely due to adoptability, communication, finance, human resources and organizationalplanning. The study ignored sports results. Similarly, Papadimitriou and Taylor (2000)utilized a sample of 20 Greek national sports organizations to report that OE was due to:quality and stability of board members, long-term planning, sport science support, interestin athletes and internal procedures. The study measured satisfaction levels of variousstakeholders but neglected goal and FP.
4.5 Competing values approach (CVA) of OEThe fifth way of measuring OE is the CVA, which is the extent to which an organizationmaintains stability and control while being adoptable and flexible (Quinn and Rohrbaugh,1983). The first example of CVA in practice was when Test cricket transformed to Twenty20cricket so as to meet spectator needs and demands. The transformation began in 2003 whenEngland and Wales Cricket board approved a Twenty20 cricket match for a domestictournament. The new game of Tewnty20 was faster, shorter and attracted larger crowds
Year Sports Women’s events Total events % of women’s events Women participants% of womenparticipants
1992 4 26 57 45.6 488 27.11994 4 28 61 45.9 522 301998 6 32 68 47.1 787 36.22002 7 37 78 47.4 886 36.92006 7 40 84 47.6 960 38.22010 7 41 86 47.7 1,044 40.72014 7 49 98 50.0 1,120 40.3Note: Some are mixed eventsSources: www.olympic.org/women-in-sport/background/statistics (accessed June 24, 2016)
Table V.Women’s participationin the Olympic WinterGames (1992–2014)
1198
IJPPM67,7

(Table VI). In realizing the positive potential on attendance and corporate sponsorships, in2005, the first international tournament was played between arch rivals Australia andNew Zealand and in 2007, ICC introduced the World Twenty20 championship.
The second example of adaptation and change is 3-on-3 basketball. With the goal ofrevamping interest, attendance and revenues, International Olympic Committee approvedthe addition of 3-on-3 basketball to the 2020 Summer Olympic Games – with a fewdifferences (Table VII).
Past researchers have noted that sports organizations ought to be flexible and adoptive tochange so as to remain competitive (Shilbury and Moore, 2006; Balduck, 2009; Wemmer et al.,2016). In the first study, Shilbury and Moore (2006) used both qualitative and quantitativedata to examine ten non-profit Australian national Olympic sport governing bodies. In all, 289stakeholders from ten national Olympic sports organizations were surveyed and the dataanalyzed using factor analysis. The results showed that the primary indicator of OE were theability to produce goals, followed by planning, flexibility and stability. The CVA allowsmanagers to quickly ascertain strengths and weaknesses of their sport governing bodies.Additionally, Balduck (2009) examined non-profit sports clubs to assess program andmanagement effectiveness of board members. The results were that the competing goals ofmanagement and participants were solved by adopting, changing and expanding existingprograms. Finally, Wemmer et al. (2016) examined the effect of collaborations withcompetitors on the OP of non-profit sports clubs via use of outside knowledge and theadoption of new services, processes and business models. The study used an online survey of292 members of the board of directors in Germany sports clubs. Results indicated thatengagement in coopetition and outside knowledge had a positive effect on OP.
Type of cricket Duration Results Innings
1. Test cricket 5 days 4 possible results – win, loss, tie and draw 2 innings of 50 overs2. Twenty20 3 hours 2 possible results – win and loss 1 inning per team of 20 oversNotes: Test cricket matches were first played in 1877. Differences based on ICC RulesSources: www.espncricinfo.com/ci/content/story/1062769.html and http://recomparison.com/comparisons/100477/one-day-vs-test-match-vs-t20-cricket/
Table VI.Difference between
Twenty20 andTest cricket
Type ofbasketball Scoring Duration of the game Other rules
1. 3-on-3 Every shot behind the arc is awarded2 pointsEvery shot inside the arc is awarded1 pointEvery successful free throw isawarded1 point
10-minute game clock1st team to reach 21 points orthe best after 10 minuteswins12-second shot duration clock
Games played inhalf court4 players on roster
2. 5-on-5 3-points for field goal made frombehind the 3-point arc2 points for field goal made frominside the 3-point arc1 point for a made free throw
Four 10-minute quarters24-seconds shot clock5-Foul limit5 1-minute timeouts
Bigger full court6 players on roster
Notes: NBA currently sponsors NBA 3X Tour. Both rules as per FIBASources: http://ftw.usatoday.com/2017/06/3-on-3-olympic-basketball-rules-3-pointer-shot-clock-kevin-durant-ideal-player and www.fiba.com/3x3/rules
Table VII.Difference Between3-on-3 and 5-on-5
basketball
1199
USA Triathlon

4.6 Multidimensional approach to OEThe last way of determining OE is the multidimensional approach (Cameron, 1978). That OEis an all-in-one approach comprising goal, internal processes, systems resources, multiplestakeholders and competing values models (Madella et al., 2005; Rocha and Turner, 2008;Nowy et al., 2015). In the first study, Madella et al. (2005) examined national swimmingfederations and reported that OE was due to multiple factors – human resources, finances,communication, partnerships and inter-organizational relations, volume and quality ofservices and athlete’s international performances. In another study, Rocha and Turner(2008) examined intercollegiate athletic programs and concluded that athletic achievement,graduation rates, social and FP were the key contributors to OE. The researchers surveyed241 coaches from NCAA division I universities and also reported that coaches’ commitmentand citizenship behaviors were insignificant in predicting the OE of athletic departments.Finally, Nowy et al. (2015) evaluated the differences in OE of 1,640 non-profit and 732for-profit sport organizations in German using an online surveys. The results indicatethat for-profits outperform non-profits in overall FP with the latter attaching moreimportance to program quality, employee qualifications and strategies.
5. FY using financial ratiosFY is the cost effective use of the financial resources of a NNSO so as to accomplish itsprograms and services objectives, as indicated by financial ratios. The origins and uses offinancial ratios can be traced back to the need for sound financial management pertaining tocredit valuation, the business transactions and negotiations between and amongst lenders,rating agencies and investors. To date various types of financial ratios have being adoptedto assess and measure the overall financial efficiencies of NNSOs to detect the efficient useor misuses of revenues, donations and other monetary resources. In a competitive, resourcescarce environment, the uses, applications and value of financial ratios have evolved to bethe premier FY measure – both for-profit and NNSOs. The contribution of financial ratioanalysis theory in this area is significant. Previous studies indicate that the uses andapplications of financial ratios to ascertain FY have the following advantages: simplificationof complex financial data, enabling easier comparison, easing trend analysis andhighlighting important financial information (Trussel and Greenlee, 2004; Zietlow et al.,2011; Winand et al., 2012). Financial ratios can be classified according to the informationthey provide and the specific goal of assessment (Greenlee and Bukovinsky 1998). As such,the aim of this study is to utilize financial ratios that are specific to evaluating the financialefficiencies of NNSOs such as program services ratio and support service ratio (Table VIII).
5.1 Program services ratioProgram services ratio measures how a NNSO is efficient at delivering its programs, withthe benchmark being lower is better (Equation (2)) (www.demonstratingvalue.org). Forinstance, a program service ratio of 0.2 or 20 percent is better than 0.9 or 90 percent, as thelatter indicates risky and wasteful use of hard-to-get revenues:
Program services ratio ¼ Total program servicesTotal revenues
: (2)
Similar program services ratios have been previously used by Greenlee and Bukovinsky,1998; Baber et al., 2001; Cordery et al., 2013; McLaughlin, 2016; Omondi-Ochieng, 2016).Program services include such expenses as camps, competitions and coaching fees amongstothers (Table VIII).
1200
IJPPM67,7

5.2 Support services ratioSupport services ratio measures how a NNSO is efficient at using its supporting services,with the benchmark being lower is better (www.demonstratingvalue.org) (Equation (3)). Forinstance, a support services ratio of 0.3 or 30 percent is better than 0.7 or 70 percent. Theformer (30 percent) indicates that the NNSO economizes the use of hard-to-get revenues forits support services:
Support services ratio ¼ Total supporting servicesTotal revenues
: (3)
Similar support services ratios have been previously used by Greenlee and Bukovinsky,1998; Baber et al., 2001; Cordery et al., 2013; McLaughlin, 2016; Omondi-Ochieng, 2016). Suchsupport services include contract labor, equipment rentals and IT support amongst others(Table VIII).
5.3 Net incomeNet income is also known as net profit and measures the amount of total revenue thatexceeds total expenses, and given as follows (www.myaccountingcourse.com):
Net income ¼ Total revenues–Total expenses: (4)
Net income measures how efficient the company is at producing profits, with higherprofits almost always preferable and is also used by donors, creditors and the board
Assets Program services Support services
Administrative officesCarsTraining groundsGymStadiumOffice furniture
Athletic supportCamps, competitions & prize moneyClub membership discountsCoaching feesContract labor and salariesCredit card processingDevelopment programsDelegate mealsEquipmentFacilitiesGuestsHealth insuranceITTF representationMedia and NewsletterPostage and shippingPrinting, copying, photography and suppliesPrize moneyPromotional merchandiseSponsors/exhibitors expensesTables, pipes, floor and drapesTelephoneTournament contractorTransporting and travelTrophies and awardsT-shirtsWebmasters
Accounting and bookkeepingAudit and tax preparationsBusiness feesIT and computer costsContract laborDues and subscriptionsEquipment rentalsFood and lodgingGiftsHealth insuranceIT SupportMarketing and media servicesPayroll servicesPostage and shippingPrinting and copyingProfessional feesRentRepresentationSalariesSimple IRASuppliesTelephoneTravel
Note: The type and number of assets, programs and services is based on the resources and size of the NNSOSource: UST Audited Financial Reports (2004–2016)
Table VIII.Sources of
organizationalefficiency data
1201
USA Triathlon

members to gauge the financial position and ability to efficiently managed assets.The advantages of a NNSO having a positive net income is that it can be used to offsetloans, initiate or improve programs and services, save for future emergencies and/oradd additional permanent professional staff (www.myaccountingcourse.com/financial-ratios/net-income).
5.4 Return on assets (ROA) ratioROA, also known as asset utilization ratio, is commonly used as a profitability ratio thatmeasures the net income produced by total assets during a period – by comparing netincome to average total assets (www.myaccountingcourse.com/financial-ratios/return-on-assets). However, it also increasingly applied in measuring how efficient an organization cangenerate revenues or produce profits from using its assets. The ratio can help managers andstakeholders to evaluate how well the organization converts its investments in the form ofassets into revenues or profits. In short, the ratio measures how efficient an organizationutilizes its assets to gain a net profit – with a higher ratio being better. For instance, a ROAof 0.8 or 80 percent is excellent compared to a 10 percent. Depending on the size of theNNSO, assets may include: administrative offices, cars, training facilities such as gym andfields, stadium and office furniture amongst others (Table IX). ROA has been previouslyused in the following studies (Dimitropoulos, 2010; Winand et al., 2012; Ecer andBoyukaslan, 2014; Sakinç, 2014).
6. MethodologyThis section contains data sources, measurement variables (dependent and independent)and the case study approach.
6.1 Data sourcesThis study used archival data from audited financial reports and Form 990 sourcedfrom www.teamusa.org/USA-Triathlon/About/USAT/Financial-Information for the period2010–2015. Audited financial reports are examinations of an entity’s financial statementand accompanying disclosures by an independent auditor. From the audited reports,
Ratio types and formulas Uses and interpretations
1. Program services ratio ¼ Total programservices/Total revenues
Measures how a non-profit organization is efficient atdelivering its programsBenchmark – lower is betterRating – high (1–32%) medium (33–65%) and low (66–100%)
2. Supporting services ratio ¼ Totalsupporting services/Total revenues
Measures how a non-profit organization is efficient at using itssupporting servicesBenchmark – lower is betterRating – high (1–32%) medium (33–65%) and low (66–100%)
3. Net income ratio ¼ Totalrevenues − Total expenses
Measures how profitable a non-profit organization isBenchmark – the higher the betterRating – above average (good) and below average (poor)
4. Return on assets ¼ Net income/Averagetotal assets
Measures how efficient a non-profit organization is at utilizingits assets to generate revenues or profitsBenchmark – the higher the betterRating – high (66–100%) medium (33–65%) and low (1–32%)
Note: The three ratios have been selected based on their suitability to NNSOsSources: Greenlee and Bukovinsky (1998), Baber et al. (2001), Cordery et al. (2013), Ritchie and Kolodinsky(2003), McLaughlin (2016) and Omondi-Ochieng (2016)
Table IX.Financial efficiencyratio formulas
1202
IJPPM67,7
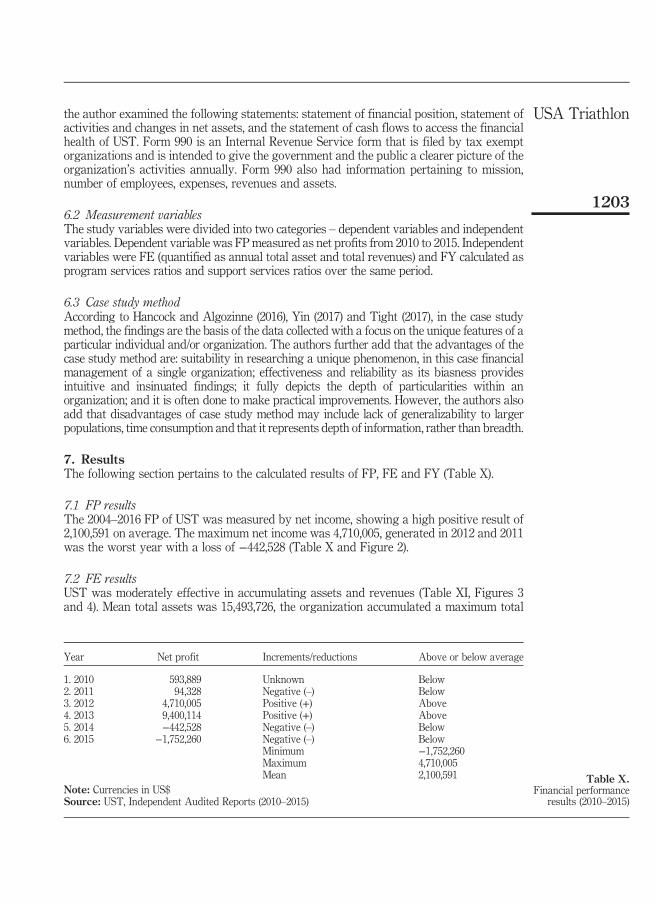
the author examined the following statements: statement of financial position, statement ofactivities and changes in net assets, and the statement of cash flows to access the financialhealth of UST. Form 990 is an Internal Revenue Service form that is filed by tax exemptorganizations and is intended to give the government and the public a clearer picture of theorganization’s activities annually. Form 990 also had information pertaining to mission,number of employees, expenses, revenues and assets.
6.2 Measurement variablesThe study variables were divided into two categories – dependent variables and independentvariables. Dependent variable was FP measured as net profits from 2010 to 2015. Independentvariables were FE (quantified as annual total asset and total revenues) and FY calculated asprogram services ratios and support services ratios over the same period.
6.3 Case study methodAccording to Hancock and Algozinne (2016), Yin (2017) and Tight (2017), in the case studymethod, the findings are the basis of the data collected with a focus on the unique features of aparticular individual and/or organization. The authors further add that the advantages of thecase study method are: suitability in researching a unique phenomenon, in this case financialmanagement of a single organization; effectiveness and reliability as its biasness providesintuitive and insinuated findings; it fully depicts the depth of particularities within anorganization; and it is often done to make practical improvements. However, the authors alsoadd that disadvantages of case study method may include lack of generalizability to largerpopulations, time consumption and that it represents depth of information, rather than breadth.
7. ResultsThe following section pertains to the calculated results of FP, FE and FY (Table X).
7.1 FP resultsThe 2004–2016 FP of UST was measured by net income, showing a high positive result of2,100,591 on average. The maximum net income was 4,710,005, generated in 2012 and 2011was the worst year with a loss of −442,528 (Table X and Figure 2).
7.2 FE resultsUST was moderately effective in accumulating assets and revenues (Table XI, Figures 3and 4). Mean total assets was 15,493,726, the organization accumulated a maximum total
Year Net profit Increments/reductions Above or below average
1. 2010 593,889 Unknown Below2. 2011 94,328 Negative (–) Below3. 2012 4,710,005 Positive (+) Above4. 2013 9,400,114 Positive (+) Above5. 2014 −442,528 Negative (–) Below6. 2015 −1,752,260 Negative (–) Below
Minimum −1,752,260Maximum 4,710,005Mean 2,100,591
Note: Currencies in US$Source: UST, Independent Audited Reports (2010–2015)
Table X.Financial performance
results (2010–2015)
1203
USA Triathlon

assets of 22,443,737 in 2014 and the lowest total assets was 8,043,981 – occurring in 2010.Total revenues were above average in four of the six years analyzed – indicating effectiverevenue generation.
7.3 FY resultsFY was measured in three ways – program services ratio, support services ratios and ROAratio. UST had inefficient program services provisions at 77 percent average but highsupport service efficiency with a mean of 18 percent. The organization was extremelyefficient at converting assets to revenues with an average ROA of 14 percent (Table XII,Figures 5 and 6).
8. Discussions of managerial and policy implicationsThis paper examined the FP of UST using FE indicators and FY ratios, for the period2010–2016.
FP was calculated by net income as common in past studies (Greenlee and Bukovinsky,1998; Dimitropoulos, 2010; Ecer and Boyukaslan, 2014; Omondi-Ochieng, 2016).The net average income was high and positive at 2,100,591, with two years out of the
593,88994,328
4,710,005
9,400,114
–442,528
y = –247177x + 5E+08R2=0.0122
–4,000,000
–2,000,000
0
2,000,000
4,000,000
6,000,000
8,000,000
10,000,000
2009
Net
Inco
me
(US$
)
Net profit Linear (Net profit )
2010 2011 2012 2013 2014 2015 2016
Note: Currencies in US$Source: UST, Independent Audited Reports, 2010–2015
Figure 2.Net income(2010–2015)
YearTotalassets
Increments orreductions
Above or belowaverage
Totalrevenues
Increments orreductions
Above or belowaverage
1. 2010 8,043,981 Unknown Below 11,124,451 Unknown Below2. 2011 8,213,996 Positive (+) Below 11,814,514 Positive (+) Below3. 2012 11,130,687 Positive (+) Below 15,383,120 Positive (+) Above4. 2013 21,708,928 Positive (+) Above 20,632,817 Positive (+) Above5. 2014 22,443,737 Positive (+) Above 15,126,242 Negative (–) Above6. 2015 21,421,028 Negative (–) Above 15,423,693 Positive (+) Above
Minimum ¼ 8,043,981 Minimum ¼ 11,124,451Maximum ¼ 22,443,737 Maximum ¼ 20,632,817Mean ¼ 15,493,726 Mean ¼ 14,917,473
Note: Currencies in US$Source: UST Independent Audited Reports (2010–2015)
Table XI.Financial effectivenessresults (2010–2015)
1204
IJPPM67,7

six above average. Year 2012 was the most profitable year with 4,710,005 and 2015 had theworst loss of −1,752,260. Overall, the FP of UST as gauged by net income was moderate butturbulent with two of the six years experiencing losses.
FE results can be viewed from two fronts, as the ability of UST to assembleneeded assets and generate additional revenues – measured as total assets and totalrevenues – collectively also known as systems resource effectiveness (Koski, 1995;
8,043,981
11,130,687
21,708,928 21,421,028
y = 3E+06x–7E+09R2 = 0.8263
0
5,000,000
10,000,000
15,000,000
20,000,000
25,000,000
30,000,000
2009
Tota
l Ass
ets (
US$
)
Total Assets Linear (Total Assets)2010 2011 2012 2013 2014 2015 2016
Note: Currencies in US$Source: UST Independent Audited Reports (2010–2015)
Figure 3.Total assets(2010–2015)
$11,124,451.00
$15,383,120.00
$20,632,817.00
$15,423,693.00
y =1E+06x–2E+09R2 = 0.3361
0
5,000,000
10,000,000
15,000,000
20,000,000
25,000,000
2009
Tota
l Rev
enue
s (U
S$)
Total Revenues Linear (Total Revenues)2010 2011 2012 2013 2014 2015 2016
Note: Currencies in US$Source: UST Independent Audited Reports (2010–2015)
Figure 4.Total revenues
(2010–2015)
1205
USA Triathlon
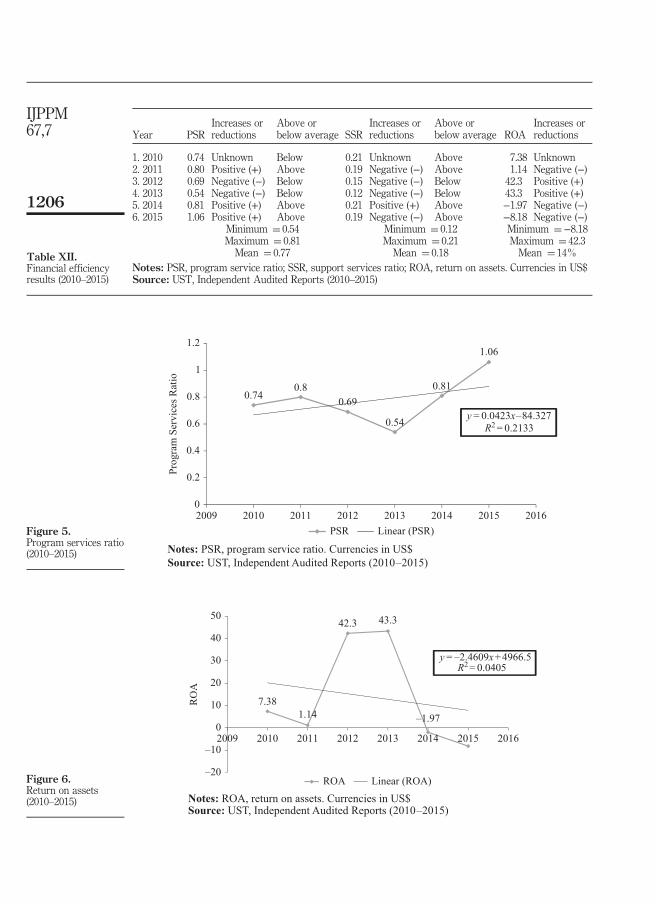
Year PSRIncreases orreductions
Above orbelow average SSR
Increases orreductions
Above orbelow average ROA
Increases orreductions
1. 2010 0.74 Unknown Below 0.21 Unknown Above 7.38 Unknown2. 2011 0.80 Positive (+) Above 0.19 Negative (−) Above 1.14 Negative (−)3. 2012 0.69 Negative (−) Below 0.15 Negative (−) Below 42.3 Positive (+)4. 2013 0.54 Negative (−) Below 0.12 Negative (−) Below 43.3 Positive (+)5. 2014 0.81 Positive (+) Above 0.21 Positive (+) Above −1.97 Negative (−)6. 2015 1.06 Positive (+) Above 0.19 Negative (−) Above −8.18 Negative (−)
Minimum ¼ 0.54 Minimum ¼ 0.12 Minimum ¼−8.18Maximum ¼ 0.81 Maximum ¼ 0.21 Maximum ¼ 42.3Mean ¼ 0.77 Mean ¼ 0.18 Mean ¼ 14%
Notes: PSR, program service ratio; SSR, support services ratio; ROA, return on assets. Currencies in US$Source: UST, Independent Audited Reports (2010–2015)
Table XII.Financial efficiencyresults (2010–2015)
0.740.8
0.69
0.54
0.81
1.06
y = 0.0423x–84.327R2 = 0.2133
0
0.2
0.4
0.6
0.8
1
1.2
2009
Prog
ram
Ser
vice
s Rat
io
PSR Linear (PSR)2010 2011 2012 2013 2014 2015 2016
Notes: PSR, program service ratio. Currencies in US$Source: UST, Independent Audited Reports (2010–2015)
Figure 5.Program services ratio(2010–2015)
7.381.14
42.3 43.3
–1.97
y = –2.4609x+4966.5R2 = 0.0405
–20
–10
0
10
20
30
40
50
2009
RO
A
ROA Linear (ROA)
2010 2011 2012 2013 2014 2015 2016
Notes: ROA, return on assets. Currencies in US$Source: UST, Independent Audited Reports (2010–2015)
Figure 6.Return on assets(2010–2015)
1206
IJPPM67,7

Papadimitriou, 2002; Omondi-Ochieng, 2014). Average total assets were 15,493,726.However, total revenues mostly appreciated with an average of 14,917,473, peaking at amaximum of 20,632,817 in 2013. Overall, the FE of UST – as gauged by asset accumulationand revenue generation – was both moderate and high, respectively.
FY results were examined using program service ratio, support service ratios and ROA ascommonly used in previous studies (Greenlee and Bukovinsky, 1998; Baber et al., 2001;Panagiotis, 2009; Hamil andWalters, 2010; Mathieu et al., 2012). UST, on average, spent over 77percent of its revenues on programs, with a minimum of 54 percent in 2013, and a maximum of81 percent in 2014, respectively. UST was more efficient on support services as indicated by aminimum of 12 percent in 2013 and an average of 18 percent. However, the organization hadvery good asset utilization efficiencies with a mean ROA of 14.0 percent – indicating excellentmanagement. Overall, USC had high program services inefficiencies and a very high ability tocovert assets to revenues – the former of which may require cost cutting and possible use ofvolunteers in program and services provision (Omondi-Ochieng, 2014; Hoeber et al., 2015).
In sum, most NNSOs have neglected the combined uses of effectiveness and efficiencyindicators by narrowly focusing on international performance and Olympic medals (Koski,1995; Madella et al., 2005; Bayle and Robinson, 2007). Although FP is of interest to NNSOs, itis increasingly becoming of particular interest to managers who must address multipleconcerns of stakeholders, public and private donors and fans who demand internationalrecognition from winning Olympic medals (Bayle and Robinson, 2007; Balduck, 2009).Moreover, non-profit sports organizations are always competing against other privateentities with bigger budgets and offering similar services and programs (Chelladurai andHaggerty, 1991; Claessens et al., 2014). Moreover, in a difficult economic climate, NNSO areoften faced by constant thorny dilemmas: fierce competition, shrinking budgets, yet they arestill expected to produce positive results (Frisby, 1986; Cordery et al., 2013). EssentiallyNNSOs have two options: either to reduce costs or increase FE and FY. In reality, however,no NNSO can offer all services and programs that they wish or their clients want. However,archiving revenue growth and general long-term growth would be overall performanceenhancement, within the limitations of human and financial resources (Omondi-Ochieng,2013, 2016). Such organizations may therefore need to continuously engage in marketingactivities in order to attract and retain customers. Sometimes NNSOs may seem effectivedue to favorable climate. For instance years prior to the Olympics, NNSO tend to receiveincreases in revenues (Table XIII).
Problem Possible solution
1. High cost of human capital Use of more volunteersCut salaries
2. High cost of program services Cut “underperforming” programsPrice/promotion offers
3. High costs of support services Reduce R&D and marketing budgetPartnerships with other NPOs
4. General inefficiency Cost cutting by selling idle buildingsOutsourcing and redundanciesLeasing instead of building
5. General ineffectiveness Advertising, promotions and marketingFundraising through lobbying and grantsBuilding brand equity
Note: Poor financial performance may also be rooted in embezzlement, scarcity, corruption, etc.Sources: Koski (1995), Madella et al. (2005), Bayle and Robinson (2007), Balduck (2009), Winand et al. (2014)and Omondi-Ochieng (2016)
Table XIII.Possible solutions to
poor financialperformance
1207
USA Triathlon
9. Conclusion and research implicationsFP is fundamental to management planning and control activities and accordingly havereceived considerable attention by both management practitioners and sports theorists(Panagiotis, 2009; Winand et al., 2014; Omondi-Ochieng, 2016). The present study aimed toevaluate the FP of UST from 2004 to 2015 based on FE and FY using a case study method.FE and efficiency are central terms for assessing and measuring the FP of NNSOs such asUST. Despite the value of assessing and measuring overall FP, the present study indicatedthe difficulty of achieving a balance between being both financially efficient and financiallyeffective simultaneously. The study offers three important lessons.
First, the study demonstrates that UST was a high financial performer (average positivenet income of 2,100,591) and was also moderately effective in accumulating assets andgenerating revenues (average 14,917,473 per year). Most NNSOs focus too much onfundraising and tend to neglect organic growth through efficient service and programdelivery (Baber et al., 2001; Baruch and Ramalho, 2006; Balduck, 2009). UST particularlyfaces the problem of costly inefficient programs which further reduce net incomes.One possible solution is to use volunteers to offset program costs (Table XIII).
Second, the study provides evidence that improving overall FP requires extraordinarymanagerial capabilities based on sound organizational policies directed at prudent financialpractices. Efficiency involves financial discipline and control over operations and workingcapital requirements (Bull, 2007; Ecer and Boyukaslan 2014; Omondi-Ochieng, 2016),whereas effectiveness requires the NNSO ability to develop their own strategies forsustainable growth, in a manner that can differentiate themselves and be creativelyinnovative, especially focused on revenue generation (Wemmer et al., 2016; Winand andAnagnostopoulos, 2017). Nevertheless, non-profit organizations can only sustain theiroperations if revenues far exceed expenses (Omondi-Ochieng, 2016). NNSO therefore need tosee efficiency as a necessary, but not sufficient condition and to consider effectiveness notjust as an output but as a continuous process of resource acquisition.
Finally, this research outcome could stimulate a research agenda in three themes: first,imperial investigation is needed as to how NNSO perceive or define their performance. Areperformance standards dictated by US Olympic committee, funders or stakeholders?Second, there is a need to learn more if NNSO abide by or comply with efficiencyrequirements possibly set by themselves or by funders. In other words are NNSOsrequired to be financially efficient? If so by who and to what extent? For example, forevery tax dollar allocated by the government, what percentage needs to go into servicesand programs? If so who decides on the amount? How do NNSO know that they arefinancially efficient? Do the NNSOs prefer the use of financial ratios as indicators of FY?Lastly, is the need to improve our understanding about why most NNSOs are ineffective?Is it that they do not see the need? Or is there no regulatory, legal or policy mandates forthem to do so. Or is it that they are faced with too many financial constraints such asdepending almost entirely on donation and handouts. Apart from the need for managerialeffectiveness, we can also pose the question of who will discipline the management forpoor FP. The research did not consider off-field factors that may influence on-fieldperformance on the national teams managed by UST.
10. Research limitationsThe study did also have its limits. First, NNSOs tend to receive direct government serviceswhich may falsely indicate that the organization is efficient (Chelladurai, 1987; Bayle andRobinson, 2007). Moreover, some donors may also restrict the uses of their monies to certainservices or programs, thereby preventing the proper productive allocations of such funds(Baber et al., 2001; Baruch and Ramalho, 2006; Cordery et al., 2013). Moreover, NNSOs oftenhave strategic objectives that are intangible and challenging to measure as they are shaped
1208
IJPPM67,7

by the multiple expectations of public stakeholders – which may further constrain finances(Lim et al., 1994; Rocha, and Turner, 2008; Musso et al., 2016). Human resources include bothpaid and volunteers – all making their internal functioning less clear compared to that of aprivate business (Papadimitriou, 2002; Omondi-Ochieng, 2017). Another research issuegenerally with NNSOs is that they only avail short-term data to the public, with majority ofsports organizations still do not have their financial information publicly accessible. If andwhen the financial information is available, most are usually disorganized, unclear and tooshort for longitudinal research. Despite these potential drawbacks, the researcher made allefforts to obtain audited financial reports from the organization and from the website www.guidestar.org/, which offers mostly free accurate and updated financial information ofthousands of non-profits. As NNSOs start striving to be effective, we also have to bear inmind that financial ratios are not the only way of measuring success. Financial ratios mayalso have other possible disadvantages such as: there could be differentials in operatingenvironments due to regulations and market structure, they may be affected by estimatesand assumptions based on different accounting policies and they are usually based on pastinformation which my neglect current and future information (Bull, 2007; Zietlow et al., 2011;Omondi-Ochieng, 2017).
References
Baber, W.R., Roberts, A.A. and Visvanathan, G. (2001), “Charitable organizations’ strategies andprogram-spending ratios”, Accounting Horizons, Vol. 15 No. 4, pp. 329-343.
Balduck, A.L. (2009), “Effectiveness in sport on micro and meso management level”, unpublisheddoctoral dissertation, Ghent University.
Baruch, Y. and Ramalho, N. (2006), “Communities and distinctions in the measurement oforganizational performance and effectiveness across for-profit and nonprofit sectors”, Nonprofit& Voluntary Sector Quarterly, Vol. 35 No. 1, pp. 39-65.
Bayle, E. and Madella, A. (2002), “Development of a taxonomy of performance for national sportorganizations”, European Journal of Sport Science, Vol. 2 No. 2, pp. 1-21.
Bayle, E. and Robinson, L. (2007), “A framework for understanding the performance of nationalgoverning bodies of sport”, European Journal of Sport Management, Vol. 7 No. 3,pp. 249-268.
Bull, R. (2007), Financial Ratios: How to use Financial Ratios to Maximize Value and Success for YourBusiness, Elsevier, London.
Cameron, K. (1978), “Measuring organizational effectiveness in institutions of higher education”,Administrative Science Quarterly, Vol. 23 No. 4, pp. 604-632.
Chelladurai, P.A. (1987), “Multidimensionality and multiple perspectives of organizationaleffectiveness”, Journal of Sport Management, Vol. 1 No. 1, pp. 37-47.
Chelladurai, P. and Haggerty, T.R. (1991), “Measures of organizational effectiveness of Canadiannational sport organizations”, Canadian Journal of Sport Sciences, Vol. 16 No. 2, pp. 126-133.
Chelladurai, P., Szyszlo, M. and Haggerty, T. (1987), “System-based dimensions of effectiveness: thecase of national sport organizations”, Canadian Journal of Sport Science, Vol. 12 No. 2,pp. 111-119.
Claessens, M., Thibaut, E., Winand, M., Scheerder, J. and Vos, S. (2014), “A unified model of non-profitsport organizations performance”, Managing Leisure, Vol. 19 No. 2, pp. 121-150.
Connolly, T., Conlon, E.M. and Deutsch, S.J. (1980), “Organizational effectiveness: a multipleconstituency approach”, Academy of Management Review, Vol. 5 No. 2, pp. 211-218.
Cordery, C.J., Sim, D. and Baskerville, R.F. (2013), “Three models, one goal: assessing financialvulnerability in New Zealand amateur sports clubs”, Sport Management Review, Vol. 16 No. 2,pp. 186-199.
1209
USA Triathlon
Dimitropoulos, P. (2010), “The financial performance of the Greek football clubs”, Choregia SportManagement International Journal, Vol. 6 No. 2, pp. 5-28.
Ecer, F. and Boyukaslan, A. (2014), “Measuring performances of football clubs using financial ratios:the gray relational analysis approach”, American Journal of Economics, Vol. 4 No. 1,pp. 62-71.
Fabianic, D. (1984), “Managerial succession, organizational effectiveness and franchise relocation inprofessional baseball”, Journal of Sport Behavior, Vol. 7 No. 1, pp. 3-17.
Frisby, W. (1986), “Measuring the organizational effectiveness of national sport governing bodies”,Canadian Journal of Applied Sport Science, Vol. 11 No. 2, pp. 94-99.
Greenlee, J.S. and Bukovinsky, D. (1998), “Financial ratios for use in the analytical review of charitableorganizations”, Ohio CPA Journal, Vol. 57, pp. 32-38.
Hamil, S. and Walters, G. (2010), “Financial performance in english professional football: ‘aninconvenient truth’ ”, Soccer & Society, Vol. 11 No. 4, pp. 354-372.
Hancock, D.R. and Algozzine, B. (2016), Doing Case Study Research: A Practical Guide for BeginningResearchers, Teachers College Press, New York, NY.
Hoeber, L., Doherty, A., Hoeber, O. and Wolfe, R. (2015), “The nature of innovation in community sportorganizations”, European Sport Management Quarterly, Vol. 15 No. 5, pp. 518-534.
Koski, P. (1995), “Organizational effectiveness of Finnish sports clubs”, Journal of Sport Management,Vol. 9 No. 1, pp. 85-95.
Kumar, S. and Gulati, R. (2009), “Measuring efficiency and performance of Indian public sector banks”,International Journal of Productivity & Performance Management, Vol. 59 No. 1, pp. 51-74.
Lawrence, P.R. and Lorsch, J.W. (1967), “Differentiation and integration in complex organizations”,Administrative Science Quarterly, Vol. 12 No. 1, pp. 1-47.
Lim, B.J., Rho, H.D., Kim, T.J., Chung, U.K., Sinbok, K. and Park, J.K. (1994), “Priorities of financialinvestments in mass sport Korea”, Journal of Sport Management, Vol. 8 No. 1, pp. 57-62.
McLaughlin, T.A. (2016), Streetsmart Financial Basics for Nonprofit Managers, John Wiley & Sons,New York, NY.
Madella, A., Bayle, E. and Tome, J. (2005), “The organizational performance of national swimmingfederations in mediterranean countries: a comparative approach”, European Journal of SportScience, Vol. 5 No. 4, pp. 207-220.
Mathieu, W., Thierry, Z. and Jeroen, S. (2012), “A financial management tool for sport federations”,Sport, Business and Management: An International Journal, Vol. 2 No. 3, pp. 225-240.
Mouzas, S. (2006), “Efficiency versus effectiveness in business networks”, Journal of Business Research,Vol. 59 Nos 10/11, pp. 1124-1132.
Musso, F., Richelieu, A. and Francioni, B. (2016), “Making small sports clubs manageable andeconomically sustainable – a study on clay target shooting in Italy”, Managing Sport andLeisure, Vol. 21 No. 5, pp. 283-299.
Nowy, T., Wicker, P., Feiler, S. and Breuer, C. (2015), “Organizational performance of nonprofit andfor-profit sport organizations”, European Sport Management Quarterly, Vol. 15 No. 2,pp. 155-175.
O’Boyle, I. and Hassan, D. (2014), “Performance management and measurement in national- levelnon-profit sport organizations”, European Sport Management Quarterly, Vol. 14 No. 3, pp. 299-314.
Omondi-Ochieng, P. (2013), “Going further: goal & resource approaches to organizational effectivenessin Asian football”, European Association of Sports Management Conference, Istanbul,September 11-15.
Omondi-Ochieng, P. (2014), “Spillovers? Economic progress, football facilities and the 2011 Asia Cup”,in Budzinski, O. and Feddersen, A. (Eds), Contemporary Research in Sports Economics, LangInternational Publishers, Berlin, pp. 161-174.
1210
IJPPM67,7

Omondi-Ochieng, P. (2016), Financial Ratio Analysis of US Nonprofit Sports Governing Associations,TopHat Publishing, Toronto.
Omondi-Ochieng, P. (2017), “Human and personnel development in global soccer team successes: alogistic analysis”, presentation at the Applied Sport Management Association Conference,Louisiana State University, Baton Rouge, February 22-24.
Omondi-Ochieng, P. (2018a), “US Table tennis association: a case study of financial performance usingeffectiveness indicators and efficiency ratios”, Managerial Finance, Vol. 44 No. 2, pp. 189-206.
Omondi-Ochieng, P. (2018b), “United States Bobsled & Skeleton federation: an evaluation of financialperformance trends”, Business & Social Science Journal, Vol. 2 No. 3, pp. 3-30.
Omondi-Ochieng, P. and Stewart, B. (2013), “Exposed? Financial transparency metrics for Europeanfootball federations”, Sports Management Australia and New Zealand Association Conference,Dunedin, November 20-22.
Panagiotis, D.E. (2009), “Profitability of the Greek football clubs: implications for financial decisionsmaking”, Business Intelligence Journal, Vol. 2 No. 1, pp. 159-169.
Papadimitriou, D. (2002), “Amateur structures and their effect on performance: the caseof Greek voluntary sport clubs”, Managing Leisure: An International Journal, Vol. 7 No. 4,pp. 205-219.
Papadimitriou, D. and Taylor, P. (2000), “Organizational effectiveness of Hellenic national sportsorganizations: a multiple constituency approach”, Sport Management Review, Vol. 3 No. 1,pp. 23-46.
Pinnuck, M. and Potter, B. (2006), “Impact of on-field football success on the off-field financialperformance of AFL football clubs”, Accounting and Finance, Vol. 46 No. 3, pp. 499-517.
Pfeffer, J. (1977), “Power and resource allocation in organizations”, New Directions in OrganizationalBehaviour, St Clair Press, pp. 235-265.
Price, J.L. (1968), “The study of organizational effectiveness”, Sociological Quarterly, Vol. 13 No. 1,pp. 3-15.
Quinn, R.E. and Rohrbaugh, J. (1983), “A spatial model of effectiveness criteria: towards acompeting values approach to organizational analysis”, Management Science, Vol. 29 No. 3,pp. 363-377.
Ritchie, W.J. and Kolodinsky, R.W. (2003), “Nonprofit organization financial performancemeasurement: an evaluation of new and existing financial performance measures”, NonprofitManagement & Leadership, Vol. 13 No. 4, pp. 367-381.
Rocha, C.M. and Turner, B.A. (2008), “Organizational effectiveness of athletic departments andcoaches’ extra-role behaviors”, Journal of Issues in Intercollegiate Athletics, Vol. 1, pp. 124-144.
Sakinç, I. (2014), “Using grey relational analysis to determine the financial performance of Turkishfootball clubs”, Journal of Economics Library, Vol. 1 No. 1, pp. 22-33.
Scott, W.R. (1977), “Effectiveness of organizational effectiveness studies”, in Goodman, P.S. andPennings, J.M. (Eds), New Perspectives on Organizational Effectiveness, Jossey-Bass, SanFrancisco, CA, pp. 63-95.
Shilbury, D. and Moore, K.A. (2006), “A study of organizational effectiveness for national Olympicsports organizations”, Nonprofit & Voluntary Sector Quarterly, Vol. 35 No. 1, pp. 5-38.
Steers, R.M. (1977), Organizational Effectiveness: A Behavioral View, Goodyear, Santa Monica, CA.
Tight, M. (2017), Understanding Case Study Research: Small-Scale Research with Meaning, Sage,London.
Trussel, J. and Greenlee, J. (2004), “A financial rating system for nonprofit organizations”, Research inGovernment and Nonprofit Accounting, Vol. 11 No. 1, pp. 105-128.
Vail, S.E. (1986), “Organizational effectiveness and national sport governing bodies a constituencyapproach”, unpublished doctoral dissertation, University of Ottawa.
1211
USA Triathlon
Wemmer, F., Emrich, E. and Koenigstorfer, J. (2016), “The impact of competition-based open innovationon performance in nonprofit sports clubs”, European Sport Management Quarterly, Vol. 16 No. 3,pp. 341-363.
Winand, M. and Anagnostopoulos, C. (2017), “Get ready to innovate! Staff’s disposition to implementservice innovation in non-profit sport organizations”, International Journal of Sport Policy &Politics, Vol. 9 No. 4, pp. 579-595.
Winand, M., Zintz, T. and Scheerder, J. (2012), “A financial management tool for sport federations”,Sport, Business & Management: An International Journal, Vol. 2 No. 3, pp. 225-240.
Winand, M., Rihoux, B., Robinson, L. and Zintz, T. (2013), “Pathways to high performance: a qualitativecomparative analysis of sport governing bodies”, Nonprofit & Voluntary Sector Quarterly,Vol. 42 No. 4, pp. 739-762.
Winand, M., Zintz, T., Bayle, E. and Robinson, L. (2010), “Organizational performance of Olympic sportgoverning bodies: dealing with measurement and priorities”, Managing Leisure: AnInternational Journal, Vol. 15 No. 4, pp. 279-307.
Winand, M., Vos, S., Claessens, M., Thibaut, E. and Scheerder, J. (2014), “A unified model of non-profitsport organizations performance: perspectives from the literature”, Managing Leisure, Vol. 19No. 2, pp. 121-150.
Wolfe, R., Hoeber, L. and Babiak, K. (2002), “Perceptions of the effectiveness of sport organizations:the case of intercollegiate athletics”, European Sport Management Quarterly, Vol. 2 No. 2,pp. 135-156.
Yin, R. (2017), Case Study Research: Design and Methods, Sage, New York, NY.
Youchtman, E. and Seashore, E.S. (1967), “A system resource approach to organizationaleffectiveness”, American Sociological Review”, Vol. 32 No. 6, pp. 891-903.
Zietlow, J., Hankin, J.A. and Seidner, A.G. (2011), Financial Management for Nonprofit Organizations:Policies and Practices, John Wiley & Sons, New York, NY.
Further reading
Cameron, K. (2010), Organizational Effectiveness, John Wiley & Sons, New York, NY.
Dimitropoulos, P. and Tsagkanos, A. (2012), “Financial performance and corporate governance in theEuropean football industry”, International Journal of Sport Finance, Vol. 7 No. 4, pp. 280-308.
Garcia-Sanchez, L.M. (2007), “Efficiency and effectiveness of Spanish football teams: a three-stage DEAapproach”, Central European Journal of Operations Research, Vol. 15 No. 1, pp. 21-45.
Herman, R.D. and Renz, D.O. (2008), “Advancing nonprofit organizational effectiveness research andtheory: nine theses”, Nonprofit Management and Leadership, Vol. 18 No. 4, pp. 399-415.
Keh, H., Chu, S. and Xu, J. (2006), “Efficiency, effectiveness and productivity of marketing in services”,European Journal of Operational Research, Vol. 170 No. 1, pp. 265-276.
Miragaia, D., Brito, M. and Ferreira, J. (2016), “The role of stakeholders in the efficiency of nonprofitsports clubs”, Nonprofit Management and Leadership, Vol. 27 No. 1, pp. 113-134.
Molnar, J.J. and Rogers, D.C. (1976), “Organizational effectiveness: an empirical comparison of the goalsand system resources approaches”, Sociological Quarterly, Vol. 17 No. 3, pp. 401-413.
Omondi-Ochieng, P. (2012), “Rule of three: how resources separate winners from losses at the Africacup of nations”, World Football II Conference, Melbourne, November 13-15.
Omondi-Ochieng, P. and Stewart, B. (2012), “Organizational effectiveness at the Africa Cup of Nations:a goal & resource approach”, Sports Management Australia and New Zealand AssociationConference, Sydney, October 28-30.
Ozawa, T., Cross, J. and Henderson, S. (2004), “Market orientation and financial performance of Englishprofessional football clubs”, Journal of Targeting, Measurement and Analysis for Marketing,Vol. Vol, 13 No. 1, pp. 78-90.
1212
IJPPM67,7
Papadimitriou, D. (2007), “Conceptualizing effectiveness in non-profit organizational environment: anexploratory study”, The International Journal of Public Sector Management, Vol. Vol, 20 No. 7,pp. 571-587.
Schmidgall, R.S. and DeFranco, A.L. (2004), “Ratio analysis: financial benchmarks for the clubindustry”, The Journal of Hospitality Financial Management, Vol. 12 No. 1, pp. 1-14.
United States Triathlon (2018), “Financial information”, available at: www.teamusa.org/USA-Triathlon/About/USAT/Financial-Information (accessed October 17, 2018).
Webb, B.J. and Brodbent, J.M. (1986), “Finance and football clubs: what cash flow analysis reveals”,Management Finance, Vol. 12 No. 11, pp. 6-10.
Winand, M., Rihoux, B., Qualizza, D. and Zintz, T. (2011), “Combinations of key determinants ofperformance in sport governing bodies”, Sport, Business and Management: An InternationalJournal, Vol. 1 No. 3, pp. 234-251.
Web referenceswww.demonstratingvalue.org/resources/financial-ratio-analysis
www.myaccountingcourse.com/financial-ratios/net-income
Corresponding authorPeter Omondi-Ochieng can be contacted at: [email protected]
For instructions on how to order reprints of this article, please visit our website:www.emeraldgrouppublishing.com/licensing/reprints.htmOr contact us for further details: [email protected]
1213
USA Triathlon
Performance measurementand management systems
as IT artefactsCharacterising, contextualising and valuing
their effective use in SMEsMarie Marchand and Louis Raymond
Institut de recherche sur les PME,Université du Québec à Trois-Rivières, Québec, Canada
AbstractPurpose – Considering performance measurement and management systems (PMMS) to be “mission-critical”information systems for many business organisations, calls have been made for researchers to shift fromstudying the use of such systems to studying their “effective” use, and in so doing to focus on theircharacterisation as information technology (IT) artefacts. The paper aims to discuss this issue.Design/methodology/approach – In seeking to answer these calls, the authors apply Burton-Jones andGrange’s theoretical framework to study the dimensions, contextual drivers and benefits of the effective useof PMMS. This is done through a field study of 16 PMMS artefacts as used in small- and medium-sizedenterprises (SMEs).Findings – In characterising, contextualising and valuing the effective use of PMMS, this study providesanswers to the following questions: What constitutes the effective use of PMMS? What are the user,artefactual and task-related drivers of such use? And what are the benefits for SMEs of using performancemeasurement and management (PMM) systems effectively?Practical implications – With regard to the design of a PMMS artefact, the findings implythat one should concentrate on those artefactual attributes that most enable informed action onthe part of owner-managers, as it is these actions have the greater consequences for the realisation of ITbusiness value in SMEs. Moreover, the nomological network resulting from this research providesthe theoretical and methodological underpinnings of a diagnostic tool meant to develop the PMM functionin SMEs.Originality/value – This study provides further empirical grounding and understanding. This studyprovides further empirical grounding and understanding of the concept of effective use, as well as furtherapplicability and actionability to this concept and to the nomological network of its dimensions, contextualdrivers and benefits in the case of PMMS and in the context of SMEs.Keywords SME, IT artifact, Information system, Managerial performance, Competitive performance,Effective use, Performance measurement and management systemPaper type Research paper
1. IntroductionIn a globalised knowledge-based economy, business enterprises must now attain a level oforganisational performance such that they can compete on a worldwide basis (Busco et al.,2008), including a growing number of small- and medium-sized enterprises (SMEs) in theindustrial and manufacturing sectors (Costa et al., 2017). Seeking to improve theircompetitive performance, many of these SMEs enable their organisational capabilities forinnovation, internationalisation and knowledge management by their use of informationtechnology (IT) artefacts (Hagsten and Kotnik, 2017). In this context, such artefacts may beessentially defined as the application of IT to support some managerial, administrative oroperational task(s) (Benbasat and Zmud, 2003).
Now, one type of IT artefact is deemed critical to support SME owner-managers inachieving such a “world-class” status for their organisation, namely performancemeasurement and management systems (PMMS) (Garengo et al., 2005). This artefact is
International Journal ofProductivity and PerformanceManagementVol. 67 No. 7, 2018pp. 1214-1233© Emerald Publishing Limited1741-0401DOI 10.1108/IJPPM-08-2017-0206
Received 3 September 2017Revised 22 December 2017Accepted 17 February 2018
The current issue and full text archive of this journal is available on Emerald Insight at:www.emeraldinsight.com/1741-0401.htm
1214
IJPPM67,7
Quarto trim size: 174mm x 240mm

defined as an IT-enabled information system (IS) whose design is founded upon acomprehensive view of organisational performance, and whose aim is to support executivedecision-making and strategic management by producing information that reflects theorganisation’s performance logic (Hall, 2014; Marchand and Raymond, 2008). The PMMSartefact may be acquired by a SME in the form of pre-built or “packaged” software, or it maybe “custom” developed by the firm internally or with the help of outside consultants(Poba-Nzaou et al., 2014).
The need for a better conceptualisation, contextualisation and explanation of the use ofPMMS and a better comprehension of their role in the organisation has also been expressedby researchers in the performance measurement and management (PMM) field (De Toni andTonchia, 2001; Franco-Santos et al., 2007; Micheli and Mari, 2014). The goal of such researchis to produce results that are not only valid theoretically but also useful practically for thedesign, use and management of PMM systems (Dekker et al., 2013; Evans, 2004; Garengoet al., 2005; Franco-Santos et al., 2012). Moreover, calls have been made in the IS researchfield to shift from the study of the use of IT artefacts to the study of their “effective” use,observing that the complexity of many organisational situations with regard to IT artefactsand their use was not accounted for in previous IS usage studies (Grover and Lyytinen,2015) and in PMMS usage studies in particular (Melnyk et al., 2014). Given the rather limitedimplications of these studies for both PMM and IS theory and practice, the need for a betterconceptualisation, contextualisation and explanation of the use of IT artefacts has beenexpressed by a number of researchers (e.g. Burton-Jones and Grange, 2013; Hsieh andWang, 2007).
Given the preceding considerations, the aims of this study are both descriptive andexplicative, that is, to characterise the extent to which PMM systems are used effectively bySMEs and to identify the principal antecedents and performance outcomes of such use.Thus arise the following research questions:
RQ1. What constitutes the effective use of PMMS?
RQ2. What are the user, artefactual and task-related drivers of such use?
RQ3. What are the benefits for SMEs of using PMM systems effectively?
2. Theoretical backgroundThe ambiguity that surrounds the notion of system usage in the IS research domain is asource of problems with regard to the conceptualisation and operationalisation of this notion(Straub et al., 1995). An inappropriate or inadequate conceptualisation will not provide thecontextualisation required to fully understand the usage phenomenon under study, and willproduce mixed results that are difficult to interpret and may lead to erroneous conclusions,particularly when dealing with complex ISs such as PMMS (Boudreau and Seligman, 2003;Jain and Kanungo, 2005). Moreover, an inappropriate or inadequate measurement of IS usefounded upon superficial indicators (e.g. duration and frequency of use) that neglecttask-related aspects, or upon binary variables (0: non-use, 1: use) or proxies (adoption vs use)will not reveal the true nature of the use of a complex IT artefact such as a PMMS(Burton-Jones and Straub, 2006; Silvi et al., 2015).
This measurement problem may indicate a conceptualisation of IS usage that lackscontextualisation or assumes use contexts to be interchangeable. Limiting the explanatorypower of contextual elements would then limit our comprehension of the PMMSusage phenomenon. With regard to the IT artefactual context in particular, one could evensay that such reductionist approaches assume that all IT artefacts such as PMMSare alike or that their attributes have no importance in understanding their use.A judicious choice of usage variables and measures is thus necessary, if the researcher is
1215
PMMS as ITartefacts

to relate an IS’s attributes to the performance of the task supported by this system(Devaraj and Kohli, 2003).
Now, the problem is particularly serious for PMM systems as used in SMEs because eachSME is a case in point, with its own performance logic (Raymond et al., 2013), and a PMMSmust be aligned with this logic to provide the necessary information on the firm’s successfactors and thus help maintain the firm’s competitive advantage (Marchand andRaymond, 2008). In studying the use of a PMMS artefact in a SME, an underdevelopedconceptualisation and measure may produce an erroneous assessment of the artefact’sbusiness value (Micheli and Mari, 2014). Situating the PMM system “in context” allows oneto assess its capacity to represent the “real world” of the organisation, and thus evaluatethese systems in an appropriate manner (Uwizeyemungu and Raymond, 2009).
Given the problems commonly associated with demonstrating the benefits of PMM(St-Pierre and Raymond, 2004) and the lack of consensus with regard to the actualperformance impacts of PMMS (Baird, 2017), Micheli and Mari (2014) have drawnattention to the underdevelopment of the “performance measurability” concept, and to themeasurement processes that ensue from it. In addition to ontological and epistemologicalconsiderations on the act of measuring as such, these authors’ questionings implypractical considerations on the tool developed to carry out this measurement, i.e. the PMMSartefact, and on the manner in which this tool is used. Measuring is an epistemic act, that is,one seeks to know something, and this epistemic act should be viewed from a relativist andpragmatic perspective (Mari, 2003). As advocated for the measurement of organisationalperformance, the pragmatic or situational perspective implies that the PMMS should befounded upon a model that is relevant to the “reality” represented, and that enablesthe achievement of organisational goals while being readily accessible, easy to use andaffordable (Lorino, 2002; Lorino et al., 2017). Moreover, this perspective favours actionas it situates the system in context and takes account of its usage contingencies(Micheli and Mari, 2014).
Complex ISs such as PMMS rest upon multiple elements and inter-related IT processescapable of integrating, within a logical ensemble, the firm’s operational and managerialprocesses across its various business functions (Boudreau and Seligman, 2003). Thesesystems are called upon to evolve with the needs of users whose type and level ofcompetency differ ( Jain and Kanungo, 2005). For this reason, the study of complex IS useshould be founded upon approaches that allow one to encompass the full range of thephenomenon in its specific context (Hsieh and Wang, 2007), and as the habitual constructsand measures of IS usage do not allow one to understand the cases where there is a lack ofappropriation of the system by users, where there is unexpected use of the system, wherethe system is under-used, and where its expected benefits are not realised (Burton-Jones andStraub, 2006).
The need for a richer conceptualisation and measurement of complex IS use is nowwell-recognised by researchers, in particular when this use is meant to support users in“cognitively engaging tasks” (Burton-Jones and Straub, 2006). By taking into accountcritical contextual elements such as the nature of use, its extent, its quality and the user’sexpectations, one should attain a better understanding of a complex IS such as a PMMS, ofits impacts and of the value or benefits realised from its use (Frutuoso Braz et al., 2011).This is borne out in a number of empirical studies where, in order to face a diversity ofcomplex systems in a large number of organisations, ISs use, and PMMS use in particular, isnot primarily approached from its technological aspects but rather from its teleologicalaspects such as its support of the firm’s management, strategy and decision making(e.g. Lisi, 2015).
Reflecting the different approaches that have been taken to solve these problemsof conceptualisation and operationalisation, many definitions of IS use or ancillary
1216
IJPPM67,7
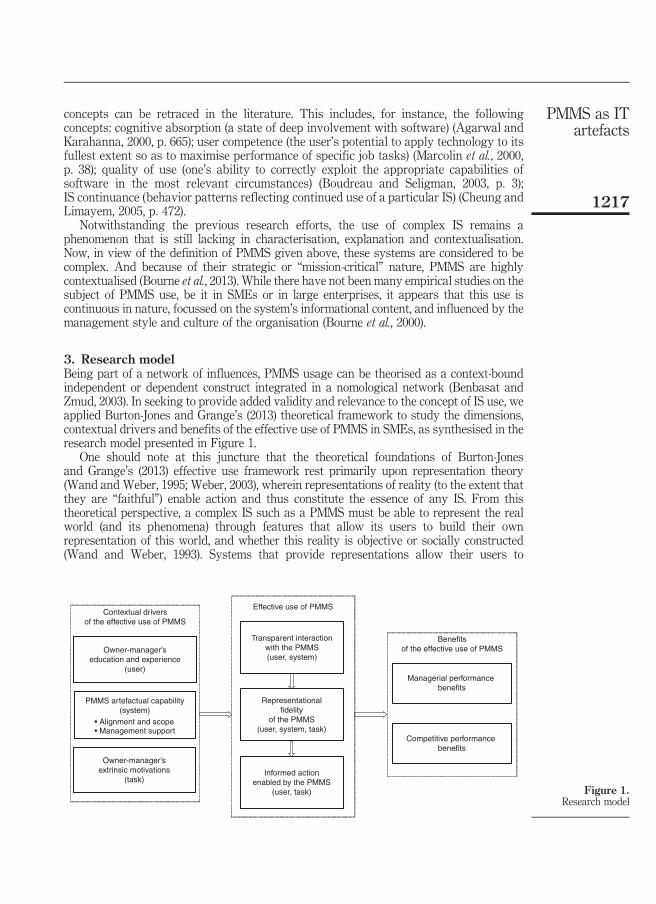
concepts can be retraced in the literature. This includes, for instance, the followingconcepts: cognitive absorption (a state of deep involvement with software) (Agarwal andKarahanna, 2000, p. 665); user competence (the user’s potential to apply technology to itsfullest extent so as to maximise performance of specific job tasks) (Marcolin et al., 2000,p. 38); quality of use (one’s ability to correctly exploit the appropriate capabilities ofsoftware in the most relevant circumstances) (Boudreau and Seligman, 2003, p. 3);IS continuance (behavior patterns reflecting continued use of a particular IS) (Cheung andLimayem, 2005, p. 472).
Notwithstanding the previous research efforts, the use of complex IS remains aphenomenon that is still lacking in characterisation, explanation and contextualisation.Now, in view of the definition of PMMS given above, these systems are considered to becomplex. And because of their strategic or “mission-critical” nature, PMMS are highlycontextualised (Bourne et al., 2013). While there have not been many empirical studies on thesubject of PMMS use, be it in SMEs or in large enterprises, it appears that this use iscontinuous in nature, focussed on the system’s informational content, and influenced by themanagement style and culture of the organisation (Bourne et al., 2000).
3. Research modelBeing part of a network of influences, PMMS usage can be theorised as a context-boundindependent or dependent construct integrated in a nomological network (Benbasat andZmud, 2003). In seeking to provide added validity and relevance to the concept of IS use, weapplied Burton-Jones and Grange’s (2013) theoretical framework to study the dimensions,contextual drivers and benefits of the effective use of PMMS in SMEs, as synthesised in theresearch model presented in Figure 1.
One should note at this juncture that the theoretical foundations of Burton-Jonesand Grange’s (2013) effective use framework rest primarily upon representation theory(Wand and Weber, 1995; Weber, 2003), wherein representations of reality (to the extent thatthey are “faithful”) enable action and thus constitute the essence of any IS. From thistheoretical perspective, a complex IS such as a PMMS must be able to represent the realworld (and its phenomena) through features that allow its users to build their ownrepresentation of this world, and whether this reality is objective or socially constructed(Wand and Weber, 1993). Systems that provide representations allow their users to
Informed actionenabled by the PMMS
(user, task)
Representationalfidelity
of the PMMS(user, system, task)
Transparent interactionwith the PMMS(user, system)
Effective use of PMMS
PMMS artefactual capability(system)
• Alignment and scope• Management support
Owner-manager’sextrinsic motivations
(task)
Managerial performance benefits
Competitive performance benefits
Contextual driversof the effective use of PMMS
Benefitsof the effective use of PMMSOwner-manager’s
education and experience(user)
Figure 1.Research model
1217
PMMS as ITartefacts
faithfully track the state and state changes of other systems such as the organisation or thebusiness environment (Weber, 2003). Moreover, the representation of a real-worldphenomenon avoids the cost of having to directly observe the phenomenon in question(Wand and Weber, 1993). Representation systems provide access to phenomena that aredifficult to apprehend, impossible to follow directly or that do not yet exist (Weber, 2003).And the more their representations are “faithful” to the system being represented, the morethese systems provide an enlightened basis for action (Weber, 1997). With regards to aPMMS, one would expect that if it provides a faithful representation of the firm’s activities,it will then help users to understand what is being measured and enable them to take action.
The theoretical framework also relies upon affordance theory (Gibson, 1977), through itsinterest not only in the physical and sensory attributes of the IT artefact’s user-interface(physical and sensory affordance) but also in those attributes that support the user’scognitive ability (cognitive affordance) and capacity to act in the pursuance of a goal(functional affordance) (Hartson, 2003). Essentially, an affordance is the actor’s perception ofthe range of actions made possible by an artefact (Gibson, 1979; Norman, 1988). Affordancesare determined both by the characteristics of the artefact and by the sensory, motor andmental capacities of the user (Norman, 1988). Hence, for the same IT artefact, affordanceswill vary across users and usage situations.
Given the theoretical framework presented above, the three aspects to be prioritised arethe user, the IS and the task (defined as “goal-directed activity”) (Burton-Jones and Straub,2006). We thus followed Burton-Jones and Grange’s (2013) approach because we deemed itto be most appropriate to our research aim of characterising and explaining the effective useof PMMS in the context of SMEs, given its encompassing multiple dimensions of effectiveuse and its organising of these dimensions into a coherent ensemble. In reaching beyondthe purely artefactual dimension of IS use, this framework incorporates other rarelyconsidered dimensions that are more specifically linked to what happens after the userinteracts with the system.
Burton-Jones and Grange’s (2013) theoretical framework also constitutes a basis for theoperationalization and measurement of effective use, providing us with the capacity tocontextualise a complex IT artefact such as a PMMS in a particularly rich manner, whencompared to previous conceptualizations of IS use. In this regard, Burton-Jones andGrange’s theory builds upon, extends and integrates well-known theories and models of ISuse, namely Davis’ (1989) technology acceptance model, DeSanctis and Poole’s (1994)adaptive structuration theory, Goodhue and Thompson’s (1995) technology-task fit, DeLoneand McLean’s (2003) IS success model and Barki et al. (2007) use-related activity. And in sodoing, Burton-Jones and Grange’s (2013) framework is the only one that attempts tosimultaneously explain the nature, antecedents and consequences of effective use.
3.1 Effective use of the PMMS artefactEffective use is defined by Burton-Jones and Grange (2013, p. 633) “as using a system in away that helps attain the goals for using the system”. This notion is conceptualised as threesequentially related components or dimensions: the physical access to the IS by the user(transparent interaction); the representation of an individual, organisational orenvironmental reality that the system provides to the user (representational fidelity); andthe action envisioned by the user from the system’s representations (informed action)(Burton-Jones and Grange, 2013, p. 642). Transparent interaction is thus viewed as anecessary condition of representational fidelity, which in turn is viewed as a necessarycondition of informed action.
As advocated by Burton-Jones and Straub (2006), our research model explicitly relateseach dimension of effective use to the aspects involved in the usage of a complex IS: the user,the system itself, and the task meant to be supported. Our ensuing contextualisation of the
1218
IJPPM67,7

effective use of PMMS was based on the findings of previous IS (Burton-Jones and Grange,2013; Burton-Jones and Straub, 2006; Hsieh andWang, 2007) and PMM (Garengo et al., 2005;Sharif, 2002) studies.
Transparent interaction with the PMMS (user/system-related). Defined as the “extent towhich a user is accessing the system’s representations unimpeded by its surface andphysical structures” (Burton-Jones and Grange, 2013, p. 642), this component of the researchmodel reflects the interaction of the SME owner-manager with the PMMS artefact.
Representational fidelity of the PMMS (user/system/task-related). Defined as the “extent towhich a user is obtaining representations from the system that faithfully reflect the domainbeing represented” (Burton-Jones and Grange, 2013, p. 642), this dimension of effective usereflects the perceived quality of the information output by the PMMS in relation to theowner-manager’s task.
Informed action enabled by the PMMS (user/task-related). Defined as the “extent to whicha user acts upon the faithful representations he or she obtains from the system to improvehis or her state” (Burton-Jones and Grange, 2013, p. 642), this dimension reflects theenablement by the PMMS of the actions required of owner-managers as they strive tomaintain and improve their firm’s performance.
Given Burton-Jones and Grange’s (2013) definition and three-dimensionalconceptualization of the effective use of an IT artefact, their framework also proposes toexplain how such use is meant to improve performance from the user’s perspective. Thus,transparent interaction allows users to interact seamlessly with the PMMS artefact and gaintime in the accomplishment of their task. Representational fidelity is meant to reduce the taskuncertainty of users by increasing their understanding of the performance domainrepresented by the PMMS artefact. Informed action allows users to leverage the informationobtained from the PMMS, that is, to “informate” their task (Zuboff, 1988). Finally,Burton-Jones and Grange’s (2013) theorisation of effective use is subject to boundaryconditions that delimit its application in different user, system and task contexts. For instance,the fact that certain users are more knowledgeable, experienced and motivated than othersand that certain systems (such as a PMMS) and certain tasks are more complex andinterdependent than others must be accounted for (Burton-Jones and Gallivan, 2007).
3.2 Contextual drivers of effective use of PMMSIn line with Burton-Jones and Grange’s (2013) theoretical framework, all three dimensionsof the effective use of a PMMS are expected to be influenced by contextual elementsrelated to the user, to the PMMS artefact he or she uses, and to his or her taskas owner-manager of a SME.
User’s education and experience (user-related). SME owner-managers’ socio-demographicattributes such as their age, gender, education and experience have long been known toinfluence their managerial behaviour (Smith and Miner, 1983). With respect to the use of aPMMS, we expect that owner-managers with the greater general knowledge and greatercapacity for analysis, synthesis and abstraction gained from a higher education as well asthe greater context-specific knowledge gained from a longer experience in the task and inthe work domain will make more effective use of such a complex IS (Raymond et al., 2013).
PMMS artefactual capability (system-related). System usage behaviours are obviouslybound by IT artefactual capabilities, i.e. those functional attributes of the IS thatdetermine what can and cannot be done by the user with the system (Wand and Weber,1995; Hartson, 2003). In the case of a PMMS artefact, we expect its effective use by a SMEowner-manager to be primarily driven by two artefactual capabilities (Marchand andRaymond, 2008). The first capability relates to the range of indicators present in thesystem that allow owner-managers to assess the different aspects of their firm’s
1219
PMMS as ITartefacts

performance in a holistic manner (level of alignment and scope of the PMMS artefact).The second capability relates to the system’s facilitation of the use of the performanceinformation output for managerial decision making and action purposes (managementsupport functionalities of the PMMS artefact).
User’s extrinsic motivations (task-related). In an organisational IS context, the user’sextrinsic motivations are based upon his or her perception of the system’s usefulness, thisperception resting upon the task-related usage goals defined ex ante by the user (Lowryet al., 2015). Behavioural theories such as the theory of reasoned action and the theory ofplanned behaviour have been oft-employed in IS research to successfully predict usagebehaviours from such motivations (Cheung and Limayem, 2005). In our case, the SMEowner-managers’ extrinsic motivations that are meant to predict the effective use of PMMSare based upon the expected usefulness of the system with respect to three primary usagegoals, as identified previously in the PMM literature (Bititci et al., 2012; Franco-Santos et al.,2012; Kueng et al., 2001). The first goal assigned by owner-managers to the use of a PMMS isto support their firm’s strategic planning process, the second is to support the SME’scontinuous improvement process, and the third is to support its operations managementprocess. We thus postulate that the greater the importance accorded to these goals byowner-managers, the more effective their use of PMMS.
3.3 Benefits of effective use of PMMSThe primary benefits of the effective use of PMMS are postulated here to be the organisationalimprovements obtained by a SME in terms of its managerial (internal) performanceand competitive (external) performance. The assumed relationship between PMMS use andperformance is based on the findings of previous PMM studies (Evans, 2004; Garengo andBititci, 2007; Chenhall, 2005) and on IS success/benefits/effectiveness measurement modelspreviously developed and validated by IS researchers (Gable et al., 2008; Seddon et al., 2002;Tallon et al., 2000). Our research model diverges in this regard from Burton-Jones andGrange’s (2013) proposal in that these authors conceptualise the performance benefits ofeffective use at the individual level (effectiveness and efficiency of the user). Moreover, ourresearch model initially assumes that all three dimensions of the effective use of PMMS willhave a positive impact on the SMEs’ attainment of performance benefits.
4. Research methodIn characterising the use of the PMMS artefact, we adopted a perspective that respects theontological value of this artefact. A positivist realist posture was thus taken to achieve thisaim (Strong and Volkoff, 2010), while simultaneously accounting for the researchers’presence and involvement in situ (Miles and Huberman, 1994).
4.1 Research design and samplingContextualising the use of an IT artefact in space and time entails a trade-off betweenexplanatory power and theoretical parsimony. The choice of a research strategy thatcombines scope and depth must account for the complexity of the environmental andorganisational contexts while controlling for relevant variables (Robson, 2002). To thiseffect, using a multiple case study or “field study” strategy in the sense of Boudreau et al.(2001) constitutes an appropriate research strategy as it reduces the study’s contextualdependency and simultaneously favours the transferability and generalisability of itsresults (Lee and Baskerville, 2003).
The case study’s theoretical sampling criteria were set to clearly identify the PMMSartefact within the firm’s organisational IS (Marchand and Raymond, 2008). As presented inTable I, 16 SMEs located in different regions of the province of Quebec, Canada,
1220
IJPPM67,7
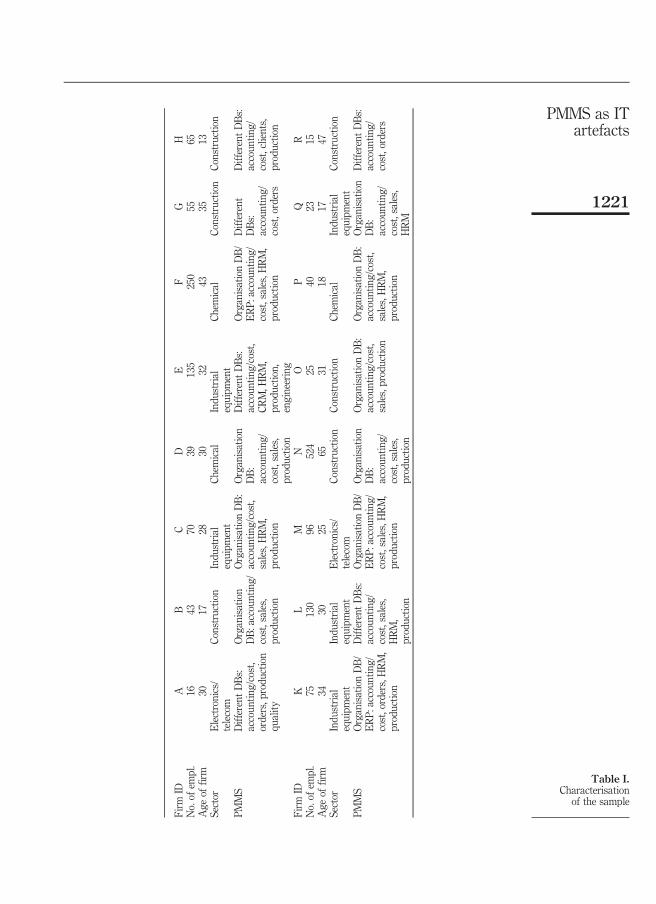
Firm
IDA
BC
DE
FG
HNo.of
empl.
1643
7039
135
250
5565
Age
offirm
3017
2830
3243
3513
Sector
Electronics/
telecom
Constructio
nIndu
strial
equipm
ent
Chem
ical
Indu
strial
equipm
ent
Chem
ical
Constructio
nCo
nstructio
n
PMMS
DifferentDBs:
accoun
ting/cost,
orders,p
rodu
ction
quality
Organisation
DB:accounting/
cost,sales,
productio
n
OrganisationDB:
accoun
ting/cost,
sales,HRM,
productio
n
Organisation
DB:
accoun
ting/
cost,sales,
productio
n
DifferentDBs:
accoun
ting/cost,
CRM,H
RM,
productio
n,engineering
OrganisationDB/
ERP:
accoun
ting/
cost,sales,H
RM,
productio
n
Different
DBs:
accoun
ting/
cost,orders
DifferentDBs:
accoun
ting/
cost,clients,
productio
n
Firm
IDK
LM
NO
PQ
RNo.of
empl.
75130
96524
2540
2315
Age
offirm
3430
2565
3118
1747
Sector
Indu
strial
equipm
ent
Indu
strial
equipm
ent
Electronics/
telecom
Constructio
nCo
nstructio
nCh
emical
Indu
strial
equipm
ent
Constructio
n
PMMS
OrganisationDB/
ERP:
accoun
ting/
cost,orders,HRM,
productio
n
DifferentDBs:
accoun
ting/
cost,sales,
HRM,
productio
n
OrganisationDB/
ERP:
accoun
ting/
cost,sales,H
RM,
productio
n
Organisation
DB:
accoun
ting/
cost,sales,
productio
n
OrganisationDB:
accoun
ting/cost,
sales,productio
n
OrganisationDB:
accoun
ting/cost,
sales,HRM,
productio
n
Organisation
DB:
accoun
ting/
cost,sales,
HRM
DifferentDBs:
accoun
ting/
cost,orders
Table I.Characterisation
of the sample
1221
PMMS as ITartefacts
and showing a variety of contexts in terms of the firms’ size, age and industrial sector werethus selected. To ensure the selection of firms that met the PMMS criteria as well as toprovide richness of experiences, phone calls and e-mails were exchanged with the firms’owner-manager prior to the case interviews.
4.2 Data collectionBoth flexible and structured data collection methods were employed, thus allowing fordifferent data types as well as their triangulation and corroboration (Yin, 2003). The userbeing the individual possessing the most knowledge of the PMMS artefact, employing amethodological approach that encourages the expression of his or her usage experience isnecessary. The user is thus asked to present the PMMS artefact he or she uses, and in his orher usage context. It is important to recall at this juncture that when the user’s perspective isnot accounted for, one cannot accurately describe nor truly understand the role that usageplays in the configuration of the IT artefact (Orlikowski and Iacono, 2001).
Combining qualitative and quantitative data analyses, we conducted extensiveinterviews in situ with the SMEs’ owner-manager. This individual’s influence informulating his or her firm’s strategy and managing its performance is the key to informthese aspects (Spanos and Lioukas, 2001) and consequently to describe the IT artefactdedicated to managing the SME’s performance. The interview was initiated with two openquestions: What is your definition of organisational performance as it applies to your firm?In what manner do you measure and manage this performance, and what tools do youemploy to do so? The interview then continued with the commented administration of aquestionnaire on the PMMS artefact, its use and its performance benefits, in addition tocontextual variables.
The interview was audio-recorded and notes were taken throughout its course. Thesenotes as well as the interviewer’s reflective comments were transcribed in the following 24 h(Robson, 2002). Available print documents relating to the PMMS artefact were also collectedand examined. Data collection activities were conducted over a 15 month period and carriedout in parallel with the data analysis, to allow for necessary adjustments (Robson, 2002).
4.3 Measurement and data analysisThe three components of the effective use of PMMS were ascertained by adaptingBurton-Jones and Grange’s (2013) as well as other measures of IS use taken from the extantIS (Hsieh and Wang, 2007; Burton-Jones and Straub, 2006) and PMM (Garengo et al., 2005;Sharif, 2002) literature, through ten linear, numeric scales (transparent interaction with thePMMS, representational fidelity of the PMMS) and five Likert scales (informed actionenabled by the PMMS), as presented in Table AI. The two dimensions of the PMMS’artefactual capability (alignment and scope, management support) were measured,respectively, through 12 and 9 Likert scales based on the range of functionalities found insuch systems (Marchand and Raymond, 2008), as presented in Table AII.
In line with previous measurement models of IS success/benefits/effectiveness (Kuenget al., 2001; Chenhall, 2005; Gable et al., 2008), the managerial performance and competitiveperformance benefits of the effective use of PMMS were assessed, respectively, through fiveand eight Likert scales adapted from the PMM literature (Evans, 2004; Garengo and Bititci,2007; Chenhall, 2005). Extrinsic motivations were measured by assessing the importanceaccorded by the owner-manager to three primary goals of PMMS use, taken from the PMMliterature (e.g. Bititci et al., 2012; Franco-Santos et al., 2012). The owner-manager’s level ofschooling (high-school, college or university), years as head of the firm (task experience) andyears in the firm’s sector of activity (industry experience) were used as measures of theuser’s education and experience.
1222
IJPPM67,7

The research questions were addressed with “exact” correlational, variance andregression analyses (Weerahandi, 1995), cluster analysis and Runkel’s (1990) relativefrequencies analysis. This last type of analysis aims to find associations between twovariables by using the calculus of probabilities, that is, by testing for the interdependence ofevents through a comparison of the actual relative frequency of joint events to the frequencyto be expected if the events were independent of one another. Note that all four types ofanalysis use statistical strategies that are particularly appropriate for small sample research(Hoyle, 1999).
5. Results5.1 Characterising the effective use of PMMSIn applying and testing Burton-Jones and Grange’s (2013) framework to characterise theeffective use of a PMMS artefact, one must first examine the relationship between the threecomponents of effective use, namely transparent interaction with the artefact (TI),representational fidelity of the artefact (RF) and informed action enabled by the artefact(IA). Now the correlational analysis presented in Table II provides evidence of the sequentialnature of this relationship, as postulated by these authors (TI→RF→IA), as TI is shown tobe significantly correlated to RF but not to IA, whereas RF is significantly correlated to IA.Moreover, a relative frequencies analysis allows us to determine that the “ease of use” and“completeness” of the information output by the PMMS are the two aspects of itsrepresentational fidelity that most benefit from a more transparent interaction with thissystem. In similar fashion, “fostering the emergence of new ideas” is the key aspect of theinformed action enabled by the PMMS artefact that benefits from a greater representationalfidelity of this artefact. These initial results thus offer a both novel and confirmatoryoperationalisation of Burton-Jones and Grange’s (2013) theoretical framework of thedimensions of the effective use of an IT artefact.
5.2 Contextualising the effective use of PMMSIn contextualising the effective use of a PMMS artefact, and given our research questions,we must first identify primary determinants of effective use at the user and artefactuallevels, as well as the components of this use (TI, RF and/or IA) that are affected. This firstimplies an examination of the influence of the user’s education and experience upon his orher effective use of a PMMS, as proposed in the research model (Figure 1). Now thecorrelational analysis presented in Table III indicates that it is the user’s level of educationrather than experience that is associated with a more effective use of PMMS in terms of RFand IA, but not in terms of TI. Here, the capacity to analyse, to synthesise and to transforminformation into actionable knowledge that is provided to the SME owner-manager by auniversity education may not be as readily developed solely from experience.
Cluster analysis was used to classify and characterise the 16 PMMS observed in terms oftheir artefactual capability. A four-cluster solution was most parsimonious, identifyinggroups of PMMS artefacts that could be clearly distinguished from one another based on the
Effective use of PMMSEffective use of PMMS TI RF IADimension R (p) R (p) R (p)
Transparent interaction with the PMMS (TI) –Representational fidelity of the PMMS (RF) 0.46 (0.076) –Informed action enabled by the PMMS (IA) 0.35 (0.188) 0.56 (0.023) –
Note: Dark|light grey-shaded cells indicate a significant relationship (exact statistics, n¼ 16, po0.05|0.1)
Table II.Interrelationship
of the dimensionsof effective use
1223
PMMS as ITartefacts
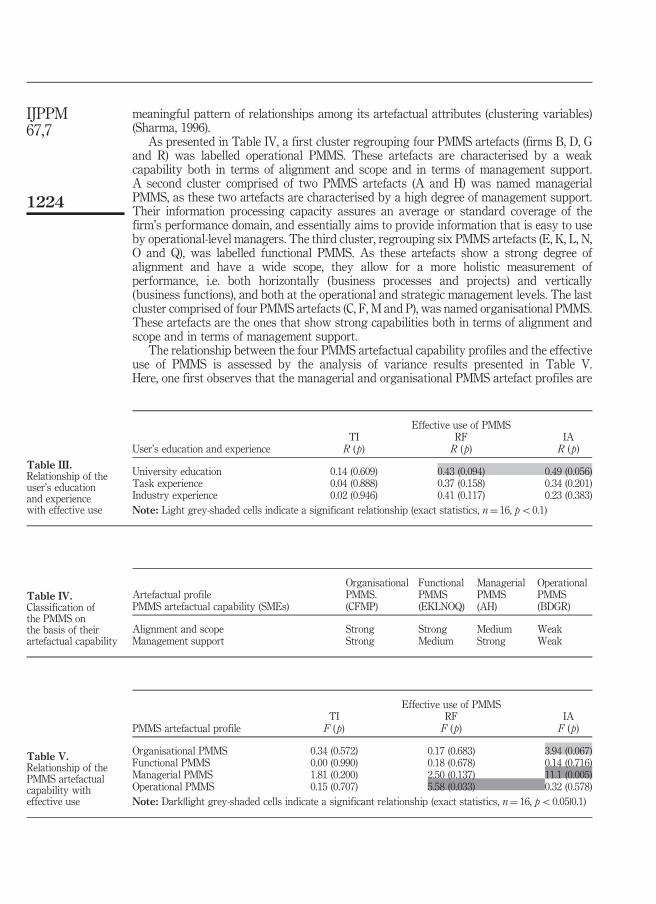
meaningful pattern of relationships among its artefactual attributes (clustering variables)(Sharma, 1996).
As presented in Table IV, a first cluster regrouping four PMMS artefacts (firms B, D, Gand R) was labelled operational PMMS. These artefacts are characterised by a weakcapability both in terms of alignment and scope and in terms of management support.A second cluster comprised of two PMMS artefacts (A and H) was named managerialPMMS, as these two artefacts are characterised by a high degree of management support.Their information processing capacity assures an average or standard coverage of thefirm’s performance domain, and essentially aims to provide information that is easy to useby operational-level managers. The third cluster, regrouping six PMMS artefacts (E, K, L, N,O and Q), was labelled functional PMMS. As these artefacts show a strong degree ofalignment and have a wide scope, they allow for a more holistic measurement ofperformance, i.e. both horizontally (business processes and projects) and vertically(business functions), and both at the operational and strategic management levels. The lastcluster comprised of four PMMS artefacts (C, F, M and P), was named organisational PMMS.These artefacts are the ones that show strong capabilities both in terms of alignment andscope and in terms of management support.
The relationship between the four PMMS artefactual capability profiles and the effectiveuse of PMMS is assessed by the analysis of variance results presented in Table V.Here, one first observes that the managerial and organisational PMMS artefact profiles are
Effective use of PMMSTI RF IA
User’s education and experience R (p) R (p) R (p)
University education 0.14 (0.609) 0.43 (0.094) 0.49 (0.056)Task experience 0.04 (0.888) 0.37 (0.158) 0.34 (0.201)Industry experience 0.02 (0.946) 0.41 (0.117) 0.23 (0.383)Note: Light grey-shaded cells indicate a significant relationship (exact statistics, n¼ 16, po0.1)
Table III.Relationship of theuser’s educationand experiencewith effective use
Artefactual profileOrganisationalPMMS.
FunctionalPMMS
ManagerialPMMS
OperationalPMMS
PMMS artefactual capability (SMEs) (CFMP) (EKLNOQ) (AH) (BDGR)
Alignment and scope Strong Strong Medium WeakManagement support Strong Medium Strong Weak
Table IV.Classification ofthe PMMS onthe basis of theirartefactual capability
Effective use of PMMSTI RF IA
PMMS artefactual profile F (p) F (p) F (p)
Organisational PMMS 0.34 (0.572) 0.17 (0.683) 3.94 (0.067)Functional PMMS 0.00 (0.990) 0.18 (0.678) 0.14 (0.716)Managerial PMMS 1.81 (0.200) 2.50 (0.137) 11.1 (0.005)Operational PMMS 0.15 (0.707) 5.58 (0.033) 0.32 (0.578)Note: Dark|light grey-shaded cells indicate a significant relationship (exact statistics, n¼ 16, po0.05|0.1)
Table V.Relationship of thePMMS artefactualcapability witheffective use
1224
IJPPM67,7

significantly associated to the effective use of the PMMS because they both have a strongmanagement support capability that better enables users to take informed action.A somewhat more surprising result is that the operational PMMS profile is also significantlyassociated to effective use, here in terms of representational fidelity. A possible explanationwould be that the operational orientation of these PMMS artefacts makes for simplersoftware design (limited number of performance indicators and managerial functionalities)and thus makes it easier to output performance information that is up to date, relevant,complete, easy to use and easy to interpret by their targeted users.
The results of the variance analysis linking users’ extrinsic motivations to their effectiveuse of PMMS are presented in Table VI. Here one finds that when the SME owner-managers’goal in using a PMMS artefact is to support either or both of their firm’s strategic planningand continuous improvement processes, effective use ensues in terms of the PMMSartefact’s greater representational fidelity. Whereas when the goal is to supportoperations management, effective use ensues in terms of the better-informed actionenabled by this artefact. This last result again comforts the shift of our research attentionfrom the use of an IT artefact to its effective use (Burton-Jones and Grange, 2013), in that itprovides a further explanation as to the conditions under which and the manner by whichIT-business value is achieved by an organisation that has invested in IT.
5.3 Valuing the effective use of PMMSAs presented in Table VII, the results of two regression analyses relate the three dimensionsof the effective use of PMMS (TI, RF and IA) to both the managerial performance andcompetitive performance benefits of this use, as perceived by the 16 SME owner-managers.The salient finding here is that the realisation of benefits from the use of a PMMS artefact issolely dependent upon the informed action that is enabled by this artefact. While neithertransparent interaction with the PMMS artefact nor its representational fidelity were foundto have a direct effect upon performance, these two dimensions of effective use wouldnevertheless have an indirect effect, as one may recall that they are sequentially prerequisite
Effective use of PMMSTI RF IA
User’s extrinsic motivations (goals of PMMS use) F (p) F (p) F (p)
Support strategic planning process 0.80 (0.385) 10.90 (0.005) 0.26 (0.620)Support continuous improvement process 2.31 (0.151) 3.39 (0.087) 0.35 (0.563)Support operations management process 0.22 (0.649) 0.27 (0.613) 6.79 (0.021)Note: Dark|light grey-shaded cells indicate a significant relationship (exact statistics, n¼ 16, po0.05|0.1)
Table VI.Relationship of the
user’s extrinsicmotivations with
effective use
Benefits of the effective use of PMMS (dependent variable)Managerial performance Competitive performance
Effective use of PMMS (independent variables) T (p) T (p)
Transparent interaction with the PMMS (TI) 0.00 (0.381) 1.58 (0.139)Representational fidelity of the PMMS (RF) 1.81 (0.774) 1.13 (0.282)Informed action enabled by the PMMS (IA) 0.15 (0.037) 2.69 (0.020)F (p) 4.23 (0.030) 9.31 (0.002)Adjusted R2 0.39 0.62Note: Dark grey-shaded cells indicate a significant relationship (exact statistics, n¼ 16, po0.05)
Table VII.Performance benefits
of the effectiveuse of PMMS
1225
PMMS as ITartefacts

to informed action. Furthermore, these last results confirm Leonardi’s (2007) view in that itis through informed action that the informational capabilities of an IT artefact are leveragedand thus generate value for the SMEs that have invested in this artefact.
6. DiscussionTo summarise our findings, and given our research questions and model, the nomologicalnetwork that emerged from this initial validation is presented in Figure 2. A first point to bemade is that the three dimensions of effective use are indeed hierarchically related, aspostulated in Burton-Jones and Grange’s (2013) framework, that is, TI enables RF which inturn enables IA. In accordance with these authors, it thus becomes important to assess eachdimension as a function of use rather than as a function of the IT artefact or the user, and toassess the context of use if one aims to theorise and operationalise effective use.
The second point is that informed action was the lone dimension of effective use to have aneffect on performance. This finding diverges from Burton-Jones and Grange’s (2013) proposalin that all three dimensions of effective use should have impacted the attainment ofperformance benefits by SMEs that have invested in a PMMS. Now, this divergence may bedue to these authors conceptualisation of performance at the individual level (effectivenessand efficiency of the user), whereas performance was conceptualised in this study at theorganisational level (managerial and competitive performance of the SME), albeit as assessedby the owner-manager who is the primary user of the PMMS and is well-placed to make suchan assessment (Raymond et al., 2013). It stands to reason however that apart from managerialand competitive performance, the development of the firm’s dynamic capabilities andchief among them its sensing, learning, integrating and coordinating capabilities are mostsusceptible to benefit from the effective use of a PMMS artefact (Sharif, 2002; Pavlou and ElSawy, 2011). We have thus included in the nomological network the development of these twodynamic capabilities as an added value of the effective use of a PMMS.
A third point to be made is that transparent interaction was the lone dimension of effectiveuse not to be influenced by any of the hypothesised user-related, system-related or task-relatedantecedents. Now, it stands to reason that the firm’s IT resources and capabilities, chief amongthem its IT infrastructure, are the contextual elements most susceptible to influence its effectiveuse of IT artefacts such as PMMS (Fink and Neumann, 2007). We have thus included in thenomological network, for future research purposes, the SME’s IT infrastructural capability as apotentially enabling factor of the owner-manager’s – and other managers’ – transparent
Informed actionenabled by the PMMS
(user, task)
Representationalfidelity
of the PMMS(user, system, task)
Transparent interactionwith the PMMS(user, system)
Effective use of PMMS
PMMS artefactual capability(system)
• Alignment and scope• Management support
Owner-manager’sextrinsic motivations
(task)
Managerial performancebenefits
Competitive performancebenefits
Contextual driversof the effective use of PMMS
Benefitsof the effective use of PMMS
Owner-manager’seducation and experience
(user)
SME’sIT infrastructural capability
(technological context)
Integrating/Coordinatingcapability
Sensing/Learningcapability
Figure 2.Nomological networkemerging from ourinitial validation of theresearch model
1226
IJPPM67,7
interaction with the PMMS artefact, or with any other of the firm’s “mission-critical” ITartefacts for that matter (e.g. ERP).
This study has provided an initial validation of Burton-Jones and Grange’s (2013)“effective use” framework, a framework that offers a conceptualization of IS use by which itis possible to explain IS effectiveness. It has shown the applicability of thisconceptualization and indicates that it is indeed possible to empirically capture the threecomponents of effective use proposed by these researchers. This approach is particularlyuseful for the study of complex organisational IS whose use cannot be reduced to a fewgeneric or proxy variables, limited in their consideration of the specific context of use.Through the broader and deeper characterisation, contextualisation and valuation that itallows, this study contributes to a better explanation of the PMMS usage phenomenon.
In applying Burton-Jones and Grange’s (2013) conceptualization of effective use toPMM systems, we were able to characterize PMMS use through three sequentially ordereddimensions. By thus opening the “black box” of IS use, this approach allowed us toidentify the variables that characterize the phenomenon under study in a more validmanner theoretically and in a more useful manner practically. Given the study’s aim, thesevariables were chosen in view of the nature of PMMS as complex organisational IS.By clarifying and proposing a unified basis for the concepts involved, these variables cancontribute to the accumulation and integration of IS and PMM research results into a morecoherent body of knowledge.
Our study further demonstrates that Burton-Jones and Grange’s (2013) framework canprovide the contextualisation necessary for an in-depth understanding of IS use andconsistent results in terms of the impacts of such use, particularly when it comes to complexorganisational IS such as PMMS. Thus, considering the diversity of IT artefacts and of thecontexts of use of these artefacts, and given our operationalization of this frameworkthrough variables that are rooted in the reality of the organisation (performancemanagement task, user, PMMS artefact) rather than being limited to generic or proxymeasures, we were able to understand the true nature of PMMS usage and to explain itscontextual determinants and performance outcomes. For example, artefactualcharacteristics (e.g. strong management support) were linked to particular aspects ofusage (e.g. informed action), links that more superficial IS use variables would not haverevealed. One can foresee that this approach would facilitate the understanding of usageproblems, e.g. divergent use or under-use, by investigating for example the prevailingsituation with regard to the representational fidelity of the PMMS artefact.
Lastly, our study confirms that Burton-Jones and Grange’s (2013) three-dimensionalconceptualization of effective use (TI→RF→IA) provides the opportunity for researchers toobserve, in context, a logical transition from the use of a performance management tool tothe effects of this use, here from the use of a PMMS artefact to its organisational impacts inSMEs (Kueng, 2000). This provides the researcher with the theoretical means for a deeperunderstanding of the benefits that complex IS can provide to an organisation, and inparticular when the expected benefits of such systems (e.g. improved competitiveperformance) do not materialize.
6.1 Contribution to theoryGiven the results of this study and the theoretical approach taken to analyse PMMS use, itscontributions concern both the PMM and the IS research fields. First and foremost, thisstudy has shed new light on – and provided greater understanding of – the nature, extent,drivers and benefits of PMMS use by SME owner-managers. As questions remainunanswered with regard to managers’ use of IT-enabled ISs to measure and manage theirorganisation’s performance, be it in large organisations, private or public, or in SMEs, ourstudy has provided both an empirically validated conceptual framework, in the form of a
1227
PMMS as ITartefacts

nomological network, and a measurement apparatus that may be employed by researchersto tackle many of these questions.
Our application and operationalisation of Burton-Jones and Grange’s (2013) theoreticalframework was found to be initially valid and fruitful in characterising, contextualising andvaluing the effective use of PMM systems in SMEs. As many researchers are still preoccupiedwith the study of complex organisational IS in decision-support roles, such as PMMS, and withthe realisation of IT business value from such use, our study contributes to the integration ofthese research efforts through a conceptualisation and operationalisation of IS use that isadapted to this type of IT artefact (Benbasat and Zmud, 2003). Our conceptualisation andoperationalisation of the IT artefactual capabilities included in the researchmodel answer the callfor researchers to account for the central position of the IT artefact (or IT materiality) in furtherattempts to understandwhy, how and to what effect managers use IT-enabled IS to measure andmanage their organisation’s performance (Weber, 2003; Orlikowski and Iacono, 2001).
6.2 Contribution to practiceAs the use of PMMS and the performance benefits of such use are not yet well understood(Franco-Santos et al., 2012), and especially in the context of SMEs (Bititci et al., 2012), theresults of this study provide conceptual and empirical foundations to improve PMMSpractice in this context, for organisations currently using a PMMS or for those planning touse such a system. For instance, with regard to the design of a PMMS artefact, one wouldconcentrate on those artefactual attributes that most enable informed action on the part ofowner-managers, as these actions have been shown to have greater consequences for therealisation of IT business value in SMEs.
The study’s findings further indicate that PMM systems possessing strong managementsupport capability, i.e. organisational PMMS and managerial PMMS, better enable informedaction and a PMMS artefact that incorporates attributes providing such support (e.g. that “allowsfor external benchmarking”, that “shows cause-effect links”) will promote a more informedmanagement of performance on the part of SME owner-managers. Furthermore, a simpler PMSSsoftware design, i.e. an operational PMSS with a limited number of indicators and managerialfunctionalities, would positively influence the managers’ ability to view the performance of theirorganisation in a holistic manner and thus reduce the risk of unintended consequences resultingfrom under-informed action. These findings may also be useful for organisations that alreadyuse a PMMS and would like to evaluate its business value. Indeed, the three-dimensionalconceptualization of effective use provides an expanded frame of reference for such anevaluation, that is, an evaluation whose scope is wider scope and whose depth is greater.
Finally, the nomological network resulting from this research could provide thetheoretical and methodological underpinnings of a diagnostic tool meant to develop thePMM function in SMEs, and in particular to evaluate the alignment of the firm’s PMMS withits business strategy and IS strategy.
7. ConclusionWhile this field study has some limitations related to the nature of the sample, its resultsnonetheless provide further empirical grounding and understanding of the concept ofeffective use, as well as further applicability and actionability to this concept and to thenomological network of its dimensions, contextual drivers and benefits in the case of PMMSand in the context of SMEs. Future research should however add technological,environmental and organisational context-related antecedents to this network, includingfirst and foremost the IT infrastructural capabilities of the organisation. Other consequencesof the effective use of PMMS should also be studied, the priority being given to the influenceof such use upon the development of the dynamic capabilities that enable SMEs to remaincompetitive in a global, knowledge-based economy.
1228
IJPPM67,7

References
Agarwal, R. and Karahanna, E. (2000), “Time flies when you’re having fun: cognitive absorption andbeliefs about information technology usage”, MIS Quarterly, Vol. 24 No. 4, pp. 665-694.
Baird, K. (2017), “The effectiveness of strategic performance measurement systems”, InternationalJournal of Productivity and Performance Management, Vol. 66 No. 1, pp. 3-21.
Barki, H., Titah, R. and Boffo, C. (2007), “Information system use-related activity: an expandedconceptualization of information system use”, Information Systems Research, Vol. 18 No. 2,pp. 173-192.
Benbasat, I. and Zmud, R.W. (2003), “The identity crisis within the IS discipline: defining andcommunicating the discipline’s core properties”, MIS Quarterly, Vol. 27 No. 2, pp. 183-194.
Bititci, U.S., Garengo, P., Dörfler, V. and Nudurupati, S. (2012), “Performance measurement: challengesfor tomorrow”, International Journal of Management Reviews, Vol. 14 No. 3, pp. 305-327.
Boudreau, M.C. and Seligman, L. (2003), “A learning-based model of quality of use: insights from a casestudy of ERP implementation”, DIGIT 2003 Proceedings, Association for Information Systems,Paper 4, pp. 1-24.
Boudreau, M.C., Gefen, D. and Straub, D.W. (2001), “Validation in information systems research:a state-of-the-art assessment”, MIS Quarterly, Vol. 25 No. 1, pp. 1-16.
Bourne, M., Mills, J., Wilcox, M., Neely, A. and Platts, K. (2000), “Designing, implementing and updatingperformance measurement systems”, International Journal of Operations & ProductionManagement, Vol. 20 No. 7, pp. 754-771.
Bourne, M., Pavlov, A., Franco-Santos, M., Lucianetti, L. and Mura, M. (2013), “Generatingorganizational performance: the contributing effects of performance measurement and humanresource management practices”, International Journal of Operations & ProductionManagement, Vol. 33 Nos 11/12, pp. 1599-1622.
Burton-Jones, A. and Gallivan, M.J. (2007), “Towards a deeper understanding of system usage inorganizations: a multilevel perspective”, MIS Quarterly, Vol. 31 No. 4, pp. 657-679.
Burton-Jones, A. and Grange, C. (2013), “From use to effective use: a representation theory perspective”,Information Systems Research, Vol. 24 No. 3, pp. 632-658.
Burton-Jones, A. and Straub, D.W. (2006), “Reconceptualizing system usage: an approach and empiricaltest”, Information Systems Research, Vol. 17 No. 3, pp. 632-658.
Busco, C., Giovannoni, E. and Scapens, R.W. (2008), “Managing the tensions in integrating globalorganisations: the role of performance management systems”, Management AccountingResearch, Vol. 19 No. 2, pp. 103-125.
Chenhall, R.H. (2005), “Integrative strategic performance measurement systems, strategic alignment ofmanufacturing, learning and strategic outcomes: an exploratory study”, Accounting,Organizations and Society, Vol. 30 No. 5, pp. 395-422.
Cheung, C.M.K. and Limayem, M. (2005), “The role of habit in information systems continuance:examining the evolving relationship between intention and usage”, Proceedings of the Twenty-SixthInternational Conference on Information Systems, Las Vegas, NV, pp. 471-482.
Costa, S., Pappalardo, C. and Vicarelli, C. (2017), “Internationalization choices and Italian firmperformance during the crisis”, Small Business Economics, Vol. 48 No. 3, pp. 753-769.
Davis, F.D. (1989), “Perceived usefulness, perceived ease of use, and end user acceptance of informationtechnology”, MIS Quarterly, Vol. 13 No. 3, pp. 318-339.
De Toni, A. and Tonchia, S. (2001), “Performance measurement systems – models, characteristics andmeasures”, International Journal of Operations & Production Management, Vol. 21 Nos 1/2,pp. 46-70.
Dekker, H.C., Groot, T. and Schoute, M. (2013), “A balancing act? The implications of mixed strategiesfor performance measurement system design”, Journal of Management Accounting Research,Vol. 25 No. 1, pp. 71-98.
1229
PMMS as ITartefacts

DeLone, W.H. and McLean, E.R. (2003), “The DeLone and McLean model of information systemssuccess: a ten-year review”, Journal of Management Information Systems, Vol. 19 No. 4, pp. 9-30.
DeSanctis, G. and Poole, M.S. (1994), “Capturing the complexity in advanced technology use: adaptivestructuration theory”, Organization Science, Vol. 5 No. 2, pp. 121-147.
Devaraj, S. and Kohli, R. (2003), “Performance impacts of information technology: is actual usage themissing link?”, Management Science, Vol. 49 No. 3, pp. 273-289.
Evans, J.R. (2004), “An exploratory study of performance measurement systems and relationships withperformance results”, Journal of Operations Management, Vol. 22 No. 3, pp. 219-232.
Fink, L. and Neumann, S. (2007), “Gaining agility through IT personnel capabilities: the mediating roleof IT infrastructure capabilities”, Journal of the Association for Information Systems, Vol. 8 No. 8,pp. 440-462.
Franco-Santos, M., Lucianetti, L. and Bourne, M. (2012), “Contemporary performance measurementsystems: a review of their consequences and a framework for research”, ManagementAccounting Research, Vol. 23 No. 2, pp. 79-119.
Franco-Santos, M., Kennerley, M., Micheli, P., Martinez, V., Mason, S., Marr, B., Gray, D. and Neely, A.(2007), “Towards a definition of a business performance measurement system”, InternationalJournal of Operations & Production Management, Vol. 27 No. 8, pp. 784-801.
Frutuoso Braz, R.G., Scavarda, L.F. and Martins, R.A. (2011), “Reviewing and improving performancemeasurement systems: an action research”, International Journal of Production Economics,Vol. 133 No. 2, pp. 751-760.
Gable, G.G., Sedera, D. and Chan, T. (2008), “Re-conceptualizing information systems success: theIS-impact measurement model”, Journal of the Association for Information Systems, Vol. 9 No. 7,pp. 377-408.
Garengo, P. and Bititci, U. (2007), “Towards a contingency approach to performance measurement: anempirical study in Scottish SMEs”, International Journal of Operations & ProductionManagement, Vol. 27 No. 8, pp. 784-801.
Garengo, P., Biazzo, S. and Bititci, U. (2005), “Performance measurement systems in SMEs: a review fora research agenda”, International Journal of Management Reviews, Vol. 7 No. 1, pp. 25-47.
Gibson, J.J. (1977), “The theory of affordances”, in Shaw, R.E. and Bransford, J. (Eds), Perceiving, Acting,and Knowing, Lawrence Erlbaum Associates, Hillsdale, NJ, pp. 127-143.
Gibson, J.J. (1979), The Ecological Approach to Visual Perception, Houghton Mifflin, Boston, MA.
Goodhue, D.L. and Thompson, R.L. (1995), “Task-technology fit and individual performance”,MIS Quarterly, Vol. 19 No. 2, pp. 213-236.
Grover, V. and Lyytinen, K. (2015), “New state of play in information systems research: the push to theedges”, MIS Quarterly, Vol. 39 No. 2, pp. 271-296.
Hagsten, E. and Kotnik, P. (2017), “ICT as facilitator of internationalisation in small- and medium-sizedfirms”, Small Business Economics, Vol. 48 No. 2, pp. 431-436.
Hall, M. (2014), “Do comprehensive performance measurement systems help or hinder managers’mental model development?”, Management Accounting Research, Vol. 22 No. 2, pp. 68-83.
Hartson, H.R. (2003), “Cognitive, physical, sensory, and functional affordances in interaction design”,Behavior and Information Technology, Vol. 22 No. 5, pp. 315-338.
Hoyle, R.H. (1999), Statistical Strategies for Small Sample Research, Sage Publications, Thousand Oaks, CA.
Hsieh, J.J.P.A. and Wang, W. (2007), “Explaining employees’ extended use of complex informationsystems”, European Journal of Information Systems, Vol. 16 No. 3, pp. 216-227.
Jain, V. and Kanungo, S. (2005), “Beyond perceptions and usage: impact of nature of informationsystems use on information system-enabled productivity”, International Journal ofHuman-Computer Interaction, Vol. 19 No. 1, pp. 113-136.
Kueng, P. (2000), “Process performance measurement system: a tool to support process-basedorganizations”, Total Quality Management, Vol. 11 No. 1, pp. 67-86.
1230
IJPPM67,7

Kueng, P., Meier, A. and Wettstein, T. (2001), “Performance measurement systems must beengineered”, Communications of the Association for Information Systems, Vol. 7, pp. 1-27.
Lee, A.S. and Baskerville, R.L. (2003), “Generalizing generalizability in information systems research”,Information Systems Research, Vol. 14 No. 3, pp. 221-243.
Leonardi, P.M. (2007), “Activating the informational capabilities of information technology fororganizational change”, Organization Science, Vol. 18 No. 5, pp. 813-831.
Lisi, I.E. (2015), “Translating environmental motivations into performance: the role of environmentalperformancemeasurement systems”,Management Accounting Research, Vol. 29, December, pp. 27-44.
Lorino, P. (2002), “Vers une théorie pragmatique et sémiotique des outils appliquée aux instruments degestion”, Document de recherche ESSEC No. DR 02015, Cergy-Pontoise, 23pp.
Lorino, P., Moury, D. and Schmidt, G. (2017), “Goffman’s theory of frames and situated meaning-making in performance reviews: the case of a category management approach in the Frenchretail sector”, Accounting, Organizations and Society, Vol. 58, April, pp. 32-49.
Lowry, P.B., Gaskin, J.E. and Moody, G.D. (2015), “Proposing the multimotive information systemscontinuance model (MISC) to better explain end-user system evaluations and continuanceintentions”, Journal of the Association for Information Systems, Vol. 16 No. 7, pp. 515-579.
Marchand, M. and Raymond, L. (2008), “Researching performance measurement systems: aninformation systems perspective”, International Journal of Operations & ProductionManagement, Vol. 28 No. 7, pp. 663-686.
Marcolin, B.L., Compeau, D., Munro, M.C. and Huff, S.L. (2000), “Assessing user competence:conceptualization and measurement”, Information Systems Research, Vol. 11 No. 1, pp. 37-60.
Mari, M. (2003), “Epistemology of measurement”, Measurement, Vol. 34 No. 1, pp. 17-30.
Melnyk, S.A., Bititci, U., Platts, K., Tobias, J. and Andersen, B. (2014), “Is performance measurementand management fit for the future?”, Management Accounting Research, Vol. 25 No. 2,pp. 173-186.
Micheli, P. and Mari, L. (2014), “The theory and practice of performance measurement”, ManagementAccounting Research, Vol. 25 No. 2, pp. 147-156.
Miles, M.B. and Huberman, A.M. (1994), Qualitative Data Analysis – An Expanded Sourcebook, 2nd ed.,Sage, Thousand Oaks, CA.
Norman, D.A. (1988), The Psychology of Everyday Things, Basic Books, New York, NY.
Orlikowski, W.J. and Iacono, C.S. (2001), “Research commentary: desperately seeking the ‘IT’ in ITresearch – a call to theorizing the IT artifact”, Information Systems Research, Vol. 12 No. 2,pp. 121-134.
Pavlou, P.A. and El Sawy, O.A. (2011), “Understanding the elusive black box of dynamic capabilities”,Decision Sciences, Vol. 42 No. 1, pp. 239-273.
Poba-Nzaou, P., Raymond, L. and Fabi, B. (2014), “Risk of adopting mission-critical OSS applications:an interpretive case study”, International Journal of Operations & Production Management,Vol. 34 No. 4, pp. 477-512.
Raymond, L., Marchand, M., St-Pierre, J., Cadieux, L. and Labelle, F. (2013), “Dimensions of smallbusiness performance from the owner-manager’s perspective: a re-conceptualisation andempirical validation”, Entrepreneurship & Regional Development, Vol. 25 Nos 5/6, pp. 468-499.
Robson, C. (2002), Real World Research, 2nd ed., Blackwell Publishers, Oxford.
Runkel, P.J. (1990), Casting Nets and Testing Specimens: Two Grand Methods of Psychology, Praeger,New York, NY.
Seddon, P.B., Graeser, V. and Willcocks, L.P. (2002), “Measuring organizational IS effectiveness: anoverview and update of senior management perspectives”, Data Base for Advances inInformation Systems, Vol. 33 No. 2, pp. 11-28.
Sharif, A.M. (2002), “Benchmarking performance management systems”, Benchmarking: AnInternational Journal, Vol. 9 No. 1, pp. 62-85.
1231
PMMS as ITartefacts
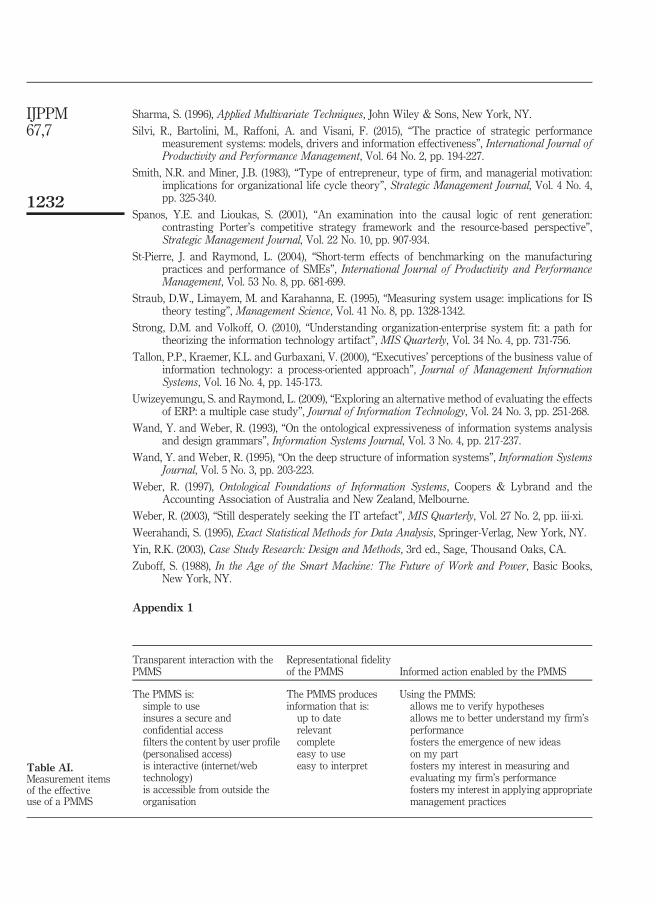
Sharma, S. (1996), Applied Multivariate Techniques, John Wiley & Sons, New York, NY.
Silvi, R., Bartolini, M., Raffoni, A. and Visani, F. (2015), “The practice of strategic performancemeasurement systems: models, drivers and information effectiveness”, International Journal ofProductivity and Performance Management, Vol. 64 No. 2, pp. 194-227.
Smith, N.R. and Miner, J.B. (1983), “Type of entrepreneur, type of firm, and managerial motivation:implications for organizational life cycle theory”, Strategic Management Journal, Vol. 4 No. 4,pp. 325-340.
Spanos, Y.E. and Lioukas, S. (2001), “An examination into the causal logic of rent generation:contrasting Porter’s competitive strategy framework and the resource-based perspective”,Strategic Management Journal, Vol. 22 No. 10, pp. 907-934.
St-Pierre, J. and Raymond, L. (2004), “Short-term effects of benchmarking on the manufacturingpractices and performance of SMEs”, International Journal of Productivity and PerformanceManagement, Vol. 53 No. 8, pp. 681-699.
Straub, D.W., Limayem, M. and Karahanna, E. (1995), “Measuring system usage: implications for IStheory testing”, Management Science, Vol. 41 No. 8, pp. 1328-1342.
Strong, D.M. and Volkoff, O. (2010), “Understanding organization-enterprise system fit: a path fortheorizing the information technology artifact”, MIS Quarterly, Vol. 34 No. 4, pp. 731-756.
Tallon, P.P., Kraemer, K.L. and Gurbaxani, V. (2000), “Executives’ perceptions of the business value ofinformation technology: a process-oriented approach”, Journal of Management InformationSystems, Vol. 16 No. 4, pp. 145-173.
Uwizeyemungu, S. and Raymond, L. (2009), “Exploring an alternative method of evaluating the effectsof ERP: a multiple case study”, Journal of Information Technology, Vol. 24 No. 3, pp. 251-268.
Wand, Y. and Weber, R. (1993), “On the ontological expressiveness of information systems analysisand design grammars”, Information Systems Journal, Vol. 3 No. 4, pp. 217-237.
Wand, Y. and Weber, R. (1995), “On the deep structure of information systems”, Information SystemsJournal, Vol. 5 No. 3, pp. 203-223.
Weber, R. (1997), Ontological Foundations of Information Systems, Coopers & Lybrand and theAccounting Association of Australia and New Zealand, Melbourne.
Weber, R. (2003), “Still desperately seeking the IT artefact”, MIS Quarterly, Vol. 27 No. 2, pp. iii-xi.
Weerahandi, S. (1995), Exact Statistical Methods for Data Analysis, Springer-Verlag, New York, NY.
Yin, R.K. (2003), Case Study Research: Design and Methods, 3rd ed., Sage, Thousand Oaks, CA.
Zuboff, S. (1988), In the Age of the Smart Machine: The Future of Work and Power, Basic Books,New York, NY.
Appendix 1
Transparent interaction with thePMMS
Representational fidelityof the PMMS Informed action enabled by the PMMS
The PMMS is:simple to useinsures a secure andconfidential accessfilters the content by user profile(personalised access)is interactive (internet/webtechnology)is accessible from outside theorganisation
The PMMS producesinformation that is:up to daterelevantcompleteeasy to useeasy to interpret
Using the PMMS:allows me to verify hypothesesallows me to better understand my firm’sperformancefosters the emergence of new ideason my partfosters my interest in measuring andevaluating my firm’s performancefosters my interest in applying appropriatemanagement practices
Table AI.Measurement itemsof the effectiveuse of a PMMS
1232
IJPPM67,7

Appendix 2
Appendix 3
Corresponding authorLouis Raymond can be contacted at: [email protected]
Alignment and scope Management support
The PMMS:includes strategic-level performance indicatorsincludes operational-level performance indicatorsincludes prospective performance indicatorsincludes business function performance indicatorsincludes business process performance indicatorsmeasures production qualitymeasures production delaysmeasures production flexibilitymeasures R&Dmeasures customer satisfactionmeasures the organisational climatemeasures training and learning
The PMMS:provides relative measures (trends, ratios, gaps)presents information in graphical formatincludes qualitative performance indicatorsshows links between operations and strategyshows cause-effect linksallows for external benchmarkinginterprets contentallows for the development of scenariosformulates recommendations Table AII.
Measurement itemsof PMMS artefactual
capability
Managerial performance benefits Competitive performance benefits
Using the PMMS has a favourable impact upon:the development of the firm’s strategythe development of managerial processes overallthe development of decision-making processesthe capacity to quickly react to market changesthe firm’s productivity
Using the PMMS improves:the capacity to respond adequately to market changesthe firm’s flexibilitythe capacity to identify market opportunities forproducts and servicesthe firm’s capacity to innovatethe capacity to focus attention on the firm’s criticalsuccess factorsthe alignment of the firm’s resources with its strategythe cohesion of objectives at all levels of the firmthe coordination of the firm’s functions, processesand projects
Table AIII.Measurement items of
the performancebenefits of PMMS use
For instructions on how to order reprints of this article, please visit our website:www.emeraldgrouppublishing.com/licensing/reprints.htmOr contact us for further details: [email protected]
1233
PMMS as ITartefacts
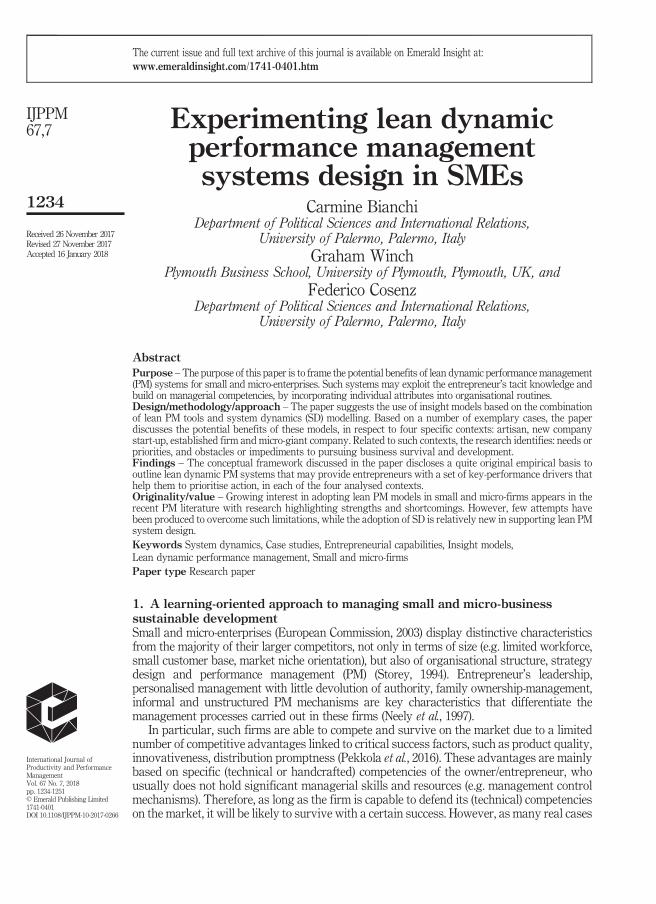
Experimenting lean dynamicperformance managementsystems design in SMEs
Carmine BianchiDepartment of Political Sciences and International Relations,
University of Palermo, Palermo, ItalyGraham Winch
Plymouth Business School, University of Plymouth, Plymouth, UK, andFederico Cosenz
Department of Political Sciences and International Relations,University of Palermo, Palermo, Italy
AbstractPurpose –The purpose of this paper is to frame the potential benefits of lean dynamic performancemanagement(PM) systems for small and micro-enterprises. Such systems may exploit the entrepreneur’s tacit knowledge andbuild on managerial competencies, by incorporating individual attributes into organisational routines.Design/methodology/approach – The paper suggests the use of insight models based on the combinationof lean PM tools and system dynamics (SD) modelling. Based on a number of exemplary cases, the paperdiscusses the potential benefits of these models, in respect to four specific contexts: artisan, new companystart-up, established firm and micro-giant company. Related to such contexts, the research identifies: needs orpriorities, and obstacles or impediments to pursuing business survival and development.Findings – The conceptual framework discussed in the paper discloses a quite original empirical basis tooutline lean dynamic PM systems that may provide entrepreneurs with a set of key-performance drivers thathelp them to prioritise action, in each of the four analysed contexts.Originality/value – Growing interest in adopting lean PM models in small and micro-firms appears in therecent PM literature with research highlighting strengths and shortcomings. However, few attempts havebeen produced to overcome such limitations, while the adoption of SD is relatively new in supporting lean PMsystem design.Keywords System dynamics, Case studies, Entrepreneurial capabilities, Insight models,Lean dynamic performance management, Small and micro-firmsPaper type Research paper
1. A learning-oriented approach to managing small and micro-businesssustainable developmentSmall and micro-enterprises (European Commission, 2003) display distinctive characteristicsfrom the majority of their larger competitors, not only in terms of size (e.g. limited workforce,small customer base, market niche orientation), but also of organisational structure, strategydesign and performance management (PM) (Storey, 1994). Entrepreneur’s leadership,personalised management with little devolution of authority, family ownership-management,informal and unstructured PM mechanisms are key characteristics that differentiate themanagement processes carried out in these firms (Neely et al., 1997).
In particular, such firms are able to compete and survive on the market due to a limitednumber of competitive advantages linked to critical success factors, such as product quality,innovativeness, distribution promptness (Pekkola et al., 2016). These advantages are mainlybased on specific (technical or handcrafted) competencies of the owner/entrepreneur, whousually does not hold significant managerial skills and resources (e.g. management controlmechanisms). Therefore, as long as the firm is capable to defend its (technical) competencieson the market, it will be likely to survive with a certain success. However, as many real cases
International Journal ofProductivity and PerformanceManagementVol. 67 No. 7, 2018pp. 1234-1251© Emerald Publishing Limited1741-0401DOI 10.1108/IJPPM-10-2017-0266
Received 26 November 2017Revised 27 November 2017Accepted 16 January 2018
The current issue and full text archive of this journal is available on Emerald Insight at:www.emeraldinsight.com/1741-0401.htm
1234
IJPPM67,7
Quarto trim size: 174mm x 240mm

prove, in the long term, the lack of PM systems may imply a weak understanding of both theimpact of current decisions on future growth and on the policies to undertake in order tocope with major changes (Bisbe and Malagueño, 2012). Usually, the deep causes of crises arefar from being related to sudden and inescapable events. Rather, they gradually arise as aresult of the concurrent action over time of different variables pertaining to the “relevant”business system, which embodies not only the internal boundaries of the firm, but also awider range of variables belonging to other external sub-systems, e.g. related to thecompetitive environment (Neely et al., 1995).
Entrepreneurs and other small business key actors should develop their abilities todetect weak signals of change in order to timely cope with possible sources of discontinuityleading to business crises. In this perspective, structural deficiencies of small andmicro-firms should not only be primarily related to lack of capital, managerial concepts,technical capabilities and qualified professional management. Entrepreneurs particularlyneed to better frame the complex system where they operate.
Standard accounting and financial-oriented packages and structured PM systems areusually recommended by both practitioners and scholars as a powerful tool to empowerdecision makers to prevent and counteract crises (Otley, 1999; Bianchi, 2002). However,although such tools may usefully satisfy specific information needs (e.g. product costing,net-working capital needs), they may not fully help decision makers in selectively detectingpatterns of behaviour of relevant variables driving to success or crisis (Tilt, 2010; Nandan,2010; Maskell and Baggaley, 2004; Mitchell and Reid, 2000; Perren and Grant, 2000).
To foster small and micro-business entrepreneurs’ strategic learning, the adoption offormal – though lean – PM systems may prove to be useful. A lean PM system in small andmicro-firms is able to combine the advantage of a structured with a flexible and selectiveapproach. The “lean” attribute is used here in order to characterize a different approach inapplying PM to small and micro-firms compared to larger organisations. In fact, suchsystems may fit with the characteristics of small and micro-firms. They are able to exploitthe entrepreneur’s tacit knowledge and to build on their own managerial competencies byincorporating such individual attributes into organisational routines. As a result, the use oflean dynamic PM systems – through insight models – may contribute to improvingentrepreneurial capabilities and decision making.
Based on this conceptual background, this paper will: discuss why a lean dynamicPM approach is needed in managing small and micro-firms; frame different small andmicro-business contexts and related criticalities for survival and development; and identifythe role that lean dynamic PM systems may play to fine-tune the structure and behaviour ofportrayed performance drivers and end-results with the specific problems/issues in thedifferent explored contexts.
In addition, the paper will consider the methodological conditions, motivations,challenges and requirements to successfully introduce this approach to small andmicro-business management, and how to communicate to entrepreneurs the usefulness ofsuch a tailored approach.
In the last sections of the paper, a number of examples related to real small andmicro-business success/failures will be discussed, and the role – in terms of challenges andmissed opportunities – played by lean dynamic PM systems in the context will be framed.
2. A dynamic view of PM: a perspective to build on entrepreneurialcapabilities in small and micro-firmsDynamic PM is an approach that enables entrepreneurs and business key actors to framethe causal mechanisms affecting organisational results over time. Such a field of researchand practice is based on two converging methods of enquiry: system dynamics (SD)modelling and PM (Bianchi, 2016; Cosenz and Noto, 2016; Barnabè, 2011).
1235
Lean dynamicPM systems
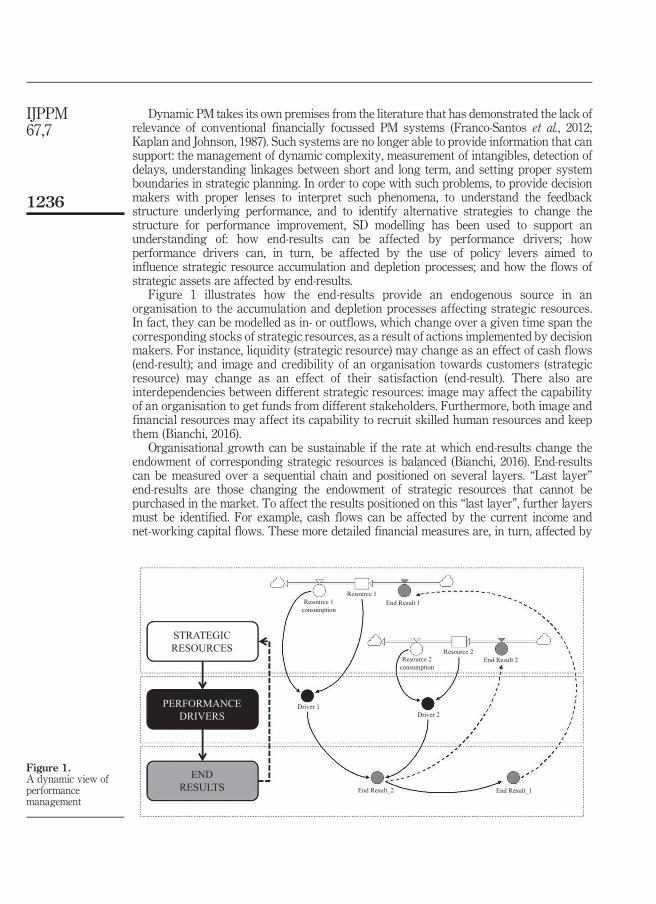
Dynamic PM takes its own premises from the literature that has demonstrated the lack ofrelevance of conventional financially focussed PM systems (Franco-Santos et al., 2012;Kaplan and Johnson, 1987). Such systems are no longer able to provide information that cansupport: the management of dynamic complexity, measurement of intangibles, detection ofdelays, understanding linkages between short and long term, and setting proper systemboundaries in strategic planning. In order to cope with such problems, to provide decisionmakers with proper lenses to interpret such phenomena, to understand the feedbackstructure underlying performance, and to identify alternative strategies to change thestructure for performance improvement, SD modelling has been used to support anunderstanding of: how end-results can be affected by performance drivers; howperformance drivers can, in turn, be affected by the use of policy levers aimed toinfluence strategic resource accumulation and depletion processes; and how the flows ofstrategic assets are affected by end-results.
Figure 1 illustrates how the end-results provide an endogenous source in anorganisation to the accumulation and depletion processes affecting strategic resources.In fact, they can be modelled as in- or outflows, which change over a given time span thecorresponding stocks of strategic resources, as a result of actions implemented by decisionmakers. For instance, liquidity (strategic resource) may change as an effect of cash flows(end-result); and image and credibility of an organisation towards customers (strategicresource) may change as an effect of their satisfaction (end-result). There also areinterdependencies between different strategic resources: image may affect the capabilityof an organisation to get funds from different stakeholders. Furthermore, both image andfinancial resources may affect its capability to recruit skilled human resources and keepthem (Bianchi, 2016).
Organisational growth can be sustainable if the rate at which end-results change theendowment of corresponding strategic resources is balanced (Bianchi, 2016). End-resultscan be measured over a sequential chain and positioned on several layers. “Last layer”end-results are those changing the endowment of strategic resources that cannot bepurchased in the market. To affect the results positioned on this “last layer”, further layersmust be identified. For example, cash flows can be affected by the current income andnet-working capital flows. These more detailed financial measures are, in turn, affected by
STRATEGICRESOURCES
ENDRESULTS End Result_2 End Result_1
End Result 2
Driver 2Driver 1
Resource 1consumption
Resource 1
Resource 2
End Result 1
Resource 2consumption
PERFORMANCEDRIVERS
Figure 1.A dynamic view ofperformancemanagement
1236
IJPPM67,7

non-monetary end-results. So, activity volumes affect revenues and the net-working capitalflow. They also affect purchase volumes, which impact on purchase costs and (throughpurchases on credit and the change in inventory) on the net-working capital flow. Therefore,activity volumes can be located on the first layer of end-results. Such results can be affectedby performance drivers.
The literature and practice on SD applied to strategic management has developed acomplementary approach to dynamic PM, implying the study of the dynamic conditionsleading an organisation to build up and defend its competitive advantage over time(Cosenz and Noto, 2016). Such an approach has been defined as dynamic resource-basedview (RBV).
Previous studies adopting a dynamic RBV of organisations have confirmed that themanagement of strategic resources, and more specifically the maintenance of an appropriatebalance between such assets, is the key to sustainable development (Morecroft, 2007;Warren, 2008).
The emerging models all focus on the building up and decline of core assets, includingworkers, equipment, population, workload, perceived service quality and financialresources. Each of the strategic resources can be controlled, to some extent, in isolationof the others; however, where there is not balanced growth or coherence in the assets, thenorganisations will likely be unable to grow to achieve their own potential, or might grow in anon-sustainable way. The two common features in strategic resource management, asshown in Figure 2, are the requirement for consistency between strategic assets and theneed to actively manage each strategic asset to maintain balance.
A synthesis of both the complementary approaches is portrayed in Figure 3.This paper will predominantly use a dynamic PM approach, since its primary focus is on
empowering small and micro-business entrepreneurs with lean modelling tools through whichthey may frame the structure and behaviour of their company’s key-performance indicators.
Workers
Service quality
Financialresources
Population
Workload
Equipment
Accumulationrate
Accumulationrate
STRATEGICRESOURCE
CONSISTENCY
Accumulationrate
Accumulationrate
Accumulationrate
Accumulationrate
Depletion rate
Depletion rate
Depletion rate
Depletion rate
Depletion rate
Depletion rate
Figure 2.A dynamic resource-
based view
1237
Lean dynamicPM systems
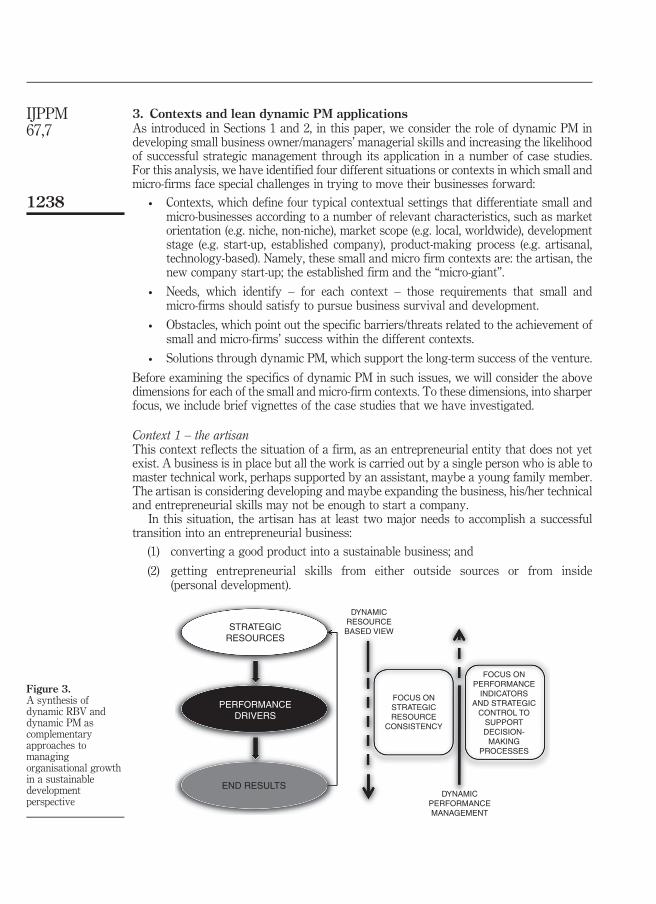
3. Contexts and lean dynamic PM applicationsAs introduced in Sections 1 and 2, in this paper, we consider the role of dynamic PM indeveloping small business owner/managers’ managerial skills and increasing the likelihoodof successful strategic management through its application in a number of case studies.For this analysis, we have identified four different situations or contexts in which small andmicro-firms face special challenges in trying to move their businesses forward:
• Contexts, which define four typical contextual settings that differentiate small andmicro-businesses according to a number of relevant characteristics, such as marketorientation (e.g. niche, non-niche), market scope (e.g. local, worldwide), developmentstage (e.g. start-up, established company), product-making process (e.g. artisanal,technology-based). Namely, these small and micro firm contexts are: the artisan, thenew company start-up; the established firm and the “micro-giant”.
• Needs, which identify – for each context – those requirements that small andmicro-firms should satisfy to pursue business survival and development.
• Obstacles, which point out the specific barriers/threats related to the achievement ofsmall and micro-firms’ success within the different contexts.
• Solutions through dynamic PM, which support the long-term success of the venture.
Before examining the specifics of dynamic PM in such issues, we will consider the abovedimensions for each of the small and micro-firm contexts. To these dimensions, into sharperfocus, we include brief vignettes of the case studies that we have investigated.
Context 1 – the artisanThis context reflects the situation of a firm, as an entrepreneurial entity that does not yetexist. A business is in place but all the work is carried out by a single person who is able tomaster technical work, perhaps supported by an assistant, maybe a young family member.The artisan is considering developing and maybe expanding the business, his/her technicaland entrepreneurial skills may not be enough to start a company.
In this situation, the artisan has at least two major needs to accomplish a successfultransition into an entrepreneurial business:
(1) converting a good product into a sustainable business; and
(2) getting entrepreneurial skills from either outside sources or from inside(personal development).
STRATEGICRESOURCES
END RESULTSDYNAMIC
PERFORMANCEMANAGEMENT
DYNAMICRESOURCEBASED VIEW
FOCUS ONSTRATEGICRESOURCE
CONSISTENCY
FOCUS ONPERFORMANCE
INDICATORSAND STRATEGIC
CONTROL TOSUPPORTDECISION-
MAKINGPROCESSES
PERFORMANCEDRIVERS
Figure 3.A synthesis ofdynamic RBV anddynamic PM ascomplementaryapproaches tomanagingorganisational growthin a sustainabledevelopmentperspective
1238
IJPPM67,7

It is not argued that this is a complete list. We just argue that these needs are likely to becentral to all “artisan vs. entrepreneur” transitions.
There are likely to be many obstacles to making such a fundamental change (again thisis not an exhaustive list.) First, the artisan must be able to understand and estimate the timeand scope of new skills needed to make a major change from an artisanal to anentrepreneurial skill base. The artisan will then need to identify the possible sources of thoseentrepreneurial skills. A key barrier in many transitions is counteracting the artisan’sreluctance to relinquish control to outsiders: this might include any specialist managersbrought in, contracted accountants or book-keepers, outside stakeholders like suppliers offunds and supply chain partners.
The role of dynamic PM is to support the development of solutions that address theneeds of the artisan and overcome barriers. This is an issue of measuring key-performancevariables to prioritise action and to assist in describing and monitoring implementation.Specifically, in this case, this means the measuring of non-financial variables and, namely,those related to time and skills of the artisan. This may imply a focus on personalisedinsight modelling – simple processes that involve diagrams, scenarios and possibly verysmall and simple simulation models that focus on key decision variables and can assist inthe surfacing and communication of knowledge between stakeholders.
“Cremolose” is a family business that produces and sells handcrafted ice-creams, sorbets,slushes, pastries and cakes. It was started in 2000 by Nino Matranga together with his brother,after a long experience as a bar assistant. The business (i.e. the main store) is located in the citycentre of Palermo (Sicily/Italy) and has experienced a rapid growth in its start-up phase.
Such a growth has been based not only on sales turnover, but also on the opening of newstores in franchising in different parts the world.
The core competencies are related to the quality and uniqueness of its main product (called“cremolosa”) that has been invented and patented by the founder, who holds high handcraftand technical skills in this business sector. Particularly, the “cremolosa” is a slushed ice-creamproduced in various fruit flavours, such as almond, mulberry, nuts, strawberry, pistachio nut.
However, in the past few years, the company’s performance started to decline due to a toorapid and unsustainable growth whose causes can be referred to the lack of a managerialapproach in developing the business by the founder. Actually, Mr Matranga – encouraged bythe success of his firm – tried to enter in new businesses (i.e. launching other food businesses,fitness centres, etc.) by investing the earnings gained through the “cremolosa”. But, the lack ofmanagerial competencies and the shortage of time dedicated to developing the core business(especially in terms of technicalities and strategies to develop new products/markets) have ledto relevant losses. Namely, the lack of managerial skills and PM tools has resulted in a wrongdefinition of the product price (too low, if compared to the costs related to the businessexpansion), and a misperception of the weak signals emerging from the market sector (e.g. costcontainment and low price strategy).
Context 2 – the new company start-upThis context reflects the very different situation of a new company being launched, based on abusiness idea which is conceptualised and developed from scratch. This differs fundamentallyfrom the circumstances of a new business being created from an existing base-level artisan
1239
Lean dynamicPM systems
activity, where the core products or services remain the same, but an established businesswould offer longer-term security with growth and job-creation potential.
The basic need in this context is to identify and develop the most appropriate businessmodel for the new venture encompassing the processes of creating the product/service to beoffered, the financing options, distribution channels and the engagement of internalknowledge resources and external partners of various types. Any or all of these mightinvolve quite new and novel processes.
The key barriers to success in this context are:
• The tendency for inexperienced business model and process designers to adopt staticand non-systemic perspectives in sketching business plans.
• The difficulties in devising and carrying through a proper evaluation of the emergingbusiness model and identified alternative ones. This may be because of a lack ofwell-developed skills in business modelling or simply the inherent difficulties indoing this for highly innovative and novel structures.
Design and evaluation processes for developing the most appropriate business model haveto permit and support the creation of dynamic business plans (Bianchi, 2002); this implies afocus on either generic or “tailored” corporate models. Further, in the longer timeframe, theremay be a need for adapting and updating dynamic business plans during implementation,i.e. the business plans serve as, mainly, a management, rather than a forecasting, tool. Giventhat the circumstances might involve fast-moving and emerging new industries, there willbe a continuing role for comparing and re-evaluating alternative futures/business models(Cosenz, 2017).
Mosaicoon is a small-sized company established in 2008 in Palermo (Italy). Its core businessfocusses on the development of innovative marketing tools. The success of this business isbased on the introduction of innovative advertising models that combines the componentsof traditional advertising campaigns with those of interactive videos. Such a combinationhas determined the invention of the so-called “viral advertising”.
Particularly, viral advertising has been defined as “a marketing technique that usespre-existing social networks and other technologies to produce an increase in brandawareness or to achieve other marketing objectives through self-replicating viral processesanalogous to spread of computer viruses” (Source: Wikipedia). Therefore, Mosaicoondevelops advertising videos for its customers – usually large-sized or multi-nationalcompanies – to be uploaded in strategic positions of the web, i.e. in those online platformsthat allow videos to be viewed and posted in other web pages (e.g. social networks). Basedon both the quality and the attractiveness of its contents, as well as on the commercialcontacts, the advertising video receives a number of feedbacks from the internet users thatbroadcast these interactive products on the web, like a virus. The more views a videoobtains, the more revenues the company achieves (Bianchi et al., 2015).
Mosaicoon’s product portfolio includes design, execution and tracking of advertisingcampaigns.
So far, Mosaicoon staff counts 35 people and, according to current managerial forecasts,the workforce will grow up to 50 employees in the next few years. All employees are lessthan 35 years old. The company’s organisational structure is divided into four mainstrategic business areas: commercial, creative, seeding and financial.
1240
IJPPM67,7
The increasing development of the company – particularly in terms of sales, commercialstaff and new orders – is being supported by fundraising institutions that noticed itsbusiness potential during start-up competitions.
Mosaicoon’s competitive strategy has been designed to position the company in ahigh-end market segment. This has been made by fixing a high price of interactiveproducts that, otherwise, might dangerously allow potential competitors to easily accessthe market and undermine the competitive advantages so far achieved by the firm(Cosenz, 2012).
The external limits to growth are mainly related to the characteristics of the marketwhere Mosaicoon competes. Indeed, viral marketing offers weak barriers to the entrance ofnew competitors that can be located all over the world. Therefore, such a sector – alsocharacterised by a rapid obsolescence of its technological equipment, as well asproducts/services – can be easily entered by those small or large-sized firms with highinnovative assets. To remain competitive, Mosaicoon is called to continuously invest inthose strategic resources linked to the specific critical success factors of the market(e.g. commercial contacts, R&D).
Context 3 – the established company
This scenario involves small and micro-firms which have operated over an extendedperiod of time according to consolidated and quite successful business models. These willusually have been developed on a local basis. While the circumstances of thebusiness – both internal and external – remain stable, then the established business modelwill continue to be valid and operational. However, over time, there are likely to bechanges and drifts. These might be internal – for example, in family firms more familymembers might be drawn in each wishing to share in profits and influence decisions, ornew managers might be recruited in – or external, like changes in legal requirements orthe entry of a major new competitor. While mostly these will not require any significantchanges to the business model in use, there will be a need to monitor business performanceand, if necessary, develop or evolve a new business model (Cosenz and Noto, 2017).In particular, there is a clear need for the co-existence of a shared (team) leadership andindividual leadership.
There are two major barriers to the successful evolution of such established firms inany change situation. First, a failure to detect weak signs of important change, this meansthe firm could be overtaken by circumstances – the so-called “boiled frog” scenario(Senge, 1990). Along with this is the failure to recognise the need to change the existingbusiness model.
Solutions to these problems involve:
• Making tacit knowledge explicit so that it can be shared within the organisation(e.g. training new managers/entrepreneurs).
• Balancing family and/or manager involvement with business growth. Possiblerelevant performance measures might include, for example, “Ratio of familymanagers’ salaries/Company revenues”. There must be a focus on dynamic patternsof such indicators and improvement through reporting the ability of companydecision makers to understand the systemic relationships behind their dynamicbehaviours over time.
1241
Lean dynamicPM systems
• Productivity measures per unit of resource (e.g. revenues/employees; revenues/floorspace) to support the identification of drift and to evaluate new models.
• Evaluating the impact of trends in the market (e.g. aging in customer base; the size ofcustomer base).
Mazzara is a pastry shop and cafeteria located in the city business centre of Palermo, Italy. Itwas founded in 1909 and has always maintained a deep-rooted tradition of Sicilian pastryand ice-cream making.
The success of this small firm has been based on a consolidated business modelexclusively developed on a local basis. Particularly, the location – sited in the heart of thehistorical neighbourhood of Palermo – the elegance of the furniture and the artisanal qualityof the products have represented its main sources of competitive advantage. Such factorshave strongly influenced the firm’s image that also contributed in designating the shop as a“cultural lounge” of the city. Actually, in the post-Second World War, many internationalactors, intellectuals and writers (such as Giuseppe Lanza Tomasi di Lampedusa) wereregular clients of Mazzara.
The main products made and sold by the firm were traditional Sicilian cakes (e.g. cassata,cannoli, other ricotta-cheese pastries), almond biscuits, ice-creams, fruit-chocolate-creampastries, freeze melon cakes.
In the last two decades, the firm has enlarged the shop in terms of seats and tables, and hasalso hired new personnel to improve the service. In 2013, there were 32 employees working aswaiters, confectioners, chefs and assistants. Besides this, Mazzara maintained its traditionalfurniture and location.
However, such a business model – that has allowed the firm to achieve its success duringthe last century – has gradually been perceived by the clients as too old-fashioned. At thesame time, a number of new pastry shops and cafeterias have opened in the sameneighbourhood adopting a modern style of furniture and services. The lack of managerialcompetencies and PM tools has prevented the firm to perceive the weak signals related to botha change in customer behaviours and an increasing competition emerging in the externalenvironment.
Also, in the last decade, the financial crisis has significantly reduced the potential marketfor the firm. In fact, the business centre of Palermo has been dramatically affected bybankruptcies and downsizing policies which have decreased the number of employees in thebar area, who were used to spend their free time, having a break during the working days.
The described phenomena led to a reduction in the customer base; consequently, afinancial crisis has been publicly declared in 2014. Nowadays, Mazzara has closed theshop in the city centre and is currently searching for opportunities to save its traditionalpastry-making expertise.
Context 4 – the “micro-giant” companyThis context involves small firms that have developed surviving and possibly thrivingbusinesses on a local basis, despite the fact that the nature of their businesses and productsmean they have to compete against one or more a “giant” companies – large, strong, maybemulti-national businesses. While such a micro-giant might have successfully entered this
1242
IJPPM67,7
hostile environment, or survived when a “giant” entered and threatened its marketplace, forcontinued success, it needs a sustainable model for competing against “giants” (Bianchiet al., 2014). This will involve developing the abilities to resist competitor initiatives, efficientuse of limited resources to develop new products, and so on.
The major barriers to success are likely to involve an inability to change from a siegementality – a “David fighting Goliath” – to a stable competitive company, albeit a micro-giant (Bianchi et al., 2014). In particular, this is likely to depend critically on being able tolearn how to be nimble/flexible and to react quickly to competitors’ moves.
One critical determinant of success in such firms is the retention of customers/clients,and so PM is likely to involve the dynamic exploration and measurement of the drivers oftrust and loyalty by the local community and customers. Another key factor will be thediscovery and delivery of new products/services (e.g. product extension, innovation), andcritical to this will be the micro-giant’s ability to measure and manage the efficiency of itsR&D function (Bianchi et al., 2014).
Sellerio is a publishing house that was founded in 1963 by the Sellerio family, which viewedthe then-cultural scene as offering business opportunities. In particular, well-known Sicilianwriters like Leonardo Sciascia and Antonino Buttitta supported the spirit of such enterprise.Initially, Sellerio decided to position itself in a “peripheral”market niche, since the core of itseditions was represented by light but stylish materials, enhanced by graphical elegance andengravings and illustrations by important illustrators. The main authors published bySellerio came from the Sicilian literature tradition and other European quality niches. Thedirect managerial responsibility of the owner-family, the small number of employees and theperipheral position of the firm all define it as a small-sized enterprise. On the other hand, itssuccessful sales performance and long presence in the market confirm Sellerio’s ability tocompete on a day-to-day basis with “giant” enterprises.
The importance of intellectual capital for the success of enterprises in creative industrieshas been remarked by several authors. In this respect, Sellerio has demonstrated a stronginclination to discover and nurture the hidden potential of unknown young writers. Further,their successful writers have relied on the publisher to promote and position their work,contributing further to improving the firm’s competitiveness. The quality of product andgraphics are considered significant drivers in creating a distinctive format for collectionsand books (Barnard, 2005). This factor and the firm’s high reputation encourage customersto select their titles just by looking at the covers, even when customers are not actuallyfamiliar with the authors or content. The final Sellerio strength has been its ability to mountpromotional campaigns – its tight control of production costs enables it to compete bylowering books prices and promoting discount campaigns.
For each of the contexts identified, a brief case vignette has been offered based on one of thecase studies the authors have undertaken in developing the context-based analysis of thepotential role for dynamic PM in supporting the management of smaller firms as theyevolve. Each of the vignettes briefly encapsulates a period during the case company’slifetime. They have been selected to provide an insight into each of the context categories,and picks up some of the broad detail of the firm’s evolution during the period. The storiesalso reflect the general pathway of “Context→Needs→Obstacles→Solutions” along whichthe companies passed. However, this pathway is a summary, and common, construct
1243
Lean dynamicPM systems

developed by the authors through retrospection with the cases, and was not a consciousprocess reportedly undertaken by the companies and their managers at the time. Two of thefour companies appear to be moving forward, though not always perfectly smooth, whilethe other two have encountered severe problems.
Table I resumes the specific needs, obstacles and critical issues for introducing dynamicPM in the small and micro-businesses above analysed.
The reader can speculate as to whether the apparent solutions chosen by the firms’owner/entrepreneurs are likely to be successful (or, in one case, whether the firm’s demisewas foreseeable). Of course, in each case the firm is at a different phase of evolution, facingquite different challenges, and is in a different industry, but there are a number ofinteresting similarities. The need for a dynamic view of the future is clear in each case – thecompanies are all going through transitions which will make their futures quite different totheir pasts. All the companies were going through significant strategic changes, ofteninitiated by external factors in their marketplaces, but frequently due to internal issuesemerging, either spontaneously, as the company grew and changed, or because of attemptsto adapt to the new external factors. An RBV of the firm and a focus on the dynamics ofrelevant performance measures are central to these processes.
ContextCasestudy Needs(s) Obstacle(s)
Critical issues for dynamic performancemanagement
Artisan Cremolose 1 Acquisition ofentrepreneurialskills (ES)
Failure to identifyneed for ESsInability to assess ESdevelopmentLack of tools toevaluate newbusinesses inportfolio
Time and scope of new skills needed tomake a major change from an artisanal toan entrepreneurial skill baseAssessing artisan’s reluctance torelinquish control to outsidersCosting and pricingIdentification of customers andcompetitorsBalance of demands on internal resourcesPortfolio management metrics
Newstart-up
Mosaicoon 1 Ability tomaximallyexploit businessmodels2 Harnessing ofinternalresources
Maintainingbalanced growthVisualisation of newbusiness modelsInability to seeevolving business indynamic terms
Identification of key success factors inthe competitive systemFraming competitors and customersLevel of coherence of vision amongststakeholdersMeasures of alternate growth potentialsUnderstanding of dynamics of growth
Establishedfirm
Mazzara 1 Detection ofperformancedrift2 Evaluation ofnew businessmodels
Inability to detectchanges in customerpreferences andbehaviourInability to articulateconsequences of drift
Identification of causes and dynamics ofperformance driftRevenues per unit resource by productsector
“Micro-Giant”
Sellerio 1 Ability toreact swiftly tocompetitorinitiatives2 Harnessing ofinternal productdevelopmentcapability
Inability to develop aModus Operandi forstable businessFailure to move fromsuccessful entry tomixed reactive/innovative mode
Identification and measurement of thesources of competitive advantage, whichmake the product unique to the customer,in spite of alternative products availablefrom “giant” competitorsEffectiveness of repositioning for stableconditionsMeasurement of effectiveness of productdevelopment
Table I.A synthesis of thespecific needs,obstacles and criticalissues for introducingdynamic PM in thedescribed small andmicro-business casestudies
1244
IJPPM67,7
Specifically, an RBV is needed as it relates both to hard resources such as author inventoryin Sellerio, retail space in Mazzara, or to soft resources like business development skills inMazzara, and design and product development capabilities in Mosaicoon. A focus on thedynamics of performance measures is needed, since it will allow business decision makersboth to understand which dimensions (beyond the financial one) should be gauged topursue sustainable development, and to support them in identifying the relevant drivers ofsuccess; the improvement (or stability) of these over time is possible through theidentification, building and deployment of strategic resources.
The second common feature is the importance of entrepreneurial competencies; thisinvolves elements of envisioning the future (or alternative futures), the surfacing andsharing of the entrepreneur’s tacit knowledge, and general issues of communication of ideasand the building of alignment of perspective and thinking amongst the stakeholders.This fact also clearly points to why an explicit PM approach, particularly one that isitself dynamic, is essential. This perspective must focus on how performance has beenevolving and how it can continue to improve throughout the changing circumstances. Thiswill involve tracking small changes, or drift, in performance so that action can be plannedand implemented in good time, and that dynamic factors both during and after anytransitions are considered. It is also essential that such a lean dynamic PM approach worksalongside and complements a dynamic RBV of the firm and supports/enhances theleadership of the firm.
4. Two examples of lean dynamic PM systems in small and micro-firmsIn this section, we show and discuss two examples related to the application of a leandynamic PM approach to real small business failure/success. Particularly, we will focus onboth the artisan (Cremolose) and the new company start-up (Mosaicoon) contexts.
Regarding the first case, the development of a lean dynamic PM framework has allowedus to selectively identify a set of performance indicators that might have supportedMr Matranga in framing the Cremolose business system. In particular, the identification andmeasurement of performance drivers – as well as the understanding of the forces affectingthem –might have supported Mr Matranga in assessing the long-term effects caused by theadoption of his emerging strategy.
The competitive development of the firm has been based on the quality and uniquenessof its products. This variable is here modelled as a ratio between the company productquality and competitors’ product quality. Such competitive advantage has been built basedon the entrepreneur’s abilities (as an artisan) to develop innovative and good sorbets(very close to their natural flavours) in the core business. The change in product quality(end-result) is affected by a driver measured by the ratio between “time allocated to improveproduct quality” and the desired time to improve quality (i.e. a benchmark).
A higher product quality perceived by the market, in comparison to the firm’scompetitors, can increase the sales orders rate (end-result), which affects sales revenues,income and cash flows (which are end-results also on a lower layer of inference). A higherlevel of liquidity (strategic resource) – due to positive cash flows – can be invested inpurchasing high-quality raw materials to be used in producing slushed ice-creams, sorbetsand other pastries. This policy can further increase the core product quality (reinforcingloop fostering business development).
The firm has experienced a number of limits to growth, which have generated a crisis.Such limits can be detected – likewise it was commented regarding the developmentforces – by a number of performance drivers.
First of all, it is possible to mention “Process efficiency” and “Costing reliability”. The firstdriver can be measured by the ratio between kgs of product and the quantity of consumedraw materials (raw materials yield). The second driver can be measured as the ratio between
1245
Lean dynamicPM systems
estimated and actual production costs. Both drivers are affected by the entrepreneur’s skills:the more the company grows in its core business, the more the entrepreneur needs to developnew skills, beyond his fundamental technical skills in artisanal pastry making.
Concerning this, a lean dynamic PM system might have enabled the entrepreneur toidentify the sources of possible limits to the company’s growth and the crisis risks related tothe total available time of the entrepreneur and the available liquidity to reinvest to buildnew competencies (in minimising waste and improve costing). So, a trade-off between theneed of increasing the total time to allocate to management activities (i.e. the need to hire amanager or finding a business partner) and the need of slowing down the sales turnovergrowth rate would have been promptly and selectively perceived by Mr Matranga. Here, theentrepreneur’s technical skills (which have been named in this way to differentiate themfrom his artisanal skills) have been modelled as stocks of strategic resources. Such stock canbe increased by corresponding inflows, which depend on financial and time investments.
A declining or unsatisfactory performance in process efficiency and costing reliabilityreduces income and cash flows, in spite of an increasing product demand (balancing loopunderlying a limit to the company’s growth). In fact, on the one hand, a lower costingreliability affects the profit and loss statement of the firm, since actual production costs arehigher than the budgeted values. On the other hand, low process efficiency – at least in thelong run – forces the firm to increase the product price even beyond market thresholds(related to competitor’s prices, demand elasticity associated to the product niche). A too highprice may generate a strong reduction in market demand and in cash flows. Negative cashflows would generate a reduction of liquidity, which would further limit investment in thenew entrepreneur’s technical skills or in the acquisition of high-quality raw materials(reinforcing loop underlying a financial and competitive crisis of the firm).
More performance drivers associated with the allocation of entrepreneur’s time to run the(core) business are linked to the trade-off between the time needed to feed the developmentof new businesses. Encouraged by the rapid success gained through the quality of products,the entrepreneur decided to enter new businesses – such as other food stores, fitnesscentres – that have diverted his attention from the development of the core business.The time dedicated to other businesses has led to an impoverishment of product quality anda consequent reduction in the sales orders rate. Furthermore, the rising financial needsrelated to the investments in different businesses have strongly decreased the liquiditygained through selling the Cremolose products. As a result, nowadays, the firm ismarginalised at the borders of the city market.
Figure 4 provides a framework of a lean dynamic PM system based on theCremolose business.
Concerning the new company start-up context, we also developed a lean dynamic PMframework based on the Mosaicoon business. As described in the previous section of thispaper, the firm makes and broadcasts advertisement videos on the web.The increasing success that Mosaicoon is currently experiencing can be mainly related tothe massive number of views (end-result) that its online videos are able to collect in a shorttime span. An increase in video views depends on video quality, which is measured as aratio between Mosaicoon’s and its competitors’ video quality. The total number of videosthat have been successfully put online affects such quality: the more experience has beendeveloped, the higher (other things being equal) the quality of videos will be.
A strategic resource affecting the development of online videos and their quality is thecustomer base. The change in the customer base (end-result) is affected by the relative priceof company services (“company price/competitor price” ratio) and by the relative businessimage (“video views/desired views” ratio). The first performance driver is affected bythe strategic resource related to the average company price (perceived by the market). Thesecond driver is affected by the stock of total views. The two drivers affect the end-result
1246
IJPPM67,7
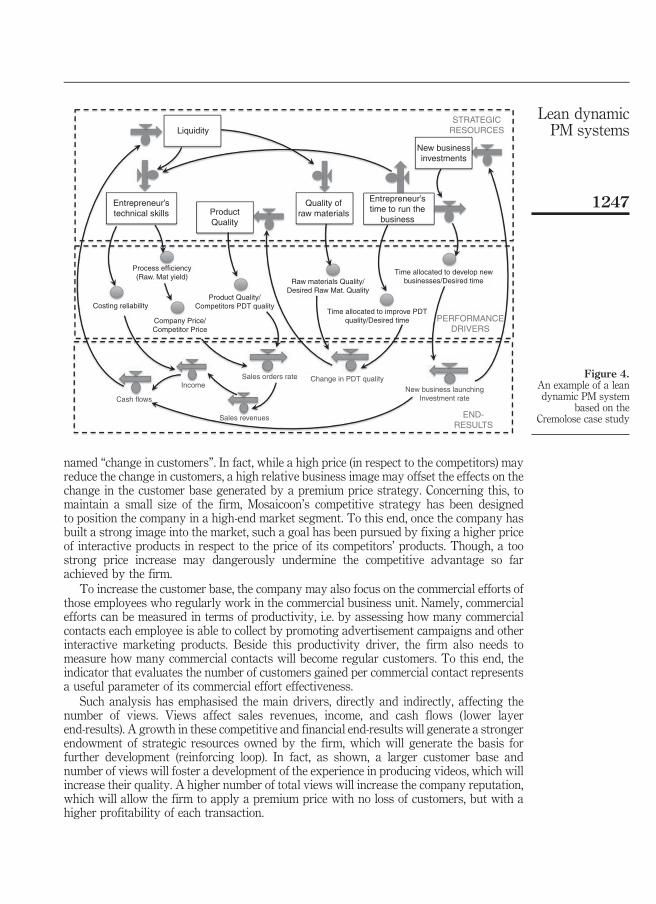
named “change in customers”. In fact, while a high price (in respect to the competitors) mayreduce the change in customers, a high relative business image may offset the effects on thechange in the customer base generated by a premium price strategy. Concerning this, tomaintain a small size of the firm, Mosaicoon’s competitive strategy has been designedto position the company in a high-end market segment. To this end, once the company hasbuilt a strong image into the market, such a goal has been pursued by fixing a higher priceof interactive products in respect to the price of its competitors’ products. Though, a toostrong price increase may dangerously undermine the competitive advantage so farachieved by the firm.
To increase the customer base, the company may also focus on the commercial efforts ofthose employees who regularly work in the commercial business unit. Namely, commercialefforts can be measured in terms of productivity, i.e. by assessing how many commercialcontacts each employee is able to collect by promoting advertisement campaigns and otherinteractive marketing products. Beside this productivity driver, the firm also needs tomeasure how many commercial contacts will become regular customers. To this end, theindicator that evaluates the number of customers gained per commercial contact representsa useful parameter of its commercial effort effectiveness.
Such analysis has emphasised the main drivers, directly and indirectly, affecting thenumber of views. Views affect sales revenues, income, and cash flows (lower layerend-results). A growth in these competitive and financial end-results will generate a strongerendowment of strategic resources owned by the firm, which will generate the basis forfurther development (reinforcing loop). In fact, as shown, a larger customer base andnumber of views will foster a development of the experience in producing videos, which willincrease their quality. A higher number of total views will increase the company reputation,which will allow the firm to apply a premium price with no loss of customers, but with ahigher profitability of each transaction.
Liquidity
ProductQuality
Process efficiency(Raw. Mat yield)
Costing reliability
Company Price/Competitor Price
Product Quality/Competitors PDT quality
Raw materials Quality/Desired Raw Mat. Quality
Time allocated to develop newbusinesses/Desired time
Time allocated to improve PDTquality/Desired time
New business launchingInvestment rate
Change in PDT quality
Sales revenues
Income
Cash flows
Sales orders rate
Quality ofraw materials
New businessinvestments
STRATEGICRESOURCES
PERFORMANCEDRIVERS
END-RESULTS
Entrepreneur’stime to run the
business
Entrepreneur’stechnical skills
Figure 4.An example of a leandynamic PM system
based on theCremolose case study
1247
Lean dynamicPM systems

A higher stock of liquidity will foster the hiring of new salespeople. This will generatenew contacts, new customers, more views, higher sales revenues, income and cash flows.
Likewise, it was commented in the previous case, also in this example, there are possiblelimits to growth. Such limits can be referred to corresponding performance drivers. Ignoringa shrinking performance of such drivers may first slow down the business growth process,then may even determine negative commercial and financial end-results.
For example, ignoring the “law of diminishing returns” related to a too aggressivecommercial strategy, based on a too intensive salespeople hire rate, may generate a too high“salespeople salaries/Indicated salespeople salaries”. The denominator of this ratio refers tothe sustainable salespeople costs that the current sales revenues on which the firm may relywould allow. A ratio higher than one is not a negative factor per se. In fact, if the increase ofcontacts, customers, video views and revenues that an aggressive salespeople hiringstrategy may determine more than offsets the increase of salary costs, than the previouslycommented growth-oriented reinforcing loop can be fostered. However, a too high salesforceincrease would result in a reduction of income (since the increase in fixed commercialexpenses would be higher than the increase in sales revenues). This would result in a drop ofcash flows and liquidity. Such phenomenon would act as an internal limit to a furthersalesforce expansion.
Figure 5 portraits a lean dynamic PM framework based on the Mosaicoon business.
5. ConclusionsAll small and micro-enterprises at some point in their evolution will undergo one, or indeedseveral, significant changes brought about by either external forces or internal developments.There are classical strategic management tools available to support the process of strategicrepositioning, including the use of the RBV of the firm, but we have considered the potential
Liquidity
Salespeople
AverageSales rev.
Commercialcontacts persalespeople
Salespeople salaries/Indicated Salaries
Cash flows Sales revenues
Income
Change in comm. contacts
Change in customersNew views
Customers percommercial
contacts
Company Price/Competitor Price
Video views/DesiredVideo Views
Videos’ Quality/Competitors’ video
quality
Commercialcontacts Average
priceVideoviews
Videoson-line
Videos’quality
STRATEGICRESOURCES
PERFORMANCEDRIVERS
END-RESULTS
Customerbase
Figure 5.An example of a leandynamic PM systembased on theMosaicoon case study
1248
IJPPM67,7

benefits of lean dynamic PM systems to enhance these approaches. In this research, the “lean”attribute is used to characterize a different approach in applying PM to small firms, comparedwith applications to larger organisations. We would expect that such systems will be able tomake use of entrepreneurs’ tacit knowledge and enhance their managerial competencies byincorporating positive individual attributes into organisational routines.
Our direct experiences and case-study analyses, some of which have been presented indetail here, have indicated that sudden crises, and, in some cases, a company’s eventualdemise, are often a product of gradual changes in circumstances that entrepreneurs have notbeen able to detect and isolate promptly and/or not counteract. We have considered howclassical information and decision-support tools, formal, financial-oriented and structuredaccounting systems are typically employed. However, their value is limited in terms ofsupporting decision makers in figuring out important patterns of behaviour over time, andin framing and examining the causal structure affecting them. These are essential if theentrepreneurs have to make effective decisions which will ensure a longer-term sustainablefuture for their firms. By placing the situation of companies facing structural change intothe framework of:
}Context-Needs-Obstacles-Solutions}:
We have looked at the process of moving to new structures and activities, including placingthis into the circumstances of four cases, presented briefly as vignettes. The cases recountthe evolution of the companies supported by analysis using then current approaches.We have therefore presented a more detailed examination of two of the cases which presentsa lean dynamic PM systems approach. This defines a PM system that is appropriate for theresources and capabilities of the smaller firm, but which can still take on board the dynamicnature of the firms and their environments.
We argue here that using such a lean dynamic PM system can help entrepreneurs andtheir direct collaborators in the process of the company-specific and continuous scanning ofcrisis symptoms, and the detection of opportunities for developing their business. Thisconceptual framework reveals a quite original empirical basis to outline a lean dynamic PMsystem that might provide decision makers with a set of key-performance drivers that helpsthem to prioritise action. We would further claim that our analysis here demonstrates how afocus on “dynamic” performance could support the managerial competencies of creativeentrepreneurs in communicating the core and purpose of their business idea, both inside andoutside the firm. It should also help entrepreneurs to restrain their emotional spirit, and toisolate and understand better the pertinent system and its delays, beyond the peripheralissues that can tend to over-tax their mental and physical resources.
References
Barnabè, F. (2011), “A ‘system dynamics-based balanced scorecard’ to support strategic decisionmaking: insights from a case study”, International Journal of Productivity and PerformanceManagement, Vol. 60 No. 5, pp. 446-473.
Barnard, M. (2005), Graphic Design as Communication, Routledge, London.
Bianchi, C. (2002), “Introducing SDmodeling into planning & control systems to manage SMEs growth:a learning-oriented perspective”, System Dynamics Review, Vol. 18 No. 3, pp. 315-338.
Bianchi, C. (2016), Dynamic Performance Management, Springer, Zurich.
Bianchi, C., Cosenz, F. and Marinković, M. (2015), “Designing dynamic performance managementsystems to foster SME competitiveness according to a sustainable development perspective:empirical evidences from a case-study”, International Journal of Business PerformanceManagement, Vol. 16 No. 1, pp. 84-108.
1249
Lean dynamicPM systems

Bianchi, C., Winch, G. and Cosenz, F. (2014), “Strategic asset building and competitive strategies forSMEs which compete with industry giants”, in Todorov, K. and Smallbone, D., Handbook ofResearch on Strategic Management in Small and Medium Enterprises, IGI Global, Hershey,pp. 77-96.
Bisbe, J. and Malagueño, R. (2012), “Using strategic performance measurement systems for strategyformulation: does it work in dynamic environments?”, Management Accounting Research,Vol. 23 No. 4, pp. 296-311.
Cosenz, F. (2012), Strategia e innovazione delle PMI italiane: quali condizioni possono influenzarne ilsuccesso competitivo? Il caso Mosaicoon S.p.A., in AA.VV., Il bene dell’azienda, Scritti in onore diVittorio Coda, Milan, pp. 355-386.
Cosenz, F. (2017), “Supporting start-up business model design through system dynamics modelling”,Management Decision, Vol. 55 No. 1, pp. 57-80.
Cosenz, F. and Noto, G. (2016), “Applying system dynamics modelling to strategic management:a literature review”, Systems Research and Behavioral Science, Vol. 33 No. 6, pp. 703-741.
Cosenz, F. and Noto, G. (2017), “A dynamic business modelling approach to design and experiment newbusiness venture strategies”, Long Range Planning, doi: 10.1016/j.lrp.2017.07.001.
European Commission (2003), European Commission Recommendation Recommendation,2003/361/EC, European Commission, Brussels.
Franco-Santos, M., Lucianetti, L. and Bourne, M. (2012), “Contemporary performance measurementsystems: a review of their consequences and a framework for research”, ManagementAccounting Research, Vol. 23 No. 2, pp. 79-119.
Kaplan, R.S. and Johnson, H.T. (1987), Relevance Lost: The Rise and Fall of Management Accounting,Harvard Business School Press, Boston, MA.
Maskell, B. and Baggaley, B. (2004), Practical Lean Accounting, Productivity Press, New York, NY.
Mitchell, F. and Reid, G. (2000), “Problems, challenges and opportunities: small business as a setting formanagement accounting research”, Management Accounting Research, Vol. 11 No. 4, pp. 385-390.
Morecroft, J. (2007), Strategic Modeling and Business Dynamics, Wiley, Chichester.
Nandan, R. (2010), “Management accounting needs of SMEs and the role of professional accountants: arenewed research agenda”, Journal of Management Accounting Research, Vol. 8 No. 1, pp. 65-78.
Neely, A., Gregory, M. and Platts, K. (1995), “Performance measurement system design: a literaturereview and research agenda”, International Journal of Operations & Production Management,Vol. 15 No. 4, pp. 80-116.
Neely, A., Richards, H., Mills, J., Platts, K. and Bourne, M. (1997), “Designing performance measures: astructured approach”, International Journal of Operations & Production Management, Vol. 17No. 11, pp. 1131-1152.
Otley, D. (1999), “Performance management: a framework for management control systems research”,Management Accounting Research, Vol. 10 No. 4, pp. 363-382.
Pekkola, S., Saunila, M. and Rantanen, H. (2016), “Performance measurement system implementation ina turbulent operating environment”, International Journal of Productivity and PerformanceManagement, Vol. 65 No. 7, pp. 947-958.
Perren, L. and Grant, P. (2000), “The evolution of management accounting routines in small businesses:a social construction perspective”,Management Accounting Research, Vol. 11 No. 4, pp. 391-411.
Senge, P. (1990), The Fifth Discipline: The Art and Practice of the Learning Organization, Doubleday,New York, NY.
Storey, D. (1994),Understanding the Small Business Sector, International Thompson Business Press, London.
Tilt, C.A. (2010), “Corporate responsibility, accounting and accountants”, in Idowu, S.O. and Leal Filho, W.(Eds), Professionals’ Perspectives of Corporate Social Responsibility, Springer, Zurich, pp. 11-32.
Warren, K. (2008), Strategic Management Dynamics, Wiley, Chichester.
1250
IJPPM67,7
About the authorsCarmine Bianchi is Professor of Business & Public Management at the Department ofPolitical Sciences and International Relations, University of Palermo (Italy), where he isalso Scientific Coordinator of CED4 System Dynamics Group. He is the Director of thedoctoral programme in “Model Based Public Planning, Policy Design, andManagement”,and of the master level programme in “Public Management”. Professor Bianchi isMember of the Steering Committee of the European Master in System Dynamics, anErasmus Mundus funded programme, sponsored by the European Commission. He has
published on several academic and professional journals, where he also serves as Member of the ScientificCommittee. Professor Bianchi has research and consulting experience with public and private sectororganisations in designing policies and outlining consistent programmes to link strategy andimplementation. Consulting and education projects that Professor Bianchi has conducted cover: strategicplanning and control, performance management and reporting, as well as system dynamics modelling forperformance improvement and crisis prevention (dynamic performance management).
Graham Winch is Professor Emeritus of Business Analysis at the University ofPlymouth Business School in the UK, and Affiliate Professor at ESC – RennesBusiness School in France. He holds a BSc in Chemistry and PhD in BusinessAdministration. Besides full-time industrial and consulting posts in Germany, UK andthe USA, Professor Winch was also Lecturer for ten years at the Durham UniversityBusiness School and has been Visiting Scholar at business schools in the USA, Italyand Australia. His research focusses on systems thinking and visualisation processes,
which he has used to study both small and large firm issues.
Federico Cosenz is Assistant Professor of Business & Public Management at theDepartment of Political Sciences and International Relations, University of Palermo(Italy). He holds an International PhD in “Model Based Public Planning, Policy Design,and Management” (University of Palermo, University of Bergen, Radboud Universityof Njimegen). He has published on several academic and professional journals. Hismain research interests are related to: performance management system, simulationfor business planning & strategic organisational learning, small business growth
management, business modelling, system dynamics modelling. Federico Cosenz is the correspondingauthor and can be contacted at: [email protected]
For instructions on how to order reprints of this article, please visit our website:www.emeraldgrouppublishing.com/licensing/reprints.htmOr contact us for further details: [email protected]
1251
Lean dynamicPM systems

Emerald is excited to announce a recent partnership with Peerwith, a platform that provides authors with a variety of services.
The Emerald Peerwith site can be found here:https://authorservices.emeraldpublishing.com/
Peerwith connects academics seeking support for their work with a relevant expert to get their research submission-ready. Peerwith experts can help with the following: language editing, copy editing, scientific editing, translation services, statistical support, funding application support, visuals, video, publication support, literature search, peer review and indexing services. Authors post their assignments on the Peerwith site, experts provide a quote, and the fee and conditions are then agreed upon directly between the author and the expert.
While we are not, of course, guaranteeing publication upon use of Peerwith, we hope that being able to direct academics to this resource either before submission or during the peer review process will help authors further improve the quality of their papers and increase their chances of positive reviews and acceptance.
Academics with relevant expertise can sign up as an expert on the Peerwith system here:https://www.peerwith.com/services/offer
12750_PeerwithJournalAd_Quarto_v01.indd 1 01/03/2017 11:07:18

Certificate Number 1985ISO 14001
ISOQAR certified Management System,awarded to Emerald for adherence to Environmental standard ISO 14001:2004.
International Journal of Productivity and Performance Managementis indexed and abstracted in:ABI InformBusiness Source Alumni Edition/Complete/Complete:
Government Edition/Corporate/Corporate Plus/Elite/Main Edition/Premier
Cabell’s Directory of Publishing Opportunities in Management and Marketing
Education Research Complete/Education SourceEmerald Management ReviewsErgonomics AbstractsINSPECProQuestPsycINFOSafetyLitTechnicalEducation and Training AbstractsTOC Premier (EBSCO)
International Journal of Productivity and Performance Management addresses new tools, developments and reflective analyses related to approaches designed to improve individual, group and organisational performance in and across all forms of organisations.
Emerald Publishing LimitedHoward House, Wagon Lane, Bingley BD16 1WA, United KingdomTel +44 (0) 1274 777700; Fax +44 (0) 1274 785201E-mail [email protected] more information about Emerald’s regional offices please go to http://www.emeraldgrouppublishing.com/officesCustomer helpdesk :Tel +44 (0) 1274 785278; Fax +44 (0) 1274 785201E-mail [email protected], subscription and missing claims enquiries:E-mail [email protected] +44 (0) 1274 777700; Fax +44 (0) 1274 785201
Missing issue claims will be fulfilled if claimed within six months of date of despatch. Maximum of one claim per issue.Hard copy print backsets, back volumes and back issues of volumes prior to the current and previous year can be ordered from Periodical Service Company. Tel +1 518 537 4700; E-mail [email protected] For further information go to www.periodicals.com/emerald.html
Reprints and permissions serviceFor reprint and permission options please see the abstract page of the specific article in question on the Emerald web site (www.emeraldinsight.com), and then click on the “Reprints and permissions” link. Or contact:E-mail [email protected] Publisher and Editors cannot be held responsible for errors or any consequences arising from the use of information contained in this journal; the views and opinions expressed do not necessarily reflect those of the Publisher and Editors, neither does the publication of advertisements constitute any endorsement by the Publisher and Editors of the products advertised.
No part of this journal may be reproduced, stored in a retrieval system, transmitted in any form or by any means electronic, mechanical, photocopying, recording or otherwise without either the prior written permission of the publisher or a licence permitting restricted copying issued in the UK by The Copyright Licensing Agency and in the USA by The Copyright Clearance Center. Any opinions expressed in the articles are those of the authors. Whilst Emerald makes every effort to ensure the quality and accuracy of its content, Emerald makes no representation implied or otherwise, as to the articles’ suitability and application and disclaims any warranties, express or implied, to their use.
Emerald is a trading name of Emerald Publishing LimitedPrinted by CPI Group (UK) Ltd, Croydon, CR0 4YY
CO-EDITORSDr Luisa Huaccho HuatucoSenior Lecturer in Operations Management, University of York, UKE-mail [email protected] Nicky ShawSenior Lecturer in Operations Management, Leeds University Business School, UKE-mail [email protected]
EDITORIAL ASSISTANTJennifer WebsterE-mail [email protected]
REGIONAL EDITOR – EUROPEDr Cláudia S Sarrico Technical University of Lisbon, Portugal
ISSN 1741-0401© 2018 Emerald Publishing Limited
Quarto trim size: 174mm x 240mm
Guidelines for authors can be found at:www.emeraldgrouppublishing.com/ijppm.htm

Inte
rnatio
nal Jo
urn
al of P
rod
uc
tivity and
Pe
rform
anc
e M
anag
em
en
tV
olu
me
67 N
um
be
r 7 20
18e
me
raldp
ub
lishin
g.c
om
www.emeraldinsight.com/loi/ijppm
Volume 67 Number 7 2018ISSN 1741-0401
Volume 67 Number 7 2018
International Journal of
Productivity and Performance Management
International Journal of
Productivity and Performance Management
The official journal of the World
Confederation of Productivity Science
Quarto trim size: 174mm x 240mm
Number 7
1089 Editorial advisory board
1090 Editorial
1091 Implementation of environmental management practices in the Ghanaian mining and manufacturing supply chainsSamuel Famiyeh and Amoako Kwarteng
1113 The relationship between management characteristics and firm innovationMahdi Salehi, Mahmoud Lari DashtBayaz and Samaneh Mohammadi Moghadam
1132 Improving public sector service delivery: a developing economy experienceEbenezer Adaku, Kwasi Amoako-Gyampah, Seth Nii Anang Lomotey, Charles Teye Amoatey and Samuel Famiyeh
1147 Impact of workplace bullying on employee outcomes: a study of Indian managerial employeesArpana Rai and Upasna Agarwal
1171 Forced distribution systems and attracting top talentStephanie J. Thomason, Amy Brownlee, Amy Beekman Harris and Hemant Rustogi
1192 USA Triathlon: a 2010–2015 case study of financial performance using effectiveness indicators and efficiencyPeter Omondi-Ochieng
1214 Performance measurement and management systems as IT artefacts: characterising, contextualising and valuing their effective use in SMEsMarie Marchand and Louis Raymond
1234 Experimenting lean dynamic performance management systems design in SMEsCarmine Bianchi, Graham Winch and Federico Cosenz