quartz crquartz crystal microbalance with dissipation monitoringystal microbalance with dissipation...
DESCRIPTION
Quartz crystal microbalance with dissipationTRANSCRIPT

7/18/2019 Quartz CrQuartz crystal microbalance with dissipation monitoringystal Microbalance With Dissipation Monitor
http://slidepdf.com/reader/full/quartz-crquartz-crystal-microbalance-with-dissipation-monitoringystal-microbalance 1/11
puorG gnihsilbuP erut
aN 0102©
natureprotocols
/moc.eruta
n.www//:ptth
PROTOCOL
1096 | VOL.5 NO.6 | 2010 | NATURE PROTOCOLS
INTRODUCTIONSupported lipid bilayers (SLBs) are a widely accepted model sys-
tem to mimic the natural cell membrane, the site of many criticalbiomacromolecular interactions1. A lipid bilayer is the backboneof the cell membrane; lipid amphiphilicity shapes the membrane’srole as a protective barrier between intra- and extracellular regions
because lipids self-assemble into a bilayer that regulates what spon-taneously enters and exits the cell1,2. As a model system for studyingmembrane properties and macromolecular interactions, SLBs are
extremely versatile because they can be functionalized by, among
many other possibilities, changing the lipid composition or incor-porating membrane-associated (transmembrane or peripheral)
proteins3. From a basic science perspective, the design of theseplatforms is also important for understanding membrane proper-ties. Researchers are applying knowledge about these properties
(e.g., electrical surface change4,5, ion conductance, lateral fluidity 6 and domain formation7) to engineer novel sensor technology basedon molecular recognition events such as biomacromolecule-sub-
strate-binding interactions3,8–10. By studying biomacromolecularinteractions with a model membrane system, one can also developincreasingly sophisticated biomedical assays for applications such
as drug screening and medical diagnostics3,10–14. Yet another applica-tion of growing interest is functionalized membranes as substratesfor cell culture15.
Surface-mediated vesicle fusion is a popular technique to form
SLBs16. McConnell and co-workers17 were the first group to reportthe fabrication of an SLB by vesicle fusion on a hydrophilic sub-strate; however, they did not determine the kinetic pathway of the
formation process. Fluorescence recovery after photobleachingexperiments have shown that SLBs formed by this method arecontinuous and that constituent lipids have a lateral fluidity not
very different from that of native cell membranes17,18. Atomic forcemicroscopy (AFM) has also been used to monitor bilayer formationat different stages of the process, elucidating critical morphological
information about the self-assembly process19. However, AFM meas-urements, even in noncontact mode, are affected by tip–substrate
interactions and it is quite difficult to measure changes in the thin
film properties of an SLB on short time scales with scanning probetechniques. By comparison, a host of acoustic- and optical-basedsensor techniques, including surface plasmon resonance (SPR)20,21,
ellipsometry 22,23, reflectometry 24,25 and quartz crystal microbalancewith dissipation monitoring (QCM-D)26, can quantitatively moni-tor changes in film thickness and mass without the addition of
external labels. By combining the information gained using thesetechniques, the user can identify interesting events in kinetics,
such as the rate of vesicle binding, point of critical vesicle coveragebefore rupture and completed SLB formation. Among these spec-troscopic techniques, QCM-D uniquely captures the film’s massand energy-dissipating properties, making it particularly useful forprobing changes in viscoelastic properties during film formation.
This measurement capability is especially important for SLB char-acterization, in which the viscoelastic properties of the resultantbilayer and its intermediate state—an incomplete layer of adsorbed,
unruptured vesicles—differ significantly.With regard to SLB formation, QCM-D can monitor the real-
time kinetics of the vesicle fusion process and characterize the
platform’s mass and viscoelastic properties27–34, as described inFigure 1. In addition, the technique can monitor SLB’s interac-tion with other biomacromolecules such as proteins and drugs11,35.
Furthermore, the QCM-D measurement principles enable a widerange of substrate possibilities for SLBs, depending on experimen-tal needs36. In this protocol, we first introduce newcomers to the
methods for forming SLBs of different lipid compositions on twopopular substrates, silicon and titanium oxides. In addition, wediscuss how an amphipathic, α-helical (AH) peptide can be usedto form zwitterionic SLBs on gold and titanium oxide substrates,
allowing researchers to take advantage of these materials’ attractiveproperties. In the absence of AH peptide, zwitterionic lipid vesiclestypically adsorb intact on gold and titanium oxide, resulting in the
formation of a monolayer of unruptured vesicles37,38. This modifiedprotocol gives researchers greater freedom over lipid composition
Quartz crystal microbalance with dissipationmonitoring of supported lipid bilayers onvarious substratesNam-Joon Cho1,2, Curtis W Frank 2, Bengt Kasemo3 & Fredrik Höök 3
1Division of Gastroenterology and Hepatology, Department of Medicine, Stanford University, Stanford, California, USA. 2Department of Chemical Engineering, StanfordUniversity, Stanford, California, USA. 3Department of Applied Physics, Chalmers University of Technology, Gothenburg, Sweden. Correspondence should be addressed toN.-J.C. ([email protected]) or F.H. ([email protected]).
Published online 20 May 2010; doi:10.1038/nprot.2010.65
Supported lipid bilayers (SLBs) mimic biological membranes and are a versatile platform for a wide range of biophysical researchfields including lipid–protein interactions, protein–protein interactions and membrane-based biosensors. The quartz crystalmicrobalance with dissipation monitoring (QCM-D) has had a pivotal role in understanding SLB formation on various substrates.As shown by its real-time kinetic monitoring of SLB formation, QCM-D can probe the dynamics of biomacromolecular interactions.We present a protocol for constructing zwitterionic SLBs supported on silicon oxide and titanium oxide, and discuss technicalissues that need to be considered when working with charged lipid compositions. Furthermore, we explain a recently developedstrategy that uses an amphipathic, α-helical (AH) peptide to form SLBs on gold and titanium oxide substrates. The protocols can be
completed in less than 3 h.
7/18/2019 Quartz CrQuartz crystal microbalance with dissipation monitoringystal Microbalance With Dissipation Monitor
http://slidepdf.com/reader/full/quartz-crquartz-crystal-microbalance-with-dissipation-monitoringystal-microbalance 2/11
puorG gnihsilbuP erut
aN 0102©
natureprotocols
/moc.eruta
n.www//:ptth
PROTOCOL
NATURE PROTOCOLS | VOL.5 NO.6 | 2010 | 1097
and substrate choices, and leads to new applications in a diverse
set of fields including nanoplasmonics39–42
, semiconductor devices43
and medical implant surfaces44. With this new method for formingSLBs on gold surfaces, there is also great potential for the design ofmore sophisticated electrophysiological biosensors3,11,35.
Criteria for experimental materials
Three main factors contribute to vesicle fusion on solid substrates:
membrane tension45, vesicle–substrate and vesicle–vesicle inter-actions37,38. To form complete SLBs with minimal defects in areproducible manner, two of the most important parameters to
be controlled are the membrane tension of the vesicles and vesi-cle lamellarity. It is recommended to work with small unilamellarvesicles (SUVs) with a monodisperse size distribution that has an
average diameter of less than 90 nm; vesicles of such size shouldhave sufficient membrane tension for fusion to be efficient45.Although vesicle fusion depends on additional factors such aslipid composition and surface chemistry, larger vesicles in general
may not have sufficient membrane tension to cause spontaneousvesicle rupture46,47.
There are two popular methods to generate SUVs. The first is
the sonication method (either high-power bath or tip sonication),which uses ultrasonic energy waves to induce fragmentation andcollisions between large multilamellar vesicles. The vesicle struc-
tures are disrupted and the resulting small aggregates rearrangeinto SUVs48–51. The extrusion method is the other technique; vesiclesize distribution is reduced as vesicles are mechanically extruded
through a polycarbonate track-etched membrane with definedpore sizes52. The extrusion technique also forms SUVs if the vesiclesolution is passed through the membrane multiple times (prefer-
ably > 23 times). For a detailed protocol regarding SUV prepara-tion by these methods, refer to references 52,53. Standard buffersthat approximate biological conditions (pH 7–7.5, I = 0.15–0.2 M)
produce excellent results. The data in Figure 2 were obtained witha Tris buffer (10 mM Tris, 150 mM NaCl (pH 7.0)). In addition toreducing size, membrane tension can be increased by creating anosmotic pressure difference between the vesicle interior and the
solution54. Vesicles should, in this case, be prepared preferably inMilli-Q water and then subsequently diluted in buffer before usewithin 30 min.
Preparation of zwitterionic SLBs on a silicon oxide substrate
The QCM-D technique was first used to study vesicle interactions
with solid substrates by Keller and Kasemo37. They showed that ves-icles can interact with solid substrates by either adsorbing irrevers-ibly while remaining intact or forming a supported lipid monolayer
or bilayer37, depending on the substrate’s properties. On the basisof this original work, along with more recent studies3,11,26,35,37,38,55,56,it has been shown that vesicles have an attractive interaction withsilicon oxide37, silicon nitride57, titanium oxide58, oxidized Pt59, oxi-
dized Au37 and alkanethiol37 and phosphate/sulfate-thiol-modified60 Au substrates, although the outcome of the interaction (adsorbedintact vesicles, continuous SLB or a mixture of these two) depends
on bulk properties60, lipid composition61–64 and the substrate’sphysical65 and chemical properties37.
Because of QCM-D’s ability to monitor in real time themass and viscoelastic property changes related to vesicle–substrateinteractions, the technique has revealed that vesicle fusion onsolid substrates follows a general two-step mechanism37, at least
in the case of zwitterionic lipid vesicles. QCM-D studies haverevealed that the detailed vesicle fusion kinetics depend on fac-tors including osmolality, temperature, flow rate, vesicle con-
centration, vesicle lipid composition and the substrate’s surfacechemistry 58,66,67.
On the basis of the classical two-step spontaneous SLB forma-
tion mechanism on a silicon oxide substrate, vesicles first adsorbirreversibly to the substrate. By themselves, vesicle–substrateinteractions are generally insufficient to promote individual vesi-
cle rupture37,38
. Therefore, a critical coverage of adsorbed vesiclesmust be reached before vesicle fusion begins (Fig. 2). At this con-centration, the combination of vesicle–vesicle and vesicle–sub-strate interactions promotes vesicle fusion, most likely through
local vesicle rupture into SLB patches, the edges of which promotean autocatalytic SLB formation process26. These steps have servedas the basis for Monte Carlo simulations that sought to better
understand the kinetic pathway of vesicle adsorption, ruptureand fusion68–70. As indicated in Figure 2, frequency (∆ f ) and dis-sipation (∆D) changes are maximized at the critical vesicle cover-
age. Intact vesicle adsorption results in a viscoelastic film (largedissipation increase) because of a combination of the nonrigidnature of the vesicles and solvent coupled within and between
∆f ~ ∆m ∆D ~ stiffness
A
Time (µs)
Intact vesicle platform
a
b c
Lipid bilayer platform
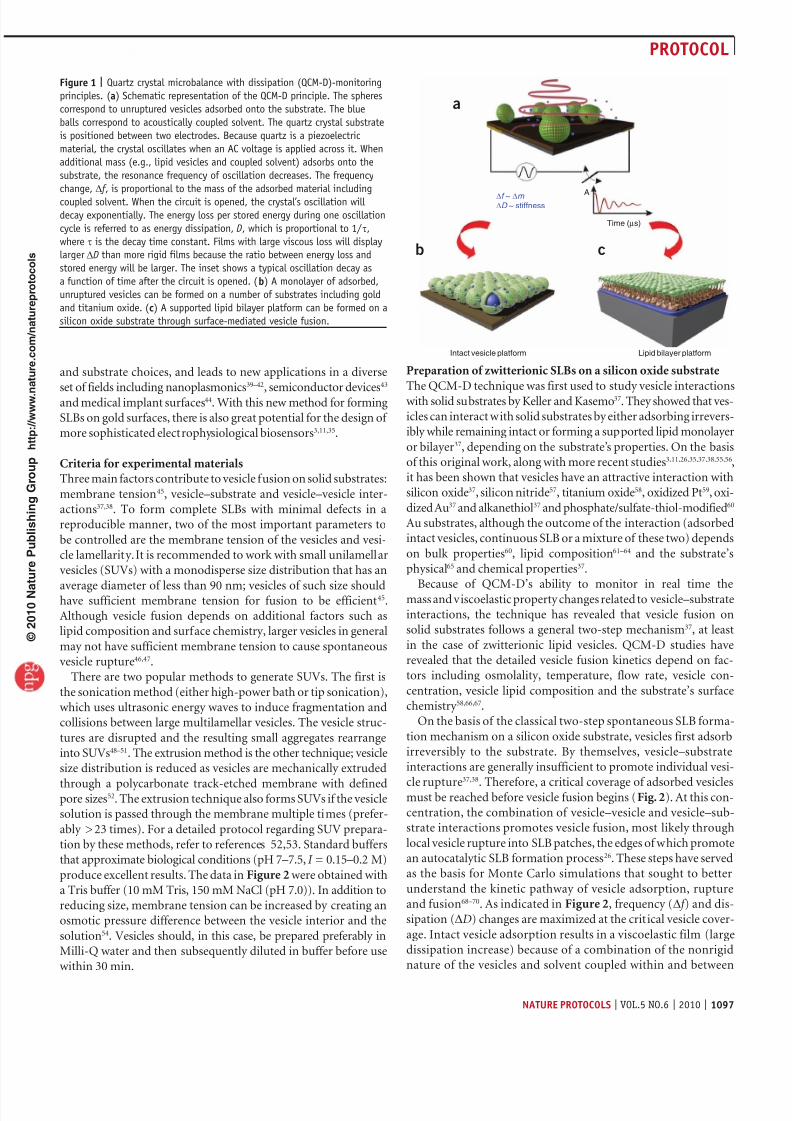
Figure 1 | Quartz crystal microbalance with dissipation (QCM-D)-monitoring
principles. (a) Schematic representation of the QCM-D principle. The spheres
correspond to unruptured vesicles adsorbed onto the substrate. The blue
balls correspond to acoustically coupled solvent. The quartz crystal substrate
is positioned between two electrodes. Because quartz is a piezoelectric
material, the crystal oscillates when an AC voltage is applied across it. When
additional mass (e.g., lipid vesicles and coupled solvent) adsorbs onto the
substrate, the resonance frequency of oscillation decreases. The frequency
change, ∆ f , is proportional to the mass of the adsorbed material including
coupled solvent. When the circuit is opened, the crystal’s oscillation will
decay exponentially. The energy loss per stored energy during one oscillation
cycle is referred to as energy dissipation, D, which is proportional to 1/ τ,
where τ is the decay time constant. Films with large viscous loss will display
larger ∆D than more rigid films because the ratio between energy loss and
stored energy will be larger. The inset shows a typical oscillation decay as
a function of time after the circuit is opened. (b) A monolayer of adsorbed,
unruptured vesicles can be formed on a number of substrates including gold
and titanium oxide. (c) A supported lipid bilayer platform can be formed on a
silicon oxide substrate through surface-mediated vesicle fusion.
7/18/2019 Quartz CrQuartz crystal microbalance with dissipation monitoringystal Microbalance With Dissipation Monitor
http://slidepdf.com/reader/full/quartz-crquartz-crystal-microbalance-with-dissipation-monitoringystal-microbalance 3/11
puorG gnihsilbuP erut
aN 0102©
natureprotocols
/moc.eruta
n.www//:ptth
PROTOCOL
1098 | VOL.5 NO.6 | 2010 | NATURE PROTOCOLS
the vesicles. The negative frequency shift indicates the additionof mass, which decreases the crystal’s resonance frequency ofoscillation. Initial vesicle rupture creates patches of bilayer with
hydrophobic edges, which propagate continued vesicle ruptureuntil the lipid bilayer is complete and the edges are minimized.After bilayer formation, the dissipation value returns to nearly
zero, which indicates that the bilayer is ‘rigid’ (compared with‘soft’ vesicles) and has a low amount of bound solvent, and thefrequency shift is reduced because of a loss of solvent trapped
inside vesicles, in spite of the fact that there is a net addition oflipid mass also after the maximum frequency and dissipationshift37. The net addition of lipid mass after the peaks in ∆ f and ∆D was verified by simultaneously combining QCM-D with SPR21
and optical reflectometry 25.Furthermore, the frequency and dissipation response kinetics can
be modeled to better understand the property changes of the film,
giving an insight into structural transformation. Bilayer thickness(~5.0 nm) can be determined from the change in frequency usingthe Sauerbrey relationship:
∆ ∆
m C f
n= −
QCM
n
where ∆m is the adsorbed mass on the surface, C QCM
is the masssensitivity constant (17.7 ng cm − 2 Hz − 1 at f = 5 MHz) and ∆f
n
is the change in the resonance frequency at the nth harmonic.However, the Sauerbrey relationship is only valid for acousti-cally rigid films (e.g., SLBs) with low dissipation71. Therefore, it
is important to use a viscoelastic model such as the Voigt-Voinovamodel to quantify the changes in mass and effective viscoelasticproperties of the film during the transformation process from
adsorbed vesicles to an SLB72. At the critical vesicle coverage in
Figure 2, the measured responses are characterized by a largedissipation (∆D/∆ f > 1 × 10 − 8 Hz − 1), and both the frequency
and dissipation responses display overtone dependencies that arecharacteristic of acoustically nonrigid films. A viscoelastic modelextends QCM-D responses to include the effective viscoelastic
properties that cause this overtone dependence. By using sucha model, the changes in film thickness, effective shear viscosityand elasticity throughout the entire vesicle-to-bilayer transfor-mation process can be determined. It is important to emphasize,
however, that the physical origin of the energy dissipation foradsorbed vesicles most likely stems from a combination of thevesicles’ intrinsic properties and the nature of their attachment
to the surface73.
(1)(1)
Variations of charged DOPC/DOPS and DOPC/DOEPC SLBs
on a silicon oxide substrate
Overall, the formation of charged SLBs follows the same self-assem-bly process as zwitterionic SLBs63,64. However, it is important to notethat vesicle–substrate interactions can vary significantly and may
require a fine-tuning of the protocol. When working with vesicles
composed of 1,2-dioleoyl-sn-glycero-3-phosphocholine (DOPC)and 1,2-dioleoyl-sn-glycero-3-[phospho-L-serine] (DOPS) lipid
mixtures, there are repulsive interactions between negativelycharged vesicles (DOPS has a negatively charged head group) andthe negatively charged silicon oxide substrate22 (Fig. 3a–c). This
results in a higher critical vesicle coverage before the start of vesiclerupture. To improve the conditions to favor vesicle rupture andSLB formation, one may include calcium in all buffers after theextrusion process when working with negatively charged vesicles74.
Recent studies have shown that magnesium ions display a similar,and even stronger, promotion of bilayer formation54. Divalent cati-ons trigger bilayer formation by bridging the interaction between
the phosphatidylserine lipid head groups and the negatively charged
substrate74. Instead of using a divalent cation to stabilize the other-wise repulsive vesicle–substrate interactions, the negatively charged
SLBs in Figure 3 were formed by using a Tris buffer with 250 mMNaCl instead of 150 mM NaCl. This increase in osmotic pressurewas sufficient to form complete, negatively charged SLBs without
the addition of a divalent cation (Fig. 3a–c)64. With regard to theformation of charged SLBs as a function of salt concentration, wehave conducted these studies previously and have noted that an
increase in osmotic pressure leads to faster SLB formation kinetics.Therefore, when working with negatively charged vesicles, we rec-ommend a higher osmotic pressure gradient to counter the effects
of more repulsive electrostatic interactions between vesicles and thesubstrate as one method presented in this protocol.
When working with DOPC/1,2-dioleoyl-sn-glycero-3-ethylphos-phocholine (DOEPC) vesicles (Fig. 3d–f ), SLB formation kinetics
will have only one step (i.e., spontaneous fusion occurring imme-diately after vesicle adsorption)19. This is due to an attractive elec-trostatic attraction between the positively charged vesicles (DOEPC
has a positively charged head group) and the negatively chargedsubstrate, which makes vesicle–substrate interactions sufficientby themselves to cause vesicle rupture. Thus, a critical coverage
of adsorbed vesicles on the substrate is not necessary to inducespontaneous vesicle rupture. The electrostatics favor individualvesicle rupture. In this case, there is no frequency minimum and
only a very minor dissipation maximum before SLB formation.It is important to note that the final resonance frequency change
0
StableInjectvesicle Buffer wash
∆f n = 3 /3
∆D n = 3
∆f n = 5 /5
∆D n = 5
∆f n = 7 /7
∆D n = 7
–10
5
4 ∆ E n er g y d i s s i p a t i on
( 1 0
– 6
)
3
2
1
0
–1
–20
–30
–40
–50
–600 3 6 9
Time (min)
∆
F r e q u e n c y ( H z )
12
Critical concentration
SiOx
15 18
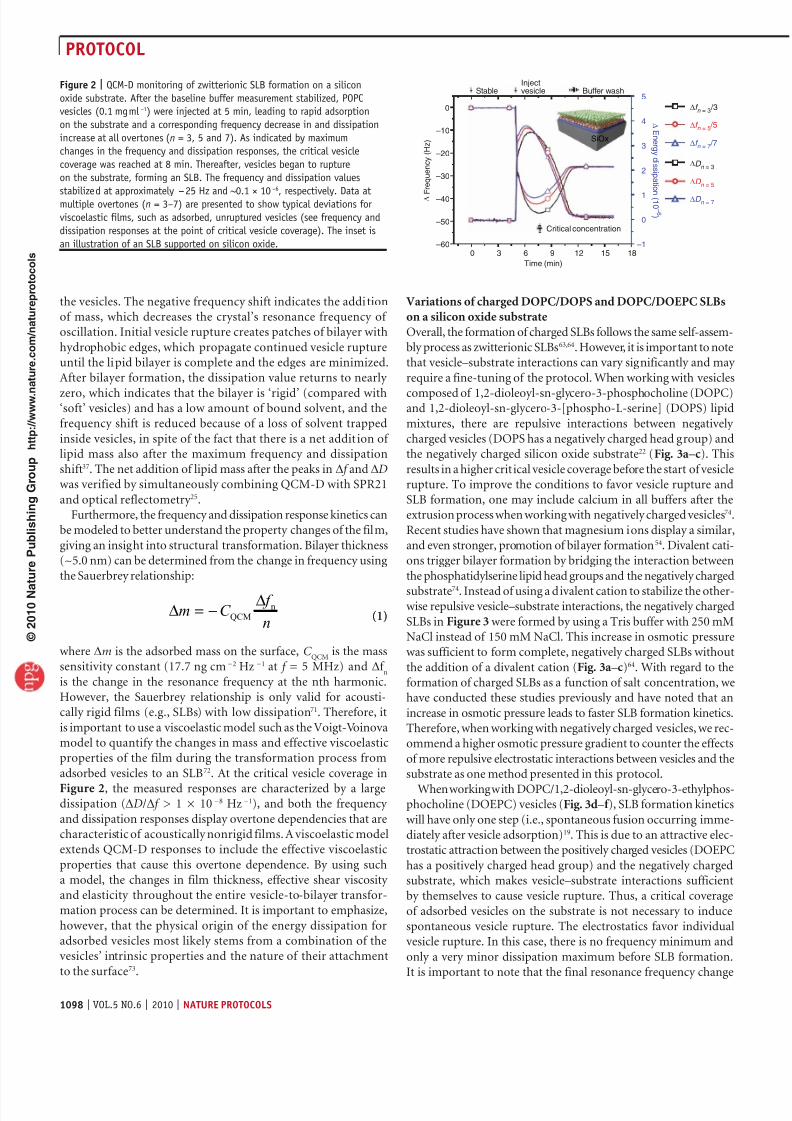
Figure 2 | QCM-D monitoring of zwitterionic SLB formation on a silicon
oxide substrate. After the baseline buffer measurement stabilized, POPC
vesicles (0.1 mg ml − 1) were injected at 5 min, leading to rapid adsorption
on the substrate and a corresponding frequency decrease in and dissipation
increase at all overtones (n = 3, 5 and 7). As indicated by maximum
changes in the frequency and dissipation responses, the critical vesicle
coverage was reached at 8 min. Thereafter, vesicles began to rupture
on the substrate, forming an SLB. The frequency and dissipation values
stabilized at approximately − 25 Hz and ~0.1 × 10
− 6
, respectively. Data atmultiple overtones (n = 3–7) are presented to show typical deviations for
viscoelastic films, such as adsorbed, unruptured vesicles (see frequency and
dissipation responses at the point of critical vesicle coverage). The inset is
an illustration of an SLB supported on silicon oxide.

7/18/2019 Quartz CrQuartz crystal microbalance with dissipation monitoringystal Microbalance With Dissipation Monitor
http://slidepdf.com/reader/full/quartz-crquartz-crystal-microbalance-with-dissipation-monitoringystal-microbalance 4/11
puorG gnihsilbuP erut
aN 0102©
natureprotocols
/moc.eruta
n.www//:ptth
PROTOCOL
NATURE PROTOCOLS | VOL.5 NO.6 | 2010 | 1099
for a DOPC/DOEPC SLB can be lower thanthe value discussed above. A frequencyshift of − 24.0 ± 1.0 Hz, rather than − 25.0 ±
1.0 Hz, is a better estimate of the final valuefor a complete, positively charged SLB, likely due to a differencein lipid–substrate interactions. We believe that the frequency shift
difference is due to a reduced water layer between SLB and the solid
support. Both of our research groups have routinely noticed thisvalue and it is well documented in literature. On the basis of our
preliminary studies to better understand this value, we believe thatthe thinner water layer between the SLB and the solid support iscaused by stronger electrostatic interactions between the positively
charged SLB and the negatively charged solid support.
Preparation of negatively charged SLBs on a titanium oxide
substrate by divalent calcium cation
Titanium oxide has a number of attractive properties such as bio-compatibility and a high refractive index that make it suitable formedical implant75 and analysis using optical waveguide lightmode
spectroscopy 76, which offers a high measurement sensitivity to
film birefringence77
. However, the formation of SLBs on titaniumoxide is not as straightforward as on silicon oxide. Rossetti et al.61,62
reported that the divalent calcium cation can promote the spon-taneous SLB formation of phosphatidylserine-containing vesicles.They concluded that the calcium-mediated short-range attrac-
tion between vesicles and the substrate may result from the cationbridging the charged groups, as in the case described above forforming negatively charged SLBs on silicon oxide. A related finding
was also reported by Richter et al.78 who discussed the influence of
lipid redistribution on the vesicle fusion process. Using calcium tostabilize vesicle–substrate interactions, we show in Figure 4 of thisprotocol the formation of a negatively charged SLB containing a
mixture of POPC and a pyrophosphate lipid, which has a double-negatively charged head group. In the absence (Fig. 4a) or presence(Fig. 4b) of calcium, vesicles either adsorb and remain intact, or
eventually rupture to form an SLB, respectively. This protocol issuitable for forming negatively charged SLBs that contain differentanionic lipids on titanium oxide. Although negatively charged lipids
may be preferentially oriented toward the substrate, it is importantto point out that calcium in combination with negatively chargedlipids is required to form SLBs on titanium oxide; this procedure
is not suitable for forming single-component zwitterionic SLBson titanium oxide.
Preparation of zwitterionic SLBs on gold and titanium oxide
substrates by an amphipathic, AH peptideSupported lipid bilayer formation requires the substrate to havespecific properties, particularly, hydrophilicity and surface charge
density, which help promote vesicle deformation and subsequentrupture into a continuous SLB37. Despite not possessing favorablesurface properties for vesicle fusion, titanium oxide and gold are two
attractive substrate candidates because of their respective biocom-patibility 55 and electrical properties79. The electrical properties ofgold are especially advantageous as they can be used to take advantage
of the SLB’s insulating properties for ion conductance–based sensormeasurements43. To overcome these surface-dependent constraints,a new method was recently developed to form a zwitterionic lipid
bilayer on these substrates. In this method, an amphipathic, AH
peptide is used as a vesicle-destabilizing agent. This process resultsin the formation of continuous SLBs on gold and titanium oxide
surfaces11,35.As presented in Figure 5, vesicles first adsorb irreversibly to the
substrate while remaining unruptured (Fig. 5a). When an AH pep-
tide derived from a hepatitis C virus protein10 is added, it destabi-lizes the vesicle structures by a presumed electrostatic interaction.The vesicles then expand and eventually rupture, forming an SLBwith final frequency and dissipation response values of 25 ± 0.5 Hz
and < 0.1 × 10 − 6, respectively (Fig. 5b). We define this structuraltransformation as AH peptide-induced vesicle fusion, as the maindriving force for vesicle rupture and subsequent SLB formation is
the vesicle interaction with AH peptide26.
05
4
∆ E n er g y
d i s s i p a t i on
( 1 0
– 6
)
∆D n = 3
∆F n = 3 /3
∆D n = 3
∆F n = 3 /3
∆D n = 3
∆F n = 3 /3
∆D n = 3
∆F n = 3 /3
3
2
1
0
–1
5
4
∆ E n er g y
d i s s i p a t i on
( 1 0
– 6
)
3
2
1
0
–1
5
4
∆ E n er g y
d i s s i p a t i on
( 1 0
– 6
)
3
2
1
0
–1
5
4
∆ E n er g y d i s s i p a t i on
( 1 0
– 6
)
3
2
1
0
–1
5
4
∆ E n er g y d i s s i p a t i on
( 1 0
– 6
)
3
2
1
0
–1
5
4
∆ E n er g y d i s s i p a t i on
( 1 0
– 6
)
3
2
1
0
–1
7:3 DOPC:DOPSa c
d e f9:1 DOPC:DOEPC 8:2 DOPC:DOEPC 7:3 DOPC:DOEPC
8:2 DOPC:DOPS 9:1 DOPC:DOPS
0 5 10
Time (min)
15 20
0 5 10
Time (min)
15 20 0 5 10
Time (min)
15 20 0 5 10
Time (min)
15 20
0 5 10
Time (min)
15 20 0 5 10
Time (min)
15 20
–10
–20
∆ F
r e q u e n c y ( H z )
–30
–40
–50
0
–10
–20
∆ F
r e q u e n c y ( H z )
–30
–40
–50
0
–10
–20
∆ F
r e q u e n c y ( H z )
–30
–40
–50
0
–10
–20
∆ F
r e q u e n c y ( H z )
–30
–40
–50
0
–10
–20
∆ F
r e q u e n c y ( H z )
–30
–40
–50
0
–10
–20
∆ F
r e q u e n c y ( H z )
–30
–40
–50
∆D n = 3
∆F n = 3 /3
∆D n = 3
∆F n = 3 /3
Figure 3 | QCM-D monitoring of charged SLB
formation on a silicon oxide substrate. (a–f ) After
the buffer measurement stabilized, the respective
vesicle solutions (0.1 mg ml − 1), 7:3 DOPC:DOPS
(a), 8:2 DOPC:DOPS (b), 9:1 DOPC:DOPS (c),9:1 DOPC:DOEPC (d), 8:2 DOPC:DOEPC (e), and
7:3 DOPC:DOEPC (f ), were injected at 5 min. After
SLB formation, a buffer wash was performed.
All final frequency and dissipation values were
in the range of − 25 ± 1 Hz and < 0.15 × 10 − 6,
respectively. All data presented were measured at
the third overtone.
30 5
43
2
1
0
–1
20
10
0
∆ E n
er g y
d i s s i p a t i on
( 1 0
– 6
)
∆ E n
er g y
d i s s i p a t i on
( 1 0
– 6
)
POPC:DGPP : 70:30 POPC:DGPP : 70:30
0 10
Time (min)
Without Ca2+With Ca2+
Time (min)
20 30 0 3 6 9 12 15 18
0
–50
–100
–150
–200
–250
–300
∆ F
r e q u e n c y ( H z )
∆D n = 3
∆f n = 3 /3
∆D n = 3
∆f n = 3 /3
0
–10
–20
∆ F
r e q u e n c y ( H z )
–30
–40
–50
–60
a b
Figure 4 | QCM-D monitoring of negatively charged SLB formation on a
titanium oxide substrate induced by divalent calcium cation. After
the baseline buffer measurement stabilized, the vesicle solution
(0.1 mg ml − 1) was injected at 10 min. (a) In the absence of calcium,
vesicles only adsorbed onto the substrate but did not rupture to form
an SLB. (b) In contrast, the addition of calcium stabilized the vesicle–
substrate interactions, resulting in SLB formation.

7/18/2019 Quartz CrQuartz crystal microbalance with dissipation monitoringystal Microbalance With Dissipation Monitor
http://slidepdf.com/reader/full/quartz-crquartz-crystal-microbalance-with-dissipation-monitoringystal-microbalance 5/11
puorG gnihsilbuP erut
aN 0102©
natureprotocols
/moc.eruta
n.www//:ptth
PROTOCOL
1100 | VOL.5 NO.6 | 2010 | NATURE PROTOCOLS
By using a viscoelastic model such as the Voigt-Voinova model,we can better understand the structural transformation (Fig. 5c) interms of changes in film thickness and effective viscoelastic proper-
ties35. The resulting thicknesses of the bilayer calculated using boththe Sauerbrey and Voigt-Voinova models are in good agreement aslong as ∆D/∆ f < 1 × 10 − 8 Hz − 1. This indicates that the structural
transformation from unruptured vesicles to continuous SLB thatis induced by the AH peptide results in an acoustically rigid lipidbilayer35. Although the mechanism of SLB formation differs onsilicon oxide compared with gold and titanium oxide, the end result
is equivalent: a zwitterionic SLB with identical mass and viscoelasticproperties. We have confirmed that AH peptide does not contributeadditional mass to the supported bilayer11,24,26,54,73, and the result is
a complete SLB with minimal defects.To better analyze biomacromolecular interactions at solid
interfaces, QCM-D can be combined with other advanced micro-
scopy and spectroscopy techniques such as AFM19,74, fluorescencemicroscopy 80, fluorescence recovery after photobleaching81, SPR 21,ellipsometry 23, electrical impedance spectroscopy 82 and optical
reflectometry 77
. As the QCM-D measurement principle is acousticbased, it measures total adsorbed mass including coupled solvent.In contrast, optical-based techniques such as SPR, ellipsometry
and optical reflectometry only measure responses that, to a firstapproximation, are proportional to the mass change associatedwith adsorbed, nonsolvent molecules. By combining QCM-D withthese optical techniques, the coupled solvent mass can be calculated
to better understand how a hydrodynamically coupled solvent isrelated to structural transformations24.
An overview of the procedure
In this protocol, we have described a number of suitable proto-cols, along with tips and tricks to form complete SLBs of various
charged lipid compositions on silicon oxide, titanium oxide andgold, all of which are compatible with many surface-based tech-niques, including QCM-D monitoring. Although the parameters
we provide are excellent for SLB formation, every research grouphas a different reason for using an SLB platform and this mayrequire the use of different materials or conditions. On the basis
of the initial QCM-D response in buffer, a complete SLB forma-tion should in general correspond to a frequency change of − 24 ±1.5 Hz and a dissipation change of less than 0.2 × 10 − 6. Note that
these frequency and dissipation changes are only valid when usingthe same buffer. For example, if one records the initial measurementin Tris/NaCl no. 1 buffer and then analyzes the QCM-D response
to SLB formation in Tris/NaCl no. 2 buffer, the frequency and dis-
sipation changes will not agree with the values listed above. Thisis because of changes in solution viscosity, which influences theQCM-D response. Thus, it is important to analyze the QCM-D
response in the same buffer as the initial measurement. In additionto single-component, zwitterionic SLBs on silicon oxide, we stressthat negatively charged SLBs can be formed on titanium oxide by
the addition of divalent ions such as calcium. Furthermore, wedescribe an additional protocol that uses an AH peptide to desta-bilize adsorbed, unruptured vesicles, resulting in the formation
of a zwitterionic SLB on both gold and titanium oxide substrates.The latter protocol also holds great promise for the formation ofplanar SLBs from biological membrane extracts, which would fur-
ther extend the applicability of such membrane platforms to newdisciplines. It is noteworthy that, although the incorporation offunctional transmembrane proteins has been difficult, it is stillone possibility to functionalize SLBs. Our key point is that SLBs
can be functionalized with membrane-associated proteins and itis up to the user to design a more complex biomimetic platformthat fits their specific interests. In this protocol, we are interested
in presenting one basic platform—a model membrane composedof phospholipids on various substrates—for researchers to takeadvantage of.
Note that the data shown for these protocols have been obtainedwith a Q-Sense E4 series (Q-Sense AB, Sweden) instrument, whichis equipped with a pump flow control system. However, the pro-
tocols are compatible with other systems using batch-mode meas-urements, such as the Q-Sense D300 series (Q-Sense AB), andalternative surface-sensitive methods (see above)83.
0
–40
0
–30
–60
–90
–120
–150
20
15
E n er g y d i s s i p a t i on
( 1 0
– 6
)
E n er g y d i s s i p a t i on
( 1 0
– 6
)
10
5
0
20
15
10
5
0
–80
–120
0 10
0 25 50 75 100 125 150
20 30
Time (min)
Time (min)
Intact vesicle
Structuraltransformation
Intact vesicle
StableInjectvesicle
SLB Buffer wash
Buffer wash
40 50 60
∆ F
r e q u e n c y ( H z )
∆ F
r e q u e n c y ( H z )
–160
SLB
a
b
c
Figure 5 | QCM-D monitoring of AH peptide-mediated structural
transformation from intact vesicles to an SLB on a gold substrate. ( a) After
the baseline buffer measurement was stabilized, POPC vesicles (0.1 mg ml − 1)
were injected at 5 min. The vesicles adsorbed onto the substrate and formed
a layer of unruptured vesicles. After the formation of a layer of unruptured
vesicles, a buffer wash was performed. The final frequency and dissipation
values were − 120 Hz and 8 × 10 − 6, respectively. (b) After forming the layer
of vesicles as given in a, an AH peptide solution (13 µM) was added.
The AH peptides caused vesicle swelling and subsequent rupture, leading
to SLB formation. The SLB had final frequency and dissipation values of
− 25.5 Hz and 0.08 × 10 − 6, respectively. (c) A schematic representation of
the AH peptide-mediated structural transformation from adsorbed, intact
vesicles to an SLB.
7/18/2019 Quartz CrQuartz crystal microbalance with dissipation monitoringystal Microbalance With Dissipation Monitor
http://slidepdf.com/reader/full/quartz-crquartz-crystal-microbalance-with-dissipation-monitoringystal-microbalance 6/11
puorG gnihsilbuP erut
aN 0102©
natureprotocols
/moc.eruta
n.www//:ptth
PROTOCOL
NATURE PROTOCOLS | VOL.5 NO.6 | 2010 | 1101
MATERIALSREAGENTS
Milli-Q water ( > 18 MΩ cm)1-palmitoyl-2-oleoyl-sn-glycero-3-phosphocholine (POPC), 1,2-dioleoyl-sn-glycero-3-phosphocholine (DOPC), 1,2-dioleoyl-sn-glycero-3-[phospho-l-serine] (DOPS), dioleoylglycerol pyrophosphate (DGPP) and1,2-dioleoyl-sn-glycero-3-ethylphosphocholine (DOEPC) lipids(Avanti Polar Lipids) ! CAUTION The protocol is based on a vesicle solution
with a lipid concentration of ~0.1 mg ml − 1
. It is recommended to initiallyprepare vesicle solution at a higher concentration of 1–5 mg ml − 1 withease and then subsequently dilute with buffer before the experiment.However, the extrusion process for sizing vesicle populations does not ingeneral work as well for vesicle solutions at lipid concentrations greaterthan 10 mg ml − 1.200 proof ethanolAnalytical grade Tris buffer, NaCl, CaCl
2 and sodium dodecyl sulfate (SDS)
EQUIPMENTPlasma Prep 5 Plasma Cleaner (GaLa Instrumente GmbH)Quartz Crystal Microbalance with Dissipation Monitoring (QCM-D) D300,E1 or E4 system (Q-Sense AB)Reglo Digital M2-2/12 Peristaltic Pump (Ismatec) [only for QCM E seriesmodels]QCM crystals with silicon oxide, titanium oxide and gold coatings(Q-Sense AB)
Syringe filters (0.2 µm, Nalgene)
REAGENT SETUP
Solutions Prepare the following aqueous solutions for SLB formation:
Tris/NaCl no. 1 (10 mM Tris, 150 mM NaCl (pH 7.0)), Tris/NaCl no. 2 (10 mM
Tris, 250 mM NaCl (pH 7.0)) and Tris/NaCl no. 3 (10 mM Tris, 150 mM NaCl,
5 mM CaCl2 (pH 7.0)). Filter all Tris buffers with a 0.2-µm membrane before
use. For cleaning the QCM-D system, prepare a 0.1-M SDS solution.
••
••
••
•
•
•
EQUIPMENT SETUP
Quartz crystals Rinse crystals thoroughly with water and ethanol and then
dry with nitrogen air. Remove any organic contaminants from the substrate
by plasma cleaning (with substrate facing up) at 75 W for 3 min. Use crys-
tals immediately after plasma cleaning for best results. We used a house-built
UV/ozone system with specific wavelengths of 185 and 254 nm. After plasma
cleaning, the typical contact angle of the substrates should be as follows:
SiO2 ≤ 10°, TiO2 ≤ 20° and Au ≤ 35°.QCM-D E1 or E4 flow cells and tubing Clean the system while all of the
tubing is connected and quartz crystals are in the flow cells. Rinse the system
with a 0.1 M SDS solution, water and finally with ethanol at a high flow rate
of 1 ml min − 1. Continue rinsing for at least 10 min per liquid. After rinsing
with the liquids, dry the tubing and flow cells by turning the pump on, with-
out solvent, at the same flow rate for 2 min. Do not dry completely because
crystals will become firmly attached to the rubber O-rings and can possibly
crack when being removed. After cleaning, detach the setup (tubing and flow
cells) and dry each flow cell with a gentle stream of nitrogen air.
QCM-D D300 axial flow chamber Alternatively, the QCM-D D300 instru-
ment can be used. The only difference between the D300 and E series is flow
control. The D300 is a batch system, whereas the E series involves continu-
ous flow. For cleaning, ensure that a crystal is mounted in the measurement
chamber to prevent electrical damage. First, turn the control valve to the
‘loop out’ position and flow at least 10 ml of the 0.1 M SDS solution throughthe reservoir chamber. Thereafter, close the valve and allow the SDS solution
to soak for at least 10 min. Repeat with water and then ethanol. Next, turn
the valve to the ‘sensor out’ position and repeat the cleaning procedure in
order to clean the measurement chamber in the same manner. After washing,
disconnect the D-300 setup and remove the crystal. Dry all tubing with a
gentle stream of nitrogen air.
PROCEDURE1| Immediately mount the quartz crystal in the flow cell after plasma cleaning and attach the cell module to electrical
contacts. CRITICAL STEP During the crystal mounting process, ensure that the crystal is dry. Moreover, place the crystal in a dryenvironment before use to prevent any humidity effects. Any wetness on either electrode will affect the initial frequency anddissipation measurements.
2| Run the QSoft program and activate temperature control at the desired temperature (24 °C) to minimize the thermaldrift that will affect measurement values. For the D-300, adjust the setpoint temperature to about 1 °C above the ambienttemperature.
3| Obtain the crystal’s resonance frequency and dissipation values in air at several overtones. Typical resonant frequency
and dissipation values are summarized in Table 1 (ref. 65). In addition, we summarized the second signature, S2, values
(S2 = ∆ f / N ∆D) that can be used as an initial check to verify proper crystal mounting and instrument performance. The ratio
of the frequency change divided by the product of the harmonic number and the dissipation change defines S2. For more
information, please refer to reference 54. CRITICAL STEP Ensure that resonance frequencies as shown in Table 1 for typical values are checked. Each harmonic’sresonance frequency should be in multiples of 5 MHz, such that 5 MHz corresponds to the fundamental frequency, 15 MHz forthe third overtone and so on. Note that there is a slight deviation of S
2 for the fundamental resonance frequency.
4| Start the peristaltic pump and flow Tris/NaCl no. 1 buffer into the system at a flow rate of 250 µl min − 1. For the D-300,
turn the control valve to the ‘loop out’ position and allow ~1.5 ml of buffer liquid to flow through the system. Thereafter,change the knob to the ‘sensor out’ position and allow the buffer to enter the measurement chamber. After fully exchangingsolutions (minimum of 1 ml), turn the valve to the ‘close’ position. CRITICAL STEP The typical values of ∆ f and ∆D in both air and solution are summarized in Table 1. Given the deviationsbetween these values, it is essential to prevent air bubbles from entering the measurement chamber for the successfulcompletion of the experiment. If there are air bubbles in the D-300’s reservoir, rinse thoroughly with more liquid (first turn
7/18/2019 Quartz CrQuartz crystal microbalance with dissipation monitoringystal Microbalance With Dissipation Monitor
http://slidepdf.com/reader/full/quartz-crquartz-crystal-microbalance-with-dissipation-monitoringystal-microbalance 7/11
puorG gnihsilbuP erut
aN 0102©
natureprotocols
/moc.eruta
n.www//:ptth
PROTOCOL
1102 | VOL.5 NO.6 | 2010 | NATURE PROTOCOLS
the control valve to the ‘loop out’ position and gently tap the inlet tubing and reservoir with a finger) until the bubbles passthrough and exit the reservoir chamber. Note that the values in solution can vary slightly depending on the solution’s ionic
strength.
5| Check the resonant frequency and dissipation values in liquid.
CRITICAL STEP There are many different causes for error when measuring f and D values. If the resonance frequency and
dissipation values are off by more than 20%, check for tube leakages, air bubbles, large substrate defects (e.g., cracks), pres-sure changes (e.g., uneven mounting), backside reactions and O-ring swelling (e.g., reaction with organic solvent).
6| Start the measurement and allow the buffer to flow for 10 min. Once the frequency and dissipation values stabilize, stopthe pump. For D-300, exchange buffers in the measurement chamber at least twice. Allow the values to stabilize until thechange in frequency is less than 1 Hz in 10 min and the change in dissipation is less than 0.2 × 10 − 6 in 10 min. Note thattypical stabilization time periods with proper operation and cleaning should be around 10 min for the E series systems and30 min for D-300.
CRITICAL STEP Although it requires additional time, there are several reasons to flow an excess amount of buffer throughthe measurement chamber, which include getting rid of entrapped air bubbles in the measurement chamber and tubing,
cleaning the tubing and allowing the ion concentration to stabilize on the measurement surface. In addition, any tubingleaks can be identified before the main part of the experiment.
7| After stabilization, restart the measurement and stabilize the signal for at least another 5 min.
8| For formation of zwitterionic and charged SLBs on a silicon oxide substrate (timing, ~1 h), follow the steps in option A.For the formation of negatively charged SLBs on titanium oxide substrate (timing, ~1 h), follow the steps in option B. Forthe formation of zwitterionic SLBs on gold substrate induced by AH peptide (timing, ~3 h), follow the steps in option C.
(A) Formation of zwitterionic and charged SLBs on a silicon oxide substrate TIMING ~1 h (i) Once all the values have stabilized, add ~0.1 mg ml − 1 vesicle solution (diluted in Tris/NaCl no. buffer) at a flow rate
between 100 and 250 µl min − 1. A slower flow rate and lower vesicle concentration will show two-step kinetics for SLB
formation.! CAUTION A higher flow rate and higher vesicle concentration ( > 0.5 mg ml − 1) may cause the process to occur withone-step kinetics.
(ii) For the D-300, vesicle injection refers to an exchange of the solution in the measurement chamber. Ensure that enoughvolume (1 ml) is passed through the measurement chamber so that a complete exchange takes place.
(iii) Continue flowing the vesicle solution into the measurement chamber for at least 5 min to ensure that the bilayer is
defect free. Thereafter, wash the bilayer with Tris/NaCl no. 1 buffer at a flow rate of 100 µl min − 1 for 5 min. CRITICAL STEP Flow the buffer continuously to check the integrity of the bilayer and wash out adsorbed vesicleson top of the substrate. If the change in frequency value increases above − 23 Hz, repeat Step 8 and add additionalvesicle solution to reduce potential SLB defects.
(iv) Wash the bilayer with Tris/NaCl no. 2 buffer at a flow rate of 100 µl min − 1 for 5 min. The change in osmotic pressurewill increase the likelihood of rupturing any adsorbed, intact vesicles.
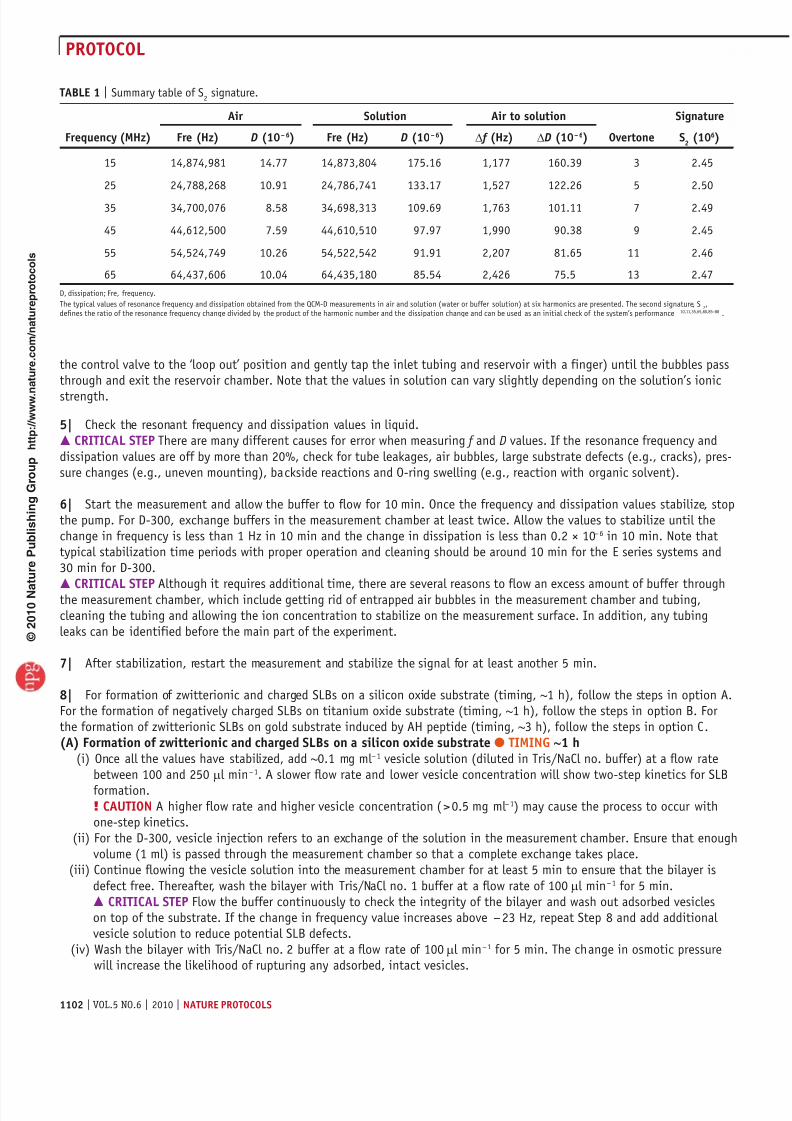
TABLE 1 | Summary table of S2 signature.
Air Solution Air to solution Signature
Frequency (MHz) Fre (Hz) D (10 − 6) Fre (Hz) D (10 − 6) ∆ f (Hz) ∆D (10 − 6) Overtone S2 (106)
15 14,874,981 14.77 14,873,804 175.16 1,177 160.39 3 2.45
25 24,788,268 10.91 24,786,741 133.17 1,527 122.26 5 2.50
35 34,700,076 8.58 34,698,313 109.69 1,763 101.11 7 2.49
45 44,612,500 7.59 44,610,510 97.97 1,990 90.38 9 2.45
55 54,524,749 10.26 54,522,542 91.91 2,207 81.65 11 2.46
65 64,437,606 10.04 64,435,180 85.54 2,426 75.5 13 2.47
D, dissipation; Fre, frequency.
The typical values of resonance frequency and dissipation obtained from the QCM-D measurements in air and solution (water or buffer solution) at six harmonics are presented. The second signature, S2,
defines the ratio of the resonance frequency change divided by the product of the harmonic number and the dissipation change and can be used as an initial check of the system’s performance 10,11,35,65,80,85–88 .
7/18/2019 Quartz CrQuartz crystal microbalance with dissipation monitoringystal Microbalance With Dissipation Monitor
http://slidepdf.com/reader/full/quartz-crquartz-crystal-microbalance-with-dissipation-monitoringystal-microbalance 8/11
puorG gnihsilbuP erut
aN 0102©
natureprotocols
/moc.eruta
n.www//:ptth
PROTOCOL
NATURE PROTOCOLS | VOL.5 NO.6 | 2010 | 1103
(v) Wash again with Tris/NaCl no. 1 buffer at a flow rate of 100 µl min − 1 for 5 min. After washing, the final resonancefrequency and dissipation values should be − 24.5 ± 1.5 Hz and less than 0.2 × 10 − 6, respectively.
(B) Formation of negatively charged SLBs on titanium oxide substrate TIMING ~1 h (i) Follow the procedure described above up to Step 6. (ii) Once all the frequency and dissipation response values have stabilized, add ~0.1 mg ml − 1 vesicle solution (POPC:DGPP
(70:30) diluted in Tris/NaCl no. 3 buffer) at a flow rate between 100 and 250 µl min − 1. A slower flow rate and lowervesicle concentration will show two-step kinetics for SLB formation. A higher flow rate and higher vesicleconcentration ( > 0.5 mg ml − 1) may cause the process to occur with one-step kinetics.! CAUTION Alternatively, one can also form the bilayer using other negatively charged lipid head groups as long asthe anionic lipid percentage is in the range of 15–30%. When selecting lipids, ensure that they have a gel–fluid phasetransition temperature well below the experimental temperature range.
CRITICAL STEP When one injects the vesicle solution, it is necessary to use the calcium-containing buffer (Tris/NaClno. 3). However, do not prepare charged vesicles in this buffer because it will promote vesicle aggregation.
(iii) Continue flowing the vesicle solution into the measurement chamber for at least 5 min to ensure that the bilayer is
defect free. Thereafter, wash the bilayer with Tris/NaCl no. 1 buffer at a flow rate of 100 µl min − 1 for 5 min. CRITICAL STEP Flow the buffer constantly to check the integrity of the bilayer and wash out the adsorbed vesicleson top of the substrate. If the change in frequency value increases past − 23 Hz, add additional vesicle solution toreduce potential SLB defects.
(iv) Wash again with Tris/NaCl no. 1 buffer at a flow rate of 100 µl min − 1 for 5 min. After washing, the final resonance
frequency and dissipation values should be − 25 ± 1.0 Hz and less than 0.2 × 10 − 6, respectively. CRITICAL STEP Ensure that the Tris/NaCl no. 3 buffer is exchanged with the Tris/NaCl no. 1 buffer. This willremove calcium ions from the solution and allow the SLB to have a high degree of lateral lipid diffusivity, resultingin a fluid bilayer. If calcium is still present, then the lateral lipid diffusivity within the SLB will be
significantly reduced.
(C) Formation of zwitterionic SLBs on gold substrate induced by AH peptide TIMING ~3 h (i) Repeat the procedure described above up to Step 6. (ii) Restart the measurement and allow it to stabilize for at least 5 min. Thereafter, add a ~0.1 mg ml − 1 POPC vesicle
solution diluted in Tris/NaCl no. 1 buffer at a flow rate of 250 µl min − 1. After adsorption, the vesicles will remainintact on the surface instead of rupturing.
CRITICAL STEP The most critical factors for forming a complete bilayer in the next step are as follows: completecoverage of intact vesicles, size distribution of vesicles (average diameter < 70 nm) and eliminating excess vesicles by
buffer wash. The frequency change corresponds to the average size of the vesicles and the fraction of surfacecoverage84. For E series instruments, a frequency change of − 140 Hz corresponds to POPC vesicles extruded with a30 nm polycarbonate etch-tracked membrane. For the D300 instrument, the change should be − 120 Hz. The massdeviation is mainly from the flow difference of the two systems (batch versus continuous). Flow rate conditionsaffect how vesicles deform once absorbed onto the substrate.
(iii) Wash the adsorbed, intact vesicles with Tris/NaCl no. 1 buffer at a flow rate of 100 µl min − 1 for 30 min to eliminateexcess vesicles on top of the adsorbed vesicles as well as vesicles in solution.
CRITICAL STEP It is important to eliminate excess vesicles in solution and those adsorbed onto the tubing walls.Otherwise, the residual vesicles will interact with the AH peptide and cause vesicle fusion and aggregation in solution.When using D300, wash at least four times in the ‘sensor out’ position.
(iv) Once the signal has stabilized, add AH peptide (13 µM) at a flow rate of 50 µl min − 1. CRITICAL STEP For D300, inject 1 ml with the ‘sensor out’ position setting and then wait for the temperature tostabilize. Add an additional 1 ml with the ‘loop out’ position setting and then close. Ensure that air bubbles are not
introduced during solution exchange. For the E series, prepare 3 ml of the AH peptide solution and allow it to flow for10 min or alternatively recirculate the AH peptide solution.
(v) Wait until frequency and dissipation values reach approximately − 25 Hz and 0.2 × 10 − 6, respectively. Thereafter, washwith Tris/NaCl no. 1 at a flow rate of 100 µl min − 1 for 10 min.
TIMINGFormation of SLBs on a silicon oxide substrate should take 2 h, including stabilization time. On gold and titanium oxidesubstrates, SLB formation, including the AH peptide-induced vesicle rupture procedure, should take a total of 4 h. Note thatthese times are only for the formation of SLB platforms. For example, a protein-binding study may take an additional fewhours depending on the experiment of interest. In addition, vesicle preparation before the experiment will takeseveral hours.
7/18/2019 Quartz CrQuartz crystal microbalance with dissipation monitoringystal Microbalance With Dissipation Monitor
http://slidepdf.com/reader/full/quartz-crquartz-crystal-microbalance-with-dissipation-monitoringystal-microbalance 9/11
puorG gnihsilbuP erut
aN 0102©
natureprotocols
/moc.eruta
n.www//:ptth
PROTOCOL
1104 | VOL.5 NO.6 | 2010 | NATURE PROTOCOLS
? TROUBLESHOOTINGTo reproducibly form complete SLBs on solid substrates with QCM-D monitoring for the subsequent investigation ofbiomacromolecular interactions, the critical steps discussed above should be followed with care. There are two main areasof troubleshooting associated with this protocol that the critical steps address. First, SLB is a platform that can be used inconjunction with the QCM-D sensor, such as the QCM-D. Therefore, the QCM-D performance must first be verified in air
and then in liquid. Analysis of QCM-D solutions in liquid follows a complex series of equations, the independent variables ofwhich include viscosity, temperature and density. Care needs to be taken so that changes in these properties do not hinderan accurate quantitative detection of the interaction taking place on the quartz crystal substrate. After verifying the deviceperformance, attention must be shifted to the formation of a complete SLB. The QCM-D analysis permits measurement of theadsorbed lipids’ mass and viscoelastic properties. Incomplete SLB formation is not uncommon and can be easily verified bya properly operating machine. Numerous material and experimental parameters need to be carefully selected to limit abruptchanges in the physical properties of the liquid (e.g., high flow rate can cause pressure-related responses) and to favorthe spontaneous adsorption and rupture of lipid vesicles onto the substrate (e.g., vesicle size and substrate conditions).Taken together, the critical steps provide a guideline to promote the self-assembly of a complete SLB, which can be verified
through two important properties (i.e., mass and viscoelasticity) with QCM-D monitoring.
ANTICIPATED RESULTSSupported lipid bilayer formation on various solid substrates including silicon oxide, titanium oxide and gold is highly
reproducible when using the protocols discussed above. Regardless of the substrate and lipid composition, the SLB shouldexhibit similar mass and viscoelastic properties, enabling its use as a platform to investigate membrane-associatedbiomacromolecular interactions. Although QCM-D can probe these two physical properties in real time, thereby offeringa fundamental characterization of the SLB self-assembly process, there is an increasing demand to combine QCM-D with
complementary techniques for the monitoring of subsequent biomacromolecular interactions. As progress is made toward thedesign of increasingly sophisticated cell-membrane mimics, parallel integration of multiple techniques relying on differentphysical principles is likely to have a key role for elucidating new insight into the interaction kinetics and dynamics. Fromthe SLB fabrication and characterization methods presented in this protocol, more complex biomimetic platforms can bedeveloped and used together with the sensitive QCM-D technique. Such work shows the emerging potential at the nexus ofnanobiotechnology and more traditional biological fields for improving our knowledge of fundamental biological pathways.
ACKNOWLEDGMENTS N.-J.C. is a recipient of an American Liver FoundationPostdoctoral Fellowship Award and a Global Roche Postdoctoral Fellowship. We
wish to thank all the members of the Frank, Kasemo and Hook laboratories, wholaid the foundation for future studies in the biomimetic sensor field.
AUTHOR CONTRIBUTIONS N.-J.C. and F.H. conceived and designed the protocoland wrote the paper; C.W.F. and B.K. contributed to data analysis and paperediting.
COMPETING FINANCIAL INTERESTS The authors declare no competing financialinterests.
Published online at http://www.natureprotocols.com/.Reprints and permissions information is available online at http://npg.nature.
com/reprintsandpermissions/.
1. Sackmann, E. Supported membranes: scientific and practical applications.Science 271, 43–48 (1996).
2. Tanaka, M. & Sackmann, E. Supported membranes as biofunctionalinterfaces and smart biosensor platforms. Physica Status Solidi A 203,
3452–3462 (2006).3. Hook, F., Kasemo, B., Grunze, M. & Zauscher, S. Quantitative biological
surface science: challenges and recent advances. ACS Nano 2, 2428–2436
(2008).4. White, R.J. et al. Ionic conductivity of the aqueous layer separating a
lipid bilayer membrane and a glass support. Langmuir 22, 10777–10783
(2006).5. White, R.J. et al. Single ion-channel recordings using glass nanopore
membranes. J. Am. Chem. Soc. 129, 11766–11775 (2007).
6. Boxer, S.G. Molecular transport and organization in supported lipidmembranes. Curr. Opin. Chem. Biol. 4, 704–709 (2000).
7. Kaiser, H.J. et al. Order of lipid phases in model and plasma membranes.
Proc. Natl. Acad. Sci. USA 106, 16645–16650 (2009).
8. Hook, F., Rodahl, M., Kasemo, B. & Brzezinski, P. Structural changes inhemoglobin during adsorption to solid surfaces: effects of pH, ionic
strength, and ligand binding. Proc. Natl. Acad. Sci. USA 95, 12271–12276(1998).
9. Hook, F. et al. Variations in coupled water, viscoelastic properties, and
film thickness of a Mefp-1 protein film during adsorption and cross-linking: a quartz crystal microbalance with dissipation monitoring,ellipsometry, and surface plasmon resonance study. Anal. Chem. 73,
5796–5804 (2001).10. Cho, N.J., Cheong, K.H., Lee, C., Frank, C.W. & Glenn, J.S. Binding
dynamics of hepatitis C virus′ NS5A amphipathic peptide to cell and
model membranes. J. Virol. 81, 6682–6689 (2007).11. Cho, N.J., Cho, S.J., Cheong, K.H., Glenn, J.S. & Frank, C.W. Employing an
amphipathic viral peptide to create a lipid bilayer on Au and TiO2.
J. Am. Chem. Soc. 129, 10050–10051 (2007).12. Cooper, M.A. & Singleton, V.T. A survey of the 2001 to 2005 quartz crystal
microbalance biosensor literature: applications of acoustic physics to theanalysis of biomolecular interactions. J. Mol. Recognit. 20, 154–184 (2007).
13. Kasemo, B. & Hook, F. Protein and vesicle interaction with surfaces. Abstr. Pap. Am. Chem. Soc. 223, U444–U444 (2002).
14. Purrucker, O., Fortig, A., Jordan, R., Sackmann, E. & Tanaka, M.Control of frictional coupling of transmembrane cell receptors inmodel cell membranes with linear polymer spacers. Phys. Rev. Lett. 98 (2007).
15. Thid, D. et al. Supported phospholipid bilayers as a platform for neuralprogenitor cell culture. J. Biomed. Mater. Res. 84, 940–953 (2008).
16. Tu, R.S. & Tirrell, M. Bottom-up design of biomimetic assemblies. Adv. Drug Deliv. Rev. 56, 1537–1563 (2004).
17. Tamm, L.K. & McConnell, H.M. Supported phospholipid bilayers.
Biophys. J. 47, 105–113 (1985).18. Axelrod, D., Koppel, D.E., Schlessinger, J., Elson, E. & Webb, W.W. Mobility
measurement by analysis of fluorescence photobleaching recovery kinetics.
Biophys. J. 16, 1055–1069 (1976).
7/18/2019 Quartz CrQuartz crystal microbalance with dissipation monitoringystal Microbalance With Dissipation Monitor
http://slidepdf.com/reader/full/quartz-crquartz-crystal-microbalance-with-dissipation-monitoringystal-microbalance 10/11
puorG gnihsilbuP erut
aN 0102©
natureprotocols
/moc.eruta
n.www//:ptth
PROTOCOL
NATURE PROTOCOLS | VOL.5 NO.6 | 2010 | 1105
19. Richter, R., Mukhopadhyay, A. & Brisson, A. Pathways of lipid vesicle
deposition on solid surfaces: a combined QCM-D and AFM study.Biophys. J. 85, 3035–3047 (2003).
20. Morigaki, K. & Tawa, K. Vesicle fusion studied by surface plasmon
resonance and surface plasmon fluorescence spectroscopy. Biophys. J. 91,1380–1387 (2006).
21. Reimhult, E., Larsson, C., Kasemo, B. & Hook, F. Simultaneous surface
plasmon resonance and quartz crystal microbalance with dissipationmonitoring measurements of biomolecular adsorption events involvingstructural transformations and variations in coupled water. Anal. Chem.
76, 7211–7220 (2004).22. Oxhamre, C., Richter-Dahlfors, A., Zhdanov, V.P. & Kasemo, B. A minimal
generic model of bacteria-induced intracellular Ca2+ oscillations in
epithelial cells. Biophys. J. 88, 2976–2981 (2005).23. Stroumpoulis, D., Parra, A. & Tirrell, M. A kinetic study of vesicle fusion
on silicon dioxide surfaces by ellipsometry. AIChE J. 52, 2931–2937
(2006).24. Cho, N.J. et al. Alpha-helical peptide-induced vesicle rupture revealing
new insight into the vesicle fusion process as monitored in situ by quartz
crystal microbalance-dissipation and reflectometry. Anal. Chem. 81,4752–4761 (2009).
25. Wang, G. et al. A combined reflectometry and quartz crystal microbalance
with dissipation setup for surface interaction studies. Rev. Sci. Instrum. 79, 075107 (2008).
26. Anderson, T.H. et al. Formation of supported bilayers on silica substrates.
Langmuir 25, 6997–7005 (2009).
27. Kanazawa, K. & Gordon, J. The oscillation frequency of a quartz resonatorin contact with a liquid. Anal. Chim. Acta 175, 99–106 (1985).
28. Kanazawa, K.K. & Reed, C.E. A new description for the viscoelasticallyloaded quartz resonator. Abstr. Pap. Am. Chem. Soc. 198, 89 Anyl (1989).
29. Rodahl, M. et al. Simultaneous frequency and dissipation factor QCM
measurements of biomolecular adsorption and cell adhesion. Faraday
Discuss. 107, 229–246 (1997).30. Rodahl, M., Hook, F. & Kasemo, B. QCM operation in liquids: an
explanation of measured variations in frequency and Q factor with liquidconductivity. Anal. Chem. 68, 2219–2227 (1996).
31. Rodahl, M., Hook, F., Krozer, A., Brzezinski, P. & Kasemo, B. Quartz-crystal
microbalance setup for frequency and q-factor measurements in gaseousand liquid environments. Rev. Sci. Instrum. 66, 3924–3930 (1995).
32. Rodahl, M. & Kasemo, B. Frequency and dissipation-factor responses to
localized liquid deposits on a QCM electrode. Sens. Actuators B Chem. 37,111–116 (1996).
33. Rodahl, M. & Kasemo, B. On the measurement of thin liquid overlayers
with the quartz-crystal microbalance. Sens. Actuators A Phys. 54, 448–456(1996).
34. Rodahl, M. & Kasemo, B. A simple setup to simultaneously measure the
resonant frequency and the absolute dissipation factor of a quartz crystalmicrobalance. Rev. Sci. Instrum. 67, 3238–3241 (1996).
35. Cho, N.J., Kanazawa, K.K., Glenn, J.S. & Frank, C.W. Employing two
different quartz crystal microbalance models to study changes inviscoelastic behavior upon transformation of lipid vesicles to a bilayer ona gold surface. Anal. Chem. 79, 7027–7035 (2007).
36. Hook, F. & Kasemo, B. The QCM-D technique for probingbiomacromolecular recognition reactions. Springer Ser. Chem. Sens. Biosens. 5, 425–447 (2007).
37. Keller, C.A. & Kasemo, B. Surface specific kinetics of lipid vesicleadsorption measured with a quartz crystal microbalance. Biophys. J. 75,1397–1402 (1998).
38. Keller, C.A., Glasmastar, K., Zhdanov, V.P. & Kasemo, B. Formation of
supported membranes from vesicles. Phys. Rev. Lett. 84, 5443–5446(2000).
39. Lee, S.E. et al. Biologically functional cationic phospholipid-goldnanoplasmonic carriers of RNA. J. Am. Chem. Soc. 131, 14066–14074(2009).
40. Larsson, E.M., Edvardsson, M.E., Langhammer, C., Zoric, I. & Kasemo, B.A combined nanoplasmonic and electrodeless quartz crystal microbalance
setup. Rev. Sci. Instrum. 80, 125105 (2009).
41. Jonsson, M.P., Jonsson, P. & Hook, F. Simultaneous nanoplasmonic andquartz crystal microbalance sensing: analysis of biomolecularconformational changes and quantification of the bound molecular mass.
Anal. Chem. 80, 7988–7995 (2008).42. Jonsson, M.P., Jonsson, P., Dahlin, A.B. & Hook, F. Supported lipid bilayer
formation and lipid-membrane-mediated biorecognition reactions studied
with a new nanoplasmonic sensor template. Nano Lett. 7, 3462–3468(2007).
43. Misra, N. et al. Bioelectronic silicon nanowire devices using functional
membrane proteins. Proc. Natl Acad. Sci. USA 106, 13780–13784 (2009).44. Kasemo, B. & Lausmaa, J. Material-tissue interfaces: the role of surface
properties and processes. Environ. Health Perspect. 102 (Suppl 5): 41–45
(1994).45. Seifert, U., Berndl, K. & Lipowsky, R. Shape transformations of
vesicles—phase-diagram for spontaneous-curvature and bilayer-coupling
models. Phys. Rev. A 44, 1182–1202 (1991).46. Shillcock, J.C. & Lipowsky, R. Tension-induced fusion of bilayer membranes
and vesicles. Nat. Mater. 4, 225–228 (2005).
47. Polozov, I.V., Anantharamaiah, G.M., Segrest, J.P. & Epand, R.M.Osmotically induced membrane tension modulates membranepermeabilization by class L amphipathic helical peptides: nucleation model
of defect formation. Biophys. J. 81, 949–959 (2001).48. Lasic, D.D. The mechanism of vesicle formation. Biochem. J. 256, 1–11
(1988).
49. Lasic, D.D. & Martin, F.J. On the mechanism of vesicle formation. J. Memb. Sci. 50, 215–222 (1990).
50. Watwe, R.M. & Bellare, J.R. Manufacture of liposomes—a review. Curr. Sci. 68, 715–724 (1995).
51. Winterhalter, M. & Lasic, D.D. Liposome stability and formation—experimental parameters and theories on the size distribution.
Chem. Phys. Lipids 64, 35–43 (1993).52. Armengol, X. & Estelrich, J. Physical stability of different liposome
compositions obtained by extrusion method. J. Microencapsul. 12,
525–535 (1995).
53. Shingles, R. & McCarty, R.E. Production of membrane vesicles by extrusion:size distribution, enzyme activity, and orientation of plasma membrane
and chloroplast inner-envelope membrane vesicles. Anal. Biochem. 229,92–98 (1995).
54. Seantier, B. & Kasemo, B. Influence of mono- and divalent ions on the
formation of supported phospholipid bilayers via vesicle adsorption.Langmuir 25, 5767–5772 (2009).
55. Kasemo, B. Biocompatibility of titanium implants: surface science aspects.
J. Prosthet. Dent. 49, 832–837 (1983).56. Kasemo, B. & Lausmaa, J. Aspects of surface physics on titanium
implants. Swed. Dent. J. Suppl. 28, 19–36 (1985).
57. Greve, F. et al. Molecular design and characterization of the neuron-microelectrode array interface. Biomaterials 28, 5246–5258 (2007).
58. Reimhult, E., Hook, F. & Kasemo, B. Vesicle adsorption on SiO2 and TiO2:
Dependence on vesicle size. J. Chem. Phys. 117, 7401–7404 (2002).59. Modin, C. et al. QCM-D studies of attachment and differential spreading of
pre-osteoblastic cells on Ta and Cr surfaces. Biomaterials 27, 1346–1354
(2006).60. Ekeroth, J., Konradsson, P. & Höök, F. Bivalent-ion-mediated vesicle
adsorption and controlled supported phospholipid bilayer formation on
molecular phosphate and sulfate layers on gold. Langmuir 18, 7923–7929(2002).
61. Rossetti, F.F., Textor, M. & Reviakine, I. Asymmetric distribution of
phosphatidyl serine in supported phospholipid bilayers on titaniumdioxide. Langmuir 22, 3467–3473 (2006).
62. Rossetti, F.F., Bally, M., Michel, R., Textor, M. & Reviakine, I. Interactions
between titanium dioxide and phosphatidyl serine-containing liposomes:formation and patterning of supported phospholipid bilayers on thesurface of a medically relevant material. Langmuir 21, 6443–6450 (2005).
63. Kunze, A., Sjovall, P., Kasemo, B. & Svedhem, S. In situ preparation andmodification of supported lipid layers by lipid transfer from vesiclesstudied by QCM-D and TOF-SIMS. J. Am. Chem. Soc. 131, 2450–2451
(2009).
64. Jackman, J.A., Cho, N.J., Duran, R.S. & Frank, C.W. Interfacial bindingdynamics of bee venom phospholipase A(2) investigated by dynamic light
scattering and quartz crystal microbalance. Langmuir 26, 4103–4112(2010).
65. Cho, N.J. et al. Quartz resonator signatures under Newtonian liquid loading
for initial instrument check. J. Colloid Interface Sci. 315, 248–254 (2007).66. Reimhult, E., Hook, F. & Kasemo, B. Temperature dependence of formation
of a supported phospholipid bilayer from vesicles on SiO2. Phy. Rev. E 66
(2002).67. Reimhult, E., Hook, F. & Kasemo, B. Intact vesicle adsorption and
supported biomembrane formation from vesicles in solution: Influence of
surface chemistry, vesicle size, temperature, and osmotic pressure.Langmuir 19, 1681–1691 (2003).
68. Zhdanov, V.P., Dimitrievski, K. & Kasemo, B. Adsorption and spontaneous
rupture of vesicles composed of two types of lipids. Langmuir 22,3477–3480 (2006).
7/18/2019 Quartz CrQuartz crystal microbalance with dissipation monitoringystal Microbalance With Dissipation Monitor
http://slidepdf.com/reader/full/quartz-crquartz-crystal-microbalance-with-dissipation-monitoringystal-microbalance 11/11
puorG gnihsilbuP erut
aN 0102©
natureprotocols
/moc.eruta
n.www//:ptth
PROTOCOL
1106 | VOL 5 NO 6 | 2010 | NATURE PROTOCOLS
69. Dimitrievski, K., Reimhult, E., Kasemo, B. & Zhdanov, V.P. Simulations of
temperature dependence of the formation of a supported lipid bilayer viavesicle adsorption. Colloids Surf. B Biointerfaces 39, 77–86 (2004).
70. Dimitrievski, K. & Kasemo, B. Influence of lipid vesicle composition and
surface charge density on vesicle adsorption events: a kinetic phasediagram. Langmuir 25, 8865–8869 (2009).
71. Sauerbrey, G. Verwendung von Schwingquarzen zur Wagung dunner
Schichten und zur Mikrowagung. Z. Phys. 155, 206–222 (1959).72. Voinova, M.V., Rodahl, M., Jonson, M. & Kasemo, B. Viscoelastic acoustic
response of layered polymer films at fluid-solid interfaces: continuum
mechanics approach. Phys. Scr. 59, 391–396 (1999).73. Johannsmann, D., Reviakine, I. & Richter, R.P. Dissipation in films of
adsorbed nanospheres studied by quartz crystal microbalance (QCM). Anal.
Chem. 81, 8167–8176 (2009).74. Richter, R.P. & Brisson, A.R. Following the formation of supported lipid
bilayers on mica: a study combining AFM, QCM-D, and ellipsometry.
Biophys. J. 88, 3422–3433 (2005).75. Kasemo, B. & Lausmaa, J. Biomaterial and implant surfaces: on the role
of cleanliness, contamination, and preparation procedures. J. Biomed.
Mater. Res. 22 (A2 Suppl): 145–158 (1988).76. Hook, F. et al. A comparative study of protein adsorption on titanium
oxide surfaces using in situ ellipsometry, optical waveguide lightmode
spectroscopy, and quartz crystal microbalance/dissipation. Colloids Surf.
B Biointerfaces 24, 155–170 (2002).77. Mashaghi, A., Swann, M., Popplewell, J., Textor, M. & Reimhult, E. Optical
anisotropy of supported lipid structures probed by waveguide spectroscopy
and its application to study of supported lipid bilayer formation kinetics. Anal. Chem. 80, 3666–3676 (2008).
78. Richter, R.P., Maury, N. & Brisson, A.R. On the effect of the solid supporton the interleaflet distribution of lipids in supported lipid bilayers.Langmuir 21, 299–304 (2005).
79. Stelzle, M. & Sackmann, E. Sensitive detection of protein adsorption
to supported lipid bilayers by frequency-dependent capacitancemeasurements and microelectrophoresis. Biochim. Biophys. Acta. 981,135–142 (1989).
80. Cho, N.J., Cho, S.J., Hardesty, J.O., Glenn, J.S. & Frank, C.W. Creation oflipid partitions by deposition of amphipathic viral peptides. Langmuir 23,10855–10863 (2007).
81. Meyvis, T.K., De Smedt, S.C., Van Oostveldt, P. & Demeester, J.Fluorescence recovery after photobleaching: a versatile tool for mobilityand interaction measurements in pharmaceutical research. Pharm. Res. 16,
1153–1162 (1999).82. Bailey, L.E. et al. Multistep adsorption of perfluoropolyether hard-disk
lubricants onto amorphous carbon substrates from solution. Langmuir 17,
8145–8155 (2001).83. Bobardt, M.D. et al. Hepatitis C virus NS5A anchor peptide disrupts
human immunodeficiency virus. Proc. Natl Acad. Sci. USA 105, 5525–5530
(2008).84. Cho, N.J. et al. The mechanism of an amphipathic α-helical peptide’s
antiviral activity involves size-dependent virus particle lysis. ACS Chem.
Biol. 4, 1061–1067 (2009).85. Han, X. et al. Supported bilayer lipid membrane arrays on photopatterned
self-assembled monolayers. Chemistry 13, 7957–7964 (2007).
86. Purrucker, O. et al. Polymer-tethered membranes as quantitative models forthe study of integrin-mediated cell adhesion. Soft Matter 3, 333–336(2007).
87. Sklan, E.H. et al. A Rab-GAP TBC domain protein binds hepatitis C
virus NS5A and mediates viral replication. J. Virol. 81, 11096–11105(2007).
88. Yu, X. et al. Cryo-electron microscopy and three-dimensionalreconstructions of hepatitis C virus particles. Virology 367, 126–134(2007).