québec handy numbers – 2016 edition · 2016 edition. la version française de cette brochure...
TRANSCRIPT

INSTITUTDE LA STATISTIQUEDU QUÉBEC
Québec Handy
Numbers2016 Edition

La version française de cette brochure s'intitule Le Québec chiffres en main, édition 2016.
This booklet was compiled and published by the Institut de la statistique du Québec.For information concerning the Institut and the statistics available, please contact:
Institut de la statistique du Québec200, chemin Sainte-FoyQuébec (Québec) G1R 5T4Telephone: 418-691-2401 or 1-800-463-4090 (toll-free)
Website: www.stat.gouv.qc.ca
Legal depositLibrary and Archives CanadaBibliothèque et Archives nationales du QuébecSecond quarter 2016ISBN 978-2-550-75604-0 (printed version) ISBN 978-2-550-75605-7 (PDF)
© Gouvernement du Québec, Institut de la statistique du Québec, 1987
Any reproduction other than for personal consultation purposes is prohibited without the authorization of the gouvernement du Québec.www.stat.gouv.qc.ca/droits_auteur_an.htm
April 2016

FOREWORD
Each year the Institut de la statistique du Québec publishes this practical booklet, which collates basic statistical information about Québec society.
Québec Handy Numbers contains a wide range of territorial, demographic, living conditions and economic data on Québec. A statistical portrait of the 17 administrative regions also complements the publication.
This booklet is for all those looking for information on Québec and its regions.
Although this booklet presents the most recent data available, you can find more information by visiting the Institut’s website, a vast source of statistical information updated throughout the year.
The publication of Québec Handy Numbers would not have been possible without the collaboration of many Québec and Canadian government department or agency employees. I would like to sincerely thank them for a job well done.
Stéphane Mercier Director General

Québec Handy Numbers was compiled by: Audrée SoucyDirection des communications: Annie Giguère, Acting DirectorCover design: Anne-Marie RoyLayout: Gabrielle Tardif
NotesAs a result of the rounding off of some data, the total may not necessarily equal the sum of its parts.The Institut creates regional maps using the 2015 Système sur les découpages administratifs (SDA) of the Ministère de l'Énergie et des Ressources naturelles.
Sustainable Development IndicatorsIndicators adopted by the government to monitor and measure the progress of Québec toward sustainable development. Please refer to the Sustainable Development Indicators section of the ISQ website to find out more about these indicators. The format may differ.
Symbolse Estimated datap Preliminary datar Revised data
.. Data not available
... Not applicable– Void or zero
Abbreviationscm Centimetred DayFTE Full time equivalentG In billionsh Hourha Hectareinhab. Inhabitantk In thousandskg Kilogramkm Kilometrekm2 Square kilometrekWh Kilowatt-hourM In millionsm2 Square metrem3 Cubic metre
mm Millimetren NumberPPP Purchasing power parity s Secondt Metric tonnetoe Tonne oil equivalentt eq. CO2 Tonne carbon dioxyde
equivalentwk Week°C Degree Celsiusµg Microgram$ Canadian dollars$US US dollars% Percent or percentage

We would like to thank all those who played a role, great or small, in the preparation of this booklet, and more particularly our closest collaborators.
GOUVERNEMENT DU QUÉBECInstitut de la statistique du Québec: Dominique André, Suzanne Asselin, Réjean Aubé, Jean-Pierre Barrette, Daniel Beaulieu, Marianne Bernier, Anne Binette Charbonneau, Monique Bordeleau, Sophie Brehain, Stéphane Crespo, Esther Frève, Marc-André Gauthier, Cédric Ghislain, Émilie Granger, Hugo Johnston-Laberge, Katrina Joubert, Maxime Keith, Stéphane Ladouceur, Danielle Laplante, Manon Leclerc, Louis Madore, Guillaume Marchand, Éric Massicotte, Marc Philibert, Marie-Hélène Provençal, Jimmy Quirion, Julie Rabemananjara, Mario Ringuette, Anne-Marie Roy, Karine St-Pierre, Gabrielle Tardif, Bruno VerreaultMinistère de l’Agriculture, des Pêcheries et de l’Alimentation: Samir BenchabaneMinistère du Développement durable, de l’Environnement et de la Lutte contre les changements climatiques: Daniel Busque, Julie Paradis, Pierre-Yves St-LouisMinistère de l’Éducation et de l’Enseignement supérieur: Chad Décarie-Deblois, Antoine Kouadio N’Zué, Richard Royer, Nancy VézinaMinistère de l'Énergie et des Ressources naturelles: Ismaël CisséMinistère de la Famille: Philippe PacautMinistère des Finances: Éric DulongMinistère des Forêts, de la Faune et des Parcs: David SalmonMinistère de l’Immigration, de la Diversité et de l’Inclusion: Raluca Paula FilipMinistère de la Santé et des Services sociaux: Isabelle Aumont, Joanne Reid, Sylvie VézinaMinistère du Tourisme: Luc Boivin, Ghislain DumasMinistère des Transports, de la Mobilité durable et de l’Électrification des transports: Saïd AllafMinistère du Travail, de l’Emploi et de la Solidarité sociale: Alexis Labrosse, Rémi Nadeau, Bernard Pelletier
RECYC-QUÉBEC: Francis Vermette
GOVERNMENT OF CANADAFisheries and Oceans Canada: Édith Lachance
ACKNOWLEDGEMENTS

TABLE OF CONTENTS
TERRITORY 7Location 7Area 7Territorial Division 7St. Lawrence River 7Temperatures and Precipitation 8Vegetation 8Heritage 8Environment 8
POPULATION 10Evolution and Age Structure of Population 10Population Movement 11Nuptiality and Conjugal Status 13Immigration 13Mother tongue 14Population of Municipalities 14
LIVING CONDITIONS 16Families 16Households 17Housing 17Monthly Last-Resort Financial Assistance 18Health and Social Services 18Justice and Protection of Citizens 21Education 21Culture and Communications 24Time Use 25Labour Market 25Unions 26Income 27Minimum Wage 29Consumption 29
THE ECONOMY AND FINANCE 31Agriculture 31Fishing 32Forestry 32Mining Sector 33Energy 33Construction 35Manufacturing Sector 36Transportation 36Tourism 38Science, Technology and Innovation 39Financial Sector 40Investments 41International Trade 42The International Economy 43Income and Expenditure Economic Accounts 44Québec Government Budgetary Transactions and Debt 45Economic Activity by Sector (NAICS) 46
REGIONS AT A GLANCE 47
SOURCES AND NOTES 64

TERRITORY
LOCATION
0 1000 Km
Source: Thematic Mapping.
AREA1
Unit
Total Area2 km2 1,667,712 Land area % 78 Water area % 22 Fresh water % 13 Brackish and salt water3 % 9
TERRITORIAL DIVISION4 (ON DÉCEMBER 31, 2015)
Administrative regions n 17Geographical RCMs5 n 104Municipalities n 1,288 Local municipalities n 1,134 Aboriginal territories n 58 Unorganized territories n 96
ST. LAWRENCE RIVER6
Length km 3,260Tributaries flowing into it7 n 244Area of drainage basin M km2 1.6Average annual flow in Québec m3/s 12,600Share of world's freshwater % 25
Québec
CANADA
UNITED STATES

8 Territory
TEMPERATURES AND PRECIPITATION8
Unit Montréal Québec Baie-Comeau Fermont
Average yearly temperature oC 6.6 4.6 2.7 –3.0Average daily temperature in January oC –10.1 –12.0 –13.3 –22.1Average daily temperature in July oC 21.2 19.3 16.4 13.5Frost-free days n 213 192 178 118Annual rainfall mm 833 900 787 535Annual snowfall cm 172 272 297 291
VEGETATION9
Continental area10 km2 1,514,100Vegetation zoneLow Arctic km2 236,000Forest Tundra11 km2 217,100Taiga11 km2 299,900Forest km2 761,100 Boreal km2 551,400 Mixed km2 98,600 Deciduous km2 111,100
HERITAGE
UNESCO WORLD HERITAGE PROPERTIES,12 2015Cultural heritage
Natural heritage
Mixed heritage
Total
nWorld 802 197 32 1,031 Canada 8 9 – 17 Québec13 1 1 – 2
Source: UNESCO, World Heritage Center.
ENVIRONMENT
2007 2014 2015
Proportion of Québec's surface area dedicated to protected areas 14 4.81 9.11 9.16

Territory 9
Unit 2006 2013 2014
Proportion of main southern rivers where water quality is good15
Based on fecal coliforms % 64 85 87 Based on phosphorus % 51 56 67 Based on suspended solids % 44 41 44
GREENHOUSE GAS EMISSIONS BY ACTIVITY SECTOR, 2012
Transportation44.7%
Industry31.6%
Residential, commercial and institutional9.7%
Agriculture8.3%
Waste5.5%
Electricity0.3%
Total emission:78.0 M t eq. CO2
Emissions per capita: 9.6 t eq. CO2
Source: Ministère du Développement durable, de l'Environnement et de la Lutte contre les changements climatiques, Direction des politiques de la qualité de l'atmosphère.
MANAGEMENT OF RESIDUAL MATERIALS,16 1998-2012
1.501.461.21
1.511.69 1.69
0.750.94 0.87 0.86 0.88
0.81
0.46 0.510.63 0.65
0.81
0.880.76
0.00
0.50
1.00
1.50
2.00
1998 2000 2002 2004 2006 2008 2010 2012
t / inhab.
Generated
Eliminated
Recovered
0.72
Source: RECYC-QUÉBEC, Bilan 2012 de la gestion des matières résiduelles au Québec.

EVOLUTION AND AGE STRUCTURE OF POPULATION
POPULATION
POPULATION OF QUÉBEC, 1851-2011 AND PROJECTED POPULATION, 2021-2061
AGE PYRAMID, 2015 AND 2061
1 M
2 M
3 M
4 M
5 M
6 M
7 M
8 M
9 M
0123456789
1011
1851 1871 1891 1911 1931 1951 1971 1991 2011 2031 2051
M 10 M
Sources: Statistics Canada, Censuses and population estimates. Institut de la statistique du Québec, Population projections.
Sources: Statistics Canada and Institut de la statistique du Québec.
70 60 50 40 30 20 10 0 0 10 20 30 40 50 60 70
Age
Population by single years of age (k)
Male Female
20612015
0102030405060708090100

Population 11
MEDIAN AGE OF POPULATION, 1901-2061
0
10
20
30
40
50 Age (in years)
1901 205120011951
Sources: Statistics Canada, Censuses and population estimates. Institut de la statistique du Québec, Population projections.
CENTENARIANS, 2010 AND 2015p
Source: Statistics Canada, Population estimates.
Men Women Total
n
20102015p
0
1,000
1,500
500118
1,173 1,291
181
1,7641,9452,000
POPULATION BY SEX AND AGE GROUP, 2015p
k %Total 8,263.6 100.0Men 4,105.5 49.7Women 4,158.1 50.30-4 years 444.8 5.45-9 years 441.0 5.310-14 years 393.2 4.815-19 years 434.8 5.320-24 years 540.6 6.525-44 years 2,195.9 26.645-64 years 2,360.7 28.665-74 years 831.5 10.175 years and over 621.0 7.5
Source: Statistics Canada, Population estimates as of July 1.
POPULATION MOVEMENT17
Unit 2006 2013 2014
Total Growth n 57,297 63,340 r 60,482p
Natural growth n 27,528 27,800p 24,700p
Births n 81,962 88,600p 87,700p
Deaths n 54,434 60,800p 63,000p
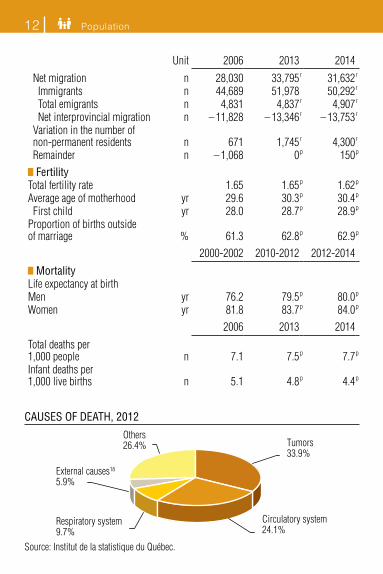
12 Population
Unit 2006 2013 2014
Net migration n 28,030 33,795r 31,632r
Immigrants n 44,689 51,978 50,292r
Total emigrants n 4,831 4,837r 4,907r
Net interprovincial migration n – 11,828 – 13,346r – 13,753r
Variation in the number of non-permanent residents n 671 1,745r 4,300r
Remainder n – 1,068 0p 150p
FertilityTotal fertility rate 1.65 1.65p 1.62p
Average age of motherhood yr 29.6 30.3p 30.4p
First child yr 28.0 28.7p 28.9p
Proportion of births outside of marriage % 61.3 62.8p 62.9p
2000-2002 2010-2012 2012-2014
MortalityLife expectancy at birthMen yr 76.2 79.5p 80.0p
Women yr 81.8 83.7p 84.0p
2006 2013 2014
Total deaths per 1,000 people n 7.1 7.5p 7.7p
Infant deaths per 1,000 live births n 5.1 4.8p 4.4p
CAUSES OF DEATH, 2012
Circulatory system24.1%
Tumors33.9%
Others26.4%
Respiratory system9.7%
External causes18
5.9%
Source: Institut de la statistique du Québec.

Population 13
CONJUGAL STATUS,20 2011
Common-lawmarriage20.9%
Single (never married)29.2%
Widowed5.8% Legally married
(not separated)35.4%
Divorced7.0%
Separated1.6%
Not living with a spouse Living with a spouse 21
Source: Statistics Canada, 2011 Census.
NUPTIALITY AND CONJUGAL STATUS
Unit 2006 2013 2014
Nuptiality17
Marriages n 21,956 23,181 22,410p
Divorces19 n 14,965 .. ..
IMMIGRATION
2006 2013 2014p
Landed Immigrant22 n 44,681 51,976 50,275 Continent of Birth
Africa n 13,325 18,103 15,578 Algeria n 4,597 4,155 3,521America n 9,022 11,105 10,302 Haiti n 1,400 3,443 2,859Asia n 13,194 13,878 16,856 Iran n 575 2,045 5,854Europe n 9,074 8,819 7,466 France n 3,236 4,494 3,522Oceania and other countries n 66 71 73

14 Population
POPULATION BY MOTHER TONGUE,24 2011
Source: Statistics Canada, 2011 Census, adapted by the Institut de la statistique du Québec.
French English Non-officiallanguage
More than onelanguage
%
Québec provinceMontréal administrativeregion
0
60
78.1
47.0
80
7.716.6 12.3
32.3
2.0 4.1
40
20
Unit 2006 2013 2014p
CategoryEconomic class23 % 58.1 67.0 66.6Family class % 23.3 23.9 22.5Refugees % 15.9 8.1 9.7Other immigrants23 % 2.7 1.0 1.2
MOTHER TONGUE
POPULATION OF MUNICIPALITIES
2006 2014r 2015p
Cities with a Population of 100,000 or more25
Montréal k 1,637.5 1,741.9 1,755.0Québec k 495.9 539.3 542.0Laval k 372.5 421.7 425.2Gatineau k 244.9 276.8 278.8Longueuil k 231.4 242.0 243.7Sherbrooke k 149.0 163.7 164.7Saguenay k 144.5 146.1 145.7Lévis k 131.5 143.0 144.0Trois-Rivières k 127.3 134.5 135.0Terrebonne k 96.1 111.4 112.2
Population 15
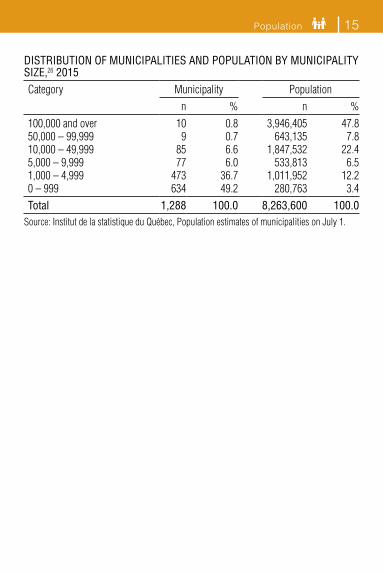
DISTRIBUTION OF MUNICIPALITIES AND POPULATION BY MUNICIPALITY SIZE,26 2015Category Municipality Population
n % n %100,000 and over 10 0.8 3,946,405 47.850,000 – 99,999 9 0.7 643,135 7.810,000 – 49,999 85 6.6 1,847,532 22.45,000 – 9,999 77 6.0 533,813 6.51,000 – 4,999 473 36.7 1,011,952 12.20 – 999 634 49.2 280,763 3.4Total 1,288 100.0 8,263,600 100.0
Source: Institut de la statistique du Québec, Population estimates of municipalities on July 1.

LIVING CONDITIONS
FAMILIES
Unit 2006 2011
Families27 n 2,121,610 2,203,625Couple families % 83.4 83.4 No children % 48.3 50.6 With children % 51.7 49.4 1 child % 41.2 40.6 2 children % 41.8 42.1 3 or more children % 17.0 17.3Lone-parent % 16.6 16.6 1 child % 63.6 62.3 2 children % 27.9 28.8 3 or more children % 8.5 8.9 Female parent % 77.9 76.0 Male parent % 22.1 24.0Couple families with children % .. 100.0 Intact % .. 83.9 Step % .. 16.1Average number of people per family n 2.90 2.83Average number of children per family with children n 1.71 1.73
2006 2013 2014
Parents in Employment28
Proportion of two-parent families with children under 6 both parents29 are both employed % 68.7 72.9 70.3Proportion of lone-parent families with children under 6 whose parent29 is employed % 66.0 71.2 70.9
Living Conditions 17
Unit 2005-2006 2011-2012 2012-2013
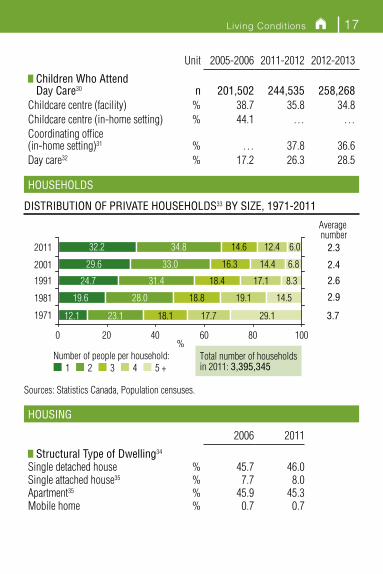
Children Who Attend Day Care30 n 201,502 244,535 258,268
Childcare centre (facility) % 38.7 35.8 34.8Childcare centre (in-home setting) % 44.1 … …Coordinating office (in-home setting)31 % … 37.8 36.6Day care32 % 17.2 26.3 28.5
HOUSEHOLDS
DISTRIBUTION OF PRIVATE HOUSEHOLDS33 BY SIZE, 1971-2011
18.1
18.8
18.4
16.3
14.6
17.7
19.1
17.1
14.4
12.4
29.1
14.5
8.3
6.8
6.032.2
29.6
24.7
19.6
12.1
34.8
33.0
31.4
28.0
23.1
0 20 40%
60 80 100
1971
1981
1991
2001
2011
1 2 3 4 5 +Number of people per household:
Average number
2.3
2.4
2.6
2.9
3.7
Total number of householdsin 2011: 3,395,345
Sources: Statistics Canada, Population censuses.
HOUSING
2006 2011
Structural Type of Dwelling34
Single detached house % 45.7 46.0Single attached house35 % 7.7 8.0Apartment35 % 45.9 45.3Mobile home % 0.7 0.7

18 Living Conditions
Unit 2006 2014 2015
Real Estate Value of Housing Stock36
Per capita $ 74,851 124,177 128,153Average by type of residential building Single-family residence $ 147,721 252,906 259,800 Condominium $ 164,199 255,923 260,965 Building with 2 to 5 units $ 203,637 352,469 361,135 Building with 6 or more units $ 663,667 1,152,336 1,186,910 Cottage or vacation home $ 64,193 130,518 135,775
MONTHLY LAST-RESORT FINANCIAL ASSISTANCE37
2006 2014 2015
Beneficiaries n 506,540 452,073 448,543 Adults n 382,857 352,222 351,143 Children n 123,683 99,851 97,400Households n 343,337 322,967 323,958Total benefits paid k$ 233,911 241,944 244,430Average benefits paid $ 681.29 749.13 754.51
HEALTH AND SOCIAL SERVICES
2007-2008 2011-2012 2013-2014
Population Health Indicators38
Population aged 12 and over Considering themselves healthy39 % 90.2 89.9 89.3 Men % 90.3 90.8 89.2 Women % 90.0 89.1 89.4 Considering themselves mentally healthy40 % 96.6 96.1 95.7
Men % 96.3 96.4 96.2 Women % 96.8 95.8 95.2Population aged 18 and over Considered sedentary41 % 25.5 24.1 23.3 Men % 26.2 26.0 25.0 Women % 24.9 22.3 21.6
Living Conditions 19
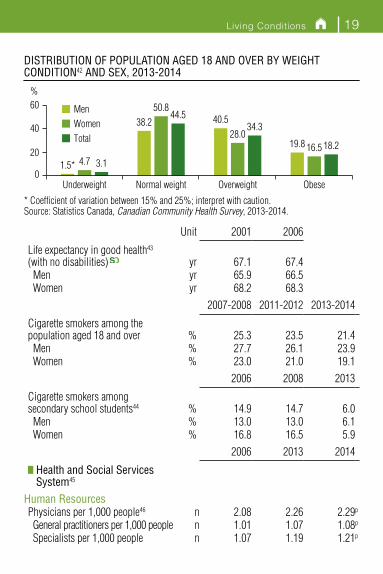
DISTRIBUTION OF POPULATION AGED 18 AND OVER BY WEIGHT CONDITION42 AND SEX, 2013-2014
40.5
19.8
4.7
28.016.5
3.1
18.2
1.5*
50.8
34.3
Underweight Normal weight Overweight Obese
%
MenWomenTotal
44.538.2
0
20
40
60
* Coefficient of variation between 15% and 25%; interpret with caution.Source: Statistics Canada, Canadian Community Health Survey, 2013-2014.
Unit 2001 2006
Life expectancy in good health43 (with no disabilities) yr 67.1 67.4 Men yr 65.9 66.5 Women yr 68.2 68.3
2007-2008 2011-2012 2013-2014
Cigarette smokers among thepopulation aged 18 and over % 25.3 23.5 21.4 Men % 27.7 26.1 23.9 Women % 23.0 21.0 19.1
2006 2008 2013
Cigarette smokers amongsecondary school students44 % 14.9 14.7 6.0 Men % 13.0 13.0 6.1 Women % 16.8 16.5 5.9
2006 2013 2014
Health and Social Services System45
Human ResourcesPhysicians per 1,000 people46 n 2.08 2.26 2.29p
General practitioners per 1,000 people n 1.01 1.07 1.08p
Specialists per 1,000 people n 1.07 1.19 1.21p

20 Living Conditions
Unit 2006 2013 2014
Employees in the health and social services establishment network47 FTE .. 222,275 223,670 Nurses, clinical nurses, nurse practitioners FTE .. 44,431 45,223
Institutional ResourcesHealth and social services facilities48 n 1,746 1,689 1,681Set-up beds allotted to health and geriatric care per 1,000 people49 n 2.08 1.95 1.93Set-up beds allotted to psychiatric care per 1,000 people49 n 0.42 0.40 0.39Set-up beds allotted to accommodation and long-term care per 1,000 people49 n 5.47 4.87 4.79
Use of ServicesAverage stay in short-term care50 d 7.16 7.01 6.90Medical services51 k 86,580 99,035 101,425p
Per capita n 11.4 12.3 12.4p
Reports followed up under the Youth Protection Act per 100 youths aged 17 and under52 n 2.03 2.12 2.20Accomodation rate for senior citizens aged 65 and over53 % 3.4 2.6 2.5
Financial ResourcesTotal health care expenditure54 M$ 31,578 45,005r 46,303e
Public sector % 71.2 70.6r 70.6e
Private sector % 28.8 29.4r 29.4e
Total health care expenditure as a percentage of GDP54 % 10.9 12.4r 12.4e
Total health care expenditure per capita54 $ 4,138 5,519r 5,637e

Living Conditions 21
Unit 2005-2006 2012-2013 2013-2014
Percentage of real net expenditure allotted to programs and services55 % 74.4 77.2 77.7Home care expenditure M$ 759 1,174 1,264
JUSTICE AND PROTECTION OF CITIZENS
2006 2013 2014
Police services56
Actual police officer strength n 15,096 16,024 16,201 Municipal police forces n 8,957 9,321 9,550 Sûreté du Québec (Québec provincial police) n 5,177 5,707 5,694
Royal Canadian Mounted Police n 962 996 957Police officers per 100,000 people n 198 196 197
2007 2013 2014
Share of crime victim claims accepted57 % 80.7 79.4 79.5
2005-2006 2013-2014r 2014-2015
Share of applications for legal aid granted58 % 82.1 84.3 83.9
EDUCATION59
2005-2006 2012-2013 2013-2014
Educational Institutions n 3,275 3,238 3,241 School and Student Population
Youth general education - Elementary60 n 599,278 576,544 591,288p
Youth general education - Secondary n 482,465 414,243r 403,290p
Adult general education n 158,791 193,344r 191,004p
Vocational training - Youth and adults n 106,460 125,684r 129,348p
College n 189,416 223,067 224,823 Mainstream of regular education n 159,362 189,348 189,707 Continuing education n 30,054 33,719 35,116
22 Living Conditions
Unit 2005-2006 2012-2013 2013-2014
University61 n 264,242 298,858 306,178 Full-time n 168,433 198,443 204,922 Part-time n 95,809 100,415 101,256
Diplomas GrantedSecondary n 110,673r 125,002r 128,357p
General education n 71,742r 74,748r 73,680p
Vocational education n 38,931r 50,254r 54,677p
College (Diploma of College Studies)62 n 41,095 43,894 46,156 Pre-university education n 23,607 25,689 26,868 Technical education n 17,488 18,205 19,288University63 n 43,396 47,212 52,142 Bachelor's degree n 32,117 33,784 38,055 Master's degree n 10,001 11,654 12,207 Doctorate degree n 1,278 1,774 1,880
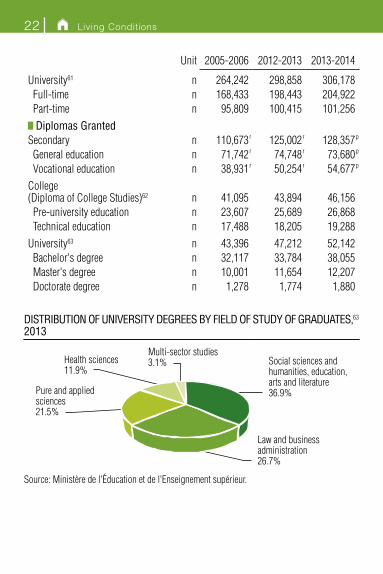
DISTRIBUTION OF UNIVERSITY DEGREES BY FIELD OF STUDY OF GRADUATES,63 2013
Social sciences andhumanities, education,arts and literature36.9%
Law and businessadministration26.7%
Pure and appliedsciences21.5%
Health sciences11.9%
Multi-sector studies3.1%
Source: Ministère de l'Éducation et de l'Enseignement supérieur.
Living Conditions 23
Unit 2005-2006 2012-2013 2013-2014
Educational StageProbability of obtaining first secondary school diploma % 84.8 94.6r 95.1p
Probability of entering college % 57.9 65.7 ..Probability of entering university (for a bachelor's degree) % 41.7 44.8 .. Public Network Teaching Staff
Elementary and Secondary60 FTE 71,136 75,156 75,848College FTE 12,816 15,299 15,037University64 n 9,181 .. .. Expenditures
Overall education expenditure per student in the public network Elementary and Secondary $ 9,170 .. .. College (private and public) $ 11,570 13,159 13,152 University $ 25,681 27,746 27,490
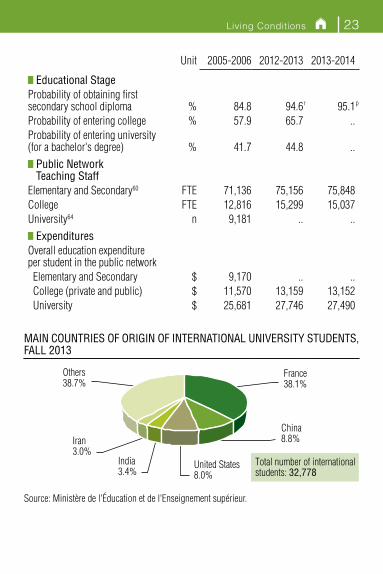
MAIN COUNTRIES OF ORIGIN OF INTERNATIONAL UNIVERSITY STUDENTS, FALL 2013
Others38.7%
Iran3.0%
India3.4%
United States8.0%
China8.8%
France38.1%
Total number of internationalstudents: 32,778
Source: Ministère de l'Éducation et de l'Enseignement supérieur.
24 Living Conditions
CULTURE AND COMMUNICATIONS65
Unit 2005-2006 2012-2013 2013-2014
Per Capita Expenditure on Culture and Communications by the Québec Government $ 104.72 122.34 122.04
2006 2013 2014
Cultural ConsumptionAdmissions to paying performing arts shows k 6,977.1 6,671.8 6,798.6Users of independent public libraries66 k .. 2,743.4 2,591.0Books sales k$ .. 694,509.3p 625,170.5p
Admissions to museum institutions67 k 11,789.9 14,191.5 13,775.4
2006 2014 2015
Sales of digital albums and CDs68 k 12,129.7 7,627.5 7,459.6Sales of digital tracks68 k 1,476.1 14,770.2 14,114.9Admissions to movie theatres and drive-ins k 24,833.3 18,860.3 20,091.2p
TOP BOX OFFICE FEATURE FILMS, 2015P
Film title Origin Admissionsn
Minions United States 846,210Star Wars: The Force Awakens United States 837,725Jurassic World United States 816,440Furious 7 United States 634,907Spectre United States 604,261
Source: Institut de la statistique du Québec, Observatoire de la culture et des communications du Québec.

Living Conditions 25
TIME USE69
Unit 1998 2005 2010
Daily AverageWork activities h/d 8.5 8.7 8.6 Men h/d 8.9 9.1 8.9 Women h/d 7.9 8.2 8.1Domestic activities h/d 3.7 3.9 3.7 Men h/d 3.0 3.3 3.2 Women h/d 4.3 4.4 4.1Personal time h/d 10.8 10.8 11.1Free time h/d 6.1 5.9 5.8
LABOUR MARKET28
2006 2013 2014
Population Aged 15 and Over k 6,226.7 6,755.3 6,802.2 Participating k 4,071.5 4,393.5 4,400.0
Men k 2,176.6 2,315.7 2,314.3Women k 1,894.9 2,077.9 2,085.815-24 years k 636.5 665.1 660.725-54 years k 2,892.5 2,928.2 2,906.055 years and over k 542.5 800.3 833.3 Employed k 3,743.1 4,060.8 4,059.7
Men k 1,990.9 2,122.7 2,106.3Women k 1,752.2 1,938.0 1,953.515-24 years k 550.9 578.6 573.425-54 years k 2,688.2 2,741.9 2,712.355 years and over k 504.0 740.2 774.0Full-time k 3,057.3 3,277.8 3,245.3Part-time k 685.8 783.0 814.4Employees k 3,244.0 3,510.0 3,501.9 Public sector % 24.0 24.5 25.1 Private sector % 76.0 75.5 74.9Self-employed workers k 499.0 550.7 557.9 Without employees70 % 62.5 69.2 70.0 With employees % 36.9 30.4 30.0

26 Living Conditions
Unit 2006 2013 2014
Unemployed k 328.4 332.8 340.3Men k 185.7 192.9 208.0Women k 142.7 139.8 132.3Average length of unemployment wk 20.4 24.3 22.9 Unemployment Rate % 8.1 7.6 7.7
Men % 8.5 8.3 9.0Women % 7.5 6.7 6.315-24 years % 13.4 13.0 13.225-54 years % 7.1 6.4 6.755 years and over % 7.1 7.5 7.1Without secondary school diploma % 15.3 15.2 15.5Secondary school diploma % 7.7 8.3 8.4Post-secondary education % 7.2 6.7 7.0University degree % 4.9 4.9 5.2 Employment Rate % 60.1 60.1 59.7
Men % 64.9 63.5 62.6Women % 55.5 56.8 56.8 Participation Rate % 65.4 65.0 64.7
Men % 70.9 69.3 68.8Women % 60.0 60.9 60.7 Employment Insurance71
Average number of recipients per month n 244,438 182,073 171,923Average weekly benefits $ .. 390.00 409.00
UNIONS
2006 2013 2014
Unionization72 % 40.6 39.8 39.6Public sector % 82.1 82.8 81.7Private sector % 27.4 25.7 25.3Primary sector % 35.1 33.6 36.9Secondary sector % 42.8 42.9 42.0 Construction % 57.8 56.4 57.5 Manufacturing % 39.1 37.1 35.8

Living Conditions 27
Unit 2006 2013 2014
Tertiary sector % 40.1 39.1 39.0 Government % 81.2 81.1 79.3 Others % 36.2 35.5 35.6 Collective Agreements in Force73 n 9,809 8,734 8,528
Signed collective agreements74 n 3,210 2,035 1,556 Labour Disputes Triggered During the Year73 n 37 76 56
Labour disputes in progress during the year n 43 84 99 Workers affected n 5,370 179,229 27,424 Annual Variation of Salary Rate73, 75 % 2.6 1.9 1.9
Public sector76 % 2.2 1.9 1.8Private sector % 3.0 2.1 2.2
INCOME77
2006 2012 2013
Individuals Earning an Income
Total Income $ 32,222 38,117 38,502Private income $ 27,567 32,352 32,507 Employment income $ 23,291 27,022 27,196 Investment income $ 1,080 1,497 1,438 Retirement income $ 2,406 3,138 3,306 Others $ 790 694 567Transfer income $ 4,655 5,765 5,995– Taxes $ – 5,734 – 6,472 – 6,393Disposable income $ 26,488 31,645 32,109Less than 25 years $ 12,454 14,671 13,56725-44 years $ 37,072 42,296 43,17145-64 years $ 37,950 46,465 47,64965 years and over $ 25,161 31,601 30,877

28 Living Conditions
Unit 2006 2012 2013
Average Employment Income from Individuals Earning an Income $ 31,949 37,263 38,125
Men $ 36,800 43,416 42,719 Full-time all year $ 49,154 58,957 60,183 Others $ 22,480 19,240 18,134Women $ 26,326 30,294 32,976 Full-time all year $ 38,494 42,463 47,006 Others $ 16,816 15,381 15,616 Average Disposable Household Income $ 48,860 59,172 59,721
One person households $ 26,089 31,784 32,007More-than-one-person households $ 59,023 72,037 72,895 Couples without children $ 52,150 62,555 63,550 Couples with children78 $ 70,106 84,938 86,092 Lone-parent families78 $ 40,594 48,317 56,125 Other households79 $ 61,307 77,037 77,185 Low Income Households After Tax80 % 13.8 14.0 13.8
One person households % 25.9 25.1 24.9More-than-one-person households % 8.4 8.7 8.5 Couples without children % 6.7 6.3 5.5 Couples with children78 % 5.7 8.0 10.3 Lone-parent families78 % 23.5 30.9 19.2 Other households79 % 9.5 8.9 8.9
DISTRIBUTION OF FAMILY UNITS BY AFTER-TAX INCOME GROUP, 2013
0102030
Less than $10,000
$10,000 – $29,999
$30,000 – $59,999
$60,000 – $99,999
$100,000or more
2.9
20.5
36.526.8
13.4
40%
Source: Statistics Canada, Survey of Labour and Income Dynamics.

Living Conditions 29
MINIMUM WAGE
Unit 2006 2013 2014
Minimum Wage Rate81 $ 7.75 10.15 10.35 Employees Earning Minimum Wage28 n 137,100 218,500 210,200
In proportion with the total number of employees % 4.2 6.2 6.0Retail trade % 11.0 16.9 15.9Accommodation and food services % 16.0 24.3 21.1Other sectors % 2.2 2.9 3.0Establishment with 1 to 19 employees % 7.7 10.9 10.4Establishment with 20 employees and over % 2.6 4.1 4.1
CONSUMPTION
AVERAGE SPENDING PER HOUSEHOLD, 2014
$ %
Total spending 69,215 100.0Food 7,771 11.2Shelter 13,187 19.1Furnishings and household equipment 1,776 2.6Clothing and accessories 2,994 4.3Transportation 10,443 15.1Health and personal care 3,604 5.2Recreation 3,262 4.7Tobacco products, alcoholic beverages and games of chance (net amount) 1,582 2.3Income taxes 13,005 18.8Personal insurance payments and pension contributions 4,458 6.4Other expenses 7,135 10.3
Source: Statistics Canada, Survey of Household Spending, CANSIM, table 203-0021, February 2016.

30 Living Conditions
PERCENTAGE CHANGE IN CONSUMER PRICE INDEX, 1985-2015
– 2
0
2345678
%
Drop inoil price
Introduction of GST
1985 1987 1989 1991 1993 1995 1997 1999 2001 2003 2005 2007 2009 2011 2013 2015
1
– 1
Tobacco taxrollback
Sources: Statistics Canada and Institut de la statistique du Québec.
THE ECONOMY AND FINANCE
AGRICULTURE82
Unit 2006 2013 2014
Zoned area for agriculture k ha 6,305 6,308 6,307Area of farmland k ha 3,463 3,293e 3,269e
Cultivated area k ha 1,933 1,851e 1,839e
Number of farms n 30,675 28,941e 28,693e
Farm cash receipts M$ 6,308 8,296r 8,403Animal production M$ 3,869 5,037r 5,506 Cattle M$ 293 309r 385 Calves M$ 221 206r 255 Hogs M$ 849 1,310 1,607 Hens and chickens M$ 410 670r 643 Other livestock M$ 93 120r 123 Milk M$ 1,849 2,186r 2,243 Eggs M$ 100 165r 174 Honey M$ 6 12r 13 Other products M$ 48 58r 64Crop production M$ 1,534 2,728r 2,550 Grains M$ 326 799r 687 Ornamental horticulture M$ 239 254 263 Maple products M$ 163 344 319 Vegetables M$ 329 431r 446 Potatoes M$ 115 130r 132 Fruits M$ 180 180r 185 Oil seed and high-protein crops M$ 125 468r 389 Forage plants M$ 47 116 122 Other products M$ 12 6 6Forest products M$ 47 26r 26Program payments M$ 858 506 321
Biofood exports M$ 3,826 6,084r 7,010Biofood imports M$ 3,798 5,637r 6,614Sector balance M$ 28 447r 396

32 The Economy and Finance
FISHING
Unit 2006 2013 2014
Marine Waters83
Licensed fishing vessels n 1,400 1,261 1,248Permit holders n 1,577 1,265 1,245Total value of landings k$ 117,056 168,531 204,453p
Fish % 10.0 8.9 8.9 Mollusks and shellfish % 90.0 91.1 91.1 Inshore Waters84
Permit holders n 136 88 86Estimated value of landings k$ 1,912 1,452 1,388 Aquaculture84
Aquaculture companies n 141 115 123Estimated value of aquacultural sales k$ 10,297 11,778 10,476 Freshwater aquaculture k$ 9,618 10,854 9,423 Marine aquaculture k$ 679 924 1,052
FORESTRY9
2005-2006 2012-2013 2013-2014
Area of intensive forest inventory zone km2 591,549 591,549 591,549 Fresh water km2 58,302 58,302 58,302 Productive forest land85
Slope of 0% to 40% km2 424,115 424,115 424,115 Slope of 41% or more km2 11,401 11,401 11,401 Unproductive forest land km2 62,838 62,838 62,838 Non forest land86 km2 34,894 34,894 34,894Gross merchantable volume87 k m3 3,791,919 3,791,919 3,791,919Harvested area ha 406,200 206,618 ..Volume of harvested wood k m3 38,616 24,973 26,119Reforested area ha 77,215 75,289 ..
2006 2011 2012Value of shipments and other revenue from logging88 M$ 3,089.2 2,175.4 2,109.2

The Economy and Finance 33
MINING SECTOR89
Unit 2006 2015p 2016e
Investment M$ 1,213 2,299 2,784Exploration and deposit appraisal M$ 295 220 219Mine complex development M$ 918 2,079 2,565
Value of Mineral Shipments M$ 4,520 7,656 7,146Gold M$ 519 2,374 2,361Nickel M$ 599 850 758Stone M$ 428 430 420Cement M$ 327 411 402Copper M$ 142 301 283Zinc M$ 347 219 213Silver M$ 78 51 46
Volume of Mineral ShipmentsGold kg 23,568 49,717 49,456Nickel t 21,821 53,452 47,689Stone k t 47,249 35,730 34,787Cement k t 3,035 2,648 2,589Copper t 18,669 45,802 43,133Zinc t 95,666 93,640 91,110Silver kg 185,478 78,586 70,657
ENERGY90
2006 2011 2012
Total Energy Consumption k toe 40,645.4 40,563.5 39,278.1By TypeElectricity % 39.0 39.1 39.1Petroleum % 39.2 38.4 38.5Natural gas % 11.7 14.1 13.5Biomass % 9.2 7.4 7.4Coal % 1.0 1.1 1.4

34 The Economy and Finance
TOTAL CONSUMPTION OF ENERGYBY SECTOR, 2012
Transportation29.5%
Residential19.1%
Commercial14.4%
Industrial37.0%
Source: Ministère de l'Énergie et des Ressources naturelles.
Unit 2006 2011 2012
Electricity Production M kWh 213,772 229,071 233,975
By Type of ProducersHydro-Québec % 70.8 74.1 73.6Private producers91 % 14.6 12.7 12.6Churchill Falls92 % 14.7 13.2 13.8
By Source of EnergyHydraulic % 96.2 96.6 96.0Thermal % 1.3 1.1 0.9Nuclear % 2.3 1.6 1.9Wind power % 0.2 0.7 1.2
Electricity Consumption93 M kWh 190,013 184,237 178,824
Electricity Exportation M kWh 14,828 25,925 32,530United States % 79.0 76.7 73.9Other Canadian provinces % 21.0 23.3 26.1
Origin of Crude Petroleum Supply
America (including Canada) % 15.1 12.3 14.2North Sea % 41.3 15.7 7.6Africa, Middle East and other countries % 43.6 71.9 78.2

The Economy and Finance 35
Unit 2006 2011 2012
Balance of Trade in the Energy Sector M$ – 9,745 .. ..
Electricity M$ 708 .. ..Petroleum94 M$ – 8,774 – 12,230 – 10,998Natural gas M$ – 1,562 – 1,385 – 1,169Coal M$ – 117 – 150 – 212
CONSTRUCTION95
2006 2014 2015
Housing starts n 47,877 38,810 37,926Value of building permits M$ 11,878.3 16,030.9r 13,847.4 Residential M$ 7,779.5 8,744.0r 8,439.3 Non-residential M$ 4,098.8 7,286.9r 5,408.1
HOURS WORKED PER SECTOR, 2005-2014
0
15
30
60
90M
Residentialconstruction
Institutional and commercial
Industrial
Civil engineeringand road network
2005 2006 2007 2008 2009 2010 2011 2012 2013 2014
75
45
Source: Commission de la construction du Québec.

36 The Economy and Finance
MANUFACTURING SECTOR96
Unit 2006 2011r 2012
Share of manufacturing in Québec's GDP97 % 17.8 14.7 14.5Share of Québec manufacturing in Canada (according to total revenue) % 24.4 24.2 23.3Manufacturing establishments98 n 22,629 20,180 19,875Total revenue M$ 157,670.1 146,299.7 146,411.6Total expenditures M$ 145,606.5 133,832.9 134,556.7Total employment n 466,581 408,646 407,340Total salaries M$ 21,041.0 19,563.5 19,700.2Revenue from goods manufactured M$ 142,041.8 137,321.1 138,386.4SMEs n 21,253 19,057 18,725Share of SMEs in manufacturing sector (by total revenue) % 26.7 29.5 29.1
DESTINATION99 OF GOODS MANUFACTURED, 2012
Québec45.1%
Other provincesand territories19.5%
Foreign35.4%
Source: Statistics Canada, Annual Survey of Manufactures and Logging, 2012, adapted by the Institut de la statistique du Québec.
TRANSPORTATION100
2006 2013 2014Road network101 km 29,778 30,631 30,898Number of motor vehicles k 5,402.4 6,161.3 6,240.3 Passenger vehicles % 74.3 75.9 76.0

The Economy and Finance 37
Unit 2006 2013 2014
Vehicles for institutional, professional or commercial use % 10.7 11.0 10.9 Vehicles outside the road network % 12.4 13.0 13.0 Restricted-area use vehicles % … 0.1 0.1Public transit vehicles102 n 4,085 4,838 4,911p
Passengers transported103 M 530.3 613.2 613.9p
Owners and operators of heavy vehicles104 n 49,167 55,816 55,840 Heavy-duty vehicles > 3,000 kg105 n 118,268 135,458 135,392Railway system106 km 6,678 6,631 6,302Rail freight transportation M t 68.3 57.9 58.0Marine transportation107
International M t 88.0 .. .. Domestic108 M t 31.4 .. ..
2006 2014 2015
Ferries109
Passengers transported k 5,281.2 5,310.3 5,106.1 Vehicles transported110 k .. 2,614.2 2,572.4
TOTAL ENPLANED/DEPLANED PASSENGERS IN AIRPORTS, 2010-2014
0
5,000
15,000
20,000
20142010 2011 2012 2013
k
International air travel(except United States)
Transborder air travel(United States)
Domestic air travel(Canada)
10,0005,128
3,314
6,189
5,563
3,356
6,544
5,527
3,390
6,804
5,600
3,437
6,772
5,806
3,575
7,093
Source: Statistics Canada, Air passenger traffic and flights, CANSIM, table 401-0044.

38 The Economy and Finance
TOURISM
TOURISTS111 AND TOURIST SPENDING, 2014
49.9%
14.6%
16.6%
18.9%
Total spending: 7.5 G$
10.6%5.9% 4.0%
79.5%
Québecers Canadians from other provinces Americans Tourists from other countries
Total number of tourists: 31.1 M
Sources: Statistics Canada, Travel Survey of Residents of Canada (TSRC) and International Travel Survey (ITS).
AVERAGE DURATION OF STAY AND AVERAGE TOURIST SPENDING PER NIGHT,111 2014
Average duration of stay
Average spending per night
d $Québecers 2.3 67Canadians from other provinces 3.0 111Americans 4.1 165Tourists from other countries 11.1 104
Sources: Statistics Canada, Travel Survey of Residents of Canada (TSRC) and International Travel Survey (ITS).
Unit 2006 2013 2014
Québec International Travel Account112
Revenues from foreign visitors111
to Québec M$ 2,290 2,303 2,698Spending by Québec visitors111
travelling abroad M$ 3,603 6,775 7,245Québec's tourism balance M$ – 1,313 – 4,472 – 4,547
The Economy and Finance 39
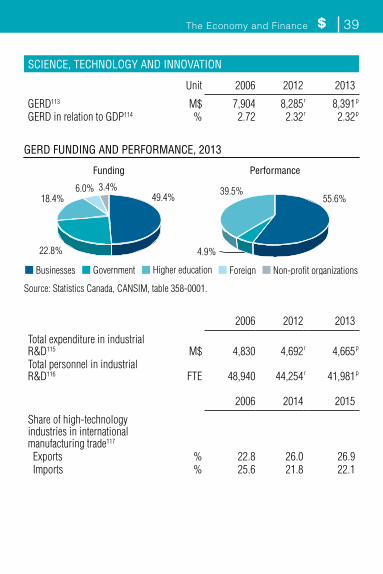
SCIENCE, TECHNOLOGY AND INNOVATION
Unit 2006 2012 2013
GERD113 M$ 7,904 8,285r 8,391p
GERD in relation to GDP114 % 2.72 2.32r 2.32p
GERD FUNDING AND PERFORMANCE, 2013
Non-profit organizationsForeign
49.4%
22.8%
18.4%6.0% 3.4%
Funding Performance
55.6%39.5%
4.9%
Higher educationBusinesses Government
Source: Statistics Canada, CANSIM, table 358-0001.
2006 2012 2013
Total expenditure in industrial R&D115 M$ 4,830 4,692r 4,665p
Total personnel in industrial R&D116 FTE 48,940 44,254r 41,981p
2006 2014 2015
Share of high-technology industries in international manufacturing trade117
Exports % 22.8 26.0 26.9 Imports % 25.6 21.8 22.1
40 The Economy and Finance
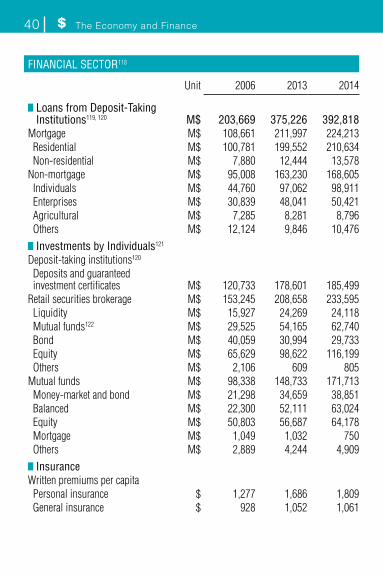
FINANCIAL SECTOR118
Unit 2006 2013 2014
Loans from Deposit-Taking Institutions119, 120 M$ 203,669 375,226 392,818
Mortgage M$ 108,661 211,997 224,213 Residential M$ 100,781 199,552 210,634 Non-residential M$ 7,880 12,444 13,578Non-mortgage M$ 95,008 163,230 168,605 Individuals M$ 44,760 97,062 98,911 Enterprises M$ 30,839 48,041 50,421 Agricultural M$ 7,285 8,281 8,796 Others M$ 12,124 9,846 10,476 Investments by Individuals121
Deposit-taking institutions120
Deposits and guaranteed investment certificates M$ 120,733 178,601 185,499
Retail securities brokerage M$ 153,245 208,658 233,595 Liquidity M$ 15,927 24,269 24,118 Mutual funds122 M$ 29,525 54,165 62,740 Bond M$ 40,059 30,994 29,733 Equity M$ 65,629 98,622 116,199 Others M$ 2,106 609 805Mutual funds M$ 98,338 148,733 171,713 Money-market and bond M$ 21,298 34,659 38,851 Balanced M$ 22,300 52,111 63,024 Equity M$ 50,803 56,687 64,178 Mortgage M$ 1,049 1,032 750 Others M$ 2,889 4,244 4,909 Insurance
Written premiums per capita Personal insurance $ 1,277 1,686 1,809 General insurance $ 928 1,052 1,061
The Economy and Finance 41
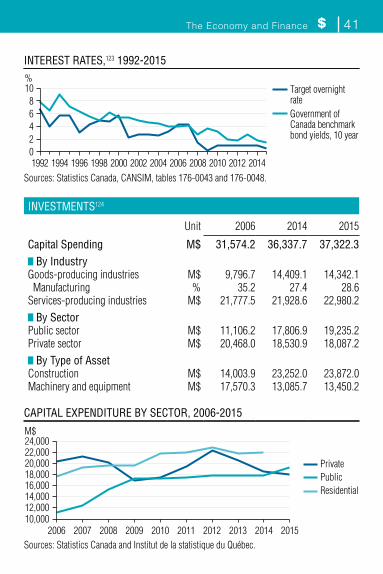
INTEREST RATES,123 1992-2015
02468
10
1992 1994 1996 1998 2000 2002 2004 2006 2008 2010 2012 2014
Target overnightrateGovernment ofCanada benchmarkbond yields, 10 year
%
Sources: Statistics Canada, CANSIM, tables 176-0043 and 176-0048.
INVESTMENTS124
Unit 2006 2014 2015
Capital Spending M$ 31,574.2 36,337.7 37,322.3 By Industry
Goods-producing industries M$ 9,796.7 14,409.1 14,342.1 Manufacturing % 35.2 27.4 28.6Services-producing industries M$ 21,777.5 21,928.6 22,980.2 By Sector
Public sector M$ 11,106.2 17,806.9 19,235.2Private sector M$ 20,468.0 18,530.9 18,087.2 By Type of Asset
Construction M$ 14,003.9 23,252.0 23,872.0Machinery and equipment M$ 17,570.3 13,085.7 13,450.2
CAPITAL EXPENDITURE BY SECTOR, 2006-2015
10,00012,00014,00016,00018,00020,00022,00024,000
2006 2007 2008 2009 2010 2011 2012 2013 2014 2015
M$
Private
ResidentialPublic
Sources: Statistics Canada and Institut de la statistique du Québec.
42 The Economy and Finance
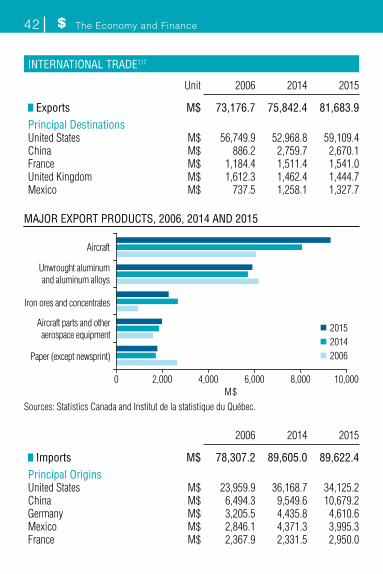
INTERNATIONAL TRADE117
Unit 2006 2014 2015
Exports M$ 73,176.7 75,842.4 81,683.9Principal DestinationsUnited States M$ 56,749.9 52,968.8 59,109.4China M$ 886.2 2,759.7 2,670.1France M$ 1,184.4 1,511.4 1,541.0United Kingdom M$ 1,612.3 1,462.4 1,444.7Mexico M$ 737.5 1,258.1 1,327.7
MAJOR EXPORT PRODUCTS, 2006, 2014 AND 2015
0 2,000 8,000 10,000M$
201520142006
Iron ores and concentrates
Aircraft parts and otheraerospace equipment
Paper (except newsprint)
Unwrought aluminumand aluminum alloys
Aircraft
4,000 6,000
Sources: Statistics Canada and Institut de la statistique du Québec.
2006 2014 2015
Imports M$ 78,307.2 89,605.0 89,622.4Principal OriginsUnited States M$ 23,959.9 36,168.7 34,125.2China M$ 6,494.3 9,549.6 10,679.2Germany M$ 3,205.5 4,435.8 4,610.6Mexico M$ 2,846.1 4,371.3 3,995.3France M$ 2,367.9 2,331.5 2,950.0
The Economy and Finance 43
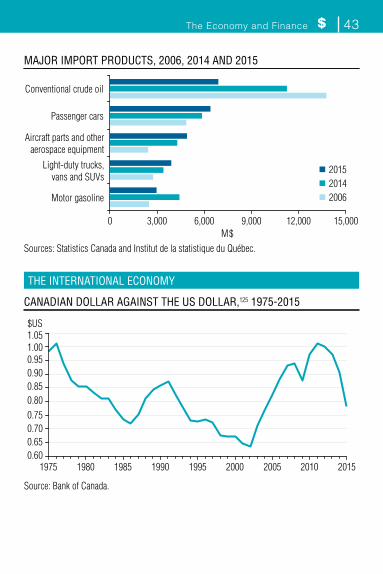
MAJOR IMPORT PRODUCTS, 2006, 2014 AND 2015
0 3,000 12,000 15,000M$
201520142006Motor gasoline
Aircraft parts and otheraerospace equipment
Light-duty trucks,vans and SUVs
Passenger cars
Conventional crude oil
9,0006,000
Sources: Statistics Canada and Institut de la statistique du Québec.
THE INTERNATIONAL ECONOMY
CANADIAN DOLLAR AGAINST THE US DOLLAR,125 1975-2015
$US
0.600.650.700.750.800.850.900.951.001.05
1975 1980 1985 1990 1995 2000 2005 2010 2015
Source: Bank of Canada.
44 The Economy and Finance
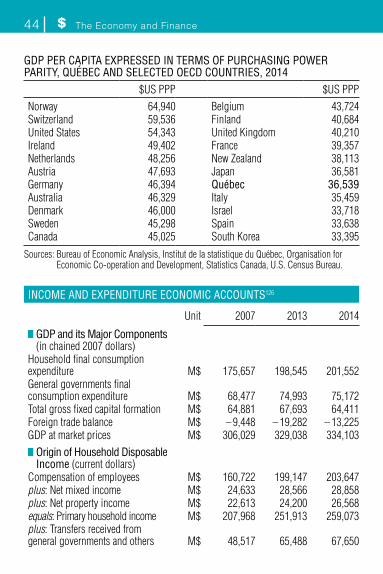
GDP PER CAPITA EXPRESSED IN TERMS OF PURCHASING POWER PARITY, QUÉBEC AND SELECTED OECD COUNTRIES, 2014
$US PPP $US PPPNorway 64,940 Belgium 43,724Switzerland 59,536 Finland 40,684United States 54,343 United Kingdom 40,210Ireland 49,402 France 39,357Netherlands 48,256 New Zealand 38,113Austria 47,693 Japan 36,581Germany 46,394 Québec 36,539Australia 46,329 Italy 35,459Denmark 46,000 Israel 33,718Sweden 45,298 Spain 33,638Canada 45,025 South Korea 33,395
Sources: Bureau of Economic Analysis, Institut de la statistique du Québec, Organisation for Economic Co-operation and Development, Statistics Canada, U.S. Census Bureau.
INCOME AND EXPENDITURE ECONOMIC ACCOUNTS126
Unit 2007 2013 2014
GDP and its Major Components (in chained 2007 dollars)
Household final consumption expenditure M$ 175,657 198,545 201,552General governments final consumption expenditure M$ 68,477 74,993 75,172Total gross fixed capital formation M$ 64,881 67,693 64,411Foreign trade balance M$ – 9,448 – 19,282 – 13,225GDP at market prices M$ 306,029 329,038 334,103 Origin of Household Disposable Income (current dollars)
Compensation of employees M$ 160,722 199,147 203,647plus: Net mixed income M$ 24,633 28,566 28,858plus: Net property income M$ 22,613 24,200 26,568equals: Primary household income M$ 207,968 251,913 259,073plus: Transfers received from general governments and others M$ 48,517 65,488 67,650
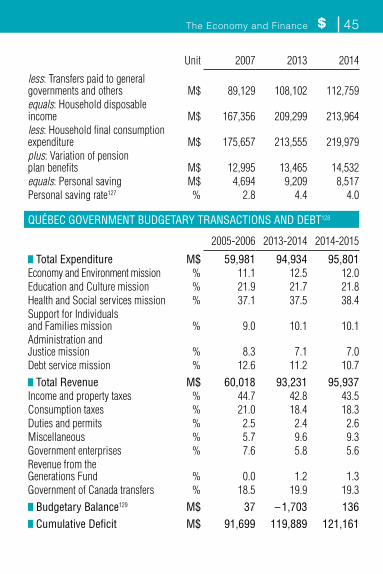
The Economy and Finance 45
Unit 2007 2013 2014
less: Transfers paid to general governments and others M$ 89,129 108,102 112,759equals: Household disposable income M$ 167,356 209,299 213,964less: Household final consumption expenditure M$ 175,657 213,555 219,979plus: Variation of pension plan benefits M$ 12,995 13,465 14,532equals: Personal saving M$ 4,694 9,209 8,517Personal saving rate127 % 2.8 4.4 4.0
QUÉBEC GOVERNMENT BUDGETARY TRANSACTIONS AND DEBT128
2005-2006 2013-2014 2014-2015
Total Expenditure M$ 59,981 94,934 95,801Economy and Environment mission % 11.1 12.5 12.0Education and Culture mission % 21.9 21.7 21.8Health and Social services mission % 37.1 37.5 38.4Support for Individuals and Families mission % 9.0 10.1 10.1Administration and Justice mission % 8.3 7.1 7.0Debt service mission % 12.6 11.2 10.7 Total Revenue M$ 60,018 93,231 95,937
Income and property taxes % 44.7 42.8 43.5Consumption taxes % 21.0 18.4 18.3Duties and permits % 2.5 2.4 2.6Miscellaneous % 5.7 9.6 9.3Government enterprises % 7.6 5.8 5.6Revenue from the Generations Fund % 0.0 1.2 1.3Government of Canada transfers % 18.5 19.9 19.3 Budgetary Balance129 M$ 37 – 1,703 136 Cumulative Deficit M$ 91,699 119,889 121,161

46 The Economy and Finance
ECONOMIC ACTIVITY BY SECTOR (NAICS)
Unit 2006 2013 2014
GDP at Basic Prices(in chained 2007 dollars)130 M$ 279,024.6 305,622.5 309,838.8Agriculture, Forestry, Fishing and Hunting M$ 4,547.1 4,817.5 4,817.7Mining, Quarrying, and Oil and Gas Extraction M$ 2,890.9 3,542.4 4,156.4Utilities M$ 10,866.1 12,886.4 12,737.5Construction M$ 16,573.7 20,953.8 20,218.7Manufacturing M$ 49,544.2 43,857.6 45,250.4Wholesale Trade M$ 15,936.0 17,572.0 17,783.5Retail Trade M$ 15,711.1 17,589.5 17,913.2Transportation and Warehousing M$ 11,876.0 12,349.5 12,798.3Information and Cultural Industries M$ 9,521.1 10,032.3 9,914.4Finance and Insurance M$ 17,210.1 18,651.9 19,097.7Real Estate and Rental and Leasing M$ 28,199.1 34,615.8 35,303.5Professional, Scientific and Technical Services M$ 14,197.8 16,474.4 16,655.9Management of Companies and Enterprises M$ 1,865.5 2,366.3 2,277.0Administrative and Support, Waste Management and Remediation Services M$ 7,419.6 8,164.1 8,348.7Educational Services M$ 16,324.7 18,215.2 18,317.2Health Care and Social Assistance M$ 22,092.9 24,341.6 24,624.6Arts, Entertainment and Recreation M$ 2,634.2 2,631.4 2,632.8Accommodation and Food Services M$ 6,325.1 6,748.8 6,738.1Other Services (except Public Administration) M$ 6,045.5 6,936.9 7,045.2Public Administration M$ 19,126.5 22,380.8 22,660.0
REGIONS AT A GLANCE
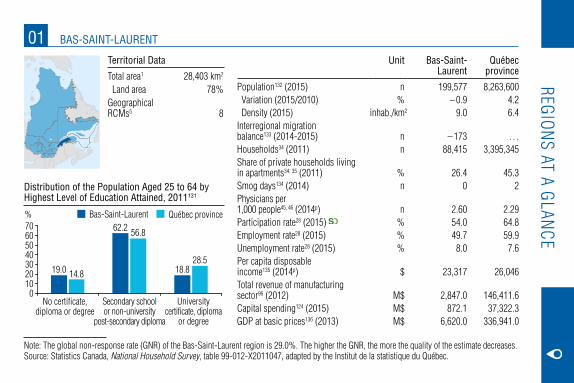
Unit Bas-Saint-Laurent
Québec province
Population132 (2015) n 199,577 8,263,600 Variation (2015/2010) % – 0.9 4.2 Density (2015) inhab./km2 9.0 6.4Interregional migration balance133 (2014-2015) n – 173 …Households34 (2011) n 88,415 3,395,345Share of private households living in apartments34, 35 (2011) % 26.4 45.3Smog days134 (2014) n 0 2Physicians per 1,000 people45, 46 (2014p) n 2.60 2.29Participation rate28 (2015) % 54.0 64.8Employment rate28 (2015) % 49.7 59.9Unemployment rate28 (2015) % 8.0 7.6Per capita disposable income135 (2014p) $ 23,317 26,046Total revenue of manufacturing sector96 (2012) M$ 2,847.0 146,411.6Capital spending124 (2015) M$ 872.1 37,322.3GDP at basic prices136 (2013) M$ 6,620.0 336,941.0
Territorial Data
Total area1 28,403 km2
Land area 78%Geographical RCMs5 8
19.0
62.2
14.8
56.8
28.518.8
010
30
50
70
No certificate,diploma or degree
Secondary schoolor non-university
post-secondary diploma
Universitycertificate, diploma
or degree
% Bas-Saint-Laurent Québec province
20
40
60
Distribution of the Population Aged 25 to 64 by Highest Level of Education Attained, 2011131
Note: The global non-response rate (GNR) of the Bas-Saint-Laurent region is 29.0%. The higher the GNR, the more the quality of the estimate decreases.Source: Statistics Canada, National Household Survey, table 99-012-X2011047, adapted by the Institut de la statistique du Québec.
01 BAS-SAINT-LAURENT
48
R
egions at a G
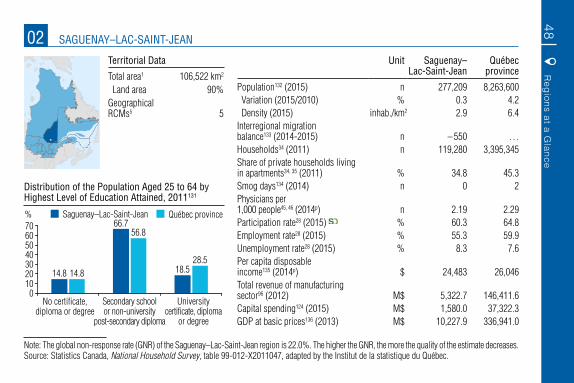
lance02 SAGUENAY–LAC-SAINT-JEAN
Unit Saguenay–Lac-Saint-Jean
Québec province
Population132 (2015) n 277,209 8,263,600 Variation (2015/2010) % 0.3 4.2 Density (2015) inhab./km2 2.9 6.4Interregional migration balance133 (2014-2015) n – 550 …Households34 (2011) n 119,280 3,395,345Share of private households living in apartments34, 35 (2011) % 34.8 45.3Smog days134 (2014) n 0 2Physicians per 1,000 people45, 46 (2014p) n 2.19 2.29Participation rate28 (2015) % 60.3 64.8Employment rate28 (2015) % 55.3 59.9Unemployment rate28 (2015) % 8.3 7.6Per capita disposable income135 (2014p) $ 24,483 26,046Total revenue of manufacturing sector96 (2012) M$ 5,322.7 146,411.6Capital spending124 (2015) M$ 1,580.0 37,322.3GDP at basic prices136 (2013) M$ 10,227.9 336,941.0
Territorial Data
Total area1 106,522 km2
Land area 90%Geographical RCMs5 5
14.8
66.7
14.8
56.8
28.518.5
010
30
50
70
No certificate,diploma or degree
Secondary schoolor non-university
post-secondary diploma
Universitycertificate, diploma
or degree
% Saguenay–Lac-Saint-Jean Québec province
20
40
60
Distribution of the Population Aged 25 to 64 by Highest Level of Education Attained, 2011131
Note: The global non-response rate (GNR) of the Saguenay–Lac-Saint-Jean region is 22.0%. The higher the GNR, the more the quality of the estimate decreases.Source: Statistics Canada, National Household Survey, table 99-012-X2011047, adapted by the Institut de la statistique du Québec.
Reg
ions at a Glance
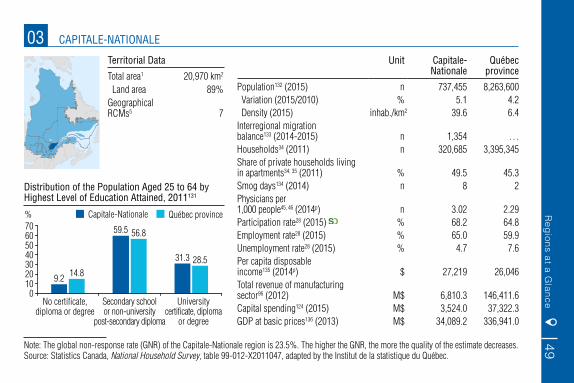
4903 CAPITALE-NATIONALE
Unit Capitale-Nationale
Québec province
Population132 (2015) n 737,455 8,263,600 Variation (2015/2010) % 5.1 4.2 Density (2015) inhab./km2 39.6 6.4Interregional migration balance133 (2014-2015) n 1,354 …Households34 (2011) n 320,685 3,395,345Share of private households living in apartments34, 35 (2011) % 49.5 45.3Smog days134 (2014) n 8 2Physicians per 1,000 people45, 46 (2014p) n 3.02 2.29Participation rate28 (2015) % 68.2 64.8Employment rate28 (2015) % 65.0 59.9Unemployment rate28 (2015) % 4.7 7.6Per capita disposable income135 (2014p) $ 27,219 26,046Total revenue of manufacturing sector96 (2012) M$ 6,810.3 146,411.6Capital spending124 (2015) M$ 3,524.0 37,322.3GDP at basic prices136 (2013) M$ 34,089.2 336,941.0
Territorial Data
Total area1 20,970 km2
Land area 89%Geographical RCMs5 7
9.2
59.5
14.8
56.8
28.531.3
010
30
50
70
No certificate,diploma or degree
Secondary schoolor non-university
post-secondary diploma
Universitycertificate, diploma
or degree
% Capitale-Nationale Québec province
20
40
60
Distribution of the Population Aged 25 to 64 by Highest Level of Education Attained, 2011131
Note: The global non-response rate (GNR) of the Capitale-Nationale region is 23.5%. The higher the GNR, the more the quality of the estimate decreases.Source: Statistics Canada, National Household Survey, table 99-012-X2011047, adapted by the Institut de la statistique du Québec.
50
R
egions at a G
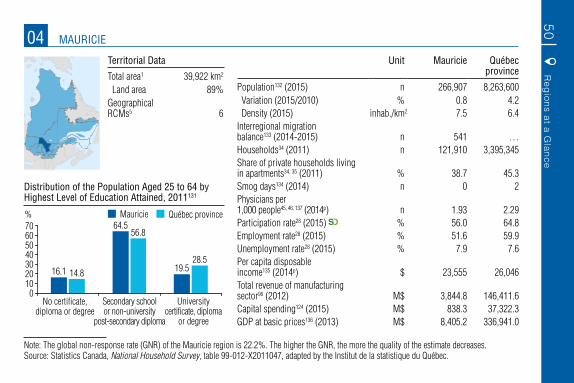
lance04 MAURICIE
Unit Mauricie Québec province
Population132 (2015) n 266,907 8,263,600 Variation (2015/2010) % 0.8 4.2 Density (2015) inhab./km2 7.5 6.4Interregional migration balance133 (2014-2015) n 541 …Households34 (2011) n 121,910 3,395,345Share of private households living in apartments34, 35 (2011) % 38.7 45.3Smog days134 (2014) n 0 2Physicians per 1,000 people45, 46, 137 (2014p) n 1.93 2.29Participation rate28 (2015) % 56.0 64.8Employment rate28 (2015) % 51.6 59.9Unemployment rate28 (2015) % 7.9 7.6Per capita disposable income135 (2014p) $ 23,555 26,046Total revenue of manufacturing sector96 (2012) M$ 3,844.8 146,411.6Capital spending124 (2015) M$ 838.3 37,322.3GDP at basic prices136 (2013) M$ 8,405.2 336,941.0
Territorial Data
Total area1 39,922 km2
Land area 89%Geographical RCMs5 6
16.1
64.5
14.8
56.8
28.519.5
010
30
50
70
No certificate,diploma or degree
Secondary schoolor non-university
post-secondary diploma
Universitycertificate, diploma
or degree
% Mauricie Québec province
20
40
60
Distribution of the Population Aged 25 to 64 by Highest Level of Education Attained, 2011131
Note: The global non-response rate (GNR) of the Mauricie region is 22.2%. The higher the GNR, the more the quality of the estimate decreases.Source: Statistics Canada, National Household Survey, table 99-012-X2011047, adapted by the Institut de la statistique du Québec.

Reg
ions at a Glance
5105 ESTRIE
Unit Estrie Québec province
Population132 (2015) n 322,099 8,263,600 Variation (2015/2010) % 3.7 4.2 Density (2015) inhab./km2 31.6 6.4Interregional migration balance133 (2014-2015) n 503 …Households34 (2011) n 137,880 3,395,345Share of private households living in apartments34, 35 (2011) % 39.2 45.3Smog days134 (2014) n 0 2Physicians per 1,000 people45, 46 (2014p) n 2.72 2.29Participation rate28 (2015) % 61.0 64.8Employment rate28 (2015) % 57.1 59.9Unemployment rate28 (2015) % 6.5 7.6Per capita disposable income135 (2014p) $ 24,443 26,046Total revenue of manufacturing sector96 (2012) M$ 6,306.1 146,411.6Capital spending124 (2015) M$ 811.8 37,322.3GDP at basic prices136 (2013) M$ 10,692.2 336,941.0
Territorial Data
Total area1 10,508 km2
Land area 97%Geographical RCMs5 7
17.4
59.5
14.8
56.8
28.523.1
010
30
50
70
No certificate,diploma or degree
Secondary schoolor non-university
post-secondary diploma
Universitycertificate, diploma
or degree
% Estrie Québec province
20
40
60
Distribution of the Population Aged 25 to 64 by Highest Level of Education Attained, 2011131
Note: The global non-response rate (GNR) of the Estrie region is 20.0%. The higher the GNR, the more the quality of the estimate decreases.Source: Statistics Canada, National Household Survey, table 99-012-X2011047, adapted by the Institut de la statistique du Québec.

52
R
egions at a G
lance06 MONTRÉAL
Unit Montréal Québec province
Population132 (2015) n 1,999,795 8,263,600 Variation (2015/2010) % 5.1 4.2 Density (2015) inhab./km2 4,015.7 6.4Interregional migration balance133 (2014-2015) n – 14,583 …Households34 (2011) n 849,445 3,395,345Share of private households living in apartments34, 35 (2011) % 80.3 45.3Smog days134 (2014) n 9 2Physicians per 1,000 people45, 46 (2014p) n 3.24 2.29Participation rate28 (2015) % 65.0 64.8Employment rate28 (2015) % 58.2 59.9Unemployment rate28 (2015) % 10.5 7.6Per capita disposable income135 (2014p) $ 26,481 26,046Total revenue of manufacturing sector96 (2012) M$ 44,674.6 146,411.6Capital spending124 (2015) M$ 11,581.6 37,322.3GDP at basic prices136 (2013) M$ 116,311.8 336,941.0
Territorial Data
Total area1 625 km2
Land area 80%Geographical RCMs5 1
12.1
44.7
14.8
56.8
28.5
43.2
010
30
50
70
No certificate,diploma or degree
Secondary schoolor non-university
post-secondary diploma
Universitycertificate, diploma
or degree
% Montréal Québec province
20
40
60
Distribution of the Population Aged 25 to 64 by Highest Level of Education Attained, 2011131
Note: The global non-response rate (GNR) of the Montréal region is 20.7%. The higher the GNR, the more the quality of the estimate decreases.Source: Statistics Canada, National Household Survey, table 99-012-X2011047, adapted by the Institut de la statistique du Québec.

Reg
ions at a Glance
5307 OUTAOUAIS
Unit Outaouais Québec province
Population132 (2015) n 385,579 8,263,600 Variation (2015/2010) % 4.8 4.2 Density (2015) inhab./km2 12.7 6.4Interregional migration balance133 (2014-2015) n 580 …Households34 (2011) n 155,595 3,395,345Share of private households living in apartments34, 35 (2011) % 30.7 45.3Smog days134 (2014) n 0 2Physicians per 1,000 people45, 46 (2014p) n 1.71 2.29Participation rate28 (2015) % 67.9 64.8Employment rate28 (2015) % 62.9 59.9Unemployment rate28 (2015) % 7.4 7.6Per capita disposable income135 (2014p) $ 25,202 26,046Total revenue of manufacturing sector96 (2012) M$ 1,207.9 146,411.6Capital spending124 (2015) M$ 923.4 37,322.3GDP at basic prices136 (2013) M$ 11,958.8 336,941.0
Territorial Data
Total area1 34,080 km2
Land area 89%Geographical RCMs5 5
15.6
54.5
14.8
56.8
28.530.0
010
30
50
70
No certificate,diploma or degree
Secondary schoolor non-university
post-secondary diploma
Universitycertificate, diploma
or degree
% Outaouais Québec province
20
40
60
Distribution of the Population Aged 25 to 64 by Highest Level of Education Attained, 2011131
Note: The global non-response rate (GNR) of the Outaouais region is 26.4%. The higher the GNR, the more the quality of the estimate decreases.Source: Statistics Canada, National Household Survey, table 99-012-X2011047, adapted by the Institut de la statistique du Québec.

54
R
egions at a G
lance08 ABITIBI-TÉMISCAMINGUE
Unit Abitibi-Témiscamingue
Québec province
Population132 (2015) n 147,700 8,263,600 Variation (2015/2010) % 1.0 4.2 Density (2015) inhab./km2 2.6 6.4Interregional migration balance133 (2014-2015) n – 539 …Households34 (2011) n 62,575 3,395,345Share of private households living in apartments34, 35 (2011) % 31.5 45.3Smog days134 (2014) n 1 2Physicians per 1,000 people45, 46 (2014p) n 2.49 2.29Participation rate28 (2015) % 63.0 64.8Employment rate28 (2015) % 58.6 59.9Unemployment rate28 (2015) % 7.0 7.6Per capita disposable income135 (2014p) $ 26,451 26,046Total revenue of manufacturing sector96 (2012) M$ 4,701.6 146,411.6Capital spending124 (2015) M$ 1,690.7 37,322.3GDP at basic prices136 (2013) M$ 6,950.8 336,941.0
Territorial Data
Total area1 64,663 km2
Land area 89%Geographical RCMs5 5
22.7
59.4
14.8
56.8
28.517.9
010
30
50
70
No certificate,diploma or degree
Secondary schoolor non-university
post-secondary diploma
Universitycertificate, diploma
or degree
% Abitibi-Témiscamingue Québec province
20
40
60
Distribution of the Population Aged 25 to 64 by Highest Level of Education Attained, 2011131
Note: The global non-response rate (GNR) of the Abitibi-Témiscamingue region is 32.8%. The higher the GNR, the more the quality of the estimate decreases.Source: Statistics Canada, National Household Survey, table 99-012-X2011047, adapted by the Institut de la statistique du Québec.

Reg
ions at a Glance
5509 CÔTE-NORD
Unit Côte-Nord Québec province
Population132 (2015) n 93,932 8,263,600 Variation (2015/2010) % – 1.7 4.2 Density (2015) inhab./km2 0.4 6.4Interregional migration balance133 (2014-2015) n – 1,339 …Households34 (2011) n 39,900 3,395,345Share of private households living in apartments34, 35 (2011) % 21.8 45.3Smog days134 (2014) n .. 2Physicians per 1,000 people45, 46 (2014p) n 2.50 2.29Participation rate28, 138 (2015) % 61.0 64.8Employment rate28, 138 (2015) % 55.1 59.9Unemployment rate28, 138 (2015) % 9.8 7.6Per capita disposable income135 (2014p) $ 26,917 26,046Total revenue of manufacturing sector96 (2012) M$ 3,277.2 146,411.6Capital spending124 (2015) M$ 2,291.2 37,322.3GDP at basic prices136 (2013) M$ 7,342.0 336,941.0
Territorial Data
Total area1, 2 351,615 km2
Land area 67%Geographical RCMs5 6
24.0
61.0
14.8
56.8
28.515.0
010
30
50
70
No certificate,diploma or degree
Secondary schoolor non-university
post-secondary diploma
Universitycertificate, diploma
or degree
% Côte-Nord Québec province
20
40
60
Distribution of the Population Aged 25 to 64 by Highest Level of Education Attained, 2011131
Note: The global non-response rate (GNR) of the Côte-Nord region is 28.1%. The higher the GNR, the more the quality of the estimate decreases.Source: Statistics Canada, National Household Survey, table 99-012-X2011047, adapted by the Institut de la statistique du Québec.

56
R
egions at a G
lance10 NORD-DU-QUÉBEC
Unit Nord-du- Québec
Québec province
Population132 (2015) n 44,769 8,263,600 Variation (2015/2010) % 5.3 4.2 Density (2015) inhab./km2 0.1 6.4Interregional migration balance133 (2014-2015) n – 151 …Households34 (2011) n 12,925 3,395,345Share of private households living in apartments34, 35 (2011) % 13.8 45.3Smog days134 (2014) n .. 2Physicians per 1,000 people45, 46 (2014p) n 3.75 2.29Participation rate28, 138 (2015) % 61.0 64.8Employment rate28, 138 (2015) % 55.1 59.9Unemployment rate28, 138 (2015) % 9.8 7.6Per capita disposable income135 (2014p) $ 23,628 26,046Total revenue of manufacturing sector96 (2012) M$ 226.8 146,411.6Capital spending124 (2015) M$ 1,821.7 37,322.3GDP at basic prices136 (2013) M$ 3,427.0 336,941.0
Territorial Data
Total area1 860,681 km2
Land area 81%Geographical RCMs5 3
37.549.2
14.8
56.8
28.5
13.3
010
30
50
70
No certificate,diploma or degree
Secondary schoolor non-university
post-secondary diploma
Universitycertificate, diploma
or degree
% Nord-du-Québec Québec province
20
40
60
Distribution of the Population Aged 25 to 64 by Highest Level of Education Attained, 2011131
Note: The global non-response rate (GNR) of the Nord-du-Québec region is 22.9%. The higher the GNR, the more the quality of the estimate decreases.Source: Statistics Canada, National Household Survey, table 99-012-X2011047, adapted by the Institut de la statistique du Québec.

Reg
ions at a Glance
5711 GASPÉSIE–ÎLES-DE-LA-MADELEINE
Unit Gaspésie–Îles- de-la-Madeleine
Québec province
Population132 (2015) n 91,786 8,263,600 Variation (2015/2010) % – 3.0 4.2 Density (2015) inhab./km2 4.5 6.4Interregional migration balance133 (2014-2015) n – 134 …Households34 (2011) n 40,975 3,395,345Share of private households living in apartments34, 35 (2011) % 14.4 45.3Smog days134 (2014) n .. 2Physicians per 1,000 people45, 46 (2014p) n 3.40 2.29Participation rate28 (2015) % 54.0 64.8Employment rate28 (2015) % 46.0 59.9Unemployment rate28 (2015) % 14.7 7.6Per capita disposable income135 (2014p) $ 23,324 26,046Total revenue of manufacturing sector96 (2012) M$ 433.9 146,411.6Capital spending124 (2015) M$ 965.6 37,322.3GDP at basic prices136 (2013) M$ 2,668.2 336,941.0
Territorial Data
Total area1 78,180 km2
Land area 26%Geographical RCMs5 6
26.7
59.5
14.8
56.8
28.513.8
010
30
50
70
No certificate,diploma or degree
Secondary schoolor non-university
post-secondary diploma
Universitycertificate, diploma
or degree
% Gaspésie–Îles-de-la-Madeleine Québec province
20
40
60
Distribution of the Population Aged 25 to 64 by Highest Level of Education Attained, 2011131
Note: The global non-response rate (GNR) of the Gaspésie–Îles-de-la-Madeleine region is 29.8%. The higher the GNR, the more the quality of the estimate decreases.Source: Statistics Canada, National Household Survey, table 99-012-X2011047, adapted by the Institut de la statistique du Québec.

58
R
egions at a G
lance12 CHAUDIÈRE-APPALACHES
Unit Chaudière- Appalaches
Québec province
Population132 (2015) n 421,832 8,263,600 Variation (2015/2010) % 2.7 4.2 Density (2015) inhab./km2 28.0 6.4Interregional migration balance133 (2014-2015) n 832 …Households34 (2011) n 173,410 3,395,345Share of private households living in apartments34, 35 (2011) % 24.1 45.3Smog days134 (2014) n 0 2Physicians per 1,000 people45, 46 (2014p) n 1.82 2.29Participation rate28 (2015) % 66.0 64.8Employment rate28 (2015) % 62.6 59.9Unemployment rate28 (2015) % 5.0 7.6Per capita disposable income135 (2014p) $ 25,218 26,046Total revenue of manufacturing sector96 (2012) M$ 18,952.7 146,411.6Capital spending124 (2015) M$ 1,582.3 37,322.3GDP at basic prices136 (2013) M$ 15,323.2 336,941.0
Territorial Data
Total area1 16,130 km2
Land area 93%Geographical RCMs5 10
16.5
63.6
14.8
56.8
28.519.9
010
30
50
70
No certificate,diploma or degree
Secondary schoolor non-university
post-secondary diploma
Universitycertificate, diploma
or degree
% Chaudière-Appalaches Québec province
20
40
60
Distribution of the Population Aged 25 to 64 by Highest Level of Education Attained, 2011131
Note: The global non-response rate (GNR) of the Chaudière-Appalaches region is 22.5%. The higher the GNR, the more the quality of the estimate decreases.Source: Statistics Canada, National Household Survey, table 99-012-X2011047, adapted by the Institut de la statistique du Québec.
Reg
ions at a Glance
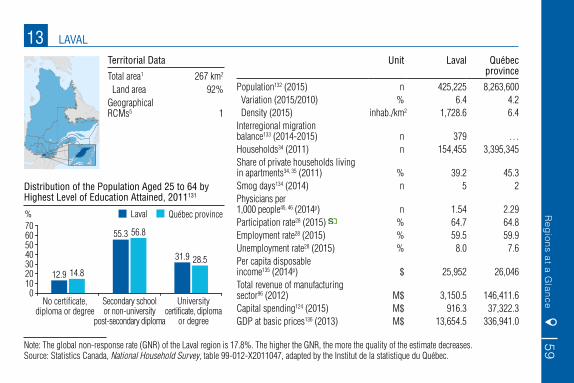
5913 LAVAL
Unit Laval Québec province
Population132 (2015) n 425,225 8,263,600 Variation (2015/2010) % 6.4 4.2 Density (2015) inhab./km2 1,728.6 6.4Interregional migration balance133 (2014-2015) n 379 …Households34 (2011) n 154,455 3,395,345Share of private households living in apartments34, 35 (2011) % 39.2 45.3Smog days134 (2014) n 5 2Physicians per 1,000 people45, 46 (2014p) n 1.54 2.29Participation rate28 (2015) % 64.7 64.8Employment rate28 (2015) % 59.5 59.9Unemployment rate28 (2015) % 8.0 7.6Per capita disposable income135 (2014p) $ 25,952 26,046Total revenue of manufacturing sector96 (2012) M$ 3,150.5 146,411.6Capital spending124 (2015) M$ 916.3 37,322.3GDP at basic prices136 (2013) M$ 13,654.5 336,941.0
Territorial Data
Total area1 267 km2
Land area 92%Geographical RCMs5 1
12.9
55.3
14.8
56.8
28.531.9
010
30
50
70
No certificate,diploma or degree
Secondary schoolor non-university
post-secondary diploma
Universitycertificate, diploma
or degree
% Laval Québec province
20
40
60
Distribution of the Population Aged 25 to 64 by Highest Level of Education Attained, 2011131
Note: The global non-response rate (GNR) of the Laval region is 17.8%. The higher the GNR, the more the quality of the estimate decreases.Source: Statistics Canada, National Household Survey, table 99-012-X2011047, adapted by the Institut de la statistique du Québec.

60
R
egions at a G
lance14 LANAUDIÈRE
Unit Lanaudière Québec province
Population132 (2015) n 496,086 8,263,600 Variation (2015/2010) % 5.6 4.2 Density (2015) inhab./km2 40.3 6.4Interregional migration balance133 (2014-2015) n 1,993 …Households34 (2011) n 190,475 3,395,345Share of private households living in apartments34, 35 (2011) % 24.5 45.3Smog days134 (2014) n 1 2Physicians per 1,000 people45, 46 (2014p) n 1.46 2.29Participation rate28 (2015) % 67.7 64.8Employment rate28 (2015) % 62.0 59.9Unemployment rate28 (2015) % 8.4 7.6Per capita disposable income135 (2014p) $ 25,420 26,046Total revenue of manufacturing sector96 (2012) M$ 4,182.3 146,411.6Capital spending124 (2015) M$ 1,016.3 37,322.3GDP at basic prices136 (2013) M$ 11,899.4 336,941.0
Territorial Data
Total area1 13,515 km2
Land area 91%Geographical RCMs5 6
17.9
64.7
14.8
56.8
28.517.4
010
30
50
70
No certificate,diploma or degree
Secondary schoolor non-university
post-secondary diploma
Universitycertificate, diploma
or degree
% Lanaudière Québec province
20
40
60
Distribution of the Population Aged 25 to 64 by Highest Level of Education Attained, 2011131
Note: The global non-response rate (GNR) of the Lanaudière region is 22.8%. The higher the GNR, the more the quality of the estimate decreases.Source: Statistics Canada, National Household Survey, table 99-012-X2011047, adapted by the Institut de la statistique du Québec.

Reg
ions at a Glance
6115 LAURENTIDES
Unit Laurentides Québec province
Population132 (2015) n 592,683 8,263,600 Variation (2015/2010) % 6.2 4.2 Density (2015) inhab./km2 28.8 6.4Interregional migration balance133 (2014-2015) n 5,068 …Households34 (2011) n 231,990 3,395,345Share of private households living in apartments34, 35 (2011) % 29.0 45.3Smog days134 (2014) n 1 2Physicians per 1,000 people45, 46 (2014p) n 1.54 2.29Participation rate28 (2015) % 67.4 64.8Employment rate28 (2015) % 63.3 59.9Unemployment rate28 (2015) % 6.1 7.6Per capita disposable income135 (2014p) $ 26,809 26,046Total revenue of manufacturing sector96 (2012) M$ 6,639.6 146,411.6Capital spending124 (2015) M$ 1,318.6 37,322.3GDP at basic prices136 (2013) M$ 18,184.9 336,941.0
Territorial Data
Total area1 22,517 km2
Land area 91%Geographical RCMs5 8
16.1
62.6
14.8
56.8
28.521.3
010
30
50
70
No certificate,diploma or degree
Secondary schoolor non-university
post-secondary diploma
Universitycertificate, diploma
or degree
% Laurentides Québec province
20
40
60
Distribution of the Population Aged 25 to 64 by Highest Level of Education Attained, 2011131
Note: The global non-response rate (GNR) of the Laurentides region is 20.1%. The higher the GNR, the more the quality of the estimate decreases.Source: Statistics Canada, National Household Survey, table 99-012-X2011047, adapted by the Institut de la statistique du Québec.

62
R
egions at a G
lance16 MONTÉRÉGIE
Unit Montérégie Québec province
Population132 (2015) n 1,520,094 8,263,600 Variation (2015/2010) % 4.6 4.2 Density (2015) inhab./km2 136.8 6.4Interregional migration balance133 (2014-2015) n 5,458 …Households34 (2011) n 594,120 3,395,345Share of private households living in apartments34, 35 (2011) % 33.9 45.3Smog days134 (2014) n 7 2Physicians per 1,000 people45, 46 (2014p) n 1.63 2.29Participation rate28 (2015) % 66.0 64.8Employment rate28 (2015) % 62.0 59.9Unemployment rate28 (2015) % 5.9 7.6Per capita disposable income135 (2014p) $ 27,246 26,046Total revenue of manufacturing sector96 (2012) M$ 27,259.6 146,411.6Capital spending124 (2015) M$ 4,824.5 37,322.3GDP at basic prices136 (2013) M$ 50,524.4 336,941.0
Territorial Data
Total area1 11,852 km2
Land area 94%Geographical RCMs5 15
14.4
59.2
14.8
56.8
28.526.4
010
30
50
70
No certificate,diploma or degree
Secondary schoolor non-university
post-secondary diploma
Universitycertificate, diploma
or degree
% Montérégie Québec province
20
40
60
Distribution of the Population Aged 25 to 64 by Highest Level of Education Attained, 2011131
Note: The global non-response rate (GNR) of the Montérégie region is 22.7%. The higher the GNR, the more the quality of the estimate decreases.Source: Statistics Canada, National Household Survey, table 99-012-X2011047, adapted by the Institut de la statistique du Québec.
Reg
ions at a Glance
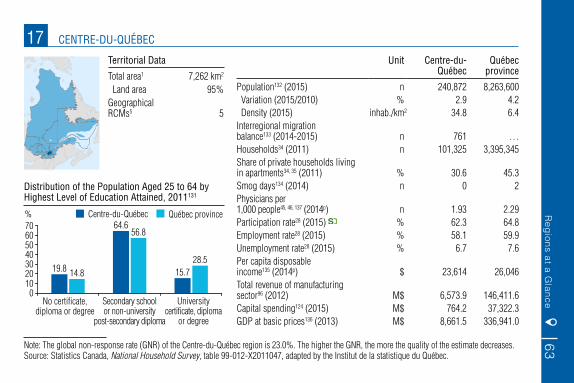
6317 CENTRE-DU-QUÉBEC
Unit Centre-du-Québec
Québec province
Population132 (2015) n 240,872 8,263,600 Variation (2015/2010) % 2.9 4.2 Density (2015) inhab./km2 34.8 6.4Interregional migration balance133 (2014-2015) n 761 …Households34 (2011) n 101,325 3,395,345Share of private households living in apartments34, 35 (2011) % 30.6 45.3Smog days134 (2014) n 0 2Physicians per 1,000 people45, 46, 137 (2014p) n 1.93 2.29Participation rate28 (2015) % 62.3 64.8Employment rate28 (2015) % 58.1 59.9Unemployment rate28 (2015) % 6.7 7.6Per capita disposable income135 (2014p) $ 23,614 26,046Total revenue of manufacturing sector96 (2012) M$ 6,573.9 146,411.6Capital spending124 (2015) M$ 764.2 37,322.3GDP at basic prices136 (2013) M$ 8,661.5 336,941.0
Territorial Data
Total area1 7,262 km2
Land area 95%Geographical RCMs5 5
19.8
64.6
14.8
56.8
28.515.7
010
30
50
70
No certificate,diploma or degree
Secondary schoolor non-university
post-secondary diploma
Universitycertificate, diploma
or degree
% Centre-du-Québec Québec province
20
40
60
Distribution of the Population Aged 25 to 64 by Highest Level of Education Attained, 2011131
Note: The global non-response rate (GNR) of the Centre-du-Québec region is 23.0%. The higher the GNR, the more the quality of the estimate decreases.Source: Statistics Canada, National Household Survey, table 99-012-X2011047, adapted by the Institut de la statistique du Québec.
SOURCES AND NOTES
1. Ministère de l’Énergie et des Ressources naturelles. The surface area is based on a compilation of data at 1/20,000 and 1/50,000 scales in the Albers Equal Area Conic map projection and the NAD83 geodesic reference system. The areas were calculated in July 2014.
2. Excluding the Newfoundland part of Labrador, according to the 1927 boundary (not final).
3. Covers the St. Lawrence River and the Gulf of St. Lawrence from the eastern tip of Île d’Orléans and is limited to the bays and mouths of the rivers along its path. Also covers the Saguenay River up to Anse-aux-Foins (Saint-Fulgence) as well as the entire coast from the north of the province to the Québec boundary.
4. Institut de la statistique du Québec, Territorial Division Directory.5. The geographical version of regional county municipalities (RCM) includes RCMs in
the legal sense and territories equivalent to an RCM, as well as Aboriginal commu-nities and northern villages located within the limits of an RCM or which constitute equivalent territories, based on geographical divisions as of December 31, 2015.
6. Environment and Climate Change Canada. From Lake Superior to the Cabot Strait.7. Québec portion only.8. Ministère du Développement durable, de l'Environnement et de la Lutte contre les
changements climatiques, Climatology. Climate normals for the 1981-2010 period.9. Ministère des Forêts, de la Faune et des Parcs, Ressources et industries forestières.
Portrait statistique.10. According to the 1998 ecological classification. The area includes the inland waters,
but excludes the St. Lawrence River below the eastern tip of Île d’Orléans.11. The forest tundra and the taiga form the sub-arctic forest.12. Considered of outstanding universal value.13. The properties are the Historic District of Old Québec (cultural heritage) and the
Miguasha National Park (natural heritage).14. Ministère du Développement durable, de l’Environnement et de la Lutte contre les
changements climatiques, Register of Protected Areas. Proportion calculated as at March 31 of the indicated year.
15. Ministère du Développement durable, de l’Environnement et de la Lutte contre les changements climatiques.
16. The generated residual materials represent the sum of the disposed and recycled quantities coming from municipal, industrial, commercial and institutional sectors (ICI), as well as from construction, renovation and demolition (CRD). Important changes were made in 2010 and in 2012 to the measuring and monitoring of Québec’s performance in residual material management. Refer to the Bilan 2010-2011 de la gestion des matières résiduelles au Québec and to the Bilan 2012 de la gestion des matières résiduelles au Québec for more information.
Sources and Notes 65
17. Institut de la statistique du Québec, Le bilan démographique du Québec, Édition 2015.18. External causes are, for example, car accidents, drownings and suicides.19. The latest available data on divorces are those of 2008. Statistics Canada terminated
this series.20. Population aged 15 and over.21. Persons living in couples include same-sex spouses. The legal marital status of a
person living common-law may be single (never legally married), separated, divorced or widowed.
22. Ministère de l’Immigration, de la Diversité et de l’Inclusion.23. The “Economic class” category includes skilled workers and business people. The
“Other immigrants” category includes post-determination refugee claimants and humanitarian cases.
24. Any comparison between the data of the 2011 Census with those of previous censuses must be made with caution.
25. Institut de la statistique du Québec. Population estimates of municipalities as at July 1, based on geographic boundaries on July 1, 2015.
26. Based on geographic boundaries on July 1, 2015. Includes local municipalities, abo-riginal territories and unorganized territories.
27. Statistics Canada, Population Censuses. A census family is composed of a married couple or two persons living common-law, with or without children, or of a lone parent living with at least one child in the same dwelling, regardless of the children’s age. Children who are living with their spouse or with one or more of their own children are not considered to be members of the census family of their parents, even if they are living in the same dwelling. They are considered as a separate census family. A couple may be of opposite or same sex.
28. Statistics Canada, Labour Force Survey (LFS), adapted by the Institut de la statis-tique du Québec. Population 15 years of age and over, with the exception of persons living on Indian reserves, full-time members of the armed forces and people living in institutions.
29. Parents between 25 and 54 years of age.30. Ministère de la Famille. Situation des centres de la petite enfance et des garderies
au Québec, Analyse des rapports d’activités, 2005-2006, Situation des centres de la petite enfance, des garderies et de la garde en milieu familial au Québec en 2012 and Situation des centres de la petite enfance, des garderies et de la garde en milieu familial au Québec en 2013. The data are on children who attended day care in March of each year (e.g.: March 2013 for the year 2012-2013).
31. Since 2006, in-home childcare has not been under the authority of childcare centres but under that of coordinating offices (in-home daycare structure), creating a break in the chronological series.
66 Sources and Notes
32. This category combines subsidized and unsubsidized day care.33. A private household refers to a person or group of persons who occupy the same
private dwelling.34. Statistics Canada, Population Censuses.35. The “Single Attached House” category is primarily comprised of semi-detached
houses and row houses. The “Apartment” category includes duplexes (stacked hou-sing) and housing located in a multi-level building regardless of the occupancy status.
36. Ministère des Affaires municipales et de l’Occupation du territoire, Évaluation foncière des municipalités du Québec and Institut de la statistique du Québec. The non-taxable land value of non-operating property and water bodies in the Municipality of Baie-James were not taken into account from 2006 to 2013.
37. Ministère du Travail, de l’Emploi et de la Solidarité sociale, Rapport statistique sur la clientèle des programmes d’assistance sociale, mars 2015. Benefits paid out to households in March of each year under the last-resort financial assistance programs (Social Assistance Program and Social Solidarity Program).
38. Statistics Canada, Canadian Community Health Survey (CCHS), 2007-2008, 2011-2012 and 2013-2014, data sharing files.
39. Includes those who perceive their health status to be good, very good or excellent.40. Includes those who perceive their mental health status to be good, very good
or excellent.41. Leisure-time physical activity indicator (LPA) developed by Bertrand Nolin (INSPQ)
and used in Québec to describe physical activity levels. The criteria used to determine the LPA are frequency, duration, intensity and type of activity.
42. The categories are defined according to body mass index (kg/m2): underweight (< 18.5), normal weight (18.5 to 24.9), overweight (25.0 to 29.9) and obese (> 30.0). Pregnant women are excluded from the analysis.
43. Institut de la statistique du Québec. Statistics Canada, Censuses. Ministère de la Santé et des Services sociaux, Death registry, Live birth registry. Compilation: Institut de santé publique du Québec.
44. Institut de la statistique du Québec, Québec Survey on Smoking, Alcohol, Drugs and Gambling in High School Students, 2006, 2008 and 2013.
45. Ministère de la Santé et des Services sociaux, Direction de la gestion intégrée de l’information et de la performance. Population data by health region are produced by the Institut de la statistique du Québec (2001-2010 estimates produced in April 2014 and 2011-2036 projections produced in November 2014). The geographical division corresponds to that in effect in April 2014.
46. The distribution of the number of health professionals by health region is esta-blished by the Régie de l'assurance maladie du Québec (table SM.18). The 2014 data are preliminary.

Sources and Notes 67
47. Database on managers and employees in the health and social services network. The calculated values are for the 12 months starting April 1 of the indicated year.
48. Fichier des établissements de santé et des services sociaux du Québec (M02). On March 31 of the indicated year, number of public and private facilities including hospi-tal centres (CHs), residential and long-term care centres (CHSLDs), local community health centres (CLSCs), rehabilitation centres (CRs) and youth centres (CJs).
49. STATÉVO database (data for 2006) and Rapport statistique annuel des centres hos-pitaliers et des centres d'hébergement et de soins de longue durée et d'activités en CLSC (AS-478, data from 2013 and 2014). Set-up beds are those that as of March 31 of the indicated year are staffed and ready to be used in public and private institutions under agreement in the socio-health network.
50. Info-Med-Écho (data from 2006 to 2013) and Statistiques sur l’hospitalisation pour soins généraux et spécialisés (data for 2014). Physical, psychiatric, and newborn care offered in general and specialized care facilities participating in the Med-Écho system, for the 12 months ending March 31 of the indicated year.
51. Régie de l’assurance maladie du Québec (table SM.03). Number of medical services rendered by physicians paid under the Québec Health Insurance Plan, excluding ser-vices paid to physicians practising outside Québec and physicians practising within the framework of laws administered by the Commission des normes, de l’équité, de la santé et de la sécurité du travail. The 2014 data are preliminary.
52. Rapport statistique annuel des centres jeunesse – Général (AS-480). Reports followed up in the 12 months ending March 31 of the indicated year, excluding data for the Nunavik (17) and Terres-Cries-de-la-Baie-James (18) regions.
53. Rapport statistique annuel des centres hospitaliers et des centres d'hébergement et de soins de longue durée et d'activités en CLSC (AS-478). Residents on March 31 of the indicated year in the CHSLDs in the network of public and private institutions under agreement having a permit from the department.
54. Canadian Institute for Health Information, National Health Expenditure Trends, 1975 to 2014. Concerns the “health” component only and does not include the “social services” component.
55. Contours financiers 2005-2006, 2012-2013 and 2013-2014. Compiled using annual financial reports, the data include administration and operating expenses and sub-sidies granted to community organizations providing home care services. Excluded are tax credits to users who purchase home care services and sums paid to social economy enterprises.
56. Statistics Canada, Canadian Centre for Justice Statistics, Police resources in Canada, 2006, 2013 and 2014.
57. Commission des normes, de l’équité, de la santé et de la sécurité du travail, Direction de l’indemnisation des victimes d’actes criminels. Rapport annuel d’activités 2007, 2013 and 2014.

68 Sources and Notes
58. Commission des services juridiques, 34e and 43e Rapport annuel de gestion.59. Ministère de l’Éducation et de l'Enseignement supérieur, Statistiques de l’éducation
and Indicateurs de l’éducation.60. Including preschool.61. Fall term. Data include resident physicians and exclude auditors, postgraduate trai-
nees and visiting students.62. College and university diplomas and degrees are tallied by calendar year (2005, 2012
and 2013); at the college level only Diplomas of College Studies (DECs) are counted, excluding non-program training.
63. Only university graduates with a bachelor’s, master’s or a doctorate degree.64. Bureau de coopération interuniversitaire. Sysper System. Full-time regular teaching
staff only.65. Institut de la statistique du Québec, Observatoire de la culture et des communications
du Québec. Ministère de la Culture et des Communications.66. Registered users of independent public libraries, affiliated libraries and the Grande
Bibliothèque.67. Includes museums, interpretation sites and exhibition centres.68. Data provided by Nielsen SoundScan Inc., and compiled by the Observatoire de la
culture et des communications du Québec.69. Statistics Canada, General Social Survey 1998, 2005 and 2010, public use microdata
files. Population aged 15 and over living in private households. For a description of the time categories used, see methodological note in the Time Use section of the ISQ website.
70. Including unpaid family workers.71. Statistics Canada, CANSIM, table 276-0020. Human Resources and Skills
Development, Monitoring and Assessment Report. Ordinary benefits as well as all other types of benefits are taken into account. The data are calculated from April to March (e.g.: from April 2013 to March 2014 for the 2014 data).
72. Statistics Canada, special compilation by the Secrétariat du travail, based on the Labour Force Survey (LFS), 2015, CANSIM, table 282-0078, excluding the agricul-tural industry.
73. Ministère du Travail, de l’Emploi et de la Solidarité sociale, Direction de l’information sur le travail.
74. The higher number of agreements signed in 2006 is due to the renewal of collective agreements in the public and parapublic sectors.
75. The reference group is composed of the bargaining units whose collective agreements govern 100 and over blue-collar employees (e.g.: workers) or 50 and over white-collar workers (e.g.: office employees).

Sources and Notes 69
76. Several Québec government collective agreements are not included in this data.77. Statistics Canada, Survey of Labour and Income Dynamics (2006) and Canadian
Income Survey (2012 and 2013). Data from 2012 and 2013 are not directly compa-rable to 2006 due to the change in survey. Individuals earning an income are those who declare earnings or another source of income.
78. One-family households with at least one child under 18 years of age.79. Includes households composed of other family types (e.g.: families including other
related persons or families whose children are all 18 years of age or older, etc.), two-or-more family households and two-or-more unrelated-person households.
80. Based on the low income measure after tax (LIM), which represents 50% of median income after tax adjusted according to the square root of household size. Calculation of median income is based on the population of individuals of all ages in Québec, where each individual is allocated their adjusted household income.
81. Commission des normes, de l'équité, de la santé et de la sécurité du travail. Minimum wage on May 1 2006, 2013 and 2014.
82. Institut de la statistique du Québec, Ministère de l’Agriculture, des Pêcheries et de l’Alimentation du Québec, Commission de protection du territoire agricole du Québec and Statistics Canada.
83. Fisheries and Oceans Canada.84. Ministère de l’Agriculture, des Pêcheries et de l’Alimentation du Québec.85. Territory where forests are managed on a time horizon of 120 years, within the sus-
tained yield principle.86. Including all land in which human activity caused a need other than forestry: roads,
right-of-way energy transport lines, etc.87. In an accessible, productive forest (slope less than 41%).88. Statistics Canada, Annual Survey of Manufactures and Logging.89. Institut de la statistique du Québec, Annual Census of Mines, Quarries and Sand
Pits and Survey of Mineral Exploration, Deposit Appraisal and Mine Complex Development Expenditures.
90. Ministère de l’Énergie et des Ressources naturelles.91. Including municipalities.92. Available electricity in accordance with a long-term contract signed by Hydro-Québec
with Churchill Falls (Labrador) Corporation Limited.93. Does not include the electricity consumed in power plants, nor the losses on trans-
portation and distribution networks.94. For each year, the result is equal to the sum of the balance of refined petroleum
products and crude oil imports.

70 Sources and Notes
95. Commission de la construction du Québec, Canada Mortgage and Housing Corporation and Statistics Canada, Building Permits, Cat. No. 64-001-X.
96. Statistics Canada, Annual Survey of Manufactures and Logging and Institut de la statistique du Québec.
97. By GDP at basic prices, expressed in 2007 chained dollars.98. Due to conceptual differences, the number of establishments of the Annual Survey
of Manufactures and Logging that appears in the table is not directly compa-rable to the number of locations in the Canadian Business Patterns, published by Statistics Canada.
99. First destination.100. Ministère des Transports, de la Mobilité durable et de l'Électrification des transports,
Rapport annuel de gestion. Commission des transports du Québec, Rapport annuel de gestion. Société de l'assurance automobile du Québec, Données et statistiques. Société des traversiers du Québec, Rapport annuel de gestion. Statistics Canada, CANSIM, table 404-0021.
101. Network under the responsibility of the Ministère des Transports, de la Mobilité durable et de l'Électrification des transports.
102. Buses used by urban, suburban and paratransit public transit agencies.103. Passengers carried by public and paratransit services.104. As at March 31 of the indicated year. Includes the owners and operators of heavy
vehicles whose address is in Québec.105. Includes trucks and road tractors.106. The distance in kilometres does not include parallel tracks, siding tracks, yard tracks,
spur tracks under 5 km long and tracks in industrial and port facilities.107. The latest available data are those of 2011. Statistics Canada terminated this series.108. Includes Canadian domestic traffic to and from Québec ports.109. Ferries operated by the Société des traversiers du Québec as well as ferries and mari-
time services operated in partnership, for the 12 months ending on March 31 of the indicated year.
110. In automotive equivalent units for crossings operated by the Société des traversiers du Québec (STQ), and in numbers for crossings operated in partnership. In 2014 and 2015, crossings operated by the STQ transported 97% of vehicles.
111. Visitors include both tourists and day-trippers. A tourist is a person who took an out-of-town trip of one night or more, but for a duration of under one year and who used commercial or private accommodation. A day-tripper is a person who took an out-of-town same-day trip to a destination of at least 40 km from home.
112. Statistics Canada, Travel Survey of Residents of Canada (TSRC) and International Travel Survey (ITS).

Sources and Notes 71
113. Statistics Canada, CANSIM, table 358-0001, Gross domestic expenditures on research and development by science type and by funder and performer sector, October 2015.
114. Statistics Canada, see source 113 and CANSIM, table 384-0038, Gross domestic product, expenditure-based, provincial and territorial (annual), November 2015.
115. Statistics Canada, CANSIM, table 358-0024, Business enterprise research and deve-lopment (BERD) characteristics, by industry group based on the North American Industry Classification System (NAICS) in Canada, April 2015 and table 358-0161, Business enterprise research and development (BERD) characteristics, by industry group based on the North American Industry Classification System (NAICS), pro-vinces and territories, April 2015.
116. Statistics Canada, Research and Development in Canadian Industry Survey, special compilation. A new imputation system developed in 2008 impacts data as of 2006. Any comparison of the number of R&D performers at the provincial level should therefore be made with caution.
117. Statistics Canada, International Trade Division. Institut de la statistique du Québec, Direction des statistiques économiques.
118. Institut de la statistique du Québec, Direction des statistiques sectorielles et du déve-loppement durable. Autorité des marchés financiers. Bank of Canada.
119. Under the new International Financial Reporting Standards (IFRS), securitized loans are reported on the balance sheets of banks and those of the Fédération, the Caisse centrale and the local Desjardins caisses for 2011. This creates a break in our statis-tical series on housing loans and non-mortgage loans to individuals.
120. Trust and mortgage loan companies not affiliated with a deposit-taking institution are excluded.
121. Investments by individuals in deposit-taking institutions, retail securities brokerage companies and holding of mutual funds in Québec.
122. The mutual funds held by securities brokerage companies are a subset of the total set of mutual funds held in Quebec.
123. Latest available data of the year.124. Statistics Canada, Annual Capital and Repair Expenditures Survey and Residential
Construction Investment. Institut de la statistique du Québec.125. Nominal quotations in terms of US dollars (yearly averages).126. Statistics Canada, Provincial and Territorial Economic Accounts. Institut de la sta-
tistique du Québec.127. Percentage of personal disposable income.128. Ministère des Finances du Québec. The data for 2005-2006 do not take into account
the 2006-2007 government accounting reform nor the line-by-line consolidation of networks.

72 Sources and Notes
129. The 2013-2014 and 2014-2015 budgetary balances do not take into account the allo-cation of $1,121 million and $1,279 million respectively to the Generations Fund and accounting changes of $418 million in 2014–2015.
130. Statistics Canada, Industry Accounts Division. The gross domestic product (GDP) at basic prices is determined using a value-added approach and expressed in 2007 chained dollars.
131. Data from the National Household Survey are not directly comparable with those of previous censuses.
132. Statistics Canada, Population estimates as at July 1.133. Institut de la statistique du Québec, Use of the insured persons registration file (FIPA)
of the Régie de l’assurance maladie du Québec.134. Ministère du Développement durable, de l’Environnement et de la Lutte contre les
changements climatiques, Direction du suivi de l’état de l’environnement. Days where the hourly concentrations of pollutants exceed 35 µg/m3 (3-hour moving average) for fine particles or 82 parts per billion for ozone during at least three consecutive hours.
135. Institut de la statistique du Québec, Direction des statistiques sectorielles et du déve-loppement durable.
136. Institut de la statistique du Québec, Statistics Canada, Ministère des Affaires muni-cipales et de l’Occupation du territoire, Fisheries and Oceans Canada and Revenu Québec. The Québec total is from Statistics Canada, Gross Domestic Product by Industry, CANSIM, table 379-0030, November 2014.
137. Figure for the Mauricie and Centre-du-Québec regions.138. Figure for the Côte-Nord and Nord-du-Québec regions.

Québec Handy Numbers, 2016 Edition was produced by the Institut de la statistique du Québec in collaboration with over 50 experts in statistics.
This booklet features statistical tables and charts on several aspects of Québec society: territory, population, living conditions, the economy and finance. Users will appreciate the convenient format of this source of essential information.
“ The Institut de la statistique du Québec is the government agency responsible for producing, analysing and disseminating official, objective and quality statistical information for Québec. This information enhances knowledge, enlightens debate and supports decision making by the various players in Québec society.”
www.stat.gouv.qc.ca
Statistics on the Québec of yesterday and today for the Québec of tomorrow