questionnaires, surveys, talented students, …
TRANSCRIPT
DOCUMENT RESUME
ED 022 462By-Baird Leonard L.; Holland, John L.THE FLOW OF HIGH SCHOOL STUDENTS TO SCHOOLS, COLLEGES, AND JOBS.American College Testing Program, Iowa City, Iowa. Research and Development Div.Repor t No- ACT -RR-26Pub Date Jun 68Note-30p.EDRS Price MF-$025 HC-$1.28Descriptors-ACHIEVEMENT TESTS, *FOLLOWUP STUDIES, *JUNIOR COLLEGES, MEASUREMENT INSTRUMENTS,QUESTIONNAIRES, SURVEYS, TALENTED STUDENTS, *TALENT IDENTIFICATION, *TESTING
A sample of students was followed from high school senior status to theireducational or vocational situation one year later. The data were taken mainly from5,508 completed questionnaires. Most of the students were attending 4-year or luniorcolleges, while the rest were in trade, business, or nursing schools, were workingfull-time, or were in military service. When student groups were compared on divergent,multiple measures of academic and nonacademic potential, the distribution of studentsto training institutions or jobs was found to be based primarily on academic ratherthan on nonacademic dimensions of talent. The aspirations of students were generallyin agreement with their educational or vocational outcomes. Implications of the resultsfor the assessment of "talent loss" are discussed. (Author/HH)
JC 680 336
S ACT
.4
4.l *7%-?
.;
-
.j
JL
/
'-
- '*.' iI
'j *:t
i
-S 4'J. , - .sfr.,
Pl ..'S, IJ.fr //k b'*4
fr' 1.-. - . '.\ '
'.55' 4". ' .c
4 -,
-"ii'.. ¼'r-' ,- .3"4
S...';. 4\W5k .4
--".5 -.
. '-'-,'
- ''ll5 "\43*I'"
S.' 5'S4\ ki7
'S 55.'5 4 '4,.-4t-c
,
:'.
"S S
'- ,,
/5. S. S'.' 'sI'?S.-'
-+JjjS.
\
N
4 --S 74 5\,::i.,4:.S.
sS45
EPO.T ;;;cf
S ' ,
.55
5
I_S. 554
%s S;-;- 1(
.4-
\O IC)
i/2i±S:
I
: . _.; ,/1/I
,'
,;_ ' S
S_.Sr4 ' S
'S_-4_'' S S'- . S.
,
'5
4
S '
S.' -' :'. '
____ :
*5S:
,
'S'S,'
I I.-(- &' .
.4 .,.S . ;5 t ...I,
24 ;7 - - -;/1/
______________________ ,
/5 5,.
______________________ I '
':
\4_i )tI, '' ,
.. S. -P4'S.
.:' ' .
-.4/S.:StS.,r;:Sk? :
''jmr
S1I
,1ii:jiJ-S:-'-. :;5'..:.(
S_________________________ 1.. ' -II - (. - ' - 4- ,- J- /i.-4. \\- s' -, - -S- S 5
S /t '' ' S- 'j' 5,
; L;=:i:; /S -.tc .
4. .S. S.'t 5 5.' S S' ' 5
-4;., '
_______________________ * 'S. S;S.SS* ,
*
S
4,SSS.%
'S.-V
(
-;
* #.; , 4
______ S 9 d-- . - S '
Jr1:;
S S 555 5.r .4
- S S.i4'- ''* S ,S Ss
-
S
a/ t
: 3 ':r5 'zS\
_f' 4--,, ' s/S ,
S 55 ;-------- *. S.
S. tI5.S-5 .
cQ) r U
5,
5dI1c-
-v *
Summary
A sample of students was followed from high school senior status
to their educational or vocational situation one year later. The majority
of students were attending four-year or junior colleges, while smaller
numbers of students were in trade or business scLools, nursing schools,
working full time, or in the military service. When student groups were
compared on measures of academic and nonacademic potential, the dis-
tribution of students to training institutions or jobs was found to be based
primarily on academic rather than nonacademic dimensions of talents.
The aspirations of students were generally congruent with their education-
al or vocational outcomes. Some implications of the results for the assess-
ment of "talent loss" are discussed.
ONIVERSITY OF CALIF.
LOS ANGELES
JUL (,) 1968
CLLhfiiNGHOUSE FOR
JUNIOR COLLEGE
INFORMATION
The Flow of High School Students to Schools, Colleges, and Jobs:
A Reexamination of Some Old Questions by the Use of Multiple Indices
of Talent Rather than by a Single Academic Index
Leonard L. Baird and John L. Ho- ad
American College Testing Program
Although the terms "talent" and "talent loss" can be variously de-
fined, educators and social scientists customarily define "talent" in
terms of a single dimension--academic aptitude-:-usually measured by
school grades or academic aptitude test scores. Those students scoring
above a certain level are "talented," while the others, by implication,
are "untalented." And "talent loss" is the percentage of "talented"
students who fail to attend college.1 This kind of definition appears emi-
nently practical at first glance, but the practical advantages of definitions
based on academic measures clo not justify their current popularity. Ac-
ademic measures are not efficient forecasters of a great range of talented
performance. At best, the only talented performance they predict well is
academic performance.2 Estimating talent loss with academic measures
is analogous to fishing with a hook that will catch only a single species.
For the assessment of human talent, a variety of hooks is needed to secure
'For a more complete discussion of the definitions of "talent" and
"talent loss" see Holland and Astin (1962).
2Holland and Richards (1967a) recently summarized some of the
pertinent evidence.
4
-2-
the variety of human talents.
In this study, we examined the movement of high school students
to schools, colleges, and jobs by multiple measures of talent rather than
by academic measures alone. From our past work, we expected to find
that the use of divergent, multiple measures of talent would reveal dif-
ferent and more informative estimates than academic measures alone of
how talented stude :its distribute themselves (and are distributed by other
persons, institutions, and businesses). Consequently, we followed a large
group of high school students from high school to their educational or vo-
cational situations one year later.
Method
Initial assessment devices. All the students in the sample took the
ACT Assessment as part of the ACT program. The ACT Assessment in-
cludes reports of high school grades and tests of academic aptitude. The
test scores for each student are converted to ACT standard scores with a
mean of 20 and a standara deviation of 5, based on college-bound high school
seniors (American College Testing Program, 1965).
The ACT Assessment also includes the Student Profile Section. In
this section, the student reports his expectations concerning work, housing,
and extracurricular participation in college, his reasons for choice of col-
lege, his family background, his choice of major and vocation, his degree
plans, and his nonacademic achievements. Scales of high school nonaca-
demic achievements yield scores in science, art, leadership, writing,
music, and drama. Students with high scores presumably have attained a
high level of accomplishment re
3-
quiring complex skills, long term persist-
ence, or originality. These nonacademic accomplishment scales have been
found to have useful reliabil.
Richards, Holland; & Lutz
ty and validity (ACT Technical Manual, 1965;
, 1967.)
Follow-up questionnaire. The follow-up instrument was a one-page
questionnaire which inc
had attended since le
Other questions ask
reasons for doing
source of financ
fulltime job we
Those who h
and their r
Stat
luded questions about the kinds of schools students
ving high school, student status, and work status.
ed the students who had dropped out of college their
so. Students in college were asked to indicate their
ial support while they were in school. Those who had a
re asked what type of job it was and how well they liked it.
d never attended college were asked if they had wanted to go
eason for not going.
istics. In order to test for differences between the students with
different educational or vocational outcomes, one-way analyses of variance
were
In or
the
used when appropriate following procedures outlined in Winer (1962).
der to assess the strength of the association between the outcomes and
other variable, we also computed omega squared (to2), a statistic de-
eloped by Hays (1963) which is similar to the intraclass correlation
coefficient. This statistic estimates the proportion of variance in a depend-
ent variable accounted for by the independent variable. It provides an esti-
mate of the investigator's power to predict one variable from another.
Student Sample
The sample of students was taken from a tape of a three percent
random sample of all high school seniors who took the ACT tests on nation-
al test dates between November, 1965 and February, 1966 (1\T535, 000).
For the purposes of this study, the records of every other senior on the ACT
tape were taken (N=8, 433). In the fall of 1966, follow-up questionnaires
were mailed to the last current address of these 'students, and 5,508 of the
questionnaires were completed and returned. The data for students filling
out the follow-up questionnaire were merged on a tape with the data collected
in their senior year.
To determine whether our procedure resulted in a biased sample,
we compared students who had completed the follow-up questionnaire with
those who had not on measures from the ACT battery and Student Profile
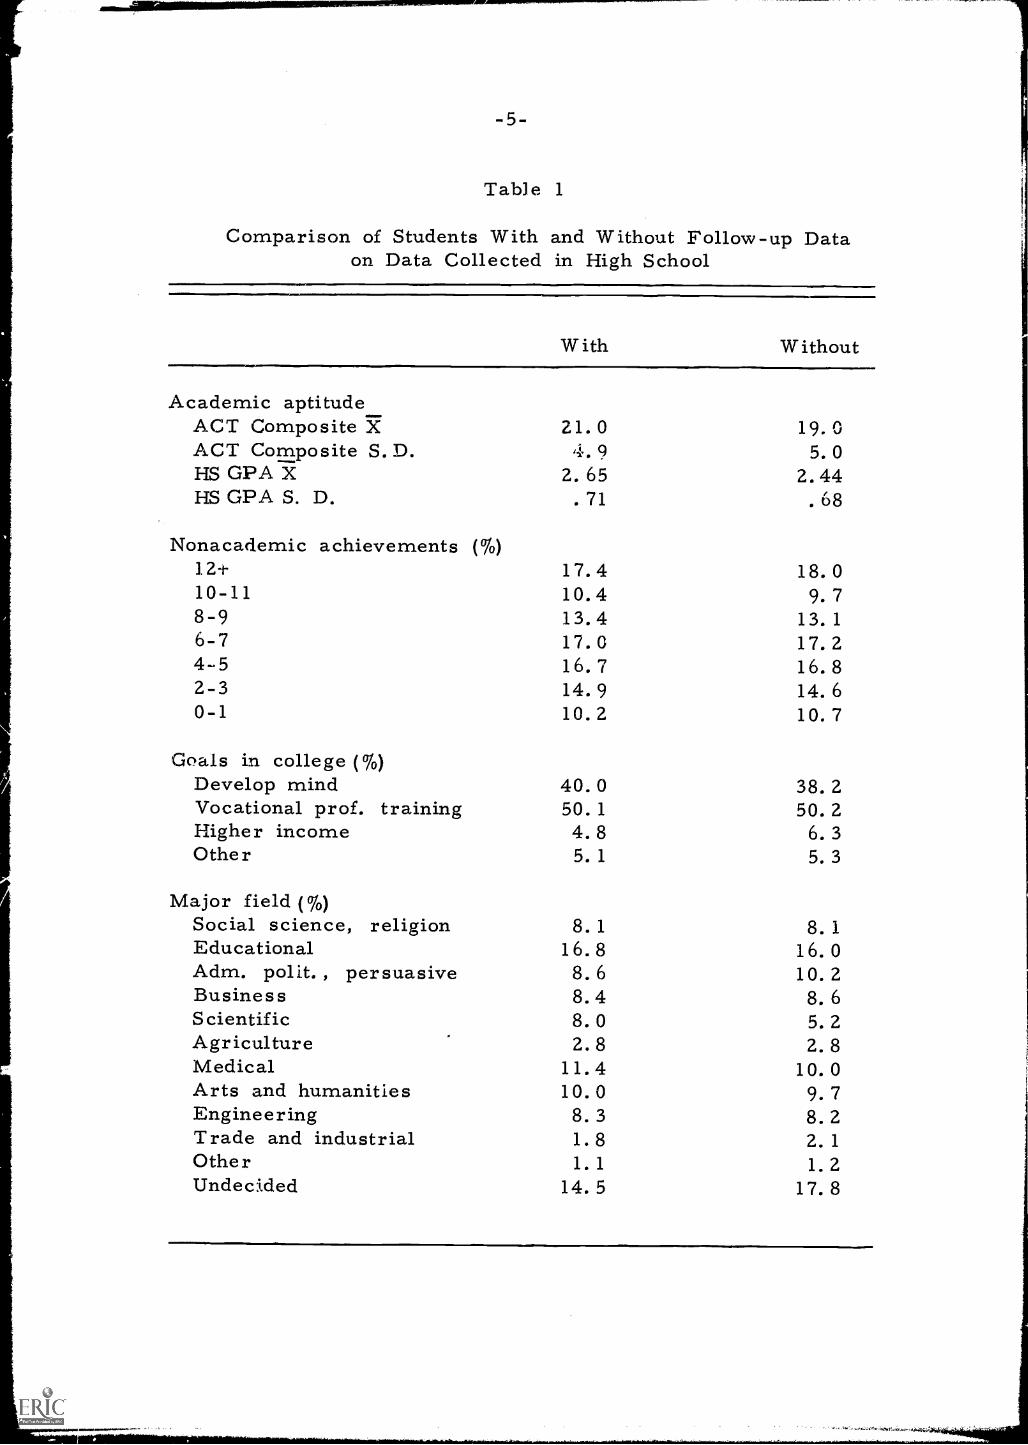
Section. Some of these comparisons are shown in Table 1. Students with-
out follow-up data had somewhat lower ACT scores and high school grades,
but the two groups did not differ in number of nonacademic achievements,
goals in attending college, or anticipated major field. The two groups were
also similar in terms of educational degree sought, expectations concerning
transportation and residence in college, planned activities, reasons for
college choice, and family background.
Although the data indicate that students with follow-up and those with-
out were similar on input measures (except for some differences in acadern-
ic aptitude), we also needed to know if the two groups of students had dif-
ferent educatiGaal and vocational outcomes a year later. For this reason,
a telephone survey of every tenth nonrespondent was conducted. We were
able to obtain information for 186 of the 340 students in this 10% sample.
1
-5-
Table 1
Comparison of Students With and Without Follow-up Dataon Data Collected in High School
With Without
Academic aptitude_ACT Composite XACT Composite S. D.HS GPA XHS GPA S. D.
Nonacademic achievements
21. 04. 9
2. 65. 71
(%)
19. 05. 0
2. 44. 68
12t 17. 4 18. 010-11 10. 4 9. 78-9 13. 4 13. 1
6-7 17. 0 17. 24-5 16. 7 16. 82-3 14. 9 14. 60-1 10. 2 10. 7
Goals in college (%)Develop mind 40. 0 38. 2Vocational prof. training 50. 1 50. 2Higher income 4. 8 6. 3Othe r 5. 1 5. 3
Major field (%)Social science, religion 8. 1 8. 1
Educational 16. 8 16. 0Adm. polit. , persuasive 8. 6 10. 2Business 8. 4 8. 6Scientific 8. 0 5. 2Agriculture 2. 8 2. 8Medical 11. 4 10. 0Arts and humanities 10. 0 9. 7Engineering 8. 3 8. 2Trade and industrial 1. 8 2. 1
Other 1. 1 1. 2Undecided 14. 5 17. 8
- 6 -
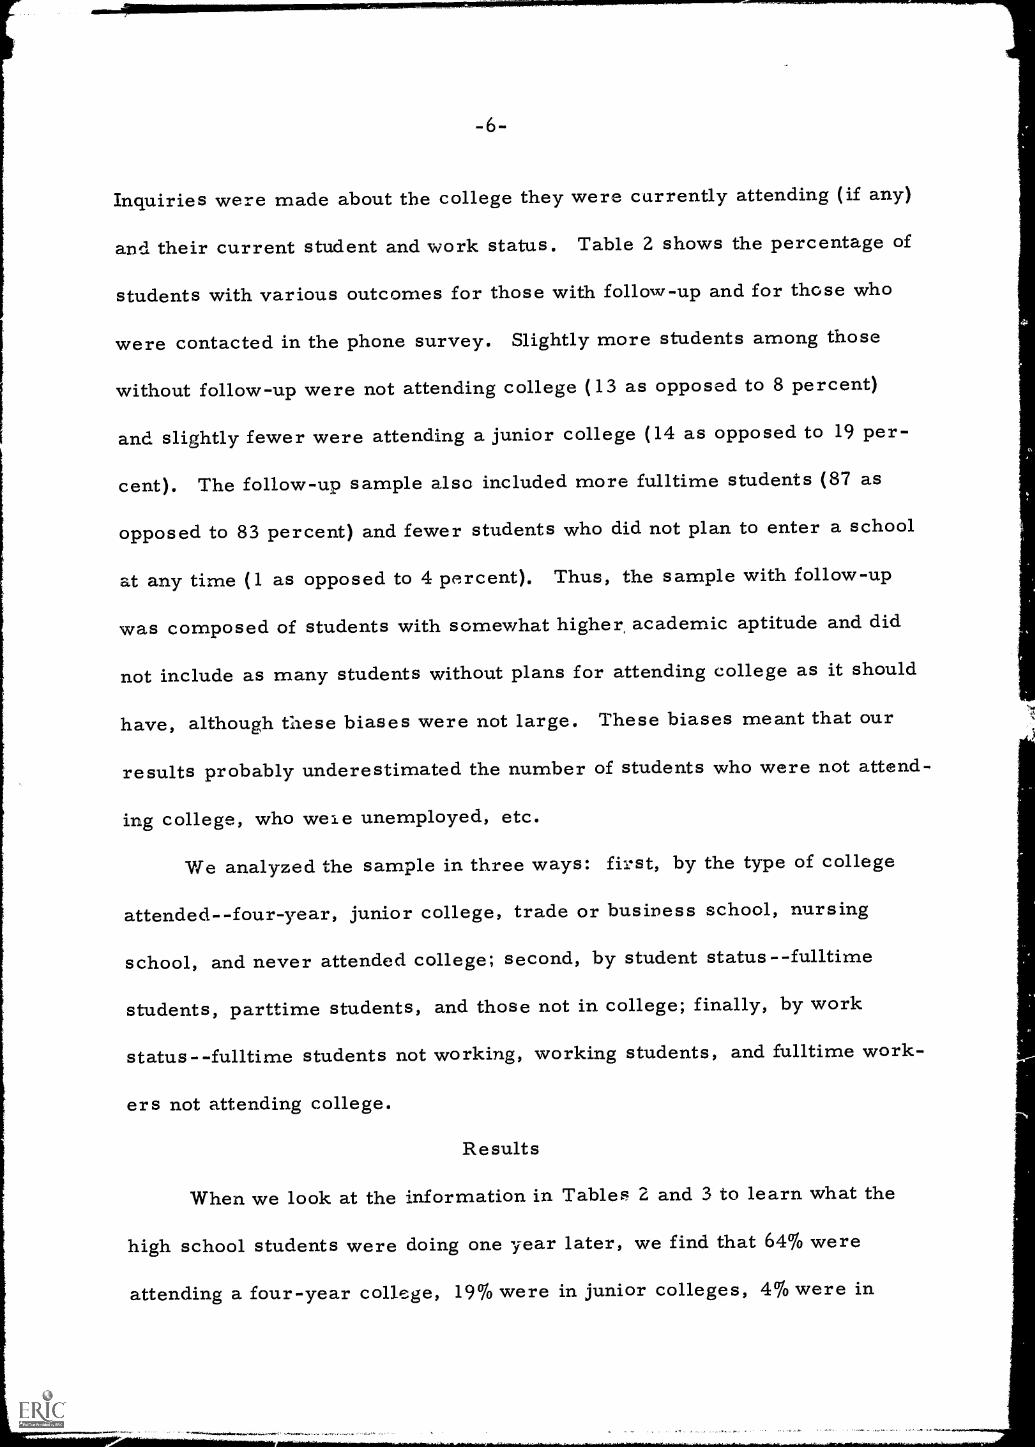
Inquiries were made about the college they were currently attending (if any)
and their current student and work status. Table 2 shows the percentage of
students with various outcomes for those with follow-up and for those who
were contacted in the phone survey. Slightly more students among those
without follow-up were not attending college (13 as opposed to 8 percent)
and slightly fewer were attending a junior college (14 as opposed to 19 per-
cent). The follow-up sample also included more fulltime students (87 as
opposed to 83 percent) and fewer students who did not plan to enter a school
at any time (1 as opposed to 4 percent). Thus, the sample with follow-up
was composed of students with somewhat higher, academic aptitude and did
not include as many students without plans for attending college as it should
have, although these biases were not large. These biases meant that our
results probably underestimated the number of students who were not attend-
ing college, who weie unemployed, etc.
We analyzed the sample in three ways: first, by the type of college
attended--four-year, junior college, trade or business school, nursing
school, and never attended college; second, by student statusfulltime
students, parttime students, and those not in college; finally, by work
status--fulltime students not working, working students, and fulltime work-
ers not attending college.
Results
When we look at the information in Tables Z and 3 to learn what the
high school students were doing one year later, we find that 64% were
attending a four-year college, 19% were in junior colleges, 4% were in
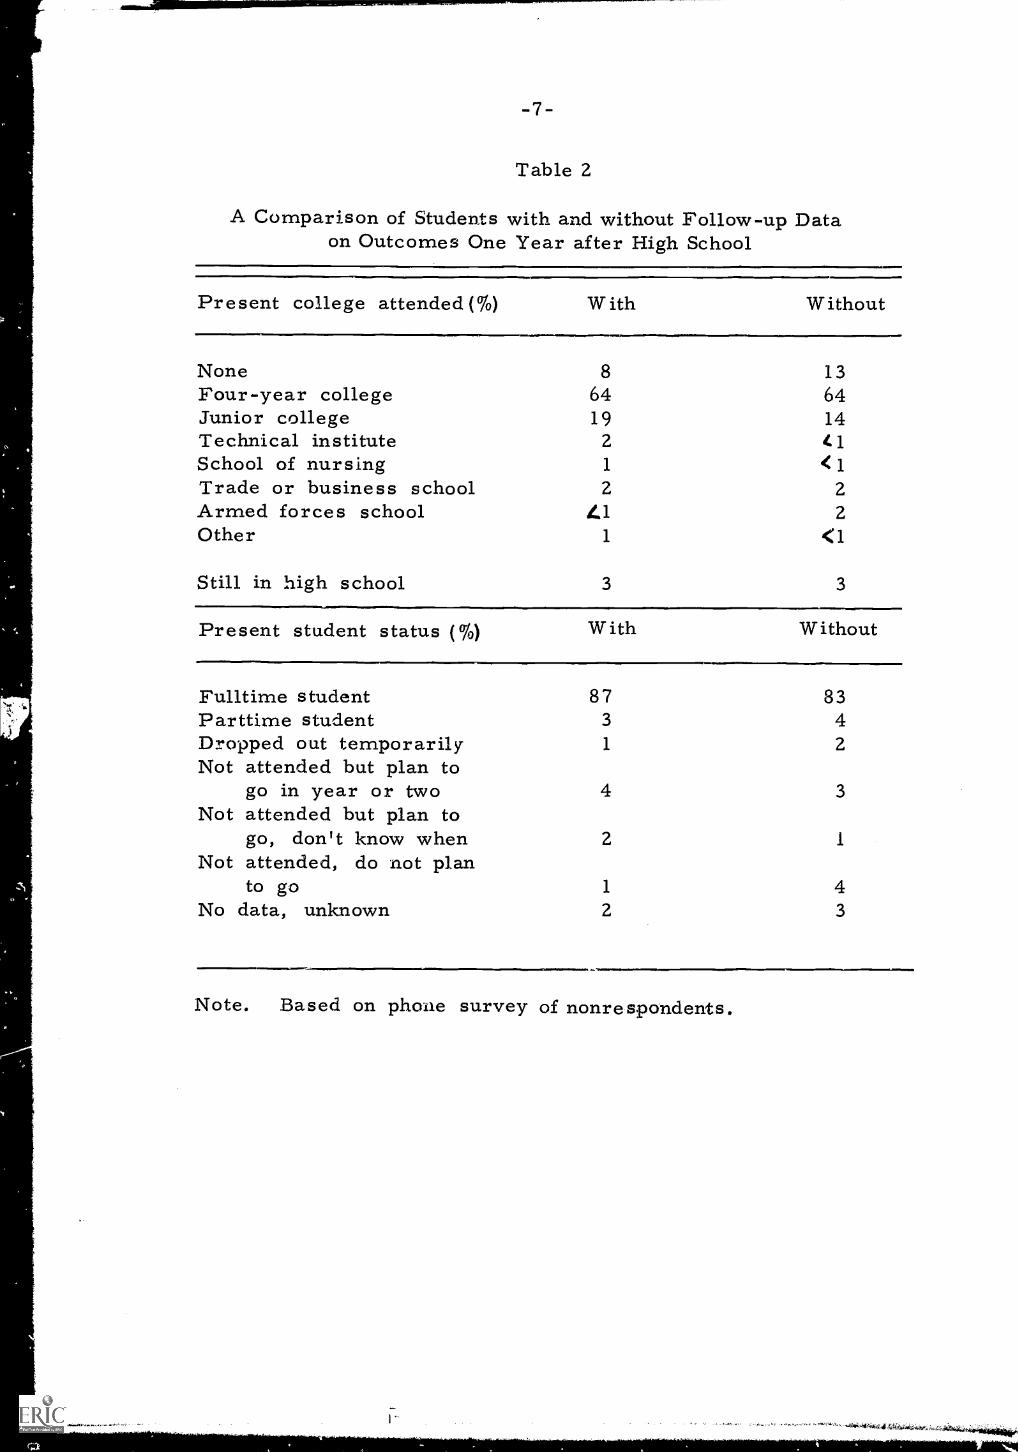
Table 2
A Comparison of Students with and without Follow-up Dataon Outcomes One Year after High School
Present college attended(%) W ith Without
None 8 13Four-year college 64 64Junior college 19 14Technical institute 2 41School of nursing 1 <1Trade or business school 2 2Armed forces school 1.1 2Other 1 <1
Still in high school 3 3
Present student status (%) With Without
Fulltime student 87 83Parttime student 3 4Dropped out temporarily 1 2Not attended but plan to
go in year or two 4 3Not attended but plan to
go, don't know when 2 1
Not attended, do not planto go 1 4
No data, unknown 2 3
Note. Based on phone survey of nonrespondents.
-8-
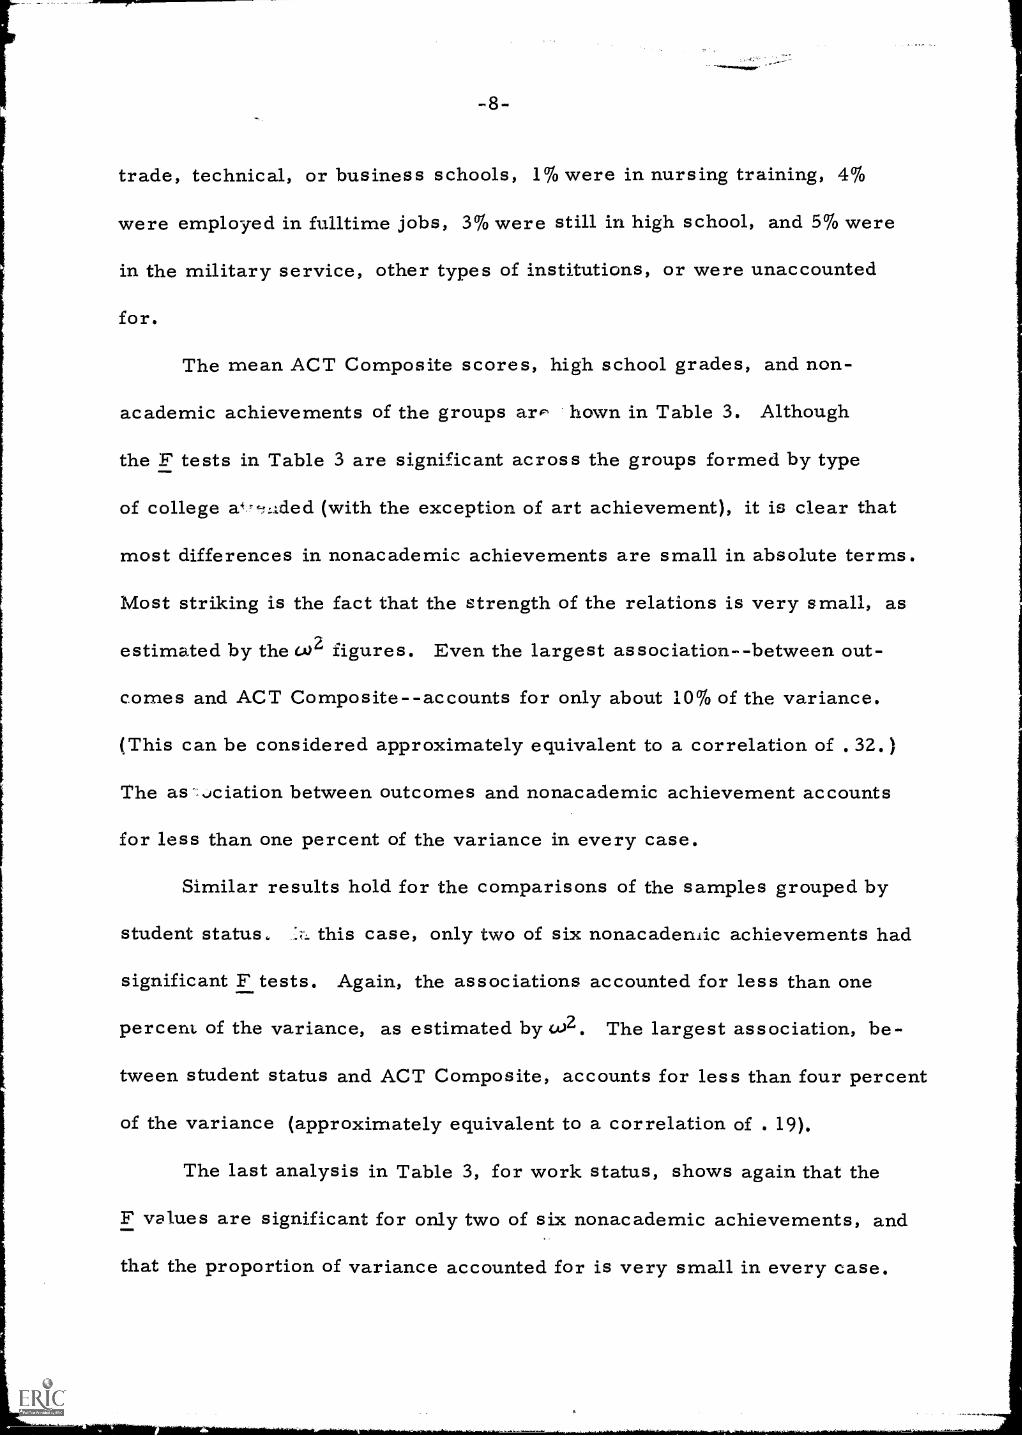
trade, technical, or business schools, 1% were in nursing training, 4%
were employed in fulltime jobs, 3% were still in high school, and 5% were
in the military service, other types of institutions, or were unaccounted
for.
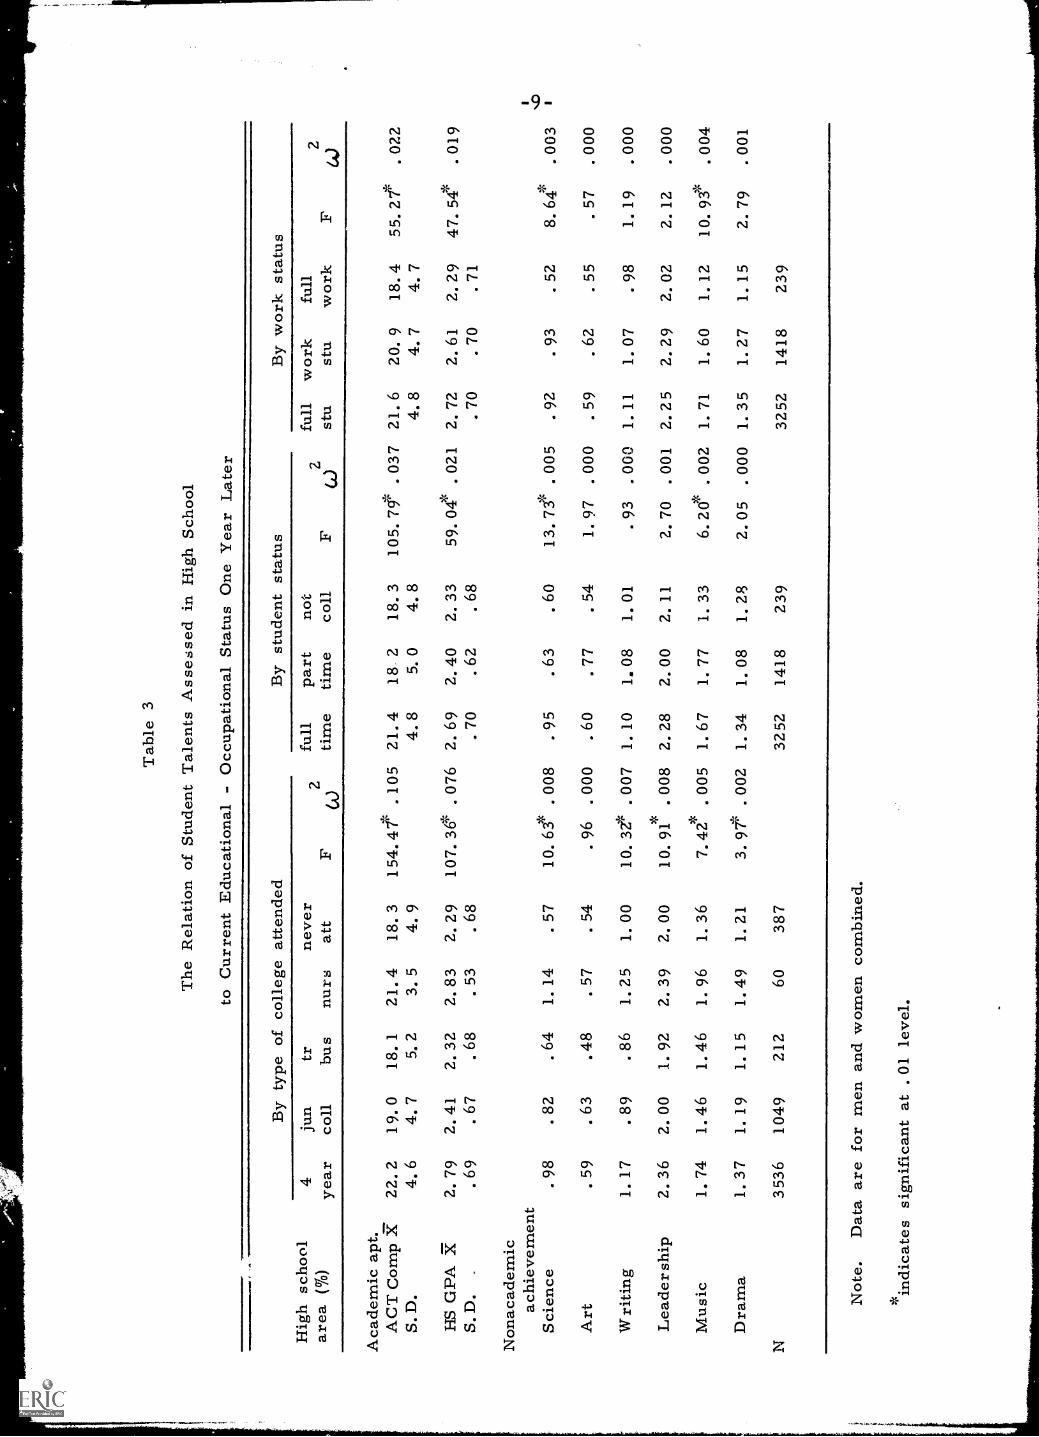
The mean ACT Composite scores, high school grades, and non-
academic achievements of the groups arr, hown in Table 3. Although
the F tests in Table 3 are significant across the groups formed by type
of college a4 -%tded (with the exception of art achievement), it is clear that
most differences in nonacademic achievements are small in absolute terms.
Most striking is the fact that the strength of the relations is very small, as
estimated by the 0/2 figures. Even the largest association--between out-
comes and ACT Composite--accounts for only about 10% of the variance.
(This can be considered approximately equivalent to a correlation of .32.)
The as. ,Jciation between outcomes and nonacademic achievement accounts
for less than one percent of the variance in every case.
Similar results hold for the comparisons of the samples grouped by
student status, this case, only two of six nonacademic achievements had
significant F tests. Again, the associations accounted for less than one
percent of the variance, as estimated by co2. The largest association, be-
tween student status and ACT Composite, accounts for less than four percent
of the variance (approximately equivalent to a correlation of . 19).
The last analysis in Table 3, for work status, shows again that the
F values are significant for only two of six nonacademic achievements, and
that the proportion of variance accounted for is very small in every case.
Tab
le 3
The
Rel
atio
n of
Stu
dent
Tal
ents
Ass
esse
d in
Hig
h Sc
hool
to C
urre
nt E
duca
tiona
l - O
ccup
atio
nal S
tatu
s O
ne Y
ear
Lat
er
Hig
h sc
hool
area
(%
)
By
type
of
colle
ge a
ttend
edB
y st
uden
t sta
tus
By
wor
k st
atus
4ye
arju
nco
lltr bu
snu
rsne
ver
att
(A)
full
time
part
time
not
coll
full
stu
wor
kst
ufu
llw
ork
(A.)
Aca
dem
ic a
pt.
AC
T C
omp
ff22
. 219
. 018
. 121
. 418
. 315
4..
105
21. 4
18 2
18. 3
105.
75*
.03
721
. 620
. 918
. 455
. 2,r
.02
2S.
D.
4. 6
4. 7
5. 2
3. 5
4. 9
4. 8
5. 0
4. 8
4. 8
4. 7
4. 7
HS
GPA
X2.
79
2. 4
12.
32
2. 8
32.
29
107.
36*
.07
62.
69
2. 4
02.
33
59. O
LP
.02
12.
72
2. 6
12.
29
47. 5
4*. 0
19S.
D.
.69
.67
.68
.53
.68
.70
.62
.68
.70
.70
.71
Non
acad
emic
achi
evem
ent
Scie
nce
.98
.82
.64
1. 1
4.
5710
. 63*
.00
8. 9
5.
63.
6013
. 73*
.00
5. 9
2. 9
3.
528.
6zi
14.
003
Art
.59
.63
.48
.57
.54
.96
.00
0.
60.
77.
541.
97
.00
0. 5
9.
62.
55.
57.
000
Wri
ting
1. 1
7. 8
9.
861.
25
1. 0
010
. 3e
.00
71.
10
1. 0
81.
01
. 93
.00
01.
11
1. 0
7. 9
81.
19
.00
0
Lea
ders
hip
2. 3
62.
00
1. 9
22.
39
2. 0
010
. 91
.00
82.
28
2. 0
02.
11
2. 7
0.
001
2. 2
52.
29
2. 0
22.
12
.00
0
Mus
ic1.
74
1. 4
61.
46
1. 9
61.
36
7.42
*.
005
1. 6
71.
77
1. 3
36.
206
.00
21.
71
1. 6
01.
12
10. 9
?.
004
Dra
ma
1.37
1.19
1.15
1.49
1.21
3. 9
t..
002
1. 3
41.
08
1. 2
82.
05
.00
01.
35
1. 2
71.
15
2. 7
9.
001
N35
3610
4921
260
387
3252
1418
239
3252
1418
239
.6N
ote.
Dat
a ar
e fo
r m
en a
nd w
omen
com
bine
d.
*ind
icat
essi
gnif
ican
t at .
01
leve
l.
-10-
In short, the estimates of student academic potential (grades and ACT
scores) in high school shown in Table 3 appeared consistent with the
distribution of student outcomes; that is, the four-year college students
had the highest average ACT scores and high school grades and the stu-
dents belonging to other gvoups had lower academic potentials. In con-
trast, the estimates of nonacademic talents revealed that four-year
college students generally differed in only minor ways from students of
junior colleges, trade and business schools, nursing schorls, and non-
attenders. This pattern of results is strong evidence that the distribu-
tion of students to training institutions proceeds primarily along academic
rather than nonacademic dimensions of talent.
In spite of some differences, the amount of overlap was great, as
demonstrated in some comparisons of fulltime students and those who
were not in college. In Table 3, the rate of achievement was approxi-
mately the same in most areas of nonacademic achievement. Even in
the case of academic aptitude, the overlap was fairly large. While 64%
of the fulltime students had ACT Composite scores of 20 or above, 40%
of those who were not in college had scores of 20 or above. This result,
along with other findings, implies that self-selection and institutional
selection processes generally distribute people in appropriate schools or
jobs in only an approximate or inefficient way; that is, many "talented"
people do not go to college, and some "untalented" people do. This out-
come can be seen more clearly by comparing the college attendance pat-
terns of the students in the top 15% of academic aptitude (26 or above on
the ACT Composite) with the attendance patterns of the top 15% of nonaca-
demic achievers (12 or more achievements). The top 15% of nonacademic
achievers were more than twice as likely to be nonattenders than the top
15% of academic achievers. While the figures in this case are small
(5.1% of the nonacadernic achievers not in college compared to 2.1% of
the academic achievers), the difference gains importance if we assume
that our sample roughly represents the thousands of students not in col-
lege. 3 This finding suggests that many students with high potentials for
nonacademic achievements do not go on to college. To summarize, stu-
dents distribute themselves and are distributed so that their aspirations
and their academic and nonacademic potentials are only loosely congruent
with the demands of their educational or vocational situation.
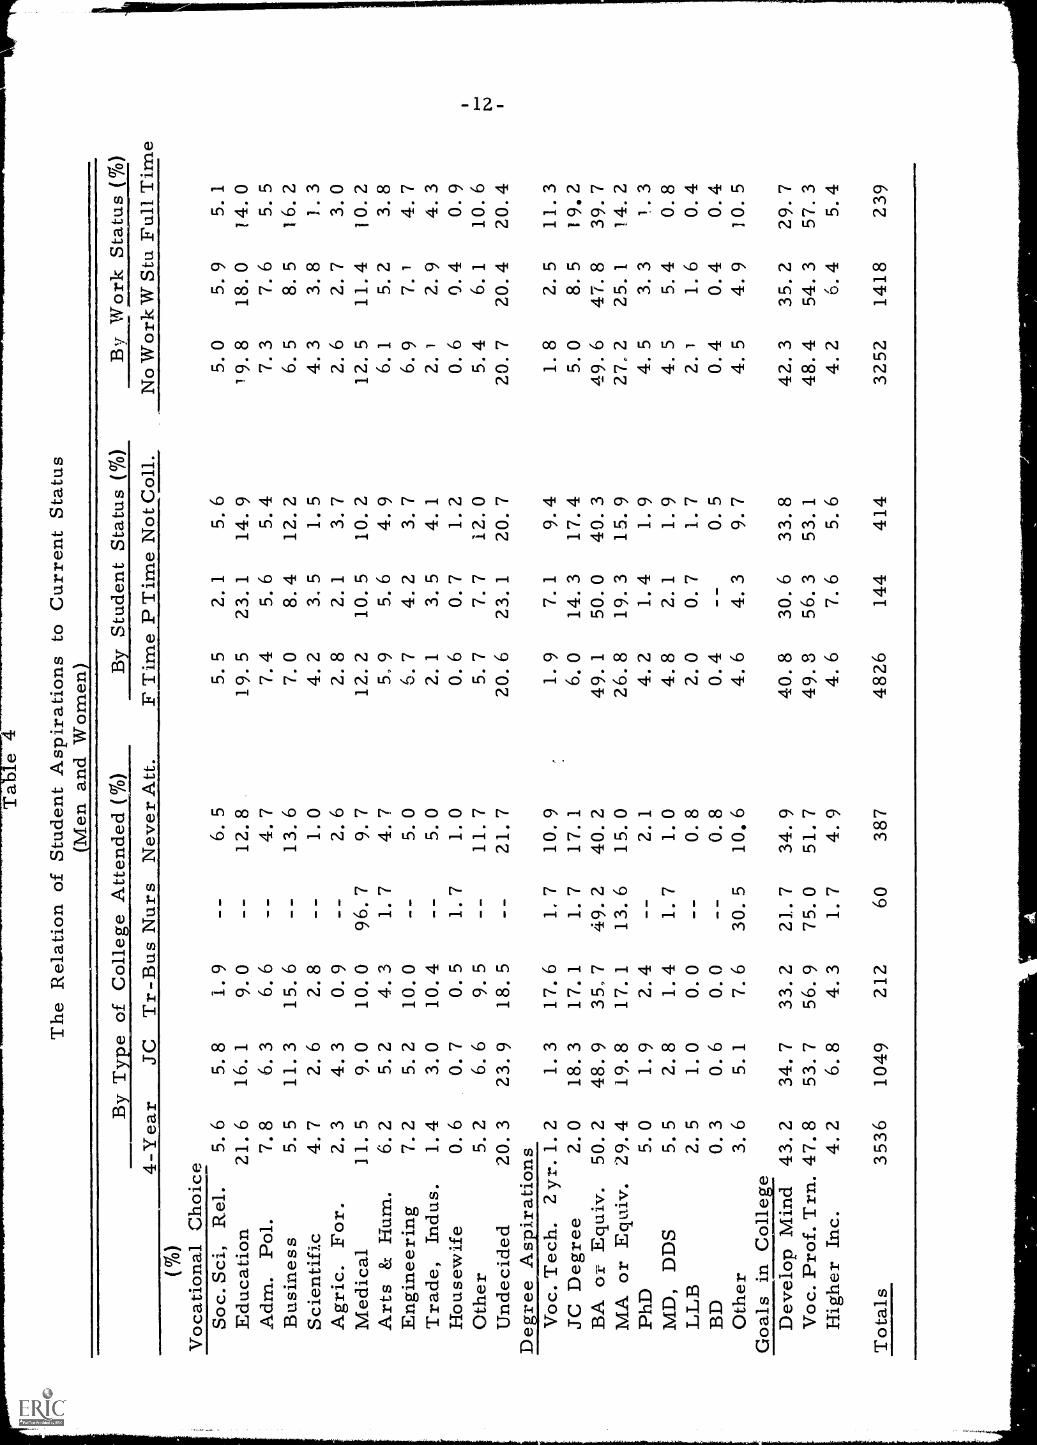
The aspirations of high school students and their educational or
occupational status one year later are shown in Table 4. In general,
students' aspirations and current situation are congruent. College
students at four-year colleges typically sought four-year and advanced
degrees, hoped to develop their mind, and aspired frequently to education-
al and scientific vocations, Junior college students and trade-business
students sought lower level degrees, hoped to acquire vocational or pro-
fessional training, and aspired frequently to business and skilled trade
vocations. Nursing students wanted to become nurses. Last, the high
3Flanagan and Cooley (1966) estimate that approximately one million
graduating high school seniors each year do not go to college.
The
Rel
atio
n of
Stu
dent
Asp
irat
ions
to C
urre
nt S
tatu
s(M
en a
nd W
omen
)
By
Typ
e of
Col
lege
Atte
nded
(%
)4-
Yea
r(%
)V
ocat
iona
l Cho
ice
Soc.
Sci
, Rel
.5.
6E
duca
tion
21.6
Adm
. Pol
.7.
8B
usin
ess
5.5
Scie
ntif
ic4.
7A
gric
. For
.2.
3M
edic
al11
.5A
rts
& H
um.
6.2
Eng
inee
ring
7.2
Tra
de, I
ndus
.1.
4H
ouse
wif
e0.
6O
ther
5.2
Und
ecid
ed20
.3L
ei=
_A
spir
atio
nsV
oc. T
ech.
2yr
. 1.2
JC D
egre
e2.
0B
A o
r E
quiv
.50
.2M
A o
r E
quiv
. 29.
4Ph
D5.
0M
D, D
DS
5.5
LL
B2.
5B
D0.
3O
ther
3.6
Goa
ls in
Col
lesa
sD
evel
op M
ind
43.2
Voc
. Pro
f. T
rn. 4
7.8
Hig
her
Inc.
4.2
Tot
als
3536
By
Stud
ent S
tatu
s (%
)B
y W
ork
Stat
us (
%)
JCT
r-B
us N
urs
Nev
er A
tt.F
Tim
e P
Tim
e N
ot C
oll.
No
Wor
k W
Stu
Ful
l Tim
e
5.8
1.9
--6.
55.
52.
15.
65.
05.
95.
116
.19.
0--
12.8
19.5
23.1
14.9
19.8
18.0
14.0
6.3
6.6
--4.
77.
45.
65.
47.
37.
65.
511
.315
.6--
13.6
7.0
8.4
12.2
6.5
8.5
16.2
2.6
2.8
--1.
04.
23.
51.
54.
33.
81.
34.
30.
92.
62.
82.
13.
72.
62.
73.
09.
010
.096
.79.
712
.210
.510
.212
.511
.410
.25.
24.
31.
74.
75,
95.
64.
96.
15.
23.
85.
210
.0--
5.0
6.7
4.2
3.7
6.9
7.1
4.7
3.0
10.4
5.0
2.1
3.5
4.1
2.1
2.9
4.3
0.7
0.5
1.7
1.0
0.6
0.7
1.2
0.6
0.4
0.9
6.6
9.5
11.7
5.7
7.7
12.0
5.4
6.1
10.6
23.9
18.5
--21
.720
.623
.120
.720
.720
.420
.4
1.3
17.6
1,7
10.9
.1.
97.
19.
41.
82.
511
.318
.317
.11.
717
.16.
014
.317
.45.
08.
519
,248
.935
,749
.240
.249
.150
.040
.349
.647
.839
.719
.817
.113
.615
.026
.819
.315
.927
,225
.114
.21.
92.
42.
14.
21.
41.
94.
53.
313
2.8
1.4
1.7
1.0
4.8
2.1
1.9
4.5
5.4
0.8
1.0
0.0
0.8
2.0
0.7
1.7
2.1
1.6
0.4
0.6
0.0
0.8
0.4
0.5
0.4
0.4
0.4
5.1
7.6
30.5
10.6
4.6
4.3
9.7
4.5
4.9
10.5
34.7
33.2
21.7
34.9
40.8
30.6
33.8
42.3
35.2
29.7
53.7
56.9
75.0
51.7
49.8
56.3
53.1
48.4
54.3
57.3
6.8
4.3
1.7
4.9
4.6
7.6
5.6
4.2
6. 4
5.4
1049
212
6038
748
2614
441
432
5214
1823
9
-13-
school students who obtained fulltime jobs were interested primarily in
vocational training, lower level degrees, and business occupations.
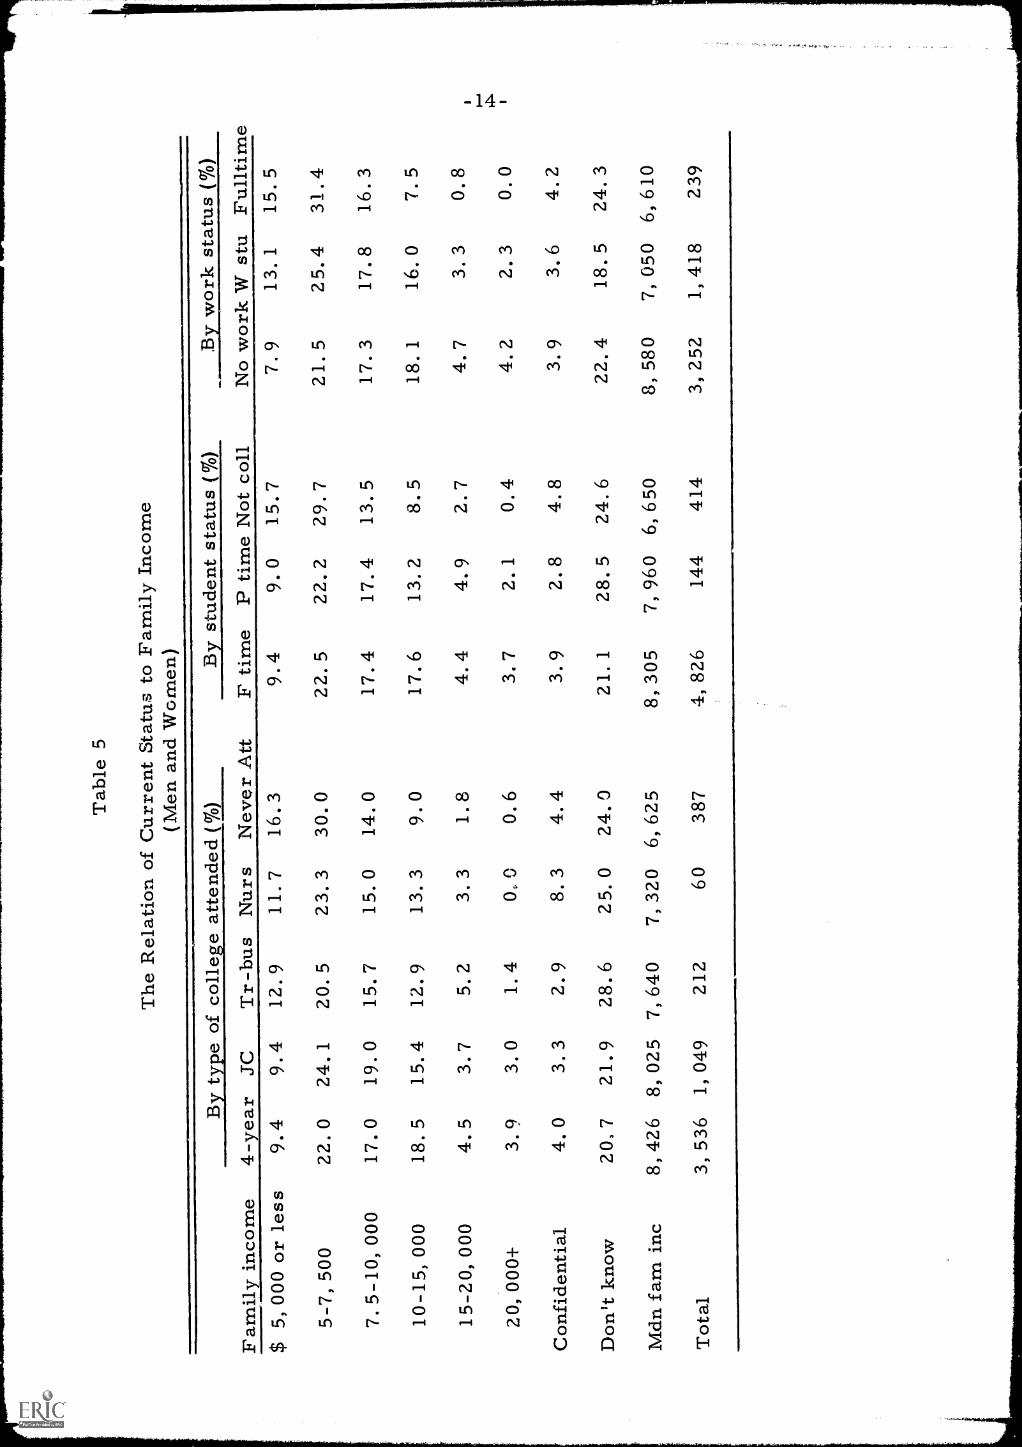
Table 5 shows how student-family incomes reported in high school
are related to current student status. The data in Table 5 are generally
congruent with much earlier research--high incomes were associated with
fulltime attendance and attendance at a four-year college, and low incomes
with lower level trainir and nonattendanr:e (Lipset & Bendix, 1960;
Flanagan & Cooley, 1966; Slocum, 1966; Baird, 1967).
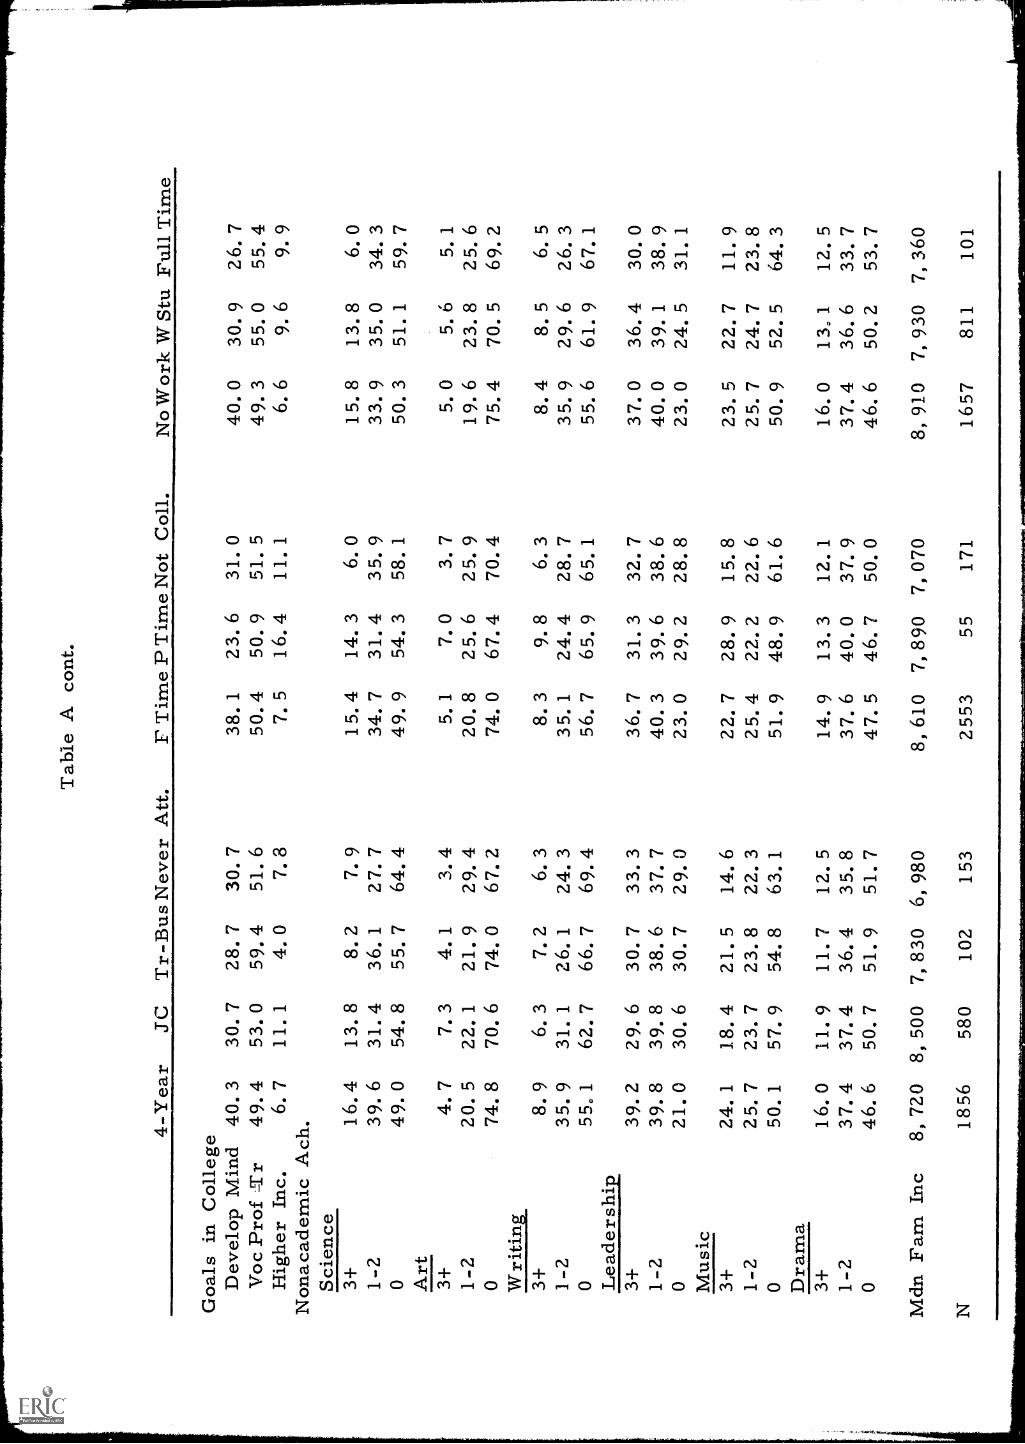
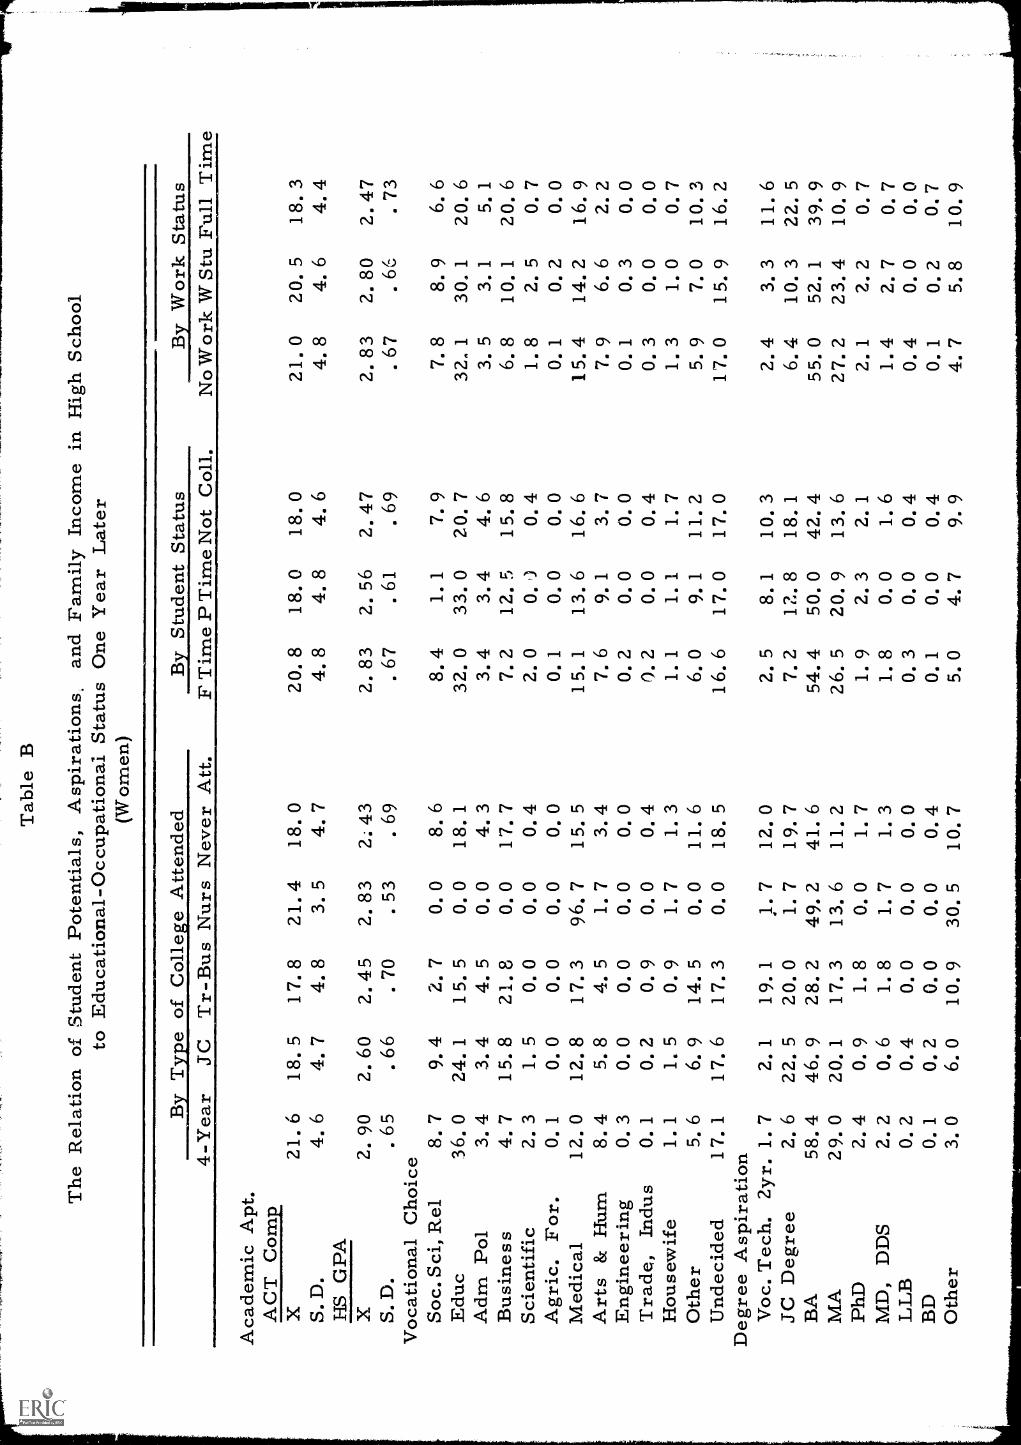
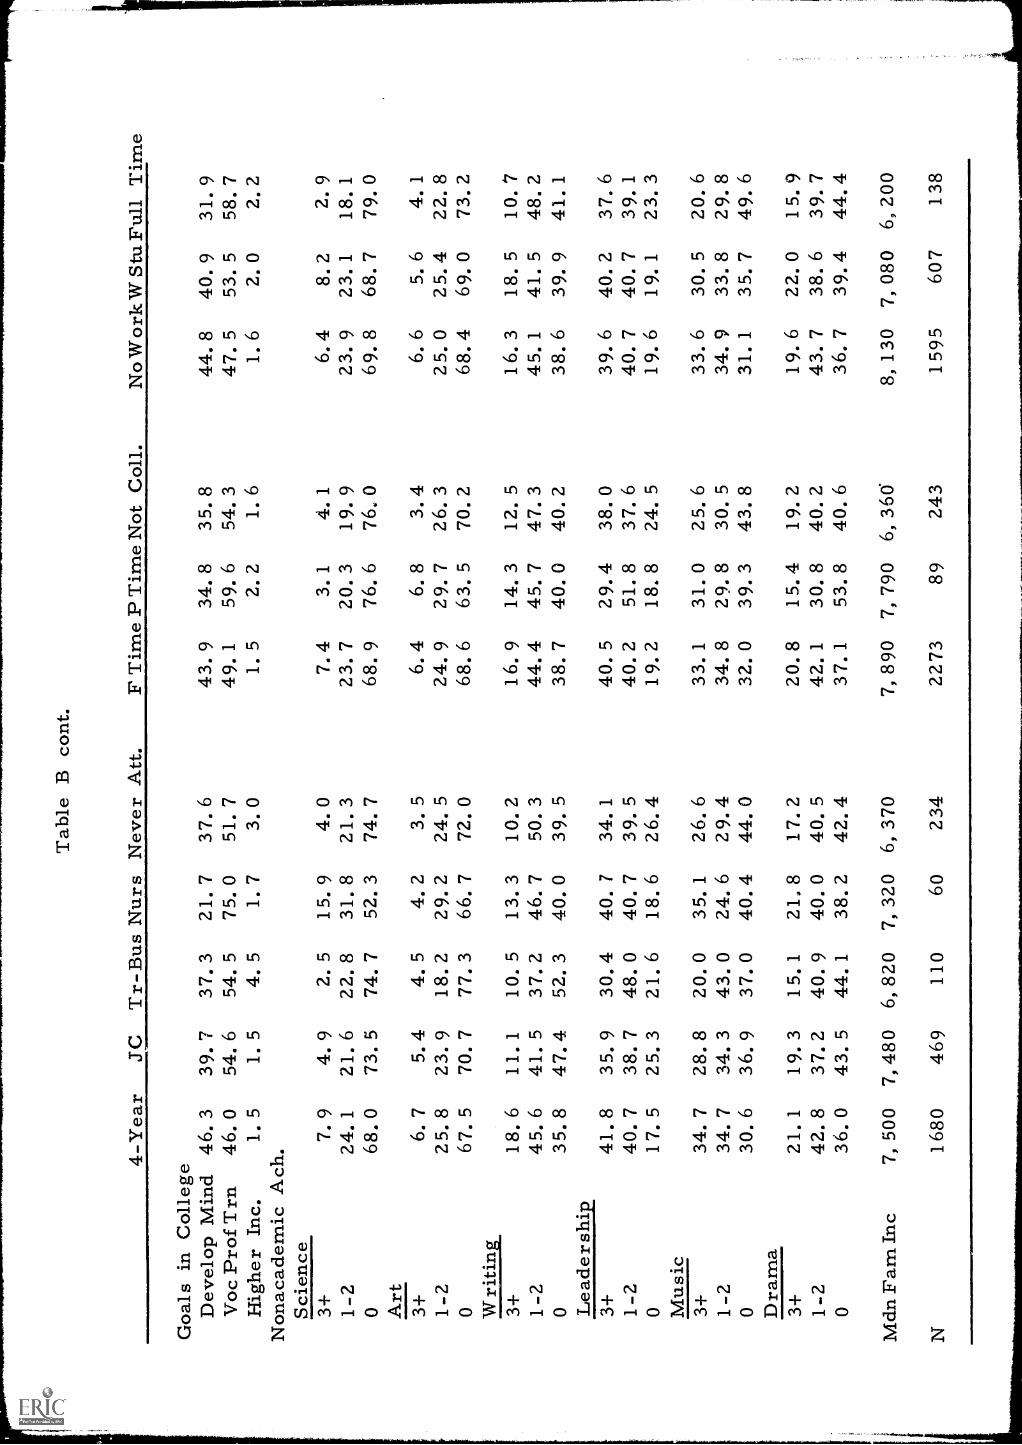
The results for the total sample (men plus women) given in Tables
3,4, and 5 have also been recalculated for separate groups of men and
women and are given in the Appendix, Tables A and El. Almost without
exception, the differences between men and women are in accordance with
substantial literature and folklore. For example, women were more inter-
ested in religious, educational, social, and artistic occupations than men;
whereas men were more interested in administrative, political, scientific,
agricultural, and technical occupations. And men were more apt to attend
college than women, etc.
The remaining results, because of the small subsamples, are too
unreliable to warrant full reporting. Of the 414 students not attending
college, more than 29% said they had not wished to attend. Men typically
preferred to enter the military service, and women wanted to earn money
or marry. Among those who wanted to attend college but did not, the most
common explanation for nonattendance was, "I couldn't afford it," although
the validity of this reason is unclear.
Tab
le 5
The
Rel
atio
n of
Cur
rent
Sta
tus
to F
amily
Inc
ome
(Men
and
Wom
en)
Fam
ily in
com
e
By
type
of
colle
ge a
ttend
ed (
%)
By
stud
ent s
tatu
s (%
)B
y w
ork
stat
us (
%)
4-ye
ar J
CT
r-bu
sN
urs
Nev
er A
ttF
time
P tim
e N
ot c
oll
No
wor
k W
stu
Fullt
ime
$ 5,
000
or le
ss9,
49.
412
.911
.716
.39.
49.
015
.77.
913
.115
.5
5-7,
500
22.0
24.1
20.5
23.3
30.0
22.5
22.2
29.7
21.5
25.4
31.4
7.5-
10,0
0017
.019
.015
.715
.014
.017
.417
.413
.517
.317
.816
.3
10-1
5,00
018
.515
.412
.913
.39.
017
.613
.28.
518
.116
.07.
5
15-2
0,00
04.
53.
75.
23.
31.
84.
44.
92.
74.
73.
30.
814
1.
20,0
00+
3.9
3.0
1.4
0,0
0.6
3,7
2.1
0.4
4.2
2.3
0.0
a
Con
fide
ntia
l4.
03.
32,
98.
34.
43.
92.
84.
83.
93.
64.
2
Don
't kn
ow20
,721
.928
.625
.024
.021
.128
.524
.622
.418
.524
.3
Mdn
fam
inc
8,42
68,
025
7,64
07,
320
6,62
58,
305
7,96
06,
650
8,58
07,
050
6,61
0
Tot
al3,
536
1,04
921
260
387
4,82
614
441
43,
252
1,41
823
9
-15-
Among students with fulltime jobs, two-thirds of the women had
such clerical jobs as secretary, typist, or clerk. Men were working in
a great range of jobs, and more than 84% of the women and men said they
liked their jobs "very well, " or "fairly well." However, when asked how
long they planned to stay in the same kind of work, 36% said they planned
to change soon and only 13% planned to make the same kind of work a career.
The most important source of support for students in college was
their families. Very few students had loans of any kind. Some students
(24%) rated their own savings as a major source of support, a few (11%)
rated their work while attending school as a major source, and a few more
(16%) rated a scholarship as a major source.
Some Implications
The present student sample appears to be a us.eful approximation
of the college-going population but not of the high school senior population.
The median family income of the present sample is much higher than the
national average ($8,115 as opposed to 6, 569), 4 and their average ACT
Composite is at the 82nd percentile rank for unselected high school seniors.
For these reasons, and because of the sampling loss described earlier, the
present study probably underestimates the amount of talent loss when it is
defined as the failure of students scoring high in academic and nonacademic
criteria to attend college. The sampling biases also mean that the small
4U. S. Bureau of the Census, Statistical Abstract of the United States,
1966 (89th edition), Washington, D. C.
percentages of students found in noncollege situations are also under-
estimated. On the other hand, the sampling biases do not appear to
vitiate the estimation of academic and nonacademic talent loss within
the population of college-aspiring youth.
The finding that academic and nonacademic estimationi of talent
yield divergent outcomes has many important implications. First, the
sorting process in the high school-college transition is largely based on
academic factors. Therefore, earlier studies using academic measures
probably underestimate the total "talent loss" as conventionally defined.
Even considering ac2-3-zmic talent alone, the analyses by type of college
illustrate that there is a college for everyone. For example, there were
70 students in the sample wh, had ACT composite scores of 11 or below
(the fifth percentile on national norms) who were attending a four-year
college. (In contrast, there were 71 students with scores of 23 or above
who were working full time.) Apparently, low academic aptitude scores
are not necessarily a great handicap to college attendance. This is es-
pecially true in those states with "open-door" colleges. Further, it ap-
pears that the main reason high school students do not go to college is that
they do not care to and have developed other plans. Second, the common
labeling of people who do not attend college as "less talented" or "untal-
ented" is grossly misleading if we take a broad view of human talent.
Third, it does not seem meaningful to regard the noncollege-going pop-
ulation as "lost talent" for the majority of these people obtain jobs (and
are glnerally satisfied with their jobs), enter the military service, enter
-17-
business and technical schools, or marry. In this sense, there is very
little "lost" talent. Talent goes somewhere where it can be used. Only
a few students were unaccountc for, and even if we assume a large sam-
pling bias, the actual percentage who would be unaccounted for in the stu-
dent population is probably still small. Fourth, we need to know more
about talented people who do not go to college. Many, perhaps most,
studies of talented persons use college graduate populations as if they
were the only source of talent. The present results indicate that talentee
people can be found in many groups of other kinds.
The present findings are indirectly supported by a similar analysis
by Flanagan et al. (1964), who demonstrated that a dramatic increase in
students labeled "talented" occurred when four aptitude measures were
used instead of one. Specifically, n...while 16.3% were identified as
above the 90th percentile in general academic aptitude, an additional
19.2% were identified..." using three other measures and a cutting score
of the 90th percentile. The Flanagan findings are impressive because
they used highly intercorrelated test measures (.66 to .94) and still ob-
tained a much more diverse group of students than that identified by the
academic aptitude measure. In contrast, the present study used test and
nontest measures with small or negligible intercorrelations (Holland &
Richards, 1967a). The present results are strengthened by another
analysis by Holland and Richards (1967b) which reveals that the use of
high cutting scores on high school grades eliminates large proportions of
students with outstanding accomplishments in art, music, literature,
-18-
leadership, and sclence.
In conclusion, the results suggest some of the difficulties in de-
fining "talent" and "talent loss." Before we can assess the degree of
"talent loss" in even an approximate way, we need to know many things.
First, we need to describe the socially relevant outcomes which we hope
"talent" will attain. We then need to know what kinds of human abilities
are essential for the attainment of these outcomes, as well as the appro-
priate environmental and social conditions. Finally, we need to know
which kinds of training programs best develop and inform the people with
the required abilities so- that they will attain the outcomes we value.
Clearly, we must know much more and make many value judgments before
we can speak of "talent loss" with any accuracy. However, it is equally
clear that academic talent and, therefore, the outcomes of academic
training are only one part of the total range of talents and outcomes we
value. Many other endeavors--work, marriage, etc. -- are also socially
relevant areas which allow achievements and actions which ale of intrinsic
value to the self and to society. Many careers do not require a college
degree for entry nor for the achievement of excellence. College training
is not the only kind of experience which leads to the development of talents.
The academic community is not the only one worth belonging to, and the
life of the mind can be lived outside the campus. Thus, it seems naive to
think that a person's career is decided by his choice at the end of high
school. Many other factors play a part in determining the course of
talent, and there are many paths to achievement other than college. If a
-19-
talented person does not enter college, it does not necessarily mea-a he
has lost his chances for success in life. In some cases, a college career
may even interfere. The present results suggest that many talented
people do choose paths other than college, and the diffusion of talent in-
to these many paths may have beneficial results. As Wolfe (1960) said
earlier:
"in the selection and education of persons of ability,it is advantageous for a society to seek the greatestachievable diversity of talent: diversity within anindividual, among the members of an occupationalgroup, and among the individuals who constitute asociety."
References
American College Testing Program. ACT technical report. Iowa City:American College Testing Program, 1965.
American College Testing Program. Interpreuide for ACT researchservices, 1966-67 edition. Iowa City: American College TestingProgram, 1966.
Baird, L. L. Family income and the characteristics of college-boundstudents. ACT research report No. 17. Iowa City: AmericanCollege Testing Program, 1967.
Flanagan, J. C., Davis, F. 13., Dailey, J. T., Shaycoft, F., Orr, D. B.,Goldberg, I., & Neyman, C. A., Jr. The American high schoolstudent. Technical report to the U. S. Office of Education, Coop-erative Research Project No. 635. Washington, D. C.: Universityof Pittsburgh, Project TALENT, 1964.
Flanagan, J. C. , & Cooley, W. W, Project TALENT one year follow-up studies. Technical report to the U.S. Office of Education,Cooperative Research Project No. 2333. Pittsburgh: Universityof Pittsburgh, Project TALENT, 1966.
Hays, W. L. Statistics for psychologists. New York: Holt, Rinehart,and Winston, 1963.
I-Tolland, J. L., & Astin, A. W. The need for redefining "talent" and"talent loss": A plan for practical action and research. Journalof Higher Education, 1962, 33, 77-82.
Holland, J. L., & Richards, J. M., Jr. Academic and nonacademicaccomplishments in a representative sample of students takingthe American College Tests. _college_tnaljniv.ersitx, 1967, 43,60-71. (a)
Holland, J. L., & Richards, J. M., Jr. The many faces of talent:A reply to Werts. Journal Educational 1967, 58,205-209. (b)
Lipset, S. M., & Bendix, R. Social mobility in industrial society.Los Angeles: University of California Press, 1960.
Richards, J. M., Jr., Holland, J. L., & Lutz, S. W. The predictionof student accomplishment in college. Journal of EducationalLa:1_192LE) 1967, 58, 343-355.
Slocum, W. L. Occupational careers: A sociological perspective.Chicago: Aldine, 1966.
United States Bureau of the Census. Statistical abstract of the UnitedStates: 1966 (89th edition). Washington, D. C.: U. S. Bureauof the Census, 1966.
Winer, B. J. Statistical principles in experimenLaldesispn. New York:McGraw-Hill, 1962.
Wolfle, D. L. Diversity of talent. American Psychologist, 1960, 15,
539-545.

Tas
ie
The
Rel
atio
n of
Stu
dent
Pot
entia
ls, A
spir
atio
ns, a
nd F
amily
Inc
ome
in H
igh
Scho
olto
Edu
catio
nal-
Occ
upat
iona
l Sta
tus
One
Yea
r L
ater
(Men
)
By
Typ
e of
Col
lege
Atte
nded
By
Stud
ent S
tatu
sB
y W
ork
Stat
us4-
Yea
r JC
Tr-
Bus
Nev
er A
tt.F
Tim
e P
Tim
e N
ot C
oll.
No
Wor
k W
Stu
Ful
l Tim
e
Aca
dem
ic A
pt.
AC
TC
omp
X22
.7
19.
418
. 418
.9
21.8
18.4
18.9
22.
121
.2
18.
5
S. D
.4.
54.
75.
55.
14.
85.
45.
14.
74.
75.
2H
S G
PA2.
68
.71
2. 2
5.
642.
18
.62
2. 0
8.
602.
57
.71
2. 1
5.
552.
15
.63
2. 6
1.
712.
47 70
2. 0
5.
61X S.
D.
Voc
atio
nal C
hoic
eSo
c R
.el
2. 9
3. 0
1. 0
3.3
2. 8
3. 6
2. 4
2. 4
3. 6
3. 0
Edu
c8.
58.
92.
04.
68.
37.
36.
57.
99.
05.
1A
dm P
ol11
. 88.
78.
95.
310
. 99.
16.
510
. 911
. 06.
1B
usin
ess
6. 2
7. 6
8. 9
7.3
6.8
1.8
7.1
6. 2
7. 3
10. 1
Scie
ntif
ic6.
93.
55.
92.
06.
19.
13.
06.
84.
82.
0A
gric
For
4. 3
7. 8
2. 0
6.6
5. 2
5. 5
8. 9
5. 0
4. 6
7. 1
Med
ical
11. 0
5. 9
2. 0
0.7
9. 6
5. 5
1. 2
9.8
9.3
1.0
Art
s &
Hum
4. 2
4. 7
4. 0
6.6
4. 4
O. 0
6. 5
4. 4
4.2
6. 1
Eng
inee
ring
13. 4
9. 4
20. 8
12.
612
. 510
. 98.
913
. 512
. 111
. 1T
rade
Ind
us.
2. 7
5. 2
20. 8
11.
93.
99.
19.
53.
95.
110
. 1O
ther
4. 9
6. 4
4. 0
11.
95.
55.
513
. 05.
05.
411
.1U
ndec
ided
23. 3
29. 0
19. 8
26.
524
. 132
. 726
. 024
. 123
. 726
. 3D
egre
e A
spir
atio
nV
oc. T
ech.
2yr
. 0. 8
0. 7
16. 0
9.2
1. 3
5. 6
8. 2
1. 3
2. 0
10. 9
J. C
. Deg
ree
1. 4
14. 9
14. 0
13.
14.
916
. 716
. 43.
77.
214
. 9B
A42
. 750
. 644
. 037
.9
44. 4
50. 0
37. 4
44. 4
44. 6
39. 6
MA
29. 8
19. 6
17. 0
20.
927
.016
. 719
.327
. 326
. 318
. 8Ph
D7.
42.
83.
02.
66.
30.
01.
86.
74.
22.
0M
D, D
DS
8. 6
4. 5
1. 0
0.7
7. 4
5. 6
2. 3
7. 5
7. 4
1. 0
LL
B4.
51.
40.
02.
03.
51.
93.
53.
82.
81.
0B
D0.
50.
90.
01.
30.
60.
00.
60.
70.
60.
0O
ther
4. 1
4. 3
4. 0
10.
54.
23.
79.
44.
44.
29.
9
Tab
le A
con
t.
4-Y
ear
JCT
r-B
us N
ever
Att.
F T
ime
P T
ime
Not
Col
l.N
o W
ork
W S
tu F
ull T
ime
Goa
ls in
Col
lege
Dev
elop
Min
d40
.3
30.
728
.7
30.
738
.1
23.
631
.0
40.
030
.9
26.
7V
oc P
rof
=T
r49
.453
.0
59.4
51.
650
.4
50.
951
.5
49.
355
.0
55.
4H
ighe
r In
c.6.
711
.1
4.0
7.8
7.5
16.4
11.
16.
69.
69.
9N
onac
adem
ic A
ch.
Scie
nce
3+16
. 413
.8
8.2
7.9
15.
414
.3
6.0
15.
813
.8
6.0
1-2
39.
631
.4
36.
127
.7
34.
731
.435
.9
33.
935
.0
34.
30
49.
054
.8
55.
764
.449
.9
54.3
58.
150
.3
51.
159
.7
Art
3+4.
77.
34.
13.
45.
17.
03.
75.
05.
65.
1
1-2
20.
522
.1
21.
929
.4
20.8
25.
625
.9
19.
623
.8
25.
60
74.
870
.6
74.
067
.2
74.
067
.470
.475
.4
70.
569
.2
Wri
ting
3+8.
96.
37.
26.
38.
39.
86.
38.
48.
56.
51-
235
.9
31.
126
.1
24.
335
.1
24. 4
28.
735
.9
29.
626
.3
055
.1
62.
766
.7
69.4
56.
765
.9
65.
155
.6
61.
967
.1
Lea
ders
hip
3+39
.2
29.
630
.7
33.
336
.7
31.
332
.7
37.
036
.430
.0
1-2
39.
839
.8
38.
637
.7
40.
339
.638
.6
40.0
39.
138
.9
021
.0
30.
630
.7
29.
023
.029
.2
28.
823
.0
24.
531
.1
Mus
ic3+
24.
118
.421
.5
14.
622
.7
28.
915
.8
23.
522
.7
11.
91-
225
.7
23.
723
.8
22.
325
.422
.2
22.
625
.7
24.
723
.8
050
.1
57.
954
.8
63.
151
.9
48.
961
.6
50.
952
.5
64.
3D
ram
a3+
16.
011
.9
11.
712
.5
14.
913
.3
12.
116
.0
13.
112
.5
1-2
37.4
37. 4
36.
435
.8
37.
640
.0
37.
937
.436
.6
33.
70
46.
650
.7
51.
951
.7
47.
546
.7
50.
046
. 650
.2
53.
7
Mdn
Fam
Inc
8, 7
208,
500
7, 8
306,
980
8, 6
107,
890
7, 0
708,
910
7, 9
307,
360
1856
580
102
153
2553
5517
116
5781
110
1
Tab
le B
The
Rel
atio
n of
Stu
dent
Pot
entia
ls, A
spir
atio
ns, a
nd F
amily
Inc
ome
in H
igh
Scho
olto
Edu
catio
nal-
Occ
upat
iona
l Sta
tus
One
Yea
r L
ater
(Wom
en)
By
Stud
ent S
tatu
sB
y W
ork
Stat
us4-
Yea
rJC
Tr-
Bus
Nur
s N
ever
Att.
F T
ime
P T
ime
Not
Col
l.N
o W
ork
W S
tu F
ull T
ime
Aca
dem
ic A
pt.
AC
TC
omp
X21
.618
.517
.821
.418
.020
.818
.018
.021
.020
. 518
.3S.
D.
4. 6
4. 7
4. 8
3. 5
4. 7
4. 8
4. 8
4. 6
4. 8
4. 6
4. 4
HS
GPA
2. 9
0.
652.
60
.66
2. 4
5.
702.
83
.53
2; 4
3.
692.
83
.67
2. 5
6.
612.
47
.69
2. 8
3.
672.
80
.66
2. 4
7.
73X S.
D.
Voc
atio
nal C
hoic
eSo
c. S
ci, R
.el
8. 7
9. 4
2. 7
0. 0
8. 6
8. 4
1. 1
7. 9
7. 8
8. 9
6. 6
Edu
c36
. 024
. 115
. 5O
. 018
. 132
. 033
. 020
. 732
. 130
. 120
. 6A
dm P
ol3.
43.
44.
50.
04.
33.
43.
44.
63.
53.
15.
1B
usin
ess
4.7
15.8
21.8
0.0
17.7
7. 2
12. 5
15. 8
6. 8
10. 1
20. 6
Scie
ntif
ic2.
31.
50.
00.
0O
. 42.
00.
,)0.
41.
82.
50.
7A
gric
. For
.0.
10.
00.
00.
00.
00.
10.
00.
00.
10.
20.
0M
edic
al12
. 012
. 817
. 396
. 715
. 515
. 113
. 616
. 615
. 414
. 216
. 9A
rts
& H
um8.
45.
84.
51.
73.
47.
69.
13.
77.
96.
62.
2E
ngin
eeri
ng0.
30.
00.
00.
00.
00.
20.
00.
00.
10.
30.
0T
rade
, Ind
us0.
10.
20.
90.
00.
40.
20.
00.
40.
30.
00.
0H
ouse
wif
e1.
11.
50.
91.
71.
31.
11.
11.
71.
31.
00.
7O
ther
5. 6
6. 9
14. 5
0. 0
11. 6
6. 0
9. 1
11. 2
5. 9
7. 0
10. 3
Und
ecid
ed17
. 117
. 617
. 3O
. 018
. 516
.617
.017
.017
.015
.916
.2D
egre
e A
spir
atio
nV
oc. T
ech.
2yr
. 1. 7
2. 1
19. 1
1. 7
12. 0
2. 5
8. 1
10. 3
2. 4
3. 3
11. 6
JC D
egre
e2.
622
. 520
. 01.
719
. 77.
212
. 818
. 16.
410
. 322
. 5B
A58
. 446
. 928
. 249
. 241
. 654
. 450
. 042
. 455
. 052
. 139
. 9M
A29
. 020
.117
.313
. 611
. 226
. 520
. 913
. 627
. 223
. 410
. 9Ph
D2.
40.
91.
80.
01.
71.
92.
32.
12.
12.
20.
7M
D, D
DS
2. 2
0. 6
1. 8
1. 7
1. 3
1. 8
0. 0
1. 6
1. 4
2. 7
0. 7
LL
B0.
20.
40.
00.
00.
00.
30.
00.
40.
40.
00.
0B
D0.
10,
20.
00.
00.
40.
10.
0O
. 40.
10.
20.
7O
ther
3. 0
6. 0
10. 9
30. 5
10. 7
5. 0
4. 7
9. 9
4. 7
5. 8
10. 9
4-Y
ear
JCT
r-B
us N
urs
Tab
le B
con
t.
Nev
er A
tt.F
Tim
e P
Tim
e N
ot C
oll.
No
Wor
k W
Stu
Ful
l Tim
e
Goa
ls in
Col
lege
Dev
elop
Min
d46
.3
39. 7
37. 3
21. 7
37. 6
43. 9
34. 8
35. 8
44. 8
40. 9
31. 9
Voc
Pro
f T
rn46
.0
54. 6
54. 5
75. 0
51. 7
49. 1
59. 6
54. 3
47. 5
53. 5
58. 7
Hig
her
Inc.
1.5
1. 5
4. 5
1. 7
3. 0
1. 5
2. 2
1. 6
1. 6
2. 0
2. 2
Non
acad
emic
Ach
.Sc
ienc
e3+
7.9
4. 9
2. 5
15. 9
4. 0
7. 4
3. 1
4. 1
6. 4
8. 2
2. 9
1-2
24.
121
. 622
. 831
. 821
. 323
. 720
. 319
. 923
. 923
. 118
. 10
68.0
73. 5
74. 7
52. 3
74. 7
68. 9
76. 6
76,,
069
. 868
. 779
. 0A
rt3+
6.7
5. 4
4. 5
4. 2
3. 5
6. 4
6. 8
3. 4
6. 6
5. 6
4. 1
1-2
25.
823
. 918
. 229
. 224
. 524
. 929
. 726
. 325
. 025
. 422
. 80
67.
570
. 777
. 366
. 772
. 068
. 663
. 570
. 268
. 469
. 073
. 2
ILT
ritig
_.n
3+18
.6
11. 1
10. 5
13. 3
10. 2
16. 9
14. 3
12. 5
16. 3
18. 5
10. 7
1-2
45.
641
. 537
. 246
. 750
. 344
. 445
. 747
. 345
. 141
. 548
. 20
35.
847
. 452
. 340
. 039
. 538
. 740
. 040
. 238
. 639
. 941
. 1L
eade
rshi
p3+
41.8
35. 9
30. 4
40. 7
34. 1
40. 5
29. 4
38. 0
39. 6
40. 2
37. 6
1-2
40.
738
. 748
. 040
. 739
. 540
. 251
. 837
. 640
. 740
. 739
. 10
17.5
25.3
21.6
18.6
26.4
19. 2
18. 8
24. 5
19. 6
19. 1
23. 3
Mus
ic3+
34.
728
. 820
. 035
. 126
. 633
. 131
. 025
. 633
. 630
. 520
. 61-
234
.7
34. 3
43. 0
24. 6
29. 4
34. 8
29. 8
30. 5
34. 9
33. 8
29. 8
030
.6
36. 9
37. 0
40. 4
44. 0
32. 0
39. 3
43. 8
31. 1
35. 7
49. 6
Dra
ma
3+21
.119
, 315
.121
, 817
.220
.815
.419
.219
. 622
. 015
. 91-
242
.8
37. 2
40. 9
40. 0
40. 5
42. 1
30. 8
40. 2
43. 7
38. 6
39. 7
036
.0
43. 5
44. 1
38. 2
42. 4
37. 1
53. 8
40. 6
36. 7
39. 4
44. 4
Mdn
Fam
Inc
7, 5
007,
480
6, 8
207,
320
6, 3
707,
890
7, 7
906,
360
.8,
130
7, 0
806,
200
1680
469
110
6023
422
7389
243
1595
607
138
ACT Research Reports
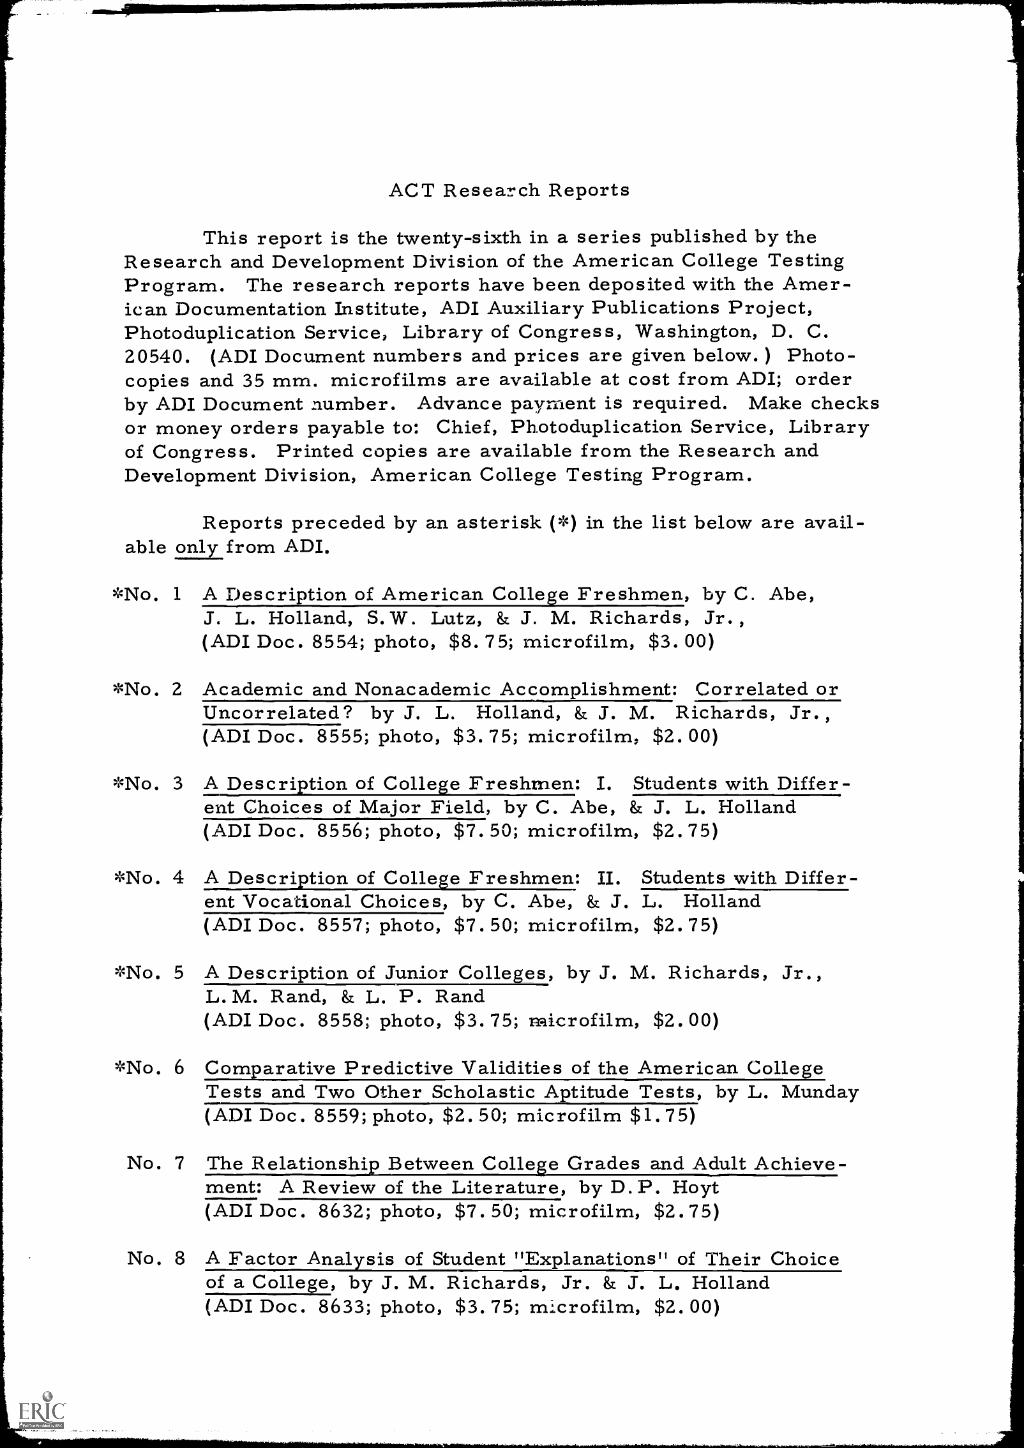
This report is the twenty-sixth in a series published by theResearch and Development Division of the American College TestingProgram. The research reports have been deposited with the Amer-ican Documentation Institute, ADI Auxiliary Publications Project,Photoduplication Services Library of Congress, Washington, D. C.20540. (ADI Document numbers and prices are given below. ) Photo-copies and 35 mm. microfilms are available at cost from ADI; orderby ADI Document number. Advance payment is required. Make checksor money orders payable to: Chief, Photoduplication Service, Libraryof Congress. Printed copies are available from the Research andDevelopment Division, American College Testing Program.
Reports preceded by an asterisk (*) in the list below are avail-able only from ADI.
*No. 1 A Description of American College Freshmen, by C. Abe,J. L. Holland, S.W. Lutz, & J. M. Richards, Jr. ,
(ADI Doc. 8554; photo, $8.75; microfilm, $3.00)
*No. 2 Academic and Nonacademic Accomplishment: Correlated orUncorrelated? by J. L. Holland, & J. M. Richards, Jr.,(ADI Doc. 8555; photo, $3.75; microfilm, $2.00)
*No. 3 A Description of College Freshmen: I. Students with Differ-ent Choices of Major Field, by C. Abe, & J. L. Holland(ADI Doc. 8556; photo, $7.50; microfilm, $2.75)
*No. 4 A Description of College Freshmen: II. Students with Differ-ent Vocational Choices, by C. Abe, & J. L. Holland(ADI Doc. 8557; photo, $7.50; microfilm, $2.75)
*No. 5 A Description of Junior Colle es, by J. M. Richards, Jr.,L. M. Rand, & L. P. Rand(ADI Doc. 8558; photo, $3.75; microfilm, $2.00)
*No. 6 Comparative Predictive Validities of the American CollegeTests and Two Other Scholastic Aptitude Tests, by L. Munday(ADI Doc. 8559; photo, $2.50; microfilm $1.75)
No. 7 The Relationship Between College Grades and Adult Achieve-ment: A Review of the Literature, by D.P. Hoyt(ADI Doc. 8632; photo, $7.50; microfilm, $2.75)
No. 8 A Factor Analysis of Student "Explanations" of Their Choiceof a College, by J. M. Richards, Jr. & J. L. Holland(ADI Doc. 8633; photo, $3.75; microfilm, $2.00)
ACT Research Reports (con't.)
No. 9 Re ional Differences in Junior Colle es, by J. M. Richards,Jr., L. P. Rand, & L. M. Rand(ADI Doc. 8743; photo, $2.50; microfilm, $1.75)
No. 10 Academic Description and Prediction in Junior Colleges, byD. P. Hoyt, & L. Munday(ADI Doc. 8856; photo, $3.75; microfilm, $2.00)
No. 11 The Assessment of Student Accomplishment in College, by J. M.Richards, Jr., J. L. Holland, & S. W. Lutz(ADI Doc. 8955; photo, $3.75; microfilm, $2.00)
No. 12 Academic and Nonacademic Accomplishment in a RepresentativeSam le taken from a Po ulation of 612 000, by J. L. Holland,& J. M. Richards, Jr.(ADI Doc. 8992; photo, $3.75; microfilm, $2.00)
No. 13 The Prediction of Student Accom lishment in Colle e, byJ. M. Richards, Jr., J. L. Holland, & S. W. Lutz(ADI Doc. 9020; photo, $5.00; microfilm, $2.25)
No. 14 Chan es in Self-Ratin s and Life Goals Amon Students atColleges with Different Characteristics, by R. W. Skager,J. L. Holland, & L. A. Braskamp(ADI Doc. 9069; photo, $3.75; microfilm, $2.00)
No. 15 Can Com uters Write Colle e Admissions Tests? by J. M.Richards, Jr.(ADI Doc. 9174; photo, $2.50; microfilm, $1.75)
No. 16 Changes in Self-Ratings and Life Goals as Related to StudentAccomplishment in College, by R. W. Skager, & L. A. Braskamp(ADI Doc. 9214; photo, $2.50; microfilm, $1.75)
No. 17 Family Income and the Characteristics of College-BoundStudents, by L. L. Baird(ADI Doc. 9378; photo, $3.75; microfilm, $2.00)
No. 18 Predicting a Student's Vocational Choice, by J. L. Holland,& S. W. Lutz(ADI Doc. 9433; photo, $2.50; microfilm, $1.75)
No. 19 The Educational Goals of College-Bound Youth, by L. L.Baird(ADI Doc. 9472; photo, $5.00; microfilm, $2.25)
No. 20 Who Goes Where to Junior College? by J. M. RichardsTr.& L. A. Braskamp(ADI Doc. 9571; photo, $3.75; microfilm, $2.00)
ACT Research Reports (con't.)
No. 21 Predicting Student Accomplishment in College from the ACTAssessment, by J. M. Richards, Jr., & S. W. Lutz(ADI Doc. 9594; photo, $6. 25; microfilm, $2.50)
No. 22 The Undecided Student: How Different Is He? by L. L. Baird(ADI Doc. 9812; photo, $3.75; microfilm, $2.00)
No. 23 The Effects of Selecting College Students by Various Kinds ofHigh School Achievement, by L. L. Baird & J. M. Richards, Jr.(ADI Doc. 9955; photo, $3.75; microfilm, $2.00)
No. 24 Do They Do What They Say They Will Do? by S. W. Lutz(ADI Doc. 9988; photo, $5.00; microfilm, $2.25)
No. 25 Changes in the Vocational Plans of College Students: Orderlyor Random? by J. L. Holland & D. R. Whitney(ADI Doc. No. not yet available)