quiz wei hsu 8/16/2006. which of the following instructions are speculative in nature? a)data cache...
Post on 20-Dec-2015
216 views
TRANSCRIPT

QuizQuiz
Wei HsuWei Hsu8/16/20068/16/2006

Which of the following instructions are Which of the following instructions are speculative in nature?speculative in nature?
A)A) Data cache prefetch instructionData cache prefetch instruction
B)B) Non-faulting loadsNon-faulting loads
C)C) Speculative loads (e.g. ld.s)Speculative loads (e.g. ld.s)
D)D) Advance load (e.g. ld.a)Advance load (e.g. ld.a)
E)E) StoresStores
Answer: A, B, C, D
Which of the following motivate dynamic Which of the following motivate dynamic optimizationoptimization
A)A) When the underlying micro-architecture is When the underlying micro-architecture is different from what the object code is compiled different from what the object code is compiled for.for.
B)B) When the program behaves very differently on When the program behaves very differently on different input datadifferent input data
C)C) When the application is large, and has a very flat When the application is large, and has a very flat profile. profile.
D)D) When the application is written in C/C++.When the application is written in C/C++.
Answer: A, B
Which of the following may increase MLP?Which of the following may increase MLP?
A)A) A larger instruction re-ordering window for OOO A larger instruction re-ordering window for OOO processorsprocessors
B)B) Use code scheduling to overlap delinquent loads Use code scheduling to overlap delinquent loads if the processor uses stall-on-use modelif the processor uses stall-on-use model
C)C) Inserting cache prefetches for multiple Inserting cache prefetches for multiple delinquent loadsdelinquent loads
D)D) Decrease the associativity of the cacheDecrease the associativity of the cache
E)E) Using a helper thread running on the second Using a helper thread running on the second corecore
Answer: A, B, C, E

Montecito is a dual-core CMP, but the two cores do Montecito is a dual-core CMP, but the two cores do not share on-chip caches (L1/L2/L3), how may we use not share on-chip caches (L1/L2/L3), how may we use help threads ?help threads ?
A)A) We may use VMT that switches the main thread We may use VMT that switches the main thread to a helper thread on a L3 cache miss.to a helper thread on a L3 cache miss.
B)B) It is hard to use the other core for helper threads It is hard to use the other core for helper threads since the synchronization overhead is highsince the synchronization overhead is high
C)C) It is possible to use the other core to warm up It is possible to use the other core to warm up the off-chip L4 shared cache, if there is one.the off-chip L4 shared cache, if there is one.
D)D) It is possible to use the other core to warm up It is possible to use the other core to warm up near memory side caches.near memory side caches.
Answer: A, B, C, D

Dynamic Instrumentation Dynamic Instrumentation Techniques and their ApplicationsTechniques and their Applications
Wei HsuWei Hsu8/16/20068/16/2006
Program InstrumentationProgram Instrumentation InstrumentationInstrumentation
A technique for inserting extra code (or probes) into an application to observe its behavior Program measurements (profiles, value profiles) Trace generator (e.g. branch trace, memory trace) Protection (program introspection)Protection (program introspection) Emulation (cache simulator, Shade)Emulation (cache simulator, Shade) Migration (e.g. PA 1.1 Migration (e.g. PA 1.1 2.0) 2.0) Debugging tools (Pure software, Debugging tools (Pure software, purify, purify, memory memory
checker)checker)
Instrumentation TimeInstrumentation Time In Source CodeIn Source Code
For communicating high-level domain specific abstraction to toolsFor communicating high-level domain specific abstraction to tools Portable across multiple compilers and platformsPortable across multiple compilers and platforms
At Compile TimeAt Compile Time compiler inserts instrumentations, e.g. using –p, -pg, -a, -ax … flags.compiler inserts instrumentations, e.g. using –p, -pg, -a, -ax … flags.
At Post-Link TimeAt Post-Link Time Often referred to as binary editing tools e.g. Atom, EEL, PixieOften referred to as binary editing tools e.g. Atom, EEL, Pixie No need to recompile applicationsNo need to recompile applications Language independentLanguage independent Will not be invalidated or affected by compiler optimization Will not be invalidated or affected by compiler optimization
At RuntimeAt Runtime Instrumentation during program executionInstrumentation during program execution No recompilation, no re-linking, no restartingNo recompilation, no re-linking, no restarting Can be inserted and/or Can be inserted and/or removedremoved at runtime, no disabled probe effect at runtime, no disabled probe effect Requires continuous porting efforts as computing platforms evolveRequires continuous porting efforts as computing platforms evolve

Static Binary Editing ToolsStatic Binary Editing Tools– ATOM on DEC (COMPAQ) UnixATOM on DEC (COMPAQ) Unix– NTATOM on WindowsNTNTATOM on WindowsNT– HiProf/TracePoint (performance tools based on ATOM)HiProf/TracePoint (performance tools based on ATOM)– Pixie for MIPSPixie for MIPS– Etch (Instrumentation/optimization for Win32/x86 apps)Etch (Instrumentation/optimization for Win32/x86 apps)– OM system (for link time optimizations, developed at OM system (for link time optimizations, developed at
DEC)DEC) Spike for AlphaSpike for Alpha iSPike for ItaniumiSPike for Itanium
– CacheProf (now rolled into CacheProf (now rolled into valgrind, valgrind, a popular Linux tool a popular Linux tool set for profiling and debugging, based on dynamic set for profiling and debugging, based on dynamic instrumentation)instrumentation)
– UQBT (resourceable and retargetable binary translator)UQBT (resourceable and retargetable binary translator)– EELEEL

EEL:Machine-Independent Executable EditingEEL:Machine-Independent Executable Editing EEL (Executable Editing Library) is a C++ library EEL (Executable Editing Library) is a C++ library
that hides much of the complexity and system-that hides much of the complexity and system-specific detail of editing executables. specific detail of editing executables.
Applications appear unchanged, and data Applications appear unchanged, and data collected as a side effect of execution.collected as a side effect of execution.
Qpt/Qpt2 are tracing tools based on EEL. Qpt’s Qpt/Qpt2 are tracing tools based on EEL. Qpt’s performance is better than Shade (Qpt is 2-6x performance is better than Shade (Qpt is 2-6x slower than native execution even with tracing)slower than native execution even with tracing)
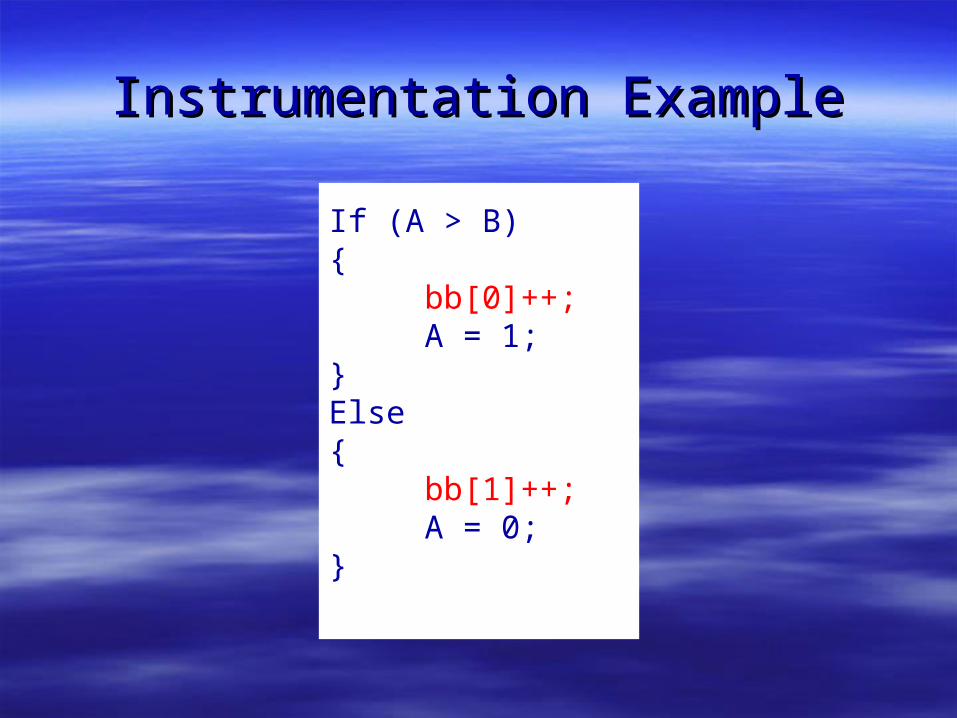
Instrumentation ExampleInstrumentation Example
If (A > B) {
bb[0]++;A = 1;
}Else{
bb[1]++;A = 0;
}
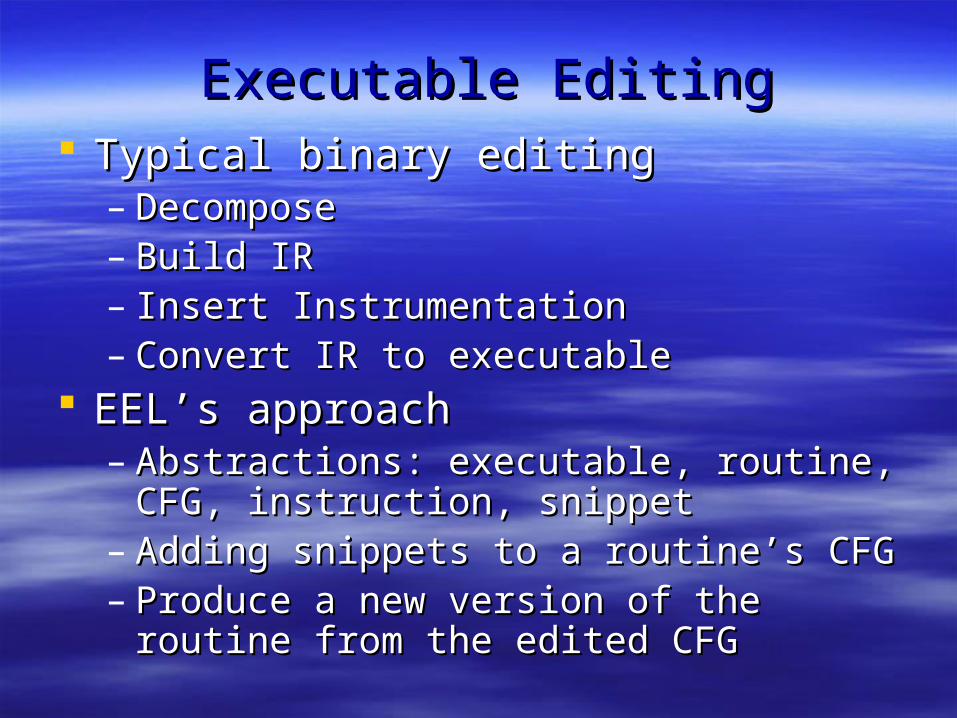
Executable EditingExecutable Editing Typical binary editingTypical binary editing
– DecomposeDecompose– Build IRBuild IR– Insert InstrumentationInsert Instrumentation– Convert IR to executableConvert IR to executable
EEL’s approachEEL’s approach– Abstractions: executable, routine, CFG, Abstractions: executable, routine, CFG,
instruction, snippetinstruction, snippet– Adding snippets to a routine’s CFGAdding snippets to a routine’s CFG– Produce a new version of the routine from the Produce a new version of the routine from the
edited CFGedited CFG

Executable EditingExecutable Editing ObstacleObstacle
– AddressAddress are bound are bound– RegistersRegisters are bound are bound
ExampleExample
if (a) a = bif (a) a = b
BnzBnz %r1, .+2%r1, .+2
LdLd _b,_b, %r1%r1
Insert
Ld _counter1, %rx
Add %rx, 1, %rx
St %rx, _counter
Q: Is reg %rx free? How about the branch inst offset?

Handling RegistersHandling Registers
BnzBnz %r1, .+2%r1, .+2
LdLd _b,_b, %r1%r1
Insert
Ld _counter1, %rx
Add %rx, 1, %rx
St %rx, _counter
1) If there are free registers (dead at the point of insertion), the editor could replace %rx by the free register.2) If no free registers, a wrapper routine must be used to spill %rx to the stack.
EEL uses data flow analysis to identify free registers – not trivial.

Handling AddressesHandling Addresses
BnzBnz %r1, %r1, .+2.+2
LdLd _b,_b, %r1%r1
Insert
Ld _counter1, %rx
Add %rx, 1, %rx
St %rx, _counter
How to change the address in the branch instructions?
EEL uses control flow analysis to change addresses in branchescalls, and jumps
One alternative is to change the Ld instruction to a branch tothe instrumented code segment (like a procedure call) so thataddresses of other branch instructions remain the same.

Handling AddressesHandling Addresses
BnzBnz %r1, %r1, .+2.+2
CallCall xxxxxxxxxx
Ld _counter1, %rx
Add %rx, 1, %rx
St %rx, _counter
Ld _b, %r1
ret
ProsNo need for CFG, no adjustment to addresses in branch/jump instructions
ConsLess efficient instrumented codeDon’t know how to handle variable length instructions

EEL AbstractionsEEL Abstractions ExecutableExecutable
– Object file, library, static or dynamically linked programsObject file, library, static or dynamically linked programs– Use symbol table information, but do not rely on itUse symbol table information, but do not rely on it
Analysis to identify all routinesAnalysis to identify all routines– Using the symbol table to form the initial set of routinesUsing the symbol table to form the initial set of routines– If no symbol table, the initial set contains only the If no symbol table, the initial set contains only the
program entry address and the first location in the text program entry address and the first location in the text segmentsegment
– Examine instructions to locate jumps out of a routine, or Examine instructions to locate jumps out of a routine, or calls on routines not in the initial set.calls on routines not in the initial set.
– A CFG is constructedA CFG is constructed
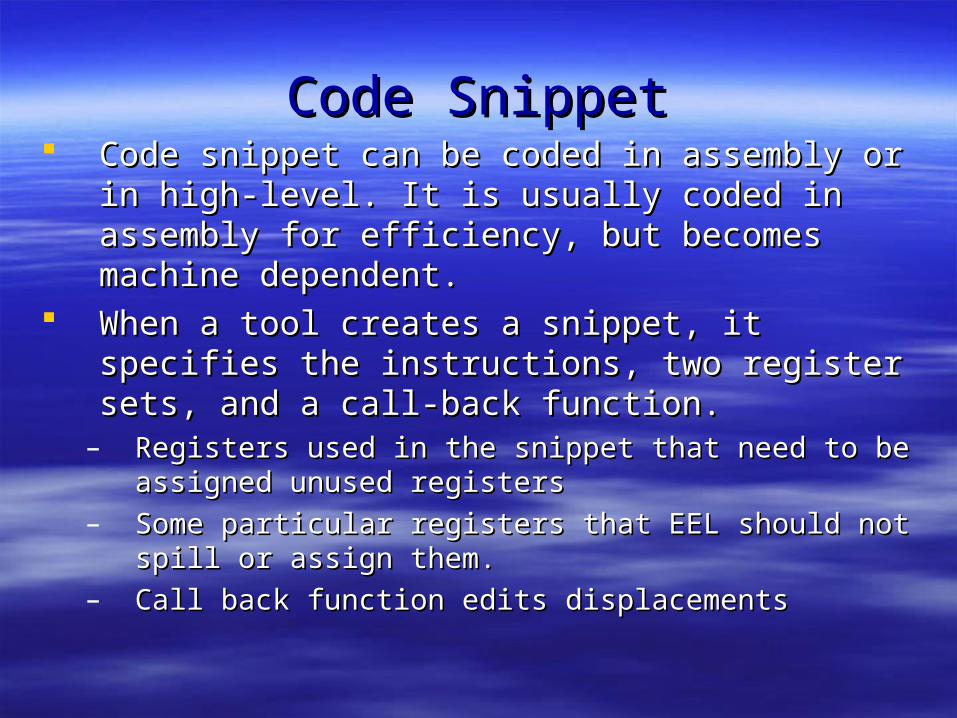
Code SnippetCode Snippet Code snippet can be coded in assembly or in Code snippet can be coded in assembly or in
high-level. It is usually coded in assembly for high-level. It is usually coded in assembly for efficiency, but becomes machine dependent.efficiency, but becomes machine dependent.
When a tool creates a snippet, it specifies the When a tool creates a snippet, it specifies the instructions, two register sets, and a call-back instructions, two register sets, and a call-back function.function.
– Registers used in the snippet that need to be assigned Registers used in the snippet that need to be assigned unused registersunused registers
– Some particular registers that EEL should not spill or Some particular registers that EEL should not spill or assign them.assign them.
– Call back function edits displacementsCall back function edits displacements
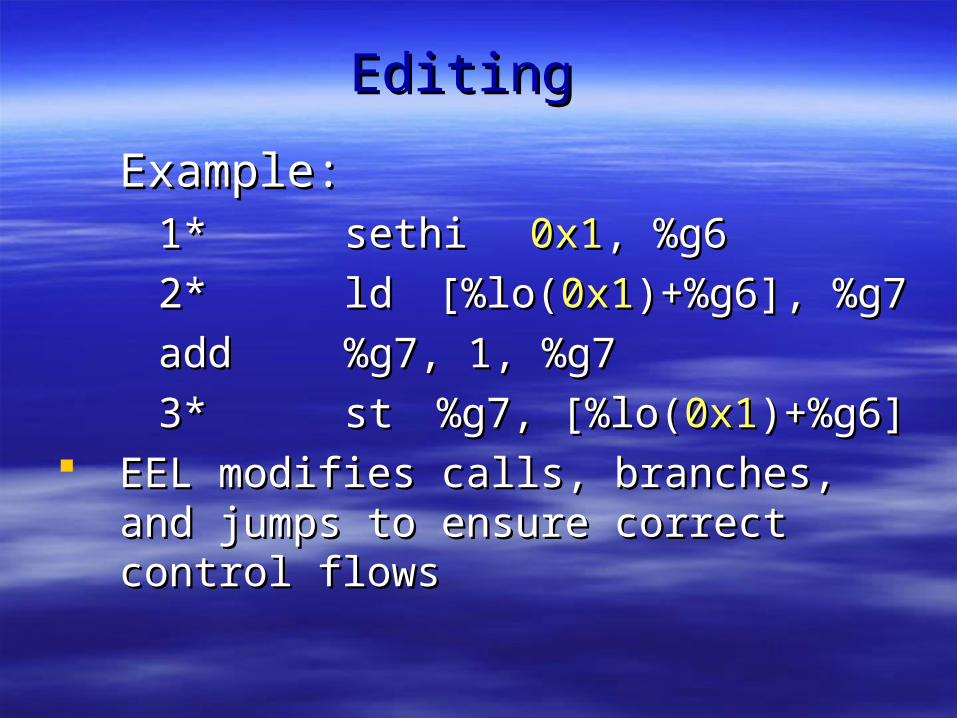
EditingEditing
Example:Example:1*1* sethisethi 0x10x1, %g6, %g6
2*2* ldld [%lo([%lo(0x10x1)+%g6], %g7)+%g6], %g7
addadd %g7, 1, %g7%g7, 1, %g7
3*3* stst %g7, [%lo(%g7, [%lo(0x10x1)+%g6])+%g6] EEL modifies calls, branches, and jumps EEL modifies calls, branches, and jumps
to ensure correct control flowsto ensure correct control flows

CFG of a routineCFG of a routine
EEL represents a routine as a CFGEEL represents a routine as a CFG Why CFG? Why CFG?
– A profile tool, qpt required CFG to place A profile tool, qpt required CFG to place instrumentation code on CFG edges. (what’s instrumentation code on CFG edges. (what’s wrong with block counts??)wrong with block counts??)
– EEL uses CFG to adjust addresses in EEL uses CFG to adjust addresses in branches and jumpsbranches and jumps
– CFG provides architecture-independence on CFG provides architecture-independence on control flowcontrol flow

Representing Delayed branchesRepresenting Delayed branches
Bne %icc, L1
Add %r1,%r2,%r3
Bne, a %icc, L1
Add %r1,%r2,%r3
Add %r1,%r2,%r3Bne %icc, L1
L1
Bne, a %icc, L1
Add %r1,%r2,%r3
L1
Nullified delay slot

Incomplete CFGIncomplete CFG When control flow cannot be completely When control flow cannot be completely
analyzed, runtime code ensures corrected analyzed, runtime code ensures corrected execution.execution.
This paper claims that most indirect jumps occur This paper claims that most indirect jumps occur in case statements (actually, most indirect in case statements (actually, most indirect branches are return jumps, shared lib calls and branches are return jumps, shared lib calls and indirect calls). EEL uses backward slicing to find indirect calls). EEL uses backward slicing to find the jump table and complete the CFG.the jump table and complete the CFG.
EEL’s backward slicing makes runtime EEL’s backward slicing makes runtime translation a rare occurrence: no unanalyzable translation a rare occurrence: no unanalyzable indirect jumps in spec92 using SunOS’s indirect jumps in spec92 using SunOS’s compilers.compilers.
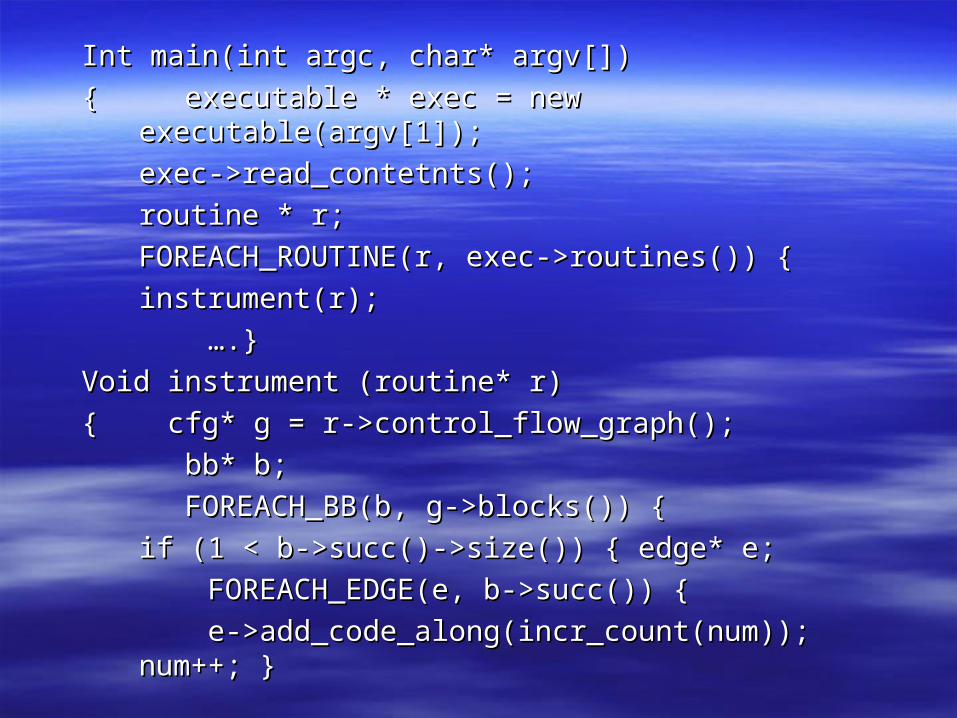
Int main(int argc, char* argv[])Int main(int argc, char* argv[])
{ executable * exec = new executable(argv[1]);{ executable * exec = new executable(argv[1]);
exec->read_contetnts();exec->read_contetnts();
routine * r;routine * r;
FOREACH_ROUTINE(r, exec->routines()) {FOREACH_ROUTINE(r, exec->routines()) {
instrument(r);instrument(r);
… ….}.}
Void instrument (routine* r)Void instrument (routine* r)
{ cfg* g = r->control_flow_graph();{ cfg* g = r->control_flow_graph();
bb* b;bb* b;
FOREACH_BB(b, g->blocks()) {FOREACH_BB(b, g->blocks()) {
if (1 < b->succ()->size()) { edge* e;if (1 < b->succ()->size()) { edge* e;
FOREACH_EDGE(e, b->succ()) {FOREACH_EDGE(e, b->succ()) {
e->add_code_along(incr_count(num)); e->add_code_along(incr_count(num)); num++; }num++; }
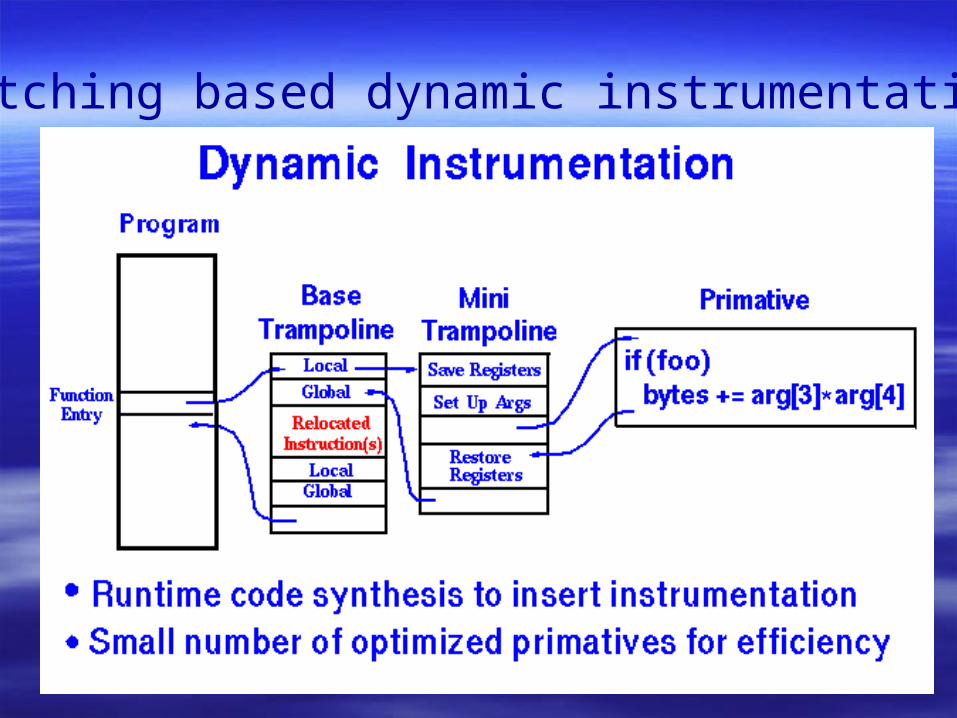
Patching based dynamic instrumentation

Dynamic InstrumentationDynamic Instrumentation Many advantages over static Many advantages over static
instrumentation:instrumentation:– No need of a separate instrumentation passNo need of a separate instrumentation pass– Can instrument all user-level codes executedCan instrument all user-level codes executed
Shared librariesShared libraries Dynamically generated codeDynamically generated code
– Easy to distinguish code and dataEasy to distinguish code and data– Instrumentation can be turned on/offInstrumentation can be turned on/off– Can attach and instrument an already Can attach and instrument an already
running processrunning process– No disabled probe effectNo disabled probe effect
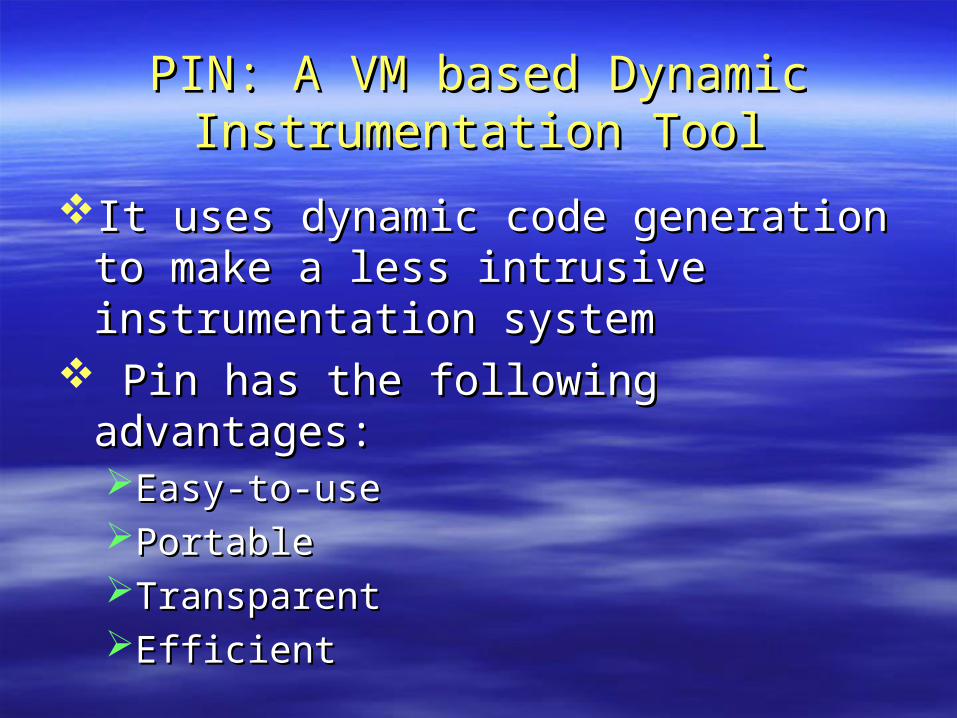
PIN: A VM based Dynamic PIN: A VM based Dynamic Instrumentation ToolInstrumentation Tool
It uses dynamic code generation to make a It uses dynamic code generation to make a less intrusive instrumentation systemless intrusive instrumentation system
Pin has the following advantages:Pin has the following advantages:Easy-to-useEasy-to-usePortablePortableTransparentTransparentEfficient Efficient
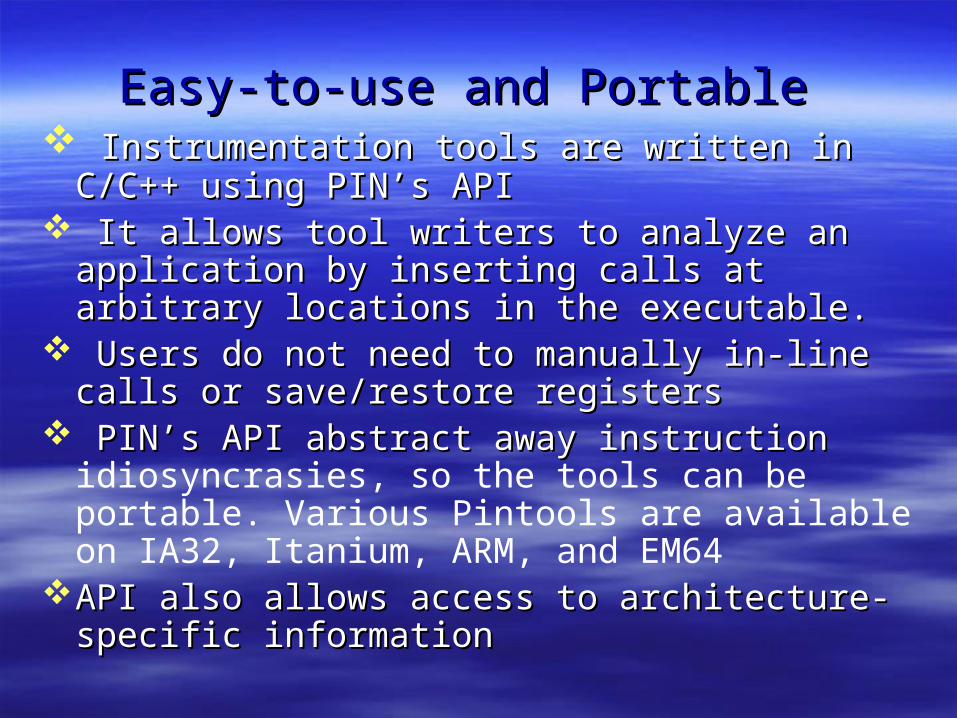
Easy-to-use and PortableEasy-to-use and Portable Instrumentation tools are written in C/C++ using Instrumentation tools are written in C/C++ using
PIN’s APIPIN’s API It allows tool writers to analyze an application by It allows tool writers to analyze an application by
inserting calls at arbitrary locations in the inserting calls at arbitrary locations in the executable.executable.
Users do not need to manually in-line calls or Users do not need to manually in-line calls or save/restore registerssave/restore registers
PIN’s API abstract away instruction PIN’s API abstract away instruction idiosyncrasies, so the tools can be portable. Various Pintools are available on IA32, Itanium, ARM, and EM64
API also allows access to architecture-specific API also allows access to architecture-specific informationinformation
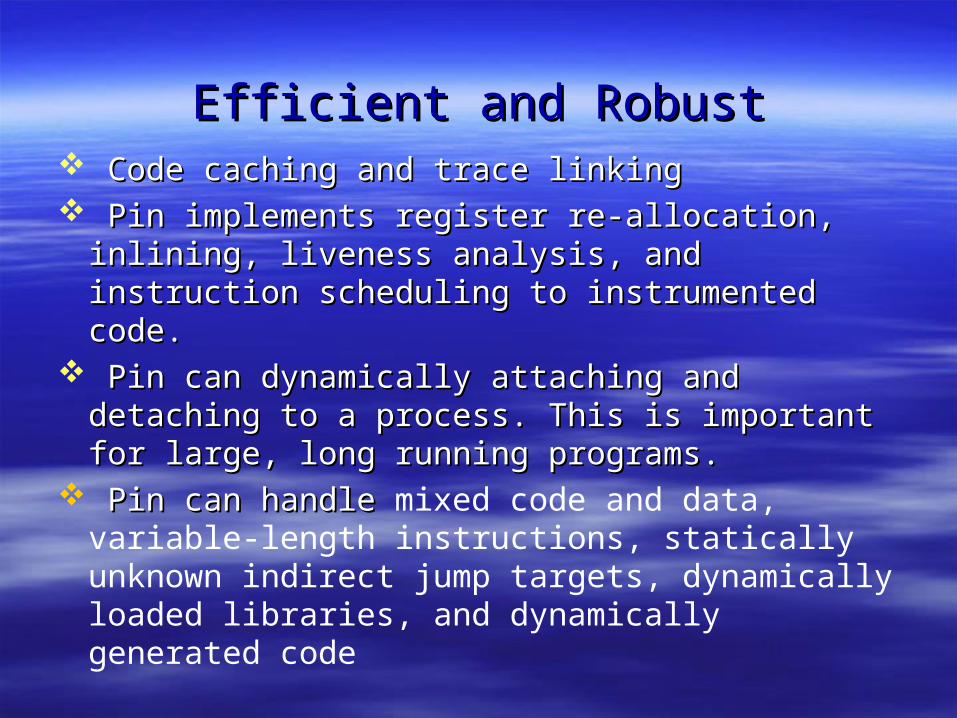
Efficient and RobustEfficient and Robust Code caching and trace linkingCode caching and trace linking Pin implements register re-allocation, inlining, Pin implements register re-allocation, inlining,
liveness analysis, and instruction scheduling to liveness analysis, and instruction scheduling to instrumented code.instrumented code.
Pin can dynamically attaching and detaching to Pin can dynamically attaching and detaching to a process. This is important for large, long a process. This is important for large, long running programs.running programs.
Pin can handle Pin can handle mixed code and data, variable-length instructions, statically unknown indirect jump targets, dynamically loaded libraries, and dynamically generated code
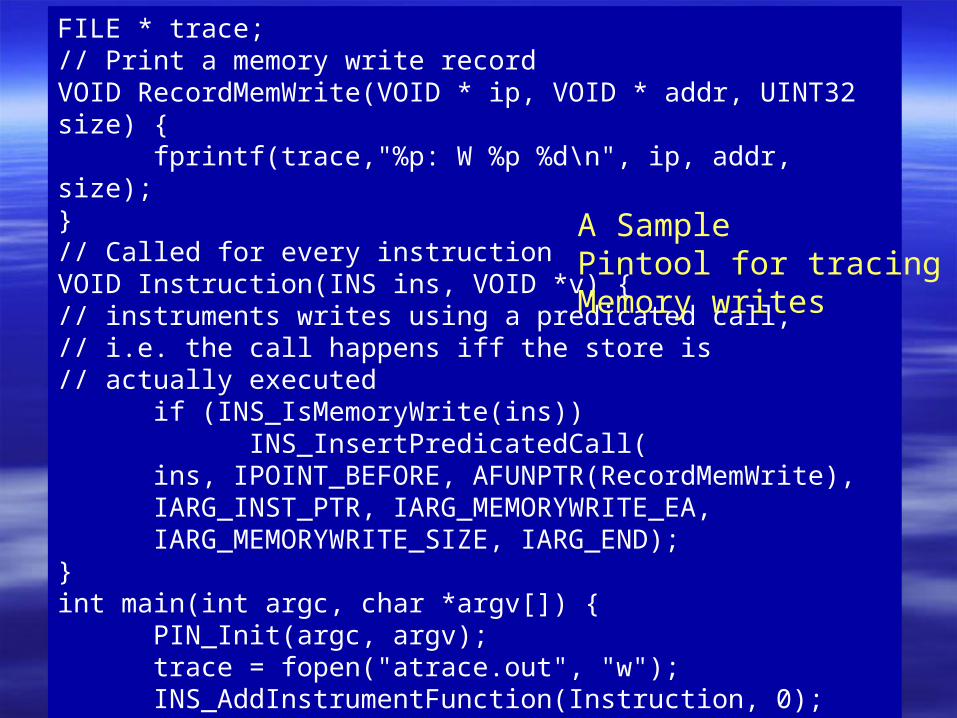
FILE * trace;// Print a memory write recordVOID RecordMemWrite(VOID * ip, VOID * addr, UINT32 size) {
fprintf(trace,"%p: W %p %d\n", ip, addr, size);}// Called for every instructionVOID Instruction(INS ins, VOID *v) {// instruments writes using a predicated call,// i.e. the call happens iff the store is// actually executed
if (INS_IsMemoryWrite(ins))INS_InsertPredicatedCall(
ins, IPOINT_BEFORE, AFUNPTR(RecordMemWrite),IARG_INST_PTR, IARG_MEMORYWRITE_EA,IARG_MEMORYWRITE_SIZE, IARG_END);
}int main(int argc, char *argv[]) {
PIN_Init(argc, argv);trace = fopen("atrace.out", "w");INS_AddInstrumentFunction(Instruction, 0);PIN_StartProgram(); // Never returns
return 0;
A SamplePintool for tracing Memory writes
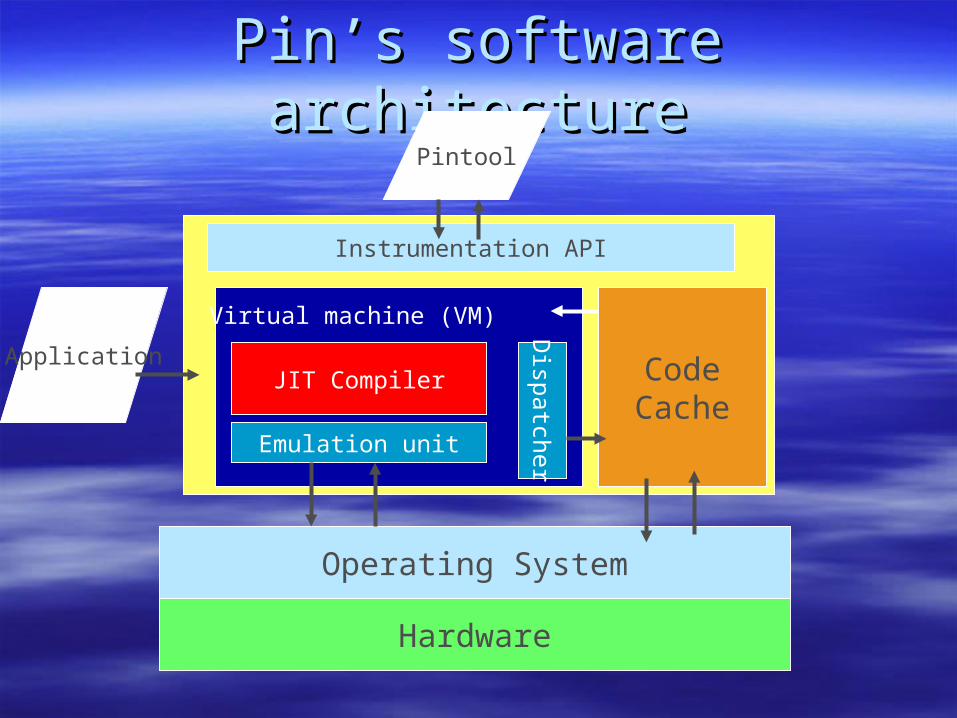
Pin’s software architecturePin’s software architecture
Hardware
Operating System
Application
Pintool
Instrumentation API
JIT Compiler
Emulation unit
CodeCache
Dispatcher
Virtual machine (VM)
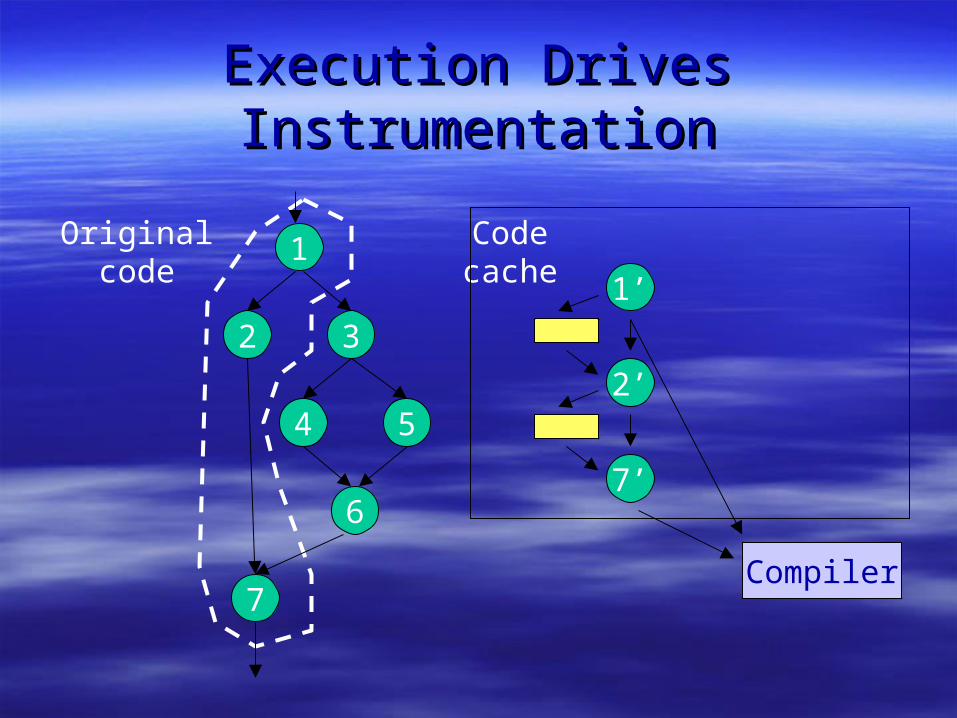
Execution Drives InstrumentationExecution Drives Instrumentation
2 3
1
7
4 5
67’
2’
1’
Compiler
Originalcode
Codecache

Execution Drives InstrumentationExecution Drives Instrumentation
2 3
1
7
4 5
67’
2’
1’
Compiler
Originalcode
Codecache
3’
5’
6’

Instruction-level InstrumentationInstruction-level Instrumentation Instrument relative to an instruction:Instrument relative to an instruction:
– BeforeBefore– After:After:
Fall-through edgeFall-through edge Taken edge (if it is a branch)Taken edge (if it is a branch)
cmp %esi, %edx
jle <L1>
mov $0x1, %edi
<L1>: mov $0x8,%edi
count(10)
count(30)
count(20)

Pin Instrumentation APIsPin Instrumentation APIs Basic APIs are architecture independent:Basic APIs are architecture independent:
– Provide common functionalities such as finding out:Provide common functionalities such as finding out: Control-flow changesControl-flow changes Memory accessesMemory accesses
Architecture-specific APIs for more detailed infoArchitecture-specific APIs for more detailed info– IA-32, EM64T, Itanium, XscaleIA-32, EM64T, Itanium, Xscale
ATOM-based notion:ATOM-based notion:– Instrumentation routinesInstrumentation routines– Analysis routinesAnalysis routines

Instrumentation RoutinesInstrumentation Routines
User writes User writes instrumentation routinesinstrumentation routines::– Walk list of instructions, and Walk list of instructions, and – Insert calls to Insert calls to analysis routinesanalysis routines
Pin invokes instrumentation routines Pin invokes instrumentation routines when placing new instructions in code when placing new instructions in code cachecache
Repeated execution uses already Repeated execution uses already instrumented code in code cacheinstrumented code in code cache

Analysis RoutinesAnalysis Routines
User inserts calls to User inserts calls to analysis routine:analysis routine:– User-specified argumentsUser-specified arguments– E.g., increment counter, record data address, E.g., increment counter, record data address,
……
User writes in C, C++, ASMUser writes in C, C++, ASM Pin provides isolation so analysis does not Pin provides isolation so analysis does not
affect applicationaffect application Optimizations like inlining, register Optimizations like inlining, register
allocation, and scheduling make it efficientallocation, and scheduling make it efficient
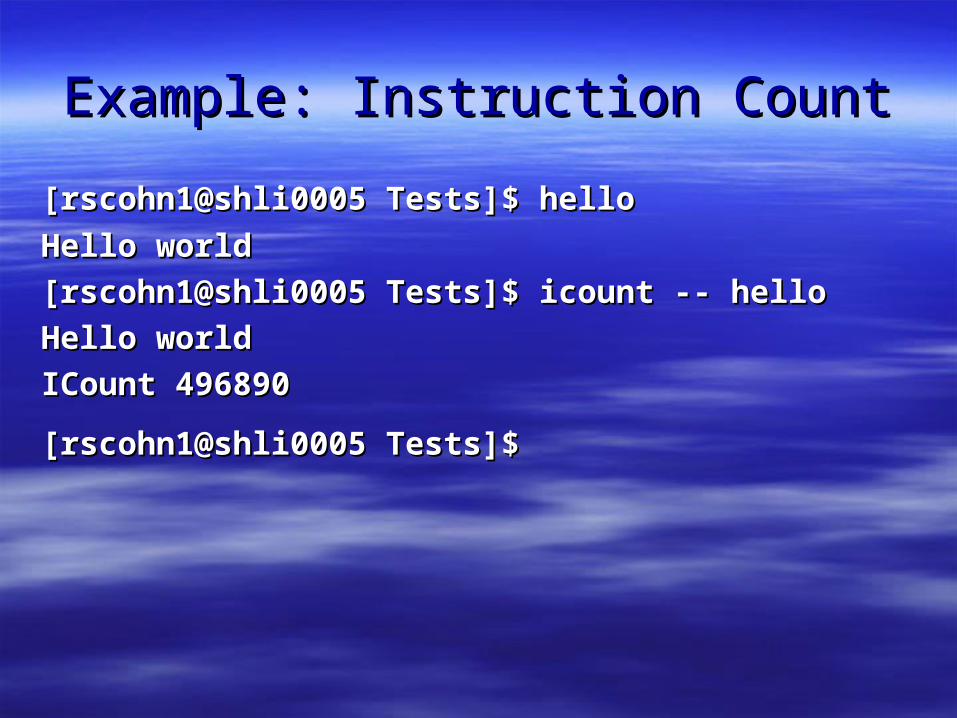
Example: Instruction CountExample: Instruction Count
[rscohn1@shli0005 Tests]$ hello[rscohn1@shli0005 Tests]$ hello
Hello worldHello world
[rscohn1@shli0005 Tests]$ icount -- hello[rscohn1@shli0005 Tests]$ icount -- hello
Hello worldHello world
ICount 496890ICount 496890
[rscohn1@shli0005 Tests]$[rscohn1@shli0005 Tests]$

Example: Instruction CountExample: Instruction Count
mov r2 = 2mov r2 = 2
add r3 = 4, r3add r3 = 4, r3
(p2) br.cond L1(p2) br.cond L1
add r4 = 8, r4add r4 = 8, r4
br.cond L2br.cond L2
counter++;
counter++;
counter++;
counter++;
counter++;

#include <stdio.h>#include "pinstr.H"
UINT64 icount=0;
// Analysis Routinevoid docount() { icount++; }
// Instrumentation Routinevoid Instruction(INS ins){ PIN_InsertCall(IPOINT_BEFORE, ins,
(AFUNPTR)docount, IARG_END);}
VOID Fini(){ fprintf(stderr,"ICount %lld\n", icount);}
int main(int argc, char *argv[]){ PIN_AddInstrumentInstructionFunction(Instruction); PIN_AddFiniFunction(Fini); PIN_StartProgram();}
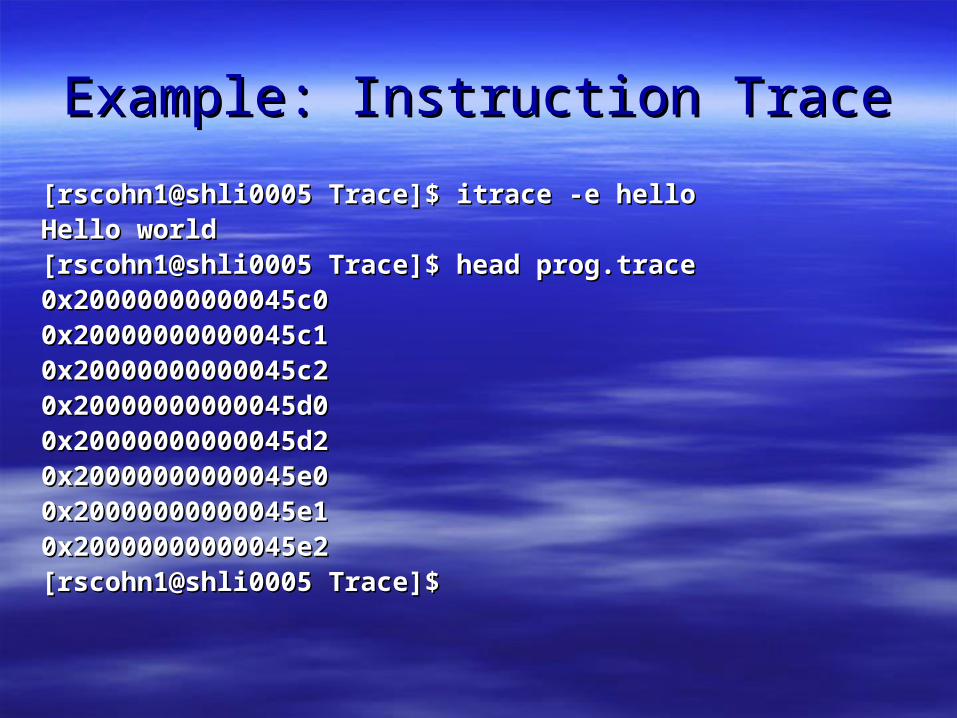
Example: Instruction TraceExample: Instruction Trace
[rscohn1@shli0005 Trace]$ itrace -e hello[rscohn1@shli0005 Trace]$ itrace -e helloHello worldHello world[rscohn1@shli0005 Trace]$ head prog.trace[rscohn1@shli0005 Trace]$ head prog.trace0x20000000000045c00x20000000000045c00x20000000000045c10x20000000000045c10x20000000000045c20x20000000000045c20x20000000000045d00x20000000000045d00x20000000000045d20x20000000000045d20x20000000000045e00x20000000000045e00x20000000000045e10x20000000000045e10x20000000000045e20x20000000000045e2[rscohn1@shli0005 Trace]$ [rscohn1@shli0005 Trace]$

Example: Instruction TraceExample: Instruction Trace
mov r2 = 2mov r2 = 2
add r3 = 4, r3add r3 = 4, r3
(p2) br.cond L1(p2) br.cond L1
add r4 = 8, r4add r4 = 8, r4
br.cond L2br.cond L2
traceInst(ip);
traceInst(ip);
traceInst(ip);
traceInst(ip);
traceInst(ip);

#include <stdio.h>#include <stdio.h>#include "pinstr.H"#include "pinstr.H"FILE *traceFile;FILE *traceFile;void traceInst(long * ipsyll){void traceInst(long * ipsyll){ fprintf(traceFile, "%p\n", ipsyll);fprintf(traceFile, "%p\n", ipsyll);}}void Instruction(INS ins){void Instruction(INS ins){ PIN_InsertCall(IPOINT_BEFORE, ins, PIN_InsertCall(IPOINT_BEFORE, ins,
(AFUNPTR)traceInst, IARG_IP_SLOT, IARG_END);(AFUNPTR)traceInst, IARG_IP_SLOT, IARG_END);}}int main(int argc, char *argv[])int main(int argc, char *argv[]){{ PIN_AddInstrumentInstructionFunction(Instruction);PIN_AddInstrumentInstructionFunction(Instruction);
traceFile = fopen("prog.trace", "w");traceFile = fopen("prog.trace", "w"); PIN_StartProgram();PIN_StartProgram();}}
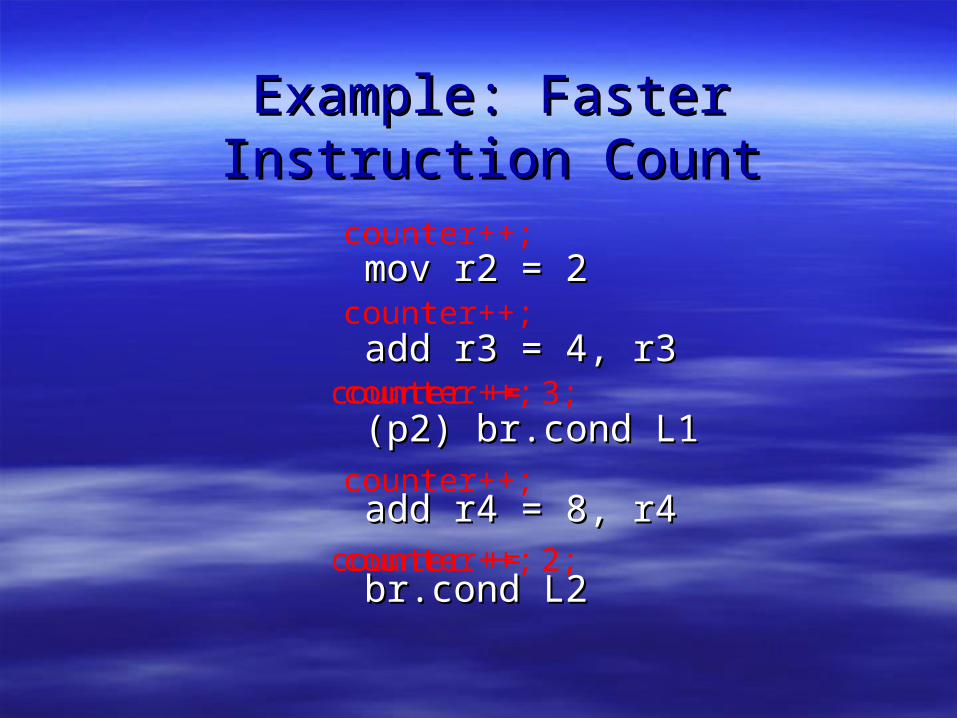
Example: Faster Instruction CountExample: Faster Instruction Count
mov r2 = 2mov r2 = 2
add r3 = 4, r3add r3 = 4, r3
(p2) br.cond L1(p2) br.cond L1
add r4 = 8, r4add r4 = 8, r4
br.cond L2br.cond L2
counter++;
counter++;
counter++;
counter++;
counter++;
counter += 3;
counter += 2;

#include <stdio.h>#include <stdio.h>#include "pin.H“#include "pin.H“
UINT64 icount = 0;UINT64 icount = 0;
VOID docount(INT32 c) { VOID docount(INT32 c) { icount += cicount += c; }; }
VOID Trace(TRACE trace, VOID *v) {VOID Trace(TRACE trace, VOID *v) {for (for (BBL bbl = TRACE_BblHead(traceBBL bbl = TRACE_BblHead(trace); );
BBL_Valid(bbl); bbl = BBL_Next(bbl)) { BBL_Valid(bbl); bbl = BBL_Next(bbl)) {
BBL_InsertCall(bbl, IPOINT_BEFORE, (AFUNPTR)docount, BBL_InsertCall(bbl, IPOINT_BEFORE, (AFUNPTR)docount,
IARG_UINT32, BBL_NumIns(bbl),IARG_UINT32, BBL_NumIns(bbl), IARG_END); IARG_END); }}}}
VOID Fini(INT32 code, VOID *v) { VOID Fini(INT32 code, VOID *v) { fprintf(stderr, "Count %lld\n", icount);fprintf(stderr, "Count %lld\n", icount);
}}
int main(int argc, char * argv[]) {int main(int argc, char * argv[]) { PIN_Init(argc, argv);PIN_Init(argc, argv); TRACE_AddInstrumentFunction(Trace, 0);TRACE_AddInstrumentFunction(Trace, 0); PIN_AddFiniFunction(Fini, 0);PIN_AddFiniFunction(Fini, 0); PIN_StartProgram();PIN_StartProgram(); return 0;return 0;}}
ManualExamples/inscount1.C
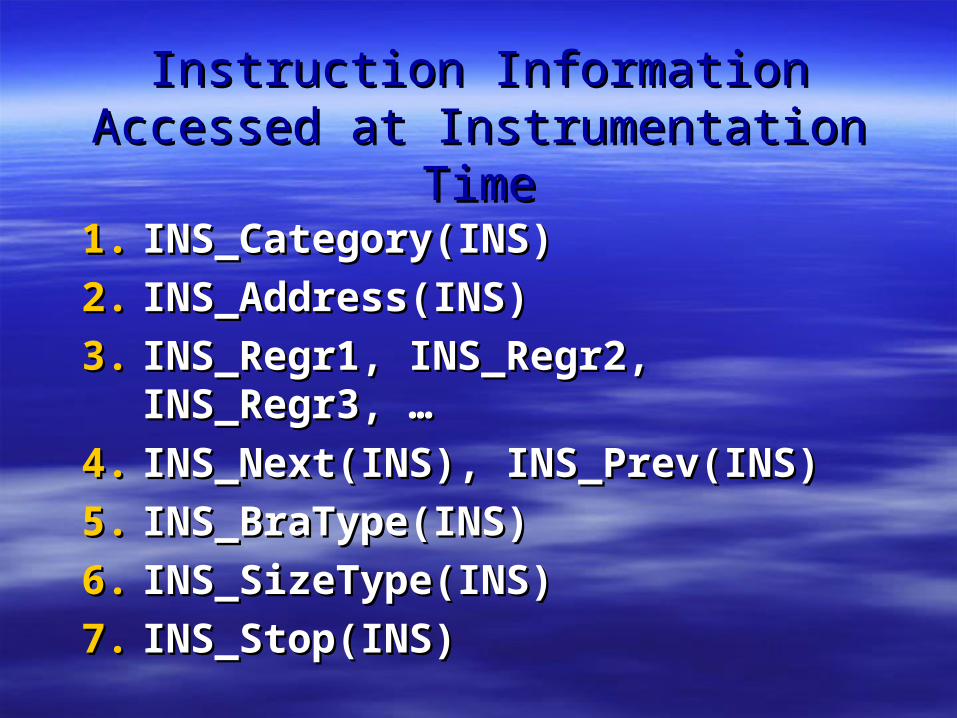
Instruction Information Accessed at Instruction Information Accessed at Instrumentation TimeInstrumentation Time
1.1. INS_Category(INS)INS_Category(INS)
2.2. INS_Address(INS)INS_Address(INS)
3.3. INS_Regr1, INS_Regr2, INS_Regr3, INS_Regr1, INS_Regr2, INS_Regr3, ……
4.4. INS_Next(INS), INS_Prev(INS)INS_Next(INS), INS_Prev(INS)
5.5. INS_BraType(INS)INS_BraType(INS)
6.6. INS_SizeType(INS)INS_SizeType(INS)
7.7. INS_Stop(INS)INS_Stop(INS)
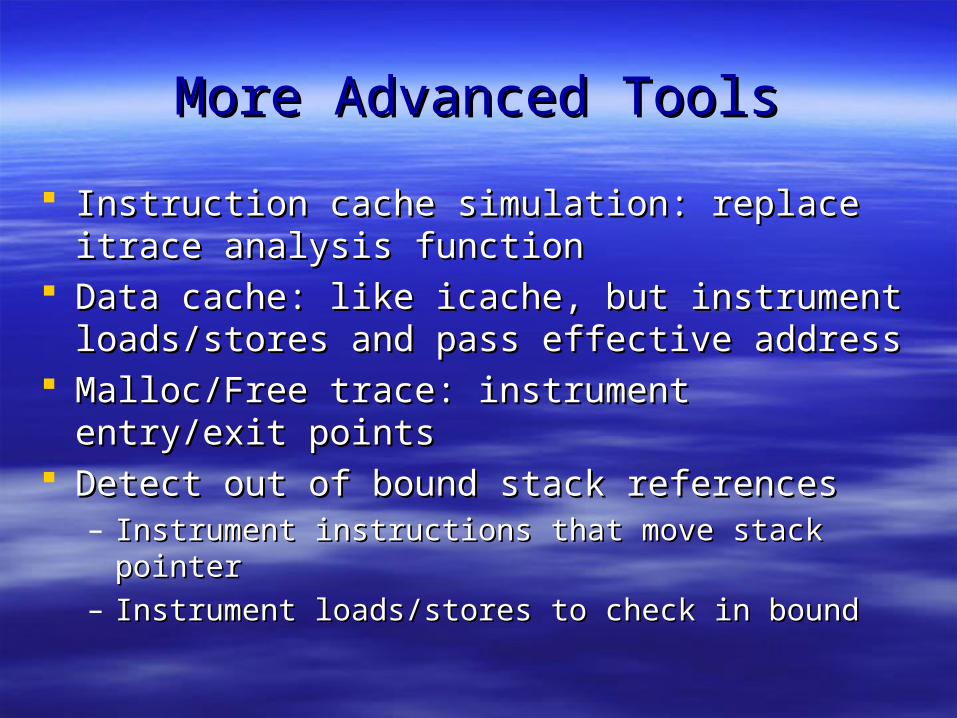
More Advanced ToolsMore Advanced Tools
Instruction cache simulation: replace itrace Instruction cache simulation: replace itrace analysis functionanalysis function
Data cache: like icache, but instrument Data cache: like icache, but instrument loads/stores and pass effective addressloads/stores and pass effective address
Malloc/Free trace: instrument entry/exit pointsMalloc/Free trace: instrument entry/exit points Detect out of bound stack referencesDetect out of bound stack references
– Instrument instructions that move stack pointerInstrument instructions that move stack pointer– Instrument loads/stores to check in boundInstrument loads/stores to check in bound
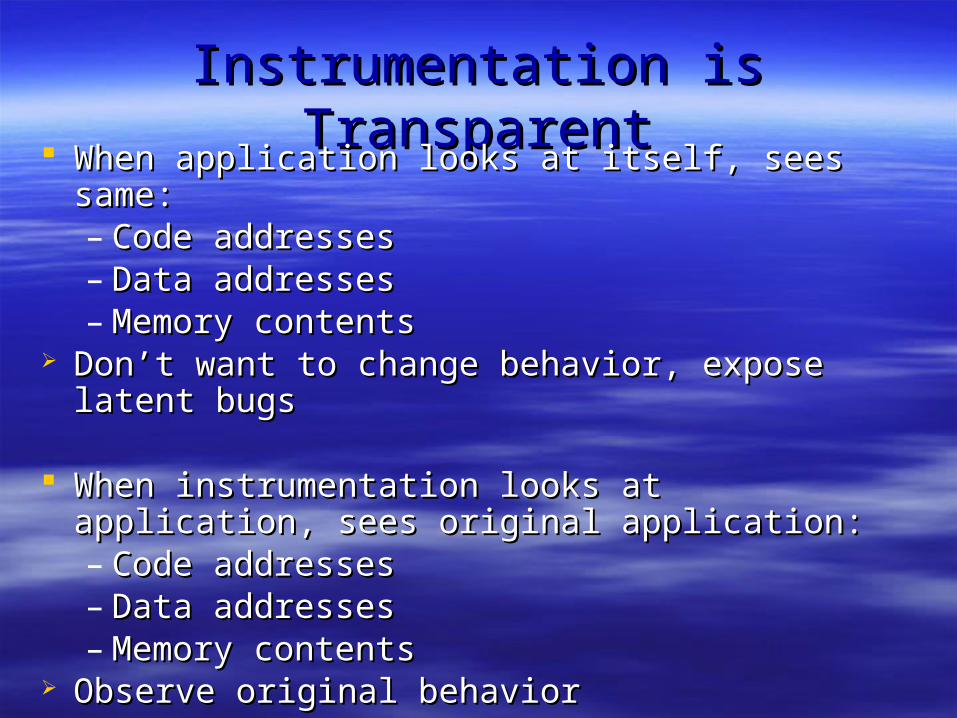
Instrumentation is TransparentInstrumentation is Transparent When application looks at itself, sees same:When application looks at itself, sees same:
– Code addressesCode addresses– Data addressesData addresses– Memory contentsMemory contents
Don’t want to change behavior, expose latent bugsDon’t want to change behavior, expose latent bugs
When instrumentation looks at application, sees When instrumentation looks at application, sees original application:original application:– Code addressesCode addresses– Data addressesData addresses– Memory contentsMemory contents
Observe original behaviorObserve original behavior

Pin Instruments All CodePin Instruments All Code
Execution driven instrumentation:Execution driven instrumentation:– Shared librariesShared libraries– Dynamically generated codeDynamically generated code
Self modifying codeSelf modifying code– Instrumented first time executedInstrumented first time executed– Pin does not detect code has been modifiedPin does not detect code has been modified

Dynamic Instrumentation in PinDynamic Instrumentation in Pin
While program is running:While program is running:– Instrumentation can be turned on/offInstrumentation can be turned on/off– Code cache can be invalidatedCode cache can be invalidated– Reinstrumented the next time it is executedReinstrumented the next time it is executed– Pin can detach and run application nativePin can detach and run application native
Use this for fast skipUse this for fast skip

Pin is freely available at http://rogue.colorado.edu/Pin.

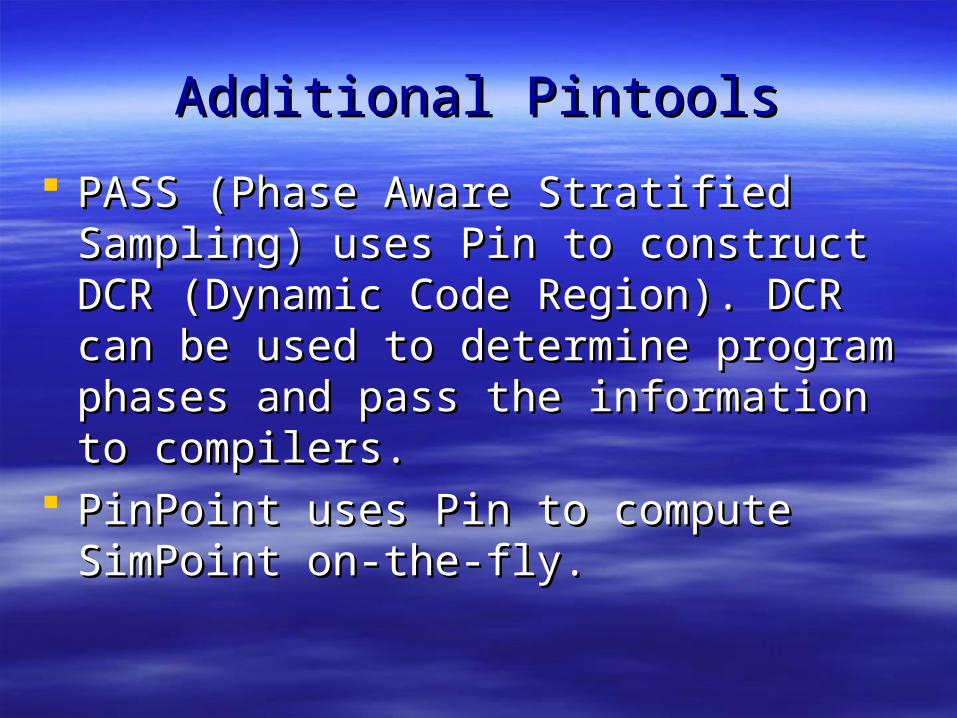
Additional PintoolsAdditional Pintools
PLR (Process Level Redundancy) to check PLR (Process Level Redundancy) to check transient faults in software uses Pin to trace all transient faults in software uses Pin to trace all system calls. It ensures output data from system calls. It ensures output data from redundant processes are consistent before redundant processes are consistent before execution continues.execution continues.
Path coverage expander selectively executes NT-Path coverage expander selectively executes NT-path (Not Taken Path) in order to increase the path (Not Taken Path) in order to increase the execution path coverage to expose potential bugs. execution path coverage to expose potential bugs. It uses Pin to modify the architecture states to It uses Pin to modify the architecture states to force execution go into NT-path. All memory force execution go into NT-path. All memory updates in NT-path are re-directed to a special updates in NT-path are re-directed to a special region.region.
Additional PintoolsAdditional Pintools
PASS (Phase Aware Stratified Sampling) PASS (Phase Aware Stratified Sampling) uses Pin to construct DCR (Dynamic Code uses Pin to construct DCR (Dynamic Code Region). DCR can be used to determine Region). DCR can be used to determine program phases and pass the information to program phases and pass the information to compilers.compilers.
PinPoint uses Pin to compute SimPoint on-PinPoint uses Pin to compute SimPoint on-the-fly.the-fly.