quotation from it or information derived from it is to be ... · at successful and unsuccessful...
TRANSCRIPT

The copyright of this thesis vests in the author. No quotation from it or information derived from it is to be published without full acknowledgement of the source. The thesis is to be used for private study or non-commercial research purposes only.
Published by the University of Cape Town (UCT) in terms of the non-exclusive license granted to UCT by the author.
Univers
ity of
Cap
e Tow
n

GOING THROUGH THE MOTIONS: THE IMPACTS OF FREQUENT
FIRES AND GRAZING PRESSURE ON REPRODUCTION BY
MONTANE GRASSLAND BIRDS
SAMUEL MUCHANE MUCHAI
Percy FitzPatrick Institute
University of Cape Town
2002
Univers
ity of
Cap
e Tow
n

Univers
ity of
Cap
e Tow
n
GOING THROUGH THE MOTIONS: THE IMPACTS OF FREQUENT
FIRES AND GRAZING PRESSURE ON REPRODUCTION BY MONTANE
GRASSLAND BIRDS
MUCHAI, SAMUEL MUCHANE
Thesis presented for the degree of doctor of philosophy in the Percy
FitzPatrick Institute, department of Zoology,
University of Cape Town
April 2002
11
Univers
ity of
Cap
e Tow
n

DECLARATION
This thesis describe original research undertaken towards a PhD. Degree at the Percy
FitzPatrick, University of Cape Town, which has not been submitted in any form towards
degree at any other University. I submit it as my own work and have acknowledged all
assistance I received.
11uchai,Samuel11uchane
CITATION 11uchai, 11. (2002). Going through the motions: the impacts of frequent fires and grazing
pressure on reproduction by montane grassland birds. Ph.D. Thesis. Percy FitzPatrick
Institute, University of Cape Town, Cape Town.
III
Univers
ity of
Cap
e Tow
n

"Happiness comes not from having much
to live on but having much to live for. "
William Arthur Ward
IV
Univers
ity of
Cap
e Tow
n

ABSTRACT
Land management practices have been implicated as a cause for the decline of many
grassland-nesting birds across the globe. While this effect has motivated extensive research
and conservation in the developed northern hemisphere, it remains poorly addressed in
southern hemisphere. Between 1998 and 200 I I examined the effect of fire frequency and
grazing intensity on the density, breeding biology and nesting success of several grassland
bird species that breed in the high altitude grasslands of Wakkerstroom, South Africa.
I established study plots in heavily grazed and annually burned, lightly grazed and
annually burned, and lightly grazed and biennially burned plots. These represent the most
frequently used grassland management regimes in this region. Independent analysis of all
study species showed that daily nesting success was higher under light than heavy grazing.
Similarly, nesting success was higher under biennial burning when compared to annual
burning. Nest predation was the major cause of nest failure during all three years for all
species. The likelihood of nest predation clearly depended upon foliage in the immediate
vicinity of the nest and vegetation within 10 m radius of the nest (the nest patch). In
general, variables important in discriminating between successful and depredated nests
across all species were directly related to vegetation cover, density and horizontal
heterogeneity.
I also examined microhabitat choices, the form of natural selection and the
adaptiveness of preferences in four coexisting grassland bird species (YeHow-breasted Pipit
Hemimacronyx chloris, Grassveld Pipit Anthus cinamomerous, Orange-throated Longclaw
Macrony capensis, and Ayre's Cisticola Cisticola ayressii). Breeding birds selected nest
patches non-randomly and this differed between species. Comparison of vegetation features
at successful and unsuccessful nests supported the idea that nesting success is a strong
selective force on habitat choice. Nest success was higher in preferred than non-preferred
habitat for all the four species, suggesting that preferences were adaptive. Estimation of
fitness functions relating fitness of individuals to critical habitat features suggests that
natural selection might favour preferences for specific habitat features.
Although food abundance and thus amount of food available to populations of
breeding birds significantly differed between management regimes, the study yielded no
evidence for an effect of management-mediated food abundance on feeding rate, nestling
provisioning rates, nestling growth rates, body condition, nest attentiveness and brooding
effort. My results suggest that the food availability alone may not be the most important
v
Univers
ity of
Cap
e Tow
n

factor influencing the production of offspring. Instead, nest predation appeared to be of
major importance in this system.
Theoretically, nest predation increases with activity at nests, and predation rates
should peak during the nestling stage when birds are feeding young. I tested this hypothesis
using three ecologically similar grassland bird species (Yellow-breasted Pipit, Orange
throated Longclaw, and Grassveld Pipit). Parental activity was indeed greater during the
nestling than incubation stage. Nest predation, however, did not increase with parental
activity between these stages in all three study species. I conducted an experiment that
controlled for parental activity (by reusing natural nests of the study species with artificial
clutches) in order to test for nest-site effects. Nests that had a high risk of predation when
used by active parents had a correspondingly high risk of predation when the same nests
were re-used with artificial clutches (Le. when controlling for parental activity). This result
supports the notion that variation in nest-site quality often affects nest predation risk, and
such effects could mask parental activity effects on nest predation. Once-nest site effects
were accounted for, nest predation showed a positive increase with parental activity during
the nestling stage within and across species.
Collectively, the chapters of this thesis help to diagnose the causes and underlying
mechanisms of grassland bird population decreases, and help to identify the most effective
conservation actions. In short, conservation effort for grassland species should be directed
at ensuring that their preferred critical nesting habitat is managed appropriately. I propose
that current intensive grazing pressure and periodic burning should be relaxed by reducing
stocking rates and burning less frequently to benefit grassland bird species. Ideally, grasslands
should be burned biennially and grazed moderately.
VI
Univers
ity of
Cap
e Tow
n

TABLE OF CONTENTS
ABSTRACT ........................................................................................................................... v TABLE OF CONTENTS ..................................................................................................... vii ACKNOWLEDGEMENTS ................................................................................................... xi 1 - GENERAL INTRODUCTION ......................................................................................... 1
History of the South African grasslands ................................................................. 2 Fire and grazing as grassland management tools .................................................. .4 Nest predation, foodlimitation and their effect on avian life history parameters ... 5 Approach and organization of the study ................................................................. 7
2 - Effects of burning and grazing management practices on the nesting success of grassland birds ........................................................................................................................ 9
Abstract. .................................................................................................................................. 9
INTRODUCTION ................................................................................................................ 10 Study species ........................................................................................................ 11
METHODS ........................................................................................................................... 11 Study area ............................................................................................................. 11 Experimental design ............................................................................................. 11 Field work ............................................................................................................. 12 Assessment of vegetation differences between management regimes ................. 12 Nest searches and monitoring ............................................................................... 13
DATA ANALYSIS .............................................................................................................. 14 Assessment of vegetation differences across management regimes .................... 14 Daily Survival and nesting success ...................................................................... 14 Patterns of daily survival and nesting success ...................................................... 15 Cause-specific nest mortality ............................................................................... 15
RESULTS ............................................................................................................................. 16 Effects of management regimes on vegetation ..................................................... 16 Effects of grazing pressure on nest success .......................................................... 17 Effects ofbuming frequency on nesting success ................................................. 20 Causes of nest failure ............................................................................................ 20 Experimental nests ................................................................................................ 20 Effects of season on vegetation across management regimes .............................. 24 Seasonal patterns in daily nesting success ........................................................... 24
DISCUSSION ....................................................................................................................... 26 Effects of fire and grazing management practices on nesting vegetation and nesting success ...................................................................................................... 26 Seasonal pattern in nesting success ...................................................................... 27 Underlying mechanism linking grassland bird population declines to management practices .................................... ; ..................................................... 27
3 - Effects of grassland management practices on density, clutch initiation, clutch size and duration of breeding ............................................................................................................. 31
Abstract. ................................................................................................................................ 31
va
Univers
ity of
Cap
e Tow
n

INTRODUCTION ................................................................................................................ 31 METHODS ........................................................................................................................... 33
Study area ............................................................................................................. 33 Experimental design ............................................................................................. 34 Censusing ............................................................................................................. 34 Assessment of relative food abundance ............................................................... 34
DATA ANALYSIS .............................................................................................................. 35 RESULTS ............................................................................................................................. 36
Effects of management practices on bird density ................................................. 36 Effects of management practices on species richness .......................................... 36 Effects of management practices on nest density ................................................. 36 Effects of management practices on clutch initiation .......................................... 37 Effects of management practices on clutch size ................................................... 45 Number of broods ................................................................................................. 45
DISCUSSION ....................................................................................................................... 47 Species richness is affected by excessive and regular defoliation ...................... .47 Bird abundance is affected by management-related defoliation by management practices ................................................................................................................ 47 Nest density relates to management practices ...................................................... 48 Life history and duration of breeding .................................................................. .49 Clutch size is affected by management practices ................................................. 49
4 - Effects of management practices on grassland birds habitat selection: Is nest site preference under selection and adaptive? ............................................................................. 51
Abstract. ................................................................................................................................ 51
INTRODUCTION ................................................................................................................ 51 STUDY AREA AND METHODS ....................................................................................... 53
Study area ............................................................................................................. 53 Field work ............................................................................................................. 53
DATA ANALYSIS .............................................................................................................. 54 RESULTS ............................................................................................................................. 56
Vegetation differences among nest sites and random sites .................................. 56 Nest patch differences among species .................................................................. 57 Vegetation differences between successful and unsuccessful nest sites .............. 63 Microhabitat preferences ...................................................................................... 63 Adaptiveness and selection on preferences .......................................................... 64 Natural selection on microhabitat choices ............................................................ 64
DISCUSSION ....................................................................................................................... 71 Vegetation differences between nest sites and random sites ................................ 71 Microhabitat differences between species ............................................................ 71 Vegetation differences in relation to nesting success ........................................... 72 Identification of critical habitat features .............................................................. 73 Adaptiveness and selection on preferences .......................................................... 73 Conclusion ............................................................................................................ 74
5 - Concealment is the key to nest survival in grassland bird communities ........................ 77
Vlll
Univers
ity of
Cap
e Tow
n

Abstract. ......................................................................................................................... : ...... 77 INTRODUCTION ................................................................................................................ 77 STUDY AREA AND METHOD ......................................................................................... 78
Nest searches and monitoring ............................................................................... 79 Vegetation sampling ............................................................................................. 79
DATA ANALYSIS .............................................................................................................. 80 RESULTS ............................................................................................................................. 81
Vegetation differences between successful and depredated nest ......................... 81 DISCUSSION ....................................................................................................................... 89
Nest concealment hypothesis: nest-site effects .................................................... 89 Total-foliage hypothesis: nest-patch effects ......................................................... 90
6 - The role of fire frequency in influencing patterns of parental care, nestling growth and body condition of grassland birds ......................................................................................... 93
Abstract. ................................................................................................................................ 93 INTRODUCTION ................................................................................................................ 93 METHODS ........................................................................................................................... 94
Measurements of arthropod abundance (food availability) .................................. 95 Food provisioning and parental care .................................................................... 95 Measurements of nestling growth rates and body condition ................................ 96
DATA ANALYSIS .............................................................................................................. 97 RESULTS ............................................................................................................................. 97 DISCUSSION ....................................................... .............................................................. 108
Relative abundance of prey ................................................................................ 108 Food provisioning, nestling growth rates and body condition between grassland types ......................................................................... ........................................... 108 Nest attentiveness and brooding ......................................................................... 109 Conclusion .......................................................................................................... 109
7 - Nest predation of grassland bird species increases with parental activity at nest.. ....... 111
Abstract ............................................................................................................................... 111
INTRODUCTION .............................................................................................................. 111 STUDY AREA AND METHODS ..................................................................................... 112 RESULTS ........................................................................................................................... 115
Grassland under light grazing with infrequent burning ...................................... 115 Grassland under light grazing with frequent burning ......................................... 116
DISCUSSION ..................................................................................................................... 124
8 - SYNTHESIS ................................................................................................................. 127
South African grassland habitats and their management regimes ...................... 127 Effects of grazing intensity on recruitment ........................................................ 127 Effects of fire frequency on recruitment ............................................................ 129 Underlying mechanisms linking grassland bird population declines to grassland management practices ........................................................................................ 130
IX
Univers
ity of
Cap
e Tow
n

Can differences in life history explain variable responses by species to fire frequency and grazing intensity? ........................................................................ 131 Ecological constraints of nest predation and its influence on the evolution of avian life-histories .............................................................................................. 135 Implication for conservation .............................................................................. l36
REFERENCE ..................................................................................................................... 138
Appendix A - Observer visitation to nests does not affect risk of nest predation in grassland system ................................................................................................................................. 149
Abstract. .............................................................................................................................. 149
INTRODUCTION .............................................................................................................. 149 Study species ...................................................................................................... 150
METHODS ., ....................................................................................................................... 150 Study area ........................................................................................................... 150 Nest searches and monitoring ............................................................................. 150
DATA ANALYSIS ............................................................................................................ 151 RESULTS AND DISCUSSION ......................................................................................... 151 REFERENCE ..................................................................................................................... 155
x
Univers
ity of
Cap
e Tow
n

ACKNOWLEDGEMENTS
I am grateful for financial support for this study provided by the Claude Harris Leon
Foundation as well as a grant secured through Mome du Plessis from the South African
National Research Foundation.
This research was conducted on privately owned farms. Farmers collaborated by providing
the range of management treatments necessary for this study. I wish to extend my sincere
thanks to the following farmers on whose properties this study was conducted: Mr Christe
Davel, Mr Ben Uys, Mrs Heila Smuts, Mr Richards, Mr Hennie Smit, Mr & Mrs Boshoff,
Mr Nkosi, Ds van der Walt and Mr John Burgers. These farmers also extended their
hospitality and friendliness for which I am very grateful. I also owe a debt of gratitude to
Johannes Molman for introducing me to the farmers.
I wish to thank David Nkosi who assisted with data collection. I thank Prof. Mome du
Plessis for his advice and allowing me total freedom in my approach to the study, yet
providing valuable criticisms of unrefined ideas and manuscripts. I also thank David Allan
and Dr. Warwick Tarboton for their invaluable advice in the field.
The study also benefited from constructive criticisms and technical assistance from staff,
colleagues and friends from the Percy FitzPatrick Institute. In particular, I would like to
thank Dr. Penn Lloyd, Dr. Andrew Jenkins for reading the synthesis, Dr. Denis Lepage for
his advice in statistical analysis and Odette Curtis for reading the acknowledgement.
Thanks also go to Hilary Buchnan, Chris Tobler, Lionel Mansfield and Danelle du Toit for
their technical and administrative support.
I am also grateful to Ms Glenn Ramke for her assistance while in Wakkerstroom. Other
special thanks go to Prof. Tom Martin for his important discussions and critical comments,
Prof. Dolph Schluter for kindly providing one of the software programmes for statistical
analysis and Dr. Leon Bennun for helping to shape what I am now. Finally I thank all those
who have helped me in any way during my lifetime including family and friends who in
one way or the other also contributed to the success of this study.
xi
Univers
ity of
Cap
e Tow
n

GENERAL INTRODUCTION
Vegetation types having similar vegetation structure, sharing important plant species and
having similar ecological processes constitute a biome (Low and Rebelo 1996). Different
grassland vegetation types (also known in South Africa as grassveld) are distinguished as
components of the southern African grassland biome. This biome is located primarily on
the central plateau of South Africa, and the inland areas of K waZulu Natal and the Eastern
Cape (Low and Rebelo 1996). Topography is mainly flat and rolling with some steeply
slopes on the escarpment (Low and Rebelo 1996). The South African grassland biome
covers 349 174 km2 (Cowling et aI., 1997), accounting for 16.5 % of the South African
land surface area. Despite hosting a remarkable and unique fauna and flora (see Siegfried
1989 for a comparision with other biomes), little appreciation has been given to this biome
as having any biotic resources worth of conservation (Tarboton 1997b).
In South Africa, as elsewhere in the world (Keith et al. 1992), the plight of
grassland is relatively under-appreciated. For example, only 2% of the grassland biome in
South Africa is conserved in the formal protected area estate, compared to 78% of the
forest biome (Siegfried 1992). Grasslands are under considerable threat from massive
transformation. Sixty-five percent of the pristine grassland biome is already transformed by
cultivation, afforestation, industrialisation, mining and urbanisation (Scharfetter 1987, Allan et
al. 1997; Tarboton 1997b; Low and Rebelo 1996, Cowling et al. 1997). The grassland biome,
in particular, is also subjected to rapid retreat due to degradation by bad management
practices (Brooke 1984, Clancey 1985, Kruger et aI, 1995, O'Connor and Bredenkamp
1997, Tarboton 1997 a). Being the most economically developed country on the continent,
South Africa's biological resources, and particularly its highland grasslands, have been
heavily impacted by man (IDCN 1990).
The Southern African grassland biome comprises a high incidence of fauna and
flora (Barnes 1998). Three hundred and fifty (350) bird species are found in the grassland
biome (Harrison et al., 1994), of which about 40% are considered to be obligate or true
grassland birds species (Le. exclusively adapted to and entirely dependent on grassland
habitats). Twenty-five (25) of the latter species are of conservation concern (Barnes 2000).
Ten (10) of the true grassland birds species are endemic to the South African grassland
(Brooke 1984, Colar et al. 1994, Barnes 1998,2000). These include the Yellow-breasted
pipit Hemimacronyx (Anthus) chloris, Bald Ibis Geronticus calvus, Blue Korhaan
1
Univers
ity of
Cap
e Tow
n

Eupodotis caerulescens, Rudd's Lark Heteromirafra ruddi,· Botha's Lark Spizocorys
jringillas, Buff-streaked Chat Oenanthe bijasciata, Orange-breasted Rockjumper Chaetops
auruntius, Drakensberg Prinia Prinia hypoxantha, Mountain Pipit Anthus hoeschii and
Drakensberg Siskin Sernus symonsi. Of these, Rudd's Lark is considered to be globally
critically endangered and Bald Ibis, Botha's Lark and Yellow-breasted Pipit as globally
vulnerable (Birdlife International 2000). The former category implies that a species is
facing an extremely high risk of extinction in the wild in the immediate future. Although
this grassland habitat and its bird populations are thought to be in decline (Clancey 1985,
Keith et al. 1992), remarkably little is known about the status of its birds, their ecology,
and how they are affected by current land-use changes (but see Hockey et al. 1988). The
biome also hosts many other fauna including a wide diversity of grasshoppers, (Dirsh 1956,
Brown 1962, Armstroom and Hensbergen 1997), butterflies (Pringle et al. 1994), reptiles,
amphibians, molluscs, and other community (Barnes 1998). Floristically, the grassland
biome comprises a centre for plant endemism and diversity for many large genera, with an
estimated 3788 species in the core region, or 82 species per km2 (Gibbs 1987, Matthews et
al. 1993). High rates of endemism are likely to be found among other taxa as well (see
Barnes 1998).
History of the South African grasslands
The habitat at any point is, in part, a function of its history, extent, and trajectory of change
at multiple spatial and temporal scales (Scott et a1.1997). Evidence from pollen
macrofossils from several sites in South Africa suggests that grasses have essentially been
in place throughout the Holocene, and that they were often widespread during the
Pleistocene (Scott et al.1997). Although there is evidence of some movements of
boundaries within the grassland biome, data from different sites in South Africa suggest
that the grassland biome occupied roughly the same area during the Holocene as it does
today (Scott et al.1997).
Some human impacts on South African grassland ecosystems possibly were started
by early Iron-Age farmers in about 250 AD (Feely 1979, 1987). Prior to the introduction of
modem farming and livestock, hunting and gathering was the only land use on the South
African grassland and savannah (Downing 1978). Until 2000 years ago, the native San
(Bushmen) and Khoikhoi (Hottentots) people occurred at low density and had little impact
on the grasslands (Downing 1978). In their time, these people hunted wild animals and
2
Univers
ity of
Cap
e Tow
n

gathered wild roots and herbs amid teeming herds of buffalo, wildebeest, blesbok, and
other herbivores that roamed the huge expanse of the grasslands. These wild herbivores
were nomadic or migratory, occurring infrequently at high density for short periods.
Although it is not very well known how often natural fires occurred, presumably they did
not occur as often as the present prescribed burning which has increased burning of
grasslands both in scale and extent (Downing 1978).
The arrival of the Nguni speaking people some two thousands years ago showed the
start of a gradual change in the grasslands (Feely 1987, Downing 1978). However, the
arrival of European whites from around 1652 accelerated the change (Downing 1978). The
arrival of the European whites also opened the region to thousands of traders and
commercial settlers and hunters. Extensive populations of wild ungulates were hunted on
the grassland until they were virtually eliminated towards the latter part of the 19th century.
With the extennination of these wild herbivore populations, the grasslands were settled by
fanners who kept sedentary herds of livestock, or who cultivated crops (Feely 1987,
Downing 1978).
With development of increasingly modem fanning techniques and fann machinery,
the period between 1850 to 1950 resulted in the conversion of thousands of hectares of
native grassland to cultivated crops like maize (today 3.5 million ha of maize are planted
each year), wheat, cabbages, fruit and plantation of forests. The discovery of gold
(Witwatersrand and Northern Free State), diamond (Northwest) and coal (Mpumalanga
highland grassland and Northern KwaZulu-Natal) in the early 19th century transformed
parts of the grassland to mining fields (Petersen et al. 1985, Macdonald 1989, Tarboton
1997b) and associated industries (Preston-Whyte and Tyson 1988, Tyson et al. 1988).
Urban cities and towns like Johannesburg (Gauteng), Bloemfontein, Klerksdorp,
Newcastle, Witbank, and Welkom are today situated within the grassland biome.
Grasslands have diminished as intensive agriculture, afforestation, mmmg,
excessive burning, and the sustained pressure of intensive grazing by livestock have
steadily replaced the pristine, native highland grasslands (e.g. see Downing 1978,
O'Connor and Bredenkamp 1997). Most of the fauna that was once common in this region
is locally extinct, rare or endangered, and the species that survive today do so in dwindling
numbers in the small, fragmented grassland remnants.
Many birds inhabiting grasslands have undergone significant population declines
throughout the world (Robbins et al., 1989, Goriup 1988, Knopf 1997, Bennun and Njoroge
3
Univers
ity of
Cap
e Tow
n

1999, Muchai et al. 2002) and seem to be showing the most general and extensive
population declines of any group of birds (Martin 1992a). In the South African highland
grasslands, for example, numbers of Yellow-breasted Pipit (Globally vulnerable) and Rudd's
Lark (Globally critically endangered), have declined drastically throughout much of their
breeding range over recent years almost without being noticed (Tarboton 1997b, Hockey et
al. 1988). In many cases, the decline comprises groups of species that are ecologically
similar, suggesting general underlying causes for these declines (see Askins 1993,
Caughley 1994). In South Africa, intensified grazing by livestock and unnatural fire
regimes have been suggested as the main causes of such declines (Allan et al. 1997,
Tarboton 1997a).
Livestock grazing is a dominant land use in the high-altitude grasslands of South
Africa.
Although periodic fire and grazing have both been used extensively as management tools
since the 1930s (Mentis 1981, Macdonald 1989), the ecological effects of these
management practices on the reproduction of birds in the South African grasslands remain
poorly understood.
Fire and grazing as grassland management tools
Semi-natural and natural grasslands are dynamic systems dependent on regular disturbance
such as grazing or fire for maintaining vegetation structure (Knopf and Samson 1997).
Farmers in the Wakkerstroom study area bum immediately after the onset of summer rains.
Both periodic fire and grazing have historically been prominent features of natural ecology
of the grasslands, here in South Africa and elsewhere, and both continue to be important
ecological processes today (O'Connor and Bredenkamp, 1997, Knopf and Samson 1997).
The role of fire (Leopold et al. 1963, Wright and Bailey 1982, Wade and Lundsford 1990)
and grazing (Michunas et al. 1988) in maintaining diversity in ecosystems, including
grassland systems is well known as well as how it affects livestock production (Mentis
1981, Macdonald 1989, O'Connor and Bredenkamp 1997). However, the indirect impacts
of fire and grazing on other biota are not known.
Grazing climax grasslands are maintained by grazing (Tainton 1981). Grazing is
used as a management tool to remove accumulated material left over from previous
seasons, to stimulate new growth, and to control encroachment of undesirable plants.
Grazing climax grasslands are sweet (i.e. lower fibre content and maintain their nutrient in
4
Univers
ity of
Cap
e Tow
n

the leaves throughout the whole year) and do not deteriorate if under-utilised. There is
therefore no real need to remove accumulated material by means other than grazing
(Tainton 1981). Overgrazing tends to increase the proportion of sour grass. Thus careful
management of grassland is required to maintain the abundance of sweet grass. Sweet
grasses predominate at lower rainfall (below 625 mm). These grasslands do not withstand
frequent fire and regular burning has a negative effect (Tainton 1981). Despite this, most
landowners burn these grassland annually.
Fire climax grasslands are maintained by fire (Tainton 1981). Fire is mainly used as
a management tool to burn off unpalatable growth left over from previous seasons, to
stimulate new growth, to control encroachment of undesirable vegetation, and to control
ticks and other parasites (Mentis 1981, O'Connor and Bredenkamp 1997). Fire climax
grasslands are sour (Le. lower fibre content and tend to withdraw their nutrients from the
leaves during winter so that they are unpalatable in the mature growth stage). This
grassland deteriorates if it is left unutilised even for short periods, thus requiring frequent
burns (Tainton 1981). However, since it is grazed throughout summer, accumulation of
litter generally does not occur. Thus frequent burning is not justified. Although optimal
burning frequency is supposed to vary according to the rate of litter accumulation (Stuart
Hill and Mentis 1982), most farmers within these grasslands burn their farms annually
irrespecti ve of litter accumulation (Tainton 1981). As a result, over 90 % of the grasslands
are burned annually.
Nest predation, food limitation and their effect on avian life history parameters
One possible indirect link between grassland management practices and grassland bird
population declines could be through reproductive dysfunction through reduced nesting
success.
Alteration of habitats by management practices is likely to affect nesting success through
removal or reduction of nesting substrates which conceal nests from nest predators (e.g. see
Ammon and Stacey 1997). Yet, few studies have examined relationships between nesting
success of grassland birds and grassland management practices. Nest predation is the
primary cause of reproductive failure for many passerine birds (Ricklefs 1969, Martin and
Roper 1988), and is thought to be a critical factor shaping many aspects of avian
reproductive biology, behaviour and a variety of life history strategies in birds (Skutch
1949, Lindern and Meller 1989, Kuleza 1990, Bosque and Bosque 1995, Martin et al.
5
Univers
ity of
Cap
e Tow
n

2000a). Only a few studies have shown a relationship between nest predation and general
habitat structure (Bowman and Harris 1980), nest·site habitat features (Martin and Roper
1988, Nonnent 1993), the behaviour of nesting birds (Cresswell 1997), and parental
activity (Skutch 1949, Martin et al. 2000b).
Further, there are few documented examples of life history shifts induced by nest
predation (Julliard et al. 1997). Nevertheless, the risk of nest predation may be a critical
factor affecting clutch size (Skutch 1949, Perrins 1977, Ricklefs 1977, Martin et al. 2000a),
nest site selection (Martin and Roper 1988, M011er 1988, Martin 1998), patterns of nest
attentiveness (Martin and Ghalambor 1999) and patterns of parental effort (Skutch 1969,
Martin 1992, Martin et al. 2000b). Empirical demonstration of the role of nest predation on
avian life history is mostly lacking (Martin et al. 2000a), particularly in the tropics where
predation is intense (Ricklefs 1969, Skutch 1976).
Population declines require immediate action, but such actions will be misguided if
we are not managing the appropriate habitat features. Yet, proper identification of critical
habitat features influencing fitness, which are necessary for effective management effort, is
still lacking. When birds settle in habitats and select nesting patches, they are believed to
do so non-randomly (Fretwell 1972). However, it remains unclear as to why individuals are
not randomly distributed across habitat types. Nest-site microhabitat choices are assumed
to be adaptive such that fitness is greater in preferred than non-preferred microhabitats
(Jaenike and Holt 1991). Although genetic variation for habitat selection is common,
particularly in invertebrates (Kekick et al. 1980, laenike and Holt 1991), only few studies
have attempted to test the genetic basis of habitat selection in birds in particular (Martin
1998), or vertebrates in general (Schluter 1988).
Grassland management regimes can change the diversity, dominance, cover and
structure of grassland plant communities (e.g. see Milchnas et al. 1988, Bullock and
Pakeman 1997, Van der Koppel et al. 1997, Dupre and Diekmann 2001). The defoliation of
grassland by disturbance regimes (herbivory and fire) can potentially have positive or
negative consequences for the various members of the food chain that live in the grassland
(e.g. see Dickson 1981, Curry 1994). Availability of food is often considered to be the most
important factor influencing the production of offspring and variation in life history traits
of birds (Lack 1968, Roff 1992, Martin 1987; but see Ricklefs 1969, Martin 1995a).
Nestling growth and survival are particularly sensitive to variation in food supply in several
bird species (Rondenhouse and Holmes 1992). Further, low food availability can influence
6
Univers
ity of
Cap
e Tow
n

schedules of parental care (Weathers and Sullivan 1989) and considerably constrain the
amount of food delivered to nestlings (e.g. see Harris 1969, Quinney 1982). This in turn
can influence nestling growth and body condition. Reduced availability of food, is also
predicted to affect bird densities (e.g. see Milchnas), limit clutch size (Ruiz et al. 2000) and
the number of breeding attempts (Martin 1987, 1993a, Rodenhouse 1986), thereby
influencing breeding productivity.
The general trend in variation of life-history strategies among species has chiefly
been attributed to trade-offs maximising lifetime reproductive output (e.g. Roff 1992).
Although a variety of traits can be influenced by costs associated with local conditions, one
trait that seems consistently modified is clutch size (Skutch 1949, Lima 1987, Martin
1988b). Despite the fact that clutch size is one of the traits showing close adjustments to
local conditions (Lack 1968), the proximate mechanism by which clutch size is adjusted
can vary. The evolution of clutch size has long been attributed to food (Lack 1948,
Charnov and Krebs 1974), adult survival (Charlesworth 1994), environmental
unpredictability (Stearns 1992), and nest predation (Slagsvold 1982, Martin 1995a, Julliard
et al. 1997, Martin et al. 2000a). Skutch (1949) proposed that increased parental activity
can proximately increase the risk of nest predation, which in turn constrains the rate at
which parent birds can deliver food to young. This in turn constrains clutch size by limiting
the number of young that parents can feed.
Approach and organization of the study
The study was conducted high altitude grasslands of Wakkerstroom, Mpumalanga
province, South Africa. The study species included nine key grassland bird species, viz.
Yellow-breasted Pipit Hemimacronyx chloris (YBP), Orassveld Pipit Anthus
cinamomerous (OP), Orange-throated Longclaw Macronyx capensis (OTL), Ayres'
Cisticola Cisticola ayressii (AC), Long-tailed Widow Euplectes progne (L TW), Common
Quail Cotumix coturnix (CQ), Quail Finch Ortygospiza atricollis (QF), Rudd's Lark
Heteromirafra ruddi (RL), and Red-capped Lark Calandrella cinerea (RCL). These were
used as representative species to help in understanding the processes and mechanisms
involved in the causes and effects of avian responses to management practices. In
particular, the species were used to answer six key questions: (1) how do changes in plant
diversity, dominance, cover and structure relate to various management practices; (2) how
7
Univers
ity of
Cap
e Tow
n

are the populations of grassland birds species affected by grass species composition, grass
cover, and vegetation structure; (3) how do various land uses and management practices
affect the reproductive success of grassland birds; (4) how does grassland bird food
(arthropod) abundance relate to different grazing intensity and fire frequency; (5) what are
the effects of grassland management practices on parental care (food provisioning.
brooding, breeding behaviour, and activity at nest); and (6) how do birds' health and body
condition relate to grazing and burning management regimes?
The results of this study are presented as a sequence of discrete papers (Chapters 2-
7). This approach allows quick communication of results, but eventually results in some
repetition, particularly in the presentation of the methods used. When this thesis is read in a
single sitting, this repetition is likely to become tedious and I apologize in advance for this.
The synthesis (Chapter 8) paints the big picture of our understanding concerning the
management of grasslands for the benefit of conservation-dependent birds.
Finally, I present my results of observer effects on nesting success as an appendix
chapter (Appendix A).
8
Univers
ity of
Cap
e Tow
n

Effects of burning and grazing management practices on the nesting success of
grassland birds
Abstract.
Land management practices have been implicated as a cause for the decline of many
grassland-nesting birds. One possible link between management practices and avian
population decline could be a reduction in nesting success. I examined from 1998 through
2001 the effect of management practices on nesting vegetation and nesting success of the
Yellow-breasted Pipit (vulnerable), Rudd's Lark (critically endangered) and other
grassland birds that breed in the high altitude grasslands of Wakkerstroom, South Africa.
Study plots were set out in heavily grazed and annually burned (H+B), lightly grazed and
annually burned (L+A), and lightly grazed and biennially burned plots (L+B). These
represent the most frequently used grassland management regimes. Vegetation cover,
structure and heterogeneity were lowest under heavy grazing (H+A), intennediate under
light grazing (L+A), and highest under biennial burning (L+B). Only a few Grassveld
Pipits, Red-capped Larks and one Rudd's Lark ever bred in heavily grazed plots.
Independent analysis of all study species showed that daily nesting success was higher on
lightly grazed than heavily grazed plots. Similarly, nesting success was higher under biennial
burning than under annual burning. Livestock grazing and burning clearly affects availability
and quality of nesting substrates for grassland birds thus increasing nest predation. Nest
predation is one of the potential causal links between management regimes and population
declines in grassland birds and this is in accordance with other studies. The poor nesting
success of study species in intensively grazed and frequently burned grasslands suggests
that conservation effort for grassland species should be directed at ensuring that their
preferred critical nesting habitat is managed appropriately. Ideally, grasslands should be
burned biennially and grazed only moderately.
Key words: Grassland birds, livestock grazing, burning, nest success, rarity,
population declines.
9
Univers
ity of
Cap
e Tow
n

INTRODUCTION
Many grassland birds have undergone significant population declines throughout the world
(Robbins et ai. 1989, Goriup 1988, Green 1995, Knopf 1997, Bennun and Njoroge 1999)
and seem to be showing the most general and extensive population declines of any group of
birds (Martin 1992). In the South African highland grassland biome, for example, numbers of
Yellow-breasted Pipit (Globally vulnerable) and Rudd's Lark (Globally critically endangered)
(BirdLife International 2000), have declined drastically throughout much of their breeding
range over recent years almost without being noticed (Tarboton 1997a, Hockey et al.
1988). In many cases, the decline comprises groups of species inhabiting the same habitat
and/or having similar ecological requirements, signifying that there may be some general
underlying causes for these population declines (also see Askins 1993). Many plausible
causes have been mentioned in the declining-population paradigm (e.g. see Caughley,
1994) worldwide and regionally. In South Africa, changing land-use and inappropriate
management practices have been implicated as the primary causes behind the observed
patterns in population declines of grassland bird species (Allan et al. 1997, Tarboton
1997b). Although periodic fire and grazing have both been extensively used as
management tools in the South African highland grasslands since the 1930s (Mentis 1981,
Macdonald 1989), the ecological effects of these management practices on grassland birds'
habitats and avian population viability remain poorly understood. One possible indirect link
between grassland management practices and grassland bird population declines could be
reproductive dysfunction through reduced nesting success. Alteration of characteristics of
habitats by agricultural land-use should affect nesting success through the removal or
reduction of nesting substrates (e.g. see Ammon and Stacey 1997).
Proper and reliable diagnosis of the causes of population declines is critical for
effective management and in deciding priorities for of conservation action (e.g. see Pimm
et ai. 1988, Martin 1993b, Green 1995, Martin 1995b).
In this paper I conduct controlled field experiments to test the hypothesis that
nesting success (egg survival, and nestling survival) of South African high altitude
grassland birds varies in relation to grazing and burning management practices. First, I
show that management regime affects vegetation characteristics. Second, I show that both
livestock grazing and burning regime affect nesting success. Third, I partition causes of
nest mortality into cause-specific components in order to understand the mechanisms that
limit avian reproductive success. Fourth, I show that vegetation characteristic change with
10
Univers
ity of
Cap
e Tow
n

season and that nest mortality decreases with an increase in vegetation structure, which
provides improved concealment for nests.
Study species
My study focussed on eight ground-nesting grassland birds, viz. Yellow-breasted Pipit
Hemimacronyx (Anthus) chloris (YBP), Grassveld Pipit Anthus cinamomerous (GP),
Orange-throated Longclaw Macronyx capensis (OTL), Ayres' Cisticola Cisticola ayressii
(AC), Long-tailed Widow Euplectes progne (L TW), Common Quail Coturnix coturnix
(CQ), Quail Finch Ortygospiza atricollis (QF), Rudd's Lark Heteromirafra ruddi (RL), and
Red-capped Lark Calandrella cinerea (RCL).
METHODS
Study area
The study was conducted in the high altitude grasslands of Wakkerstroom (centered at 270
10' S, 300 06' E) in Mpumalanga province, South Africa at 1800-2250 m A.S.L. from
1998-2001. The main land use in the Wakkerstroom district is large-scale livestock farming,
for beef. The district experiences a temperature climate with mild to warm summers, and
cold and dry winters with occasional snow. Rain falls in summer at an average rate of
between 700 mm and 1200 mm. Prescribed burning and grazing are used as management
tools over the entire South African highland grassland biome. The highland grassland of
Mpumalanga has been under considerable pressure from overgrazing since the 1930s
(Downing 1978, Edwards 1981, Hockey et al. 1988). Also, although the optimal burning
frequency is supposed to vary according to the rate of litter accumulation (Stuart-Hill and
Mentis 1982), most farmers in Mpumalanga burn their farms annually irrespective of litter
accumulation (Tainton 1981). As a result, over 90 % of the grassland get burned every
year.
Experimental design
To examine effects of different grassland management practices on reproductive success,
and to test the above hypothesis, I controlled for slope and aspect and selected plots
representing three sets of management regimes, viz. (1) heavily grazed and annually burned
(H+A); (2) lightly grazed and annually burned (L+A); and (3) lightly grazed and biennially
burned (L+B). Six replicate treatment plots were used for each management regime. The
11
Univers
ity of
Cap
e Tow
n

treatment plots (experimental units) were separated from others by at least 500m wide
strips and were all within 10 km2 of continuous grassland. All study plots were
approximately 25 ha in size. Grazing intensity was defined as the number of large animal
unit grazing in an area of one hectare (halLAU), or the grazing area allocated per each large
animal units (LAU/ha). One LAU is equivalent to 1 cow (454 kg) or 5 sheep (Owen-Smith
and Dankwerts 1997). Heavy grazing intensity was assumed to be > 3 LAU/ha while light
grazing was < 1.5 LAU/ha. During the 199811999 breeding season, I controlled for burning
and tested for effects of grazing (heavy versus light). During the 1999-2001 breeding
season, I controlled for grazing and tested for effects of burning (annual versus biennial).
Field work
The study involved three major activities: (1) vegetation surveys across management
regimes to determine how habitat variables related to management practices; (2) nest
finding and monitoring natural nests to assess nesting success between species and across
treatment plots; and (3) reuse of natural nests with artificial clutches (real and artificial
eggs) to assess nesting success between species and between treatment plots for
experimental clutches.
Assessment of vegetation differences between management regimes
Vegetation structure was surveyed three times for each treatment viz. at the start of the
spring growing season, and two and four months latter. These surveys used techniques
modified from Wiens and Rotenburry (1981). At 50-m intervals along each of the three 500
m long transects, I positioned myself at a random point, closed my eyes and turned several
times before throwing a I-m stick upwards. A 10-m tape was then laid out perpendicularly to
the transect with the zero mark at the thick end of the stick. Vegetation was then sampled at
I-m intervals yielding 100 point samples of vegetation per transect (i.e. a total of 300 point
samples per grassland plot). At each sampling point, a thin (6-mm diameter) rod was
placed vertically through the vegetation to the ground, and the number of contacts ("hits")
with plants within 0-5 cm, 5-10 em, 10-20 cm, 20-30 cm, 30-40 cm, 40-50 cm and 60-100
cm heights intervals recorded. The plant species making contact with the rod at each I-m
interval of the tape, as well as litter depth was recorded. Bare ground or presence of rocks
was noted when vegetation or litter was absent at the point of contact. The following 10
variables were then recorded: (1) percentage grass cover (%GCOV); (2) percentage herb
12
Univers
ity of
Cap
e Tow
n

cover (%HCOV) (Le. the percentage coverage of grasses and herbs was calculated as the
frequency of occurrence of each type at all samples along each transect); (3) percentage
total ground cover (%TGCOV) calculated as the proportion of all points not recording bare
ground or rocks; (4) mean maximum vegetation height (MAXHGT) given by the maximum
height of the rod recording contacts with vegetation; (5) mean horizontal foliage density
(HITO-lO) calculated as the number of contacts of vegetation with the rod in the 0-10 cm
height intervals; (6) mean vertical foliage density (TOTHITS) calculated as the mean total
number of contacts over the entire height of the rod; (7) horizontal heterogeneity calculated
using the coefficient of variation of the maximum height interval with hits (CVMAXHGT);
(8) horizontal heterogeneity calculated using the coefficient of variation of the mean total
number of contacts over the entire height of the rod (CVTOTHITS); (9) horizontal foliage
diversity (HFD 1 0) calculated using a heterogeneity index according to Wiens and
Rotenberry (1981); and (10) vertical foliage diversity (VDFlO) calculated using the
Shannon diversity index.
Nest searches and monitoring
Study plots were searched for nests of all grassland bird species over the entire breeding
season (October to April) during each of the three years of the study (1998-2001).
Searching and locating of nests was done by dragging a 50m rope between two people to
flush out birds from nests, or based on behavioural observation. Nest sites were marked
(for relocation) with a stick or stone placed 10 m away from each nest. Nests were visited
at one to five-day intervals to determine nest fate (success versus failure). Nests were
considered successful only if one or more young fledged. When a nest failed, I determined
the cause of failure as follows: (1) desertion, if nest failed due to abandonment after eggs
were laid; (2) starvation, if nestlings were found dead or were absent after a marked
retarded growth with no visible signs of illness or other causes of mortality; (3) trampling,
if eggs or nestlings were found smashed inside the nest; (4) adult mortality, if an adult was
found dead in or near nest or if the entire brood was found dead inside nest with no signs of
predation or symptoms of disease; (5) weather, if the nestlings died after an extreme
weather event or were flooded; and, (6) predation, if eggs or nestlings younger than
fledgling age disappeared from the nest (with or without definite evidence of predation).
Partial predation was assumed to have occurred when partial losses of eggs occurred, or if
some of the nestlings disappeared with no prior signs of illness or starvation. Brood
13
Univers
ity of
Cap
e Tow
n

parasitism (mainly by Cuckoofinch Anomalospiza imberbis) was only recorded in two
Ayre's Cisticola nests. A conscious effort was made to minimize disturbance of breeding
birds and their nests. To this end, gloves were used while handling nests and their contents.
Human observer visitation to the nests, however, did not affect nest predation rates (see
Appendix Chapter A).
DATA ANALYSIS
Assessment of vegetation differences across management regimes
Univariate comparisons of vegetation between management regimes involved one-way
ANOVA (Sokal and Rohlf 1995, Zar 1984). Pairwise comparisons between grasslands
were made for each vegetation variable using Wilcoxon two-sample tests. Overall
differences between management regimes were analysed using stepwise logistic regression
analysis. Stepwise discriminant function analysis (SDF A) was used to identify vegetation
variables that differentiated between management regimes. The criterion for adding a
variable from the model was F = 2 for the SDF A and, for adding a variable into the model,
(l = 0.1 for the log-likelihood ratio statistic.
Daily Survival and nesting success
Nests were discovered at various stages of development. Daily nest mortality (DMR) was
calculated using the Mayfield method (Mayfield 1961, 1975), which only uses information
from the period during which a nest was under observation. These estimates consider any
nest failure regardless of cause. I used the first day of egg laying (if the nest was found
during the building stage) or the day the nest was found (if the nest was found after the first
egg was laid) as the first day of observation. The mid-point between nest visits was used to
estimate when critical events in the nesting cycle occurred. Half the number of days
between subsequent visits over which a nest failed or fledged (although I did not
extrapolate beyond the normal nesting period) was added to the previous number of days
the nest survived to obtain the total exposure days (Mayfield 1961). I followed nests until
fledging or failure. For each species, I calculated daily mortality as the number of failures
divided by the total number of active nest observation days (exposure days). I calculated
daily survival as (1 - daily mortality). I analyzed nest survival rates during the incubation
period (period from the date the first egg was laid until hatching) and nestling period
separately. Overall, daily nest survival (the probability of a nest surviving both the
14
Univers
ity of
Cap
e Tow
n

incubation and nestling periods) was based on the pooled daily survival rates within each
nesting period. I calculated standard errors of Mayfield's survival probabilities according to
Johnson (1979) and variance of Mayfield's estimator according to Hensler and Nichols
(1981).
Hypothesis testing was conducted using the Z-test for daily survival probability
according to Hensler and Nichols (1981) and Program CONTRAST (Hines and
Saucer1989) for multiple comparisons of daily nest survival. This program uses a "1..2-
approach that is similar to ANOV A in order to control for experiment-wise error and adjust
for Type I errors (Hines and Saucer 1989). I analyzed nest survival rates during the egg
period (period from the date the first egg was laid until the hatching) and nestling period
separately. Overall daily nest survival (the probability of a nest surviving both the
incubation and nestling periods) was analyzed by pooling daily survival rates within each
nesting period. I also grouped nests into those observed during early (October-November),
mid (December-January) and late (February-April) season. Statistical analysis of nest
success was limited to species with at least five nests in any particular management
treatment. For each study species, I tested for all nests whether nesting success differed
between years, between season, and among management practices.
Patterns of daily survival and nesting success
I analyzed each of the nine grassland bird species separately. However, my primary
objective was to test whether grassland management practices affect nesting success of
grassland bird species. Consequently, I tested whether the general patterns of daily nest
success rate of the nine grassland species differed across management regimes. This test
was done using a combined probabilities test (Sokal and Rolf 1995) that utilizes a series of
separate significance tests on different sets of data that test the same scientific hypothesis.
Although the test on the individual species furnishes a probability value that mayor may
not be statistically significant, the combined probabilities from separate tests of
significance may reveal a generalized pattern that would not be statistically detected by
separate analyses (Sokal and Rolf 1995).
Cause-specific nest mortality
To determine the mechanisms that limit reproductive success among management regimes,
I divided the total daily nest mortality into cause-specific components. To do this, I
15
Univers
ity of
Cap
e Tow
n

summed the total number of nest failures due to each cause-specific component (source of
mortality) and divided that number by the total number of observation days. Daily cause
specific nest mortality was calculated for each species and by year. For each species, I
tested whether cause-specific daily nest mortality differed among treatment using a Chi
Square analysis with multiple comparisons (Hines and Saucer 1989). I used a combined
probabilities test (Sokal and Rolf 1995) to determine whether the general patterns of daily
cause-specific nest mortality differed across management regimes.
I performed all the statistical analyses using STATISTICA software (StatSoft Inc,
2000) unless stated otherwise. Significance levels for statistical tests were set at P < O.OS.
Percentage data were arc-sine transformed.
RESULTS
Effects of management regimes on vegetation
Vegetation characteristics varied significantly between management regimes (Table 1),
Pairwise comparisons of all vegetation variables showed more ground vegetation cover,
higher vegetation structure (foliage density and cover), and greater heterogeneity under
light than heavy grazing pressure (Table 1, P < 0.001 for all pairwise comparisons).
Similarly, pairwise comparisons of all vegetation variables examined showed that
vegetation differed between burning regimes with annual burning having the lowest values
(Table 1, P < 0.001 for all pairwise comparison), Logistic regression indicated a significant
overall difference in vegetation structure between heavily grazed and lightly grazed
(likelihood ratio Xl = 46.8S, P < 0.0001), and between annually burned and biennially
burned treatments (likelihood ratio X2 = 3S.47, P < 0.001). Stepwise discriminant function
analysis (SDF A) selected two vegetation variables as the main variables that separated
between grazing regimes (Wilks' lambda = 0.274, F = 43.66, df= 2,33, P < 0.0001). These
two variables, in short, depicted aspects of structural vegetation (MAXHGT) and vertical
heterogeneity (VFD 10), Similarly, SDF A selected 6 main vegetation variables that
differentiated between burning regimes (Wilks' lambda = 0.268, F = l3.20, df = 6, 29, P <
0.0001) - one cover variable (%TOTGVCOV), three structural vegetation variables
(MAXHGT, HITO-IO, and TOTHITS) and two horizontal heterogeneity variables (HFDIO
and CVMAXHGT). SDF A on all the three management regimes yielded two highly
significant canonical axes (X2 > 23.67, P < 0.001 in both cases) that strongly differentiated
vegetation between management regimes (Mahalanobis - P < 0.001, F> 11.0S, df = 7, 4S
16
Univers
ity of
Cap
e Tow
n

for all pairwise comparisons). Predictor variables selected by this SDFA were a cover
variable (%HCOV), two structural vegetation variables (MAXHGT and HITO-l 0) and four
heterogeneity variables (HFDI0, CVMAXHGT, CVTOTHITS and VFDlO).
Effects of grazing pressure on nest success
For breeding purposes, all the study species apart from GP, RCL and RL avoided the
heavily grazed treatment. Daily nest success rate of GP differed significantly between
grazing treatments (Table 2a). RCL and RL showed a similar trend, but sample sizes were
too low to show statistical significance (Table 2a). Overall daily nest survival and daily
nest survival during egg stage for GP were significantly higher (Chi-Square; X2 > 5.28, df =
1, P < 0.05 in both cases) under light than heavy grazing. However, there was no difference
between treatments in daily nest survival during the nestling stage (P > 0.05). Results of
combined probabilities from independent tests for each species indicated that the general
pattern of daily success rates of nests was affected by grazing (Table 2a). Overall daily nest
survival and daily nest survival during nestling stage were greater under biennial than
under annual burning (X2 >12.92, df= 6, P < 0.05 in both cases). Daily nest survival during
the egg stage did not differ between treatments (P> 0.05).
17
Univers
ity of
Cap
e Tow
n

Table I. The means of vegetation characteristics between (1) H+A versus L+A grasslands, and (2) L+A versus L+B grasslands (H+A =
heavy grazing with annual burning, L+A = light grazing with annual burning, L+B = light grazing with biennial burning) in the
Wakkerstroom high-altitude grasslands. "Data were analysed using Wicoxon pairwise comparisisons and univariate ANOVA." Asterisks
indicate significance: *p < 0.05, **p < 0.01, ***p < 0.001
Effects of grazing Effects of burning
Vegetation Mean value {±SD} ANOVA Wilcoxon ANOVA Wilcoxon variables H+A L+A F P P F P P
Coverage %TGCOY 94.0 (11.0) 98.0 (8.0) 19.4 0.001 *** 98.0 (8.0) 99.0 (20.0) 5.2 0.029 *** % GCOY 81.0 (10.0) 88.0 (10.0) 19.0 0.001 *** 88.0 (10.0) 91.0 (20.0) 8.1 0.007 *** % HCOY 13.0 (4.0) 10.0 (4.0) 6.2 0.018 *** 10.0 (4.0) 8.0 (1.0) 6.0 0.019 ***
Horizontal structure HitO-IO 1.52 (0.99) 3.58 (0.94) 40.6 0.001 *** 3.58 (0.94) 5.46 (0.95) 36.0 0.001 ***
Vertical structure MAXHGT 8.11 (3.33) 18.50 (5.52) 46.7 0.001 *** 18.50 (5.52) 27.69(6.09) 22.5 0.001 *** TOTHITS 1.63 (1.09) 4.18 (1.33) 39.4 0.001 *** 4.18 (1.33) 1I.I0(6.13) 21.9 0.001 ***
Horizontal Heterogeneity HFDIO 2.23 (0.67) 1.31 (0.42) 25.0 0.001 *** 1.31 (0.42) 2.65 (2.48) 5.1 0.030 *** CYMAXHGT 0.67 (0.09) 0.56 (0.08) 12.4 0.001 *** 0.56 (0.08) 0.49 (0.09) 7.0 0.012 *** CYTOTHITS 1.11 (0.29) 0.70 (0.19) 26.0 0.001 *** 0.70 (0.19) 0.66 (0.25) 0.3 0.602 ***
Vertical Heterogeneity
YFD10 0.63 {Q1§L._0}l(0.51) 0.22 0.645 *** 0.71 (0.59) 2.66 (1.90) 17.4 0.001 ***
18
Univers
ity of
Cap
e Tow
n

Table 2a. Daily survival probability (± SE) of nests for each species, as calculated
according to Mayfield (1975), on heavily grazed (H+A) and lightly grazed grasslands
(L+A).
Daily survival probability (SE)"
Species Stage Number Total days H+A L+A 1.1 df P
of nests exposure (n l ; nl)b (EI; E1)"
Grassveld Overall 42;214 421; 2660.5 0.924 (0.0129) 0.958 (0.0039) 6.36 0.0116 Pipit Eggs 37; 168 245; 1349.5 0.918 (0.0175) 0.960 (0.0053) 5.28 0.0216
Nestling 22; 156 175.5; l311 0.932 (0.0191) 0.956 (0.0057) 1.45 0.2286
Red-capped Overall 2;6 8.5; 56.5 0.764 (0.1455) 0.947 (0.0298) 1.52 .02179 Lark Eggs 2;4 8.5; 21.5 0.764 (0.1455) 0.861 (0.0747) 0.35 0.5531
Nestling 0;3 0;35 0.000 (0.0000) 1.000 (0.0000) 0.0001
Rudd's Lark OveralI 1; 11 6.5; 97 0.846 (0.1415) 0.918 (0.0279) 0.25 0.6176 Eggs 1; 11 6.5; 64 0.846 (0.1415) 0.938 (0.0303) 0.40 0.5249 Nestling 0; 6 0;33 0.000 (O.OOOO} 0.879 (0.0568} 0.0001
Combined Overall -2})nP, df, (P) 12.92 6 0.0500 probability Eggs -2})nP, df, (P) 10.14 6 0.5500
Nestling -2})nP, dE (P) 39.79 6 0.0010
a SE as calculated under the method of Johnson (1979). b n l = number of nests on H+A; n2 = number of nests on L+A. C E( = total exposure days in H+A; E2 = total exposure days in L+A.
19
Univers
ity of
Cap
e Tow
n

Effects of burning frequency on nesting success
Daily nest success rates were similar among years (Appendix 1). Consequently, all these
data were pooled for subsequent analysis. I analyzed each of the nine grassland species
separately (see Table 2b). Independent analysis of each species showed that daily nest
survival for OP were similar between management treatments (Table 2b), while daily nest
survival for YBP, OTL, AC, and LTW were higher in the biennially burned than in
annually burned plots (Table 2b). QF, CQ, and RCL showed similar trends, but their
sample size were too low to show statistical significance. RL did not breed under biennial
burning treatment. Results of combined probabilities from independent tests for each
species indicated that the general pattern of daily success rates of nests was affected by
burning treatment (Table 2b). Overall, daily nest survival throughout the breeding period,
daily nest survival during the incubation stage, and daily nest survival during the nestling
stage were all greater under biennial burning than under annual burning (X2 >39.74, df= 16
(14 for nestling stage), P < 0.0001 in all cases).
Causes of nest failure
The main cause of nest mortality was nest predation irrespective of grazing pressure (Table
3), and accounted for> 87 % of total nest failures. Similarly, the major cause of nest
mortality was nest predation irrespective of burning frequency (Table 3), and accounting
for> 70 % of total nest failures. Daily nest mortality as a result of nest predation differed
between grazing (X2 =12.90, df= 6, P < 0.05) and burning treatments (t = 59.34, df= 16, P
< 0.001). Failure due to other mortality cause factors were insignificant and did not differ
between management regimes (P> 0.05 in all cases).
Experimental nests
Daily nest success rates for artificial clutches were affected by burning frequency between
treatments (Table 4). Using Mayfield estimates of daily survival rates, daily nest survival
for artificial clutches were significantly higher under biennial burning than under annual
burning (t = 9.92, df= 1, P < 0.002).
20
Univers
ity of
Cap
e Tow
n

Table 2b. Daily survival probability (± SE) of nests for each species, as calculated
according to Mayfield (1975), on annually burned grassland (L+A) and biennially burned
grasslands (L+B).
Dail! survival 2robabili!r {SEt
Species Stage Number of Total days L+A L+B ·f df P nests exposure {n.; nJ} b ilili E~'
Grassveld Pipit Overall 214;94 2660.5; 1331 0.958 (0.0039) 0.965 (0.0051) 1.19 0.2756 Eggs 168; 79 1349.5; 659 0.960 (0.0053) 0.971 (0.0065) 1.72 0.1897 Nestling 156; 74 1311; 672 0.956 (0.0057) 0.958 (0.0077) 0.04 0.8346
Yellow- Overall 171,78 1697.5, 1211.5 0.939 (0.0058) 0.980 (0.0040) 33.86 0.0001 breasted Pipit Eggs 123;57 901; 561.5 0.936 (0.0082) 0.972 (0.007) 11.15 0.0008
Nestling 114; 64 796.5; 650 0.944(0.0082) 0.988 (0.0043) 22.58 0.0001
Orange- Overall 115; 80 1087.5; 1141.5 0.936 (0.0074) 0.978 (0.0043) 24.08 0.0001 throated Eggs 87; 61 546; 512.5 0.919 (0.0116) 0.969 (0.0077) 12.90 0.0003 Longc1aw Nestling 70;72 540;629 0.952 (0.0092) 0.986 (0.0047) 10.83 0.0010
Ayre's Overall 123;35 1685.5; 537 0.961 (0.0047) 0.980 (0.0061) 6.09 0.0136 Cisticola Eggs 96;26 812; 203.5 0.948 (0.0078) 0.980 (0.0109) 5.70 0.0170
Nestling 78;30 871; 333.5 0.972 (0.0055) 0.982 (0.0073) 1.20 0.2739
Long-tailed Overall 67;69 863; 1189.5 0.951 (0.0073) 0.970 (0.0050) 4.61 0.0318 Widow Egg 52;58 455; 651.5 0.945 (0.0107) 0.977 (0.0063) 6.64 0.0100
Nestling 42;56 408;628 0.958 (0.0099) 0.963 (0.0075) 0.16 0.6873
Quail Finch Overall 9;27 133; 415 0.947 (0.0129) 0.971 (0.0082) 2.47 0.1164 Egg 9;25 79;209 0.949 (0.0247) 0.952 (0.0148) 0.01 0.9170 Nestling 5; 17 54;206 0.944 (0.0312) 0.990 (0.0068) 2.08 0.1497
Rudd's Lark Overall 11; 0 97;0 0.918 (0.0279) Egg 11; 0 64;0 0.938 (0.0303) Nestling 6;0 33;0 0.879 (0.0568)
Red-capped Overall 6;2 56.5; 26 0.947 (0.0298) 1.000 (0.0000) 3.16 0.0753 Lark
Egg 4; I 21.5; 3 0.861 (0.0747) 1.000 (0.0000) 3.46 0.0628 Nestling 3;2 35;23 1.000 (0.0000) 1.000 (0.0000) 1.0000
Common Egg 25,5 197.5; 0.936 (0.0 1756) 0.966 (0.0236) 1.04 0.3082 Quail
Combined Overall -2DnP, dr, (P) 66.74 16 0.0001 probability Egg -2DDP, dr, (P) 59.23 16 0.0001
Nestling -2DnP! dr! {P! 39.74 14 0.0001
• SE as calculated under the method of Johnson (1979). b n l = number of nests on H+A; n2 = number of nests on L+A; nJ= number of nests on L+B. , E2 = total exposure days in L+A; E3= total exposure days in L+B.
21
Univers
ity of
Cap
e Tow
n
Table 3. Daily mortality of study species among the three management treatments (H+A, L+A, and
L+B) partitioned by cause of nest failure.
Species Treatment" Daily mortality Daill:: monali!Z Eartitioned into cause of nest failure failed by any Predation Trampling Desertion Weather Adult mortality cause and starvation
Grassveld H+A 0.078 0.071 0.002 0.002 0.002 0.000 Pipit L+A 0.044 0.038 0.002 0.003 0.00) 0.000
L+B 0.035 0.032 0.001 0.002 0.00) 0.00) -l, dr, (P) Grazing 6.17, I, (0.013) 6.37, I, (0.012) 0.00, I, (1.000) 0.15, I, (0.703) 0.17, I, (0.681)
Burning 1.96, I, (0.161) 0.98, I, (0.322) 0.89, I, (0.346) 0.34, I, (0.562) 0.00, I, (1.000) 1.45,1, (0.228)
Red-capped H+A 0.235 0.235 0.000 0.000 0.000 0.000 Lark L+A 0.053 0.053 0.000 0.000 0.000 0.000
L+B 0.000 0.000 0.000 0.000 0.000 0.000 i, dr, (P) Grazing 1.50, I, (0.220) 1.50, I, (0.220)
Burning 3.16, 1(0.076) 3.16, I (0.076)
Rudd's H+A 0.154 0.154 0.000 0.000 0.000 0.000 Lark L+A 0.082 0.082 0.000 0.000 0.000 0.000 Xl, dr, (P) Grazing 0.25, I (0.618) 0.25, I (0.618)
Yellow- L+A 0.061 0.054 0.002 0.002 0.001 0.001 breasted L+B Pipit 0.020 0.QI8 0.001 0.001 0.000 0.000 i, dr, (P) Burning 33.94, I (0.001) 28.80, I, (0.001) 0.48, I, (0.488) 0.48, 1, (0.488) 1.45, 1, (0.228) 2.87, I, (0.090)
Orange- L+A 0.064 0.060 0.003 0.001 0.000 0.001 throated L+B Longclaw 0.022 0.020 0.001 0.001 0.000 0.000 Xl, dr, (P) Burning 23.80,1(0.001) 23.19, I, (0.001) 1.21, I, (0.271) 0.00, I, (1.000) 1.18, I, (0.277)
Ayre's L+A 0.039 0.027 0.009 0.002 0.001 0.000 Cisticola L+B 0.020 0.Q\5 0.004 0.002 0.002 0.000 X2, dr, (P) Burning 6.06, I, (0.014) 3.40, I, (0.065) 2.06, I, (0.1516) 0.00, I, (1.000) 0.24. I, (0.624)
Long-tailed L+A 0.050 0.038 0.002 0.003 0.000 0.006 Widow L+B 0.030 0.024 0.002 0.002 0.000 0.003 Xl, dC, (P) Burning 5.02, I, (0.025) 3.13, I, (0.077) 0.00, 1, (1.000) 0.18, I, (0.667) 1.03,1,(0.311)
Quail Finch L+A 0.053 0.053 0.000 0.000 0.000 0.000 L+B 0.029 0.029 0.000 0.000 0.000 0.000
i, dr, (P) Burning 1.30, I, (0.254) 1.30, I, (0.254)
Common L+A 0.063 0.063 0.000 0.000 0.000 0.000 Quail 0.033 0.033 0.000 0.000 0.000 0.000 Xl, dC, (P) Burning 0.65, 1, (0.420) 0.65, I. (0.418)
Combined -2DnP, dr, (P) probability - Grazing 12.67,6, (0.05) 12.90,6, (0.05) 0.00, 2, (1.00) 0.70, 2, (0.70) 0.77,2, (0.70)
-2DnP, dr, (P) - Burning 66.06, 16, (0.001) 59.34, 16, (0.001) 9.94, 10, (0.40) 3.40,10, (0.97) 3.90,6, (0.70) 12.67,8, (0.20)
'H+A = Heavily grazed and annually burned; L+A Lightly grazed and annually burned; L+B = Lightly grazed and biennially burned.
22
Univers
ity of
Cap
e Tow
n

Table 4. Comparison of daily probability of success of artificial clutches placed in natural
nests belonging to three major ecologically similar species calculated using Mayfield
(1961,1975) on annually burned (L+A) and biennially burned grassland (L+B).
Species L+A L+B t df P
All 0.961 (0.00484) 0.980 (0.00360) 9.9 0.002 Grassveld Pipit 0.955 (0.00850) 0.974 (0.00684) 3.0 0.082 Yellow-breasted Pipit 0.967 (0.00677) 0.981 (0.00608) 2.4 0.124 Orange-throated Longclaw 0.957 (0.01121) 0.988 (0.00523) 6.3 0.012
23
Univers
ity of
Cap
e Tow
n

Effects of season on vegetation across management regimes
Yegetation characteristics (foliage density, height, cover and heterogeneity) increased
significantly through the season in H+A treatment (ANOY A, P < 0.007), in L+A treatment
(ANOYA, P < 0.001) but not in L+B treatment (P > 0.05).
Seasonal patterns in daily nesting success
Independent analysis of daily nest success probabilities across seasons showed a mixed
response for each species (Table 5). Results of combined probabilities from independent
tests for each species, however, indicated that the general pattern of daily success rates of
nests was affected by season (Table 5). Daily nest success differed significantly at different
times of the season on both annually burned (X2 = 40.58, df = 16, P < 0.001) and on
biennially burned plots (X2 = 42.57, df= 14, P < 0.001). Patterns of daily nest success were
significantly higher later in the season on both annually burned (X2 = 45.61, df = 16, P <
0.001) and biennially burned plots (X2 = 36.81, df= 14, P < 0.005). There was no difference
in patterns of daily nest success between the mid-season and early-season on either burning
treatment (P > 0.05 in both cases).
24
Univers
ity of
Cap
e Tow
n

Table 5. Daily probability survival of nests for each species at different times of the season on annually burned treatment (L+A) and
biennially burned grassland (L+B).
L+A
SPECIES
SEASON GP YBP OTL AC LTW CQ QF RL RCL Icombined probability
OCT-NOV (1) 0.963 0.931 0.943 0.933 0.857 0.750 0.947
DEC-JAN (2) 0.950 0.888 0.907 0.962 0.946 0.976 0.962 0.908
FEB-APR (3) 0.967 0.939 0.961 0.955 0.950 0.936 0.938 0.964 -U)nP. dJ. (P)
.. t! (1&2), dr, (P) I. 76, I, (0.1848) 4.06, I, (0.0438) 2.14, I, (0.1435) 2.05, I, (0.1524) 0.45, I (0.5021) 1.37,1, (0.2416) 21.50, 14, (0.100)
'l (2&3), dr, (P) 3.39, I, (0.0657) 12.90, I, (0.0003) 12.02,1, (0.0005) 0.34, I, (0.5583) 0.06, I, (0.8038) 1.91, I, (0.1667) 0.40, I, (0.5251) 0.98, I, (0.3225) 45.61,16,(0.001)
'1..2 (I, 2, &3), dr, (P) 3.93, 2, (0.1400) 13.38, 2, (0.0012) 12.03,2, (0.0024) 2.20,2, (0.3325) 0.53,2, (0.7684) 1.91, I, (0.1667) 0.40, 1, (0.5251) 3.54, 2, (0.1707) 40.58, 16, (0.00 I)
L+B
SPECIES
SEASON YBP OTL AC LTW CQ QF RL RCL (ombined ......_.. probability
OCT-NOV (1) 0.969 0.963 0.964 0.990 0.964 0.959 1.000
DEC-JAN (2) 0.952 0.972 0.981 0.974 0.970 0.971 0.953
FEB-APR (3) 0.765 0.997 0.985 0.981 0.986 1.000 0.976 -2.1JnP. dJ. (P)
'1..2 (I &2), dr, (P) 2.29, t, (0.1302) 0.53, I, (0.4685) 1.85, I, (0.1735) 1.50, I, (0.2201) 0.05, I, (0.8158) 0.07, I, (0.7881) 13.01,12,(0.700)
'1..2 (2&3), dr, (P) 1.65, 1, (0.1996) 10.45, I, (0.0012) 0.22, I, (0.6424) 0.11, I, (0.7349) 9.30, I, (0.0023) 2.12, I, (0.1452) 1.22, I, (0.2691) 36.81, 14, (0.005)
'1..2 (1,2, &3), dr, (P) 4.16,2, (0.1248) 19.38,2, (0.0001) 2.67,2, (0.2629) 1.51,2, (0.4710) 10.02,2, (0.0067) 3.17,2, (0.2046) 1.22, I, (0.2691) 42.6, 14, (0.001)
25
Univers
ity of
Cap
e Tow
n

DISCUSSION
My results on the effects of management-induced disturbance on vegetation are 10
accordance with other studies (e.g. see Milchnas et al. 1988, Bullock & Pakeman 1997,
Van der Koppel et al. 1997, Dupre and Diekmann 2001). My study demonstrates a clear
relationship between nesting success and both burning and grazing practices. My results are
in general agreement with published studies that show strong effects of management
practices on bird populations (e.g. see Saab 1995, Ammon and Stacey 1997).
Effects of fire and grazing management practices on nesting vegetation and nesting
success
Fire can affect ecosystems negatively or positively depending on variation of its use and
application (also see Bullock and Pakeman 1997). Farmers in the Wakkerstroom study area
bum immediately after the onset of summer rains and use it to control ticks and disease,
improve forage for grazing - sour to sweet grass, manage competing vegetation, remove
accumulated litter, and regenerate new grass. Although the optimal burning frequency is
supposed to vary according to the rate of litter accumulation (Stuart-Hill and Mentis 1982),
most farmers in South African high altitude grasslands bum their farms annually, or more
frequently, irrespective of litter accumulation (Tainton1981). Domestic livestock does not
simulate a natural ecological result as wild herbivores used to do (e.g. see McNaughton 1986).
The shift from wild to domestic grazing has thus changed the nature of grazing and intensified
the effect of grazing on grassland habitats and their fauna. In my study area, timing of grazing
is not dependent on sward height as it should (Mentis 1981, Tainton 1981), but on the time
when poisonous Grass Tulips die off; i.e. normally three weeks to a month after the bum
(personal communication with farmers). Cattle are thus introduced into grazing paddock
before the grass height reaches the recommended sward height of 25cm (Mentis 1981, Tainton
1981). The combined effect of frequent fires and overgrazing leads to the removal or
reduction of nesting vegetation cover, reducing nest concealment and making nests more
visible to nest predators (Also see Wiens 1969, Jackson et al. 1988, Martin and Roper
1988, Martin 1988c, Knopf 1995, Ammon and Stacey 1997, Chapter 5). Consistent
differences in predation rates due to variation in management-mediated habitat quality can
favour contrasting life-history traits (e.g. see Lack 1968, Martin 1993a), and merits further
investigation.
26
Univers
ity of
Cap
e Tow
n

Seasonal pattern in nesting success
As expected, vegetation characteristic (foliage density, height, cover and heterogeneity)
increased through the season. My results show that livestock grazing and fire affect
vegetation characteristics (vegetation cover, density and heterogeneity) of the breeding
habitat, which in tum influences nesting mortality probabilities. Further, nest mortality
decreased with an increase in plot vegetation cover and density, which provided greater
concealment for nests. Growth in vegetation during the season may provide greater
concealment with time, thereby reducing visibility of nests during late season, which
enhances nest survival. This demonstrates that habitat structure, as altered by fire frequency
and grazing intensity, is indeed the causal agent of the observed trend in nesting success.
Underlying mechanism linking grassland bird population declines to management practices This study provides support for the hypothesis that potential demographic consequences of
grazing and burning effects include altered susceptibility to reproductive failure (Ammon
and Stacey 1997). Partitioning causes of nest mortality into cause-specific components has
important consequences for understanding the mechanisms that limit avian reproductive
success. Daily mortality as a result of nest predation accounted for the majority of nest
failures under all management regimes for all species. This result suggests that livestock
grazing and fire may not only affect abundance and availability of nesting vegetation, but
could influence bird populations by facilitating nest predation. This further emphasizes the
primary role of nest predation as a selective force. Direct impacts of grazing and fire
through removal of cover of active nests, disturbance of nests, or direct mortality through
trampling and burning of nests apparently are of little consequence. Grazing and burning
rarely harm birds directly. Instead, the negative impact of grazing and burning could be
indirectly linked to increased nest predation.
These findings concerning nesting success and the mechanisms limiting nesting
success (nest predation) suggest a possible link between fire frequency and grazing
intensity on the one hand, and declines in bird populations. Although I was able to
explicitly demonstrate that management-mediated nest predation could be the cause of
population declines, other possible alternatives needs to be considered as well. Single
causal explanations may not be sufficient while developing strategies to mitigate and/or
curb the current trends in avian population declines. Management practice-mediated
27
Univers
ity of
Cap
e Tow
n

reproductive dysfunction via nest predation could be a more important factor than even
food availability in regulating populations of the birds that live in South Africa's highland
grassland ecosystems. Nest predation has similarly been linked to population declines of
for example, Neotropical migratory birds (see Wilcove 1985, Donovan et al. 1995, Ammon
and Stacey 1997). Because nesting success for all eight focal species in this study were
affected similarly by grazing and burning regimes, this pattern might hold for many other
grassland nesting birds.
Persistent renesting attempts after nesting failure and multiple brooding effort by
successful pairs can offset high nest mortality rates to some extent (Martin 1992). Such
compensation may not be possible in heavily disturbed grassland systems where predation
is common throughout the breeding season. The low nest success that I observed in my
study could well be below the level needed to balance expected mortality and could thus
affect population size and cause the ultimate loss of some grassland species. Indeed,
nesting success rates below 30% (whole cycle) have been implicated in population declines
in Neotropical migrants (Donovan et al. 1995) and shrub steppe songbirds (Yanes and
Suarez 1995).
28
Univers
ity of
Cap
e Tow
n

Appendix 1. Daily probability (SE) of survival of nests, calculated according to Mayfield
(1961,1975) on annually and biennially burned grassland plots for all nests in each
breeding season.
Species Treatment Year Number or Total days Daily survival X2 df P nests (N, n) exposure probability'
Grassveld Pipit L+A 1998-1999 53 (26) 727.5 0.964 (0.00688) 1999-2000 61 (27) 835 0.968 (0.00612) 2000-2001 100 (51) 1098 0.954 (0.00635) 2.63 2 0.2681
L+B 1998-1999 8 1999-2000 59 (30) 898 0.967 (0.00600) 2000-2001 27 (II) 369 0.970 (0.00885) 0.078 0.7790
Yellow-breasted L+A 1998-1999 31 (21) 341.5 0.939 (0.01300) Pipit 1999-2000 64 (36) 635.5 0.943 (0.00917)
2000-2001 75 (45) 707.5 0.936 (0.00917) 0.26 3 0.8639 L+B 1998-1999 4
1999-2000 45 (14) 774.5 0.982 (0.00479) 2000-2001 29 (7) 380 0.982 (0.00690) 0.00 1.000
Orange-throated L+A 1998-1999 36 (25) 370.5 0.933 (0.01303) Longclaw 1999·2000 34 (20) 298 0.933 (0.01449)
2000·2001 45 (25) 419 0.940 (0.01157) 0.22 2 0.8980 L+B 1998-1999 4
1999-2000 38 (12) 586.5 0.980 (0.00585) 2000-2001 38 (12) 529 0.977 (0.00647) 0.12 0.7309
Ayre's Cisticola L+A 1998-1999 0.959 (0.00534)
1999·2000 35 (19) 507.5 0.963 (0.00843)
2000-2001 41 (25) 518 0.952 (0.00942) 0.77 2 0.6808
L+B 1998·1999 3
1999-2000 23 343 0.980
2000-2001 9
Long-tailed L+A 1998·1999 22 (13) 290 0.955 (0.01215) Window 1999-2000 26 (19) 360 0.947 (0.01178)
2000-2001 19 (10) 213 0.953 (0.01449) 0.24 2 0.8871 L+B 1998-1999 7
1999-2000 46 (25) 809.5 0.970 (0.00608) 2000-2001 16 (7) 271 0.974 (0.00964) 0.12 0.7256
• SE as calculated under the method of Johnson 1979.
29
Univers
ity of
Cap
e Tow
n

30
Univers
ity of
Cap
e Tow
n

Effects of grassland management practices on density, clutch initiation, clutch size
and duration of breeding
Abstract.
Grassland management practices may have profound effects on grassland birds' natural
history and life history. I used a comparative approach to examine the effect of
management practices on the distribution, abundance, clutch size and clutch initiation of
grassland birds. The study was conducted in the high altitude grasslands at Wakkerstroom,
South Africa, from 1998 through 2001. Study plots were set out in heavily grazed and
annually burned grasslands (H+A), lightly grazed and annually burned grasslands (L+A),
and lightly grazed and biennially burned grasslands (L+B). I measured vegetation
characteristics across management regimes, surveyed bird densities and searched for nests
to explore their distribution, nest initiation dates, clutch size and duration of breeding under
each of the three management regimes. Vegetation density, cover and heterogeneity were
lowest in H+A, intermediate in L+A, and highest in L+B grasslands. Thus management
practices clearly affected the distribution and abundance of bird species. Although birds
occurred at low densities in H+A grasslands, only three out of eight focal species bred there
at all. Pairs with territories located in biennially burned grassland started nesting earlier than
their counterparts in annually burned grasslands, thus effectively shortening the breeding
season in the latter. Grazing and burning only affected the clutch size of Grassveld Pipits and
Long-tailed Widows respectively. This difference in clutch size was caused by management
mediated nest predation rather than food abundance. I propose that intensive grazing pressure
and periodic burning should be relaxed by reducing stocking rates and burning less frequently
to benefit grassland bird species.
Key words: Grassland bird abundance, nest density, egg initiation, clutch size,
duration of breeding, livestock grazing, burning.
INTRODUCTION
Although the general trend in variation of life-history strategies among species has been
attributed to trade-offs maximising lifetime reproductive output (Roff 1992), life histories
could be influenced by historical, physical, environmental, and phylogenetic constrains
31
Univers
ity of
Cap
e Tow
n

(Stearns 1992). For example, offspring production (e.g. timing of breeding, clutch size and
duration of breeding) may be constrained by temperature, season, and by life history trade
offs that may be caused by food limitation (Lack 1947) or predation (Lima 1987, Stearns
1992, Martin and Clobert 1996). The causes and causal mechanisms producing variation in
avian life histories and the hypotheses explaining these differences are poorly understood.
Although a variety of traits can be influenced by costs associated with local conditions, one
trait that seems consistently modified is clutch size (Skutch 1949, Lima 1987, Martin
1988). Despite the fact that clutch size is one of the traits showing close adjustments to
local conditions (Lack 1968), the proximate mechanism by which clutch size is adjusted
remains uncertain in the many cases.
Grassland management regimes can change the diversity, dominance, cover and
structure of grassland plant communities (e.g. see· Milchnas et al. 1988, Bullock and
Pakeman, 1997, Van der Koppel et al. 1997, Dupre and Diekmann 2001, Chapter 2). The
defoliation of grassland by disturbance regimes (herbivory and fire) can potentially have
positive or negative consequences for the various members of the food chain that live there
(e.g. see Dickson 1981, Curry 1994). Reduced availability of food, for example, is
predicted to affect bird densities (e.g. see Milchnas et al. 1988), limit clutch size (Ruiz et
al. 2000) and number of breeding attempts (Martin 1987, 1992, Rodenhouse 1986), and
will therefore to influence breeding productivity. Destruction and alteration of breeding
habitat could also affect abundance and behaviour of predators (Martin 1993b). Individuals
can respond to high nest predation pressure in a variety of ways. They can reduce their
investment at anyone breeding attempt by reducing clutch size (Skutch 1949, Martin et al.
2000a, Murphy 2000, Bosque and Bosque 1995), increase the number of breeding attempts
(Martin 1992) or avoid areas of high predation risk altogether (e.g. see Blancher and
Robertson 1985).
Livestock farming is one of the primary land uses of privately-owned grasslands in
South Africa. Both periodic fire and grazing have historically been prominent features of
the natural ecology of the grasslands and both continue to be important ecological
processes today (e.g. see Wade and Lundsford 1990). In South Africa, the role of fire and
grazing in maintaining grassland systems is well known in as far as it affects livestock
production, but little is known of their effects on grassland birds (Mentis 1981, Macdonald
1989, O'Connor and Bredenkamp 1997).
32
Univers
ity of
Cap
e Tow
n

Given the general poor conservation status of many grassland birds in South Africa
(see Tarboton 1997b), it is crucial to understand the mechanisms of how grassland
management practices affect bird breeding.
In this chapter, I evaluate the effects of defoliation (by grazing and burning) on
grassland birds concerning their abundance, densities and interspecific interactions, (2) nest
densities and distribution (3) clutch initiation and duration of the breeding season, and (4)
clutch size. To this end, two alternatives are possible: (i) clutch size decrease with
increased risk of nest predation, and (ii) clutch size decreases with a decrease in food
abundance. The hypothesis here is that if clutch size could be shown to be similar
comparing areas with equal food abundance, then any differences would be a result of nest
predation and vice versa.
METHODS
Study area
The study was conducted in the high-lying grassland (between 1800m to 2250m elevations)
of Wakkerstroom (centred at 270 10' S, 300 06' E), South Africa, from 1998-2001. The
main vegetation types with respect to altitude and soil type as classified by Low and Rebelo
(1996) are Moist Sandy Highveld Grassland dominated by Themeda triandra, Digitaria
thicholaenoides, Tristachya leucothrix and Hetropogon contortus; North-eastern Mountain
Grassland which is dominated by Tristachya leucothrix, Loudetia simplex and
Diheteropogon filifolius; Moist Clay Highveld Grassland dominated by Themeda triandra
and Natal Central Bushveld. The main land use in the Wakkerstroom district is large-scale
livestock farming, mainly beef cattle. The district experiences mild to warm summers, and
cold and dry winters with occasional snow. Rain falls in summer at an average rate of
between 700 mm and 1200 mm. The highland grassland of Mpumalanga has been under
considerable grazing pressure since the 1930s (Downing 1978, Edwards 1981, Hockey et
al. 1988). Also, although the optimal burning frequency is supposed to vary according to
the rate of litter accumulation (Stuart-Hill and Mentis 1982), most farmers in Mpumalanga
bum their farms annually irrespective of litter accumulation (Tainton1981). As a result,
over 90 % of the grassland get burned every year.
33
Univers
ity of
Cap
e Tow
n

Experimental design
I controlled for slope in my selection of and selected plots representing three sets of
grassland management systems, viz. heavily grazed and annually burned (H+A), lightly
grazed and annually burned (L+A), and lightly grazed and biennially burned (L+B). Six
replicate grassland plots were used for each management system. The grassland plots
(experimental units) were separated from others by at least 500m wide strips and were all
within 10 k:m2 of continuous grassland. Study plots were 25 ha in size. Grazing intensity
was standardised to large animal units (LAU). One LAU is equivalent to 1 cow (454 kg) or
5 sheep (Booysen 1967, Owen-Smith and Dankwerts 1997). Heavy grazing intensity was
assumed to be > 3 LAU/ha and light grazing was < 1.5 LAU/ha.
Censusing
I estimated bird abundance using a modification of the fixed-strip or belt transect method
(Kendeigh 1944). Birds were counted along three 500m transects per study plot. The
transects ran perpendicular to the plot fence and were located at 100m, 250m and 400m
from the edge of the plot fence. To census birds, we held a 50 m rope between two
observers and dragged it over the vegetation along the transect. These were the same
transects used for vegetation survey (Chapter 2). Collectively, the three transects covered
an area of 7.5 ha per study plot. Censusing began after territories were established (Le.
November). Study plots were censused monthly during the breeding season (Nov-Apr).
Censusing days were divided into three four-hour observation periods (0600-1000 h, 1000-
1400 h, 1400-1800 h). Each plot was censused six times during each breeding season, with
census sessions spread over the three observation periods in rotation according to a fixed
schedule.
Assessment of relative food abundance
Monthly arthropod abundance was sampled along the same three transects used for bird
censusing during the entire breeding seasons (October to April the following year) from
1998 through 2001 using sweep nets. These samples consisted of 600 sweeps per plot (200
at each of the 3 transects) during each monthly food survey.
34
Univers
ity of
Cap
e Tow
n

DATA ANALYSIS
During each census, the results of the three transect surveys from each plot were combined
to give the mean density of each species. The values used for statistical analysis were
single estimates of the population density of each bird species at each plot (derived from
the pooled set of the three transect surveys) in each year for each management system. I
used a Mann-Whitney U-test to compare mean bird abundance between management
systems (H+A and L+A) and (L+A and L+B). Shannon-Wiener index of species diversity
(Zar 1984) was calculated for birds between management systems. Similarities in species
composition between management systems were determined using Jaccard's coefficient of
similarity (Krebs 1999). The index can have values ranging from 0 (perfect dissimilarity) to
1 (perfect similarity). Species richness was simply the number of bird species observed
(Wiens 1989).
Since multiple nesting (re-nesting) can inflate nest densities, nest density was
calculated over a 15-day period (shortest time between re-nest). Nest density was
calculated as the number of nests found per hectare of each management regime during
each of the thirteen 15-days blocks, divided by total area of the management treatment.
Differences in nest density between management regimes over the I5-day periods were
tested using a paired I-test across all the species in order to explore general relationships.
Parametric I-test were computed after transforming nests density (n) to n = --J(n + 0.5) to
normalise the data (Zar 1984, Sokal and Rohlf 1995). Statistical analysis of nest density
was limited to study species with at least 10 nests in anyone management system.
Nests initiation dates were calculated according to Martin et al. (1997), and
included known exact dates of first egg laying, and back-dating from any reliably estimated
period (e.g. known hatching date and fledging dates). Only clutches verified as complete
were used to determine clutch size. To control for date of clutch initiation clutches laid
early (October) and late breeding season (March onwards) were excluded from the
analysis. I evaluated this for eight common birds with >25 nests in at least two of the three
management systems. Only three of these eight species ever nested in the third
management system, viz. H+A.
35
Univers
ity of
Cap
e Tow
n

RESULTS
Effects of management practices on bird density
When I controlled for burning, overall density (birds/ ha) of 48 study bird species were
higher (Mann-Whitney U Test: Z == -2.72, P < 0.006) on transects in lightly grazed grassland
(0.63 ± 0.98) than heavily grazed grassland (0.35 ± 0.72). When I controlled for grazing,
overall density (birds/ ha) of the study birds were similar in transects in annually and
biennially burned grassland (0.63 ± 0.98) versus (0.56 ± 1.07) (Mann-Whitney U Test: P >
0.05). Individual species showed a mixed response to management grassland disturbance
(Tables 1 a and b).
Effects of management practices on species richness
Census survey data indicated higher species richness on L+A (n = 41) than on both H+A (n = 19) and L+B (n = 28) grasslands. When all species were considered (Tables la and b), there
was a significant decrease in species richness with grazing (Student's t = 9.41, P < 0.0001) and
marginally fewer with increasing burning frequency (Student's t = 1.94, P = 0.0516). The
Shannon-wiener diversity (H') was estimated at 2.55, 3.59 and 3.11 for H+A, L+A and L+B
respectively. Species similarity indices between grazing systems showed a Jaccard's
coefficient of 0.44, while burning showed a coefficient of 0.49.
Effects of management practices on nest density
A total of over 1202 nests were found over the three breeding seasons (Table 2a). Of these,
1182 nests belonged to only nine focal species found within the study area of (81O ha)
during the study period (Table 2a). When I controlled for burning, overall nest density
(nests/ha) for the nine main study species were significantly higher in lightly grazed (0.18 ±
0.0.21) than in heavily grazed grassland (0.08 ± 0.0.09) (Combined probability, "l = 66.37, df
= 24, P < 0.001) (Table 2b). Nest densities for each of the 14-day periods and results of
paired t-test are shown in Table (2b). Only three of the nine species nested in heavily
grazed grassland (Table 2a), and they nested there in low densities (Table 2b). RCL was the
only species to benefit from heavy grazing: nest densities of the RCL were significantly
lower in lightly grazed (0.01 ± 0.02, n = 6) than in heavily grazed grassland (0.04 ± 0.00, n =
9) (Student t-test: t = 4.05, df = 25, P < 0.001). Nest densities of the GP were significantly
higher in lightly grazed (0.47 ± 0.22, n = 42) than in heavily grazed grassland (0.19 ± 0.06)
36
Univers
ity of
Cap
e Tow
n

(Student t-test: t:;;:: -4.03, df:;;:: 25, P < 0.001). The remaining six species entirely avoided
heavily grazed grassland for breeding purposes during the study period (Table 2a).
When I controlled for grazing, overall density (nests/ha) representing the nine key
study species were significantly higher in biennially burned (0.24 ± 0.26) than in annually
burned (0.18 ± 0.0.21) grassland (Combined probability, "I::;;:: 36.50, df:;;:: 24, P = 0.05). Nest
densities for each of the 15-day periods and results of paired t-test are shown in Table (2c).
Rudd's Lark never nested in biennially burned grassland. LTW and QF apparently benefited
from biennially burned grassland: nest densities of L TW, and QF were higher in biennially
burned grassland than in annually burned grassland (Student t-test t > 2.14, df:;::: 25, P < 0.05 in
both cases). Grassland burning had little effect on the nest densities of the other five species
(Table 2c, P> 0.05 in all cases). Nest densities of five major species over 15 days periods in
both fire regimes are shown in figures 1 and 2.
Effects of management practices on clutch initiation
All study species bred between October and March each year. Frequency distribution of
clutch-initiation dates showed similar shapes and trends for all species (Fig 3a-f). Pairs
with territories located in L+B grasslands generally started nesting earlier relative to their
counterparts breeding on recently burned (H+A and L+A) grasslands. The first breeding
peak and consecutive peaks of laying periods for L+A and H+A grasslands lagged behind
that in L+B grassland by at least a month (Fig 3a-f).
37
Univers
ity of
Cap
e Tow
n

Table lao Mean (±SD) relative abundance (birds/Ha) for 48 grassland bird species on transects in heavily
grazed (H+A) and lightly grazed grassland (L+A) in the high-altitude grasslands of Wakkerstroom (Mann
Whitney U Test). " Focal species are given in bold text."
Species Mean (SD) Z 11
H+A L+A
YeHow-breasted Pipit Henimacronyx chloris 0.14 (0.13) 0.65 (0.20) -3.42 0.0006
Oran2e-throated Longclaw Macronyx capensis 0.67 (0.06) 1.80 (0.48) -3.46 0.0005
d Widow Eup!ectus pro!:ne 0.16 (0.32) 2.42 (1.27) -3.38 0.0007
Avres Cisticola Cil>1ieola ayresii 0.64 (0.53) 1.74 (0.61) -2.96 0.0030 .
Red-capped Lark Calandrella cinerea 2.07 (0.64) 1.18 (0.48) 2.52 0.0119
brassveld Pipit Anthus cinamomerous 2.38 (0.67) 3.20 (0.43) -2.60 0.00938
(:ommon Quail Coturnix eoturnix - 1.14 (0.37) - -~inch Orty!:ospi'l.ll atricollis - 0.46 (0.53) - -
eaked chat Oenanthe bi{asciata O.QI (0.03) 0.07 (0.11) -0.64 0.5218
IBlack Crow Corvus eapensis O.oJ (0.04) 0.07 (0.11) 0.32 0.7488
rrowned Plover Vanellus coronatus 0.Q7 (0.10) 0.13 (0.14) 0.72 0.4712
Southern Ant-eating Chat Myrmecociehla Jormicjvora 0.08 (0.10) 0.04 (0.07) 0.64 0.5218
Southern Bald Ibis Bostryehia hagedash 0.13 (0.33) 0.25 (0.41) -0.48 0.6310
rape Wagtail Motaeilla capensis 0.01 (0.03) 0.02 (O.OS) -0.08 0.9362
Plain-backed Pipit Anthus leucaphrys 0.Q3 (O.OS) 0.03 (0.07) 0.3203 0.7488
rattle Egret Buhu/eus ihis 0.12 (0.29) 0.13 (0.33) -0.08 0.9362
African Rock Pipit Anthus erenatus 0.01 (0.03) 0.01 (0.03) 0.00 1.0000
Fiscal Shrike Lanius callaris 0.02 (0.05) 0.02 (0.05) 0.00 1.0000
Red-breasted Sparrow Hawk Acciviler rufiventris 0.01 (0.02) 0.01 (0.02) 0.00 1.0000
Spike-heeled Lark Chersamanes alhafasciata 0.06 (0.09) 0.06 (0.09) 0.00 I.Mnn
Black-winged Plover Vanellus melanapterus 0.01 (0.03) - - -Black Harrier Circus maurus - 0.002 (O.OOS) - -Red-winged Francolin Franealinus levaillantii - 0.02 (0.05) - -Swainsons Francolin Franealinus swainsoni - 0.03 (0.07) - -Blue crane Anthropoides paradiseus - 0.01 (0.03) · -Stanley Bustard Neolis denhami - 0.03 (0.04) - -Blue Korhaan Eupodatis caerulescens · 0.Q7 (0.07) - -Rudd's Lark Heteramira/ra ruddi - 0.18 (0.20) - -Eastern Long-billed Lark Certhilauda curvirostris - 0.16 (O.l2) · -~ink-billed Lark Spizaearys conirostris - 0.03 (0.06) - -Sentinel Rock Thrush Monticola e.xplorator - 0.03 (0.04) - -Mountain Chat Oenanthe montieola - 0.04 (O.OO) - -Stone Chat Saxicala torquata · 0.02 (0.05) - · :Fantailed Cisticola Cistieo/a iuncidis - 0.09 (0.10) - -rJoud Cisticola Cistieola textrix - 0.01 (0.03) - · Pale-crowned Cisticola Cisticala hrunnescens - 0.01 (0.03) · ·
evaillant's Cisticola Cistieala tinniens - om (0.03) - · Long-billed Pipit Anthus similis · 0.07 (0.07) - -BufTy Pipit Anthus vaalensis I - 0.01 (0.03) - -ruckoo Finch Anamalospiza imherbis - 0.02 (0.05) - -rape Canary Serinus canieollis - 0.60 (0.22) - -tAli 0.35 (0.72) 0.63 (0.98) -2.72 0.006
38
Univers
ity of
Cap
e Tow
n

Table lb. Mean (±SD) relative abundance (birdslHa) for 48 grassland bird species on transects in annually
burned (L+A) and biennially burned grassland (L+B) in the high-altitude grasslands ofWakkerstroom
(Mann-Whitney U Test). "Focal species are given in bold text."
Species Mean (SD) Z P L+A L+B
.Crassveld Pipit 3.20 (0.43) 1.52 (0.43) 3.97 0.0000
1.14 (0.37) 0.03 (0.05) 3.97 0.0000 i 1.18 (0.48) 0.20 (0.09) 3.97
~ Quail Finch 0.46 (0.53) 1.33 (0.21) -2.90
Ayres Cisticoia 1.74 (0.61) 1.31 (0.24 2.33
0.65 (0.20) -1.48
2.42(1.27) 1.51 0.1306
Ora nile-throated Lon2claw 1.80 (0.48) 1.84 (0.24) -0.76 0.4497
0.18 (0.20) · Red·winged Francolin 0.02 (0.05) 0.10 (0.06) -1.92
iBlue Korhaan 0.07 (0.071 0.01 (0.03) 1.20
tape Canary 0.60 (0.22) 0.48 (0.09) 0.72
iBald Ibis 0.25 (0.41) 0.04 (0.10)
Stanley Bustard 0.03 (0.04) 0.01 (0.03) 0.48 0.6310
lFiscal Shrike 0.02 (0.05) 0.01 (0.03) 0.08 0.9362
Stone Chat 0.02 (0.05) 0.03 (0.04) -0.32 0.7488
Fantail Cisticola 0.09 (0.10) 0.11 (0.17) 0.08 0.9362
rattle Egret 0.13 (0.33) 0.15 (0.28) -0.32 0.7488
Red-breasted Sparrow Hawk 0.01 (0.02) 0.01 (0.02) 0.00 1.0000
Black Harrier 0.002 (0.005) 0.002 (0.005) 0.00 1.0000
iswainsons Francolin 0.03 (0.07) 0.03 (0.07) 0.00 1.0000
k\nt-eating Chat 0.04 (0.07) O.
Buffy Pipit 0.01 (0.03) 0.01
Blue crane 0.01 (0.03) · rrowned Plover 0.13 (0.14) · Eastern Long-hilled Lark 0.16 (0.12) · Spike-heeled Lark 0.06 (0.09) · ,Pink-billed Lark . 0.03 (0.06) -IBlackCrow 0,07 (0.11) -
E= 0.03 (0.04) -0.04 (0.00) - ! 0.07 (O.II) -
baud Cisticola 0.01 (0.03) -
~ 0.01 (0.031 -0.01 (0.03) -
rape Wa2!ail 0.02 (0.05) -onJt-billed Pipit 0.07 (0.07) ·
Plain-backed Pipit 0.03 (0.07) -African Rock Pipit 0.01 (0.03) -ruckoo Finch 0.02 (0.05) -Grey-winged Francolin Franco!inus a/ricanus - 0.01 (0.02)
Helmeted Guinea Fowl Numida meleaKris - 0.04 (0.10)
Marsh Owl Asio capensis - om (0.03)
Common Waxbill EstrUda astrUd - 0.13 (0.31)
Pin-tailed Whydah Vidua macroura - 0.05 (0.11)
All 0.63 (0.98) 0.56 (1.07) 0.59 0.5536
39
Univers
ity of
Cap
e Tow
n

Table 2a. Distribution and number of nests found for each of the nine major grassland
species in each of the three management systems (H+A = heavy grazing with annual
burning, L+A = light grazing with annual burning, L+B = light grazing with biennial
burning).
Management system H+A L+A L+B
Species Total nests Grassveld Pipit 42 214 94 350 Yellow breasted Pipit 0 171 78 249 Orange-throated Longclaw 0 115 80 195 Ayres' Cisticola 0 123 35 158 Long-tailed Widows 0 67 69 136 Quail Finch 0 9 27 36 Common Quail 0 25 5 30 Rudd's Lark 0 11 0 11 Red-capped Lark 9 6 2 17 Total nests 51 741 390 1182
40
Univers
ity of
Cap
e Tow
n

Table 2b. Paired t-test of differences in the means of nest density (±SD) for nine grassland
bird species (Grassveld Pipit; Yellow-breasted Pipit; Orange-throated Longc1aw, Ayres'
Cisticola; Long-tailed Widow, Common Quail, Quail Finch, Rudd's Lark, and Red-capped
Lark) nesting in heavily grazed (H+A) and lightly grazed grassland (L+B) in
Wakkerstroom high-altitude grasslands. Nest density was calculated over 15 days periods
(shortest time between re-nest).
Date L+A(SD) H+A(SD) t df P InP
October 1·15 0.002 (0.004) 0.001 (0.002) 0.98 8 0.36 -1.02 October 16-31 0.005 (0.007) 0.001 (0.002) 1.34 8 0.22 -1.51 November 1-15 0.011 (0.011) 0.005 (0.008) 1.82 8 0.11 -2.21 November 16-30 0.028 (0.022) 0.010 (0.019) 2.03 8 0.08 -2.53 December 1-15 0.022 (0.018) 0.007 (0.009) 2.23 8 0.06 -2.81 December 16-31 0.031 (0.021) 0.004 (0.009) 3.06 8 0.02 -3.91 January 1-15 0.024 (0.016) 0.003 (0.006) 3.48 8 0.01 -4.61 January 16-31 0.027 (0.016) 0.001 (0.003) 3.30 8 0.01 -4.61 February 1-15 0.0190.013 0 0.002 (0.005) 3.00 8 0.02 -3.91 February 16-28 0.008 (0.005) 0.002 (0.005) 2.71 8 0.03 -3.51 March 1-15 0.00 I (0.002) 0.000 (0.000) 1.32 8 0.22 -1.51 March 16-31 0.000 (0.001) 0.000 (0.000) 1.00 8 0.35 -1.05 Combined df, (P), -2iJnP 24 0.001 66.37 probability
41
Univers
ity of
Cap
e Tow
n

Table 2c. Paired t-test of differences in the means of nest density (±SD) for nine grassland
bird species (Grassveld Pipit; Yellow-breasted Pipit; Orange-throated Longclaw, Ayres'
Cisticola; Long-tailed Widow, Common Quail, Quail Finch, Rudd's Lark, and Red-capped
Lark) nesting in annually burned (L+A) and biennially burned grassland (L+B) in
Wakkerstroom high-altitude grasslands. Nest density was calculated over 15 days periods
(shortest time between re-nest).
Date L+A (SD) L+B (SD) t df P InP October 1-15 0.002 (0.004) 0.005 (0.007) -1.32 8 0.22 -1.51 October 16-31 0.005 (0.007) 0.019 (0.024) -1.59 8 0.15 -1.90 November 1-15 0.01l (0.011) 0.038 (0.034) -2.14 8 0.06 -2.81 November 16-30 0.028 (0.022) 0.039 (0.026) -1.40 8 0.20 -1.61 December 1-15 0.022 (0.018) 0.027 (0.021) -0.47 8 0.65 -0.43 December 16-31 0.031 (0.021) 0.032 (0.029) -0.03 8 0.98 -0.02 January 1-15 0.024 (0.016) 0.013 (0.009) 1.94 8 0.09 -2.41 January 16-31 0.027 (0.016) 0.008 (0.006) 3.12 8 0.01 -4.61 February 1-15 0.019 (0.013) 0.017 (0.015) 0.33 8 0.75 -0.29 February 16-28 0.008 (0.005) 0.005 (0.006) 1.78 8 0.11 -2.21 March 1-15 0.001 (0.002) 0.001 (0.002) -0.05 8 0.96 -0.04 March 16-31 0.000 (0.001) 0.001 (0.001) -0.46 8 0.66 -0.42 Combined probability dC, (P), -2LlnP 24 0.005 36.50
42
Univers
ity of
Cap
e Tow
n
0,090
'ni 0,080
..c: 0.070 $ (J) 0.060 Q.)
S 0,050 J!' ·w 0,040 c:: (!)
0,030 "0
iii 0,020 (!)
Z 0.010
0,000
/~/ r L-~ __ ~~~~~~--__ ----_- ---r~--~--__ ~~~~,~t~=-.~ ___ ~
OCT1· OC NOV1· NO DEC1· DEC16· JAN1· JAN16· FEB1· FEB16· MAR1· MA 15 T16·31 15 V16·30 16 31 15 30 15 28 15 R16·31
APR1· 15
AP R16·30
Fig 1. Nest densities of five focal species over IS-day periods during the breeding season in
grassland under light grazing with frequent (annual) burning. Species: GP = Grassveld
Pipit; YBP = Yellow-breasted Pipit; OTL = Orange-throated Longc1aw, AC = Ayres'
Cisticola; LTW = Long-tailed Widow.
0.160
(tJ 0,140 ..c: --.!!l 0.120 (J) (!)
0,100 S J!' 0.080 Ow c:: 0,060 (!) "0
iii 0,040 (!)
Z 0,020
0,000 OCT1· OC NOV1· NO DEC1· DEC16· JAN1· JAN16· FEB1· FES16· MARl· MA APR1· AP
15 T16·31 15 V16·30 16 31 15 30 15 28 15 R16·31 15 R16·30
Dates
Fig 2. Nest densities of five focal species over IS-day periods during the breeding season in
grassland under light grazing with infrequent (biennial) burning. Species: GP = Grassveld
Pipit; YBP = Yellow-breasted Pipit; OTL = Orange-throated Longc1aw, AC = Ayres'
Cisticola; LTW = Long-tailed Widow.
43
Univers
ity of
Cap
e Tow
n

Fig Ia Focal ~es cx:ntira:J
"0
i20l~ 1§ 15· .IN· ..... _ ••••• .- 10.. "
~ 5 ~~.I_.I __ ., ~ o"'~ ~"i"'·! iii i f i I t i i j
?J? 1 2 3 4 5 6 7 8 9 10 11 12 13 14
J ritiatioo pericx:J
Fig Ib Yellcwbwsted Pipt (YEP)
lritictioo faicx:J
Fig Ic Ayre's Osticola (AC)
"0
I:A ill 20 " (\) , . z 0 ,' ••• I. . I. . ?J? r"~:~ 1 2 3 4 5 6 7 8 9 10 11 12 13 14
lnitiatioo period
• - •• • o/J.\lL-JIB
---o/J.\lL-I3B
••.•••. %'t13P..f.tB
---%'t13P-I3B
- - .-. ·%.AC-AB
---o/!AC8B
Fig Id Q-asswId Pilit (GP)
]~~ J1l 30 ~ '1'1'1 ;20j~.~.,. ',., iii 10 . -. . . I
~ 0 ~ o
Fig Ie
1 2 3 4 5 6 7 8 9 10 11 12 13 14
Jritiatioo pericx:J
Ocrg7ttn::ated l.cqpaN (on.)
_ ••. -%GP-JIB
---o/tGP-8B
~1~ ..... ~~ ~ ~ . . !::15 " ••• ,' '1' ...... ___ O/.oTl-I3B !!l10.· • en • (\) 5.. '. ~ 0 ~"""~~1ilJr"':"". i • I .1
1 2 3 4 5 6 7 8 9 10 11 12 13 14
Imatico pericx:J
Fig If Long-tailed WtcbN (L TW)
"0
a:j . jg 20 ,," .\ en • • ~ o.,.,~::· .... ,., .. ,. (\) : ...
1 2 3 4 5 6 7 8 9 10 11 12 13 14
Iniation period
..•. '%lTW-AB
---o/t!. TW-BB
Fig3. (a-f). Nest chronology of clutch initiation among five major grassland bird species in grasslands under annual burning (AB)
and under biennial burning (BB) regimes during each ofthe thirteen I5-days blocks spanning the breeding season; starting on 01 October.
44
Univers
ity of
Cap
e Tow
n

Effects of management practices on clutch size
Only GP provided a sufficient sample size to test for the effect of grazing intensity on
clutch size. Clutch size for GP was significantly smaller in heavily grazed (2.27 ± 0.52)
than in lightly grazed grasslands (2.89 ± 0.57) (t-test: t = 6.17, df= 197, P < 0.001). When I
controlled for grazing, I found that clutch size for L TW was significantly smaller in
annually burned grassland (3.02 ± 0.67) than in biennially burned grassland (3.41 ± 0.53)
(t-test: t = 3.40, df = 109, P < 0.001). I found no effect of burning on any of the other 6
species (Table 3, P > 0.05). Management practices can influence clutch size in two ways,
viz. food availability and nest predation. When I controlled for predation by considering
clutch size in L+A and L+B grasslands where risk of predation for GP were equal (0.958 ±
0.004 versus 0.965 ± 0.005; Chi-Square; X2, = 1.19, 1df, P > 0.05), burning frequency had
no effect on clutch size (t-test: t = -0.40, df= 240, P> 0.05) (2.89
± 0.52) versus 2.92 ± 0.56). However, when I controlled for food by considering clutch
size in H+A and L+B grasslands where food abundance were equal (12.6 ± 5.0 g versus
16.9 ± 9.6 g; Mann-Whitney U test, U = 430, 66 df, P> 0.05), clutch size for GP was
significantly smaller in heavily grazed (2.27 ± 0.57) compared to lightly grazed grasslands
(2.92 ± 0.56) (t-test: t = 5.51, df= 107, P < 0.0001).
N umber of broods
Although some birds were colour banded, most birds in this study were not individually
identifiable. Banded birds, however, indicated that some pairs were rearing at least two
broods per season and regularly re-nested after a failed attempt. Multiple broods and re
nesting to replace depredated nests occurred in YBP, GP, and OTL and were also a
possibility for all other species. Three successful broods per breeding season were
occasionally possible for early nesters.
45
Univers
ity of
Cap
e Tow
n

Table 3. Mean clutch size (SD) of seven grassland bird species nesting in annually (L+A)
versus biennially burned (L+B grasslands, but under similar light grazing pressure from
livestock.
Mean (±SD) Mean (±SD) n L+A L+B t-value df !!
Long-tailed Widow (52,59) 3.02 (0.67) 3041 (0.53) -3.40 109 0.0010
Ayre's Cisticola (94,25) 3048 (0.67) 3.52 (0.59) -0.28 117 0.7789 Grassveld Pipit (166, 76) 2.89 (0.52) 2.92 (0.56) -0040 240 0.6886 Yellow-breasted Pipit (117,55) 3.02 (0.44) 3.02 (0.36) -0.02 170 0.9872 Orange-throated Longclaw (81,58) 3.26 (0.67) 3.16 (0.45) 1.03 137 0.3042 Quail Finch (09,25) 4.44 (0.88) 4.08 (0.95) 1.00 32 0.3243 Common Quail {25,041 5.92 {1.411 4.75 {2.06) 1.45 27 0.1585
46
Univers
ity of
Cap
e Tow
n

DISCUSSION
I found that vegetation cover, structure (foliage density), complexity and structural
heterogeneity were lowest in H+A grasslands, intennediate in L+A grasslands and highest
in L+B grasslands (Chapter 2). This result hinted at the fact that grazing and burning may
affect vegetation, and consequently abundance or availability of food resources and nesting
sites for breeding birds.
Species richness is affected by excessive and regular defoliation
As expected, management practices affected species richness and diversity suggesting that
grazing pastures varied considerably in their attractiveness for birds. The low species
richness in H+A grasslands could be explained by the simplicity of the vegetation structure
in them. Burning eliminates ground litter, reduces habitat heterogeneity and simplifies
habitats floristically and structurally, which in turn can reduce the diversity of birds. This is
probably due to the effects of grazing and burning on availability of seeds and invertebrate
food resources. Low disturbance (e.g. in L+B grasslands) may, however, also lead to a
decline in species diversity. For example, this study found that all birds avoided tall and
thick vegetation suggesting that the exclusion of grazing and burning as management tools
in grassland can be detrimental to the associated bird fauna. This supports the intennediate
disturbance hypothesis (see Vitousek and Hooper 1993). Many studies elsewhere have also
demonstrated that species number is often greatest under moderate disturbance (see
references in Pickett and White 1985). Our results further indicate that birds species
diversity is likely to drop under high disturbance supporting the hypothesis that range
contractions (or local extinctions) of grassland birds such as the Yellow-breasted Pipit, are
a consequence of changing management practices on grasslands.
Bird abundance is affected by management-related defoliation by management
practices
Bird densities were significantly higher for all species in lightly grazed compared to
heavily grazed grasslands, but there was no difference in this respect between annually
burned and biennially burned grasslands. Although I recorded 48 species during the study
period, fewer than 10 species could be considered as common. Higher abundance of birds
in L+A than H+A grasslands suggests that breeding grassland birds may not tolerate
excessive disturbance. The observed low density in H+A grassland could be explained
47
Univers
ity of
Cap
e Tow
n

either by food limitation or nest predation because heavy grazing can reduce availability of
food (Conner et al. 1986) or nesting substrates (Morris 1967, Ammon and Stacey 1997).
Higher abundance of birds in L+A than in L+B grasslands suggests that breeding grassland
birds may, however, prefer some disturbance. I did not rigorously test the effect of total
removal of grazing or the complete exclusion of burning. However, two plots that were
only lightly grazed and not burned for three years were generally avoided by most of the
species, suggesting a bell shape in relation to species response to management disturbance.
Our results are consistent with the hypothesis that an increase in intensity of grazing and
frequent burning is the cause of the observed decline in densities of grassland birds (e.g.
see Saab et al. 1995, Bendell 1974). Further, moderate grazing and infrequent burning
appear to be most beneficial to grassland birds. Ideally, grasslands should be burned
biennially and grazed moderately in order to benefit grassland bird populations. Although
the total bird diversity and density was reduced by frequent burning and intense grazing,
individual species were variously positively, negatively or neutrally affected by
management regimes. For example, RCL preferred open areas created by heavy grazing.
GP appeared resilient to grazing and appeared to tolerate, adapt and cope with the different
intensity and levels of grazing and burning. Most birds were more than twice as abundant
in lightly grazed than in heavily grazed grassland indicating their sensitivity to vegetation
changes resulting from livestock grazing. The Yellow-breasted Pipit (vulnerable) was most
affected by the level of disturbance. These observations suggest that, conservation plans
need a management approach that considers individual species, or management for habitat
mosaics for multiple-species conservation. Other studies have shown similar patterns in
bird responses to management regimes (e.g. see Zimmerman 1992, 1993, Saab et al. 1995,
Henderson et al. 2000, Muchai et al. 2002).
Nest density relates to management practices
Even though most bird species were present in all of the management regimes, most only
nested in specific habitats indicating that their distribution may largely be constrained by
lack of suitable nesting substrates or other resources for breeding. Grazing and burning
may affect vegetation, and consequently availability of nesting sites for breeding birds.
Vegetation structure influences the placement of nests (see Martin 1993c, Chapter 4). Low
ground cover and foliage density might be unsuitable to foliage dependant-species. For
example, H+A grassland, which was notable for its sparse vegetation cover and structure,
48
Univers
ity of
Cap
e Tow
n

was avoided for breeding by most of the focal species. YEP and OTL showed the strongest
affinities for dense vegetation cover for nesting in. Choices of nesting habitat by the species
in this study are consistent with the prediction that birds would avoid habitats that are more
vulnerable to predation for breeding purposes. Small passerines, especially in the tropics,
are particularly vulnerable to predators (Ricklefs 1969) and dense vegetation may enhance
their nesting success (Martin and Roper 1988, Chapter 5). Indeed, the relatively low
number of nests that we recorded in H+A grasslands could either suggest that birds avoids
nesting there, or that there was a high probability of nests being trampled, abandoned or
lost to predators before we found them. Although nest densities were similar when
comparing L+A and L+B grasslands, I could have missed finding more nests in the former
due to higher predation rates there.
Life history and duration of breeding
Breeding commenced earlier in biennially burned than in annually burned grasslands. Early
nesters are at an advantage as they have a longer nesting season. The delay in clutch
initiation may be costly if seasonal declines in nesting condition occur. Birds nesting in
habitats where risk of predation is intense can offset this effect by extending the duration of
breeding or laying multiple broods. The delay in clutch initiation may reduce the number of
broods by successful pairs or the opportunities for re-nesting. Multiple broods and re
nesting were observed in the few identified breeders. Although few birds were banded,
multiple broods and re-nesting could have been a common phenomenon based on the fact
that after nest failure or successful breeding, new nests were frequently found near earlier
ones.
Clutch size is affected by management practices
Although the proximate mechanism by which clutch size is adjusted remains poorly
understood, clutch size generally is one of the traits showing close proximate adjustments
to individual and local conditions (Lack 1968). Traditionally, evolution of clutch size has
long been mainly attributed to food limitation (Lack 1947) or to a combination of several
life-history traits (Roff 1992, Steams 1992, Murphy 2000). However, although often
overlooked, nest predation is the primary cause of nest mortality for many bird species
(Ricklefs 1969, Chapter 2), and may be the main driving force influencing avian life
histories (Skutch 1949, Linden and Meller 1989, Martin 1996, lulliard et aI., 1997, Martin
49
Univers
ity of
Cap
e Tow
n

et al. 2000a). My results are in accordance with these latter studies, which attributes
variation of clutch size to predation. Taken together, my results add support to the idea that
although frequently underrated, nest predation may be a more important force in driving
evolution of avian clutch size than food. Species that feed their dependent altricial young
may reduce risk of nest predation to their nestlings by reducing the rate that they visit the
nest to feed their young (Ghalambor and Martin 2001), thus trading the cost linked with
reduced food delivery to their offspring against a reduction in risk of death to themselves or
their young ones (Ghalambor and Martin 2001). Large clutches should require more
feeding trips by parents to feed young. Increased activities associated with large broods
may attract predators. (Skutch 1949, Martin et al. 2000a, Murphy 2000).
Note that young birds may have used marginal habitats as opposed to older birds. If
suitable habitats are already saturated, immature birds could be forced into low quality
habitats (H+A), both in terms of food availability and risk of nest predation. If older birds
occupy the best nesting habitats, then higher clutch sizes in high quality plots may simply
be a result of the positive correlation with bird quality. This could also explain the reduced
clutch size for GP in H+A grassland and for LTW in L+A grasslands. However, on
occasion first year breeders (young birds) had territories in high quality habitats suggesting
that habitats were not saturated.
50
Univers
ity of
Cap
e Tow
n

Effects of management practices on grassland birds habitat selection: Is nest site
preference under selection and adaptive?
Abstract
Identification of traits determining fitness and knowledge of the ecological significance of
traits under selection is crucial for understanding the way in which organisms choose their
habitats. I examined microhabitat choices, and the form of natural selection and
adaptiveness of preferences of four coexisting grassland bird species, which breed in the
high altitude grasslands, at Wakkerstroom South Africa. Breeding birds selected nest
patches with greater foliage cover, vegetation density, and heterogeneity than was generally
available. The non-random nest site choices differed among species. Comparison of
vegetation features at successful and unsuccessful nests supported the idea that nesting
success is a strong selective force on habitat choice. Nest success was higher in preferred
than non-preferred habitat for all the three species, suggesting that preferences were
adaptive. Estimation of fitness functions relating fitness of individuals to critical habitat
features using cubic spline regressions, standardized directional selection differentials and
selection gradients suggest that natural selection might be acting to favor preference for
specific habitat features that determines fitness.
Key words: South African high altitude grasslands, management practices, habitat
selection, natural selection, critical habitat features.
INTRODUCTION
Nest-site microhabitat choices are assumed to be adaptive such that fitness is greater in
preferred than non-preferred microhabitats (Jaenike and Holt 1991), and to have a genetic
basis (Kekick et al. 1980, laenike and Holt 1991). That is, when allowed complete freedom
to choose habitats, birds should choose a habitat in which fitness is maximized. Genetic
variation for habitat selection is common, particularly in invertebrates (Kekick et at. 1980,
laenike and Holt 1991), but not so in vertebrates (Schluter 1988). Identification of specific
habitat features that influence the occurrence, distribution, density, and fitness of birds is a
maj or goal in avian ecology (Holmes 1981). When birds settle in habitats and select nesting
51
Univers
ity of
Cap
e Tow
n
patches, they are believed to do so non-randomly (e.g. see, Fretwell 1972, Mackenzie and
Sealy 1981, Cody 1985, Peterson and Best 1985, Martin and Roper 1988, Rosenzweig
1991, Rodrigues 1994). Explanations for why individuals are not randomly distributed
across habitat types, however, remain poorly understood.
Density may not be positively correlated with fitness (Pulliam 1988, Martin 1998)
or reflect preference (Van Home 1983). Yet, traditionally, habitat preferences in birds are
often inferred from correlations of occurrence and density to habitat features (e.g. see
Fretwell 1972, Cody 1985, Muchai et al. 2002) rather than measurements that have a direct
fitness component. Recently, Martin (1998) has shown that nest-site selection is closely
tied to fitness and has potential consequences for natural selection and population
dynamics. Fitness and habitat choice in birds is commonly measured at the population level
(Fretwell and Lucas 1970). However, nest sites represents microhabitat choice by
individuals. Thus, measurements of fitness consequences of nest sites choices by
individuals provide the most appropriate test of habitat preference.
Adaptiveness of habitat preferences in birds can be examined by estimating the
relative fitness of habitat choices by individual breeding birds when each individual is
given the full range of habitats from which to choose (Jaenike and Holt 1991, Martin
1998). I had the opportunity to study grassland birds in a system that was managed in three
ways, viz. heavily grazed and burned annually (H+A), lightly grazed and burned annually
(L+A), and lightly grazed and burned every second year (L+B). Vegetation varied
considerably between management regimes providing a gradient in variation in habitat
features across management types. Since birds were nesting in these habitat gradients, and
because habitat features are known to directly influence fitness (Martin 1993c),
differentially managed grassland areas provided me with an ideal opportunity to examine
nest-site selection and adaptiveness of microhabitat preferences in birds. Birds were
breeding in the different management types at different densities because of the structurally
dissimilar habitat types caused by differential management (Chapter 3). Relative breeding
densities in these management habitat types were thus assumed to represent preferences.
In this paper, I set out to examine nest site choices and whether they are under
selection and adaptive in a grassland study system using four ground-nesting grassland bird
species. First, I show that habitat features at nest site differed with those at random sites
and between species. Second, I compare vegetation features for successful versus failed
nests to examine whether they differ in order to identify critical nest site habitat features for
52
Univers
ity of
Cap
e Tow
n

each species. Third, I document preferences by examining the nesting densities of birds
across management systems. Fourth, I analyze various components of fitness to examine
adaptiveness of preferences. Fifth, I estimate the selection functions to examine whether
selection gradients could favour and maintain preferences.
STUDY AREA AND METHODS
Study area
The study was conducted in the high altitude grasslands of Wakkerstroom in Mpumalanga
province, South Africa at 1800-2200 m a.s.1. from 1998-2001. The study area (centred at
270 10' S, 300 06' E) is located on the high lying grassveld between 1800m to 2250m
elevations. The main land use in the Wakkerstroom district is large-scale livestock farming.
The grasslands are managed with grazing and burning. More than 80% of the farmers either
entirely rear beef cattle. Other farmers practice mixed farming of both cattle and a few
sheep. Farmers also keep some goats, a few horses and game such as blesbok. Grazing
intensity is mainly either heavy or light. Heavy grazing intensity was assumed to be > 3
cow (454 kg) or 5 sheep/ha and light grazing was < 1.5 cow (454 kg) or 5 sheep /ha.
Livestock continuously graze the same grassland throughout the breeding season. The
grasslands are burned either annually or biennially.
Four study species of ground-nesting grassland birds were used in this study, viz.
Yellow-breasted Pipit Hemimacronyx chloris (YBP), Grassveld Pipit Anthus
cinamomerous (GP), Orange-throated Longclaw Macrony capensis (OTL), and Ayres'
Ayres' Cisticola Cisticola ayressii (AC). Multiple brooding and re-nesting are common in
all these species and they all build a new nest in a different location on the territory for
each nesting attempt. YBP, GP and OTL are all members of the family Motacillidae, and
considered to be ecologically broadly similar.
Field work
The whole study area was intensively searched for nests (for all grassland birds) throughout
the study period from 1998 to 2001. Searching and locating of nests was done by rope
dragging to flush out birds from nests, or based on behavioural observation. This method of
nest finding (as opposed to direct searching) minimizes biases of finding nests that are
easily detectable. Nests were visited to record their status at 1-5 day intervals until the
53
Univers
ity of
Cap
e Tow
n

event was completed or had been terminated. Nests were considered successful if one or
more young fledged, and unsuccessful if they failed completely.
Microhabitats were measured following techniques modified from Wiens and
Rotenberry (1981). Briefly, vegetation was measured at nest sites, and for comparison, at
random sites. Random sites were the same measurements recorded for each management
treatment (see Chapter 2). The nest site was considered to be all habitats from 1 m to 10 m
from the nest. Vegetation features at nest site were measured at 1m intervals along a 10m
tape extending outwards from the nests in each of the four cardinal directions. Nest site
vegetation measurements were recorded using the same protocol as described in Chapter 2.
10 nest site and 10 random site vegetation variables were recorded.
DATA ANALYSIS
Nests were discovered at various stages of development. Thus, daily nest success rate was
calculated following Mayfield (1961, 1975), which only make use of information from the
period during which a nest was under observation. The mid-point between nest visits was
used to estimate when critical events in the nesting cycle occurred. Half the number of days
between subsequent visits over which a nest failed or fledged (although we did not
extrapolate beyond the normal nesting period) was added to the previous number of days
the nest survived to obtain the total exposure days (Mayfield 1961). For each species, I
calculated daily mortality as the number of failures divided by the total number of active
nest observation days (exposure days). I calculated daily survival as (1 - daily mortality). I
calculated standard errors of Mayfield's survival probabilities according to Johnson (1979)
and variance of Mayfield's estimator according to Hensler and Nichols (1981). Hypothesis
testing was conducted using the Z-test for daily survival probability according to Hensler
and Nichols (1981) and Program CONTRAST (Hines and Saucer 1989).
I used univariate analysis of variance to test for differences in the vegetation
characteristics between nest site and random sites, and variation in vegetation variables
between successful and unsuccessful nest sites for each bird species. These univariate
comparisons involved I-way ANOV A. I compared each species' nest site with available
habitat (random sites) in separate analysis for all 10 habitat variables. Habitat variables that
discriminated between groups (nest site versus random sites, and successful versus
unsuccessful nest sites) were identified by stepwise discriminant function analysis (SDFA).
Equality of the covariance matrices was tested using Box's M criterion. The between group
54
Univers
ity of
Cap
e Tow
n

variance/covariance matrices often showed significant heteroscedasticity (P < 0.05). Thus,
discriminant function was based on the pooled within-group covariance matrices and using
the Mahalanobis distance (Minimum d) between group centroids as the criterion for
maximizing separation of groups (Hand 1981, Williams 1983). This method is most
appropriate when covariance matrices are not homogenous (Hand 1981, Williams 1983).
However, moderate violations of equality of the covariance matrices probably have little
effect on two-group classification success and F-tests can still be powerful (Cooley and
Lohnes 1971, Williams 1983). Thus, Wilks' lambda and F-tests were used to determine the
combination of variables providing the best group separation for two-group classifications.
Because group size sample sizes differed, the classification performance of SDF A was
tested against a chance model, using Cohen's kappa statistic (Z values) to test whether the
SDF A models classified the observations significantly better than chance alone (Titus et al.
1984). Structure coefficient from DFA was used to determine correlations of variables with
the discriminant functions and standardized coefficients to determine the unique (partial)
contribution of each variable to the discriminant functions.
The form of natural selection on habitat selection was estimated by estimating
selection surfaces (fitness function) relating nest survival of individuals to habitat variables
that influence nest site choices. Fitness functions, f, were estimated using cubic spline
regression (Schluter 1988), a 'non-parametric' technique, applied to successful versus
unsuccessful vegetation binomial data using the equation: Y = f(z) + random error, where, Y
is survival (nesting success; 1 or 0 for success or failure respectively). A measure of
individual fitness, z is the trait (continuous variable) under selection and J(z) is the
probability of survival as a function the selected trait. Confidence limits (standard errors of
the predicted regression surfaces) for splines were estimated by bootstrapping in which the
original data was re-sampled 200 times (Schluter 1988). Natural selection is defined as
variation in fitness. Therefore relative selection intensity, which is a function of
intrapopulation variation in fitness, was estimated as the coefficient of variation of relative
fitness. Critical habitat variables that differentiated successful nests from unsuccessful
nests for each species were assumed to be the phenotypic traits influencing variation in
fitness, thus preference, and were used in the analysis of relative selection intensity.
Selection differentials (8), which measure phenotypic responses to selection on correlated
traits, were estimated as the slope of the univariate regression of relative fitness on
standardized characters. Phenotypic characters were direct measures of critical vegetation
55
Univers
ity of
Cap
e Tow
n

variables. The assumption here was that vegetation measurements reflected phenotypic
variation in behavioural choices on which selection acts (see Jaenike and Holt 1991).
Standardized directional selection gradients (B) were estimated as the partial regression
coefficients of relative fitness versus all important habitat variables. Habitat variables used
in these analyses seemed to be directly used by the study birds.
I performed all the statistical analysis using the STA TISTICA software (StatSoft
Inc, 2000) unless stated otherwise. Analyses for computation of fitness surfaces were done
by a software (Univariate program version 4.0) provided by Dolph Schluter. Significant
levels for statistical tests were set at P < 0.05. Percentage data were arc sine transformed to
more closely fit the normal distribution (Sokal and Rohlf 1995). Means are presented ± SD.
RESULTS
Vegetation differences among nest sites and random sites
Nest sites differed from random sites for most of the 10 habitat variables examined for all
the four species (Appendix 1), with random sites having the lowest values, indicating
nonrandom nest-site choice. All four discriminant analyses (see tables 1-4) yielded a single
highly significant canonical axis (P < 0.0001 for all cases) that strongly differentiated nest
sites from random sites, further supporting the non-random nest site selection (Mahalanobis
distance: P < 0.0001 for all cases). Briefly, all the four species' nests were typically placed
in areas with relatively more ground vegetation cover, higher vegetation structure (foliage
density and height), and greater heterogeneity than available elsewhere. One could
confidently distinguish YBP nest sites from random sites using three out of the 10 habitat
variables (Table 1), including two horizontal heterogeneity variables and one vertical
heterogeneity (patchiness) variable (Table 1). OTL nest sites were distinguished from
random sites using six out of the 10 habitat variables (Table 2), including one coverage
variable, two structural vegetation variable (horizontal and vertical foliage density), and
three horizontal heterogeneity variables (Table 2). One could distinguish GP nest sites from
random sites with five of the 10 habitat variables (Table 3), including one coverage
variable, one structural vegetation variable (vertical foliage density), one vertical
patchiness variable and two horizontal heterogeneity variables (Table 3). Lastly, AC nest
sites were differentiated from random sites using six out of the 10 habitat variables (Table
4), including one coverage variable, two structural vegetation variable (horizontal and
vertical foliage density), and three horizontal heterogeneity variables (Table 4).
56
Univers
ity of
Cap
e Tow
n
Nest patch differences among species
SDFA yielded two highly significant (X2 > 12.8, P < 0.05 in both cases) canonical axes that
strongly differentiated nest sites of the three ecologically similar species from each other
(Mahalanobis: P < 0.05, F> 2.7, df= 5, 444 for all pairwise comparisons). Nest sites of the
three species were correctly classified more frequently than not (Table 5), reflecting strong
differences in nest-site selection. When all four species were considered, SDF A yielded
two highly significant discriminant function axes (Xl> 114.41, P < 0.000 1 in the first two
canonical axes) that strongly differentiated nest sites of the four species from each other
(Mahalanobis: P < 0.05, F> 2.4, df = 7, 555 for all pairwise comparisons) and one non
significant canonical axis (X2 = 9.9, P > 0.05). Nest sites of the four species were correctly
classified more frequently than not (Table 6), reflecting strong differences in nest-site
selection between species.
57
Univers
ity of
Cap
e Tow
n

Table 1. Mean (SD) habitat characteristics that are important in discriminating between (A) nest
site versus random site and (B) successful versus failed nests of the Yellow-breasted Pipit, using
univariate (ANOVA) of differences in the means and stepwise discriminant function analysis.
Variables are given in the order in which they were entered in the model. Asterisks indicate
significance: *p < 0.05, **P < 0.01, ***p < 0.001.
Univariate analysis Discriminant analysis A Variable Nest Site Random F P Wilk's Structure Standard P
(150) (54) lambda coefficient coefficient HFDlO 5.77 (2.12) 2.07 (1.58) 137.25 0.0001 0.537 -0.585 -1.114 0.0001 CVTOTHITS 0.52 (0.14) 0.82 (0.32) 88.21 0.0001 0.534 0.470 0.994 0.0001 VFD10 4.36 (1.78) 1.33 (1.48) 124.37 0.0001 0.341 -0.558 0.214 0.0072
Correctly 100.0% 87.0% Eigenvalue 1.981 classified Z=9.79***
B Successful Failed (67) F P Wilk's Structure Standard P (83) lambda coefficient coefficient
MAXHGT 26.9 (9.2) 17.41 (6.3) 51.77 0.0001 0.779 0.925 0.680 0.0002 VFD10 4.92 (1.63) 3.65 (1.72) 21.38 0.0001 0.728 0.594 0.310 0.0564 CVMAXHG 0.47 (0.12) 0.59 (0.14) 30.00 0.0001 0.720 -0.704 -0.265 0.1475 T
Correctly 73.5% 76.1% Eigenvalue 0.409 classified Z = 6.01 ***
MAXHGT :::0 mean maximum vegetation height; CVMAXHGT (coefficient of variation of the
maximum height) :::0 a measure of horizontal heterogeneity; CVTOTHITS (coefficient of
variation of the mean total number of hits) = a measure of horizontal heterogeneity; HFDIO =
horizontal foliage diversity; and VDF10 = vertical foliage diversity.
58
Univers
ity of
Cap
e Tow
n

Table 2. Mean (SD) habitat characteristics that are important in discriminating between (A) nest
site versus random site and (B) successful versus failed nests of the Orange-throated Longclaw,
using univariate (ANOY A) of differences in the means and stepwise discriminant function
analysis. Variables are given in the order in which they were entered in the model. Asterisks
indicate significance: *p < 0.05, **p < 0.01, ***p < 0.001.
Univariate analysis Discriminant analysis
A Yariable Nest Site Random F P Wilk's Structure Standard P (131) (54) lambda coefficient coefficient
HFDI0 5.28 (2.44) 2.07 (1.58) 79.72 0.0001 0.629 -0.506 -1.125 0.0001 CYTOTHITS 0.54 (0.26) 0.82 (0.32) 39.56 0.0001 0.495 0.357 0.798 0.0001 HITO-lO 6.54 (3.29) 3.52 (1.88) 40.01 0.0001 0.427 -0.359 -1.340 0.0001 TOTHITS 19040 (17.46) 5.63 (SAl) 32.23 0.0001 00418 -0.322 1.218 0.0001 %TGCOY 96.9 (23.5) 97.3 (11.2) 0048 0.4875 0.393 0.040 0.393 0.0012 CYMAXHG 0.51 (0.18) 0.57 (0.11) 6.29 0.0130 0.379 0.142 0.287 0.0527 T
Correctly 99.2% 83.3% Eigenvalue 1.695 classified Z = 9.50***
B Successful Failed (62) (69)
HITO-lO 7.71 (3.79) 4.65 (1.20) 32.38 0.0001 0.778 -0.828 -1.684 0.0058 %HCOY 7.9 (5.9) 10.9 (8.7) 5.38 0.0219 0.788 0.338 0.867 0.0023 CYMAXHG 0.48 (0.19) 0.59 (0.32) 5.52 0.0203 0.759 0.554 0.484 0.0327 T %GCOY 88.8 (2204) 83.0 (22.1) 8.38 0.0045 0.760 -00421 0.674 0.0292 TOTHITS 25.82 (20.82) IU9 (8.79) 25.64 0.0001 0.747 -0.737 0.910 0.1148
Correctly 79.7% 66.1% Eigenvalue 0.366 classified Z= 5.23***
%GCOY = percentage grass cover; %HCOY = percentage herb cover; %TGCOY) = percentage
total ground cover; MAXHGT = mean maximum vegetation height; HITO-IO = mean horizontal
foliage density; TOTHITS = mean vertical foliage density; CVMAXHGT (coefficient of
variation of the maximum height) = a measure of horizontal heterogeneity; CYTOTHITS
(coefficient of variation of the mean total number of hits) = a measure of horizontal
heterogeneity; and HFDIO = horizontal foliage diversity.
59
Univers
ity of
Cap
e Tow
n
Table 3. Mean (SD) habitat characteristics that are important in discriminating between (A) nest
site versus random site and (B) successful versus failed nests of the Grassveld Pipit, using
univariate (ANOVA) of differences in the means and stepwise discriminant function analysis.
Variables are given in the order in which they were entered in the model. Asterisks indicate
significance: *P<0.05, **P<O.OI, ***P<O.OOI.
Univariate analysis Discriminant analysis (a) Variable Nest Site Random F P Wilk's Structure Standard P
(170) (54) lambda coefficient coefficient HFDlO 6.34 (2.65) 2.07 (1.58) 126.38 0.0001 0.794 -0.605 -1.684 0.0001 CVTOTHITS 0.67 (0.26) 0.82 (0.32) 12.23 0.0006 0.629 0.188 1.251 0.0001 VFDI0 3.00 (1.89) 1.33 (1.48) 35.09 0.0001 0.479 -0.319 1.142 0.0001 TOTHITS 10.90 (13.93) 5.63 (5.41) 7.34 0,0073 0.413 -0.146 -0.462 0.0005 %TGCOV 94.3 (23.0) 97.4 (11.2) 11.83 0.0007 0.401 0.185 -0.236 0.0190
Correctly 98.8% 87.0% Eigenvalu 1.558 classified e Z = 9.83***
(b) Successful Failed (89) (81 )
MAXHGT 21.03 (9.44) 12.89 (5.76) 46.93 0.0001 0.719 -0.819 -0.375 0.0764 HITO-IO 5.81 (3.59) 3.24 (1.09) 41.43 0.0001 0.775 -0.769 -2.319 0.0001 TOTHITS 16.14 (18.53) 6.13 (3.41) 25.02 0.0001 0.763 -0.598 2.224 0.0003 VFDIO 3.00 (1.89) 1.33 (1.48) 35.09 0.0001 0.744 -0.350 -0.678 0.0029
Correctly 72.8% 78.7% Eigenvalu 0.417 classified e Z 6.70***
% TGCOV) = percentage total ground cover; HITO~ 1 0 = mean horizontal foliage density;
TOTHITS = mean vertical foliage density; CVMAXHGT (coefficient of variation of the
maximum height) = a measure of horizontal heterogeneity; CVTOTHITS (coefficient of
variation of the mean total number of hits) = a measure of horizontal heterogeneity; HFDIO =
horizontal foliage diversity; and VDFIO = vertical foliage diversity.
60
Univers
ity of
Cap
e Tow
n

Table 4. Mean (SD) habitat characteristics that are important in discriminating between (A) nest
site versus random site and (B) successful versus failed nests of the Ayre's Cisticola, using
univariate (ANOY A) of differences in the means and stepwise discriminant function analysis.
Variables are given in the order in which they were entered in the modeL Asterisks indicate
significance: * P < 0.05, ** P < 0.01, *** P < 0.001.
Univariate analysis Discriminant analysis (a) Variable Nest Site Random F P Wilk's Structure Standard P
(62) (54) lambda coefficient coefficient HFDIO 4.91 (2.31) 2.07 (1.58) 58.13 0.0001 0.757 -0.422 -1.747 0.0001 CVTOTHITS 0.61 (0.19) 0.82 (0.32) 18.49 0.0001 0.358 0.239 0.921 0.0001 VFDIO 1.80 (1.46) 1.33 (1.48) 2.89 0.0916 0.262 -0.085 -0.172 0.6287 TOTHITS 7.72 (5.67) 5.63 (5.41) 4.09 0.0455 0.314 -0.104 2.221 0.0001 HITO-I0 4.81 (1.49) 3.52 (1.88) 17.14 0.0001 0.307 -0.223 -1.163 0.0001 %TGCOV 97.3 (17.6) 97.3(11.2) 0.00 0.9711 0.268 -0.010 0.206 0.1073
Correctly 98.3% 96.3% Eigenvalu 2.821 classified e Z = 9.72***
(b) Successful Failed (23) (39)
HITO-I0 4.99 (1.55) 3.47 (0.89) 18.26 0.0001 0.934 -0.864 -0.907 0.0001 CVTOTHITS 0.58 (0.19) 0.68 (0.18) 4.58 0.0364 0.776 0.427 0.506 0.0421
Correctly 87.2% 47.8% Eigenvalu 0.387 classified e Z = 2.59**
%TGCOY) = percentage total ground cover; HITO-IO = mean horizontal foliage density;
TOTHITS = mean vertical foliage density; CVMAXHGT (coefficient of variation of the
maXImum height) = a measure of horizontal heterogeneity; CYTOTHITS (coefficient of
variation of the mean total number of hits) == a measure of horizontal heterogeneity; HFD 1 0 ==
horizontal foliage diversity; and YDFIO = vertical foliage diversity.
61
Univers
ity of
Cap
e Tow
n

Table 5. Classification of nest sites (number and percentage of nests classified as nests of
each species) from discriminant functions of the three ecologically similar species of the
family Motacillidae based on separate covariance matrices.
Predicted species
Actual species Orange-throated Grassveld Pipit Yellow-breasted Total
Longclaw Pipit
Orange-throated Longclaw 44 (33.6%) 32 (24.4%) 55 (42.0%) 131
Grassveld Pipit 23 (13.5%) 117 (68.8%) 30 (17.6%) 170
Yellow-breasted Pipit 29 (19.3%) 38 (25.3%) 83 (56.3%) 150
Total 96 187 168 451
Table 6. Classification of nest sites (number and percentage of nests classified as nests of each
species) from discriminant functions of all four the study species based on separate covariance
matrices.
Predicted species
Actual species Ayre's Cisticola Orange-throated Grassveld Pipit Yellow-breasted Total
Longclaw Pipit
Ayre's Cisticola 60 (52.6%) 7 (6.1%) 34 (29.8%) 13 (11.4%) 114
Orange-throated Longclaw II (8.4%) 39 (29.8%) 30 (22.9%) 51 (38.9%) 131
Grassveld Pipit 17 (10.0%) 17 (10.0%) 107 (62.9%) 29 (17.1%) 170
Yellow-breasted Pipit 8 (5.3%) 21 (14.0%) 40 (26.7%) 81 (54%) 150
Total 96 84 211 174 565
62
Univers
ity of
Cap
e Tow
n

Vegetation differences between successful and unsuccessful nest sites
Vegetation variables associated with successful nests differed from those associated with
unsuccessful nesting attempts for all species (Appendix 1). Generally, individuals with
successful nesting attempts chose nest patches with greater vegetation cover, higher foliage
density, greater vertical heterogeneity and lower horizontal heterogeneity than unsuccessful
individuals. All four discriminant analyses (see Table 1-4) each yielded a single highly
significant discriminant function axis (P < 0.000 I for all cases) that strongly differentiated
successful nests from unsuccessful nests (Mahalanobis distance: P < 0.0001 for all cases).
Successful YBP nests tended to be placed in areas with a combination of less horizontal
heterogeneity and greater vertical patchiness than unsuccessful ones (Table 1). In addition,
vegetation was taller at successful YBP nests than failed nests (Table 1). Successful OTL
nests were associated with greater horizontal foliage density and lower horizontal
vegetation heterogeneity than failed ones (Table 2). In addition, grass cover for successful
OTL nests were significantly higher, and herb cover was significantly lower, at successful
nests than failed nests (Table 2). Successful GP nests were generally placed in vegetation
with greater horizontal and vertical foliage density and greater vertical structure and
heterogeneity than failed ones (Table 3). In addition, vegetation was taller at successful GP
nests than failed nests (Table 3). Successful AC nests generally were placed in vegetation
with greater horizontal foliage density and lower horizontal heterogeneity (Table 4).
Microhabitat preferences
Vegetation characteristic varied with management treatment (Chapter 2). Vegetation cover,
structure and heterogeneity were lowest in H+A, intermediate in L+A, and highest in L+B.
Correspondingly, birds were more abundant, and nest density higher in areas with
relatively more ground vegetation cover, higher vegetation structure (foliage density and
cover), and greater heterogeneity (Chapter 2). To further document preference, I partitioned
study plots into two groups as represented by their vegetation cover (cover and density);
i.e. plots with low and high cover respectively. Based on nest densities, there was an
apparent preference for high cover plots over those with low cover (Fig 1). This reflects the
likelihood of birds choosing high over low cover habitat for nesting if the two habitat
components are offered equally.
63
Univers
ity of
Cap
e Tow
n
Adaptiveness and selection on preferences
To demonstrate that habitat preferences are adaptive, I examined whether fitness (nesting
success) was higher in the preferred habitat. YBP and OTL entirely avoided highly grazed
areas. Daily nesting success rate (a fitness component) ofGP was lower (Z 2.5, P < 0.01)
under high grazing than low grazing. Highly significant differential mortality occurred
between individuals that selected biennially and annually burned grasslands for nesting.
Daily nesting success across species was higher (Z = 2.4, P < 0.01) in biennially than
annually burned grasslands. Further, analysis of preference~performance relationships
between birds nesting in the two cover habitat types showed that daily nesting success rate
was significantly greater in preferred high cover habitats than at non-preferred low cover
habitats (Fig 2, X2 > 4.3, df= 1, P < 0.05 for all pairwise comparisons).
Natural selection on microhabitat choices
All three species showed strong positive selection differentials (s) and directional selection
gradients (13) more often than not for the critical habitat variables examined (Table 7). This
was further supported by examination of the cubic spline curves (Figs 3a-d) for the
respective critical vegetation variables that were considered. AC, YBP and OTL showed a
negative selection for horizontal heterogeneity (Fig 3a, band d, Table 7). In addition, OTL
however also showed a negative selection for frequency of herbs (Fig 3b, Table 7).
64
Univers
ity of
Cap
e Tow
n

!DLow Cover .High Cover
90 ~ 1.0 0.7
~ 80
.. ~~ 1 ->-
(,) 50 c Q) 40 ::::J tT 30 -; Q)
20 i ... u.
10 0
Grassveld Yellow~ Orange- Ayre's Pipit breasted throated Cisticola
Pipit Longclaw
Fig 1. Frequency of nests placed in low and high cover habitats. The number above each
pair of bars is the nest density per hectare.
! 10 Low Cover (non-preferred) S • High Cover (preferred) S I
I 0.98...... ...... ... ~ 0.97 D:: 0.96 ca 0.95 > 0.94 .~ 0.93 ~ 0.92 >- 0.91 :: 0.9 ~ 0.89
0.88 +---'''--
Grassveld Pipit
Yellowbreasted
Pipit
Orangethroated Longclaw
Ayre's Cisticola
Fig 2. Daily survival rates (+1 SE) of nests in low cover (non-preferred) and high cover
(preferred) habitat: Asterisks indicate significance: *p < 0.05, **p < 0.01, ***P < 0.001.
65
Univers
ity of
Cap
e Tow
n

Table 7. Standardized directional selection differentials (s) and selection gradients (3) for vegetation characteristics associated with nesting
survivaL Data are means ± 1 SE. Asterisks indicate significance: * P < 0.05, ** P < 0.01, *** P < 0.001.
vegetation
%GCOV %HCOV
MAXHGT HITO-IO TOTHITS
CVTOTHITS CVMAXHGT HFDIO
VFDIO
Grassveld Pipit Yellow-breasted Pipit Orange-throated Longclaw Ayre's Cisticola s [\ S [\ S [\ S [\
0.027 ± 0.004··· 0.011 ± 0.006 0.027 ± 0.003··· 0.077 ± 0.012 .. •• 0.204 ± 0.051··· 0.013 ± 0.003...... -0.039 ± 0.011·"
-1.431 ± 0.261·"
0.058 ± 0.020" 0.084 ± 0.028 .... 0.100 ± 0.022"·
-0.019 ± 0.005···
-0.459 ± 0.315
0.042 ± 0.022
0.541 ± 0.187'" -1.345 ± 0.580 ....
0.066 ± 0.012· ... 0.012 ± 0.002···
-0.675 ± 0.306·· -2.634 ± 0.846**
0.122 ± 0.043·· .(J.O 13 ± 0.008
-0.877 ± 0.230··.. 0.624 ± 0.289·"
0.267 ± 0.060*** 0.244 ± 0.075 .. ••
-1.1 09 ± 0.396.... -0.225 ± 0.454
%GCOV = percentage grass cover; %HCOV percentage herb cover; HITO-IO = mean horizontal foliage density; TOTHITS = mean
vertical foliage density; CVMAXHGT (coefficient of variation of the maximuni height) = a measure of horizontal heterogeneity;
CVTOTHITS (coefficient of variation of the mean total number of hits) = a measure of horizontal heterogeneity; HFDIO = horizontal
foliage diversity; and VDFIO = vertical foliage diversity.
66
Univers
ity of
Cap
e Tow
n
......... -a :> .~
::1 V)
'" +-'
'" Z ....
i=4
1.000
0.1300
0.600
0.400
0.200
0.000 '-l-""'I"" ... ""I--F'-o;o • ...".-~-~ • .,-,-...,....,_...,.-.--........ ...,...--..-,.r 8.000 19.500 31.000 42.500 54000 65.500
MAXHGT
1.000· ••• ••• - •••
'" ~ 0.400
Z "-'
..... i=4
0.200
0.220 0.364 0.508 0.652
CVMAXHGT
1.000
,-, «! 0.800 1>
'e 0.600 ~ .... '" 0.400 Z '-' .... 0.2£10 Po< .--
O.llOO 0.920 2.200 3.'1$0 4.760
VFD10
0.796 0.940
Fig 3a. Fitness surfaces (probability of nest survival) of Yellow-breasted Pipit as a
function of the three critical vegetation features (MAXHGT - Mean maximum vegetation
height, CVMAXHGT Horizontal heterogeneity, VDFlO - Vertical foliage diversity)
characterizing the bird species' nesting choice. Dashed curves indicate ± ISE of
predicted values from 200 bootstrap replicates of the fitness function.
67
6.D40 7.32£1
Univers
ity of
Cap
e Tow
n

.-.. ,~ -"il 0.800 , ,-
I>
E III .........
:::s 0.600 ('{l ....
<II 0.400 Z '-' .... 0.200 P;
0.000 0.180
CVMAXHGT 0.070 4.016 7.962 11.908
EITO-I0
1.000 1.000
.-.. .-.. 0.800 "il
"il O.SOO I>
I>
'E 0.000 :::s ('{l
'E 0.600 :::s ('{l .... ....
<II DADO Z '-'
<II 0.400 Z '-'
.... 0.200 P; .... 0.200 P;
0.000 -_ •• 0.000 0.074 0.148 0.222 0.290 0.370 O.OgO 18.352 36.614 54.876
Herb Freq. TOTHITS
1.000
r-. 13 0.800 :> .... e: 0.600 :l
t:rl ... III 00400 Z '-'
\.0 0100 P;
0.000 '"i.~""""~rr-';-"-+""""""."=ia'~':"""--. __ "':':,,,,,,,;'"--.,---r¥ 0.200 0.474 0.748 loOn 1196 1.570
Grass Freq.
Fig 3b. Fitness surfaces (probability of nest survival) of Orange-throated Longc1aw as a
function of the six critical vegetation features (%GCOV - Percentage grass cover,
%HCOV - Percentage herb cover, HITO-lO - Mean horizontal foliage density, TOTHITS
- Mean vertical foliage density, CVMAXHGT - Horizontal heterogeneity) characterizing
the bird species' nesting choice. Dashed curves indicate ± ISE of predicted values from
200 bootstrap replicates of the fitness function.
68
73.138
Univers
ity of
Cap
e Tow
n

"...,
71 0.1300 I>
.~ o.eoo ::l
Vl
0.000 .... __ • __ •••• - .. II II II II •
5.050 12.920 20.790 28.660 36530 44.4j)0
MAJaIGT
1.000 --_.- .... -~J#".: ............... ;.,.
'"' .
J ,
J I 71 0.800 I ,
J I l> I ,
'e . ( , , I
0.600 ' I ::l , J
Vl •• i, " .... " '" O.4j)O " ~ _/f/
I I '-' I t ... 0.200
I
P1 I
0.000 ---1.110 lQ.168 37.226 55.284 73342 81.4j)0
TOTHITS
1.000
r-. 71 0.000 I> .~
0.600 ::l Vl oW
'" 0.4j)0 ~
, I
• Ii' '. I ' '-' I , ... 0.200
I , ~ , , I , , , ,
0.000 -~- ....... 1.090 4.832 11.574 12.316 16£158
BITO-tO
1.000
"...,
71 0.000 l> .~
0.600 ::l Vl .... '" 0.4j)0
~ '-' ... 0100 ~
VFDI0
Fig 3c. Fitness surfaces (probability of nest survival) of Grassveld Pipit as a function of
the four critical vegetation features (MAXHGT - Mean maximum vegetation height,
HITO-IO - Mean horizontal foliage density, TOTHITS - Mean vertical foliage density,
VDFIO - Vertical foliage diversity) characterizing the bird species' nesting choice.
Dashed curves indicate ± 1 SE of predicted values from 200 bootstrap replicates of the
fitness function.
69
18.S00
Univers
ity of
Cap
e Tow
n

1,000 • - - .11. 0._-'"""' ~ 0.800
'E ~ 0,600 til .... '" Z 0.400
'-'
~ 0.200
-...... _- ....... "' .........
0.000 """,~,.......";""""::"r-:'~' ':.,.:'~' .:.; •• :....,.~. -==p.'~"~. =;='I""'F~........p 0.295 0.469 0.623 0,787 0.951 1.114
CVTOTHITS
'"""' ~ ::. 'E ::l
V'l .... til
Z '-' I-.
Pi
1.000 , .11_- -, " , , I /
I I
0,800 I I I I , ,
I I I I
0,606 , I I I
I I • I ,
I I
0,400 / I / j
" " I ,~ ,
t O.2liO I
} /
" /
0.000 ," ... '" h. __
1.795 3.904 6,012 8.121 10229
HITO-10
Fig 3d. Fitness surfaces (probability of nest survival) of Ayre's Cisticola as a function of
the two critical vegetation features (HITO-IO - Mean horizontal foliage density,
CVTOTHITS - Horizontal heterogeneity) characterizing the bird species' nesting choice.
Dashed curves indicate ± ISE of predicted values from 200 bootstrap replicates of the
fitness function.
70
12.337
Univers
ity of
Cap
e Tow
n
DISCUSSION
Vegetation differences between nest sites and random sites
Nest sites differed from random sites for most of the habitat features of each of the four
species indicating nonrandom nest-site selection. Other studies have demonstrated non~
random selection of nest sites (e.g. see Martin and Roper 1988, Knopf and Sedgwick 1994,
Badyaev 1995, Martin 1998). Low Wilk's lambda (for nest site vs. random) for AC (Wilk's
lambda 0.262), before any discriminant function was derived, indicated a high amount of
discriminating power in the predictor variables suggesting that of the four species, they
were most specific in their choice of nest sites. Of the three ecologically similar species,
YBP was the most selective in choosing nest sites (YBP's Wilk's lambda = 0.335, OTL's
Wilk's lambda =0.371, and OP's Wilk's lambda = 0.391).
Microhabitat differences between species
The nonrandom nest-site choices also differed between species. Correct classifications
reflected general differences (or little overlap) between groups, while incorrect
classification reflected similarities (or overlap). Differences in nest site can emerge from
contrasting physiological endurance (e.g. see Martin 1998), adaptations among species, and
competition among species for resources (nest sites), which may result in partitioning of
nest sites. The high frequency of correct classifications suggested that birds were selecting
specific habitat features in their nesting patches. OP chose nests sites with relatively open
areas characterized with less ground vegetation cover, more herbaceous cover, lower
vegetation structure (foliage density and cover) and lower heterogeneity compared to either
OTL or YBP. The huge difference between AC and the other three species suggests that
nest-site selection might be evolutionarily conservative. If selection of nest site is heritable,
then selection should favour intraspecific differences in nest site selection to allow
successful coexistence of species. Differential susceptibility to mortality by predation over
evolutionary history between species may provide a possible explanation for the observed
differences. That is, for species that may have historically suffered high nest predation risk,
mortality caused by such high predation are thought to favour evolution of selection for
seeking better cover (concealment) or selection for unusual nesting sites to reduce
predation risk of nests. However, if predators do not search nests randomly, but can
develop search images for patches associated with nests, then stereotypy in nest site
placement should result in poor reproductive success (see Martin 1996a).
71
Univers
ity of
Cap
e Tow
n

Incorrect classification reflected similarities in nest sites of the species suggesting
that some birds are much less specialized and may often overlap with other species.
Although OTL generally nest in areas with relatively greater vegetation cover, density, and
vertical complexity, reduced availability of these features due to management disturbance
(grazing and burning) may sometimes force them to place their nests in areas similar to
either GP or YBP nesting sites. This may be the cause of the occasional misclassification in
our analysis. Some birds may also place their nests in unusual places as this sometimes
enhances nesting success (Filliater et al. 1994). Incorrect classification can also reflect
behavioural responses to predation where birds change nest sites following a failed nesting
attempt (e.g. see Martin 1992). Young birds might be forced to nest in non-preferred nest
site due to competition. In addition, overlap in nest site may be a consequence of body
condition of individuals. Inferior body condition of individuals may constrain the
acquisition of preferred high quality nest sites forcing individuals with low body condition
to nest in areas outside their normal preferred nest sites. The choice of nest site may
therefore involve conflicting selection pressures. For example foraging, and nesting may
require different habitats. Because incubation and caring for nestling are both energetically
expensive activities requiring high-energy demands on adults (e.g. e.g. see Roff 1992),
birds may trade off nesting sites with rich foraging sites by nesting in places unsuitable for
nesting. Such a trade-off between predation (nesting sites) and food (foraging sites) may
result in overlap (similarity) in nest sites between species. Overlap or similarity of nest
sites may to incur fitness costs (e.g. nest predation) because the resulting increase in
cumulative nest density can increase density-dependent predation rates (Martin 1988c,
1993c, 1996a).
Vegetation differences in relation to nesting success
Vegetation variables associated with successful nests differed from those associated with
unsuccessful nesting attempts for all species. This suggests that choice of habitat features
that influence the ability of birds to reproduce successfully should be favoured over
evolutionary time. The total-foliage hypothesis (see Martin 1996a, 1993c) predicts that
higher foliage density influences nesting success by concealing nests, inhibiting predator
search, or hindering nest discovery through inhibiting transmission of chemical, visual and
auditory cues (see Martin 1993). Selection for greater foliage cover may also be associated
with the enhanced thermal environment of nest microhabitat (e.g. see Walsberg 1985,
72
Univers
ity of
Cap
e Tow
n

Murphy 1993) leading to reduced likelihood of heat stress and cold stress, which enhance
nest success. The fitness advantage gained by individuals using habitat features associated
with successful nesting may have important consequences. Natural selection will eliminate
offspring of birds choosing the 'wrong' nesting site features while potentially favouring the
ability of organisms to identify and choose habitat features that define increased nesting
success. However, this will only happen if habitat choice indeed has a genetic basis.
Identification of critical habitat features
Critical habitats are those that directly influence the ability of birds to reproduce
successfully. Habitat variables that entered the model and which helped to distinguish nest
sites from random sites, may not be the habitat features that are critical to fitness (also see
Martin 1998). For example, although lower horizontal heterogeneity tended to be crucial
for successful nesting, random sites had a higher horizontal heterogeneity than nest sites.
Further, the difference suggests that, although greater structural heterogeneity might
simultaneously provide high food resource and diversity of nesting substrates, the criteria
for choice of nesting habitat may differ from that considered to meet other specific
demands such as food, perch sites (see Matsuoka 1997). If selection gradients could favour
and maintain selection for particular features through the process of natural selection, then
habitat features that affect fitness could be more important in driving habitat selection. In
particular, nest predation, the main cause of mortality in grassland birds (Chapter 2) may be
the driving force that determines choice of nest sites (also see Martin and Roper 1988,
Marzluff 1988). Thus, it may favour nests-site specialization and thus determine
preferences for particular habitat features.
Adaptiveness and selection on preferences
Nest success was higher in preferred than non-preferred habitat for all the four species,
indicating that preferences were adaptive. Natural selection can thus potentially favour the
ability of birds to distinguish and identify habitat features influencing nest success. The
strong positive directional selection coefficients and gradient selection for individual
habitat features that determine fitness provide the basis for the evolution of nest site
choices. It also suggests that these traits are under selection that can be maintained if
selection has a genetic basis. Habitat choices are assumed to have a genetic basis (Jaenike
and Holt 1991). Selection pressure will favour those individuals that succeed in their
73
Univers
ity of
Cap
e Tow
n
nesting attempts. Thus, if the above assumption is true, then choice of habitat features that
enhance reproductive success should be favoured over evolutionary time. Indeed, natural
selection maintains features that enhance fitness (also see Jaenike and Holt 1991). Nest
predation may favour nest site specialization to reduce overlap. However, in disturbed
habitats, very strong positive selection for particular traits may be reduced by natural
selection if individuals spend more time searching for them (which can amount to reduced
individual fitness).
The negative standardized selection gradient for mean vertical foliage density
(TOTHITS) indicated that vertical foliage density was not under selection when selections
for other habitat features in the multivariate array were considered. Note that if a nest is
well covered below 10 cm (HITO-IO; horizontal foliage density), any more cover on top
(e.g. given by TOTHITS) may have no extra effect on enhancing fitness. A negative
standardized selection gradient for vertical foliage density can also suggest that very thick
vegetation was selected against. Such vegetation can reduce visibility of the approach of
predators. Early detection of predators alerts the breeding bird and allows them to display
cryptic and evasive behaviour. Use of herbs as nesting substrates was strongly selected
against. Use of herbs as nesting substrates may have a bottle neck effect in the sense that
rapid growth of the herbs may leave nests exposed for individuals nesting under herbs or
choosing patch cover by herbs. The negative directional selection for horizontal
heterogeneity reflects selection for individuals placing their nests in less uniform habitats.
This might suggest that uniform distribution of vegetation interferes with the ability of
predators to locate nests.
Univariate directional selection (s) differentials differed from the multivariate
selection gradients (B) in some cases suggesting that multiple (rather than single) habitat
features were responsible for influencing fitness and nest site selection. The combinations
of all positive multivariate selection gradients provided the major combination of critical
traits for each species. Some traits (e.g. HITO-I0) appeared in the combination of traits
enhancing nesting success across species suggesting that these were the major heritable
determinants of nesting success.
Conclusion
This study clearly demonstrated that nest sites selection is non-random. The non-random
nest site choice probably differs between species to allow coexistence of species because
74
Univers
ity of
Cap
e Tow
n

overlap in nest site can incur substantial fitness cost. Although several factors are predicted
to be selective forces that detennines avian habitat selection (e.g. Holmes et al. 1986), this
study suggests that nest predation risk can strongly influence nest-site selection. There is
evidence that birds can respond to predation in their choice of nest sites (Martin 1996a,
Sieving and Wilson 1998). Indeed, birds are known to choose breeding habitat based, in
part, on risk of nest predation and actual nest predation events result in marked changes in
re-nesting location (Greig-Smith 1982, Marzluff 1988), presumably to avoid subsequent
attacks by the same predator (Morton et al. 1993). The fitness consequences of individuals
. differing in their selection for particular phenotypic traits suggest that preferences are
adaptive. Estimation of fitness functions relating fitness of individuals to critical
phenotypic traits (nest site) suggests that natural selection might be acting to favour
preference for specific fitness-related habitat features. Taken together, my results add
support to the idea that nest predation events can represent proximate and evolutionary
mechanisms potentially influencing an individual's decision about where to nest (Martin
1998). The strong positive directional selection coefficients and gradient selection
differentials for traits (nest site) that detennine fitness provide the basis for evolution of
nest site choices and suggest that these traits are under selection. Finally, this study
identifies critical phenotypic traits (nest-site characteristics) that directly influence fitness.
These are crucial for understanding the way in which organisms choose their habitats and
for their conservation planning.
75
Univers
ity of
Cap
e Tow
n

Appendix 1. Means (SD) of habitat characteristics between (A) nest site versus random site and (B) successful versus failed nests of four focal grassland bird
species that nest in the Wakkerstroom high altitude grasslands and the univariate (ANOVA) of differences in the means.
Yellow-breasted Pipit Orange-throated Longclaw Grassveld Pipit Ayre's Cisticola (a) Variable Nest Site Random F P Nest Site Random F P Nest Site Random F P Nest Site Random F P
~150) {54) (131) (54) (170) (54) (62) (54) %GCOV 87.2 (23.9) 86.7 (12.0) 0.01 0.942 86.2 (22.9) 86.7 (12.0) 0.14 0.710 83.1 (20.5) 86.9 (12.0) 6.23 0.013 87.7 (20.2) 86.7 (12.9) 0.14 0.706 %HCOV 7.9 (8.1) 10.3 (3.9) 4.36 0.034 9.3 (7.5) 10.3 (3.9) 0.89 0.347 9.6 (7.3) 10.3 (3.9) 0.44 0.507 10.0 (8.7) 10.3 (3.9) 0.03 0.862 %TGCOV 96.1 (23.1) 97,4 (I 1.2) 2,49 0.116 96.9 (23.5) 97.3 (11.2) 0,48 0.488 94.3 (23.0) 97.4 (11.2) 11.83 0.001 97.3 (17.6) 97.3 (11.2) 0.00 0.971 MAXHGT 23.3 7 (9.31) 18.10 (9.5) 12.57 0.001 25.56 (10.6) 18.1 (9.51) 20.24 0.001 16.77 (8.7) 18.1 (9.51) 0.91 0.341 20.29 (4.9) 18.10(9.5) 2.44 0.121 HITO-IO 5.89 (3.08) 3.52 (3.00) 28.14 0.001 6.54 (3.29) 3.52 (1.88) 40.01 0.001 4,47 (2.89) 3.52 (1.88) 5.09 0.025 4.81 (1.49) 3.52 (1.88) 17.14 0.001 TOTHITS 18.27 (15.67) 5.63 (5,41) 33.58 0.001 19.40(17.5) 5.63 (5,41) 32.23 0.001 10.9 (13.9) 5.63 (5.41) 7.34 0.007 7.72 (5.67) 5.63 (5.41) 4.09 0.046 CVMAXHGT 0.52 (0.14) 0.57 (0.11) 5.06 0.026 0.51 (0.18) 0.57 (0.11) 6.29 0.013 0.63 (0.31) 0.57 (0.11) 1.60 0.207 0.55 (0.12) 0.57 (0.11) 1.55 0.215 CVTOTHITS 0.52 (0.14) 0.82 (0.32) 88.21 0.001 0.54 (0.26) 0.82 (0.32) 39.56 0.001 0.67 (0.26) 0.82 (0.32) 12.23 0.001 0.61 (0.19) 0.82 (0.32) 18,49 0.001 HFDIO 5.77 (2.12) 2.07 (\.58) 137.25 0.001 5.28 (2.44) 2.07 (\.58) 79.72 0.001 6.34 (2.65) 2.07 (1.58) 126.4 0.001 4.91 (2.31) 2.07 (1.58) 58.13 0.001 VFDIO 4.36 (1.78) 1.33 (1.48) 124.37 0.001 3.91 (2.08) 1.33 (1.48) 68.33 0.001 3.00 (1.89) 1.33 (1.48) 35.09 0.001 1.80 (1.46) 1.33 (1.48) 2.89 0.092
(b) Successful Failed F P Successful Failed (62) Successful Failed Successful Failed (83) (67) (69) (81) (89) (39) (23)
%GCOV 89.1 (24.8) 83.0 (22.7) 8.33 0.005 88.8 (22,4) 83.0 (22.1) 8.38 0.005 85.2 (22.9) 81.3 (17.5) 5.57 0.019 88.2 (19.3) 85.2 (22.9) 1.42 0.238 %HCOV 8.3 (8.2) 7.3 (8.00) 0.59 0,442 7.9 (5.9) 10.9 (8.7) 5.38 0.022 10.1 (8.6) 9.1 (6.0) 0.82 0.368 8.8 (8.4) 13.2 (10.2) 3.24 0.077 %TGCOV 97.57 (20.7) 93.2 (25.7) 16.17 0.001 (21.5) (24.8) 4.99 0.027 96.4 (23.3) 92.2 (21.3) 12,40 0.006 97.8 (18.6) 97.1 (16.2) 0.29 0.592 MAXHGT 26.9 (9.2) 17.41 (6.3) 51.77 0.001 27.3 (9.87) 20.39 (7,4) 20.21 0.001 21.03 (9,4) 12.9 (5.76) 46.93 0.001 21.06 (4.5) 16,42 (5,4) 12.90 0.007 H1TO-1O 7.03 (3,41) 4.06 (1.52) 44.07 0.001 7.71 (3.79) 4.65 (1.20) 32.38 0.001 5.81 (3.59) 3.24 (1.09) 41.43 0.001 4.99 (1.55) 3.47 (0.89) 18.26 0.001 TOTHITS 24.30 (17.91) 10.18 (7.5) 36.37 0.001 25.82 (20.8) 11.39 (8.8) 25.64 0.001 16.14 6.13 (3.41) 25.02 0.001 9.05 (6.66) 4.19 (1.37) 11.84 0.001
(18.53) CVMAXHGT 0.47 (0.12) 0.59 (0.14) 30.00 0.001 0,45 (0.17) 0.57 (0.18) 14,48 0.002 0.60 (0.42) 0.65 (0.16) 1.05 0.306 0.52 (0.14) 0.59 (0.09) 5.20 0.026 CVTOTHITS 0.49 (0.14) 0.55 (0.14) 5.45 0.021 0.48 (0.19) 0.59 (0.32) 5.52 0.020 0.60(0.20) 0.73 (0.29) 11.66 0.001 0.58 (0.19) 0.68 (0.18) 4.58 0.036 HFDIO 5.76 (2.16) 5.76 (2.01) 0.00 0.998 5.19(2.18) 5.38 (2.73) 0.20 0.657 6.00 (2.68) 6.65 (2.60) 2.57 0.111 4.90 (2.66) 5.03 (1.61) 0.04 0.838 VFDIO 4.92 (1.63) 3.65 (1.72) 21.38 0.001 4.47(1.99) 3.28 (2.02) 11.35 0.001 3.44 (2.09) 2.60 (1.6)) 8.60 0.004 2.20 (1.69) 1.09 (0.21) 9.82 0.003
76
Univers
ity of
Cap
e Tow
n

Concealment is the key to nest survival in grassland bird communities
Abstract
I examined the relationship between nest-site and nest-patch characteristics, and nest
predation risk in three ecologically similar ground-nesting grassland bird species, the
Yellow-breasted Pipit Hemimacronyx chloris, Grassveld Pipit Anthus cinamomerous, and
Orange-throated Longclaw Macrony capensis, which breed in the Wakkerstroom high
altitude grassland, South Africa. The likelihood of nest predation clearly depended upon
habitat structure (foliage) at the immediate vicinity of the nest as well as the vegetation
surrounding the nest at the scale as large or larger than the nest patch. In general, variables
that are important in discriminating between successful and depredated nests across all
species were directly related to vegetation cover, density and horizontal heterogeneity.
Successful nests across all species were placed in denser foliage with thicker cover than
depredated nests. Mean horizontal vegetation heterogeneity at the nest patch tended to be
higher for depredated nests across species, suggesting that the uniform distribution of the
vegetation interfered with the ability of predators to locate nests. My results emphasize the
need to consider both nest-site characteristics and nest-patch characteristics in studies of
nest predation.
INTRODUCTION
Nest predation is the major factor influencing reproductive success for many passerine
birds (Ricklefs 1969, Martin and Roper 1988, Chapter 2) and is thought to be a critical
factor shaping many aspects of avian behaviour (Skutch 1949, Lindem and Meller 1989,
Kuleza 1990, Martin and Li 1992, Bosque and Bosque 1995, Martin 1996b). Few studies
have examined factors affecting risk of predation in birds. The variability in nest site
placement can directly affect the fitness of individuals using them (see Martin 1998, Stokes
and Boersma 1998), Consequently, birds should place their nests in microhabitats that
reduce the risk of predation (see Martin 1988b, Chapter 4).
Nest survival may be affected by microhabitat at two spatial scales (Martin and
Roper 1988): (1) nest site (characteristics within the immediate vicinity of the nest) and (2)
77
Univers
ity of
Cap
e Tow
n
nest patch (characteristics of the habitat patch surrounding the nest). Increased nest
concealment in the immediate vicinity of the nest (nest site) will reduce the probability of
nest predation - "nest concealment hypothesis." Increases in vegetation density and
complex vegetation at a scale as large or larger than the nest patch will also reduce the
probability of nest predation - "the total-foliage hypothesis" (Martin 1993c). The two
hypotheses are not mutually exclusive; rather their negative effects on fitness are additive.
The nest site hypothesis has been supported by some studies (e.g. Martin and Roper 1988,
Murphy 1983, Kelly 1993, Nonnent 1993), while others have not (Best and Stuffer 1980,
Holway 1991, Howlett and Stutchbury 1997). Studies in aquatic systems have shown that
foliage density at the scale as large or larger than the nest patch often reduces predation risk
(e.g. see Crowder and Cooper 1982). Yet, only few studies of birds have attempted to relate
vegetation characteristics at the scale of nest patch to nest predation risk.
In this paper, I examine the relationship between nest-site and nest-patch
characteristics and nest predation risk in three ground-nesting grassland bird species in the
high altitude grassland, South Africa. I addressed losses of nests to predators only; losses
due to other causes of mortality are not considered here.
STUDY AREA AND METHOD
The study was conducted in the high altitude grasslands of Wakkerstroom in Mpumalanga
province, South Africa at 1800-2200 m a.s.l. from 1998-2001. The study area (centered at
270 10' S, 300 06' E) is located on the high lying grassveld between 1800m to 2250m
elevations. Wakkerstroom's main vegetation types with respect to altitude and soil type, as
classified by Low and Rebelo (1996), are Moist Sandy Highveld Grassland dominated by
Themeda triandra, Digitaria thicholaenoides, Tristachya leucothrix and Hetropogon
contortus; North-eastern Mountain Grassland which is dominated by Tristachya leucothrix,
Loudetia simplex and Diheteropogon filifolius; Moist Clay Highveld Grassland dominated
by Themeda triandra and Natal Central bushveld dominated. The main land use in the
Wakkerstroom district is large-scale livestock fanning. These grasslands are managed in
three ways, viz. heavily grazed and annually burned (H+A), lightly grazed and annually
burned (L+A), and lightly grazed and biennially burned (L+B). Vegetation varies
considerably between management regimes. In particular, vegetation varies with respect to
floristic characteristics, vegetation cover, density, and structural heterogeneity.
78
Univers
ity of
Cap
e Tow
n

Three ecologically similar species of ground-nesting grassland birds of the family
Motacillidae were selected for this study, viz. Yellow-breasted Pipit Hemimacronyx chloris
(YBP), Grassveld Pipit Anthus cinamomerous (GP), and Orange-throated Longclaw
Macrony capensis (OTL). All three species are commonly multiple brooded and they build
a new nest in a different location at each nesting attempt.
Nest searches and monitoring
The whole study area was intensively searched for nests throughout the study period from
1998 to 2001. Searching and locating of nests was done by dragging a 50m rope between
two observers to flush out birds from nests, or based on behavioral observation. Nests were
visited at 1-5 day intervals to record their status until the nesting process was completed or
had been terminated. Nests were considered successful if one or more young fledged.
Conversely, if all nest contents (i.e. eggs or nestling) disappeared simultaneously, the nest
was considered to have been depredated.
Vegetation sampling
Nest-site and nest patch characteristics were measured following techniques modified from
Wiens and Rotenberry (1981). Nest-site and nest-patch vegetation characteristics were
measured at nests only after completion or termination of nesting. All these data were
collected within 2 weeks after the nesting episode. At each nest I measured eight nest-site
variables and 10 nest-patch variables. Vegetation variables at nest sites were measured at
10-cm intervals along 100-cm transects extending outwards from the nest in the four
cardinal directions. The nest patch was considered to be the vegetation> 1 m < 10m from
the nest. Vegetation features at the nest patch were measured at 1m intervals along a 10m
tape extending outwards from the nests in each of the four cardinal directions. At each
sampling point for both nest site and nest patch, a thin (6-mm diameter) rod was placed
vertically through the vegetation to the ground, and the number of contacts ("hits") with
plants within 0-5 cm, 5-10 cm, 10-20 cm, 20-30 cm, 30-40 cm, 40-50 cm and 50-100 cm
heights intervals recorded. The plant species making contact with the rod at each 10-cm
interval of the tape was also recorded. Bare ground or presence of rocks was noted when
vegetation or litter was absent at the point of contact with the ground. The following eight
nest site variables were then recorded. (1) Height of the primary concealing vegetation
(NSCHGT). (2) Percentage grass cover at nest site (%NSGCOV). (3) Percentage herb
79
Univers
ity of
Cap
e Tow
n

cover at nest site (%NSHCOY). The percentage coverage of grasses and herbs was
calculated as the frequency of occurrence of each type at all 44 samples along transects. (4)
Percentage total ground cover at nest site (%NSTGCOY), calculated as the proportion of
all points not recording bare ground or rocks. (5) Mean vegetation height at nest site
(NSHGT), given by the maximum height of the rod recording contacts with vegetation. (6)
Mean horizontal foliage density at nest site (NSHITO-I0), calculated as the number of
contacts of vegetation with the rod in the 0-10 cm height intervals. (7) Mean vertical
foliage density at nest site (NSTOTHIT), calculated as the mean total number of contacts
over the entire height of the rod. (8) Nest detectability (DETEC). Nest detectability at each
nest was measured by estimating the amount of lateral cover afforded nests in each of the
four cardinal directions and from above. This was estimated as the percentage of a 5x5 cm
fluorescent orange card marker attached to the nest that was visible from a distance of 1 m
away from the nest sides and 1 m directly above the nest roof. Similarly, the following 10
variables were also recorded. (1) Percentage grass cover at nest patch (%NPGCOY). (2)
Percentage herb cover at nest patch (%NPHCOY). (3) Percentage total ground cover at nest
patch (%NPTGCOY). (4) Mean vegetation height at nest patch (NPHGT). (5) Mean
horizontal foliage density at nest patch (NPHITO-I0). (6) Mean vertical foliage density at
nest patch (NPTOTHIT). (7) Horizontal heterogeneity, calculated using the coefficient of
variation of the maximum height interval with hits (CYHGT). (8) Horizontal heterogeneity,
calculated using the coefficient of variation of the mean total number of contacts over the
entire height of the rod. (9) Horizontal foliage diversity (HFD 1 0), calculated using a
heterogeneity index according to Wiens and Rotenberry (1981). (10) Vertical foliage
diversity (YDFI0), calculated using the Shannon diversity index.
DATA ANALYSIS
I used both uni- and multivariate methods to test for differences in the vegetation
characteristics between successful and depredated nests for each bird species. Univariate
comparisons involved I-way ANOYA (Sokal and Rohlf (1995). Variables that
discriminated between successful and depredated nests were identified by stepwise
discriminant function analysis (SDF A). This analysis helped to further investigate
relationships between nest-site and nest-patch characteristics, and nest predation. All 18
variables were included in this analysis. Equality of the covariance matrices was tested
using Box's M criterion. For each pair of groups tested, the covariance matrices were un-
80
Univers
ity of
Cap
e Tow
n

equal (P<0.05). Discriminant function analysis was then based on the pooled within-group
covalence matrix, where Wilks' lambda was used to determine the combination of
variables providing the best group separation, and using Mahalonobis distance (Minimum
D2) between group centroids as the criterion for maximizing separation of groups (Hand
1981, Williams 1983). Moderate violations of equality of the covariance matrices probably
have little effect on two-group classification success and F-tests can still be powerful
(Cooley and Lohnes 1971, Williams 1983). Finally, original variables selected by SDFA
were correlated with the discriminant function to examine their importance. Group sample
sizes differed. Thus, the classification performance of each SDF A was tested against a
chance model using Cohen's Kappa and its associated Z-value (Titus et al. 1984).
I performed all the statistical analyses using STATISTICA software (StatSoft Inc,
2000). Significance levels for statistical tests were set at P < 0.05. Percentage data were
arcsine transformed to more closely fit the normal distribution. Means are presented ±
standard deviation (SD).
RESULTS
Vegetation differences between successful and depredated nest
The mean values of most nest-site variables and nest-patch variables differed significantly
between successful and depredated nests for all species (Table 1-3). In all species,
depredated nests were placed in vegetation characterised with lower nest concealment,
lower foliage density, lower ground vegetation cover, lower vertical heterogeneity, and
greater horizontal heterogeneity than for successful nests. Discriminant function analysis
further emphasised the importance of both nest-site and nest-patch characteristics in
influencing nest predation for all species (Table 4-6). In all analyses, the number of
correctly classified cases indicated that nest fate was strongly dependent on specific
features (Table 4-6). For YBP, successful and depredated nests were discriminated
significantly (Wilk's lambda = 0.463, Minimum D2 = 4.9, P < 0.0001; approx. F = 44.4, df
= 3, 115) using three of the 18 variables considered (DETEC, CVHGT, %NSHCOV).
Briefly, successful YBP nests were distinguished from depredated nests by having a
combination of lower detectability at the nest site (DETEC) (i.e. greater nest concealment),
lower nest patch horizontal heterogeneity (CVHGT), and fewer herbs at the nest site
(%NSHCOV) (Table 4). Four of the 18 variables considered discriminated between
successful and depredated OTL nests (NPHITO-I0, DETEC, %NPTGCOV, CVGHT)
81
Univers
ity of
Cap
e Tow
n

(Wilk's lambda = 0.541, Minimum D2 = 3.4, P < 0.0001; approx. F = 17.2, df = 4, 81).
Briefly, successful OTL nests had greater horizontal foliage density at nest patch (NPHITO-
10), lower detectability at nest site (DETEC) (i.e. greater nest concealment), higher ground
cover at nest patch (%NPTGCOV), and lower nest patch horizontal heterogeneity
(CVHGT) than depredated nests. A model that included six out of the 18 variables
significantly discriminated between successful and depredated GP nests (DETEC,
NSHITO-10, %NPTGCOV, NSCHGT, NSHGT, NSTOTHIT) (Wilk's lambda = 0.404,
Minimum D2 = 5.9, P < 0.0001; approx. F = 20.6, df = 6, 84). Successful GP nests tended
to be placed in vegetation with lower detectability (DETEC) (i.e. greater nest concealment),
greater horizontal foliage density at the nest site (NSHITO-10), greater ground cover at the
nest patch (%NPTGCOV), taller primary concealing vegetation (NSCHGT), greater mean
vegetation height at nest site (NSHGT) and greater mean vertical foliage density at nest site
(NSTOTHIT), than for depredated nests.
82
Univers
ity of
Cap
e Tow
n

Table 1. Means (±SD) of nest-site and nest-patch characteristics of successful and
depredated Yellow-breasted Pipit nests and the univariate (ANOVA) of differences in the
means. Where appropriate, data were arcsine transformed before statistical analysis.
Variables Depredated Successful F P
Nest site
DETEC (%) 0.448 (18.4) 15.4 (13.7) 112.0 0.0001 NSCHGT 23.71 (8.90) 33.98 (9.86) 33.7 0.0001 %NSGCOV 84.0 (25.5) 92.1 (25.6) 13.0 0.0004 %NSHCOV 4.7 (5.4) 6.8 (8.0) 2.4 0.1238 %NSTGCOV 91.9 (26.4) 98.8 (19.1) 35.8 0.0001 NSHGT 17.84 (7.41) 27.85 (8.13) 47.1 0.0001 NSHITO-IO 4.76 (2.34) 8.09 (3.74) 29.8 0.0001 NSTOTHIT 14.85 (9.73) 29.32 (16.27) 30.3 0.0001
Nest patch
%NPGCOV 82.9 (23.3) 89.4 (26.2) 7.5 0.0072 %NPHCOV 5.8 (5.2) 8.1 (8.7) 2.6 0.1097 %NPTGCOV 91.8 (24.9) 97.5 (21.2) 18.1 0.0001 NPHGT 16.29 (6.78) 27.25 (9.58) 46.8 0.0001 NPHITO-IO 4.05 (1.74) 7.33 (3.54) 34.8 0.0001 NPTOTHIT 12.08 (8.03) 27.21 (17.57) 30.8 0.0001 HFDIO 6.77 (1.91) 6.19 (2.00) 2.5 0.1171 VFDlO 4.63 (0.78) 5.53 (0.71) 43.3 0.0001 CVHGT 0.60 (0.16) 0.46 (0.13) 28.3 0.0001 CVTOTHIT 0.55 (0.15) 0.49 (0.15) 4.7 0.0329
83
Univers
ity of
Cap
e Tow
n

Table 2. Means (±SD) of nest-site and nest-patch characteristics of successful and
depredated Orange-throated Longclaw nests and the univariate (ANOVA) of differences in
the means. Where appropriate, data were arcsine transformed before statistical analysis.
Variables Depredated Successful F p
Nest site
DETEC 0.384 (0.201) 15.4 (17.4) 34.7 0.0001 NSCHGT 30.19 (9.60) 37.55 (11.81) 10.2 0.0020 %NSGCOV 87.7 (27.6) 95.2 (22.8) 11.9 0.0009 %NSHCOV 5.0 (4.6) 4.7 (5.5) 0.1 0.7757 %NSTGCOV 96.0 (26.3) 99.6 (17.5) 16.6 0.0001 NSHGT 24.02 (8.37) 33.97 (10.83) 23.1 0.0001 NSHITO·I0 5.98 (2.92) 11.30 (5.22) 34.5 0.0001 NSTOTHIT 20.11 (10.57) 45.50 (26.89) 33.9 0.0001
Patch site
%NPGCOV 83.1 (24.6) 90.4 (25.4) 7.5 0.0077 %NPHCOV 8.6 (7.4) 7.7(6.2) 0.3 0.5590 %NPTGCOV 95.2 (28.8) 98.3 (22.5) 4.9 0.0289 NPHGT 20.02 (7.18) 31.21 (9.44) 38.8 0.0001 NPHITO·I0 5.16 (2.03) 9.61 (3.71) 48.5 0.0001 NPTOTHIT 15.82 (7.89) 37.11 (19.56) 44.7 0.0001 HFDIO 6.17 (2.74) 5.62 (2.15) 1.1 0.2953 VFD10 4.95 (0.73) 5.74 (0.66) 28.1 0.0001 CVHGT 0.56 (0.21) 0.40 (0.16) 17.5 0.0001 CVTOTHIT 0.50 (0.23) 0.46 (0.19) 0.9 0.3472
84
Univers
ity of
Cap
e Tow
n

Table 3. Means (±SD) of nest-site and nest-patch characteristics of successful and
depredated Grassveld Pipit nests and the univariate (ANOV A) of differences in the means.
Where appropriate, data were arcsine transformed before statistical analysis.
Variables Depredated Successful F P
Nest site
DETECT 53.2 (25.0) 16.6 (14.1) 82.7 0.0001 NSCHGT 20.67 (lLll) 26.43 (9.42) 7.2 0.0087 %NSGCOV 77.6 (20.8) 88.1 (29.1) 13.1 0.0005 %NSHCOV 6.5 (8.2) 0.050 (0.071) 0.9 0.3533 %NSTGCOV 88.2 (21.8) 95.4 (25.4) 13.7 0.0004 NSHGT 13.80 (5.95) 22.60 (10.11) 27.4 0.0001 NSHITO-I0 3.58 (0.97) 8.10 (5.03) 39.5 0.0001 NSTOTHIT 10.00 (3.92) 28.38 (21.72) 35.2 0.0001
Nest patch
%NPGCOV 79.3 (20.2) 86.6 (26.6) 7.3 0.0082 %NPHCOV 7.1 (5.5) 8.l (7.9) 0.5 0.4789 %NPTGVCOV 89.5 (22.8) 96.2 (27.2) 12.6 0.0006 NPHGT 12.10 (5.29) 26.86 (34.29) 9.2 0.0031 NPHITO-1O 3.27 (1.03) 7.03 (4.56) 32.8 0.0001 NPTOTHIT 8.49 (3.47) 25.06 (22.11) 27.9 0.0001 HFD10 7.83 (2.51) 7.67 (2.45) 0.1 0.7649 VFDlO 4.15 (0.73) 5.14 (1.01) 30.0 0.0001 CVHGT 0.65 (0.15) 0.66 (0.56) 0.0 0.9453 CVTOTHIT 0.65 (0.22) 0.63 (0.22) 0.3 0.5651
85
Univers
ity of
Cap
e Tow
n

Table 4. Means (±SD) of habitat characteristics that are important in discriminating between
successful and depredated nests of Yellow-breasted Pipits, Univariate (ANOY A) of differences in
the means and results of stepwise discriminant function analysis are given. Yariables are given in
the order in which they were entered in the model.
Univariate analysis Discriminant analYsis
Variable Successful Depredated F P Wilk's Structure Standard P (75) (45) lambda coefficient coefficient
DETEC (%) 0.448 (18.4) 15.4 (13.7) 112.0 0.0001 0.802 -0.891 -0.898 0.0001 CVHGT 0.60 (0.16) 0.46 (0.13) 28.3 0.0001 0.501 -0.440 -0.373 0.0030 %NSHCOV 4.7 (5.4) 6.8 (8.0) 2.4 0.1238 0.482 0.132 0.268 0.0358
Eigenvalue 1.157 Correctly 88.0% 74.5% classified Z=6.6***
86
Univers
ity of
Cap
e Tow
n

Table 5. Means (±SD) of habitat characteristics that are important in discriminating
between successful and depredated nests of Orange-throated Longclaws, Univariate
(ANOV A) of differences in the means and results of stepwise discriminant function
analysis are given. Variables are given in the order in which they were entered in the
model.
87
Univers
ity of
Cap
e Tow
n

Table 6. Means (±SD) of habitat characteristics that are important in discriminating
between successful vs. depredated nests of Grassveld Pipits, Univariate (ANOY A) of
differences in the means and results of stepwise discriminant function analysis are given.
Yariables are given in the order in which they were entered in the model.
Univariate analysis Discriminant analysis Variables Successful Depredated F P Wilk's Structure Standard
(43) (51) lambda coefficient coefficient
DETECT 53.2 (25.0) 16.6 (14.1) 82.7 0.0001 0.629 -0.805 -0.877 NSHITO-10 3.58 (0.97) 8.10 (5.03) 39.5 0.0001 0.415 0.535 1.071 %NPTGVCOV 89.5 (22.8) 96.2 (27.2) 12.6 0.0006 0.412 0.313 0.194 NSCHGT 20.67 (ILl 1) 26.43 (9.42) 7.2 0.0087 0.448 0.247 -0.805 NSHGT 13.80 (5.95) 22.60 (10.11) 27.4 0.0001 0.443 0.449 1.009 NSTOTHIT 10.00 (3.92) 28.38 (21.72) 35.2 0.0001 0.414 0.507 -1.171
Eigenvalue 1.474 Correctly 81.4% 92.2% classified Z = 7.1***
88
P
0.0001 0.1364 0.2036 0.0035 0.0058 0.1551
Univers
ity of
Cap
e Tow
n

DISCUSSION
The likelihood of nest predation clearly depends upon the vegetation characteristics in the
immediate vicinity of the nest as well as the vegetation surrounding the nest at the scale as
large or larger than the nest patch. This emphasizes the need to consider both nest-site and
nest-patch characteristics in studies of nest predation (e.g. see Martin and Roper 1988,
Norment 1993). In general, variables that are important in discriminating between
successful and depredated nests across all species were directly related to vegetation cover,
density and horizontal heterogeneity. Successful nests across all species were placed in
denser foliage with thicker cover than depredated nests. Mean horizontal vegetation
heterogeneity (the magnitude of spatial variation in vegetation) tended to be higher for
depredated nests across species, suggesting that more uniform distribution of the vegetation
interfered with the ability of predators to locate nests.
Nest concealment hypothesis: nest-site effects
Poorly concealed nests were more likely to be depredated than well concealed nests,
suggesting that most predators find nests by actively searching for them. Detectability
index (or degree of concealment) entered into all models discriminating between successful
and depredated nests and pointed to the universal importance of nest concealment at the
immediate vicinity of the nest in reducing predation risk. Increased nest concealment would
be expected to reduce predation risk from diurnal predators that use visual cues to locate
nests. Suricates Suricata suricatta and Yellow Mongoose Cynictis penicillata which are
common in our study, are diurnal and rely on sight to find nests. Other visual oriented
predators that I observed in my study area include birds like Fiscal Shrike Lanius col/aris,
Stanley'S Bustard Neolis denhami, and Red-chested Sparrow Hawk Accipiter rufiventris
and snakes like Rinkhals Hemachatus haemachatus, Rhombic Skaapsteker, Psammophylax
rhombeatus, Brown House Snake Lamprophis juliginosu, and Short-snouted Grass Snake
Psammophis brevirostris among others. Thus, increased concealment may decrease the
ability of these predators to locate nests. The importance of nest concealment by foliage in
reducing the probability of nest predation has been demonstrated in other studies (e.g.
Keppie and Herzog 1978, Westmoreland and Best 1985, Martin and Roper 1988; but see
Best and Stauffer 1980).
89
Univers
ity of
Cap
e Tow
n

Total-foliage hypothesis: nest-patch effects
Characteristics of the surrounding vegetation within 10 m of the nest had a clear effect on
the probability of nest survival with dense foliage in the nest patch reducing nest predation.
Greater foliage density in the nest patch may impede both random and intentional nest
discovery by concealing nests, inhibiting predator search, or hindering nest discovery
through inhibiting transmission of chemical, visual and auditory cues. Dense and
homogenous vegetation surrounding the nest may reduce predation rates of the nests by
providing increased number of potential nest sites to be searched which reduces nest
detection by predators actively searching the vegetation for nests (e.g., see Martin 1988c,
Martin and Roper 1988, Knopf and Sedgwick 1992). This in turn reduces predator search
efficiency by increasing the time and effort of searches. Low horizontal heterogeneity of
habitat neighbouring the nest may also prevent common predators from developing search
images for nests. Dense foliage at the nest patch can reduce risk of predation by concealing
parental movement and activity from predators. This can result in reduced nest detectability
and vulnerability to predation by predators that use parental movements to locate nests.
Dense and complex vegetation in the nest patch may thus reduce predator search efficiency
even for poorly concealed nests. of bird nests that rely on visual cues to detect. In addition,
predators themselves may avoid habitats with thick vegetation altogether to avoid been
eaten by their own predators. The support of the hypothesis that total foliage density (total
vegetation) in the nest patch influences predation probability has also been documented in
both terrestrial (e.g. see Bowman and Harris 1980, Martin and Roper 1988, Norment 1993)
and aquatic systems (see Crowder and Cooper 1982). Taken together, my results add
support to the idea that although ignored in most studies of nest predation, habitat patch
characteristics may be as important as nest site characteristics in influencing fitness, and
both need to be considered in nest-predation studies.
Although the nest concealment hypothesis and the total foliage hypothesis are taken
as two separate hypotheses, the two are not mutually exclusive; rather their negative effects
on fitness are additive. They should be viewed as a single hypothesis because they both test
the effect of the degree of nest concealment on predation risk and they do not make any
mutually exclusive predictions regarding the outcomes of breeding events. Because nest
disturbance associated with our visit to nests does not affect predation risk I am confident
in believing that variables under examination affected nest predation rates of grassland
birds (see Appended Chapter A).
90
Univers
ity of
Cap
e Tow
n

In conclusion, this study suggests that nest-site selection at both nest-site and nest
patch scales have consequences for individual fitness. Although several factors can
potentially act as selective forces in shaping avian habitat preferences (e.g. Holmes et al.
1986), nest predation risk can strongly influence nest-site selection (Greig-Smith 1980,
Marzluff 1988, Morton et ai. 1993, Martin 1996a, Sieving and Wilson 1998). Traditionally,
habitat has been thought to influence nest survival only at the fine scale of the nest site and
nest sites are accordingly considered to be abundant (Ricklefs 1969, Lack 1971). Now that
data are available to suggest that habitat parameters also affect fitness at a broader scale,
high-quality nest sites may not be as abundant as traditionally presumed (Martin and Roper
1988).
91
Univers
ity of
Cap
e Tow
n

92
Univers
ity of
Cap
e Tow
n

The role of fire frequency in influencing patterns of parental care, nestling growth
and body condition of grassland birds
Abstract
I obtained an index of food abundance and conducted field experiments to compare food
provisioning, nestling growth, body condition, nest attentiveness and time spent brooding
at two management-mediated grassland habitat types. The two grassland types, which
differed in their burning frequency, were lightly grazed and annually burned and lightly
grazed and biennially burned. Three ecologically similar grassland species of the family
Motacillidae bred on the study area: Yellow-breasted Pipit Hemimacronyx chloris,
Grassveld Pipit Anthus cinamomerous, and Orange-throated Longclaw Macrony capensis.
Although food abundance differed significantly between the two management habitat
types, my study yielded no evidence for an effect of management-mediated food abundance
on feeding rate, nestling provisioning rates, nestling growth rates, body condition, nest
attentiveness or time spent brooding. This suggested that food availability alone may not be
the most important factor influencing the production of offspring.
INTRODUCTION
Availability of food is often considered to be the most important factor influencing the
production of offspring and variation in life history traits of birds (Lack 1968, Roff 1992,
Martin 1987; but see Ricklefs 1969, Martin 1995a). Nestling growth and survival are
particularly sensitive to variation in food supply in several bird species (e.g. Perrins 1965,
von Bromssen and Jansson 1980, Prince and Ricketts 1981, Quinney 1982, Ricklefs et al.
1984, Holthuijzen 1990, Magrath 1990, Wiggins 1990, Rondenhouse and Holmes 1992).
Low food availability can considerably constrain the amount of food delivered to
nestlings (e.g. see Harris 1969, Quinney 1982). Increases in parental food provisioning
rates can cause increases in nestling growth and body condition. Thus, we might expect
growth and body condition of nestlings raised in sites where food is most abundant to be
superior to those raised in sites where food is less abundant. If parents increase foraging
effort to compensate for the low food supply then they are expected to impair their own
93
Univers
ity of
Cap
e Tow
n

health, especially among small passerines that cannot store much body fat (Garnet 1981).
Reproduction is energetically expensive and may deplete the reserves of the parent (Roff
1992). Parent birds nesting and rearing young in areas of low food availability can also thus
be expected to be of poorer body condition than those nesting and rearing young at sites
where food is more abundant. As incubation places high energy demands on adults (Ruiz et
al. 2000), the quality of foraging areas in the vicinity of the nests should be important
during the incubation period as well. Indeed, food supply can influence schedules of
parental care (Weathers and Sullivan 1989). If food is abundant, parent may forage for
shorter periods and spend more time attending to the nest (nest attentiveness and brooding).
In this paper, I first test whether food abundance varies in relation to fire frequency.
Second, I test whether differences in food abundance affect: (a) food provisioning rates, (b)
nest attentiveness, (c) time spent brooding, (d) nestling growth rates and (e) nestling and
adult body condition. I present data for three ground-nesting grassland bird species, the
Yellow-breasted Pipit Hemimacronyx chloris, Grassveld Pipit A nth us cinamomerous, and
Orange-throated Longclaw Macrony capensis, which breed in the high altitude grasslands
ofWakkerstroom, South Africa.
METHODS
The study was conducted in the high altitude grasslands of Wakkerstroom (centred at 270
10' S, 300 06' E), Mpumalanga province, South Africa during the summers of 1998 to
2001. Six study plots were laid out in each of the two management systems, viz. lightly
grazed and annually burned (L+A) and lightly grazed and biennially burned (L+B). These
plots were separated from adjacent ones by at least 500m wide strips and measured
approximately 25 ha each in size. Vegetation differences were measured for each grassland
habitat type following techniques modified from Wiens and Rotenburry (1981) (See
chapter 2 for details). Nests were searched over three breeding seasons from 1998 to 2001.
Searching and locating of nests was done by rope dragging to flush birds out from their
nests, or based on behavioural observation. Rainfall data were recorded from five rain
gauges spread widely over the study area. All areas received equal amounts of rain.
94
Univers
ity of
Cap
e Tow
n

Measurements of arthropod abundance (food availability)
Arthropods were sampled along three transects (each 500 m long) located at 100m, 250m
and 400m from the edge of each study plot fence and running perpendicular to each plot
fence. Monthly arthropod abundance was estimated over the entire breeding season
(October to April the following year) from 1998 to 200 I. Using sweep nets, 600 sweeps per
plot (200 at each of the three transects) were done during each monthly food survey. Sweep
nets have been shown to be superior to other sampling techniques in terms of measuring
overall arthropod abundance in grasslands and are efficient in catching most of the prey
groups eaten by the Motacillidae (Brodmann and Reyer 1999).
Food provisioning and parental care
Video cameras were used to record food provisioning patterns (number and size of food
item brought and food delivery to nest), nest attentiveness and brooding by parents. Birds
were video-taped during their incubation and nestling stages in 200 1. Sony camcorders
with 360x Digital zoom lenses were set up on tripods as low as possible at a distance of 3 -
5 m from nests. All camcorders were placed in a well camouflaged hide. During the
incubation stage, video recording were made on any day after the confirmed day of clutch
completion. During the nestling period, all video recordings were made when the nestling
were 9-10 days old, or one or two days after primary feathers broke their sheaths. No nests
were sampled more than once per nesting stage. Video recording was restricted to nests
containing a clutch or brood size of three, this being the mean and modal size for all three
species in my study area. Each videotaping season lasted six hours beginning at 07hOO and
ending at 13hOO. From each videotape, I recorded the frequency of feeding trips to the nest
by both parents and where possible the number, size and type (order) of food item
delivered during each feeding trip. Prey size was determined by comparing the length of
the prey item (or the prey load when there was more than one item that could not be
distinguished) with the size of the parent's bill (mean bill length = 17 mm for GP and YBP,
21 mm for OTL). I also scored the volume of prey items by comparing the volume of the
item to the volume of the parent's bill, using five classes: 0.5, 1, 1.5, 2, 2.5, 3, 3.5, and 4
bill-equivalents. Provisioning rate was expressed as total bill-equivalents of food received
per hour. From each videotape, I also measured the time that parents spent incubating eggs
and brooding nestling, as well as the number of off bouts (time away from the nest) per
hour. Duration of attentiveness (incubation) and brooding during each visit were
95
Univers
ity of
Cap
e Tow
n

determined by subtracting departure time from arrival time for each incubating or brooding
visit respectively. The number of feeding trips to the nest by both parents per hour, prey
mass delivered per hour, nest attentiveness per hour and brooding time per hour were
averaged over the six hours for each nest. This was then averaged across nests in order to
obtain mean values for each species. At least six video samples (mean = 11 nests per
species during incubation, and 23 nests per species during the nestling stage) were
collected per species (Yellow-breasted Pipit, Orange-throated Longclaw, and Grassveld
Pipit) in each of the two grassland management systems (Le. L+A and L+B). A total of203
nests were sampled in this way.
Measurements of nestling growth rates and body condition
Measurements of weight and tarsus length were taken every second day after hatching, up
to the tenth day of the 14-day nestling period (day of hatch = day 0). I did not take
measurements after day 10, as nestlings may fledge prematurely if handled after that age.
Nestlings were individually marked (with a tiny mark) on different parts of the body
(tarsus, belly and tibia) with a non-toxic marker. All nestlings were weighed during the
morning hours using a 60-g Pesola spring balance (accuracy of 0.1 gram). The length of the
right tarsus was measured by a single observer from the full joint to the bent toes with a
sliding calliper to the nearest 0.1 mm. Potential differences in nestling growth in relation to
fire frequency were assessed by comparing the mean body mass of nestlings at Day eight,
and overall growth rate across species. To estimate growth curves, I fitted logistic curves to
the mass data of day 0 to day 10 as described by Ricklefs (1967). From these curves, the
rate of gain in nestling body mass between day 2 and day 10 was calculated according to
Ricklefs (1967). This included the time to grow from 10% to 90% of asymptotic mass
(maximum mass).
Nestling mass and tarsus length was used to measure nestling body condition at Day
eight using the residual body mass according to Hochachka and Smith (1991). Body mass
and structural size measurements (tarsus and wing length) were taken for 110 adults.
Residuals from a Model I regression of body mass on tarsus length (and wing length for
adults) were used as an index of condition (Ots et al. 1998).
96
Univers
ity of
Cap
e Tow
n

DATA ANALYSIS
Data for both the number of feeding trips per hour, load sizes and food volume delivered
per hour were normalised by square root transformation. All within-year comparisons were
conducted using Mann-Whitney U tests using one-tailed probabilities at the 0.05 level of
significance. Differences in parental feeding rates, load sizes, provisioning rates, nest
attentiveness and time spent brooding in grassland under varying fire frequencies were
tested using a paired t-test across the three species. Intraspecific comparisons of nestling
mass and tarsus length at eight days of age were made using a paired t-test (Sokal and Rolf
1995).
RESULTS
A range of arthropods were collected in the sweep nets, viz. Coleoptera (beetles), Diptera
(fry), Saltatoria (grasshopper and crickets), Hymenoptera (wasps and bees), Heteroptera,
Menoptera (ants), Odonata (dragonflies), Arachnida (spiders) and Lepidoptera (caterpillar
larvae). Relative food abundance in both fire regimes treatments were similar among years
(Mann-Whitney U test, P> 0.05 in both cases). Consequently, data were pooled during
subsequent analyses. Mean arthropod abundance was significantly greater under annual
(33.9 ± 19.8 g) than under biennial burning (16.9 ± 9.6 g) (Mann-Whitney U test, U =
441.5, df = 86, P < 0.0001) (Figure 1). The study species are fairly generalised in their diet
on the breeding ground, based on the wide variety of arthropods taken during normal
foraging (Keith et at. 1992) and collar samples of nestling and video monitoring on food
provisioning (this Chapter). All arthropods sampled were included in the food abundance
estimates.
Food delivery rates did not vary in relation to fire frequency (7.04 ± 0.13 hr'! versus
6.30 ± 0.24 hr- I, Paired t-test, P > 0.05) (Fig. 2). Similarly, there were no differences in
mean provisioning rate hour-! (volume of food delivered hr-!) between annually and
biennially burned grasslands (15.17 ± 0.04 bill-equivalents hr- t versus 13.66 ± 0.37 bill
equivalents hr-t, Paired t-test, P> 0.05) (Fig. 3).
Mean nestling mass at 8 days of age did not vary with fire frequency for all three
species (25.0 ± 8.9 g versus 23.7 ± 6.9 g) (Paired t-test, P > 0.05). The rate of gain in
nestlings body mass between day 2 and day 10, which included the time to grow from 10%
97
Univers
ity of
Cap
e Tow
n

to 90% of asymptotic mass (maximum mass), similarly did not vary with fire frequency
(Fig. 4-6).
There were no differences in both adult and nestling body condition between
annually and biennially burned grasslands across all three species (mean weight:::::: 30.4 g,
tarsus length = 31.0 mm, wing length;; 88.4 mm, residual = 0.00, versus mean weight :::;
33.0 g, tarsus length 32.7 mm, wing length 91.8 mm, residual = 0.00, Paired t-test, P >
0.05).
The number of trips from the nest per hour during incubation period, the mean time
spent incubating the eggs per hour, and mean time spent brooding the nestling per hour did
not vary in relation to fire frequency either (Paired t-test, P> 0.05 in all cases). This was the
case for all three species in question (Fig. 7-9).
98
Univers
ity of
Cap
e Tow
n

o L+A L+ B
Grassland type
Figure 1. Mean (± SD) arthropod abundance in lightly grazed and annually burned (L+A)
and lightly grazed and biennially burned (L+B) grasslands. During each breeding season
from 1998 through 200 I, 600 sweeps were made monthly with a sweep net in each of the
six 500 m2 study plots. Mean arthropod food abundance was significantly greater in L+A
grassland than in L+B grassland (Mann-Whitney Utest, U= 441.5, df= 86, P< 0.0001),
99
Univers
ity of
Cap
e Tow
n
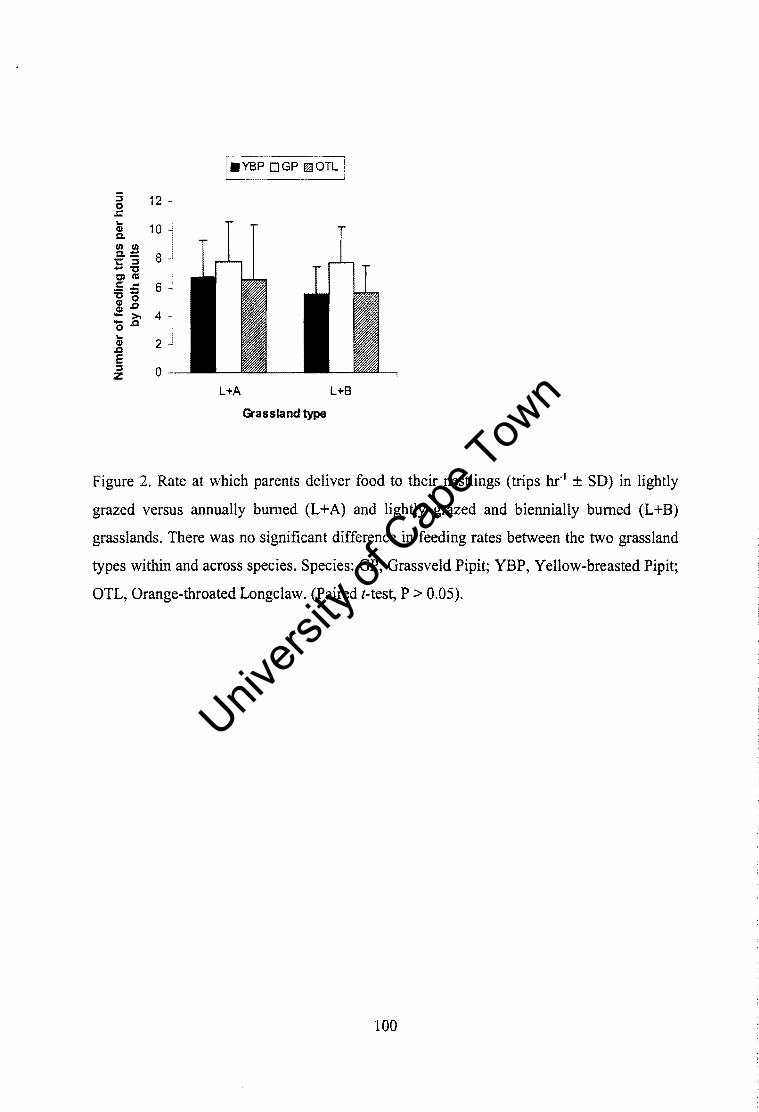
~ 12 I ... ~ 10 UI UI
.@" ~ 8 -" O)ClS
.5..c: 6 ,,<II 0 <II.e
:: ~ 4 o ... <II .e E = z
2
o L+A L+B
Grassland type
Figure 2. Rate at which parents deliver food to their nestlings (trips hr-] ± SD) in lightly
grazed versus annually burned (L+A) and lightly grazed and biennially burned (L+B)
grasslands. There was no significant difference in feeding rates between the two grassland
types within and across species. Species: GP, Grassveld Pipit; YBP, Yellow-breasted Pipit;
OTL, Orange-throated Longclaw. (Paired t-test, P > 0.05).
100
Univers
ity of
Cap
e Tow
n

25 :a == 1:' 20 :::I :::I "C 0 11:1'::: -o.. QI QI 15 m C-o.. _
C)C
C ~ 10 - CG C > 0-.- :::I jz tr 5 > QI e a.
o
I_YEP OGP !?lIOTL I
L+A L+B
Grassland type
Figure 3. Provisioning rates (volume of food measured as adult bill-equivalents hr-l ± SD)
by parents to their nestlings in lightly grazed and annually burned (L+A) versus lightly
grazed and biennially burned (L+B) grasslands. There was no significant difference in
provisioning rates between the two management systems within and across species.
Species: OP, Grassveld Pipit; YBP, Yellow-breasted Pipit; OTL, Orange-throated
Longclaw. (Paired t-test, P > 0.05). (Paired t-test, P > 0.05).
101
Univers
ity of
Cap
e Tow
n

1.0 IJ1 I-
.2 u ro 0.5 lJ... c:
,Q
~ <I.l > c: 0 U u ;p IJ1 '00 0
....J
L+A ·1.0 x L+B
0 2 4 6 8 10 12 Age, days
Figure 4. Converted growth curves of the Yellow-breasted pipit in annually (L+A) versus
biennially burned (L+B) grassland. The rate of gain (slope of the two lines) in nestling
body mass between Day 2 and Day 10, which included the time to grow from 10% to 90%
of asymptotic mass (maximum mass) were not significantly different between L+A (slope
= 0.1 129/day, K = 0.452) and L+B (slope = 0.1048/day, K = 0.419) management systems.
Ricklefs 1967 graphical method.
102
Univers
ity of
Cap
e Tow
n

({) 0.5 ...
.9 u ro u.. c:
.Q 0.0 ({) ...
(i) > c: 0 ()
u :p ({)
·60 0
...J
L+A ·1.0 x L+B
0 2 4 6 8 10 12 Age, days
Figure 5. Converted growth curves of the Grassveld Pipit in annually (L+A) versus
biennially burned (L+B) grassland. The rate of gain (slope of the two curves) in nestling
body mass between Day 2 and Day 10, which included the time to grow from 10% to 90%
of asymptotic mass (maximum mass) were not significantly different between L+A (slope
::;:: 0.1250/day, K = 0.500) and L+B (slope::;:: 0.1210/day, K = 0.484) management systems.
Ricklefs 1967 graphical method.
103
Univers
ity of
Cap
e Tow
n

~ .9 ()
1.0
~ 0.5 c
.Q ~ Q)
f: 0.0 o U
/~/
//
,/:/ //// x
/ /,/F
.1.0 '--_.L--_...l--_--L-_-'-_......I-_.-...l
o 2 4 6 8 10 12 Age, days
L+A x L+B
Figure 6. Converted growth curves of the Orange-throated Longclaw in annually (L+A)
versus biennially burned (L+B) grassland. The rate of gain (slope of the two curves) in
nestling body mass between Day 2 and Day 10, which included the time to grow from 10%
to 90% of asymptotic mass (maximum mass) were not significantly different between L+A
(slope::: O.l472/day, K = 0.589) and L+B (slope = O.l210/day, K = 0.484) management
systems. Ricklefs 1967 graphical method.
lO4
Univers
ity of
Cap
e Tow
n
[ 2.5 1/1 '51/12 ~3 c"C o 10 :;;.c 1.5 ~o :::l.c u >.= .c - ... o :::l ... 0 0 QI.c .5 .c E i 0
L+A L+8
Grassland type
Figure 7. Number of incubation bouts by both adults (trips hr- l ± SD) in lightly grazed
versus annually burned (L+A) and lightly grazed and biennially burned (L+B) grasslands.
There was no significant difference in number of in bouts between the two grassland types
within and acrosS species. Species: GP, Grassveld Pipit; YBP, Yellow-breasted Pipit; OTL,
Orange-throated Longclaw. (Paired t-test, P > 0.05).
105
Univers
ity of
Cap
e Tow
n

c s:. 60 o ... :;:;;,g co >0 50 -g.c g 5 40 =,g0 o ... .: 30 C G) :::I o a. "Q ;; .......... lU
e.5 20 -6.5.
10
o
.YBP DGP mOTl I
l+A l+B
Grassland type
Figure 8. Mean duration of incubation bouts by both adults (min hr-1 ± SD) in lightly
grazed and annually burned (L+A) versus lightly grazed and biennially burned (L+B)
grasslands. There was no significant difference in mean duration of incubation bouts
between the two grassland types within and across species. Species: GP, Grassveld Pipit;
YBP, Yellow-breasted Pipit; OTL, Orange-throated Longclaw. (Paired t-test, P > 0.05).
106
Univers
ity of
Cap
e Tow
n

30 -, - ' C QI C1. 25 flI_
~ ~ 20 .... -III E C1._ - C7) 15 III c J: ._
-" QI 0 10 E 0 .- ... -.0 C III QI :E
L+A L+8
Grassland type
Figure 9. Mean time spent brooding nestlings by parent birds (min hr'l ± SD) in lightly
grazed and annually burned (L+A) versus lightly grazed and biennially burned (L+B)
grasslands. There was no difference in mean brooding time between the two management
systems within and across species. Species: GP, Grassveld Pipit; YBP, Yellow-breasted
Pipit; OTL, Orange-throated Longclaw. (Paired (-test, P > 0.05).
107
Univers
ity of
Cap
e Tow
n

DISCUSSION
Relative abundance of prey
Both vegetation characteristics (density, cover and heterogeneity) and abundance of
arthropod food available to breeding birds differed between annually burned and biennially
burned grasslands, suggesting that vegetation characteristics can index food availability
(also see Martin 1988b). The study species appear to be fairly generalised in diet on the
breeding ground, based on the wide variety of arthropods taken during normal foraging
(Keith et al. 1992) and collar samples of nestling and video monitoring on food
provisioning. Based on video images of food brought to nestlings and collar samples of
nestling, there was excellent correspondence between the taxa or arthropods collected in
the sweep nets and those delivered by parents to their nestlings. Thus, all arthropod
sampled were justifiably considered to be potential prey.
Food provisioning, nestling growth rates and body condition between grassland types
Prey density is typically believed to positively affect foraging success of grassland birds
(Brodmann et al. 1977), and thus food delivery rates to nestling. Feeding conditions of
nestlings during the growth stage have been shown to have a significant effect on both the
growth and final size attained (Ricklefs and Peters 1981). Although food abundance was
significantly higher in annually burnt compared to biennially burnt grasslands, this study
yielded no evidence for an effect of food abundance on feeding rates, provisioning rates, or
nestling growth. These results may be explained in several ways. First, prey density may
not affect feeding conditions of nestlings and/or targeted growth (e.g. see Wiggins 1990),
suggesting that growth rate and body size are heritable (e.g. see Schluter and Smith 1986).
Alternatively, parents do not feed their nestlings with more than the required amount of
food. Second, nestlings in grassland with low food resources may be able to compensate
for poor feeding condition through higher food conversion efficiency or other
compensatory mechanisms. Adults may have adjusted their feeding behaviour with respect
to choice of food provided to nestlings. For example, although nestlings in both grassland
types were mainly fed with grasshoppers, caterpillars (larval arthropods), prey was
delivered at a relatively higher frequency in annually than biennially burned grasslands.
Caterpillars may be more accessible in biennially burned grasslands. Although
compensatory growth in wild birds is still poorly understood, studies of growth in domestic
chickens have shown that under laboratory conditions, birds may compensate for periods of
108
Univers
ity of
Cap
e Tow
n

under-nutrition by accelerating growth at a later stage (Wilson Osbourn 1960). Third,
parents nesting in biennially burned grasslands may be of higher quality in terms of body
condition and parenting performance than those nesting in annually burned grassland. Such
parents would be able to effectively search and provide nestlings with enough food even
when food is scarce, and to utilise their body reserves thus masking any possible
deterioration of their condition. Birds might have better concealment under biennial
burning (Chapter 5). Thus, although food may be scarcer in biennially burned grasslands,
they might be better concealed from predators. However, if parents increase foraging
distance to compensate for scarcity of food, long distances to feeding areas would,
however, increase the risk of nest predation as nests are left unattended for longer periods
of time. Other studies have also failed to detect effects of food availability on food
provisioning and growth rates (e.g. Omland 1994, Wiggins 1990).
N est attentiveness and brooding
The lack of an overall difference in mean time spent incubating and brooding between
annually burned and biennially burned grasslands suggest that the duration of incubation
bouts and time spent brooding are not sensitive to food abundance.
Conclusion
Food availability alone may not be the major evolutionary driver of life history variation
among bird species suggesting the need to consider other possible alternatives such as nest
predation. Indeed, management practice-mediated reproductive dysfunction via nest
predation could be a more important factor than food availability in influencing for
example provisioning rates (by constraining the rate at which parent birds visit nests to feed
their young), which in turn can influence growth and health state of the nestling and life
history traits such as clutch size. In addition, higher nest predation rates are associated with
a shorter nesting cycle (Martin 1995a), and thus higher nestling growth rates.
109
Univers
ity of
Cap
e Tow
n

110
Univers
ity of
Cap
e Tow
n

Nest predation of grassland bird species increases with parental activity at nest
Abstract
Alexander Skutch predicted that nest predation will increase with activity at nests, and that
predation should be greatest during the nestling stage when parents are feeding young. I
tested this hypothesis using three ecologically similar grassland bird species nesting on the
high altitude grasslands of Wakkerstroom, South Africa. Parental activity, measured as
adult arrival and departure frequency from the nest, was greater during the nestling than
incubation stage. Nest predation, however, did not increase with parental activity between
these stages in all three study species. However, nest-site effects could have confounded
this result. I therefore conducted an experiment that controlled for parental activity (by
reusing natural nests of the study species with artificial clutches) in order to test for nest
site effects. Nests that had a high risk of predation when used by active parents had a
correspondingly high risk of depredation when the same nests were reused with artificial
clutches (i.e. after controlling for parental activity). This result supports the notion that
variation in nest-site quality is the primary factor affecting nest predation risk. I also tested
whether high predation during incubation is related to nest-site effects. Nest predation rates
of experimental clutches placed in nests that were depredated during incubation when
active parents were present were significantly higher than those depredated during the
nestling stage when active parents were present. However, once nest-site effects were
accounted for, nest predation showed a positive increase with parental activity during the
nestling stage both within and across species.
INTRODUCTION
Nest predation is the main cause of nest failure in many passerine birds (Ricklefs 1969,
Lima, 1987, Martin and Clobert 1996, Chapter 2). Despite the fact that clutch size is one of
the traits showing close adjustments to local conditions (Lack 1968), the proximate
underlying mechanism by which clutch size is adjusted remains poorly understood. The
evolution of clutch size has long been attributed to food (Lack 1948, Charnov and Krebs
1974) or to nest predation (Slagsvold 1982, Martin 1995a, Julliard et al. 1997, Martin et al.
111
Univers
ity of
Cap
e Tow
n

2000a). Skutch (1949) hypothesized that increased parental activity can proximately
increase the risk of nest predation which constrains the rate at which parent birds can
deliver food to young. This in turn constrains clutch size through the limited number of
young that parents can feed. Skutch's hypothesis predicts that if activity at nests is
positively correlated with risk of predation, then nest predation should be higher during
times of greater activity. This hypothesis and the positive proximate response has only
received partial support (e.g. see Martin et al. 2000b; but see Roper and Goldstein 1997).
Although there is some evidence that species at higher risk of nest predation show lower
parental activity (Martin 1996b, Martin and Ghalambor 1999, Conway and Martin 2000),
this hypothesis has not been tested widely. However, in order to test this hypothesis, one
must first show the positive proximate relationship between parental activity and nest
predation.
Nest-site effects may confound the relative importance of parental activity in
influencing nest predation rates. Birds may also modify their behaviour to compensate for
the risk of nest predation caused by nest-site effects (Maller 1989, Cresswell 1997). Three
alternatives are possible: (1) parental presence and activity have no effect and nest-site
characteristics influences nest predation risk; (2) nest sites have no effect and parental
presence and activity influences nest predation; and (3) nest-site characteristics, parental
presence and activity balance each other in influencing nest predation so that there will be
no observable change in the risk of predation with variation in activity between stages.
In this chapter, I test these alternatives using three ecologically similar species
breeding in Wakkerstroom high altitude grasslands, South Africa. First, I investigate
whether predation rates generally increase with activity between stages by comparing
parental activity and nest predation rates during the incubation and nestling stages. Second,
I conduct an experiment that excludes parental activity in order to isolate nest-site effects.
Finally, I examine whether predation increases proximately with parental activity once nest
site effects are removed.
STUDY AREA AND METHODS
The study was conducted in the high altitude grasslands ofWakkerstroom, South Africa at
1800-2200 m a.s.1. from 1998-2001. Here grasslands are managed in three different ways,
viz. heavily grazed and annually burned (H+A), lightly grazed and annually burned (L+A),
and lightly grazed and biennially burned (L+B). Vegetation varies considerably across
112
Univers
ity of
Cap
e Tow
n

management regimes with respect to floristics, vegetation cover, density, and structural
heterogeneity (Chapter 3). Most birds did not breed in patches that were both heavily
grazed and annually burned.
I examined parental activity and nest predation rates for three ecologically similar
grassland species of the family Motacillidae breeding in the study area: YeHow-breasted
Pipit Hemimacronyx chloris (YBP), Grassveld Pipit Anthus cinamomerous (GP), and
Orange-throated Longclaw Macrony capensis (OTL).
Nests were located in three consecutive breeding seasons between 1998 and 2001.
Searching and locating of nests was done by dragging a 50m rope between two people to
flush out birds from nests, or based on behavioural observation. Nests were marked (for
relocation) with a stick or stone placed 10m away from each nest. Nests were visited at
one to five days (1-5day) intervals to determine the nest fate (successful or failed) until the
nesting process terminated. A serious effort was made to minimize disturbance of breeding
birds and their nests. To this end, gloves were used while handling nests and their contents.
Human observer visitations to the nests did not affect nest predation rates in my study (see
Appended Chapter A). Nests were considered successful if one or more young fledged after
no losses to predators, and depredated if the nest failed completely due to predation (i.e. if
eggs or nestlings younger than fledging age disappeared from the nest with definitive
evidence of depredation).
For the purpose of analysis of daily survival rates, I only used nests that were
confirmed as either successfully fledged or were confirmed lost to predators. These
included: GP (L+A = 159 nests; L+B = 75 nests), YBP (L+A = 116 nests; L+B = 55 nests),
and OTL (L+A = 82 nests; L+B = 58 nests). Daily nest predation rates were calculated
using the Mayfield method (Mayfield 1961, 1975). Standard errors for Mayfield's daily
predation probabilities were calculated as described by Hensler and Nichols (1981) and
Johnson (1979). I separately analyzed nest survival rates for the incubation and nestling
period.
Sony camcorders with 360x Digital zoom lenses were set up on tripods as low as
possible at a distance of 3 - 5 m from nests to record parental activity during their
incubation and nestling stages. All camcorders were placed in a well camouflaged hide.
During the incubation stage, video recording were made on any day after the confirmed day
of clutch completion. During the nestling period, all video recordings were made when the
nestling were 9-10 days old, or one or two days after primary feathers broke their sheaths.
113
Univers
ity of
Cap
e Tow
n

No nests were sampled more than once per nesting stage. Video recording was restricted to
nests containing a clutch or brood size of three, this being the mean and modal size for all
three species in my study area. Each videotaping season lasted six hours beginning at
07hOO and ending at 13hOO. The number of feeding trips to and from the nest by both
parents per hour were averaged over the six hours for each nest. This was then averaged
across nests in order to obtain mean values for each species. At least six video samples
(mean = 11 nests per species during incubation, and 23 nests per species during the nestling
stage) were collected per species (Yellow-breasted Pipit, Orange-throated Longc1aw, and
Grassveld Pipit) in each of the two grassland management systems (i.e. L+A and L+B). A
total of 203 nests were sampled in this way.
I tested for nest-site effects independent of parental activity by re-using natural
nests ofGP, YBP, and OTL during the 1999/2000 breeding season. For the purpose of this
Chapter, only those nests confirmed as either successfully fledged or were confirmed lost
to predators, were included. Natural nests were re-used as experimental nests two weeks
after termination. These nests were divided into three categories based on their original
outcome when there was parental activity: (a) nests that were depredated during the
incubation stage, (b) nests that were depredated during the nestling stage, and (c) nests that
successfully fledged young. I placed two eggs (a real Red Bishop Euplectus orix egg, and
an artificial egg) in each of the experimental nests. Artificial eggs were made by filling
natural eggs shells (donated by the Durban Natural Science Museum) with wax. The wax
eggs simulated the 'host' species' eggs for both size and colour, while the real egg
simulated the 'host' species' egg only for size. I left the two eggs (one real and one
artificial) exposed to predators for 14 days (period equivalent to incubation stage for the
study species), but monitored them using the same procedure as for naturally active nests.
Gloves were used while handling both real and artificial eggs. I calculated daily predation
rates for each of the three groups separately. This design allowed me to examine nest
predation rates of experimental clutches relative to their prior natural fate.
I tested whether nest predation differed between nesting stages once nest-site effects
were taken into account. This was done by considering experiments that removed effects of
parental activity as the reference point for examining effects of parental activity according
to Martin et al. (2000b). Briefly, species with small or no changes in parental activity
between stages should show nest predation differences that are similar to those found in the
experiments that removed effects of parental activity. If nest predation increases
114
Univers
ity of
Cap
e Tow
n

proximately with an increase in parental activity, greater increases in parental activity
should yield greater increases in nest predation relative to incubation, thereby offsetting the
nest site effect. I tested for a positive correlation between the change in parental activity
and nest predation based on the relative change in parental activity and predation between
nesting stages. Changes in predation and activity levels between stages were calculated by
subtracting incubation stage data from nestling stage data for both parental activity and
predation data (see Martin et al. 2000b).
Differences in parental activity and daily predation rates between the incubation and
nestling stages were tested using a paired t-test across the three species in order to explore
general relationships. I compared daily predation rates using the program CONTRAST
(Hines and Sauer 1989). Pearson moment product correlations was used for testing
correlation between change in parental activity and nests predation across species.
RESULTS
Previously, I found that management practices affect nest predation rates in the study
system (Chapter 2). To the ends, nest predation was significantly higher in grasslands under
light grazing with infrequent burning, than those under light grazing, with frequent burning.
I therefore, present my results on the two treatments separately.
Grassland under light grazing with infrequent burning
Parental activity (visits to the nests) across species was significantly greater during the
nestling than during the incubation stage (14.2 ± 1.4 versus 3.0 ± 0.7 trips h'l; Paired t-test,
t = 27.7, 2df, P < 0.001), but individual species varied in the magnitude of relative
differences in activity between stages (Fig. la). Daily predation rates were, however, not
different between the incubation and nestling stages across species (0.06 ± 0.02 versus 0.05
± 0.005; P> 0.05). However, within species daily predation rates varied for some species
during both the incubation and nestling stages (Fig. 1 b, Table 1).
When parental activity was controlled for (by re-using active natural nests with
artificial clutches), daily nest predation rates differed significantly among the three nest
outcome categories ("l = 19.1, df= 2, P < 0.0001). Nests that had a high risk of predation
when used by active parents, had a correspondingly high predation risk when re-used as
experimental nests (Fig. 2). Daily nest predation rate was higher in nests that were
depredated during incubation, than nests that were previously successful (Fig. 2). Daily
115
Univers
ity of
Cap
e Tow
n

nest predation rates were significantly higher for the experimental nests that were
previously depredated during incubation (when parents were present) than experimental
nests that were previously depredated during the nestling stage (i.e. when parent were
present) (X2 = 8.6, df= 1, P < 0.003).
When nest-site effects were removed, daily nest predation rates increased with a
change in parental activity between stages both within and between species (Fig. 3; r =
0.95). GP, which showed the highest change in parental activity between stages, had the
greatest increase in nest predation relative to incubation (Fig. 3).
Grassland under light grazing with frequent burning
Parental activity across species was significantly greater during the nestling than during the
incubation stage (12.6 ± 2.9 versus 2.9 ± 0.5 trips h· l; Paired I-test, 1= 8.2, 2df, P < 0.015),
but individual species varied in the magnitude of the relative differences between stages
(Fig. 4a). Daily predation rates were not significantly different between incubation and
nestling stages between species (0.03 ± 0.002 versus 0.02 ± 0.02, P > 0.05) and within
species (Fig 4b, Table 2).
When parental activity was controlled for (by re-using active natural nests with
artificial clutches), daily nest predation rates differed significantly among the three nest
outcome categories (X2 = 8.3, df= 2, P < 0.02). Nests that had a high risk of predation when
used by active parents, had a correspondingly high predation risk when re-used as
experimental nests (Fig. 5). Daily nest predation rate was higher in nests that were
depredated during incubation than nests that were previously successful (Fig. 5). However,
daily nest predation rates did not differ between the experimental nests that were previously
depredated during incubation (when parents were present) and experimental nests that were
previously depredated during the nestling stage (when parent were present) (P> 0.05).
When nest-site effects were removed, daily nest predation rates increased with
parental activity both within and between species (Fig. 6; r = 0.99). This increase in nest
predation was, however, proportional to the change in parental activity between stages. For
example, GP, which had the highest change in parental activity between stages, showed the
greatest increase in nest predation relative to incubation (Fig. 6).
116
Univers
ity of
Cap
e Tow
n

Table 1. Comparison of daily predation rates (± SE) of natural nests during the incubation
and nestling stages on annually burned grassland using the Mayfield method (1961, 1975).
Species
Grassveld Pipit Yellow-breasted Pipit Orange-throated Longclaw
Incubation
0.038 (0.005) 0.064 (0.008) 0.077 (0.012)
Nestling
0.042 (0.006) 0.052 (0.008) 0.047 (0.009)
t
0.3\ 0.94 4.03
df P
0.58 0.33 0.04
Table 2. Comparison of daily predation rates (± SE) of natural nests during the incubation
and nestling stages on biennially burned grassland using the Mayfield method (1961,
1975).
Species
Grassveld Pipit Yellow-breasted Pipit Orange-throated Longclaw
Incubation
0.025 (0.006) 0.026 (0.007) 0.029 (0.008)
117
Nestling
0.041 (0.008) 0.012 (0.004) 0.013 (0.006)
t
2.48 2.80 2.38
df P
0.12 0.09 0.12
Univers
ity of
Cap
e Tow
n

o incubation • nestling o incubation. nestling
_ 18 : (a) (b) ... *** 0.09 1 :::s 16 0 0.08 * ..c
14 CD - - 0.07 1/1 nJ . 9- 12 ... ... c 0.06 - 0 - 10 +:I 0.05 >. - nJ 'S; 8 " 0.04 +:I
6 f!!
CJ Q. 0.03 nJ
~ 0.02 iii 4 - nJ C 2 C 0.01 f!! nJ 0 0 Q.
GP YBP OlL GP YBP OlL
Fig, 1. (a) Parental activity (number of trips to and from the nest per hour) during the
incubation and nestling stages of three ecologically similar grassland bird species nesting in
annually burned grasslands. (b) Daily nest predation rates for the incubation and nestling
stages. Species: GP - Grassveld Pipit; YBP - Yellow-breasted Pipit; OTL - Orange
throated Longclaw. Asterisks indicate significance: *p < 0.05, **p < 0.01, ***p < 0.001.
(Paired I-test, P > 0.05).
118
Univers
ity of
Cap
e Tow
n

c: (I) .c:
0.12
3:.... 0.1 (I) c: .... (I)
E 1i 0.08 c: ca ~ ~ 0.06 ca c: -g ~ 0.04 '- ca ~ Co 0.02 .-ca C o
43
depredated incubation
depredated nestling
successful
Fate when parents present
Fig.2. Daily predation rates (± SE) for three ecologically similar grassland bird speCIes
(Grassveld Pipit; Yellow~breasted Pipit and Orange~throated Longclaw) nests that were re-used
with experimental clutches (a real Red bishop egg, and an artificial egg) on annually burned
grasslands. The nests were grouped into three categories based on their original fate when
parents were present (nests that were depredated during incubation stage, nests that were
depredated during the nestling stage, and nests that successfully fledged young), Numbers
above bars indicate the number of nests sampled.
119
Univers
ity of
Cap
e Tow
n

c:: o 10 .
t" -1~ -c. 0 1 >. 0 -20 =~ C'O )( 1::1 - -30 c::.! .- e -40 Q) C) c:: ·50 C'O
r= 0.95 +G
+YB
+ OT ____ Nest site
..... ~ ..................................................................... ~~ ......... -........ ., ....... .
~ -60+-------~--------r-------~ (,)
o 5 10 15
Change in parental activity
Fig.3. Correlation between the change in parental activity versus daily predation rates once
nest-site effects were removed on annually burned grasslands (GP - Grassveld Pipit; YBP -
Yellow-breasted Pipit and OTL - Orange-throated Longclaw).
120
Univers
ity of
Cap
e Tow
n

o incubation. nestling 0.045 1 (b) (a) 0.04
1:" 18 CIJ ;:, -0.Q35 0 16 *** C1J
I.. .c c: 0.03 - 14 II) 0 Co ;:: 0.025 'i: 12 C1J - "C - 10 f 0.02 ~ :t:: 8
Co > J!:o 0.015 ;:: CJ 6 '(0 0.01 C1J C n; 4 0.005 - 2 c: <I) 0 I.. 0 C1J GP OTl YBP Q. GP YBP OTl
Fig, 4. (a) Parental activity (number of trips to and from the nest per hour) during the
incubation and nestling stages of three ecologically similar grassland bird species nesting
on biennially burned grasslands. (b) Daily nest predation rates for the incubation and
nestling stages. Species: GP - Grassveld Pipit; YBP - Yellow-breasted Pipit; OTL -
Orange-throated Longclaw. Asterisks indicate significance: *P < 0.05, **p < 0.01, ***P <
0.001. (Paired t-test, P > 0.05).
121
Univers
ity of
Cap
e Tow
n

~ 0.08 1 s:::. !
~ 0.07 J~ ::>-
~ ~ 0.06 • ~ ~ 0.05 j ,g : 0.04
~ ~ 0.03 j' CD "-50[0.02 ~ 0.01 J
~ 0
21
depredated incubation
27
depredated nestling
successful
Fate when parents present
Fig.5. Daily predation rates (± SE) for three ecologically similar grassland bird species
(Grassveld Pipit; Yellow-breasted Pipit and Orange-throated Longclaw) nests that were re·used
with experimental clutches (a real Red bishop egg, and an artificial egg) on biennially burned
grasslands. The nests were grouped into three categories based on their original fate when
parents were present (nests that were depredated during incubation stage, nests that were
depredated during the nestling stage, and nests that successfully fledged young). Numbers
above bars indicate the number of nests sampled.
122
Univers
ity of
Cap
e Tow
n

5 20 r = 0.99 ; .0 ~ 10 e - 0 e.g >-0 0 - _ -1 &
'ca >< YB .... -c - -20 • OT c .! .- e -30 Nest site (I) C) c -40~"'~""""'''''''''''''''''''''''''''''''''''''''''''''''''''''''''''''''''''''''''''''''''' ............................... ..
ca .c -50 -i--------,------,---------, (J
o 5 10 15
Change in parental activity
Fig.6. Correlation between the change in parental activity versus daily predation rates once nest
site effects were removed on biennially burned grasslands (OP, Orassveld Pipit; YBP, Yellow
breasted Pipit and OTL, Orange-throated Longclaw).
123
Univers
ity of
Cap
e Tow
n

DISCUSSION
Skutch (1949) hypothesized that higher nest predation constrains the rate at which parent
birds can deliver food to young and thereby constrains clutch size by limiting the number
of young that parents can feed. Skutch argued that predators are diurnal and they use
parental activity to find nests. Surricates, which are diurnal, were among the most common
mammalian predators in the present study. Snakes are also known to use a variety of visual
stimuli including the intensity of parental mobbing behaviour to locate nests (Goodman and
Goodman 1976, Czaplicki and Porter 1974). For such predators, increased activity at nests
is expected to elevate nest predation during the nestling stage (when activity is greatest)
compared to the incubation stage.
Alexander Skutch's (1949) hypothesis predicts that increased parental activity at the
nest can proximately increase the risk of nest predation. Thus, one would expect a higher
risk of predation during the nestling than the incubation phase. Without taking into account
the effects of nest site, my results suggest that nest predation is generally not greater during
the nestling than the incubation stage. Indeed, for OTL in annually burned grassland, nest
predation was higher during the incubation than during the nestling stage. Similar results
have been found by other studies (e.g. see Roper and Goldstein 1997, Lloyd 1998, Martin
et al. 2000b). Superficially, one might be tempted to reject the Skutch hypothesis of
parental activity and nest predation rates. However, nests that had a high risk of predation
when used by active parents had a correspondingly high risk of predation when the same
nests were re-used with artificial clutches - i.e. parents not present. This suggests that nest
site characteristics have a strong effect on nest predation risk. Thus, nest-site effects
apparently can mask effects of parental activity on nest predation. Certainly, a careful
consideration of there being no difference in predation rates between nesting stages can
indicate a strong effect of parental activity balancing the opposing nest site effects in
influencing nest predation (also see Martin et al. 2000b).
Nests most vulnerable to predators are likely to be found by predators early in the
nesting cycle (i.e. during incubation); consequently, those that survive this period are likely
to remain undetected. Nests in microhabitats with poor nest-site characteristics are thus
expected to have higher predation rates during incubation than during the nestling stage,
simply because of the effects of the nest site. Indeed, within patches that were both lightly
grazed and annually burned (poor-quality nest-site microhabitat) (Chapter 2), there was a
general trend towards an increasing vulnerability to predation risk during incubation than
124
Univers
ity of
Cap
e Tow
n

during nestling stage for species that require greater nesting cover (i.e. YBP and OTL).
This trend, however, disappeared in patches that were both lightly grazed and biennially
burned (high-quality nest-site microhabitat) (Chapter 2).
Once nests-site effects were accounted for, nest predation increased with parental
activity both within and between species. This supports Skutch's (1949) hypothesis of
increased nest predation during the nestling period (when activity is greatest) compared to
during incubation. This emphasises the need to effectively control for nest-site effects in
studies testing Skutch's hypothesis (also see Martin et al. 2000b). My results are in
accordance with other studies (e.g. see Martin et a1. 2000b) and add support to the idea that
increased parental activity at the nest can increase the risk of nest predation, but that nest
site effect first have to be properly controlled.
125
Univers
ity of
Cap
e Tow
n

126
Univers
ity of
Cap
e Tow
n

II SYNTHESIS
South African grassland habitats and their management regimes
Natural and semi-natural grasslands occur extensively around the word. In South Africa
they include low and high altitude grasslands. Although the distribution and maintenance of
grasslands is primarily limited by the interplay between geography, soil type, altitude and
climatic factors, the processes of grazing and fire often play fundamental roles. In South
Africa, the grassland biome is under enormous pressure from agricultural development,
afforestation, industrialization, mining, urbanization and degradation by intensive grazing and
inappropriate use of fire (e.g. see Brooke 1984, Clancey 1985, Macdonald 1989, Low and
Rebelo 1996, Cowling et al. 1997, O'Connor and Bredenkamp 1997). Despite this pressure,
and the associated decline in bird populations (Clancey 1985, Keith et al. 1992, Tarboton
1997b), remarkably little is known about the avifauna of southern African grasslands, their
ecology, and the manner in which they are affected by current land-use changes. Also,
while the effects of fire and grazing pressure on the health of grassland ecosystems in terms
of their capacity to support livestock is well understood, effects of these management
practices on the natural biota is poorly known.
Effects of grazing intensity on recruitment
Comparison of vegetation characteristics showed more ground vegetation cover, greater
foliage density, and greater heterogeneity on lightly grazed than heavily grazed grasslands
(Chapter 2). This suggests that grazing affect vegetation, and consequently abundance or
availability of food resources and nesting sites for breeding birds. Vegetation density and
complexity have been shown to reflect the availability of both food and nest sites (Chapters
3,4, 5 and 6). I suggest that the shift from wild to domestic grazing has drastically intensified
the effect of grazing on grassland habitats and their associated fauna. Wild ungulates were
nomadic or migratory, occurring infrequently at high density for short periods. Domestic
livestock are present, usually at high densities, year-round.
The current intensive grazing pressure on the grasslands of South Africa affects bird
abundance, distribution, species coexistence, breeding density, clutch initiation dates,
duration of the breeding season and clutch size. Avian species diversity and abundance
127
Univers
ity of
Cap
e Tow
n

could be limited by food availability and foraging efficiency, or by predation and
availability of nesting resources (Chapters 2-7). Most birds were more than twice as
abundant in lightly grazed than in heavily grazed grassland (Chapter 3). This study indicates
that some species avoid nesting in heavily grazed grasslands although they forage there at low
densities (Chapter 3). Further, management plans based on species abundance or presence
without considering nest-site resources may be misleading and grazing affects bird
populations through a reduction in nest-site availability and suitability, which in tum
influences breeding success.
My results further clearly demonstrate that the general patterns of daily nest success
rates are severely affected by grazing intensity. Daily nest survival is higher under light
grazing than under heavy grazing pressure (Chapter 2). Grazing can also increase the
abundance of predators (Martin 1992) and reduce alternate prey (Medin and Clary 1990),
which can influence the overall level of predation risk. The frequency of predation may
also vary with the species composition of nest predators (e.g. Norment 1993), which is also
influenced by grazing (Martin 1992). One explanation for the higher mortality in heavily
grazed grasslands is that nests are easier to locate by predators as a result of reduced cover
there (Chapter 4 and 5). Cover can also influence the thermal environment of nests
(Walsberg 1985). Birds in heavily stocked grasslands, where cover is generally less, are
likely to occasionally leave the nest because of heat stress and consequently to leave their
eggs or nestlings unattended.
The density of grassland vegetation can be important in determining the shading
and concealment features of a habitat (Chapter 5). Nestlings that move out of the nests
because of high temperatures (e.g. see Yorio and Boersma 1994) are also more vulnerable
to predation because they might expose themselves to predators while seeking shade. Birds
that fledge in heavily grazed grasslands could possibly behaviourally compensate for the
cover condition of their nests. However, these compensation strategies may be
energetically costly thus compromising future reproductive output. Persistent re-nesting
after nest failure and consequent multiple brooding can, however, offset high nest mortality
rates to some extent (Martin 1992). Such compensation may not be possible in heavily
disturbed grassland systems where predation is prevalent throughout the breeding season.
I propose that grasslands should ideally be grazed moderately. It might be difficult
to stop all undesirable management practices within a given region. One management
approach to maintaining stable populations of grassland birds in disturbed habitats (e.g.
128
Univers
ity of
Cap
e Tow
n

heavily grazed grasslands) where recruitment no longer matches mortality, is to intersperse
poorly managed farms with appropriately managed ones. A single large grassland
farm/farms grazed moderately at the scale of the management unit could act as a 'source' to
compliment surrounding 'sink' farms. Overall productivity could then be enhanced because
of the high density and nest success associated with the 'source' (see Pulliam 1988). The
spacing of such 'source' versus sink' areas should be in such a way to allow normal
. dispersal. The spatial relationship among potential 'source' and 'sink' patches, and the
consequences of source-sink dynamics, however, require further investigation.
Effects of fire frequency on recruitment
Grasslands managed under less frequent fires showed more ground vegetation cover,
greater foliage density, and greater heterogeneity than under more frequent fires (Chapter
2). As expected, breeding commenced earlier in unburned grasslands than in annually
burned grasslands (Chapter 3). This suggests that fire may affect the abundance or
availability of nest-site resources. Birds breeding in frequently burned grasslands have to
wait for vegetation to grow beyond a threshold before commencing with breeding. Early
nesters are at an advantage as they potentially have a longer nesting season. In addition, the
delay in clutch initiation is costly if seasonal declines in nesting conditions occur. A delay
in clutch initiation reduces both the number of broods a successful pair can raise, as well as
opportunities for re-nesting to replace depredated nests.
The most important impact that fire frequency has on recruitment is its effect on
nesting success. My results clearly demonstrate that the general trend of daily success rates
of nests is affected by fire frequency (Chapter 2). Daily nest survival is greatest under low
fire frequency (Chapter 2). Frequent fires lead to the removal or reduction of nesting
vegetation cover (Chapter 2), reduce nest concealment and make nests more visible to nest
predators (Chapter 4 and 5). Dense vegetation can inhibit transmission of auditory or
chemical stimuli (Chapter 5; also see Martin 1993c) and thus reduce vulnerability of nests
to predation. If parents value their own survival (e.g. see Ghalambor and Martin 2001),
particularly in areas where predation is intense, concealment provided by dense vegetation
may contribute to the lower rate of nest abandonment by providing nesting parents with a
greater sense of protection from predators. Superior cover may also improve nest macro
and microclimate, which may enhance nest survival (e.g. see Walsenberg 1985, Yorio and
Boersma 1994). Frequent fires can also cause a reduction in diversity of nest-site
129
Univers
ity of
Cap
e Tow
n

microhabitats and density of potential nest sites (Chapter 4). This in turn can then cause
increased overlap in nest site use among coexisting species and, thereby increase nest
predation (Chapter 4; also see Martin 1996a).
The low nest success that I recorded in the Wakkerstroom grasslands could well be
below the level needed to balance mortality (Chapter 2). Indeed, nest success rates below
30% have been implicated in population declines in Neotropical migrants (Donovan et al.
1995) and shrub steppe songbirds (Yanes and Suarez 1995). To enhance avian nesting
success, management should be directed towards using appropriate fire frequencies.
Ideally, the South African montane grasslands should be burned biennially. This maintains
tall and dense growth which may restrict activity and search effort of nest predators and
provide better nest concealment. The ideal management protocol should identify the most
appropriate timing of burning, as well as the scale of the burn. However, further research is
required to determine the trade-off between economic losses of livestock production and
retention of grassland bird popUlations that might apply when farmers alter their
management practices to benefit grassland birds.
Underlying mechanisms linking grassland bird population declines to grassland
management practices
A major consequence of the most common management regIme In South African
grasslands (i.e. annual burning and heavy grazing) is reproductive failure among grassland
birds. In particular, a regime of heavy grazing and annual burning increases grassland bird
nest failure (Chapter 2). The main cause of nest failure is nest predation, regardless of
grazing intensity, and accounts for> 87 % of the total nest failures (Chapter 2). Similarly,
the major cause of nest mortality is nest predation regardless of fire frequency and together
accounts for> 70 % of total nest failures (Chapter 2). The difference in the percentage of
failure due to predation between management regimes suggests grazing affect nest
predation more than fire. Failure due to other mortality factors was insignificant and did not
differ between management regimes (Chapter 2). In addition, direct impacts of grazing and
fire through removal of cover of active nests, disturbance of nests, or direct mortality
through trampling and burning of nests are of little consequence (Chapter 2). Clearly these
results support the hypothesis that potential demographic consequences of grazing and
burning effects include altered susceptibility to reproductive failure, particularly as
mediated through nest predation (e.g. see Ammon and Stacey 1997). It also suggests that
130
Univers
ity of
Cap
e Tow
n

nest predation may be the proximate mechanism that drives bird population declines. Thus,
management-practice mediated reproductive dysfunction via nest predation may be more
important than food availability in regulating populations of the birds that live in South
Africa's highland grassland ecosystems.
Can differences in life history explain variable responses by species to fire frequency
and grazing intensity?
My study demonstrates a clear relationship between nesting success and management
practices. There are, however, interspecific differences. For example, in the most
widespread management regime (grassland managed under light grazing with frequent
fires), Yellow-breasted Pipit (YBP) and Orange-throated Longclaw (OTL) both had similar
levels of nesting success, whereas Grassveld Pipit (GP) was twice as successful. Nesting
success for other species was variable.
In the following, I attempt to explain variable responses by species to fire frequency
and grazing intensity. In particular, I examine the relationship between nesting success and
a number of life history traits of the study species (Table 1) in order to identify life-history
characteristics associated with nest survival. I focus my attention on the three ecologically
similar grassland species of the family Motacillidae, viz. GP, YBP and OTL - in order to
control for phylogeny. Only the GP was able to nest under heavy grazing (Chapter 2). The
YBP and OTL require relatively more dense vegetation cover than GP for nesting and
possibly hiding from danger while foraging. Species differences in nesting success can be
explained in a couple of ways. First, nest placement, specificity in nest site selection, and
predator specialization can explain species nesting success differences within treatments.
For example, YBP and OTL showed higher nest-site specificity than the GP (Chapter 4).
Search intensity of a nest predator may also increase with prey density (Martin 1988c). The
degree of similarity of nest placement is high between YBP and OTL. Overlap or similarity
of nest sites is assumed to incur a fitness cost (e.g. nest predation), because the resulting
increase in cumulative nest density can increase density-dependent predation rates (Martin
1996a).
The generally higher mortality rate for YBP and OTL as compared to GP can
possibly be explained by their plumage colouration. Birds with brighter plumage are easier
to detect and thus face a higher risk of predation (e.g. see Anderson 1994). For those
predators using behaviour and activity of parents as cues for detecting nests (Chapter 7),
131
Univers
ity of
Cap
e Tow
n

Table 1. Reproductive characteristics and natural history of the focal birds species in the Wakkerstroom high-altitude grassland study area.
Species Body Modal Length of Length of Plumage Type of nest Residency Status Threat category mass (g) clutch incubation nestling colour
size ~eriod [!eriod Grassveld Pipit 25 3 14 days 14 days Brown Cup·shaped Altitudinal migrant Common None Yellow-breasted Pipit 25 3 14 days 14 days Yellow Ball·shaped Altitudinal migrant Rare Vulnerable Orange-throated Longclaw 45 3 14 days 14 days Yellow Cup-shaped resident Common None Ayre's Cisticola 10 4 12 days 14 days Brown Ball-shaped resident Common None Long-tailed Window 35 3 14 days 16 days Brown Ball·shaped resident Common None Common Quail 120 6 19 days precocial Brown Scrape on ground Summer visitor Common None Quail Finch 12 5 14 days 21 days Brown Ball-shaped resident Common None Rudd'sLark 20 3 14 days 14 days Brown Roofed Cup-shaped resident Rare Critically endangered Red-capped Lark 25 3 14 days 14 days Brown Cup-shaped resident Common None
132
Univers
ity of
Cap
e Tow
n

increased level of display as well as brightness of plumage of the parent are both factors
that would increase conspicuousness - and thus vulnerability to predation (Goodman and
Goodman 1976, Gotmark & Hoh1falt 1994).
Egg colour can also contribute to the observed differences in species nesting
success. A major function of egg colour is presumed to be protection from visually oriented
predators (Oniki 1985), and egg colour is known to influence rates of predation (Yahner
and Mahan 1996). The YBP and OTL generally lay creamy, white eggs, which may have
been more conspicuous than the relatively brownish eggs of the GP. GP may also have
adapted a kind of anti-predator defense response by concealing their eggs by means of
back-ground matching of the cryptic nest colouration, a frequent kind of defense in birds
(Ricklefs 1969). Egg size could explain the higher egg mortality experienced by OTL
(Chapter 2). OTL nests are on average bigger than those of GP and YBP. Bigger eggs will
require bigger nests and more cover for nest concealment (e.g. Meller 1990). If cover is
limited, such nests will be more conspicuous increasing their vulnerability to nest
predation. Another explanation is that, differences in nest predation between species could
be due to the different anti-predator adaptations employed by the different species
including mobbing, distraction displays, nest defense, nest guarding and reaction distances.
N est departure time and flushing distances are known to influence nest predation
(Gochfield 1984, Byrkjedal 1987). GP adopts an anti-predator behaviour of sitting tight in
the nest and only flushing within less than a meter, while the Long-tailed Widow (LTW)
always sneaks away or flushes at a distance when approached by a predator (pers. obs.).
Both these species have relatively high nesting success rates compared to others.
In addition to visual cues or activity at the nest, predators in grassland habitats may
be locating nests by searching around the area from which birds have flushed. If this is so,
one would expect reduced predation in denser vegetation. This was the case in my study
(Chapter 2). This also suggests that it is likely to be easier for predators to locate nests
during incubation than during the nestling phase because parents spend more time on the
nest during incubation. In addition to nest-site effects (Chapter 7), such a mechanism can
explain the lower predation during the nestling stage than incubation in OTL, YBP and
Ayre's Cisticola (AC). This further supports the idea that the absence of adults from the
nests can considerably reduce the risk of nest predation (Simon 1990). If predators locate
nests by flushing birds from the nests, then the two anti-predatory behaviours as expressed
by GP and LTW (see above), may indeed enhance nesting success for these two species.
133
Univers
ity of
Cap
e Tow
n

Flushing distance and flushing decisions by OTL and YBP, particularly in grasslands with
relatively little cover, may subject them to a higher risk of predation than that experienced
by, for example, the GP.
Species-related variation in the intensity of begging and conspicuousness of the
nestlings can also account for an increased likelihood of predation. To this end, OTL and
YBP nestlings generally had their mouths open most of the time, while GP nestlings only
opened theirs on presentation of food. Both OTL and YBP nestlings begged more when I
disturbed the nest or when parents approached the nest than GP nestlings (from video
observations). Begging activity is known to influence the risk of predation (Skutch 1949),
with noisier nestlings being more vulnerable (Redondo and Castro 1992).
Open cup-shaped nest types were generally more vulnerable to predation than
roofed nests. The differences in nest type could explain the generally higher nesting
success among AC, Quail Finch and LTW - all of which build dome-shaped nests.
Residency throughout the year, for example in OTL, may enable birds to: (1)
acquire knowledge, experience and familiarity with the habitat and with predator activity in
the environs of the nest; (2) retain the same territory and mate during successive breeding
attempts or between seasons, or (3) gain site dominance over others by remaining in the
breeding site. All these factors are predicted to enhance survival. The hypothesis that long
term residency enhances nest survival (Robins et al. 1989), however, is not supported in
this study. The GP, despite being a partial migrant, experienced markedly higher nesting
success than the resident OTL. Indeed OTL (resident) and YBP (altitudinal migrant)
experienced similar nest mortality suggesting that breeding success may not be related to
the breeding pair's knowledge of the habitat or predators. Rather, nest-site selection itself is
paramount in determining reproductive success.
Nesting success of the rare YBP in the most widespread management regime
(grassland managed under light grazing with frequent fires) was similar to its closely
related common congener, OTL, but half that of its other commonly occurring congener,
the GP. Irrespective of phylogeny, rare species (YBP and Rudd's Lark), however, generally
experience lower nest success than commoner species suggesting that they are more
sensitive to management effects. The generally low nesting success rates for rare species
may result from a combination of many life history characteristics that cumulatively and
additively reduce nesting success.
134
Univers
ity of
Cap
e Tow
n
Ecological constraints of nest predation and its influence on the evolution of avian life
histories
I was able to show that there was no observer effect within my study system (see Appended
Chapter A). Thus, I have confidence in believing that it is the variables under examination
that affected nest predation rates in my study.
In Chapter 7, I explicitly demonstrated that once nest-site effects are removed, nest
predation increases with parental activity during the nestling stage within and between
species. Further nest-site effects and parental activity apparently have additive effects on
nest predation rates (Chapter 7). The increase in nest predation due to parental activity
effects could influence the selection of nest-site choices (Chapter 4). The relationship
between parental activity and nest predation should favour a negative evolutionary outcome
(e.g. see Martin and Ghalambor 1999), where species nesting in areas with substantial risk
of nest predation are expected to show trends towards reduced parental activity (e.g. Skutch
1949, Conway and Martin 2000). The relationship between parental activity and nest
predation also supports the concept that nest predation places a critical evolutionary
constraint on variation in avian clutch sizes (see Skutch 1949, Lima 1987, Linden and
Moller 1989, Martin et al. 2000a). Large clutches should require more feeding trips by
parents to the nest, thus placing the nest contents at greater risk from predators (Skutch
1949, Martin et al. 2000a). Consistently high nest predation such as that recorded in this
study (Chapter 2) can then constrain the rate at which parent birds visit nests to feed their
young (e.g. see Skutch 1949, Ghalambor and Martin 2001), thereby ultimately constraining
clutch size by limiting food delivery. Lastly, the effects of parental activity on predation
rates can place an important evolutionary constraint on variation in feeding rates and
foraging strategies among species (Chapter 6), which can affect nestling growth rates and
body condition of the chicks.
My results on parental activity (Chapter 7), and the tests of predictions of the nest
predation (Skutch 1949), and food limitation hypotheses (Lack 1947) in determining
optimal clutch size (Chapter 3), suggest that Lack's model of food limitation on clutch size
could be rejected in favour of Skutch's hypothesis. Even though other factors may explain
variation in clutch size, there is good reason to believe that nest predation is the most
important factor driving the evolution of clutch size in my grassland study area.
135
Univers
ity of
Cap
e Tow
n

Implication for conservation
The implications of my results (Chapter 2·6) for the management of grassland bird species
are quite clear. To enhance nesting success and productivity of the focal study species, and
grassland birds in general, management should focus on manipulating, increasing and
maintaining habitat features that increase reproductive success as these have direct fitness
consequences. I propose that grasslands should be managed according to the model
depicted in Figure I. Because risk of nest predation is affected by habitat characteristics at
the scale of nest-site and nest-patch scale, (Chapter 5) grassland management should focus
on improving habitat condition, particularly availability and suitability of nest sites, based
on habitat attributes surrounding nests at a range of scales.
Although the total bird diversity and density was reduced by frequent burning and
intense grazing, individual species were variously affected by different management
practices (Chapter 2 and 3). These observations suggest that conservation planners should
adopt an approach that considers individual species, or management for habitat mosaics for
the conservation of multiple species. In order to benefit a diversity of birds, and the concern
for conservation for a broad spectrum of species (e.g. see Ball et al. 1994, Maddock and Du
Plessis 1999), managers should provide fine-scale diversity of vegetation characteristics
within grazing fields. Based on habitat measurements and the reported classification
functions (Chapter 4), managers can now easily predict the species likely to utilize a given
plot. Such knowledge will assist in designing appropriate habitat manipulations for species
of conservation concern. The richness of the regional avifauna will be maintained through
availability of the full mosaic of habitat necessary for each species. The diversity of
management practices, species and their habitat requirements are assumed to complicate
effective management. However, the general similarity in the effects of management
regimes across all species (Chapter 2 and 3), overlap of nest-sites (Chapter 4), and
similarity of major habitat features determining nesting success across species (Chapter 4
and 6) suggest that grassland management practices and restoration programs for single
priority species (Yellow-breasted Pipit for example), should provide habitat for a diversity
of similar species.
136
Univers
ity of
Cap
e Tow
n

High
I I
I I
I Low I
Low
I I
Frequent
Heavy
I I
Xl I
I I
I
Burning Infrequent
Grazing Light
, ... - ......... .,. .... '" ........ '" ....
'" ' '" " '" , '" ....
A Medium High
Vegetation density and cover
Fig 1. A simplified model linking management practices to nest survival of birds in the
South African grasslands. The dotted line (X) represents food availability, while the solid
line (Y) represents nest predation. Bear in mind that highest nest predation results in lowest
nest survival, and vice versa. Point A indicates an hypothetically optimal trade-off between
fire frequency and grazing pressure. The effects of nest predation would appear to
outweigh those of food in determining general survival for grassland species. Thus.
management should be biased towards maximizing areas for successful nesting, rather than
foraging.
137
Univers
ity of
Cap
e Tow
n
REFERENCE Allan, D.G., Harrison, R. A., Navarro, R. A., van Wilgen, B. W., and Thompson, M. W. 1997. The impact of
commercial afforestation on bird populations in Mpumalanga province, South Africa - Insights from
bird-atlas data. BioI. Conserv. 79: 173-185.
Ammon, E. M., and Stacey, P. B. 1997. Avian nest success in relation to past grazing regimes in a montane
riparian system. Condor. 99: 7-13.
Anderson, M. 1994. Sexual selection. Princeton Univ. Press, Priceton, NJ.
Armstrong, A. J. and Hensbergen, H. J. 1997. Evaluation of afforestable montane grasslands for wildlife
conservation in the North-eastern Cape, South Africa. Bio!. Conserv. 81: 179-190.
Askins, R. A. 1993. Population trends in grassland, shrubland, and forest birds in Eastern North America.
Curro Ornithol. 1-34.
Badyaev. 1995. Nesting habitat success of Eastern Wild Turkeys in the Arkansas Ozark Highlands. Condor
97: 221-232.
Ball, I. J., T. E. Martin, and J. K. Ringelman 1994. Conservation of nongame birds and waterfowl: conflict or
compliment? Trans N. Am. Wildl. Res. Con! 59: 337·347.
Barnes, K. 2000. The Eskom red data book of South Africa, Leshotho and Swaziland. BirdLife South Africa,
Johannesburg.
Barnes, K. N. (ed.) 1998. The important bird areas of Southern Africa. BirdLife South Africa, Johannesburg.
Bendell, J. F. 1974. Effects of fire on birds and mammals. Pp. 73-138. In: T. T., Kozlowski and C. E.
Ahlheren, (eds.). Fire and ecosystems Academic Press New York.
Bennun and P. Njoroge.lmportant Bird Areas in Kenya. East Africa Natural History Society. Nairobi (1999).
Best, L. B., and Stauffer. 1980. Factors affecting nesting success in riparian bird communities. Condor 82:
149-158.
BirdLife International, 2000. Threatened Birds of The World. BirdLife International and Lynx Edi~ions,
Cambridge and Barcelona (2000).
Blancher, PJ., and R. J. Robertson. 1985. Site consistency in kingbirds breeding performance: Implication for site
fidelity. J. Anim. Ecol. 54: 1017·1027.
Booysen, P. de V. 1967. Grazing and grazing management terminology in Southern Africa. Proc. Grassld.
Soc. Sth. Afr. 2: 45-57.
Bosque, C., and Bosque, M. T. 1995. Nest predation as a selective factor in the evolution of developmental
rates in altricial birds. Am. Nat. 145: 234-260.
Bowman, G. B., and L. D. Harris. 1980. Effects of spatial heterogeneity on ground-nest depredation. 1. Wildl.
A4anage.44: 806-813.
Brodmann, P. A. and Reyer, H-U. 1999. Nestling provisioning in water pipits (A nth us spino/etta): do parents
go for specific nutrients or profitable prey? Oec%gia 120: 506-514.
Brodmann, P. A. and Reyer, H·U., Baer, B. 1977. The relative importance of habitat structure and prey
characteristics for the foraging success of water pipits (Anthus spino/etta): Ethology 103: 222·235.
Brooke, R. K. 1984. South African Red Data Book-birds. Pretoria: South African National Scientific Programmes
(Report 97).
138
Univers
ity of
Cap
e Tow
n
Brown, H. D. 1962. New and interesting grasshoppers from southern Africa, 3 (Orthoptera: Acridoidea). J.
entomol. Soc. S. Afr. 25: 198·229.
Bullock, J. M. and R. J. Pakeman. 1997. Grazing of low land heatherland: management methods and their
effects on heatherland vegetation. BioI. Conserv. 79: 1-13.
Byrkjedal, I. \987. Antipredator behavior and breeding success in Greater Golden-Plover and Eurasian
Dotterel. Condor 89: 40-47.
Caughley, G. (1994). Directions in conservation biology. J. Anim. Ecol. 63: 215-244.
Charlesworth, B. 1994. Evolution in Age-Structured Populations. Cambridge University Press, Cambridge.
Charnov, E. L. and Krebs, J. R. 1974. On clutch size and fitness. Ibis 116: 217·219.
Clancey, P. A. 1985. The rare birds of southern Africa. Johannesburg: Winchester Press.
Cody, M. L. editor. 1985. Habitat selection in birds. Academic Press. New York, USA.
Collar, N. 1., Crosby, M. 1. and Stattersfield, A.1. 1994. Birds to watch 2. The world list of threatened birds.
BirdLife International. Cambridge.
Conner, R. N., M.E., Anderson, and 1. G. Dickson. 1986. Relationships among territory size, habitats, song,
and nesting success of Northern Cardinals. Auk 103: 23·31.
Conway, C. J., and Martin, T. E. 2000. Evolution of avian incubation behaviour: influence of food, climate and
nest predation. Evolution 54: 670-685.
Cooley, W.W., and P. R. Lohnes. 1971. Multivariate data analysis. Wiley, New York, New York, USA.
Cowling, R. M., Richardson, D. M. and Pierie, S. M. 1997. Vegetation of Southern Africa. Cambridge,
Cambridge University Press. Pp 615.
Cresswell, W. 1997. Nest predation: effects of nest characteristics, clutch size and parental behaviour. Anim.
Behav.53: 93·103.
Crowder, L. B., and W. E. Cooper. 1982. Habitat structure complexity and the interaction between bluegills
and their prey. Ecology 63: 1802-1813.
Curry, J. P. 1994. Grassland Invertebrates. Chapman & Hall, London, UK.
Czaplicki, 1. A., and Porter, R. H. 1974. Visual cues mediating the selection of Goldfish (Carassius auratus) by
two species of Natrix. J. Herpetol. 8: 129·134.
Dickson, J. G. 1981. Effects of forest burning on songbirds. Pp. 67-72. In: G. W. Wood. (eds.). Prescribed
fire and wildlife in southern forests. Belle W. Baruch For. Sci. Inst., Clemson University,
Georgetown, SC.
Dirsh, V. M. 1956. Orthoptera Acridoidea. In: B., Brinck, P., and Rudebeck, G. (eds.). South African animallife.
Vol. 3. Hanstrom, Almqvist and Wiksell, Stockholm, pp. 121-272.
Donovan, T. M., Thompson, F. R. Faaborg, J. and Probst, J. R. 1995. Reproductive success of migratory
birds in habitat sources and sinks. Conserv. BioI. 9: 1380·1395.
Downing, B. H. 1978. Environmental consequences of agricultural expansion in South Africa since 1850. S.
Afr. J. Sci. 74: 420-422.
Dupre C. and Diekmann, M. 2001. Differences in species richness and life-history traits between grazed and
abandoned grasslands in southern Sweden. Ecography 24: 275·286.
139
Univers
ity of
Cap
e Tow
n

Edwards, P. 1. 1981. Sour grassveld. In: Taiton N. M. (ed.). Veld and pasture management in South Africa,
pp. 395-399. Shuter and Shooter in association with the University of Natal Press.
Feely, 1. M. 1979. Did iron-age man have a role in the history of Zulu land's wilderness landscapes? S. Afr. J.
Sci. 76: 150-152
Feely,1. M. 1987. The early farmers in Trasnkei, South Africa, before AD 1870. Cambridge Monographs in
African Archaeology 24: 1-142.
Filliater, T.S., Breitwisch, Randall and P. M. Nealen. 1994. Predation on the northern cardinal nests: does
choice of nest matter? Condor 96: 761-768.
Fretwell, S. D. 1972. Populations in a seasonal environment. Priceton University Press, Priceton, New
Jersey, USA.
Fretwell, S. D., and Lucas, H. L. 1970. On territorial behaviour and other factors influencing habitat
distribution in birds. Acta Biotheor. 19: 16-36.
Garnet, M. C. 1981. Body size, its heritability and influence on juvenile survival among great tits Pares
major. Ibis 123: 31-41.
Ghalambor, C. K., and T. E. Martin, 2001. Fecundity-survival trade-offs and parental risk-taking in birds.
Science 292: 494.
Gibbs, R. G. E. 1987. Preliminary floristic analysis of the major biomes in Southern Africa. Bothalia 17: 213-227.
Gochfeld, M. 1984. Anti-predator behaviour: Aggressive and distraction display of shorebirds, p. 289-377.
In: 1. Burger and B. Olla (eds.). Behaviour of marine mammals. Vol. 5. Shorebirds: breeding
behaviour and populations, Plenum Press, New York.
Goodman, J. D., and Goodman, 1. M. 1976. Contrasting colour and patterns as enticement display in snakes.
Herpetologica 32: 145-148.
Goriup, P. D. (ed.) 1988. Ecology and conservation of grassland birds, ICP B Tech. Pubt. 7, Cambridge, U.K.
G6tmark, F. and Hohlfalt, A. 1995. Bright male plumage and predation risk in passerine birds: are males
easier to detect than females? Oikos 74: 475-484.
Green, R. E. 1995. Diagnosing causes of bird population declines. Ibis 137 (Suppl.): S47-S55.
Greig-smith, P. W. 1980. Parental investment in nest defense by stonechats (Saxicola torquata). Anim. Behav.
28: 604-619.
Hand, D. J. 1981. Discrimination and classification. John Wiley and Sons, New York.
Harris, M. P. 1969. Food as a factor controlling the breeding of Puffinus herminieri. Ibis Ill: 139-156.
Harrison, J. A., Allan, D.G., and Hensbergen, H. J. 1994. Automated habitat annotation of bird species lists - an
aid in environmental constancy. Ostrich 65: 316-328.
Henderson, I. A., Cooper, J., Fuller, R. J., and Vickery, J. 2000. The relative abundance of birds on set aside
and neighbouring fields in summer. J. Appl. Eco/. 37: 335-347.
Hensler, G. L. and 1. Nichols. 1981. The Mayfield method of estimating nesting success: A model, estimators
and simulation results. Wilson. Bull. 93: 42-53.
Hines, J. E., and Sauer, J. R. 1989. Program CONTRAST: a general program for the analysis of several
survival or recovery rate estimates. USflSh Wildt. Servo Fish Wi/d. Tech. Rep. 24, 009.
140
Univers
ity of
Cap
e Tow
n
Hochachka, W., and Smith, 1. N. M., 1991. Determinants and consequences of nestling condition in Song
Sparrows. 1. Anim. Ecol. 60:695-1008.
Hockey, P. A. R., Allan, D. G., Rebelo, A. G. and Dean, W. R. J. 1988. The distribution, habitat
requirements and conservation status of Rudd's Lark Heteromirafra ruddi in South Africa. BioI.
Conserv. 45: 255-266.
Holmes, R. T. 1981. Theoretical aspects of habitat use by birds, p. 33-37. In: D. E. Capen (ed.). The use of
multivariate statistics in studies of wildlife habitats. USDA For. Servo Tech. Rep. R M-87.
Holmes, R. T., T. W. Sherry, and F. W. Sturges. 1986. Bird community dynamics in a temperate deciduous
forest: long-term trends at Hubbard Brook. Ecological Monographs 56: 201-220.
Holthuijzen, A. M. A. 1990. Prey delivery, catching, and retrieval rates in nestling Prairie Falcons. Condor
92: 475-484.
Holway, D. A. 1991. Nest-site selection and the importance of nest concealment in the Black-throated Blue
Warbler. Condor 93:575-581.
Howlett, J. S., and Stutchburry, B. J. M. 1997. Within season dispersal, nest-site modification, and predation
in renesting hooded warblers. Wilson Bull. 109: 643-649.
ICBP (1992) Putting biodiversity on the map: Priority areas for global conservation. Cambridge, UK: ICBP.
IUCN. 1990. Biodiversity in Sub-Saharan Africa and its Islands. Conservation, management and Sustainable
Use.
Jaenike, J. J., and Holt, R. D. 1991. Genetic variation for habitat preference: evidence and explanations. Am.
Nat. 137: S67-S290.
Johnson, D. H. 1979. Estimating nest success: the Mayfield method and an alternative. Auk 96: 651-661.
Julliard, R., R. H. McClery, J. Clobert, and C.M. Perrins. 1997. Phenotypic adjustment of clutch size due to
nest predation in the great tit. Ecology 78: 394-404.
Keith, S., Urban, E. K. and Fry, C. H. 1992. The Birds of Africa. Vol. lV. Academic Press. London.
Kekick, V., C. E. Taylor, and M. Andjelkovic. 1980. Habitat choice and resources specialization by
Drosophila subobscura. Genetika. 12: 219-225.
Kelly, J. P. 1993. The effect of nest predation on habitat selection by Dusky Flycatcher in limber pine-juniper
woodland. Condor 95: 83-93.
Kendeigh, S. C. 1944. Measurements of birds populations. Ecol. Monogr. 14: 67-106.
Keppie, D. M., and Herzog, P. W. 1978. Nest site characteristics and nest success of Spruce Grouse. 1. Wildl.
Manage. 42: 628-632.
Knopf, F. L., and F. B. Samson. 1997. Conservation of grassland vertebrates. Pp. 273-289 in F. L., Knopf,
and F. B. Samson (eds.). Ecology and conservation of Great Plains vertebrates. Springer-Verlag,
New York, New York, USA.
Knopf, F. L., and J. A. Sedgwick. 1992. An experimental study of nest-site selection by Yellow Warblers.
Condor. 94: 734-742.
Krebs C. J. 1999. Ecological methodology. Addison Wesley Longman, Menlo Park, California.
141
Univers
ity of
Cap
e Tow
n

Kruger, F., Barnard, C., Bethlehem, L., Coetzee, H., Copper, D., Edwards, M., Gevisser, D., and Greyling, T.
(eds). 1995. Towards a policy for sustainable forest management in South Africa: a discussion paper.
Department of Water Affairs and Forestry, Pretoria.
Kuleza, G. 1990. An analysis of clutch size in New World passerine birds. Ibis 132: 407-422.
Lack, D. 1947. The significance of clutch-size. Pt. 1. Interspecific variations. Ibis 89: 302-352.
Lack, D. 1948. The of clutch size. Pt. 3. Some interspecific comparisons. Ibis 90: 25-45.
Lack, D. 1968. Ecological adaptations for breeding in Birds. Methuen and Company, London.
Lack, D. 1971. Ecological isolation in birds. Harvard Univ. Press, Cambridge, MA.
Leopold, A. S., S. A. Cain, C. M. Cottam, LN. Gabrielson, and T. L. Kimball. 1963. Wildlife management in
the national parks. Amer. For. 69 (4): 32-35, 61-63.
Lima, S. L. 1987. Clutch size in birds: a predation perspective. Ecology 68: 1062-1070.
Linden, M., and M0ller, A. P. 1989. Cost of reproduction and co variation oflife history traits in birds. Trends
Ecol. Evol. 4: 367-371.
Lloyd, P. 1998. A study of the ecology of the Namaqua sandgrouse and other arid-zone birds. Ph.D.
dissertation, University of Cape Town, South Africa.
Low, A. 8., and Rebelo, A. G. 1996. Vegetation of South Africa. Lesotho and Swaziland. Department of
Environmental Affairs and Tourism, Pretoria.
Macdonald, I. A. W. 1989. Man's role in changing the face of South Africa. In: Huntley, 8. 1. 1989 (eds.). Biotic
diversity in South Africa. Pp 51-77). Oxford Univ. Press.
MacKenzie, D. 1., and S.O. Sealy. 1981. Nest site selection in Eastern and Western kingbirds: a Multivariate
approach. Condor 83:310-321.
Maddock, A., and du Plessis, M. A. 1999. Can species data only be appropriately used to conserve biodiversity?
Biodivers. Conserv. 8: 603-615.
Magrath, R. D. 1990. Hatching asynchrony in altricial birds. Bioi. Rev. 65: 587-622.
Martin, T. E. 1987. Food as a limit on breeding birds: a life-history perspective (review article). Annu.
Rev.Eco. Syst. 18: 453-487.
Martin, T. E. 1988a. Habitat and area effects on forest bird assemblages: is nest predation an influence?
Ecology. 69: 74-84.
Martin, T. E. 1988b. Nest placement: implications for selected life-history traits, with special reference to
clutch size. Am. Nat. 132: 900-910.
Martin, T. E. 1988c. On the advantage of being different: Nest predation and the coexistence of bird species.
Proc. Nat. Acad. Sci. 85: 2196-2199.
Martin, T. E. 1992. Breeding season productivity: what are the appropriate habitat features for management?
Pp. 455-473. In J. M. Hagan, and Johnstone, D. W. (eds.). Ecology and conservation ofNeotropical
migrant landbirds. Smithsonian institution Press, Washington, D.C.
Martin, T. E. 1993a. Evolutionary determinants of clutch size in cavity-nesting birds: nest predation or
limited breeding opportunities? Am. Nat. 142: 937-46.
Martin, T. E. 1993b. Nest predation among vegetation layers and habitat types: revising the dogmas. Am. Nat.
141: 897-913.
142
Univers
ity of
Cap
e Tow
n

Martin, T. E. 1993c. Nest predation and nest sites. New perspectives on old patterns. BioScience 43: 523-532.
Martin, T. E. 1995a. Avian life history evolution in relation to nest sites, nest predation, and food. Ecol.
Monographs 65: 101-27.
Martin, T. E. 1995b. Summary: model organisms for advancing understanding of ecology and land
management. In Martin, T. E, and Finch, D. M. (eds.). Ecology and management of Neotrpropical
migratory birds. Oxford Univ. Press, New York.
Martin, T. E. 1996a. Fitness costs of resource overlap among coexisting bird species. Nature 380: 33840.
Martin, T. E. 1996b. Life history evolution in tropical and south temperate birds: what do we really know? 1.
Avian Bioi. 27: 263-273.
Martin, T. E. 1998. Are microhabitat preference of coexisting species under selection and adaptive? Ecology.
79: 656-670.
Martin, T. E., and Ghalambor, G. K. 1999. Males helping females during incubation. 1. Required by
microclimate or constrained by nest predation? Am. Nat. 153: 131-139.
Martin, T. E., C. R. Paine, C. J. Conway, W.M. Hochachka, P. Allen, and W. Jenkins. 1997. BBIRD Field
Protocal. Montana Cooperative Wildlife Research Unit, University of Montana, Missoula, Montana,
USA.
Martin, T. E., Clobert, J. 1996. Nest predation and avian life-history evolution in Europe versus North
America: a possible role of humans? Am. Nat. 147: 102846.
Martin, T. E., Li, Pingjun. 1992. Life history traits of open- vs. cavity-nesting birds. Ecology 73: 579-92.
Martin, T. E., P. R. Martin, C. R. Olson, B. J. Heidinger, and J. 1. Fontaine. 2000a. Parental care and clutch
sizes in North and South American birds. Science 287: 1482-1485.
Martin, T. E., Roper, J. 1. 1988. Nest predation and nest-site selection of a western population of the Hermit
Thrush Condor 90: 51-7.
Martin, T. E., Scott, J., and Menge, C. 2000b. Nest predation increase with parental activity: separating nest
site and parental activity effects. Proc. R. Soc. Land. B 267: 1-6.
Marzluff, J. M. 1988. Do Pinyon Jays alter nest placement based on prior experience? Anim. Behav. 36: 1-10.
Matsuoka S. M., Handel, C.M., Roby, D. D. & Thomas, D. L. 1997. The relative importance of nesting and
foraging sites in selection of breeding territories by Townsend's Warblers. Auk 114:657-667.
Matthews, W. S., van Wyk, A. E. and Bredenkamp, G. 1. 1993. Endemic flora of the north-eastern Transvaal
escarpment, South Africa. Biological Conservation 63: 83-94.
Mayfield, H. F. 1961. Nesting success calculated from exposure. Wi/son Bull. 73: 255-261.
Mayfield, H. F. 1975. Suggestions for calculated nesting success. Wi/son Bull. 87: 456466.
McNaughton, S. J. 1986. Grazing lawns: On domesticated and wild grazers. Am. Nat. 128: 937-939.
Medin, D. E., and Clary, W. P. 1990. Birds and small mammal populations in a grazed and ungrazed riparian
habitat in Idaho. US Department of Agriculture Research Paper !NT 425: 1-9.
Mentis, M. T. 1981. The effects of scale of burn on the densities of grassland francolins in the Natal Drakensberg.
Bioi. Conserv. 21: 247-261.
Milchunas, D. G., O. E. Sala, and W. K. Lauenroth. 1988. A generalized model of the effects of grazing by
large herbivores on grassland community structure. Am. Nat. 132: 87-106.
143
Univers
ity of
Cap
e Tow
n

Maller A. P. 1989. Nest predation selects for small nest size in the blackbird. Oikos 57: 237-240.
Maller, A. P. 1988. Nest predation and nest site choice in passerine birds in habitat patches of different size: a
study of Magpies and blackbirds. Oikos 53: 215-221.
Morris, M.G. 1967. Differences between the invertebrate fauna of grazed and ungrazed chalk grassland. 1.
Responses of some phytophagous insects to cessation of grazing. J. Appl. Ecol. 4: 459-474.
Morton, M. L., K. W. Sockman, and L. E. Peterson. 1993. Nest predation in the mountain White-crowned
Sparrow. Condor 95: 72-82.
Muchai, M., Lens, L. and Bennun, L. 2002. Habitat selection and conservation of Sharpe's Longclaw
(Macronyx sharpei), a threatened Kenyan grassland endemic. Bioi. Conserv. 105: 271-277.
Murphy, M. T. I 983.Nest success and nesting habits of Eastern Kingbirds and other fly catchers. Condor 85:
208-219.
Murphy, M. T. 2000. Evolution of clutch size in the Eastern Kingbird: test of alternative hypotheses. £Co.
Monogr. 70: 1-20.
Norment, C. 1993. Nest-site characteristics and nest predation in Harris' Sparrows and White-crowned
Sparrows in the Northwest territories, Canada. Auk 110: 769-777.
O'Connor, T. G., and Bredenkamp, G. 1. 1997. Grasslands. In Cowling, R. M., Richardson, D. M. and Pierie,
S.M. (eds.). Vegetation of Southern Africa. Cambridge, Cambridge University Press. Pp 615.
Omland, K. E. Parental care of two age classes of male American Redstart: implication for female mate
choice Condor 96: 606-613.
Oniki, Y. 1985. Why Robin eggs are blue and build nests: statistical tests for Amazonian birds. Omithol.
Monogr. 36: 536-545.
Ot5, 1., Murumagi, A., and Horak, P. 1998. Haematological health state indices of reproducing great Tits:
methodology and sources of natural variation. Funct. £Col. 12: 700-707.
Owen-Smith, N., and Dankwerts, 1. E. 1997. Herbivory. In: Cowling, R.M., Richardson, D. M. and Pi erie, S.
M. (eds.). Vegetation of Southern Africa. Cambridge: Cambridge University Press. Pp 615.
Perrins, C. M. 1965. Population fluctuations and clutch size in the great Tit, Parus major L. J. Anim. Ecol.
38: 601-647.
Petersen, W. Newberry, R., and Jacobsenn, N. 1985. Cordylus giganteus is alive and well and living at
Rietpoort. Fauna and Flora 42: 26-29.
Peterson, M. P., and Best, L. B. 1985. Nest-site selection by sage Sparrows. Condor 87: 217-221.
Pickett, S. T. A., and White, P. S. (eds.) 1985. -The ecology of natural disturbance and patch dynamics.
Academic Press. New York.
Pimm, S. L., H. L. Jones, and J. diamond. 1988. On the risk of extinction. Am. Nat. 132: 757-785.
Preston-Whyte and Tyson, D. 1988. The atmosphere and weather of South Africa. Oxford University press,
Cape Town. 375 pp.
Prince, PA, and Ricketts, C. 1981. Relationships between food supply and growth in albatrosses: an interspecies
chick fostering experiment. Ornis Snand. 12: 207-210.
Pringle, E. L. L., Henning, G. A., and Ball, J. B. 1994. Penninton butterflies of Southern Africa, 2nd edn. AD.
Donker, Johannesburg.
144
Univers
ity of
Cap
e Tow
n

Pulliam, H. R. 1988. Sources, sinks, and population regulation. Am. Nat. 132: 652-661.
Quinney, T. E. 1982. Growth, diet, and mortality nestling Great Blue Herons. Wilson Bull. 94: 571·577.
Redondo, T., and Castro, F. 1992. The increase in risk of predation with begging activity in broods of Magpies
Pica Pica. Ibis 134: 180-187.
Ricklefs, R. E. 1967. A graphical method of fitting equations to growth curves. Ecology 48: 978-983.
Ricklefs, R. E. 1969. An analysis of nesting mortality in birds. Smithson. Contrib. Zoo/. 9: 1-48.
Ricklefs, R. E. 2000. Lack, Skutch, and Moreau: The early development of life-history thinking Condor 102:
3·8.
Ricklefs, R. E., and Peters, S. 1981. Parental components of variance in growth rate and body size of nestling
European starlings (Stmus vulgaris) in eastern Pennsylvania. Auk 98: 39-48.
Ricklefs, R. E., Duffy, D. c., and Coulter, M. 1984. Weight gain of blue-footed booby chicks: an indicator of
marine resources. Omis Scand. 15: 162-166.
Robbins, C. S., Sauer, 1. R., Greenberg, R. and Droege, S. 1989. Population declines in North American birds
that migrate to the Neotropics. Proc. Nat. Acad. Sci. USA. 86: 7658-7662.
Rodrigues, R. \994. Microhabitat variables influencing nest-site selection by tundra birds. Ecol. Appl. 4: 110-
116.
Roff, D. A. 1992. The evolution of life histories; Theory and analysis. Routeledge, Chapman and Hall, Inc.
Rondenhouse, N. L. 1986. Food limitation for forest passerines: Effects of natural and experimental food
reductions. Ph.D. Dissertation. Dartmouth College, Hanover. New Hemisphere.
Rondenhouse, N. L., and Holmes, R.T. 1992. Results of experimental and natural food reduction for breeding
Black-throated Blue Warblers. Ecology 73: 357-372.
Roper, 1.1. and Goldstein, R. R. 1997. A test of the Skutch hypothesis: does activity at nests increase nest
predation risk? 1. Avian Bioi. 28: 111-116.
Rosenzweig, M. L. 1991. Habitat selection and population interactions: the search for mechanism. Am. Nat.
137: S4-S28.
Ruiz, x., lover, L., Pedrocchi, V., Oro, D., and Gonzalez-Solis, l. 2000. How costly is clutch formation in
the Audouin's Gull Larus audouinii? 1. Avian Bioi. 31: 567-575.
Saab, V. A., Bock, C. E., Rich, T. D. and Dobkin, D. S. 1995. Livestock grazing effects in western North
America, p. 311-353. In Martin, T. E. and Finch, D. M. (eds.). Ecology and management of
Neotropical migratory birds. Oxford Univ. Press, New York.
Scharfetter, H. 1987. Timber resources and needs in southern Africa. S. Afr.1. Sci. 83: 256-259.
Schluter D. and Smith l. N. 1986. Genetic and phenotypic correlations in a natural popUlation of Song
Sparrows. Bioi. J. Linn. Soc. 29: 23-36.
Schluter, D. 1988. Estimating the form of natural selection on a quantitative trait. Evolution 42: 849-861.
Scott, L., Anderson, H. M., and Anderson, 1. M. 1997. Vegetation history. In: Cowling, R. M., Richardson, D.
M. and Pierie, S. M (eds). Vegetation of Southern Africa. Cambridge: Cambridge University Press.
Pp 615.
Siegfried, W. R. 1989. Man's role in changing the face of South Africa. In: Huntley, B. 1. 1989 (eds.). Biotic
diversity in South Africa. Pp 5 I -77). Oxford Univ. Press.
145
Univers
ity of
Cap
e Tow
n

Siegfried, W. R. 1992. Conservation status of the South African endemic avifauna. S. Afr. J. Wildl. Res. 22: 61-64.
Sieving, K. E., and Wilson, M. F. 1998. Nest predation and avian species diversity in northwestern forest
understory. Ecology 79: 2391-2402.
Skutch, A. F. 1949. Do tropical birds rear as many young as they can nourish? Ibis 91: 430-455.
Skutch, A. F. 1976. Parent birds and their young. University of Texas Press, Austin.
Slagsvold, T. 1982. Clutch size variation in passerine birds: the nest predation hypothesis. Oecologia 54:
159-169.
Sockal, R. R. and Rohlf, F. J. 1995. Biometry. 3n1 edition. W.H. Freeman, San Francisco.
StatSoft, Inc. 2000. STATISTICAfor windows. Tulsa, OK: StatSoft, Inc.
Stearns, S. C. 1992. The evolution of life histories. Oxford University Press, Oxford, UK.
Stokes, D. L. and Boersma, P. D. 1998. Effects of nesting substrate on the distribution of Magellan penguin
(Speniscus magellanicus) burrows. Auk 108: 922-933.
Stuart-Hill, G. C. and Mentis, M. T. 1982. Coevolution of African grasses and large herbivores. Proceeding
of the Grasslands Society of South Africa. 17: 122-128.
Tainton, N. M. 1981. Veld burning. In Taiton N. M. (ed.). Veld and pasture management in South Africa. Pp.
395-399. Shuter and Shooter in association with the University of Natal Press.
Tarboton, W. 1997a. South Africa's Grasslands. The cinderella blame. Africa - Birds & Birding 2: 57-60.
Tarboton, W. 1997b. Wither Grasslands? Africa Birds & Birding 2: 49-53.
Titus, K., J. A. Mosher, and B. K. Williams. 1984. Chance-corrected classification for use in discriminant
analysis: Ecological applications. AM. Midi. Nat. Ill: 1-7.
Tyson, D. Kruger, F. J. and Louw, C. W. 1988. Atmospheric pollution and its implication in the eastern
Transvaal Highveld. South African National Scientific Programmes Report 150: CSIR, Pretoria. III
pp.
Van de Koppel, J., Rietkerk, M., and Weissing, F. J. 1997. Catastrophic vegetation shifts and soils
degradation in terrestrial grazing systems. Trends Ecol. Evol. 12: 353-357.
Van Horne, B. 1983. Density as a misleading indicator of habitat quality. J. Wildl. Manage. 47: 893-901.
Vitousek, P. M., and Hooper, D. U. 1993. Biological diversity and terrestrial ecosystem biochemistry. In:
Schulze, E. D. and Mooney, H. A. (eds.). Biodiversity and ecosystem function. Springer-Verlas,
Berlin, pp. 3-14.
von Bromssen, A., and C. Janssen. 1980. Effects of food addition to Willow Tit and Crested Tit at the time of
breeding. Omis Scand. 11: 173-178.
Wade, D. D., and J. Lundsford. 1990. Fire as a forest management tool: prescribed burning in the Southern
United States. Unasylva 41: 28-38.
Walsenberg, G. E. 1985. PhYSiological consequences of microhabitat. Pp. 389-413. In: Cody, M. L, (ed.).
Habitat selection in birds. Academic Press, Orlando, Florida.
Weathers, W. W., and Sullivan K. A. 1989. Nest attentiveness and egg temperature in the Yellow-eyed
Junco. Condor 91: 628-633.
Westmoreland, D. and Best, L. B. 1985. The effect of disturbance on Mourning Dove nesting success. Auk
102: 774-780.
146
Univers
ity of
Cap
e Tow
n

Wiens, 1. A. 1969. An approach to the study of ecological relationships among grassland birds. Ornithol.
Monogr. 8: 1-93.
Wiens,1. A. 1989. The ecology o/bird communities. Vol. 2: Process and variations. Cambridge University
Press, Cambridge.
Wiens, J. A., and Rotenberry, J. T. 1981. Habitat associations and community structure of birds in
shrubsteppe environments. Eco. Monogr. 51: 21-41.
Wiggins, D. A. 1990. Food availability, growth, and heritability of body size in nestling tree swallows
(Taehycineta bieolor). Can. J. Zool. 68: 1292-1296.
Wilcove, D. S. 1985. nest predation in forest tracts and the decline of migratory songbirds. Ecology 66: 1211-
1214
Williams B. K. 1983. Some observations on the use of discriminant analysis in ecology. Ecology 64:
1283: 1291.
Wilson, P. N., and Osbourn, D. F. 1960. Compensatory growth after undernutrition in mammals and birds.
Bioi. Rev. 35: 324-363.
Wright, H. A., and A. W. Bailey. 1982. Fire ecology. John Wiley and Sons, New York.
Yahner, R. H. and C. G. Mahan. 1996. Effects of egg type on depredation of artificial ground nests. Wi/son
Bull. 108: 129·136.
Yanes, M., and Suarez, F. 1995. Nest predation patterns in ground-nesting passerines on the Iberian
Peninsula. Ecography 18: 423-428.
Yorio, P., and P.D Boesma 1994. Consequences of nest desertion and attendance for Magellanic Penguin
hatching success. Auk Ill: 215-218.
Zar,1. H. (1984). Biostastieal analysis. Second ed. Prentice-Hall Inc. Enslewood Cliffs, New Jersey.
Zimmerman,1. L. 1993. The birds o/Konza. University Press of Kansas. Lawrence, K. S.
Zimmerman, J.L. 1992. Density-independent factors affecting the avian diversity of the tallgrass prairie.
Wilson Bull. 104: 85-94.
147
Univers
ity of
Cap
e Tow
n

148
Univers
ity of
Cap
e Tow
n

Appendix A
Observer visitation to nests does not affect risk of nest predation in grassland system
Abstract
Estimates of nesting success are vital in studies of avian popUlations. To estimate nesting
success, observers usually visit nests periodically to monitor nest contents. Regular visits to
nests by observers can affect (increase or reduce) nesting success, particularly predation
rates, which may yield biased and misleading conclusions regarding population viability. I
examined whether regular researcher visits to the nests affected nest predation for eight
grassland bird species breeding in high altitude grasslands of Wakkerstroom, South Africa.
I found that investigator visit to the nests and visitation schedule did not affect nesting.
This suggests that observers did not provide predators with cues for finding nests, and that
frequent visits to nests have no cumulative effect on the probability of nest predation.
INTRODUCTION
Estimates of nesting success are important for the study of avian population dynamics,
particularly for grassland birds, which usually suffer high levels of nest predation (Chapter
2). To determine nesting success, observers usually visit nests periodically to monitor nest
contents (Mayfield 1961, 1975). The disturbance associated with regular nest visit by
observers may positively or negatively affect the success of a sample of nests under
observation (Bart and Robson 1982, Major 1990, Gotmark 1992, Mayer-Goss et al. 1997,
Lloyd 1998, Rotella et al. 2000). This can be manifested through the following: (1)
predator following or being repelled by the observers scent and tracks to a nest (Bowen et
al. 1976, Mayer-Goss et al. 1997); (2) displaced parents leaving the nest unattended
(Westmoreland and Best 1985); and (3) attraction of predators to the nest either by the
presence of an observer, or by the accompanied distraction and alarm behaviour of the
displaced parents (Gotmark et al., 1990, 1992), or by nest re-Iocation markers (Greenwood
and Surge ant 1985). According to Rotella et al. (2000), estimates of nesting success can be
strongly affected by even small observer effects, and may yield biased and misleading
conclusions about variables under examination and inferences regarding population
viability. Here, I test the hypothesis that visits to the nests by observers affect (increase or
reduce) predation rates in my study.
149
Univers
ity of
Cap
e Tow
n

Study species
My study focussed on eight ground-nesting grassland birds, viz. Yellow-breasted Pipit
Hemimacronyx (Anthus) chloris (YBP), Grassveld Pipit Anthus cinamomerous (GP),
Orange-throated Longclaw Macrony capensis (OTL), Ayres' Cisticola Cisticola ayressii
(AC), Long-tailed Widow Euplectes progne (L TW), Common Quail Coturnix coturnix
(CQ), and Quail Finch Ortygospiza atricollis (QF) and Rudd's Lark Heteromirafa ruddii
(RL), Red-capped Calandrella cinerea Lark (RCL).
METHODS
Study area
The study was conducted in the high altitude grasslands of Wakkerstroom (centred at 270
10' S, 300 06' E) in Mpumalanga province, South Africa from 1998-2001. These grasslands
are managed in three ways, viz. heavily grazed and annually burned (H+A), lightly grazed
and annually burned (L+A), and lightly grazed and biennially burned (L+B). Vegetation
varies considerably across management regimes with respect to floristics, vegetation cover,
density, and structural heterogeneity. Birds generally avoided H+A for breeding purposes. I
identified major predators through examining the nest and nest environs, examining the
remains, marks in artificial wax eggs, baited traps, video cameras and direct observation.
The main predators included snakes, foxes, mongooses, mice, shrews, and birds of prey
(appendix 1). In the absence of predator identity from video evidence, snakes were
identified as predators of natural nests when either of the following happened: crushed
shells were found near the nest, eggs or nestling disappeared one or two at a time, and a
dead nestling was found in or outside the nest with no apparent injury. Otherwise mammals
were assumed to be the predators if broken eggs shells were found, nests severely
damaged, tom out or removed, or there were bite marks on feathers.
Nest searches and monitoring
Study plots were searched for nests of all grassland bird species over the entire breeding
season (October to April) during each of the years between 1998 and 2001. Searching and
locating of nests was done by dragging a 50 m rope between two observers to flush out
birds from nests, or based on behavioural observation. Nest sites were marked (for
relocating) with a stick or stone placed 10 m away from each nest. Nests were monitored
150
Univers
ity of
Cap
e Tow
n

over intervals of 1-6 days (rechecking intervals). I grouped my data set into rechecking
interval lengths of I, 2, 3, 4, 5, and 6 days for each nest. I recorded number of nests
observed for each interval and the number of these observations that survived the interval. I
only used nests that were confirmed as either successfully fledged, or were confirmed lost
to predators for the purpose of analysis of observer effect. A total of 1202 nests were
monitored over the three breeding seasons from 1998 through 2001. For the purpose of this
chapter, I only used nests that were definitely exclusively lost to predation and those that
fledged successfully (1084 in total). These nests yielded survival data for a total of 3031
intervals of 1-6 days. These data only include intervals in which the nest was successful or
losses of nests were attributable to predators; losses due to other causes of mortality are not
included here.
DATA ANALYSIS
To examine the importance of observer effects on the nesting success of study species
across management, I used the maximum-likelihood estimator model (observer effect
model) that estimates observer effect on daily survival rate for sets of data with
observations from an array of rechecking or visitation-interval lengths (Rotella et al. 2000).
In this model the probability of surviving an interval of tJ days between observations is:
P(Oj = 1 It; = h *p Ii, where P is the probability that a nest survives natural mortality each
day; OJ is an indicator variable that takes on the value of 1 if the nest survives an interval,
and 0 otherwise; and h is the observer effect on the survival probability that occurs shortly
after a nest visit. Values of h ranges between h < 1 and h > 1. If h < 1, observer visitation
reduces risk of nest predation shortly after a nest visit. If h > I ,observer visitation increases
risk of nest predation shortly after a nest visit. h= 1 shows no observer effect.
RESULTS AND DISCUSSION
There was no observer effect in my study system. Nest visits did not affect nesting success
in all of the species. Observer effect model, h, was equal to 1.0 (h = 1) in each of the
species in L+B grassland (Table 1). Observer effect model, h, ranged between 0.78 to 1.03
in L+A grassland (Table 2).
These results suggest that the disturbance associated with regular nest visits by
observers in my study do not affect their outcome. Nest predation, the major cause of
nesting failure for many passerine birds, did not increase in response to researcher
151
Univers
ity of
Cap
e Tow
n

disturbance. Other studies have failed to detect any observer effect despite a widely held
belief that predators, particularly mammals, would pose great threat to nests visited by
researchers (see GOtmark 1992, Lloyd 1988). Although serious effort should be made not
to unnecessarily disturb nests, serious biases on fate of nests under observation are
unlikely, and general visits to the nests by researchers working in grasslands in South
Africa should not affect the validity of the information gathered.
152
Univers
ity of
Cap
e Tow
n

Table 1. The number of nests in each interval found surviving (Sj) and depredated (F) and
daily survival probability (P) and observer effect (h) of species in lightly grazed, but
annually burned areas as calculated following Rotella et al. method (2000). Values of h
ranges between h<l and h> 1. Values of h < 1 show that observer visitation reduces risk of
nest predation shortly after a nest visit. If h > 1, observer visitation increases risk of nest
predation shortly after a nest visit. Values of h = 1 shows no observer effect.
Species Intervall Interval Interval Interval Interval Interval Daily Observer 2 3 4 5 6 Survival Effect (h)
Probabili Species Sl Fl S2 F2 S3 F3 S4 F4 S5 F5 S6 F6 Ayre's Cisticola 81 6 120 II 162 19 76 16 34 3 44 6 0.983 0.942 Common Quail 4 I 7 3 8 2 7 1 5 I 1 1 1.000 0.781 Long-tailed Widow 31 I 96 8 65 10 38 9 12 6 15 3 0.945 1.028 Orange-throated Longclaw 91 7 121 14 83 18 49 6 15 4 18 6 0.963 0.961 Grassveld Pipit 146 4 201 16 216 33 132 25 60 13 71 14 0.958 1.009 Yellow-breasted Pipit 146 13 223 23 138 25 84 20 32 5 36 to 0.966 0.956
153
Univers
ity of
Cap
e Tow
n

Table 2. The number of nests in each interval found surviving (S;) and depredated (F;) and
daily survival probability (P) and observer effect (h) of species in lightly grazed, but
biennially burned areas as calculated following Rotella et al. method (2000). Values of h
ranges between h<l and h> 1. Values of h < 1 show that observer visitation reduces risk of
nest predation shortly after a nest visit. If h >1, observer visitation increases risk of nest
predation shortly after a nest visit. Values of h = 1 shows no observer effect.
Species Interval Interval Interval Interval Interval Interval Daily Observer 1 2 3 4 5 6 Survival Effect (h)
Probabilit SI Fl S2 F2 S3 F3 S4 F4 S5 F5 S6 F6
Ayre's Cisticola 20 46 2 21 I 28 4 31 3 24 1 0.991 0.964 Long-tailed Widow 33 86 9 72 6 56 6 37 5 57 7 0.987 0.950 Orange-throated Longclaw 33 82 5 79 4 57 6 28 2 38 4 0.987 0.976 Quail Finch 3 22 1 13 23 2 8 2 6 2 0.978 0.962 Grassveld Pipit 70 139 9 84 13 70 2 42 7 31 2 0.981 0.983 Yellow-breasted Pipit 45 105 6 86 5 47 4 40 I 22 2 0.993 0.967
154
Univers
ity of
Cap
e Tow
n

REFERENCE Bart, 1., and Robson, D. S. 1982. Estimating survivorship when the subjects are visited periodically. Ecology
63: 1078-1090.
Bowen, D. E., R. J. Robel, and P. G. Watt. 1976. Habitat and investigators influence artificial ground nest
losses: Kansas. Trans. Kansas Acad. Sci. 79: 141-147.
G6tmark, F. 1992. The effect of investigator disturbance on nesting birds. Curro Ornithol. 9:63-104.
G6tmark, F., Neegard, R., and Ahlund, M. 1990. Predation of artificial and real Arctic Loon nests in Sweden.
J. Wildl. Manage. 54: 429-432.
Greenwood, R. J, and sergeant, A. B. 1995. Effects of a commonly-used nest marker on nest success of ducks
in prairie Canada. Can. Field Natur. 109: 437-440.
Lloyd, P. 1998. A study of the ecology of the Namaqua sandgrouse and other arid-zone birds. Ph.D.
dissertation, University of Cape Town, South Africa.
Major, R. E. 1990. The effect of human observers on the intensity of nest predation. Ibis 132: 608-612.
Meyer-Gross, H., Crick, H.Q., and Greenwood, 1.1.0. 1997. The effect of observers visiting the nests of
passerines: an experimental study. Bird study 44: 53-65.
Rotella, J. J., Taper, M. L., and Hansen, A. 1. 2000. Correcting nesting-success estimates for observer effects:
maximum-likelihood estimates of daily survival rates with reduced bias. Auk. 117: 92-109.
Westmoreland, D. and Best, L. B. 1985. The effect of disturbance on Mourning Dove nesting success. Auk
102: 774-780.
155
Univers
ity of
Cap
e Tow
n

Appendix 1
Major potential nest predators identified (marked with asterisk*) and or found in and around the study area.
Mammals
Least dwarf shrew Suncus injinitesimus,
Greater Musk Shrew Crociduraflavescens,
*Rock Elephant Shrew Elephantulus myurus,
Lesser Savanna Doonnouse Graphiurus parvus,
Sloggett's Rat Otomys sloggetti,
*Striped Mouse Rhabdomys pumilio,
House Mouse Mus musculus,
Natal Multimammate Mouse Astomys natalensis,
Highveld Gerbille Atera brantsii,
White-tailed Mouse Mystromys albicaudatus,
Grey Climbing Mouse Dendromus melanotis,
Aardwolf Proteles cristatus.
Caracal Felis caracal,
African Wild Cat Felis lybica,
Serval Felis serval,
*Cape Fox Vulpes chama,
*Black-backed Jackal Canis mesomelas,
African Weasel Poecilogale albinucha,
Striped Polecat Ictonys striatus,
Small-spotted Genet Genetta genetta,
Large-spotted Genet Genetta tigrina,
*Suricate Suricata suricatta,
*Yellow Mongoose Cynictis penicillata,
Slender Mongoose Galerella sanguinea,
White-tailed Mongoose Ichneumia albicauda,
Snakes
Natal Purple-glossed Snake Amblyodipsas
con color,
Common Purple-glossed Snake Amblyodipsas
polylepis,
Brown House Snake* Lamprophis /uliginosus,
Olive House snake Lamprophis inornatus,
Spotted House Snake L/amprophis guttatus,
Aurora House Snake Lamprophis aurora,
Yellow-bellied House snake Lamprophis/uscus,
156
Cape Wolf Snake Lycophidion capense,
Variegated Wolf Snake Lycophidion variegatum,
Cape File Snake Mehelya capensis,
Mole Snake Pseudaspis cana,
Many-spotted Snake Amplorhinus
multimaculatus,
*Rhombic Skaapsteker, Psammophylax
rhombeatus,
Striped Skaapsteker Psammophylax tritaeniatus,
Short-snouted Grass Snake Psammophis
brevirostris ,
*Snout Grass Snake,
*Montane Grass Snake,
*Olive Grass Snake,
Sross-marked Grass Snake Psammophis crucifer,
*Rhombic Egg Eater Dasypeltis scabra,
Southern Brown Egg Eater Dasypeltis inornata,
Red-lipped Snake (herlad) Crotophopeltis
hotamboeia,
Booms\ang Dispho/idus typus,
Spotted Harlequin Snake Homoroselaps lacteus,
Striped Harlequin Snake Homoroselaps dorsalis,
Sundevall's Garter Snake Elapsoidea sunderwalli,
Mozambique Spitting Cobra Naja mossambica,
*Rinkhals Hemachatus haemachatus,
Rhombic Night Adder Causus rhombeatus,
*PufTadder Bitis arietans,
Berg Adder Bitis atropos,
Birds
* Fiscal ShrikeLanius collaris,
*Staneley's Bustand Neotis denhami,
*Red-cheasted Sparrow Hawk Accipiter
rufiventris,
Univers
ity of
Cap
e Tow
n