racial/ethnic inappropriate identification: are spp indicators making a difference? leadership for...
TRANSCRIPT

Racial/Ethnic Inappropriate Identification: Are SPP Indicators Making a Difference?
Leadership for Equity and Excellence Forum Sue Gamm, Esq.Public Consulting GroupMarch, 2011

Illinois State Board of Education 2
Context
SPP 9 & 10 Data
Monitoring Model
Failure to Identify

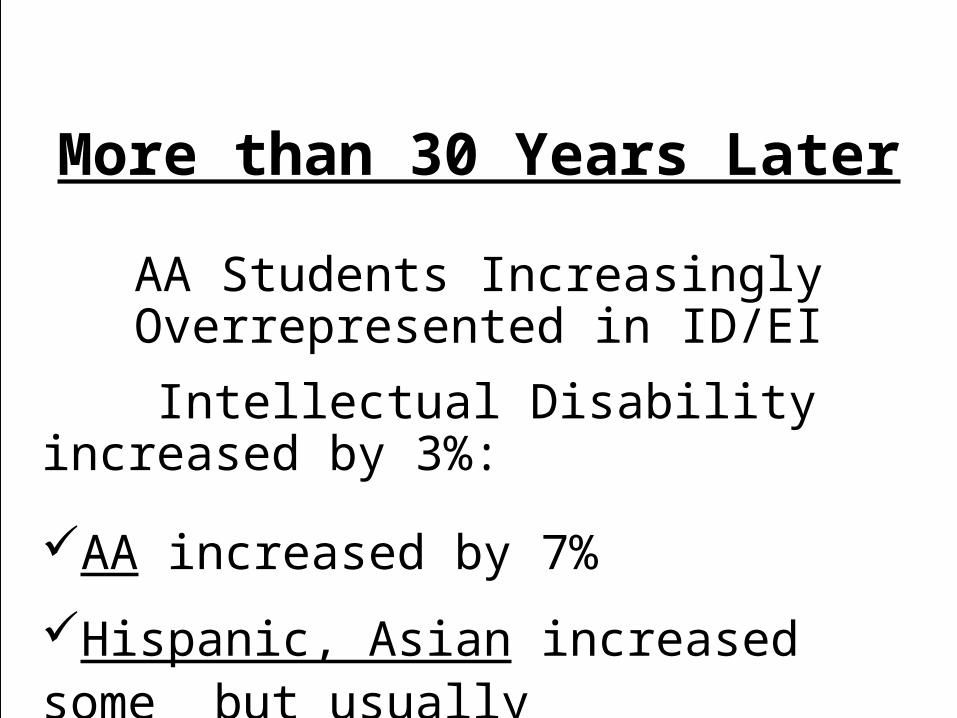
More than 30 Years Later
AA Students Increasingly Overrepresented in ID/EI
Intellectual Disability increased by 3%:
AA increased by 7%
Hispanic, Asian increased some but usually underidentified
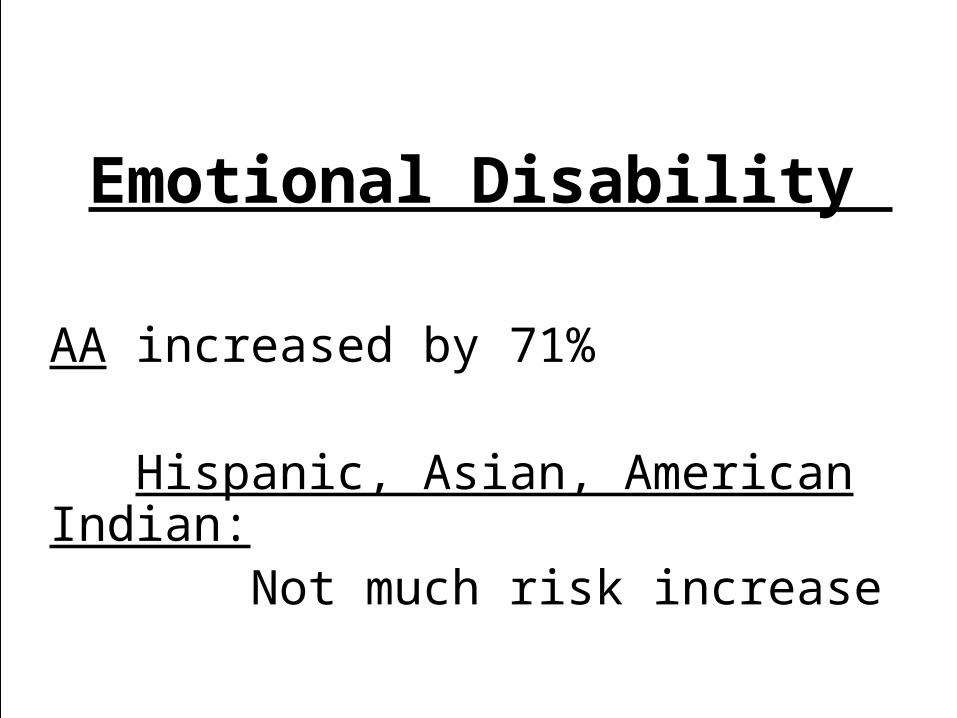
Emotional Disability
AA increased by 71% Hispanic, Asian, American Indian: Not much risk increase
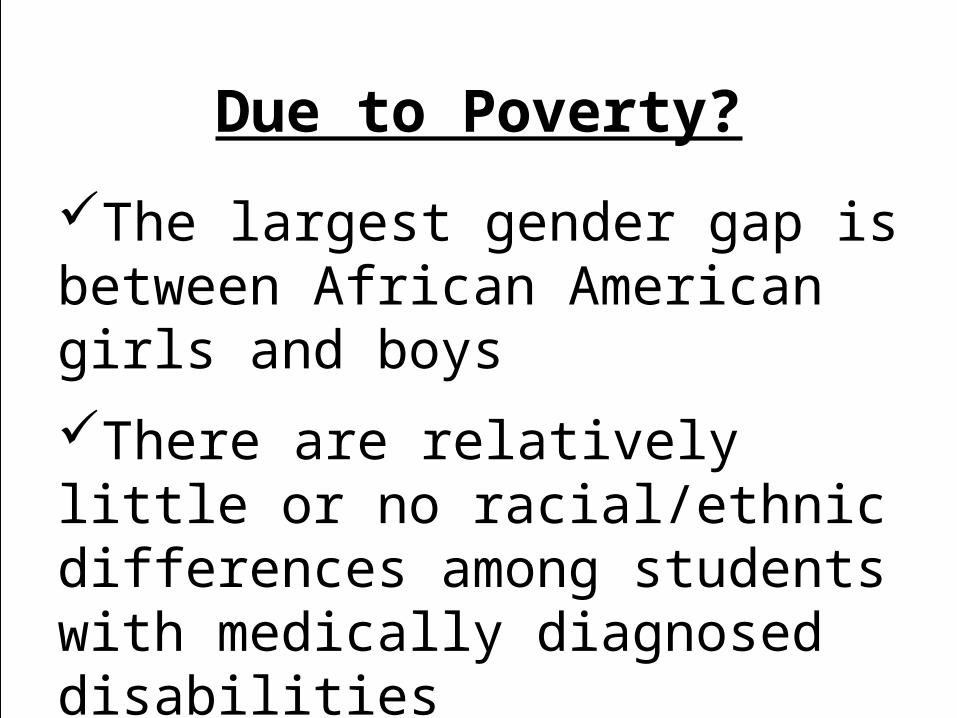
Due to Poverty?
The largest gender gap is between African American girls and boys
There are relatively little or no racial/ethnic differences among students with medically diagnosed disabilities

Early Access To Language?
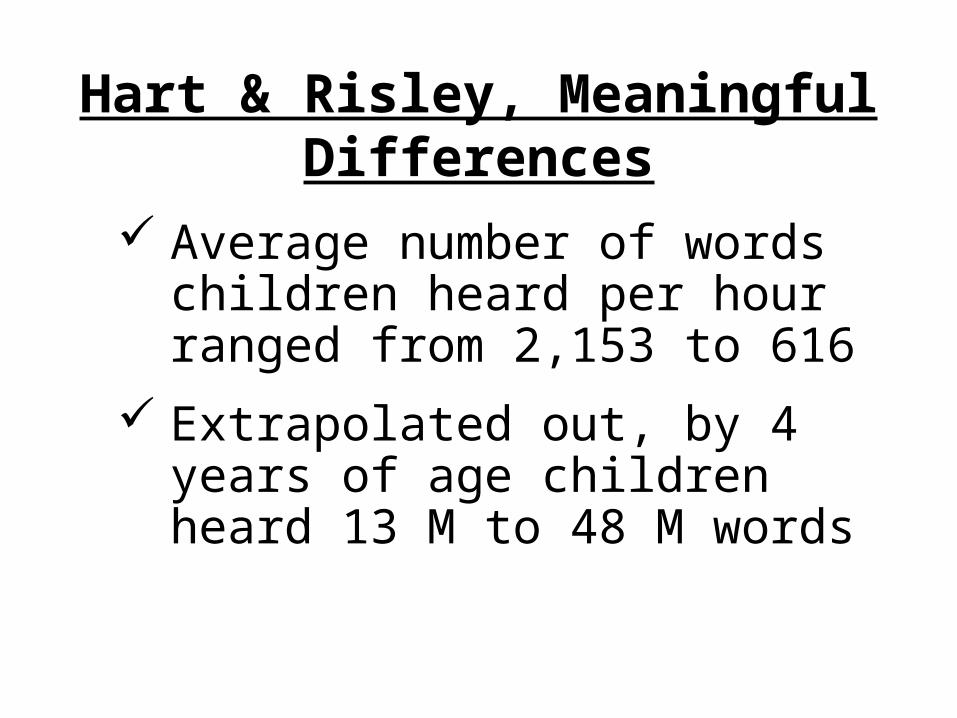
Hart & Risley, Meaningful Differences
Average number of words children heard per hour ranged from 2,153 to 616
Extrapolated out, by 4 years of age children heard 13 M to 48 M words
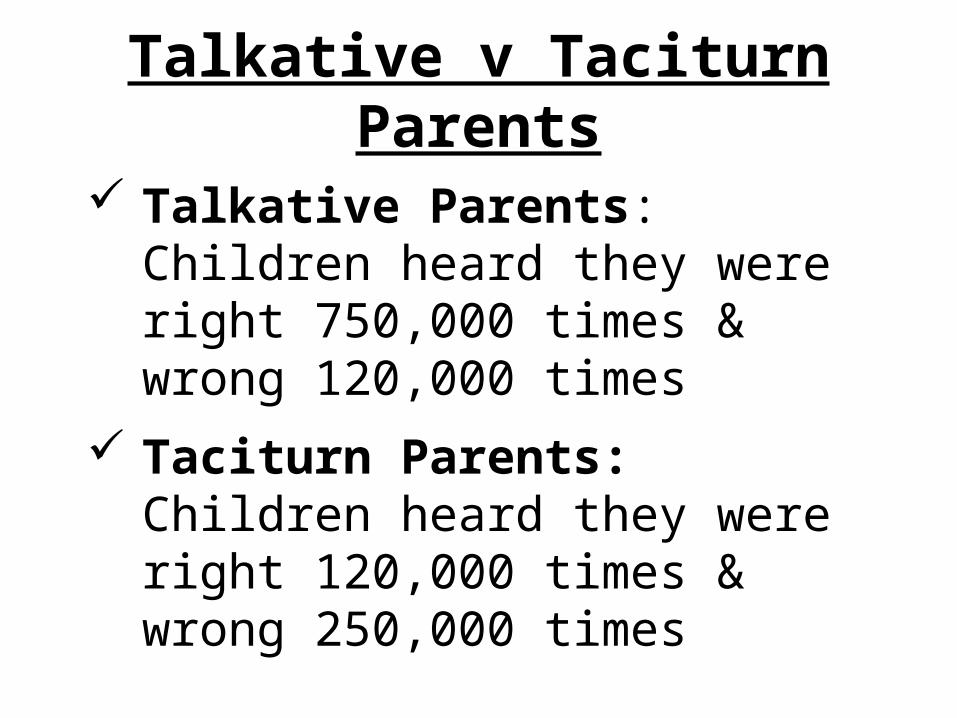
Talkative v Taciturn Parents
Talkative Parents: Children heard they were right 750,000 times & wrong 120,000 times
Taciturn Parents: Children heard they were right 120,000 times & wrong 250,000 times

Due to Academic Performance?
Most students are referred for IDEA evaluation because of academics and then behavior
AAs/Hispanics average NAEP scores are significantly lower than whites in reading, writing, math & science

Lessons from Research
In practice, it can be difficult to
distinguish internal child traits that require the ongoing support of special education from
inadequate opportunity or contextual support for learning behavior.
Many children are “instructional casualties” of failed or poor
reading instruction.
2000 National Reading Panel
Reading deficits often reflect an inadequate opportunity to learn & correlated sped referral rates for mild disability areas reflect quality of instruction.
Reading failure rates as high as 38-40% can be reduced to ≤6% through early identification & multitiered intervention.
Minority Students in Gifted & Special Education (2001)

Disability
or
ABT?

Designing Change
IDEA Standards for Appropriate Instruction
1. Data showing prior to/part of
evaluation process, student is given:
Appropriate instruction in regular education settings
Delivered by qualified personnel

Reading essential components: phonemic awareness, phonics, fluency, vocabulary & comprehension (2001 ESEA)
Math essential components: conceptual understanding, procedural fluency, strategic competence, adaptive reasoning, & productive response (2001 National Research Council)
Appropriate Instruction
2. Documented Progress
Data-based documentation of repeated achievement assessments Reasonable intervals Reflecting formal assessment of
student progress during instruction Provided to parents
Reasonable intervals
Reflecting formal assessment of student progress during instruction
Provided to parents

Potential Eligibility

AA students 15 times more likely than white students to score below proficiency
One District: Reading
95 AA students not proficient compared to 15 white (15% to 1%)

Black students 20 times more likely than white students to score below proficiency
89 AA students not proficient compared to 11 white (14% to 1%)
Math
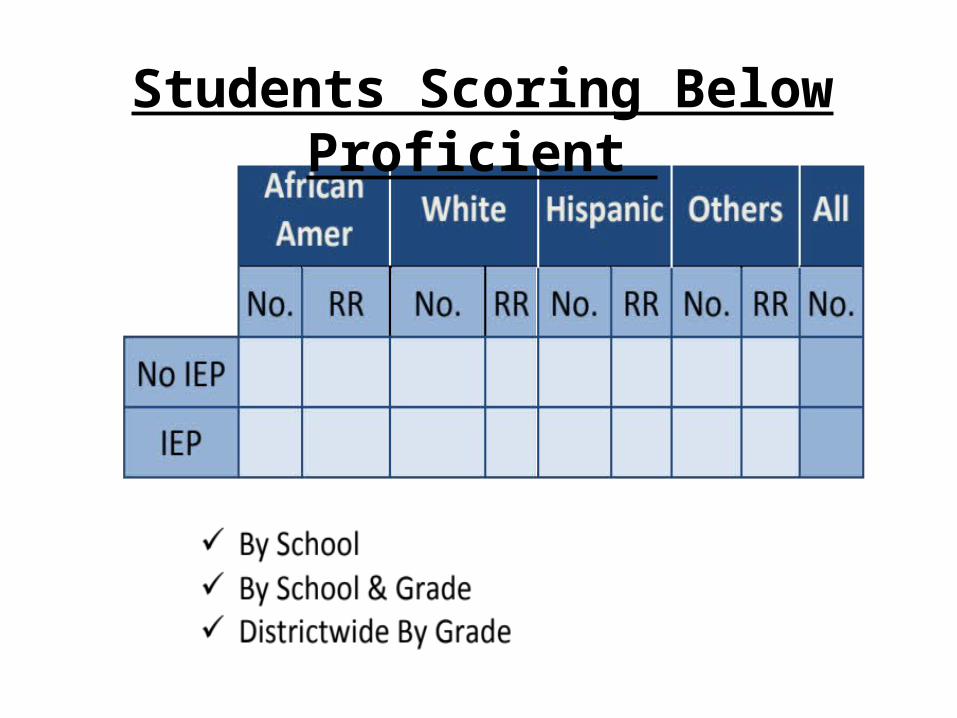
Students Scoring Below Proficient
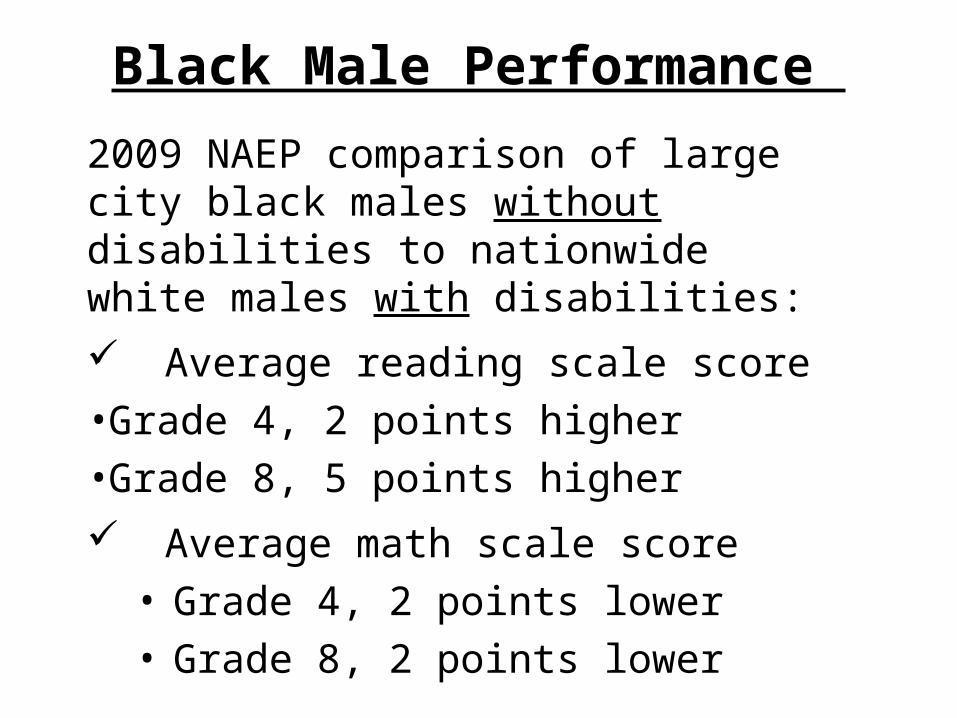
Black Male Performance
2009 NAEP comparison of large city black males without disabilities to nationwide white males with disabilities: Average reading scale score •Grade 4, 2 points higher •Grade 8, 5 points higher Average math scale score
• Grade 4, 2 points lower • Grade 8, 2 points lower

http://www.cgcs.org/publications/achievement.aspx

How Do You Know?
If poor performance or behavior is due to inadequate general education instruction & support or a disability?
Are there standards for knowing the difference?
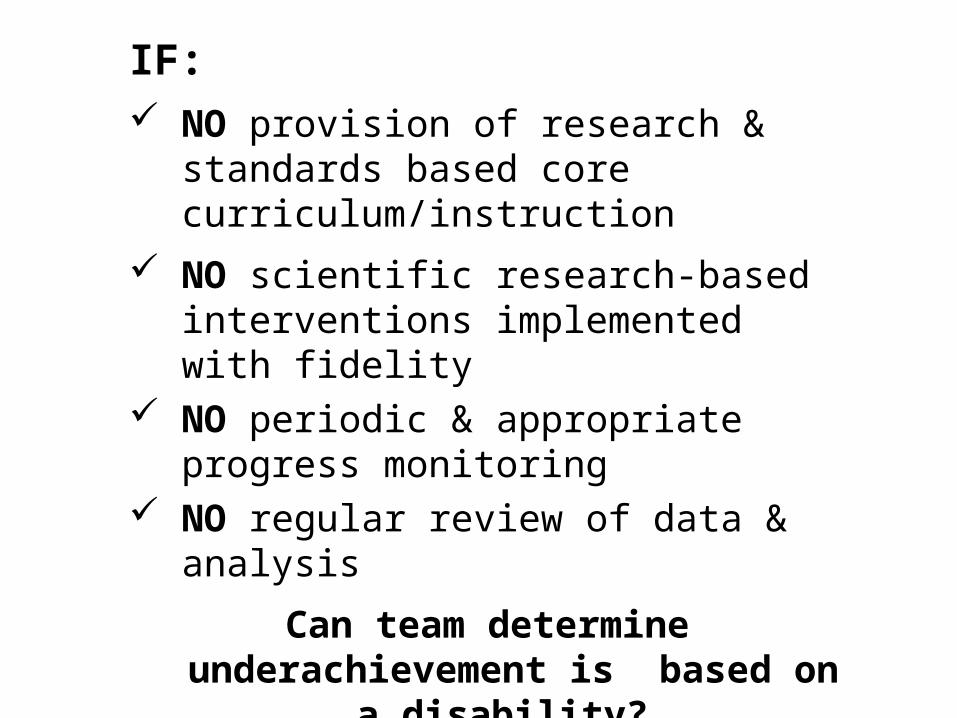
IF: NO provision of research & standards
based core curriculum/instruction NO scientific research-based
interventions implemented with fidelity
NO periodic & appropriate progress monitoring
NO regular review of data & analysis
Can team determine underachievement is based on a disability?

Must Initiate LD Evaluation When:
No adequate progress
Appropriate period of time
Provided appropriate instruction
Progress monitored

Looking at the Data
Data Accountability CenterDec. 2010
SY 2008-2009 Data
29
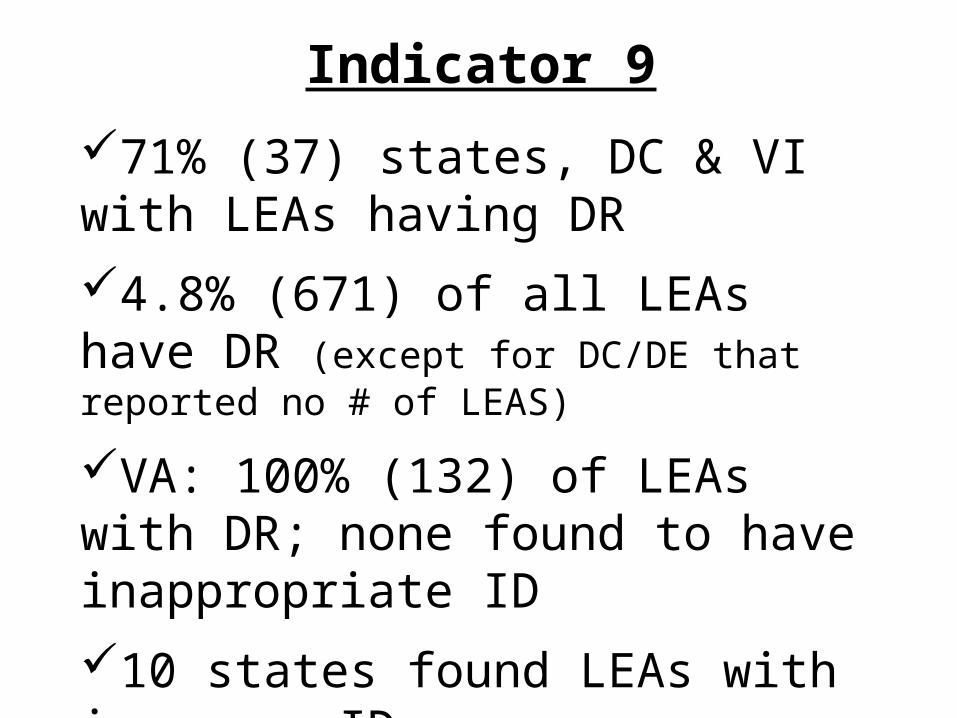
Indicator 9
71% (37) states, DC & VI with LEAs having DR4.8% (671) of all LEAs have DR (except for DC/DE that reported no # of LEAS)
VA: 100% (132) of LEAs with DR; none found to have inappropriate ID10 states found LEAs with inapprop ID.5% (68) LEAs have innapprop ID

Indicator 9: Inappropriate ID

2005-6: 26 states
2006-7: 38 states
2007-8: 42 states
2008-9: 40 states
Number of States with NO Inappropriate ID
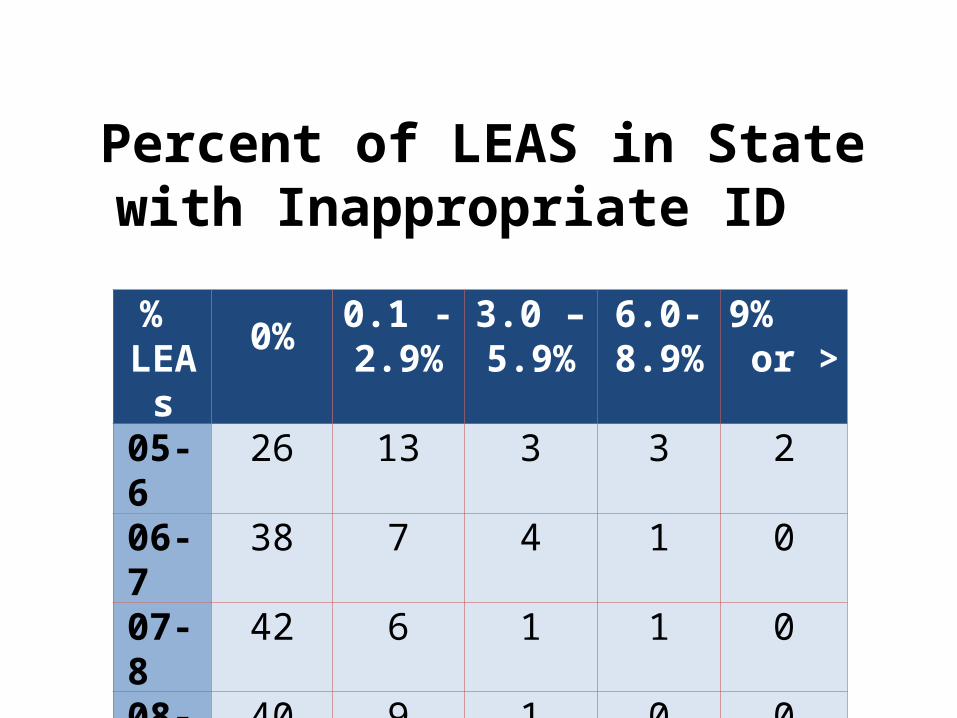
Percent of LEAS in State with Inappropriate ID
% LEAs 0% 0.1 -
2.9%3.0 –5.9%
6.0- 8.9%
9% or >
05-6 26 13 3 3 206-7 38 7 4 1 007-8 42 6 1 1 008-9 40 9 1 0 0

Indicator 10
83% (48) states, DC & VI with DR
9.8% (1379) of all LEAs (except for DC that reported no # of LEAS)
17 states found LEAs with inapprop ID
.8% (116 LEAs) with innapprop ID and 2.9% of all LEAs with DP
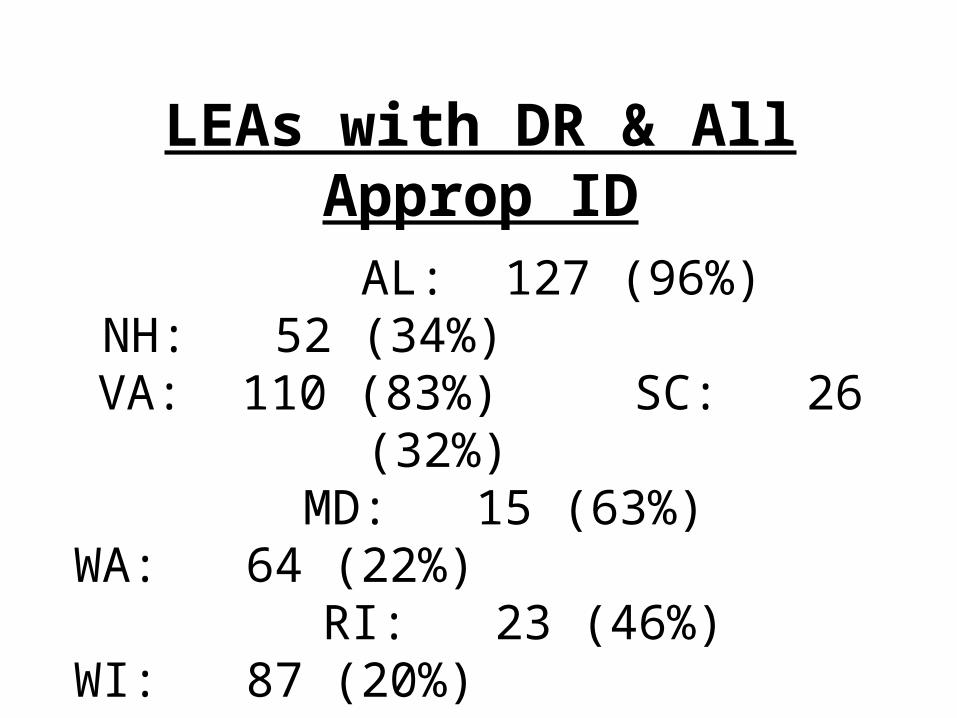
LEAs with DR & All Approp ID AL: 127 (96%) NH: 52 (34%)
VA: 110 (83%) SC: 26 (32%) MD: 15 (63%) WA: 64 (22%)
RI: 23 (46%) WI: 87 (20%)
LEAs with DR & 1 Inappropriate ID
LA: 55 (52%) CT: 38 (22%)

Indicator 9: Inappropriate ID

Percent of LEAS in State having Inappropriate ID
% LEAs 0% 0.1-
3.9%4.0- 7.9%
8.0- 11.9%
12% or >
05-6
21 11 3 6 4
06-7
27 13 3 3 2
07-8
34 12 1 1 1
08-9
33 11 5 0 1

Number of LEAs with DR having Inapprop ID
Oregon
Indicator 9: 47% (8) of 17 LEAs Indicator 10: 61% (11) of 18 LEAs
New Jersey
Indicator 9: 38% (9) of 24 LEAs Indicator 10: 50% (8) of 16 LEAs
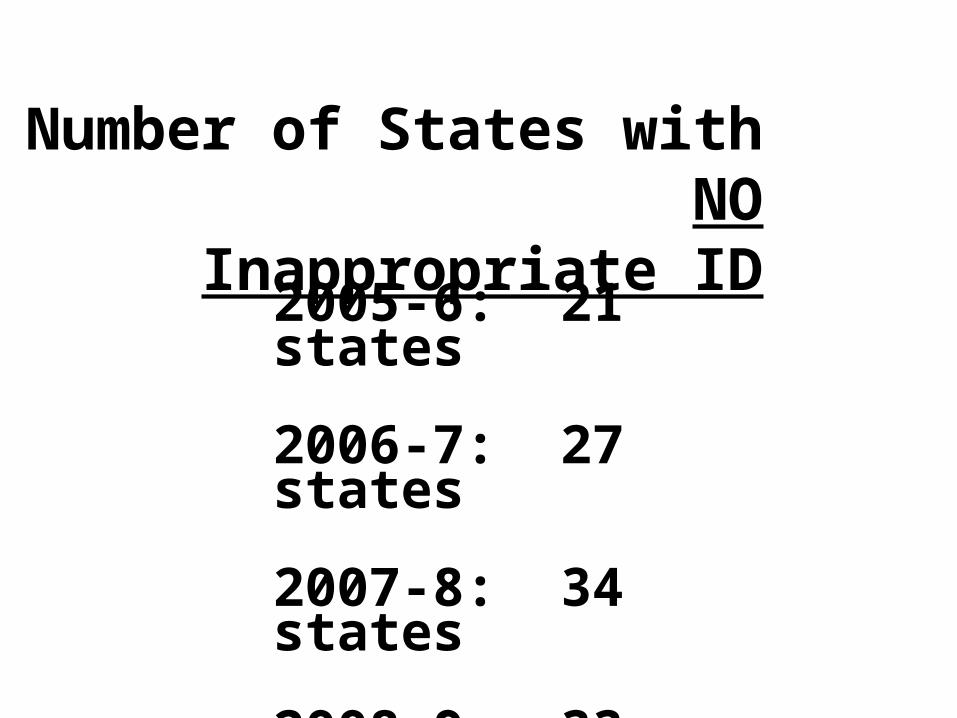
2005-6: 21 states
2006-7: 27 states
2007-8: 34 states
2008-9: 33 states
Number of States with NO Inappropriate ID

Celebration Time!!


For Discussion
Why do some states identify no LEAs - or a very small percentage of LEAs – with DR?
Compare: One state (VG) with all LEAs found to have DR.
What is at play when a large percentage of LEAs in a state are identified with DR but NONE or few are found to have inappropriate identification?
Compare: Only two states (OR & NJ) have a high percentage of LEAs with DR that are found to have inappropriate identification.
What has been the impact of Indicators 9 & 10? Has there been real progress?
Percent of states with no inappropriate ID (’06 to ‘09)
9: 26 to 40 10: - 6 to 33

Model for Monitoring forInappropriate Identification

http://www.shoplrp.com/product/p-300604.html

DecisionsFailure to Identify

Child Find Hearing Decision #1
Provided 504 accommodations, additional tutoring & Saturday tutoring camps
No positive academic benefits
Continued to struggle: reading, math & science
El Paso Indep. Sch. Dist. v. Richard R (W.D. Tx. 2008)
“Why [the district’s assistance team] would have suggested these measures, knowing that [the student] had undertaken each of these steps in the past three years and that none had helped him achieve passing [state test] scores, simply baffles this court.”

HO Decision #2
15 year-old student was retained twice and in 8th grade
Referred 3 times for evaluation; denied in 2nd & 8th grades
5th grade: team determined no LD because of lack of adequate instruction in reading and math
Chicago Public Schools, JF 2009-0318 (8/7/09)

HO Finding
No evidence to support conclusion that lack of inappropriate instruction caused poor performance
Student received same instruction as other students who were not failing.
Alternatively, it would be obvious that he needed different instruction, based on his lack of progress
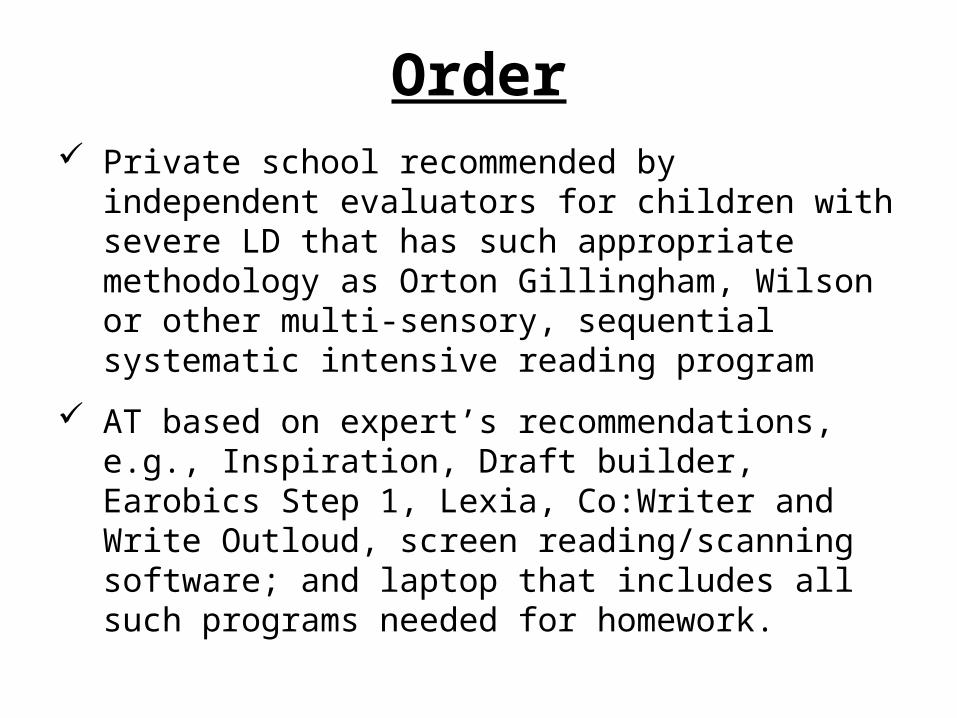
Order Private school recommended by independent
evaluators for children with severe LD that has such appropriate methodology as Orton Gillingham, Wilson or other multi-sensory, sequential systematic intensive reading program
AT based on expert’s recommendations, e.g., Inspiration, Draft builder, Earobics Step 1, Lexia, Co:Writer and Write Outloud, screen reading/scanning software; and laptop that includes all such programs needed for homework.
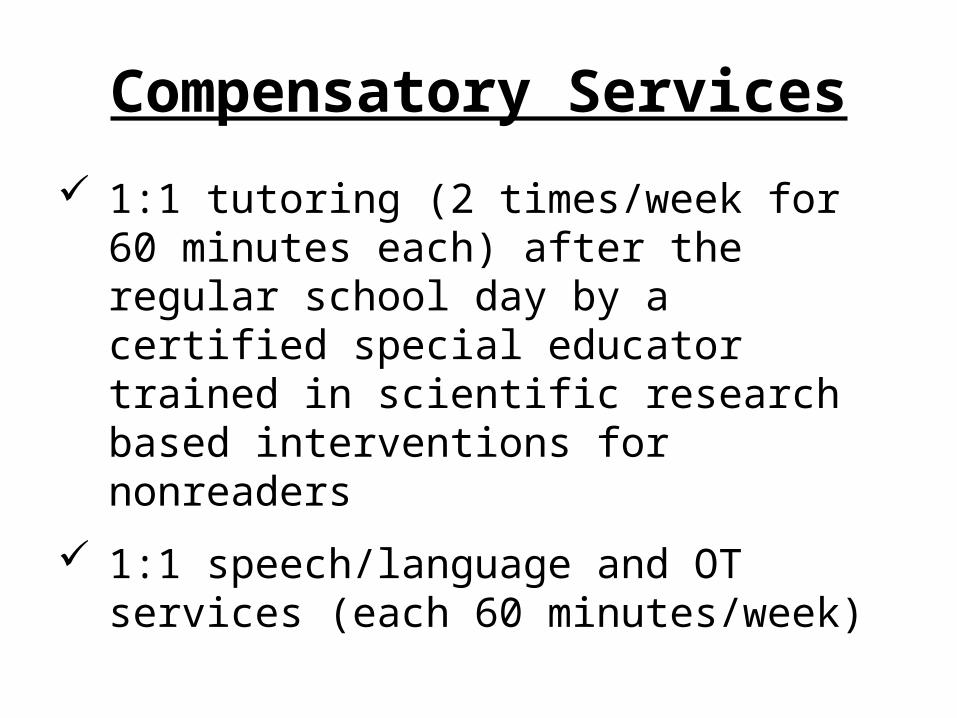
Compensatory Services
1:1 tutoring (2 times/week for 60 minutes each) after the regular school day by a certified special educator trained in scientific research based interventions for nonreaders
1:1 speech/language and OT services (each 60 minutes/week)

Sensible for LEAs to explore options in regular ed before determining need for special ed
Improved with interventionsPassed statewide assessment without accommodation
A.P. v Woodstock Bd of Ed (D. Conn
2008)
Court Approved Interventions

Class Action
Federal class action ruling: Milwaukee Public Schools violated child find (SEA failed to oversee)
Compensatory ordered for nonidentified students September, 2000 to June, 2005
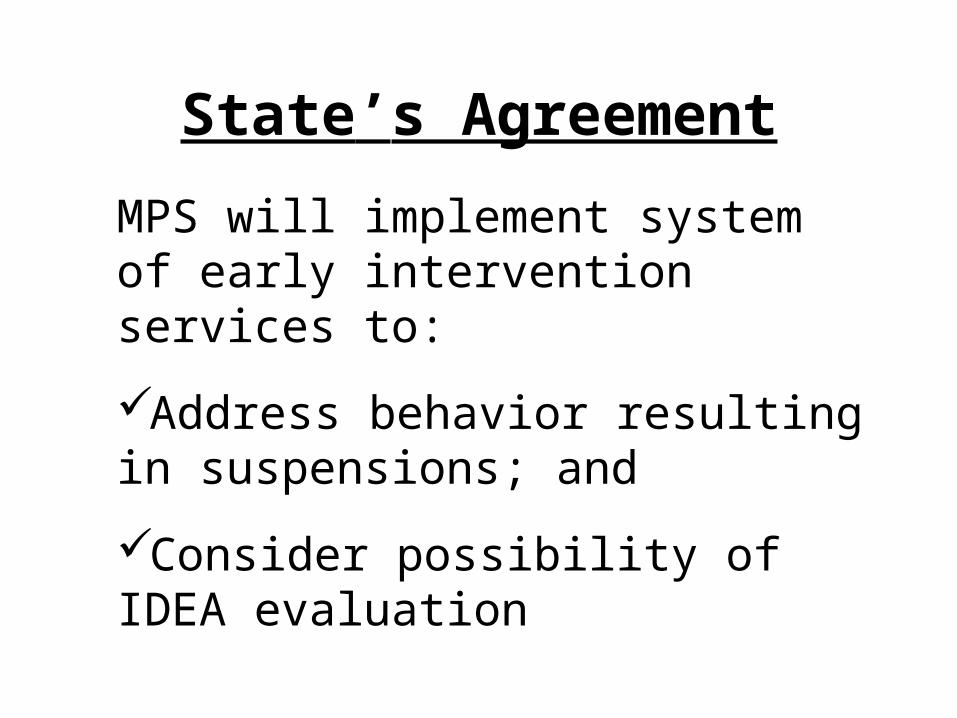
State’s Agreement
MPS will implement system of early intervention services to:
Address behavior resulting in suspensions; and
Consider possibility of IDEA evaluation

Monitoring Standard - Consider Referral for:
95% of students in k–5 suspended 10 or > or days
95% of students in 6–12 suspended 20 or > days

7th Circuit Stayed Order