radar informatics (with application to glaciology) jerome e. mitchell school of informatics and...
TRANSCRIPT
Radar Informatics (with application to glaciology)
Jerome E. MitchellSchool of Informatics and Computing
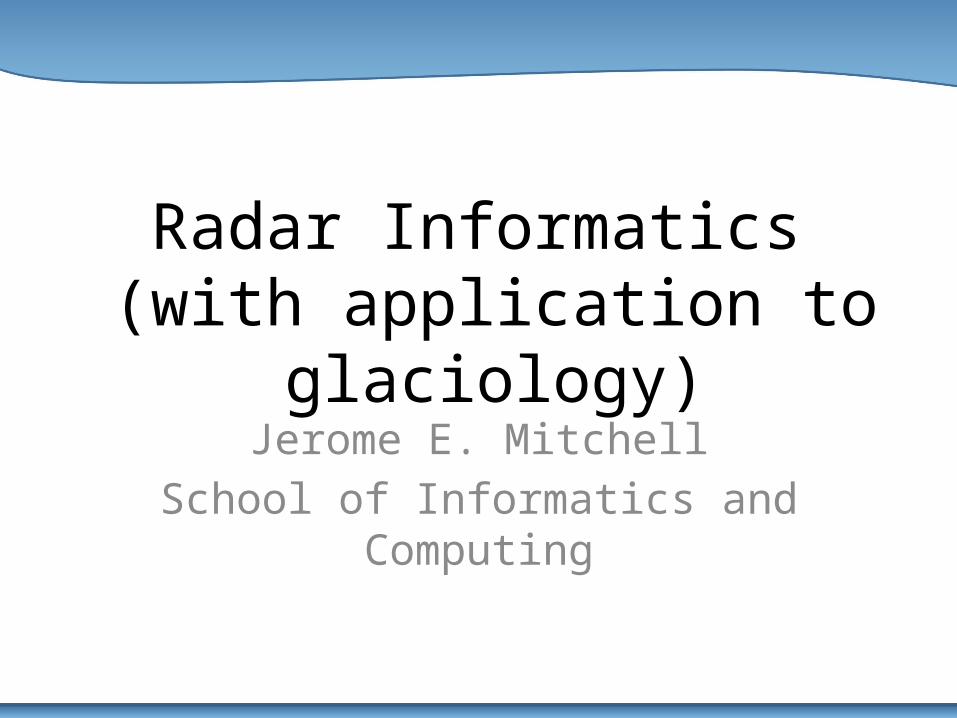
1992
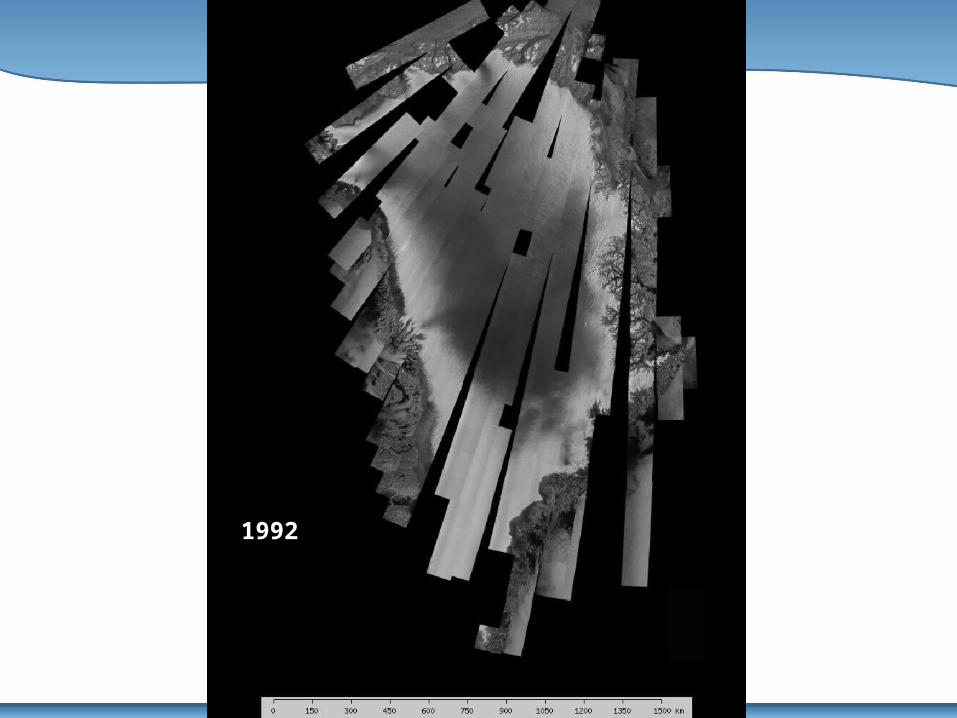
2000
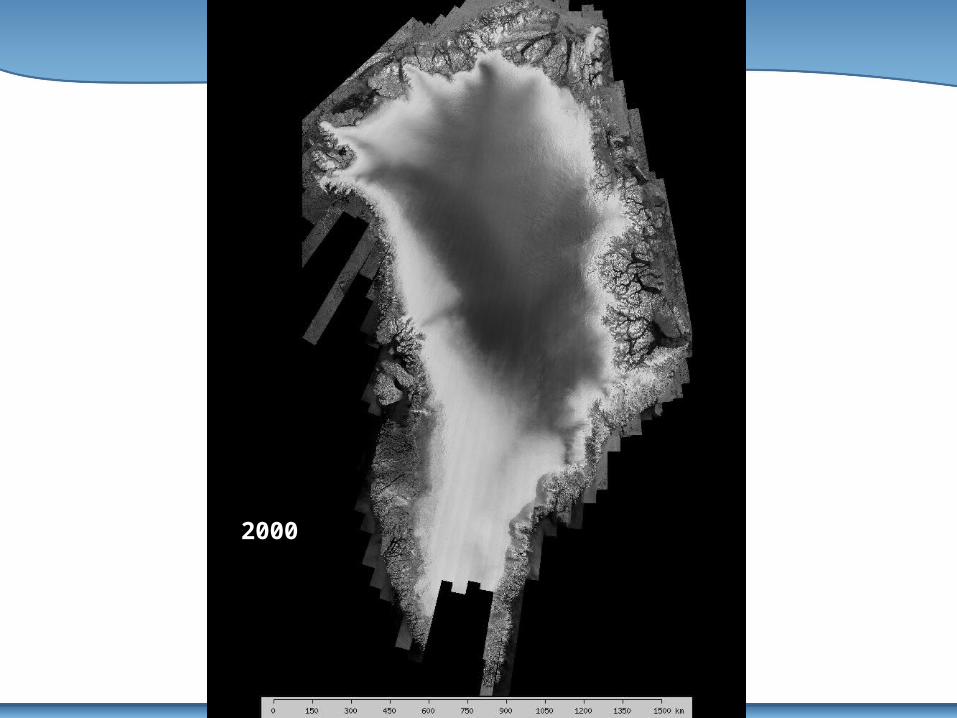
2005
Outline
• Background – Remote Sensing• Background – Global Climate Change• Radar Overview
– Radar Basics • Ice Sheet Science• What Are We Doing?• How Are We Doing It?
Outline
• Background – Remote Sensing• Background – Global Climate Change• Radar Overview
– Radar Basics • Ice Sheet Science• What Are We Doing?• How Are We Doing It?
What is Remote Sensing?
• Remote Sensing is the art and science of – Acquiring– Processing and– Interpreting
Images and related data obtained from ground-based, air or space-borne instruments, which record the interaction between a target and electromagnetic radiation
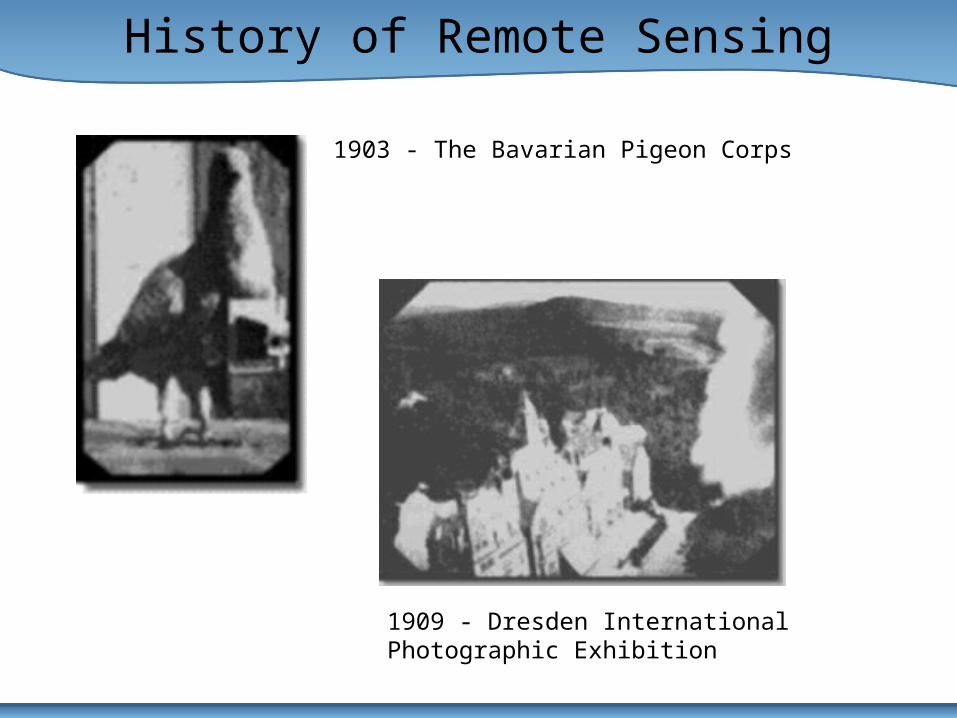
History of Remote Sensing
1909 - Dresden InternationalPhotographic Exhibition
1903 - The Bavarian Pigeon Corps
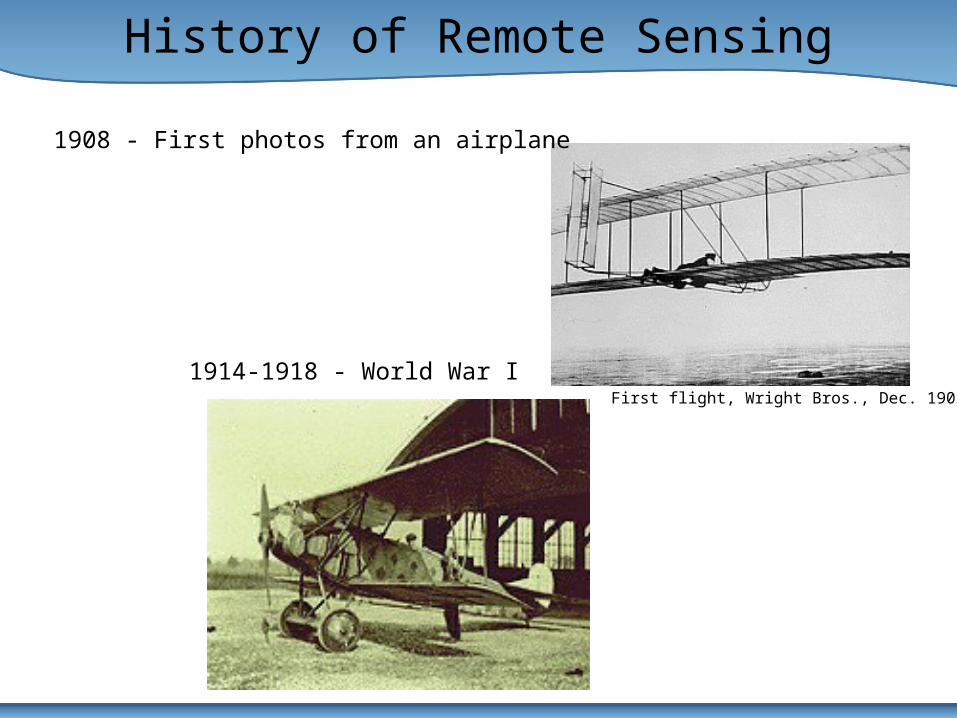
History of Remote Sensing
1914-1918 - World War I
1908 - First photos from an airplane
First flight, Wright Bros., Dec. 1903

What is Remote Sensing?

Types of Remote Sensing
• Passive: uses natural energy, either reflected sunlight (solar energy) or emitted thermal or microwave radiation.
• Active: sensor creates its own energy – Transmitted toward Earth or other targets– Interacts with atmosphere and/or surface– Reflects back toward sensor (backscatter)– Advantages: all weathers and all times

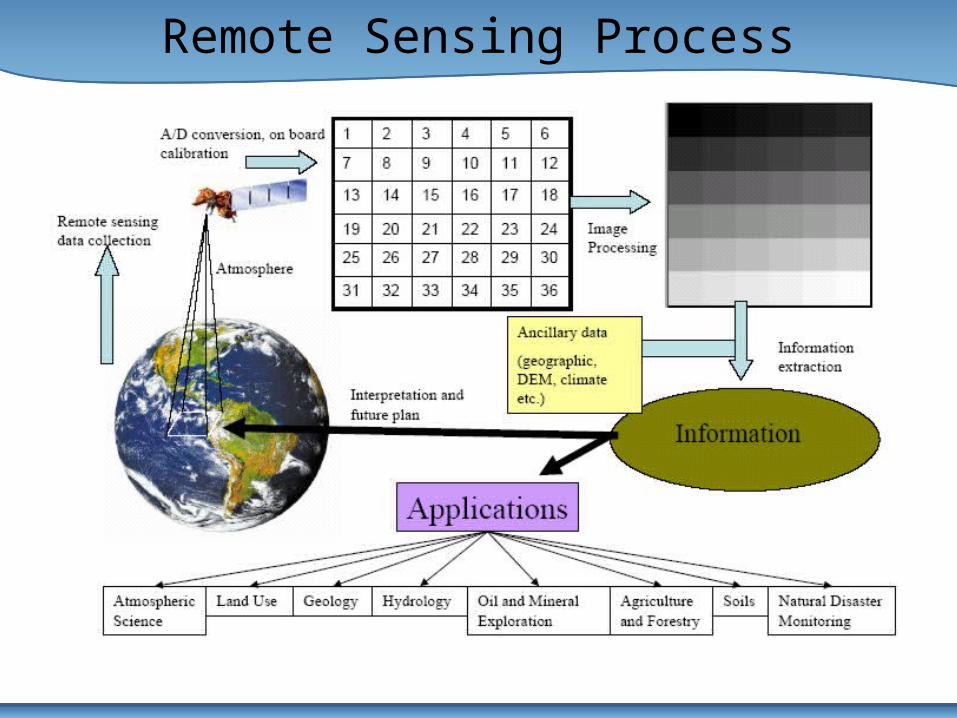
Remote Sensing Process

Radiation – Target Interactions
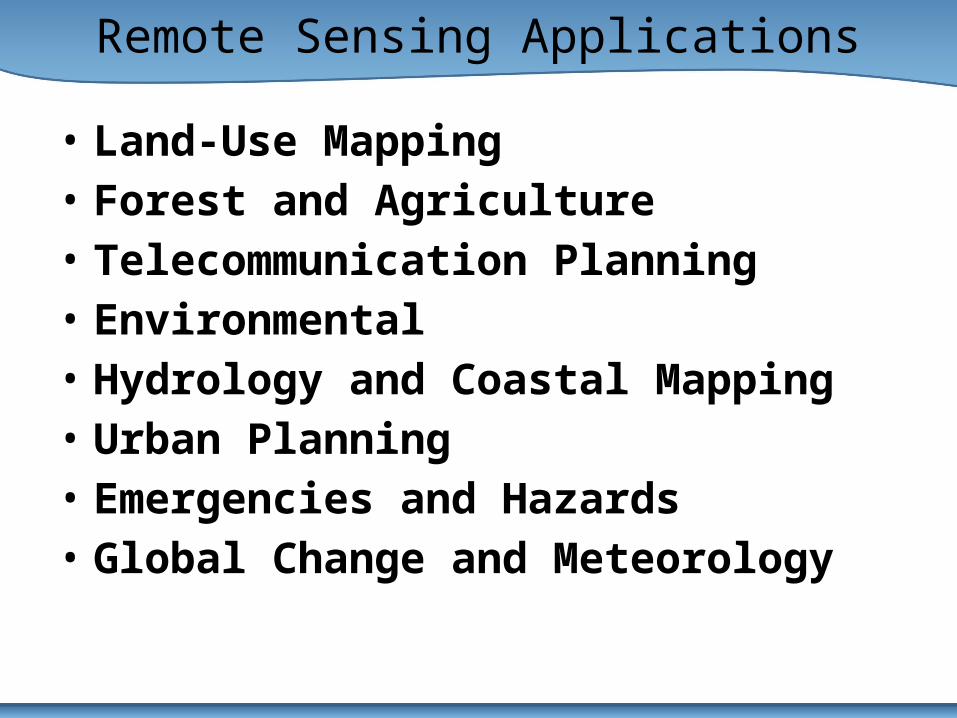
Remote Sensing Applications
• Land-Use Mapping• Forest and Agriculture • Telecommunication Planning• Environmental • Hydrology and Coastal Mapping• Urban Planning• Emergencies and Hazards• Global Change and Meteorology

Outline
• Background – Remote Sensing• Background – Global Climate Change• Radar Overview
– Radar Basics • Ice Sheet Science• What Are We Doing?• How Are We Doing It?

What have you heard?

Is Global Warming Fueling Katrina?
How one number touched off big climate-change fight at UW
Global warming could burn insurersActivists call on industry to act
Jellyfish creature the answer to global warming? www.Scienceblog.com
EXAGGERATED SCIENCE
How Global Warming Research is Creating a Climate of Fear
Research Links Global Warming to Wildfires In a Shift, White House Cites Global Warming as a Problem
Global warming causing new evolutionary patterns
Rise in wild fires a result of climate change
Seattle mayors' meeting a cozy climate for business
Seattle reports milestone in cutting emissions
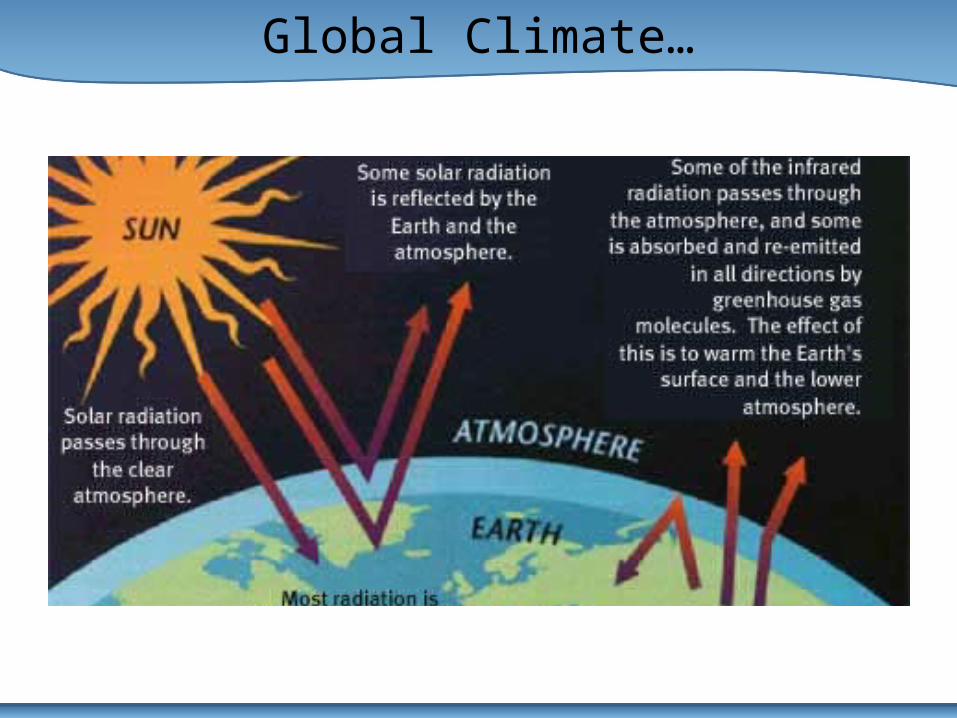
Global Climate…
Background
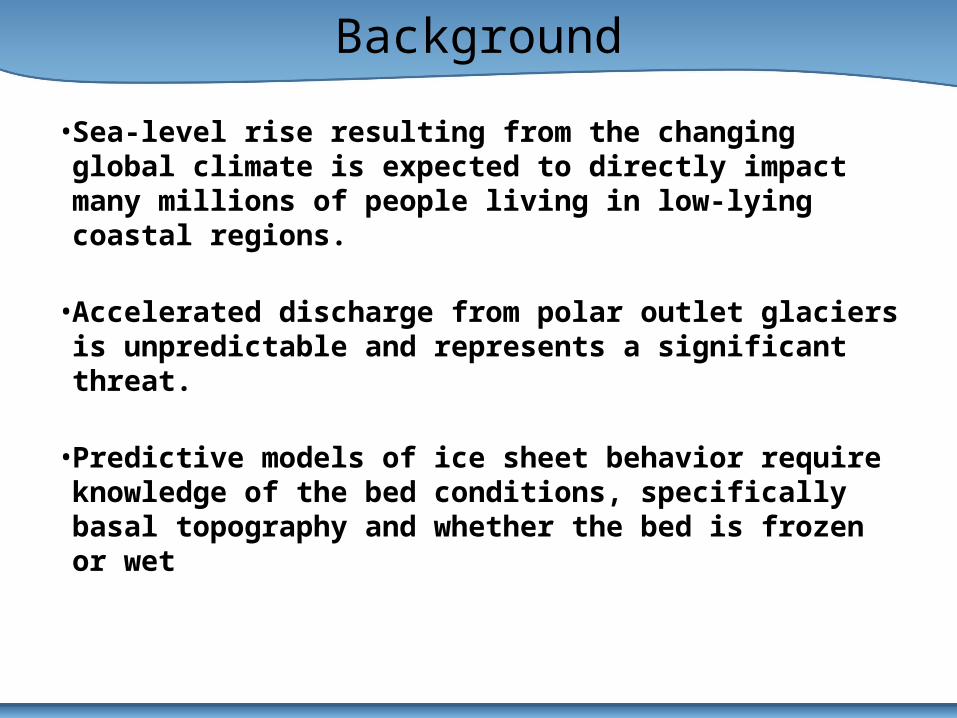
• Sea-level rise resulting from the changing global climate is expected to directly impact many millions of people living in low-lying coastal regions.
• Accelerated discharge from polar outlet glaciers is unpredictable and represents a significant threat.
• Predictive models of ice sheet behavior require knowledge of the bed conditions, specifically basal topography and whether the bed is frozen or wet
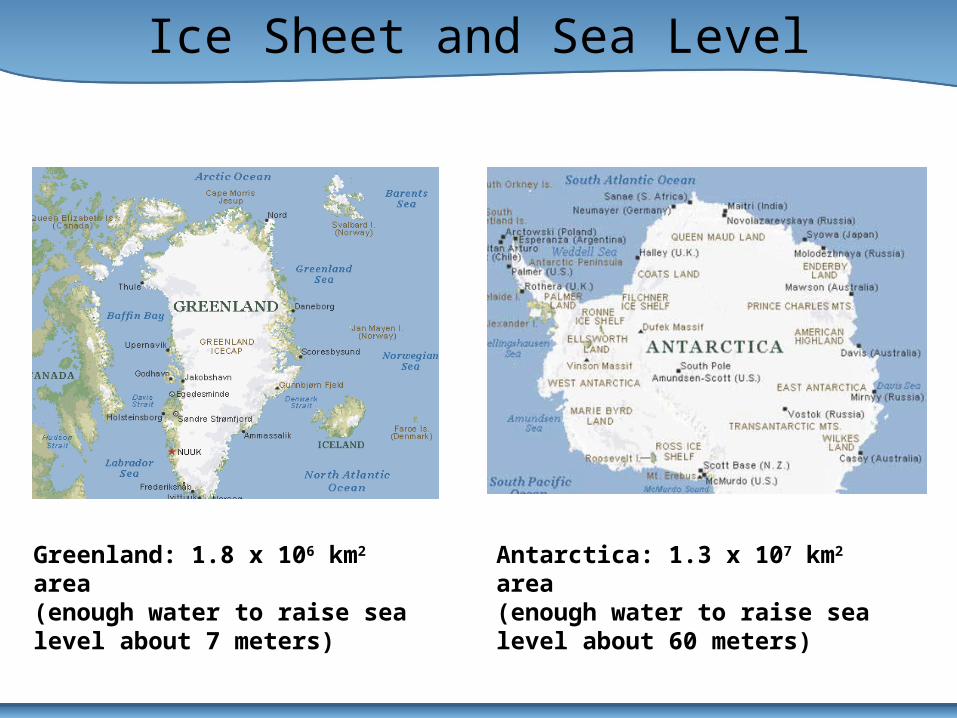
Ice Sheet and Sea Level
Greenland: 1.8 x 10⁶ km2 area (enough water to raise sea level about 7 meters)
Antarctica: 1.3 x 10⁷ km2 area (enough water to raise sea level about 60 meters)
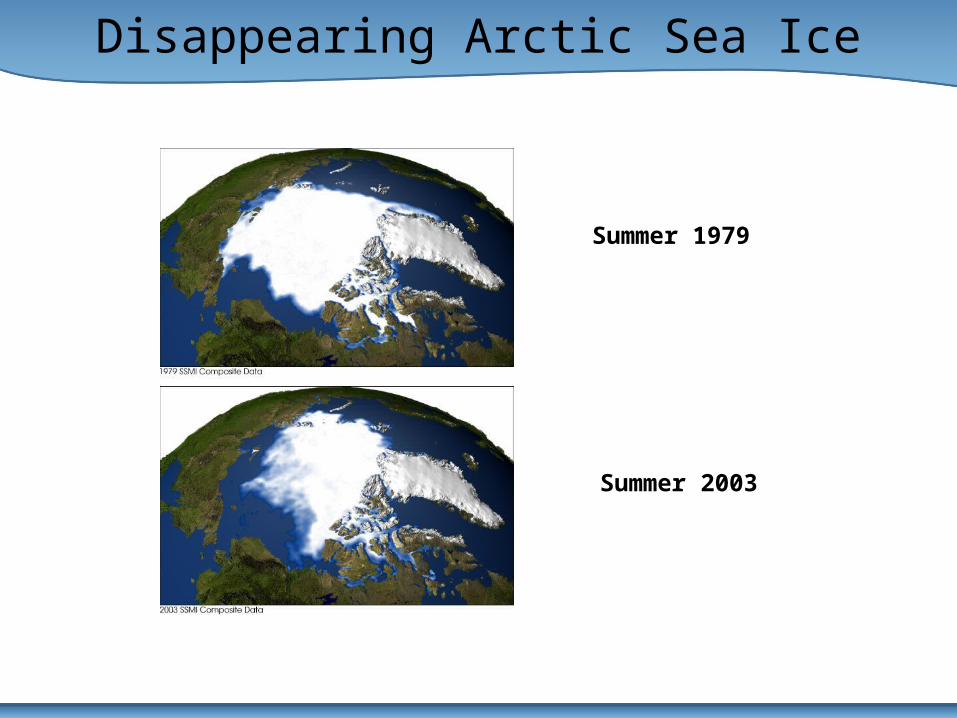
Disappearing Arctic Sea Ice
Summer 1979
Summer 2003
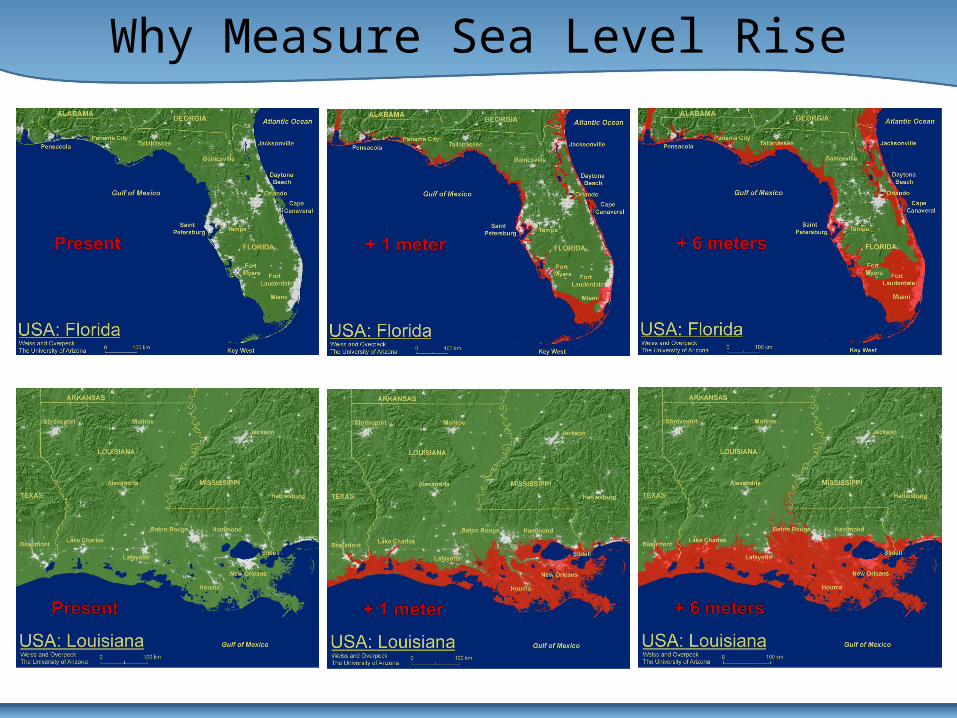
Why Measure Sea Level Rise
• Background – Remote Sensing• Background – Global Climate Change• Radar Overview
– Radar Basics • Ice Sheet Science• What Are We Doing?• How Are We Doing It?

• Ice melt flows down to bedrock through crevasses and moulins
• Water between bedrock and ice sheet acts as lubricant
• Allows ice sheet to move faster toward the coastline
Outline
• Background – Remote Sensing• Background – Global Climate Change• Radar Overview
– Radar Basics • Ice Sheet Science• What Are We Doing?• How Are We Doing It?
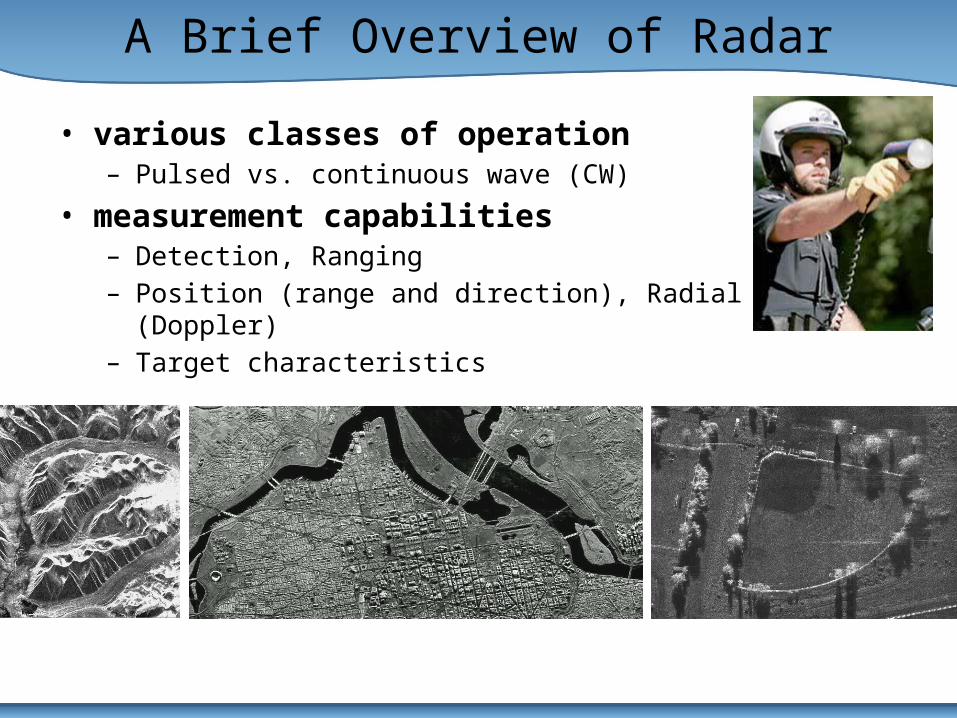
A Brief Overview of Radar
• various classes of operation– Pulsed vs. continuous wave (CW)
• measurement capabilities– Detection, Ranging– Position (range and direction), Radial velocity (Doppler)– Target characteristics
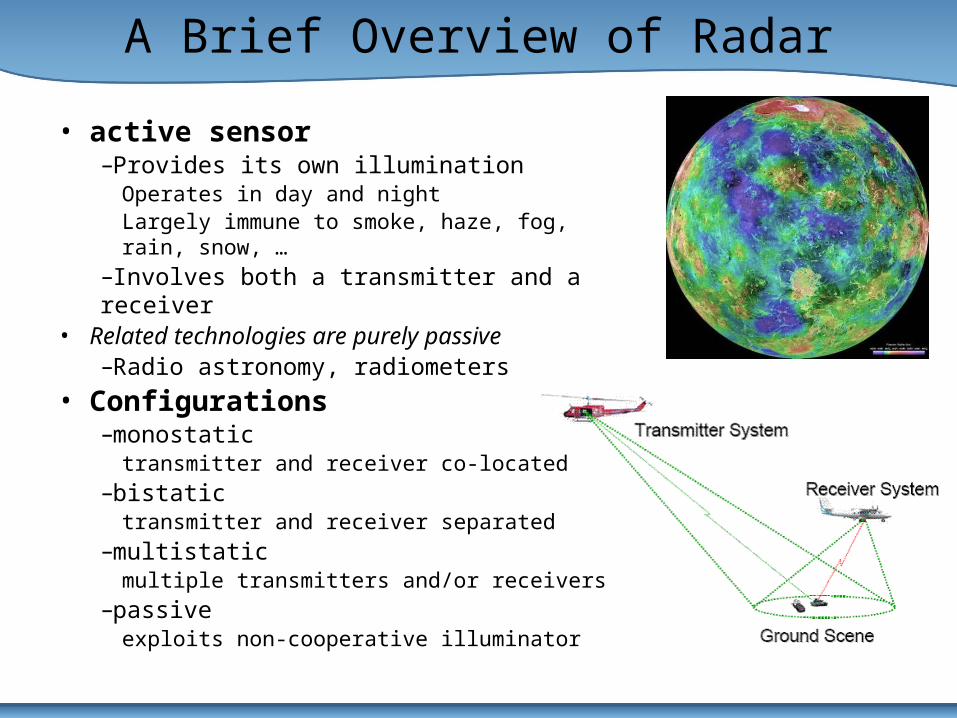
A Brief Overview of Radar
• active sensor–Provides its own illumination
Operates in day and nightLargely immune to smoke, haze, fog, rain, snow, …
–Involves both a transmitter and a receiver• Related technologies are purely passive
–Radio astronomy, radiometers• Configurations
–monostatictransmitter and receiver co-located
–bistatictransmitter and receiver separated
–multistaticmultiple transmitters and/or receivers
–passiveexploits non-cooperative illuminator
A Brief Overview of Radar
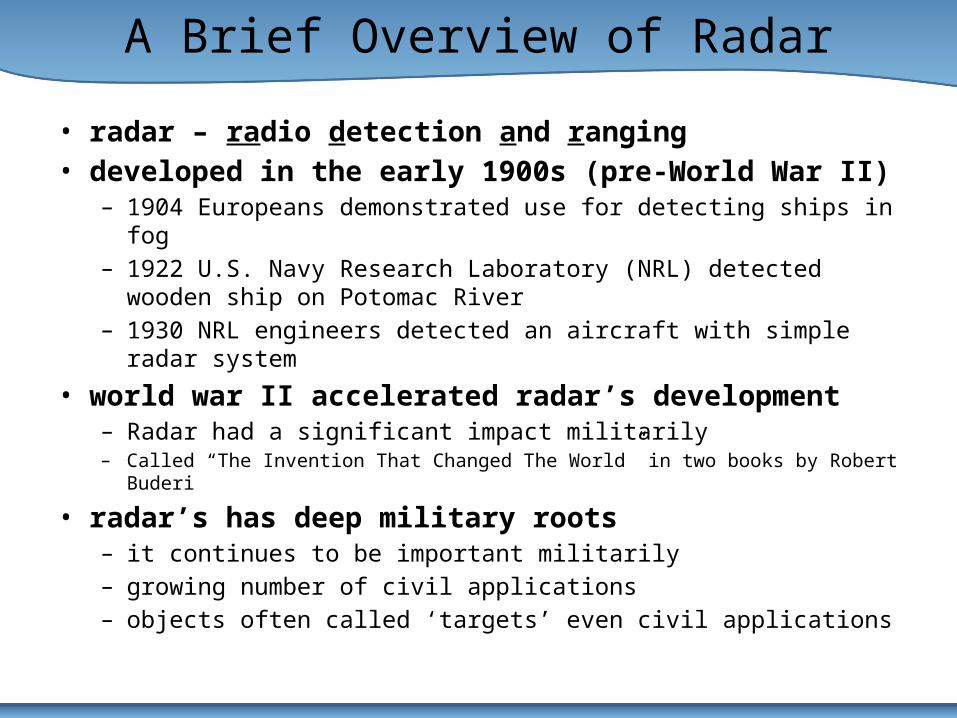
• radar – radio detection and ranging• developed in the early 1900s (pre-World War II)
– 1904 Europeans demonstrated use for detecting ships in fog– 1922 U.S. Navy Research Laboratory (NRL) detected wooden ship on
Potomac River– 1930 NRL engineers detected an aircraft with simple radar system
• world war II accelerated radar’s development– Radar had a significant impact militarily– Called “The Invention That Changed The World” in two books by Robert Buderi
• radar’s has deep military roots– it continues to be important militarily– growing number of civil applications – objects often called ‘targets’ even civil applications
Active Remote Sensing
• Active microwave (RADAR)• LIDAR• SONAR
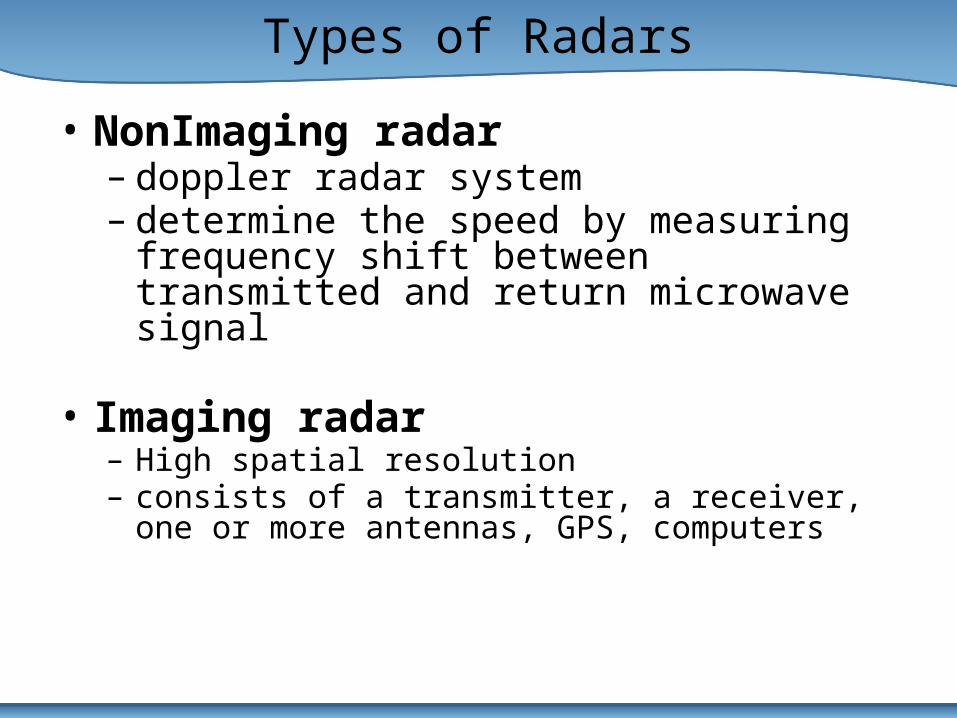
Types of Radars
• NonImaging radar– doppler radar system – determine the speed by measuring frequency shift
between transmitted and return microwave signal
• Imaging radar– High spatial resolution– consists of a transmitter, a receiver, one or more antennas,
GPS, computers

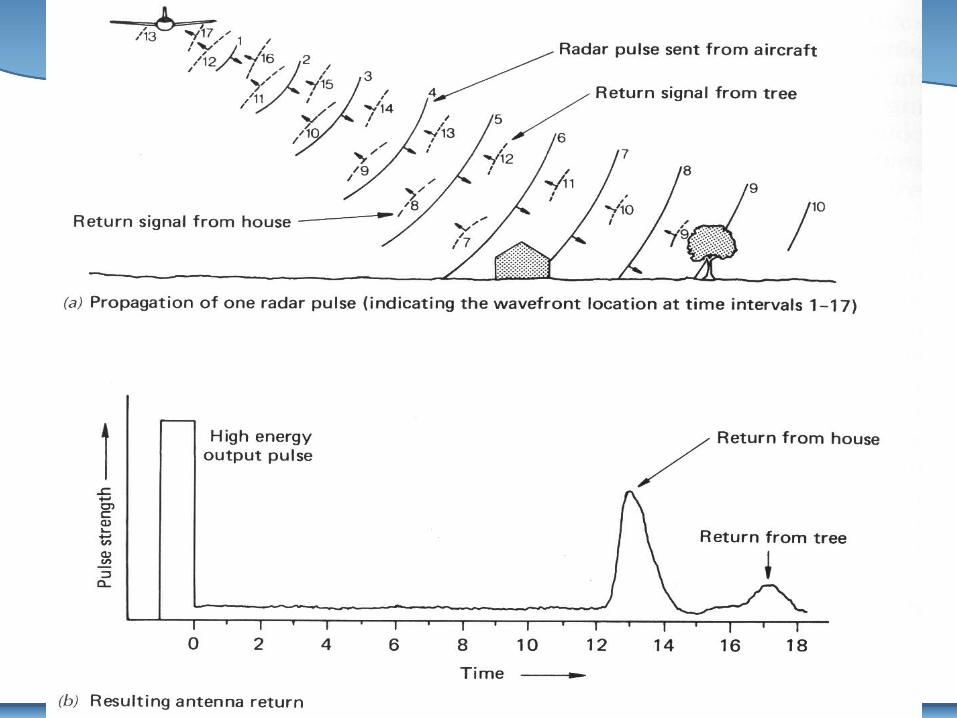
How Radars Work – The Short Answer
• an electromagnetic wave is transmitted by the radar • some of the energy is scattered when it hits a distance• a small portion of the scattered energy is collected by the
radar antenna
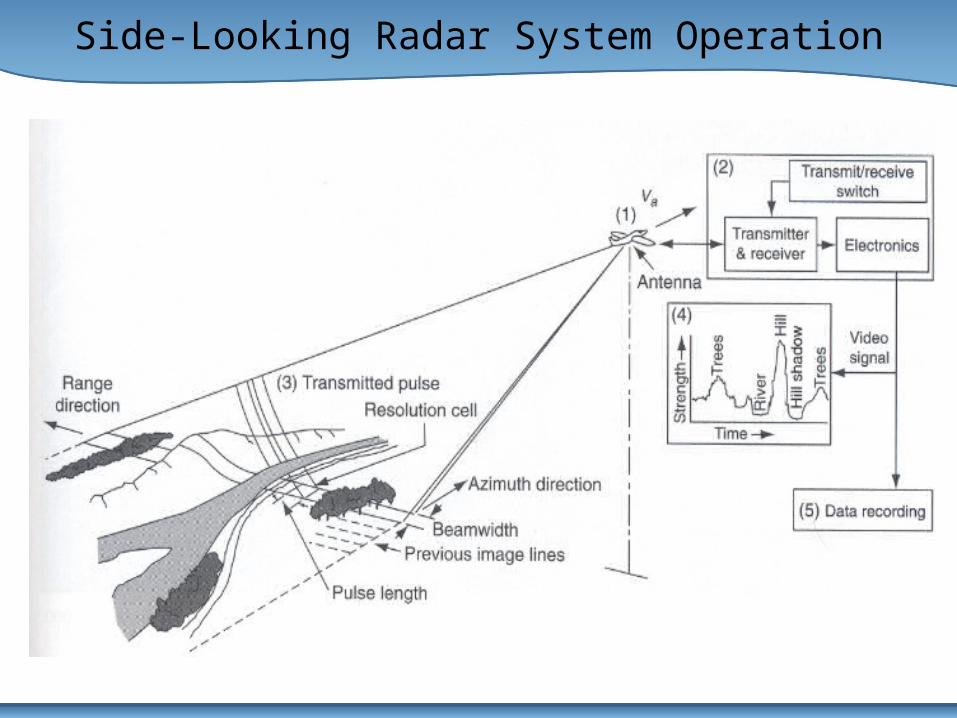
Side-Looking Radar System Operation

Block Diagram of Radar System
• Background – Remote Sensing• Background – Global Climate Change• Radar Overview
– Radar Basics • Ice Sheet Science• What Are We Doing?• How Are We Doing It?
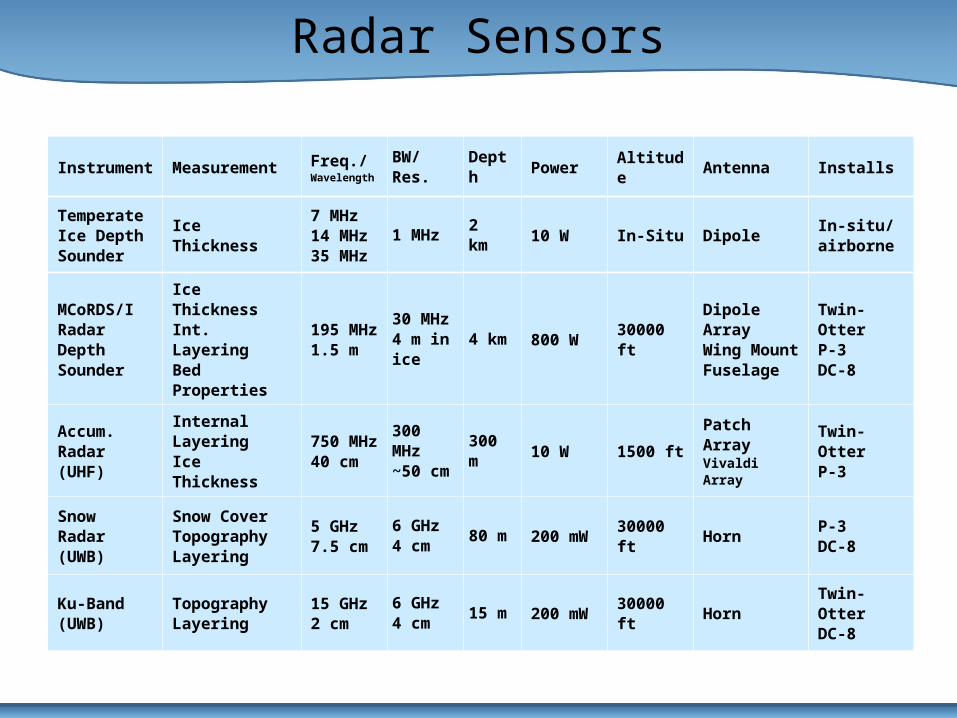
Radar Sensors
Instrument Measurement Freq./Wavelength
BW/Res. Depth Power Altitude Antenna Installs
Temperate Ice Depth Sounder
Ice Thickness7 MHz14 MHz35 MHz
1 MHz 2 km 10 W In-Situ Dipole In-situ/ airborne
MCoRDS/IRadar DepthSounder
Ice ThicknessInt. LayeringBed Properties
195 MHz1.5 m
30 MHz4 m in ice
4 km 800 W 30000 ftDipole ArrayWing MountFuselage
Twin-OtterP-3DC-8
Accum.Radar(UHF)
Internal LayeringIce Thickness
750 MHz40 cm
300 MHz~50 cm 300 m 10 W 1500 ft Patch Array
Vivaldi ArrayTwin-OtterP-3
SnowRadar (UWB)
Snow CoverTopographyLayering
5 GHz7.5 cm
6 GHz4 cm 80 m 200 mW 30000 ft Horn P-3
DC-8
Ku-Band (UWB)
TopographyLayering
15 GHz2 cm
6 GHz4 cm 15 m 200 mW 30000 ft Horn Twin-Otter
DC-8
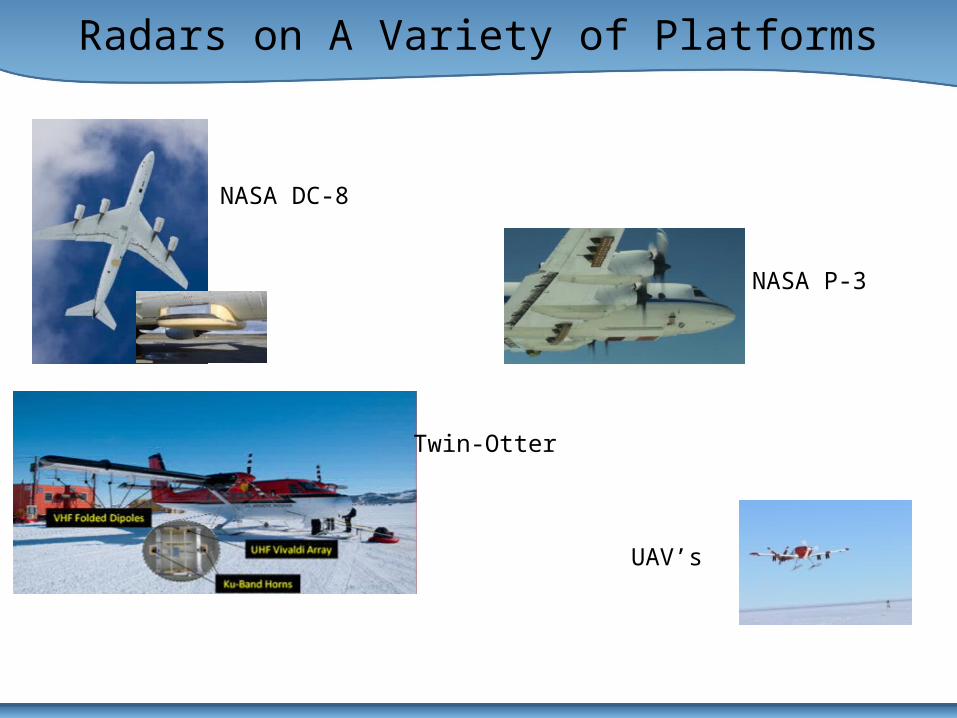
Radars on A Variety of Platforms
NASA DC-8
NASA P-3
Twin-Otter
UAV’s
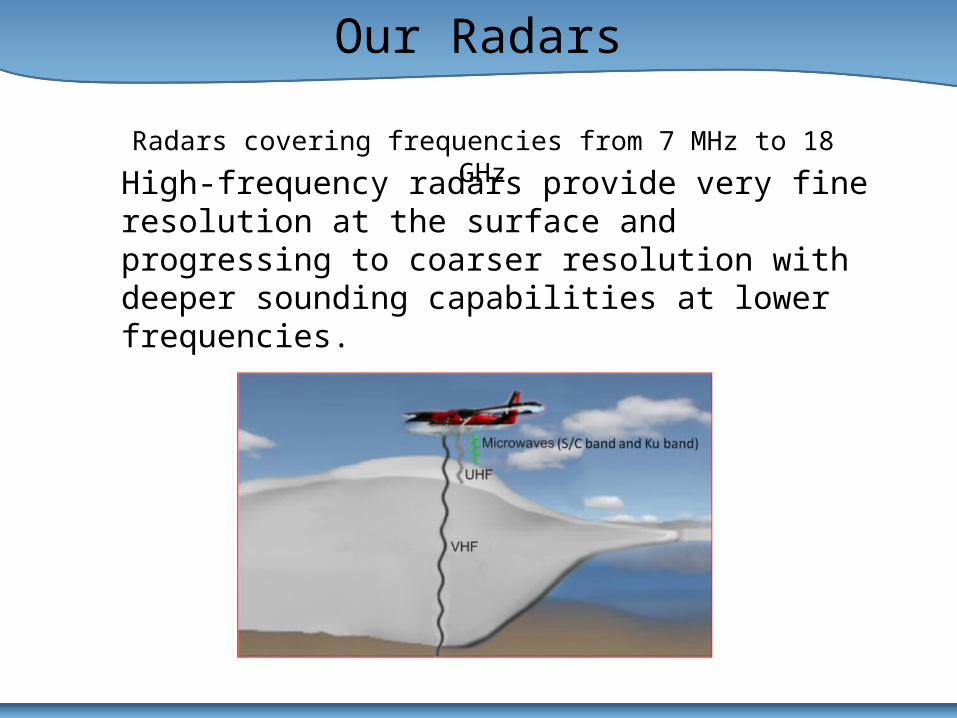
Our Radars
Radars covering frequencies from 7 MHz to 18 GHz
High-frequency radars provide very fine resolution at the surface and progressing to coarser resolution with deeper sounding capabilities at lower frequencies.

Survey Regions
Outline
• Background – Remote Sensing• Background – Global Climate Change• Radar Overview
– Radar Basics • Ice Sheet Science• What Are We Doing?• How Are We Doing It?

The Data Deluge
Expect massive increases in amount of data being collected in several diverse fields over the next few years:– Astronomy - Massive sky surveys– Biology - Genome databases etc.
–Earth Observing!– Digitisation of paper, film, tape records etc to create Digital
Libraries, Museums . . .– Particle Physics - Large Hadron Collider– . . .1PByte ~1000 TBytes ~ 1M GBytes ~ 1.4M CDs [Petabyte Terabyte Gigabyte]
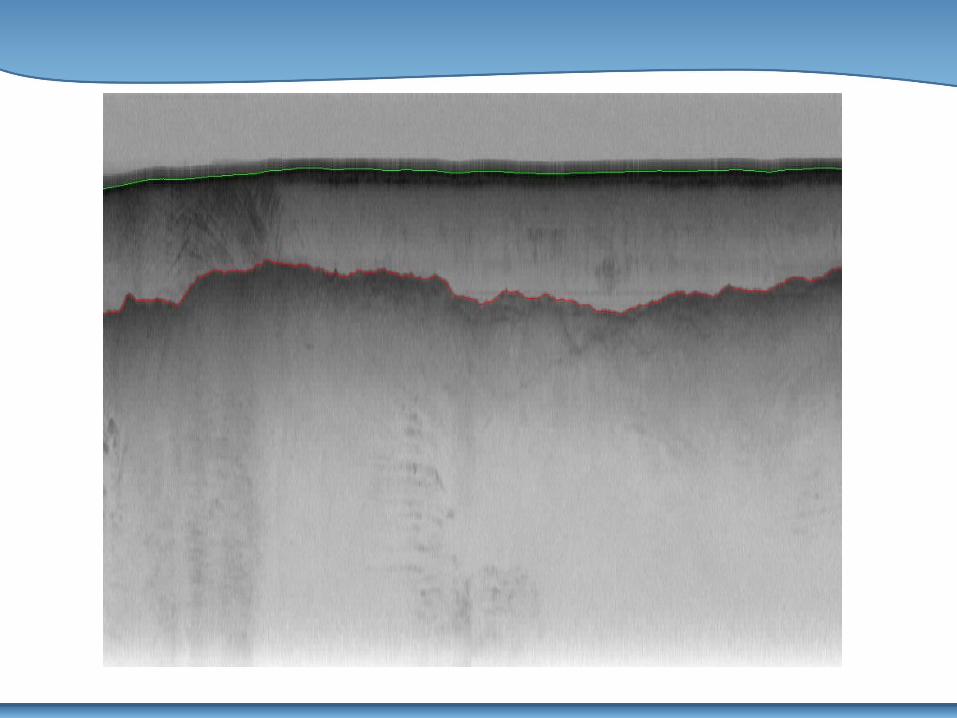
Challenges of Processing Radar Imagery
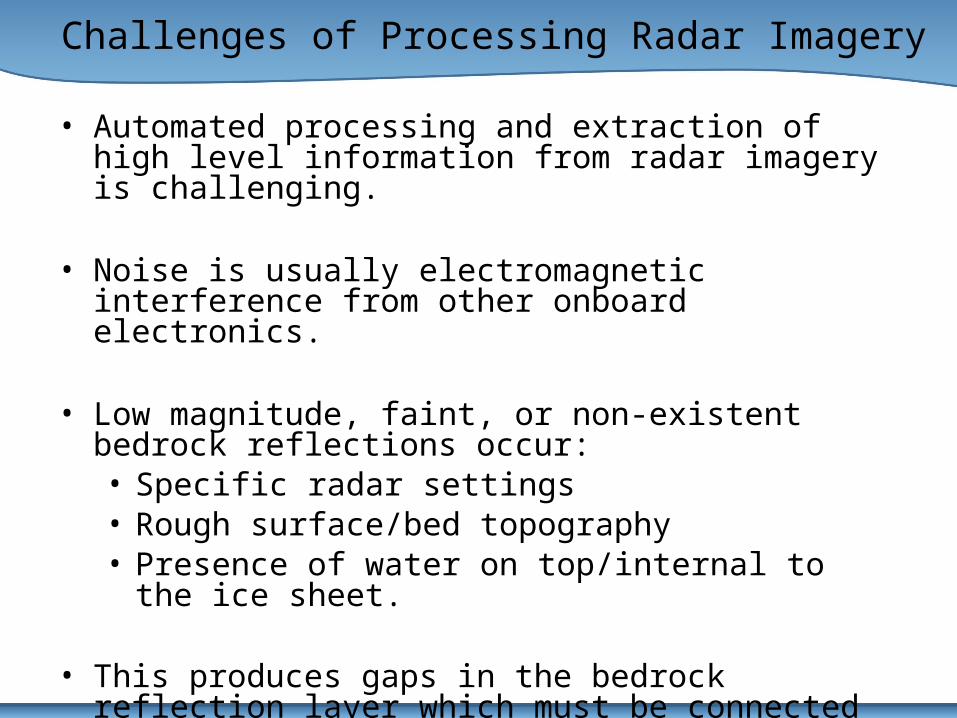
• Automated processing and extraction of high level information from radar imagery is challenging.
• Noise is usually electromagnetic interference from other onboard electronics.
• Low magnitude, faint, or non-existent bedrock reflections occur:• Specific radar settings• Rough surface/bed topography• Presence of water on top/internal to the ice sheet.
• This produces gaps in the bedrock reflection layer which must be connected to construct an adjacent layer for the completion of ice thickness estimation.
Challenges of Processing Radar Imagery
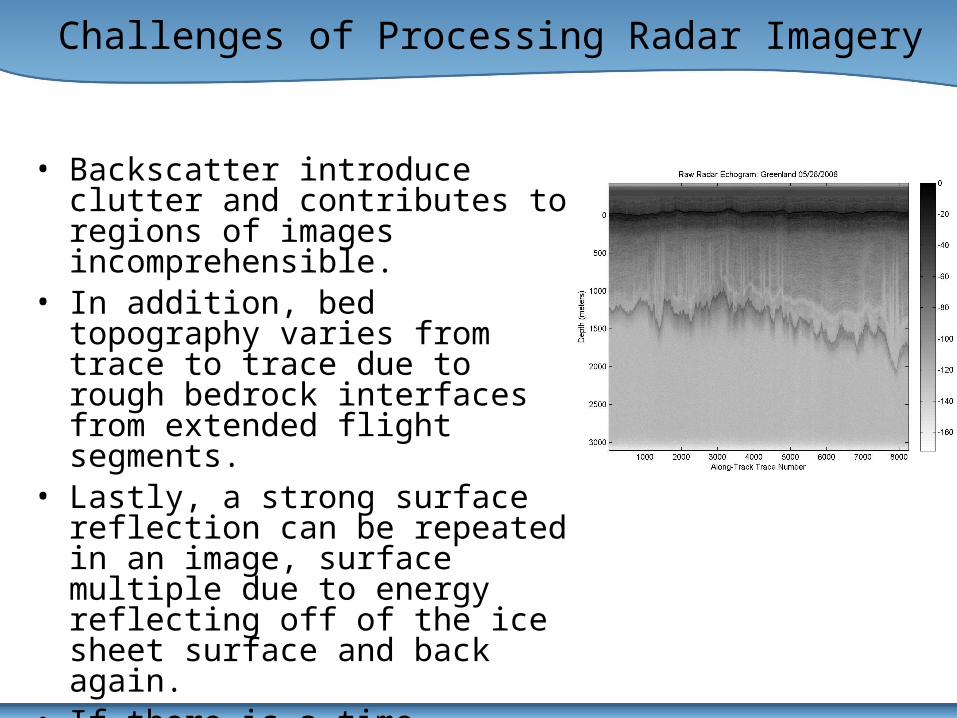
• Backscatter introduce clutter and contributes to regions of images incomprehensible.
• In addition, bed topography varies from trace to trace due to rough bedrock interfaces from extended flight segments.
• Lastly, a strong surface reflection can be repeated in an image, surface multiple due to energy reflecting off of the ice sheet surface and back again.
• If there is a time difference between the first and second surface return, the surface layer will repeat in an image, at a lower magnitude with an identical shape.
Challenges of Processing Radar Imagery
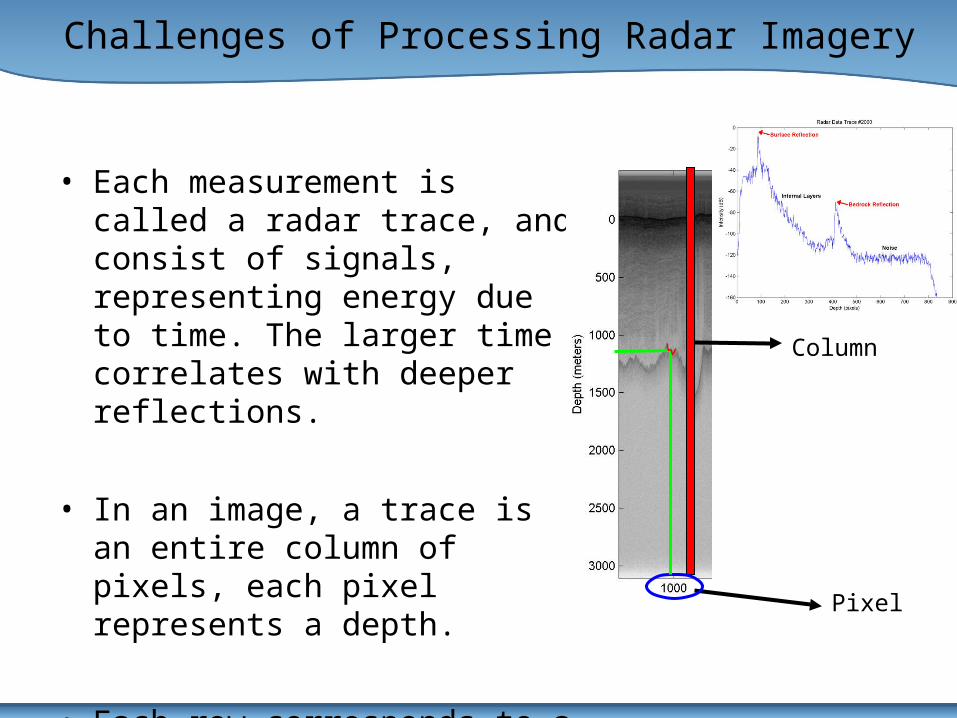
• Each measurement is called a radar trace, and consist of signals, representing energy due to time. The larger time correlates with deeper reflections.
• In an image, a trace is an entire column of pixels, each pixel represents a depth.
• Each row corresponds to a depth and time for a measurement, as the depth increases further down.
Pixel
Column
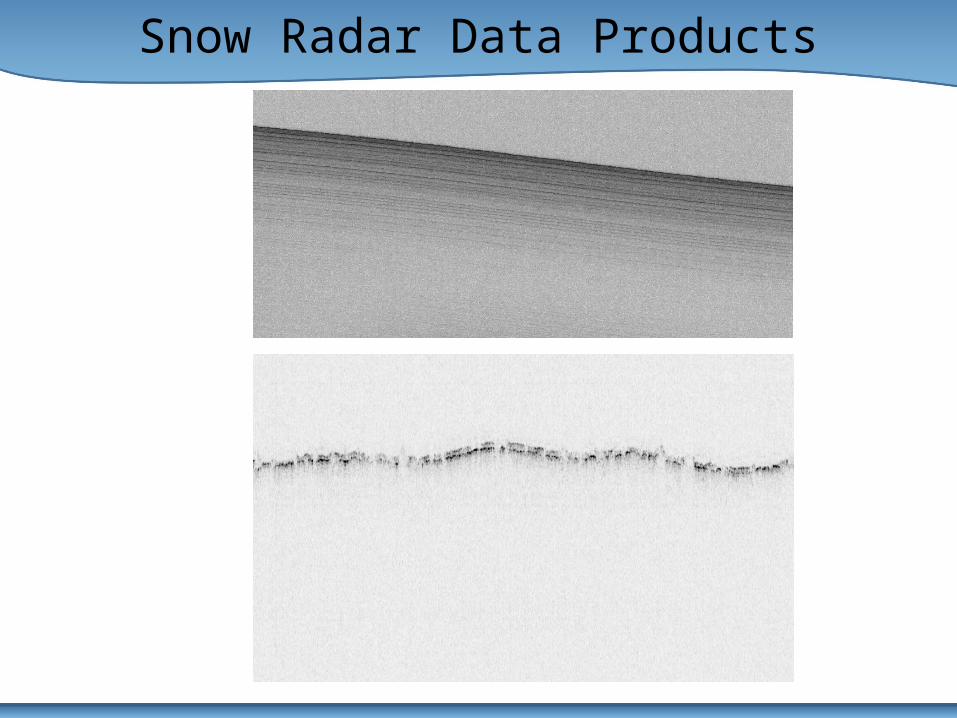
Snow Radar Data Products
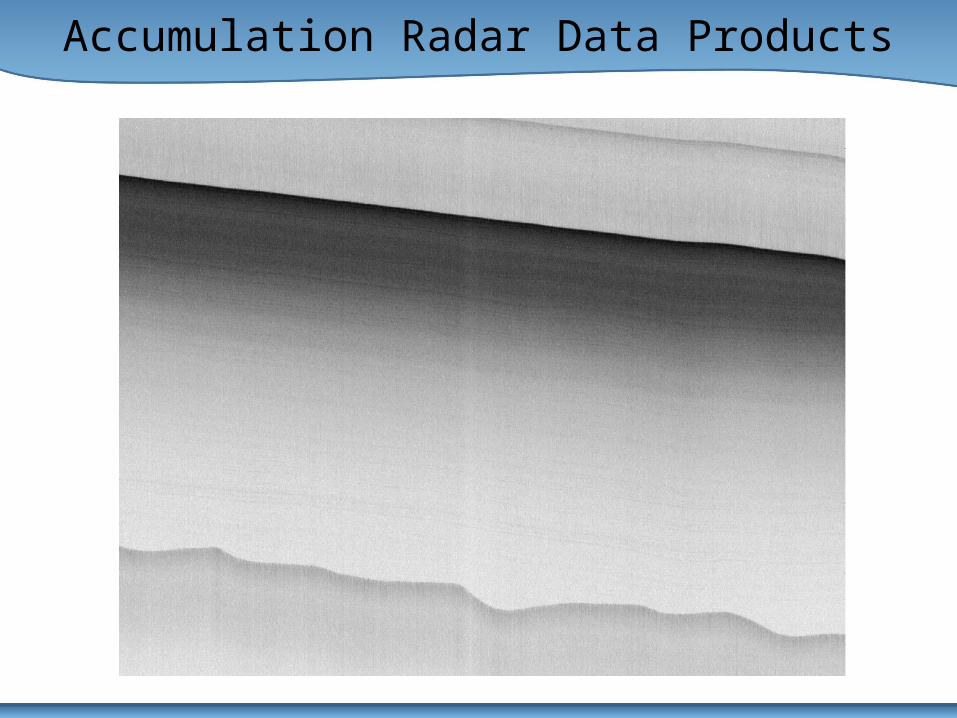
Accumulation Radar Data Products
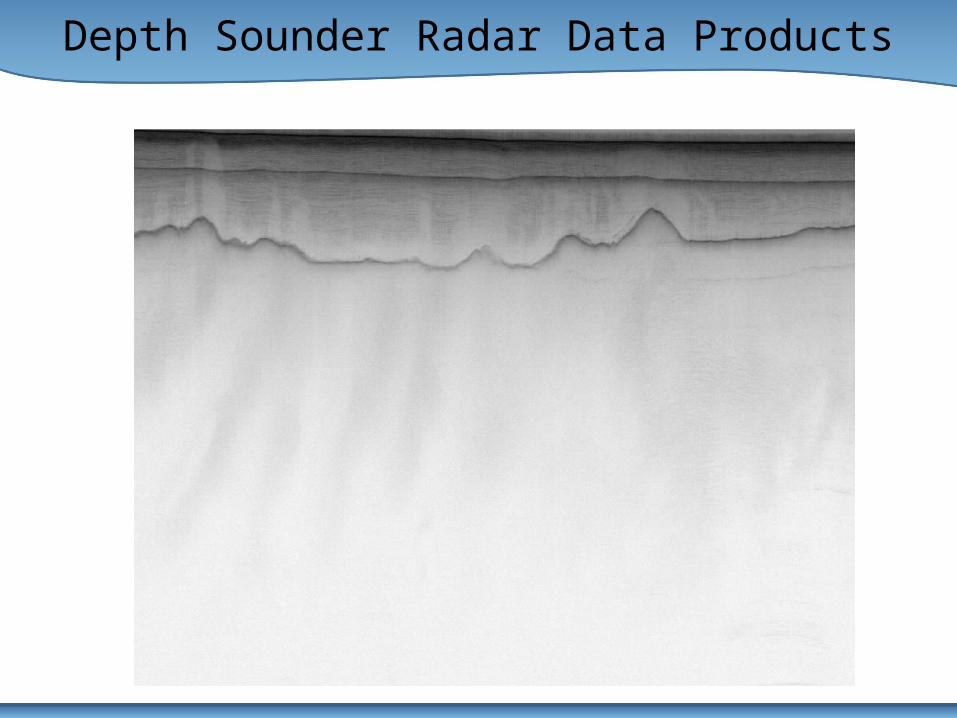
Depth Sounder Radar Data Products
Developing Automated Techniques for Radar Imagery

Conclusions
• Remote Sensing • Global Climate Change• Radar Theory • Ice Sheet Science