radon as earthquake precursor - intech -...
TRANSCRIPT

7
Radon as Earthquake Precursor
Giuseppina Immè and Daniela Morelli Dipartimento di Fisica e Astronomia Università di Catania - INFN Sezione di Catania
Italy
1. Introduction
Earthquake predictions are based mainly on the observation of precursory phenomena. However, the physical mechanism of earthquakes and precursors is at present poorly understood, because the factors and conditions governing them are so complicated. Methods of prediction based merely on precursory phenomena are therefore purely empirical and involve many practical difficulties. A seismic precursor is a phenomenon which takes place sufficiently prior to the occurrence of an earthquake. These precursors are of various kind, such as ground deformation, changes in sea-level, in tilt and strain and in earth tidal strain, foreshocks, anomalous seismicity, change in b-value, in microsismicity, in earthquake source mechanism, hypocentral migration, crustal movements, changes in seismic wave velocities, in the geomagnetic field, in telluric currents, in resistivity, in radon content, in groundwater level, in oil flow, and so on. These phenomena provide the basis for prediction of the three main parameters of an earthquake: place and time of occurrence and magnitude of the seismic event. The most important problem with all these precursors is to distinguish signals from noise. A
single precursor may not be helpful, the prediction program strategy must involve an
integral approach including several precursors.
Moreover, in order to evaluate precursory phenomena properly and to be able to use them
confidently for predictive purposes, one has to understand the physical processes that give
rise to them. Physical models of precursory phenomena are classified in two broad
categories: those based on fault constitutive relations, which predict fault slip behavior but
no change in properties in material surrounding the fault, and those based on bulk rock
constitutive relations, which predict physical property changes in a volume surrounding the
fault. Nucleation and lithospheric loading models are the most prominent of the first type
and the dilatancy model is of the second type.
During the past two decades efforts have been made to measure anomalous emanations of
geo-gases in earthquake-prone regions of the world, in particular helium, radon, hydrogen,
carbon dioxide. Among them radon has been the most preferred as earthquake precursor,
because it is easily detectable.
Radon is found in nature in three different isotopes: 222Rn, member of 238U series, with an half life of 3.8 days, 220Rn (also called thoron), member of 232Th series, with an half life of 54.5 s and 219Rn, member of 235U series, with an half life of 3.92 s. Owing to his longer half-life, the most important of them is 222Rn, produced by 226Ra
decaying. After his production in soil or rocks, 222Rn can leave the ground crust either by
www.intechopen.com

Earthquake Research and Analysis – Statistical Studies, Observations and Planning
144
molecular diffusion or by convection and enters the atmosphere where his behavior and
distribution are mainly governed by meteorological processes.
The radon decay products are radioactive isotopes of Po, Bi, Pb and Tl and they are easily attached to aerosol particles present in air. In table 1 are shown the principal decay characteristics of 222Rn and 220Rn, including properties of their respective parent radionuclides and their short-lived decay products.
Radionuclide Half-life Radiation E(MeV) E(MeV) 226Ra 1600 y 4.78(94.3%) 0.186 (83,3%)
4.69 (5.7%) 222Rn 3.824 d 5.49(100%) 218Po 3.05 m 6.00(100%) 214Pb 26.8 m 0.295 (19%)
0.352 (36%) 214Bi 19.7 m 0.609 (47%)
1.120 (15%)
1,760 (16%) 241Po 164 s 7.69 (100%) 224Ra 3.66 d 5.45 (6%) 0.241(3.9%)
5.68 (94%) 220Rn 55 s 6.29 (100%) 216Po 0.15 s 6.78 (100%) 212Pb 10.64 h 0.239 (47%)
0.300 (3.2%) 212Bi 1.01 h 6.05 (25%) 0.727 (11.8%)
6.09 (10%) 1.620 (2.8%) 212Po 298 ns 8.78 (100%) 208Tl 3.05 m 0.511 (23%)
0.583 (86%) 0.860 (12%) 2.614 (100%)
Table 1. Principal decay Characteristics of 222Rn and 220Rn
The release of radon from natural minerals has been known since 1920’s (Spitsyn, 1926) but its monitoring has more recently been used as a possible tool for earthquake prediction, because the distribution of soil-gas radon concentration is closely related to the geological structure, fracture, nature of rocks and distribution of sources. Therefore, surveying of radon concentration can prospect fracture trace, earthquake forecast, environment monitoring, etc.
2. Radon production and transport
The production of 222Rn depends on the activity concentrations of 226Ra in the earth’s crust,
in soil, rock and water.
www.intechopen.com
Radon as Earthquake Precursor
145
When radium decays in a mineral substance, the resulting radon atoms must first emanate from the grains into the air-filled pore space. The fraction of radon that enters the pores, commonly known as emanation fraction, consists of two components due to recoil and diffusion mechanisms. Since the diffusion coefficient of gases in solid materials is very low, it is assumed that the main portion of the emanation fraction comes from the recoil process. From the alpha decay of radium, radon atoms possess sufficient kinetic energy (86 keV) to move from the site where radon is generated. The range of 222Rn is between 20 to 710 nm in
common materials, 100 nm for water and 63 m for air. (Sabol et al., 1995) The emanation fraction can be strongly influenced by water content in the material,
increasing with soil moisture, up to saturation in the normal range of soil moisture content.
A representative estimate of the fraction of radon that leaves solid grains is 25%.
The increase in the emanation fraction can be explained by the lower recoil range of radon
atoms in water than in air. A radon atom entering a pore that is fully or partially filled with
water has a very good chance of being stopped by the water in the pore. Generally, the
presence of water increases the emanation fraction, but this trend may show a saturation
effect or the effect may even later reverse as the water content becomes greater.
In addition to the moisture effect, dependence of the emanation fraction on grain size and
temperature has also been observed. Small grain size soils, such as clay, display maximum
emanation at about 10%-15% water content. The ratio of the maximum emanation fraction to
that of a dry sample also decreases as the grain size increases. A rise in temperature also
causes an increase in the emanation fraction, which is probably due to the reduced
adsorption of radon.
Different types of soil show different emanation fractions for 222Rn, which are generally in
the range 0.01-0.5 (Sabol et al., 1995).
Some emanated radon atoms, after their penetration trough the pore of a material, may
finally reach the surface before decaying. Radon behaves as a gas and its movement in
material follows some well-known physical laws. There are essentially two mechanisms of
radon transport in material: (1) molecular diffusion and (2) forced advection.
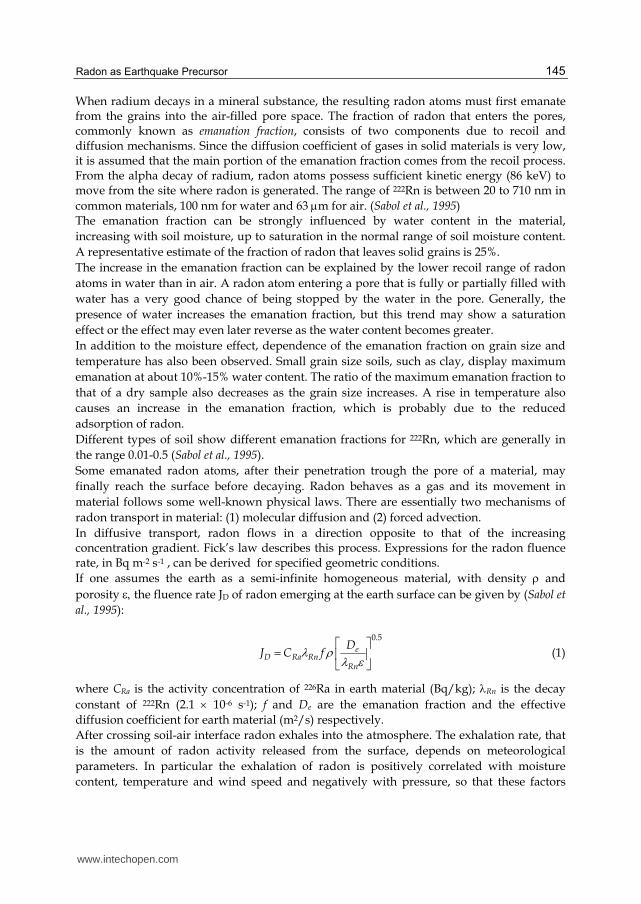
In diffusive transport, radon flows in a direction opposite to that of the increasing concentration gradient. Fick’s law describes this process. Expressions for the radon fluence rate, in Bq m-2 s-1 , can be derived for specified geometric conditions.
If one assumes the earth as a semi-infinite homogeneous material, with density and
porosity the fluence rate JD of radon emerging at the earth surface can be given by (Sabol et
al., 1995):
0.5
eD Ra Rn
Rn
DJ C f (1)
where CRa is the activity concentration of 226Ra in earth material (Bq/kg); Rn is the decay
constant of 222Rn (2.1 10-6 s-1); f and De are the emanation fraction and the effective
diffusion coefficient for earth material (m2/s) respectively.
After crossing soil-air interface radon exhales into the atmosphere. The exhalation rate, that
is the amount of radon activity released from the surface, depends on meteorological
parameters. In particular the exhalation of radon is positively correlated with moisture
content, temperature and wind speed and negatively with pressure, so that these factors
www.intechopen.com

Earthquake Research and Analysis – Statistical Studies, Observations and Planning
146
must be considered in the determination of exhalation rates in environmental
measurements. Since the main mechanism governing the entry of radon into the atmosphere
from the surface of the earth is diffusion, the radon fluence rate can be calculated by using
appropriate parameters in equation (1). Representative values of these parameters and CRa =
40 Bq m-3 yield JD= 0.026 Bq m-2 s-1 which is quite close to the average value experimentally
obtained for some regions (Sabol et al. ,1995).
2.1 Theory of radon diffusion
In order to understand how radon anomalies could be correlated to geodynamic events
radon transport mechanisms in soil must be considered. Different models to describe radon
diffusion have been proposed. In this section we will give a brief review.
2.1.1 Plate sheet model
One of the most reliable models to describe radon diffusion is the plane sheet model. The
molecular diffusion is considered in only one direction and, for any stable element, can be
described by Fick’s second law as follows (Gauthier et al.,1999):
2
2
C CD
t z (2)
where C is the concentration of the element and D the diffusion coefficient along z. This
equation admits a solution C(z, t) which is constrained by the initial and boundary
conditions (C = C0 at t = 0 and –a < z < a; C = 0 at t > 0 and z = +a):
2 2
02
0
1 2 1 2 14( , ) cos exp
2 1 2 4
n
n
n z D n tCC z t
n a a (3)
where a is the half-width of the slab. In order to take into account radioactivity, equation (3) has to be modified for radon by
adding a production term from its parent 226Ra and a decay term, which leads to:
2
2Rn Rn
Ra Ra Rn Rn
C CC C D
t z (4)
where CRa and CRn represent the concentrations (in atoms g-1) and Ra and Rn the decay
constants of 226Ra and 222Rn, respectively.
Defining the function K(z, t) as:
Rn( , ) C , expRa
Ra RnRn
K z t z t C t (5)
and introducing K(z, t) in equation (4) gives:
2
2
K KD
t z (6)
www.intechopen.com
Radon as Earthquake Precursor
147
which is the Fick’s second law expressed for the function K(z, t). Nevertheless the solution
of equation (6) cannot be merely obtained by combining the solution of the general Fick’s
second law (2) with the substitution (5) because the two functions K(z, t) and CRn (z, t) do not
admit the same initial and boundary conditions. These conditions are for CRn (z, t) :
,0 for a z a,t 0
, 0 for z a,z a
RaRn RnEq Ra
Rb
Rn
C z C C
C z t
(7)
(the atmosphere is considered as a reservoir of concentration C = 0) which means for K(z, t):
( ,0) 0 for a z a,t 0
( , ) exp for z a,z aRnEq Rn
K z
K z t C t (8)
Fick’s law is usually solved for plane sheet geometry by separation of variables but this
method is unsuccessful for such initial and boundary conditions. Several studies have been
done for heat conduction in a slab having an initial zero temperature and surfaces
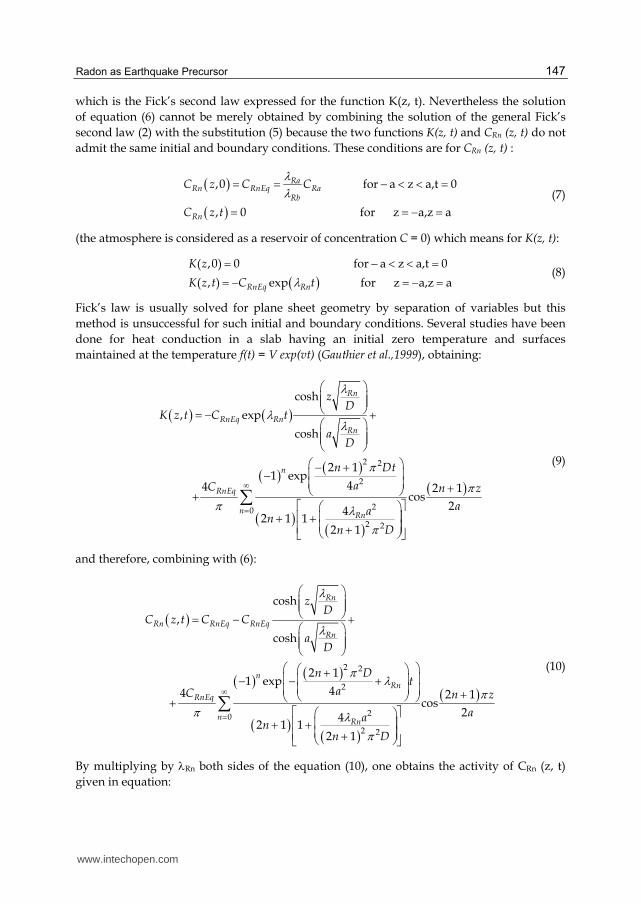
maintained at the temperature f(t) = V exp(vt) (Gauthier et al.,1999), obtaining:
2 2
2
20
2 2
cosh
, exp
cosh
2 11 exp
44 2 1cos
242 1 1
2 1
Rn
RnEq Rn
Rn
n
RnEq
nRn
zD
K z t C t
aD
n Dt
aC n z
aan
n D
(9)
and therefore, combining with (6):
2 2
2
20
2 2
cosh
,
cosh
2 11 exp
44 2 1cos
242 1 1
2 1
Rn
Rn RnEq RnEq
Rn
nRn
RnEq
nRn
zD
C z t C C
aD
n Dt
aC n z
aan
n D
(10)
By multiplying by Rn both sides of the equation (10), one obtains the activity of CRn (z, t)
given in equation:
www.intechopen.com

Earthquake Research and Analysis – Statistical Studies, Observations and Planning
148
2 2
2
20
2 2
cosh
,
cosh
2 11 exp
4 2 14cos
242 1 1
2 1
Rn
Rn Ra ra
Rn
nRn
Ra
nRn
zD
C z t C C
aD
n Dt
a n zC
aan
n D
(11)
where CRn and CRa represent the activity of 222Rn and 226Ra, respectively.
2.1.1 Infinite source model
In another earth model an infinite source C0 is overlain by an overburden of thickness h, where no radon source exists. In this case the radon transportation equation in the overburden, where radon production rate is zero, can be written as (Wattanikorn et al,1998):
2
20Rnd C v dC
CD dz Ddz
(12)
where C is the radon concentration at depth z, v is the gas flow velocity; D is the diffusion
coefficient of radon, and Rn is the decay constant. The solution of (12) is:
2
02
sinh2
exp2
sinh2
Rn
Rn Rn
Rn
vz
D Dv h zC C
Dv
hD D
(13)
3. Radon measurements
In general Radon measurements can be performed in continuous, integrating or discrete mode, regarding the time duration of measurement, and by using passive devices, when Radon enters the detection system by natural diffusion, or active technique, when gas is pumped in the device, that require electric power. Some types of the most used detectors for in-soil radon measurements are the following: a. Solid State nuclear track detectors: the most used SSNTD are Cr-39 type or LR-115 one.
They are particularly sensitive to alpha particles that, passing trough, produce tracks visible in optical microscope after chemical etching. The main advantages of this kind of detectors, especially for the first type, is that they are cheap, are sensitive only to alpha particles, are unaffected by humidity, low temperature, moderate heating and light. Moreover these passive devices don’t need electrical power supply.
b. Electret detector: an electret is a dielectric material that exhibits a permanent electrical charge. The particles from Radon decay produce ions within the device that determine
www.intechopen.com

Radon as Earthquake Precursor
149
changing in the total charge of the electret. This kind of detector offers several advantages: possibility to store information over relatively long period, independence from moisture in its envelop and ease to read. The main problems are linked to its response curve that does not cover efficiently the very low and very high doses and its sensitivity also to gamma radiations.
c. Activated charcoal: this type of detectors is based on the capability of the charcoal to adsorb Radon gas. The analysis is carried out by means of the gamma spectrometry of the Radon products. However with this kind of device measurements can be performed only for 3 – 5 days and they are affected by humidity.
d. Thermoluminescent detector: Radon is allowed to enter the detection device volume containing the TLD. A metallic plate, placed at short distance in front of the TLD, can be electrically charged for a better collection efficiency. Radon daughters deposited on the plate decay producing energy storage in the TLD. After appropriate exposition, the TLD is recovered and read out in a TLD apparatus.
e. Scintillation detector: the most widely used is the ZnS(Ag) scintillation cell for grab sampling. It is a metal container internally coated with silver activated zinc solphide. Light photons are detected, resulting from the interaction of the alpha particles from radon decaying. For counting the photons, the scintillation cell is coupled to a photomultiplier.
In the last years active devices have been used for continuous measurements of in soil Radon gas. They use prevalently detectors as ionization chamber or silicon detectors. The devices have a probe placed in the soil at a certain depth, the gas Radon enters into the detection chamber or by means of a pump with a fixed flow rate or they can be placed inside the soil and the gas enters into the detection chamber via natural diffusion. This kind of measurements need power supply, not always available in active fault areas, but in the last years the detection systems have been implemented with solar panels, overcoming the problem. These devices have more performance respect to the previous ones because they allow continuous measurements and on-line reading by means of remote data transfer and so they allow to monitor continuously the Radon temporal trend. Accordingly, the choice among the different possibilities can be guided by the particular interest in radon measurements, whether in time-dependent or in space-dependent variations of the concentrations. In particular, spot measurements (with portable detectors) of soil–gas Radon are useful for the quick recognition of high emission sites to be later monitored for Radon variations in time. SSNTD allow for the temporal monitoring of a relatively large number of sites, but cannot distinguish short-term changes due to their long integration times. Continuous monitoring probes are optimal for defining detailed changes in soil–gas Radon activities, but are expensive and can thus be used to complete the information acquired with SSNTD in a network of monitored sites.
4. Origin and mechanisms of radon anomalies
Most of the researchers define radon anomaly as the positive deviation that exceeds the mean radon level by more than twice the standard deviation. The origin and the mechanisms of the radon anomalies and their relationship to earthquakes
are yet poorly understood, although several in-situ and laboratory experiments have been
performed and mathematical modelings have been proposed. The radon observed in case of
anomalies correlated with geophysical events may be considered as having two possible
www.intechopen.com
Earthquake Research and Analysis – Statistical Studies, Observations and Planning
150
origins. Either it is produced in depth origin or, once produced locally, it is displaced by
other interstitial fluids whose motion is triggered by geodynamical events. Both possibilities
have been discussed so far but the local origin hypothesis seems to be the most reliable,
sustained by experiments too. In order to relate radon anomalies to earthquake occurrence,
several scenarios have been proposed. Accordingly to the dilatancy-diffusion model (Scholz,
1973; Planinic et al, 2001) the radon anomalies could be related to mechanical crack growth in
the volume of dilatancy or to changes in groundwater flow. Consequently either opening of
new cracks, widening or closing of old cracks or redistribution of open and closed cracks
can happen. In dry rocks opening or closing of cracks will lead to significant changes of the
diffusion coefficient of radon. Volumetric changes in the rock will also lead to a subsurface
gas flow and therefore to an additional radon transport. If the new open cracks are filled
with water the increased water-rock interface leads to an increase in the transfer of radon
from the rock matrix to the water. If water filled cracks close, the water will be compressed
to another subsurface volume where the emanation from the rock to the water may be
different. All these effects result in pressure and water level variations of the relevant
aquifer. This also can lead to changes in the mixing ratios for the water which can be
observed at the earth’s surface. Finally gas flows can also move some groundwater and
again all previously discussed mechanisms which are consequences of the redistribution of
water in the earth’s crust can take effects. This scenario has the drawback that an
unreasonably large change in stress or strain is required far away from the epicentre.
An alternative mechanism is the stress corrosion theory, first proposed by Anderson and Grew (1977). It attributes the radon anomalies to slow crack growth controlled by stress corrosion which should precede any mechanical cracking in wet environment. According to the mechanism of stress corrosion radon anomalies may depend on strain rate and local conditions such as rock type, porosity, elasticity, pattern of micro-cracks, degree of saturation, temperature, stress intensity factor and hygroscopic properties. If the local parameters of the rocks are assumed to be responsible for the radon anomalies an
explanation is needed to justify how very small changes in the stress field can produce such
effects. From the theory of the earthquake preparation process it could be derived that in a
region where the stress reaches a level which is not very far away from rock failure, very
small changes in the stress fields result in considerable changes in certain rock parameters. If
this theory holds, earthquake sensitivity could be expected only in areas which are highly
pressed, for example near fault zone systems, not necessarily seismic active.
According to another kind of mechanism, the compression mechanism proposed by King (1978), the anomalous radon concentration may be due to an increase in crustal compression, impending an earthquake, that squeezes out the soil-gas into the atmosphere at an increased rate. Radon anomalies have been observed at large distance from the earthquake epicentre, resulting from changes in the immediate vicinity of recording station, rather than at the distant focal region. This is accomplished if it is assumed that changes in stress or strain are propagated from the rupture zone to the radon station, leading to variations also in porosity, emanating power or flow rate of the local groundwater, near the radon monitoring station. When the diffusion constant of radon in a soil of average porosity and moisture content is
considered, the calculation shows that radon cannot be detected at a distance larger than a
few meters. When radon is pumped by an upward moving carrier, whose motion is of the
order of a few microns per second, it of course increases its concentration near the
www.intechopen.com
Radon as Earthquake Precursor
151
monitoring station while the underground is depleted in radon. Since the half-life of radon
is of 3.82 d, it would take a time larger than what is observed actually for those lower parts
to supply by radioactive decay only. A much longer radon gas column than the few meters
involved by mere diffusion should be involved. However, the most of the radon would
decay away before reaching the detection system. The motion of pore fluids would first of
all increase the radon concentration temporarily and then exhaust the available resources for
further increase.
4.1 Radon anomaly shapes
When radon concentrations are measured in continuous mode for a long time and with a
time resolution of at least one hour, it is possible to classify the observed radon anomalies
according to different trends. Typically two shapes can be considered that Friedman, 1991
classified group A and group B anomalies. Probably the physical process is different for the
two groups of anomalies.
The group A shows a very slow increase (or decrease) of the radon concentration with a rate
less than 0.1% per hour. This kind of anomaly can be linked to a continuous increase in
stress, until the rock fracture occurency.
The second group B is characterized by a fast increase (or decrease) in the radon
concentration with a rate of about 1% per hour. Often a fast increase is followed by a rather
constant radon concentration. Sometimes anomaly spikes with fast radon change
immediately followed by a fast change in the opposite direction. These two kind of B
anomalies could be linked to different physical processes or simply to different time scales
(Friedmann, 1991).
The B-type anomalies can be a local effect, which depends on certain local parameters, or
they can be an epicentral effect. In this case the epicentral area must be supposed as origin of
the fast change in stress.
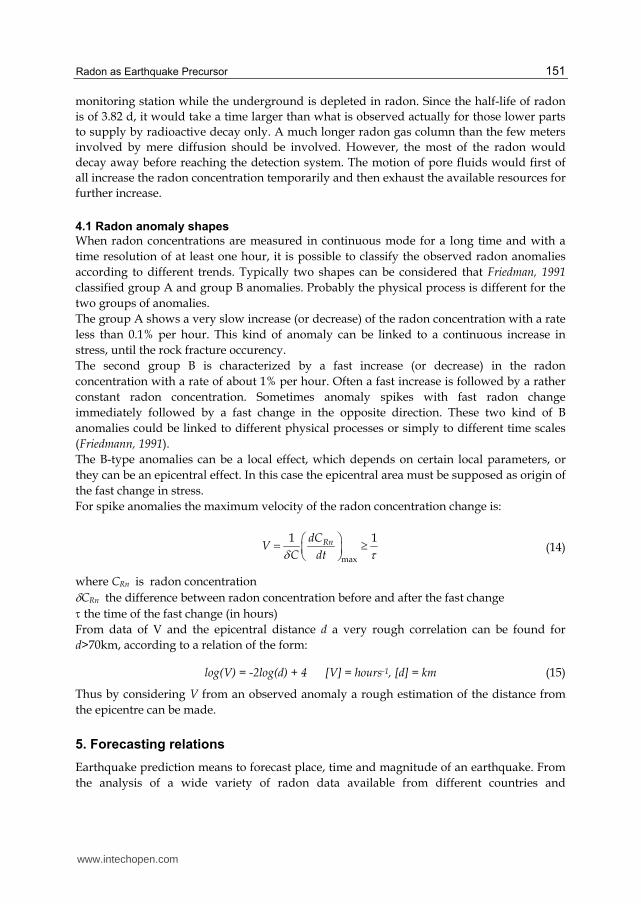
For spike anomalies the maximum velocity of the radon concentration change is:
max
1 1RndCV
C dt (14)
where CRn is radon concentration
CRn the difference between radon concentration before and after the fast change
the time of the fast change (in hours)
From data of V and the epicentral distance d a very rough correlation can be found for
d>70km, according to a relation of the form:
log(V) = -2log(d) + 4 [V] = hours-1, [d] = km (15)
Thus by considering V from an observed anomaly a rough estimation of the distance from
the epicentre can be made.
5. Forecasting relations
Earthquake prediction means to forecast place, time and magnitude of an earthquake. From
the analysis of a wide variety of radon data available from different countries and
www.intechopen.com
Earthquake Research and Analysis – Statistical Studies, Observations and Planning
152
earthquakes with M<3, Rikitake proposed an empirical relation between the time interval t
between radon anomaly and earthquake occurrence and magnitude of an earthquake
(Rikitake, 1976):
Log t = 0.76M – 1.83 (16)
The relation was modified by Fleischer depending on the time interval: (Rikitake, 1976):
Log t = M –2.16 for 0,1<t<7 days (17)
Log t = 0.62M –1.0 for t> 7 days (18)
Starting from the radon diffusion equation and analyzing radon data from many countries , Ramola et al (1988) proposed an empirical relation to predict the magnitude of strong earthquakes (M>5) :
M = 2log(RnCRn/KT) –15.26 (19)
where CRn is the anomalous variation of radon concentration, T rise time for radon anomaly and K is a constant (3.96 x 10⁻¹⁷). Several models were suggested in the past to evaluate the size of the area subject to changes in the tensional state. The models are based on assumption of homogeneity and isotropy of the ground or little heterogeneity around the focal zone. In particular, Dobrovolsky et al.(1979) proposed some relations, taking into account an ellipsoidal inclusion with a 30% of heterogeneity with respect to the surrounding ground. He obtained the following relations that connect the magnitude M and the maximum distance R that the deformation can reach with the amplitude of the deformation E:
1.5 9.18
3
1.3 8.19
3
105.0
105.0
M
M
E MR
E MR
(20)
On the basis of these relationships deformations that can generate an anomaly were evaluated to be of the order of 10-8 (Hauksson, 1981). Since radon anomalies seem to have a local origin, it is important to consider a relationship between the magnitude and the distance to the epicentre. If the maximum possible distance d between the epicentre of a forthcoming earthquake and the spring which can be influenced by this earthquake is proportional to the volume of the pre-stressed lithosphere or to the energy of the earthquake respectively, a relation holds of the form (Friedmann, 1991):
M = a � log(d) + b a,b = const (21)
From known relations between magnitude M and the volume of the focal zone the a-value can be determined to be about 2. Dobrovolsky et al.(1979) observed that precursory phenomena are not observed beyond the distance d, thus to estimate roughly the radius of the effective precursory manifestation zone, they proposed the formula:
d= 10 exp 0.43 M (22)
www.intechopen.com
Radon as Earthquake Precursor
153
where d is in km and M is the magnitude of the earthquake. It means that a magnitude 5 earthquake will be detected by means of precursory phenomena at a distance not greater than 142 km. By collecting and analyzing radon anomaly data Hauksson et and Goddard (1981) found a similar relation. It is important that all these relations do not differ by more than 30% in d
for M4. But the most interesting result is that all observed precursors are limited by a straight line which coincides practically with a computed deformation of 10-8. Summarizing the results in only one formula it is possible to estimate the magnitude-limit Mmin for the possibility of detecting a precursor anomaly at a distance d (in Km) to be
MMmin=(2.30.2)log(d)-(0.40.3) (23)
The constants in (23) may differ for different areas, however it is a good over all approximation. Of course we can expect that certain directions from the future epicentre are favored compared to others. The limit (23) must be seen as the limit for the favored directions. Another relation was proposed by Martinelli, 1992 for which:
M=2.4logd – 0.43 –0.4 (24)
While precursor time t (in days) related to the magnitude M and the epicentral distance d (in km) can be estimated as follows:
logdt = 0.63M + (-) 0.15 (25)
Long term series analyses have revealed a relation between the amplitude and duration of
the gaseous anomaly and the magnitude M of the expected earthquake (Barsukov et al.,
1984):
M K S (26)
where K is a correction factor and S is the area of the peak anomaly, thus the shape of the
peak is a diagnostic parameter for the forthcoming seismic event.
6. Radon anomalies and earthquakes: Some cases
Several radon investigations have been carried out all over the world. Measurements of this
gas both in soil and in groundwater have shown that spatial and temporal variations can
provide information about geodynamical events.
In the following we report some examples of studies among the numerous ones performed around the world with the purpose to relate abnormal radon emission to seismic events. The pioneering work on radon investigation in groundsoil was performed at an active fault
zone for two years (Hatuda, 1953). Radon concentration in soil gas was measured and
anomalous radon concentrations were reported before the strong earthquake (M=8) of
Tonankai (December 1944, Japan).
Some years later Tanner (Tanner, 1959) evidenced the importance of the influence of the
meteorological parameters on radon measurements and in 1964 he suggested that radon
could be used as tracer to discover uranium deposits or to predict earthquakes (Tanner,
1964).
www.intechopen.com

Earthquake Research and Analysis – Statistical Studies, Observations and Planning
154
The first evidence of radon in groundwater as precursor of earthquakes was observed in Tashkent (Ulomov, 1967). The author observed that the radon concentration in a spring near Tashkent increased constantly before the M=5.2 earthquake on April 15, 1966. Afterward many studies have been performed about radon anomalies and earthquakes. In the following some examples are reported on ground radon monitoring in the most seismic regions in the world.
6.1 Japan
As already cited, studies performed by Hatuda (Hatuda 1953), at an active fault zone evidenced anomalous radon concentration before the strong earthquake (M=8) of Tonankai. Radon anomalies were recorded before the Nagano Prefecture earthquake (M= 6.8) on September 14, 1984 (Hirotaka et al., 1988). The authors observed a gradual increase in radon counts three months before the quake and a remarkable increase two weeks before the shock. For about twenty years an extensive network of groundwater radon monitoring has been operated mainly by the University of Tokyo and the Geological Survey of Japan for the purpose of earthquake prediction in eastern Japan. In figure 1. a significant example of radon anomaly is reported (Igarashi et al., 1995). The authors performed radon concentration analysis in a well 17 m deep from November 1993 to March 1995 and observed stable radon concentration of 20 Bq/l at the end of 1993. The radon concentration started to increase gradually from October 1994 reaching 60 Bq/l on November 1994, three times that in the same period one year before. Furthermore, a sudden increase of radon concentration, recorded on 7 January was followed by a sudden decrease on 10 January, 7 days before an earthquake of magnitude 7.2. After the earthquake, the radon concentration returned to the pre-October 1994 levels. The main result of this example is that it is possible to observe strange behavior before an anomaly. This, for instance, as in this case, must be preceded by a continuous increasing in the background level till its manifestation. Naturally it depends on the geodynamical evolution of the area
Fig. 1. Radon concentration data at the well in the southern part of Nishinomiya city, Japan [From . Igarashi et al., 1995]
www.intechopen.com
Radon as Earthquake Precursor
155
6.2 India
In Bhatsadam, Maharashtra, India, major earthquakes occurred during August 1983 - July
1984. In that region radon concentration was measured by Rastogi et al.(1986). They found an
increase in radon concentration during March–April 1984 when seismicity was high enough.
Precursory phenomena of radon in earthquake sequence were observed by Rastogi et al.
(1987) and by other groups at the Osmansagar reservoir, Hederabad, India during January–
February, 1982 (Rastogi et al.,1987). An earthquake with a magnitude of 3.5 occurred on
January 14, 1982 with subsequent seismic events. There was an increase of radon
concentration in soil gas during February due to those high seismic activities.
Singh et al. (1991) performed a daily radon monitoring in soil-gas in Amritsar from 1984 to
1987. They recorded radon anomalies before different earthquakes: June 1988 (M=6.8);
April, 26, 1986 (M=5.7); July 1986 (M=3.8); Kangra earthquake March 1987 (M=7) and May
1987 (M= 5).
Virk and Singh (1994) carried out daily measurements of radon in soil-gas and groundwater at
Palampur since 1989 and radon anomaly was recorded simultaneously in both soil- gas and
groundwater. Weekly integrated data also showed abnormal radon behaviour during first
week of October, 1991 at different recording stations. These recorded anomalies were
correlated with an earthquake of magnitude 6.5 occurred in Uttarakashi area in October 1991.
6.3 Syria
Al-Hilal et al. (1998) recorded groundwater radon data for two years, during 1993 and 1994
at monthly intervals, from two selected monitoring sites of the northern extension of the
Dead Sea Fault System. The results showed that measured radon concentrations fluctuate
around the mean value, showing some variations with peak values, about two or three times
the mean value, preceding some seismic events. It is possible to consider those anomalies
related to changes in crustal strain and thereby to indicate a probable relation with the local
seismicity. Nevertheless, the authors conclude that this does not necessarily means that it is
possible to relate univocally these radon peaks to seismic event occurrence, but rather, it
may indicate the possibility of using groundwater radon variations as a useful tool.
6.4 Turkey
In soil radon gas was monitored by Friedmann et al. (1988) in a network of five monitoring
sites along 200 km at the North Anatolian Fault Zone, Bolu. They observed an increase in
radon concentration during the strong earthquake (M=5.7) on July 5, 1983. In order to search
some relation between earthquakes and radon concentration variations, more recently Inceoz
et al (2006) performed a radon investigation at the North and East Anatolian fault system.
They found that radon anomaly was quite significant in particular over the fault line but not
away from this line.
Also the Aksehir fault zone was investigated, by Baykara and Dogru (2006) and Yalim et al.
(2007), trough radon measurements in well water. Although the observed radon levels could
be related to several seismic activity that at the fault region occurred with high magnitude,
the authors did not infer correlation between seismic activity and radon concentration.
Radon concentration in thermal water was investigated by Erees et al. (2006,2007) at two thermal springs at the Denizli basin site and significant radon anomalies were observed before earthquakes with magnitude between 3.8 and 4.8.
www.intechopen.com

Earthquake Research and Analysis – Statistical Studies, Observations and Planning
156
6.5 Italy
In the last ten years systematic studies on Radon as precursor of geophysical events have been carried out on Mt. Etna since 2001 ( Immè et al, 2005; Immè et al. 2006a, Immè et al, 2006b; La Delfa et al. 2007; La Delfa et al., 2088; Morelli et al. 2006, Morelli et al., 2011). In particular two sites were investigated among the cropping up structural discontinuities, which lie along the NE-SW direction through the volcano. One site (Biancavilla) is in the SW flank, while the other one (Vena) is in the NE flank (circles in fig.2). Continuous monitoring was performed by using active systems with time resolution of 10 min. Capillary probes inserted into the soil at one meter depth, allowed to reduce influence from the meteorological parameters that were measured too.
Fig. 2. Mt. Etna map– Circles indicate the sites where devices for continuous in soil gas Radon monitoring were positioned
Several studies conducted in tectonic areas evidenced relation to earthquakes of magnitude bigger than 3 (Igarashi et al., 1995; Virk et al., 1994, Al-Hilal et al., 1998). The etnean area is characterized by a big number of earthquakes, up to about thousands per day before an eruptive period (Benina et al,1984; Patanè et al, 1995), but with low magnitude (< 3) and rarely they exceed magnitude 4. Moreover Mt. Etna has a very complex structure, due to the occurrence of both tectonic and volcanic phenomena. Major results have been obtained respect to a possible link between radon concentration and volcanic activity. Nevertheless, some relations were also observed with seismic events as reported by Immè et. al, 2005, the data are referred to the period 2001-2002. Radon concentration values started to increase the 27th of October 2002, reached the maximum the 1st of November 2002 and the minimum the 3rd of November 2002. During this period several earthquakes of magnitude higher than 3 occurred, some of them reached values up to M= 4.5 (29/10/02 time 09:02:00 epicentral area of Santa Venerina).
www.intechopen.com

Radon as Earthquake Precursor
157
It was observed that, as well as the radon raises the earthquake daily rate and strain release raise, correspondently at the eruption beginning. A radon anomaly was recorded before the November 3rd event (M= 3.5), with epicentral zone close (less than 1 km) to the Vena Station (NE station), also associated to evident soil fractures.
Fig. 3. Radon concentration (black line), daily earthquakes rate (black column bar) and strain release (grey histogram) measured in the period between 1st September 2002 and 30th November 2002 (Vena station).[Immè et al., 2005]
More recently a systematic radon investigation was extended to fault systems, in particular the Pernicana fault, one of the more active etnean fault, was chosen as first monitoring area. In particular, two different horizontal profiles, orthogonally to the main fault plane, were investigated. The first one was located at 1400m asl, the second one at 1370m asl (Giammanco et al, 2009). Each profile consisted of ten measurement points where CO2 efflux values were also measured. Concentrations of 222Rn were obtained by means of three different methodologies: passive, spot and continuous. The pattern of soil 222Rn values measured in the two profiles is clearly similar: higher values were generally recorded on the up thrown side of the fault and the lowest values occurred generally close to the main fault plane. Differently to radon, higher CO2 emissions were recorded on the fault plane. This behavior can be justified by the in-soil gas transport mechanism. In particular, along the main fault plane, advective transport of deep gases (CO2, Rn) occurs because of the high ground fracturation and permeability. Near the surface, dilution of radon by CO2 prevails, thus producing lower radon values. This kind of investigations is useful to study the dynamics of the faults and the possible earthquake mechanisms.
7. Conclusion
From many years a lot of efforts have been done in order to improve in-situ radon data monitoring and analysis, technical methodologies and mathematical modeling, with the aim to reinforce the link between ground radon concentration anomalies and geodynamical
www.intechopen.com
Earthquake Research and Analysis – Statistical Studies, Observations and Planning
158
events. Measurements of radon gas in soil and in ground water have been carried out all over the world and the results seem to indicate the radon as a good indicator of crustal activity such as earthquakes. However, the current literature describing the possible correlation between radon levels and earthquake activity uses such qualifying and caution words as possible, apparent, limited, could, sometimes, may be, and so on. It is clear that in some cases there are precursor changes in radon levels, but that the causal relationship or mechanism relating these to earthquake activity is not yet well understood. Thus, even if some results seem to suggest that geodynamical events could influence radon concentrations, however, because of the complexity of its transport mechanism, the correlation needs more investigations in order to clearly and firmly established it. Further contributions can be obtained from more extended continuous data recording, in particular near active faults, and from the comparison with other earthquake precursors.
8. References
Al-Hilal, M., Sbeinati, M.R. and Darawcheh, R. (1998) Radon variation and microearthquakes in western Syria. Applied Radiation and Isotopes Vol.49, Nos.1-2, pp. 117-123
Anderson, O.L., and Grew, P.C. (1977) Stress corrosion theory of crack propagation with application to geophysics. Rev. Geophys. Space Phys., Vol. 15, 77-104.
Antsilevich, M.G. (1971). An attempt to forecast the moment of origin of recent tremors of the Tashkent earthquake through observations of the variation of radon. Izvestiâ Akademii nauk Uzbekskoj SSR 188-200.
Barsukov, V.l., Varshal, G.M., Garanin, A.B., and Serebrennikov, V.S. (1984). Hydrochemical Precursors of Earthquakes. Earthquake Prediction, UNESCO, Paris,169-180.
Baykara, O., Dogru, M. (2006). Measurements of radon and uranium concentration in water and soil samples from East Antolian active fault systems (Turkey). Radiation Measurements 41 (3), 362–367.
Benina, A., Imposa, S., Gresta, S., Patanè, G. (1984). Studio macrosismico e strutturale di due terremoti tettonici avvenuti sul versante meridionale dell’Etna, Atti III convegno annuale del GNGTS; 931-946
Dobrovolsky, I.P., Zubkov, S.I., Achkin, V.I. (1979). Estimation of the size of earthquakes preparation zone. Paleoph.,Vol.117, 1025-1044.
Erees, F.S., Yener, G., Salk, M., Ozbal, O. (2006). Measurements of radon content in soil gas and in the thermal waters in Western Turkey. Radiation Measurements, 41, 354–361.
Erees, F.S., Aytas, S., Sac, M.M., Yener, G., Salk, M. (2007). Radon concentrations in thermal waters related to seismic events along faults in the Denizli Basin, Western Turkey. Radiation Measurements, 42, 80–86.
Friedmann, H., Aric, K., Gutdeutsch, R., King, C.Y., Altay, C., Sav, H. (1988). Radon measurements for earthquake prediction along the North Anatolian Fault Zone: a progress report. Tectonophysics 152 (3–4), 209–214.
Friedmann, H. (1991) Selected problems in Radon measurement for earthquake prediction Proceedings of the Second workshop on Radon Monitoring in Radioprotection, Environmental and/or Earth Science, Furlan, G. and Tommasino, L. (Ed.) World Scientific.307-316.
www.intechopen.com

Radon as Earthquake Precursor
159
Gauthier, P-J. and Condomines, M. (1999). 210Pb - 226Ra radioactive disequilibria in recent lavas and radon degassing: inferences on the magma chamber dynamics at Stromboli and Merapi volcanoes. Earth and Planetary Science Letter, Vol. 172, 111-126.
Giammanco, S., Immè, G., Mangano, G., Morelli, D., Neri, M. (2009). Comparison between different methodologies for detecting Radon in soil along an active fault: the case of the Pernicana fault system, Mt. Etna(Italy). Applied radiation and Isotopes 67, 178 -185.
Hauksson, E. (1981). Radon content of groundwater as an earthquake precursor: evaluation of worldwide data and physical basis. Journal of geophysical research, Vol. 86, 9397-9410.
Hauksson, E., Goddard J.G (1981). Radon earthquake precursor studies in Iceland. J. Geophys. Res. , Vol.86, No. B8, 7037-7054
Hatuda, Z. (1953). Radon content and its change in soil air near the ground surface. Memoirs of the College of Science, University of Kyoto, Series B 20, 285–306.
Hirotaka, U., Moriuchi, H., Takemura, Y., Tsuchida, H., Fujii, I., Nakamura, M. (1988). Anomalously high radon discharge from the Atotsugawa fault prior to the western Nagano Prefecture earthquake (m 6.8) of September 14, 1984. Tectonophysics 152 No 1–2, 147–152.
Igarashi, G., Saeki, S., Takahata, N., Sumikawa, K., Tasaka, S., Sasaki, Y., Takahashi, M., Sano ,Y. (1995). Ground-water radon anomaly before the Kobe earthquake in Japan Science Vol. 269, 60-61.
Imamura, G. (1947). Report on the observed variation of the Tochiomata hot spring immediately before the Nagano earthquake of july 15, 1947, Kagaku, 11, 16-17
Immè, G., La Delfa, S., Lo Nigro, S., Morelli D., Patanè, G. (2005). Gas Radon emission related to geodynamic activity of Mt. Etna. Annals of Geophysics, 48 N.1, 65-7.
Immè, G., La Delfa, S., Lo Nigro, S. , Morelli D., Patanè, G. (2006a) Soil Radon concentration and volcanic activity of Mt. Etna before and after the 2002 eruption. Radiation Measurements Vol.41, 241-245.
Immè, G., La Delfa, S., Lo Nigro, S., Morelli D., and Patanè, G. (2006b). Soil Radon monitoring in NE flank of Mt. Etna (Sicily), Applied Radiation and Isotopes, Vol.64, 624-629.
Inceoz, M., Baykara, O., Aksoy, E., Dogru, M. (2006). Measurements of soil gas radon in active fault systems: a case study along the North and East Anatolian fault systems in Turkey. Radiation Measurements 41 (3), 349–353.
King, C.Y. (1978). Radon emanation on San Andreas Fault. Nature, Vol. 271, 576-519. La Delfa, S., Immè, G., Lo Nigro, S., Morelli, D., Patanè, G., Vizzini, F. (2007) Radon
measurements in the SE and NE flank of Mt. Etna (Italy). Radiation Measurements, Vol. 42, 1404-1408
La Delfa, S., Agostino, I., Morelli, D., Patanè, G. (2008). Soil Radon concentration and effective stress variation at Mt Etna (Sicily) in the period January 2003-April 2005 Radiation Measurements 43 1299- 1304.
Martinelli, G. (1992). Fluidodynamical and chemical features of radon 222 related to total gases: implications on earthquakes prediction topics. IAEA-TECDOC-726 Isotopic and geochemical precursors of earthquakes and volcanic eruptions Proceedings of an Advisory Group Meeting held in Vienna, 9-12 September 1991, 48-62.
Morelli, D., Immè, G., La Delfa, S. , Lo Nigro, S., Patanè, G. (2006). Evidence of soil Radon as tracer of magma uprising at Mt. Etna. Radiation Measurements Vol. 41, 721-725
www.intechopen.com

Earthquake Research and Analysis – Statistical Studies, Observations and Planning
160
Morelli, D., Immè, G., Altamore, I., Cammisa, S. , Giammanco, S. , La Delfa, S. , Mangano, G., Neri, M., Patanè, G. (2011). Radionuclide measurements, via different methodologies, as tool for geophysical studies on Mt. Etna. Nuclear Instruments and Methods in Physics Research A, DOI NIMA 10.1016/j.nima.2011.01.172
Patanè, G., Coco, G., Corrao, M., Imposa, S. Montalto, A. (1995): Source parameters of seismic events at Mount Etna Volcano, Italy, during the outburst of the 1991-1993 eruption. Phys. earth and Planet. Inter., 89, 149-162
Planinic, J., Radolic, V., Lazanin, Z. (2001). Temporal variation of radon in soil related to earthquakes. Applied Radiation and Isotopes ,Vol. 55, 267-272.
Ramola, R.C., Sing, S. and Virk, H.S. (1988). The correlation between radon anomalies and magnitude of earthquakes. Nucl. Tracks Radiat. Meas. ,Vol. 15, 689-692.
Rastogi, B.K., Chadha, R.K., Raju, I.P., (1986). Seismicity near Bhatsa reservoir, Maharashtra, India. Physics of the Earth and Planetary Interiors 44 (2), 179–199.
Rikitake, T., (1976). Earthquake prediction developments in solid earth. Geophysics., Vol.9 357 Sabol, J. and Weng, P.-S. (1995). Introduction to radiation protection dosimetry. World Scientific,
Singapore Scholz, C.H., Sykes, L.R. and Aggarwal, Y. P.(1973). Earthquake prediction a physical basis.
Science, Vol. 181, 803-810. Shiratoi, K., (1927). The variation of radon activity of hot spring . Science Reports of the
Tohoku Imperial University, Series 3 (16), 1725-1730. Spitsyn, V. I., (1926). Collection of studies on radium and radioactive ores, 264 Tanner, A.B. (1959). Meterological influence on radon concentration in drill holes. Mining
Engineering, Vol.11, 706-708. Tanner, A.B. (1964). Radon migration in the ground : a supplementary review. The natural
radiation environment. In Lowder, W.M. (Ed.). symposium proc. Houston, Texas, April 10-13, 1963. University of Chicago Press. Chicago, III, 161-190.
Singh, M., Ramola, R. C., Singh, B. , Singh S. and Virk, H.S.(1991). Radon anomalies: correlation with seismic activities in northern India. Proceedings of the Second workshop on Radon Monitoring in Radioprotection, Environmental and/or Earth Science, Furlan, G. and Tommasino, L. (Ed.) World Scientific.,354-375.
Ulomov, V.I., Zakharovc, A, I. and Ulomova, N.V. (1967). Tashkent earthquake of April 26, 1966, and its aftershocks. Akad Nauk SSSR, Geophysic 177, 567-570
Virk, H. S. and Singh, B. (1994). Radon recording of Uttarkashi earthquakes. Geophysical Research Letters, Vol.21, No.8, pp.737-740
Wattananikorn, K., Kanaree, M. and Wiboolsake, S. (1998). Soil gas radon as an earthquake precursor: some considerations on data improvement. Radiation Measurements Vol. 29, No.6, pp.593-598.
Yalim, H.A., Sandikcioglu, A., Unal, R., Orhun, O., (2007). Measurements of radon concentrations in well waters near the Aksehir fault zone in Afyonkarahisar, Turkey. Radiation Measurements 42, 505–508.
www.intechopen.com

Earthquake Research and Analysis - Statistical Studies,Observations and PlanningEdited by Dr Sebastiano D'Amico
ISBN 978-953-51-0134-5Hard cover, 460 pagesPublisher InTechPublished online 02, March, 2012Published in print edition March, 2012
InTech EuropeUniversity Campus STeP Ri Slavka Krautzeka 83/A 51000 Rijeka, Croatia Phone: +385 (51) 770 447 Fax: +385 (51) 686 166www.intechopen.com
InTech ChinaUnit 405, Office Block, Hotel Equatorial Shanghai No.65, Yan An Road (West), Shanghai, 200040, China
Phone: +86-21-62489820 Fax: +86-21-62489821
The study of earthquakes plays a key role in order to minimize human and material losses when theyinevitably occur. Chapters in this book will be devoted to various aspects of earthquake research and analysis.The different sections present in the book span from statistical seismology studies, the latest techniques andadvances on earthquake precursors and forecasting, as well as, new methods for early detection, dataacquisition and interpretation. The topics are tackled from theoretical advances to practical applications.
How to referenceIn order to correctly reference this scholarly work, feel free to copy and paste the following:
Giuseppina Immè and Daniela Morelli (2012). Radon as Earthquake Precursor, Earthquake Research andAnalysis - Statistical Studies, Observations and Planning, Dr Sebastiano D'Amico (Ed.), ISBN: 978-953-51-0134-5, InTech, Available from: http://www.intechopen.com/books/earthquake-research-and-analysis-statistical-studies-observations-and-planning/radon-as-earthquake-precursor