railway reform in south east europe and turkey: on the...
TRANSCRIPT
Railway Reform in South East Europe and Turkey: On the Right Track? Annexes
137
THE RAILWAYS OF BOSNIA AND HERZEGOVINA113
252. The railways in Bosnia and Herzegovina have a complex and costly structure, reflecting their difficult recent history. Prior to 1991, the railways in Bosnia and Herzegovina were a fully integrated part of the former Yugoslavian railways. When Bosnia and Herzegovina become independent in 1991, a new state railway company was formed. Following the Dayton Peace Accords of 1995, the state railway company was divided into three regional state owned companies reflecting the ethnic divisions of the country. In 2001, the FBH adopted a new railway law that merged the railway companies in the Croat and Bosnian parts of the country to create Željeznice Federacije Bosne i Herzegovine (ŽFBH). However, the railway in the RS, Željeznice Republike Srpske (ŽRS), remained separate. The sector now includes two vertically integrated railway companies, and a state level coordinating body, Bosanskohercegovačka Željeznička Javna Korporacija (BHŽJK).
253. The railway network in Bosnia and Herzegovina extends for some 1,017 km. It is based on a standard gauge (1,435 mm) and the majority is single track (92 percent). After extensive rehabilitation, more than 85 percent of the network is now classified as D4 in terms of UIC load categories, allowing maximum loads of 22.5 tons per axle, or 8.0 tons per linear meter. Around 76 percent of the network is electrified with a mono-phase 25kV, 50HŽ AC system. The only non-electrified part of the railway network is located in the north-eastern part of the country, around Tuzla, but it is important in traffic terms. All lines are single-track, except one section of 87 kilometers of Corridor Vc between Zenica and Doboj.
254. The railway network comprises two main strategic lines, which are also the main railway lines for cargo. The two include: (i) The North-South Bos.Samac-Doboj-Zenica-Sarajevo-Mostar-Capljina line located on Corridor Vc (which connects Budapest in Hungary to Ploce in Croatia); and (ii) the West-East Dobrjlin–Bos.Novi-Banja Luka-Doboj-Tuzla-Zvornik line which is the railway line parallel to Corridor X. The rehabilitation of the core railway network, in particular Pan-European Corridor Vc and the east-west line parallel to Corridor X are deemed to be critical first steps. In 2005, the EBRD approved euro 70 million (US$102 million) for a program of track renewal on key sections of both corridors, together with rehabilitation of the station signaling system and purchase of track machinery.
Operational Performance 255. In Bosnia and Herzegovina passenger traffic is dwarfed by freight traffic, with the latter accounting for 94.2 percent of total traffic in 2009.114 Passenger traffic has risen by 30 percent over the decade, from a very low base—47 million passenger-km in 2000 to 61 million
113 This section is based in part on Annex 3 of the World Bank’s Bosnia and Herzegovina: The Road to Europe, Transport Sector Review, Transport Unit, Sustainable Development Department, Europe and Central Asia Region, Report No. 54406-BH, May 2010. 114 Reliable figures on the traffic volumes carried by Bosnia’s railways are difficult to obtain. The numbers for both freight and passenger traffic have to be treated with a degree of caution, as a simple addition of traffic data from the two entity railway companies overestimates actual traffic. Both ZFBH and ZRS count traffic with an origin in one of the entities and a destination in the other in their respective figures. Traffic with an origin and destination in one of entities, where it crosses the other, is counted by the latter as transit traffic. This requires careful consideration in the appraisal of prospective investments.
Railway Reform in South East Europe and Turkey: On the Right Track? Annexes
138
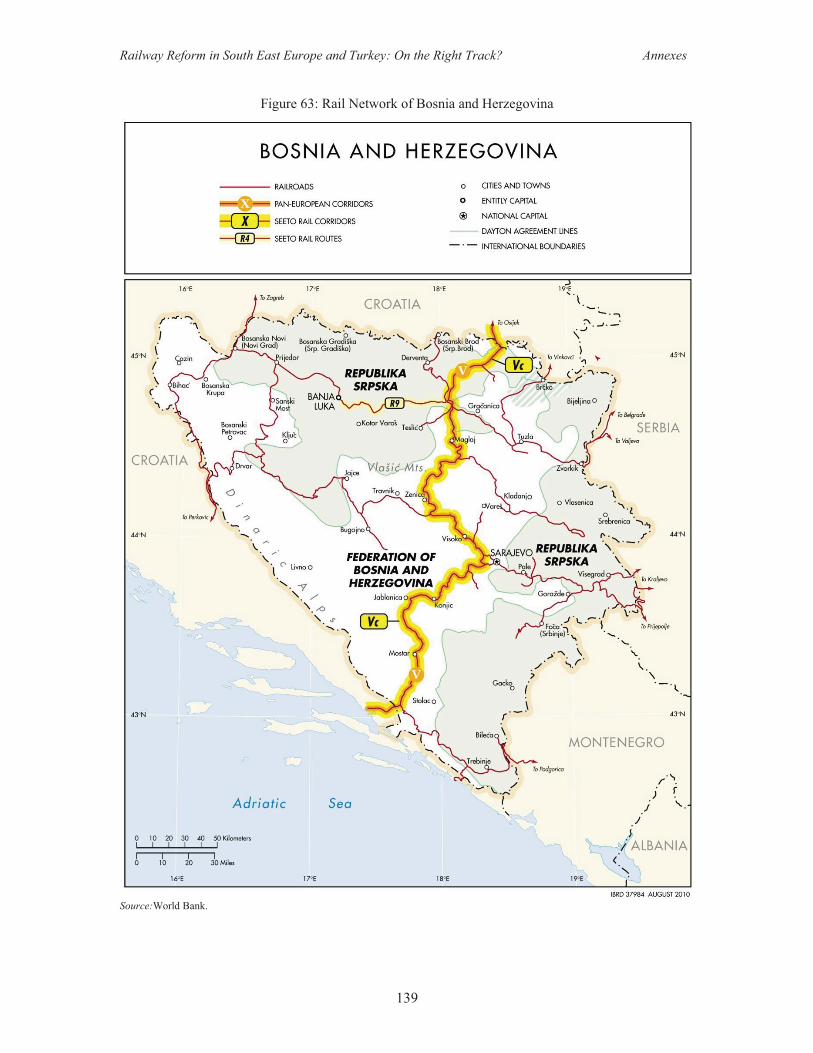
passenger-km in 2009. Its share in the total traffic has declined from 18 percent in 2000 to 4.6 percent in 2005 and to 5.8 percent by 2009. Figure 64 presents a break-down of passenger traffic between the two entity-level railway undertakings, and reveals that there has been a large rise, albeit from a very modest base, for passenger transport carried by ŽFBH, but not for ŽRS. In fact, over 2000-2009, passenger transport rose by 277.8 percent for ŽFBH, while for ŽRS it declined by 28.9 percent. In 2009, passenger transport was a mere 34 million passenger-km for ŽFBH and 27 million passenger-km for ŽRS—these are the lowest passenger traffic figures for the 10 countries included in this report, with the exception of Albania and Kosovo. In 2009, the average number of passengers in a ŽFBH train was a mere 35, down from 37 in 2008, in a train consisting on average of 2.11 coaches for a distance of 73 km.
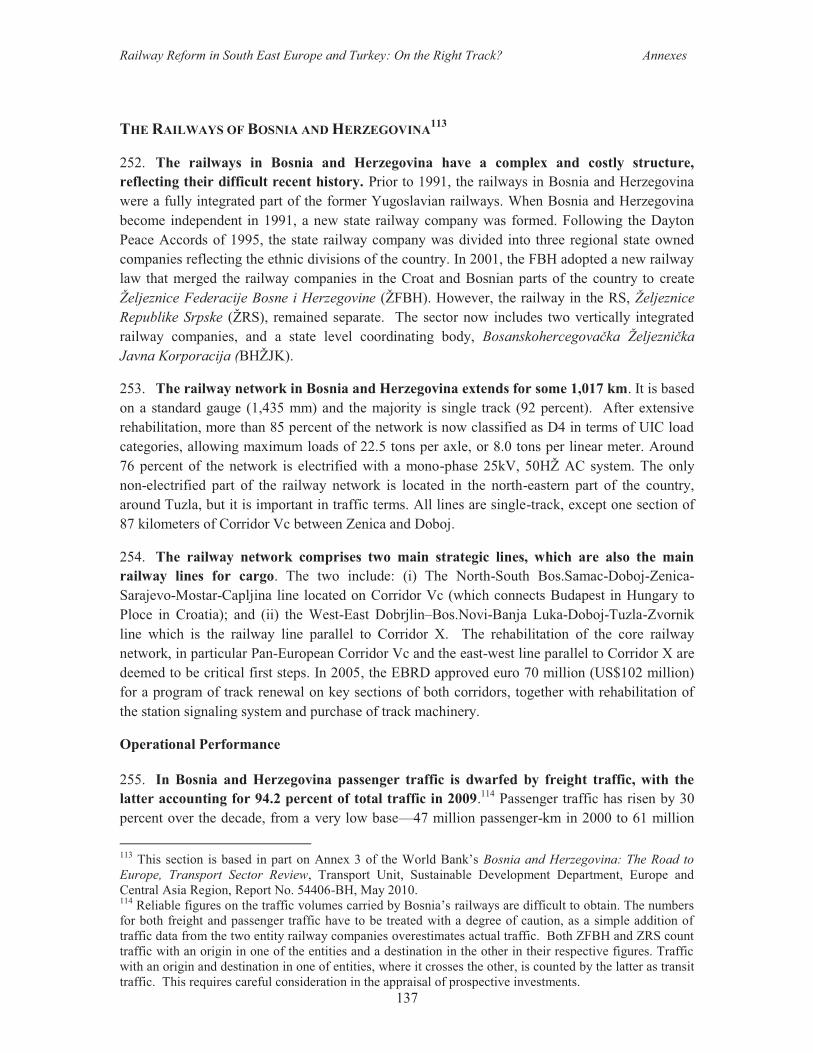
Figure 62: Bosnia and Herzegovina – Rail Traffic, 2000-2009
Source: UIC.
256. Rail traffic is dominated by developments in freight transport. Freight traffic has more than tripled, increasing from 214 million ton-km in 2000 to 988 million ton-km in 2009.115 The reopening of some of the heavy and extractive industries in Bosnia and Herzegovina since 2004, particularly in the FBH, has led to an increase in both tons and ton-km. Figure 65 shows that the gap in traffic between ŽFBH and ŽRS has increased over the decade, although both railway undertakings experienced rapid growth: traffic grew by 375 percent for ŽFBH and by 336 percent for ŽRS. However, ŽFBH traffic stood at 665 million ton-km, double the 332 million ton-km of ŽRS.
115 The commodity structure of freight traffic is dominated by bulk cargo. The main commodities include iron ore and bauxite, lignite, aluminum and hydrated alumina, coking coal and coke, and scrap. Major clients include (i) Elektroprivreda with coal transported from the coal mines to coal-fired power stations, mainly in Tuzla and Kakanj; (ii) Mittal Prijedor export of iron ores; (iii) GIKIL Lukavac with imports of coking coal and export of coke; (iv) Birac Zvornik and hydrated alumina; (v) Mittal Zenica with scrap and metallurgical products; and Aluminj Mostar. The traffic volume of these clients represented over 80 percent of total railway traffic in ZFBH, which represents a relatively strong concentration on a few rail clients and a few commodities.
0
200
400
600
800
1,000
1,200
1,400
2000 2001 2002 2003 2004 2005 2006 2007 2008 2009
Passenger (million pass-km) Freight (million ton-km)
Railway Reform in South East Europe and Turkey: On the Right Track? Annexes
139
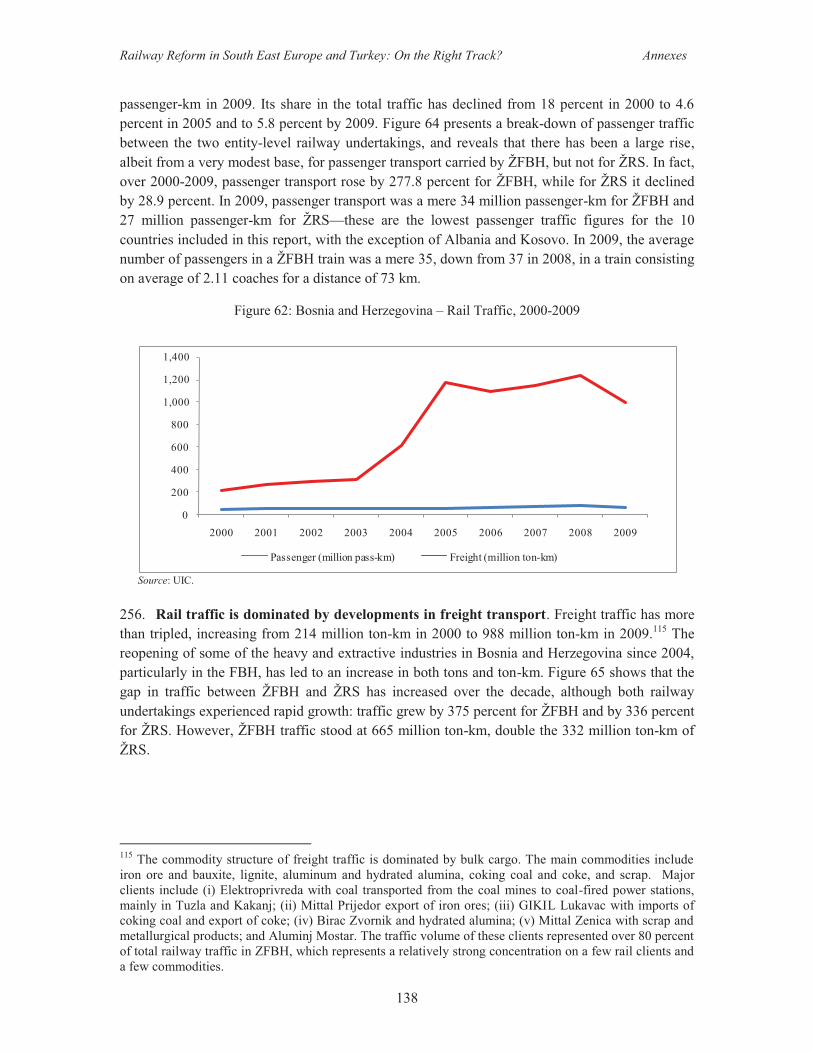
Figure 63: Rail Network of Bosnia and Herzegovina
Source:World Bank.
Railway Reform in South East Europe and Turkey: On the Right Track? Annexes
140
258. Vis-à-vis the EU average, rail traffic intensity in Bosnia and Herzegovina has remained largely unchanged over 2000-2009. Rail traffic intensity fell from 1,230,060 traffic units per km of network in 2000 to 1,032,480 traffic units per km, down from 34 percent to 33 percent of the EU average, reflecting lack of progress over the decade. However, there are considerable differences between the performance of ŽFBH and ŽRS: ŽFBH traffic intensity is 27.8 percent higher than ŽRS, making the former equal to 38 percent of the EU average versus 27.8 percent for ŽRS. Traffic intensity is undoubtedly being pulled down by passenger services: in 2009, freight traffic intensity in Bosnia and Herzegovina reached 969,886 traffic units per rail route-km, equal to 76 percent of the EU average, rising to 86 percent of the EU average for ŽFBH and equivalent to 60 percent of the EU average for ŽRS. The intensity of overall infrastructure usage for freight transport, particularly in the case of ŽFBH, is high compared to other countries in the region. Nevertheless, the low levels of passenger traffic reduce overall traffic intensity, with negative financial repercussions on the performance of both ŽFBH and ŽRS.
Figure 64: BH- Passenger Rail Traffic, 2000-09 Figure 65: BH- Freight Rail Traffic, 2000-09
Source: UIC. Source: UIC.
259. The overall condition of the railway network in Bosnia and Herzegovina remains poor, with operational weaknesses reducing line capacity markedly. Despite extensive rehabilitation, overall operational speeds remain low, due to the following: (i) temporary speed restrictions arising from the condition of some tunnels (notably Tunnel Ivan south of Sarajevo where there is a speed restriction of 40 km/hour); (ii) poor track alignment (due to topography and gradient) and condition; and (iii) the number and functioning of crossings. On around 80 percent of the railway lines on Corridor Vc, train speed is limited to a range of between 30 km/hour and 70 km/hour, depending upon the conditions of the track. In addition, there are limitations in ballast in the curves, weak sleepers, and inadequate fastenings. Another significant problem is the length of the crossing sidings in stations (with a usable length of 570 meters), leading to restrictions on train length (550 meters) and train weight (1,500 tons).
0
10
20
30
40
50
60
70
80
2000 2001 2002 2003 2004 2005 2006 2007 2008 2009
ZFBH ZRS Total
0
200
400
600
800
1,000
1,200
1,400
2000 2001 2002 2003 2004 2005 2006 2007 2008 2009
ZFBH ZRS Total

Railway Reform in South East Europe and Turkey: On the Right Track? Annexes
141
Figure 66: BH- Traffic Intensity, 2005-09 Figure 67: BH- Labor Productivity, 2005-09
Source: UIC. Source: UIC.
260. Labor productivity, as measured by the number of traffic units per employee, has not improved over 2005-2009, and is less than a third of EU levels. In the case of ŽFBH, labor productivity rose in 2006-2008, before declining to 172,380 traffic units per employee in 2009—equal to 29 percent of the EU average (Figure 67)—while staff levels rose by 8 percent to 4,055.116 ŽRS has very low labor productivity, and it has declined annually during the last five years, to 101,952 traffic units per staff in 2009. This is only 59 percent of the ŽFBH level in 2009, and a mere 17 percent of EU levels—the lowest in ten countries covered in this study after Albania. ŽRS employees rose by 4 percent in 2005-2009, to 3,433. Given such low labor productivity levels, particularly for ŽRS, the question needs to be asked as to why additional employees are being recruited, given the impact this will have on the cost structure. According to the RS Government Strategy for the rails sector, number of employees and current expenditure on the work force are not in line with business results, and need to be reduced to sustainable levels.117 With 2,082 staff working in the infrastructure department of ŽRS, this represents 5 staff per km of track—which is extremely high and indicative of overstaffing.118 For ŽFBH, there are 2,084 staff working in infrastructure, equivalent to 3.5 staff per km of track—which although lower than for ŽRS, is on the high side.119
261. The age structure of key rail infrastructure is generally old, in both ŽFBH and ŽRS. The age structure of the: (i) telecommunications installations; (ii) catenary system; (iii) relay interlocking system, and (iv) signaling system are presented in Figure 68 for ŽFBH and Figure 69 The relay system in ŽFBH was installed over the last 10 years—but over 50 percent of the three other types of infrastructure was installed over 40 years ago and is in need of upgrading. Over 60
116 ZFBH calculates its labor productivity at 211,462 net ton-km per employee in 2009 using the number of workers based on the number of working hours, instead of the total number of staff. According to agreed criteria of an EBRD credit, productivity, measured in this way, should not be less than 200,000 traffic units per employee. See Railways of Federation Bosnia and Herzegovina Ltd (2010a), Report on Operations Railway Federation of B&H For 2009 ,Sarajevo, February 2009. 117 Government of Republika Srpska (2009), Development Strategy for Railways of Republika Srpska 2009-2015, Banja Luka, August 2009. 118 ZRS (2009), Business Plan Railways of the Republika Srpska, JSC Doboj, 2009-2011. Doboj, January 2009. 119 Railways of Federation Railways of Federation Bosnia and Herzegovina Ltd (2010), Report on Operations Railway of Federation B&H For Year 2009, Sarajevo, February 2010.
20%
25%
30%
35%
40%
45%
700,000
800,000
900,000
1,000,000
1,100,000
1,200,000
1,300,000
1,400,000
1,500,000
1,600,000
2005 2006 2007 2008 2009ZFBH ZRS% of EU average (ZFBH) % of EU average (ZRS)
3,000
3,200
3,400
3,600
3,800
4,000
4,200
90,000
110,000
130,000
150,000
170,000
190,000
210,000
230,000
250,000
2005 2006 2007 2008 2009
ZFBH Traffic units/staff ZRS Traffic units/staffZFBH Staff ZRS Staff
Railway Reform in South East Europe and Turkey: On the Right Track? Annexes
142
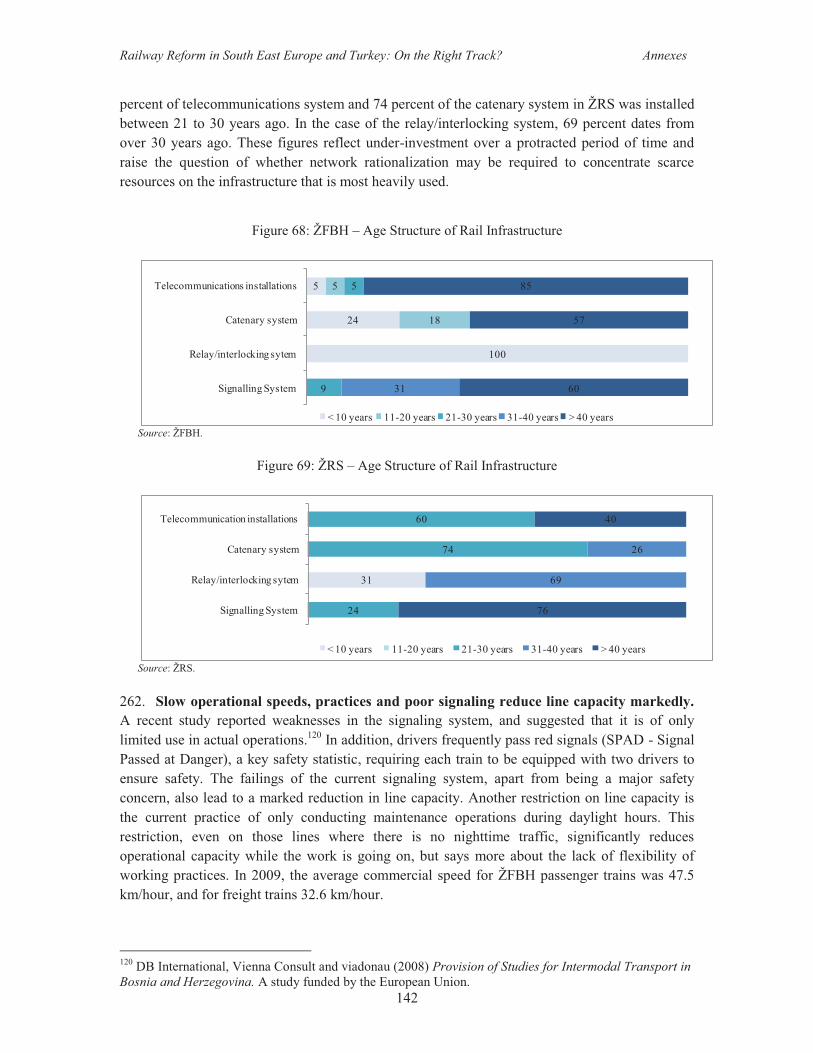
percent of telecommunications system and 74 percent of the catenary system in ŽRS was installed between 21 to 30 years ago. In the case of the relay/interlocking system, 69 percent dates from over 30 years ago. These figures reflect under-investment over a protracted period of time and raise the question of whether network rationalization may be required to concentrate scarce resources on the infrastructure that is most heavily used.
Figure 68: ŽFBH – Age Structure of Rail Infrastructure
Source: ŽFBH.
Figure 69: ŽRS – Age Structure of Rail Infrastructure
Source: ŽRS.
262. Slow operational speeds, practices and poor signaling reduce line capacity markedly. A recent study reported weaknesses in the signaling system, and suggested that it is of only limited use in actual operations.120 In addition, drivers frequently pass red signals (SPAD - Signal Passed at Danger), a key safety statistic, requiring each train to be equipped with two drivers to ensure safety. The failings of the current signaling system, apart from being a major safety concern, also lead to a marked reduction in line capacity. Another restriction on line capacity is the current practice of only conducting maintenance operations during daylight hours. This restriction, even on those lines where there is no nighttime traffic, significantly reduces operational capacity while the work is going on, but says more about the lack of flexibility of working practices. In 2009, the average commercial speed for ŽFBH passenger trains was 47.5 km/hour, and for freight trains 32.6 km/hour.
120 DB International, Vienna Consult and viadonau (2008) Provision of Studies for Intermodal Transport in Bosnia and Herzegovina. A study funded by the European Union.
100
24
5
18
5
9
5
31 60
57
85
Signalling System
Relay/interlocking sytem
Catenary system
Telecommunications installations
< 10 years 11-20 years 21-30 years 31-40 years > 40 years
31
24
74
60
69
26
76
40
Signalling System
Relay/interlocking sytem
Catenary system
Telecommunication installations
< 10 years 11-20 years 21-30 years 31-40 years > 40 years
Railway Reform in South East Europe and Turkey: On the Right Track? Annexes
143
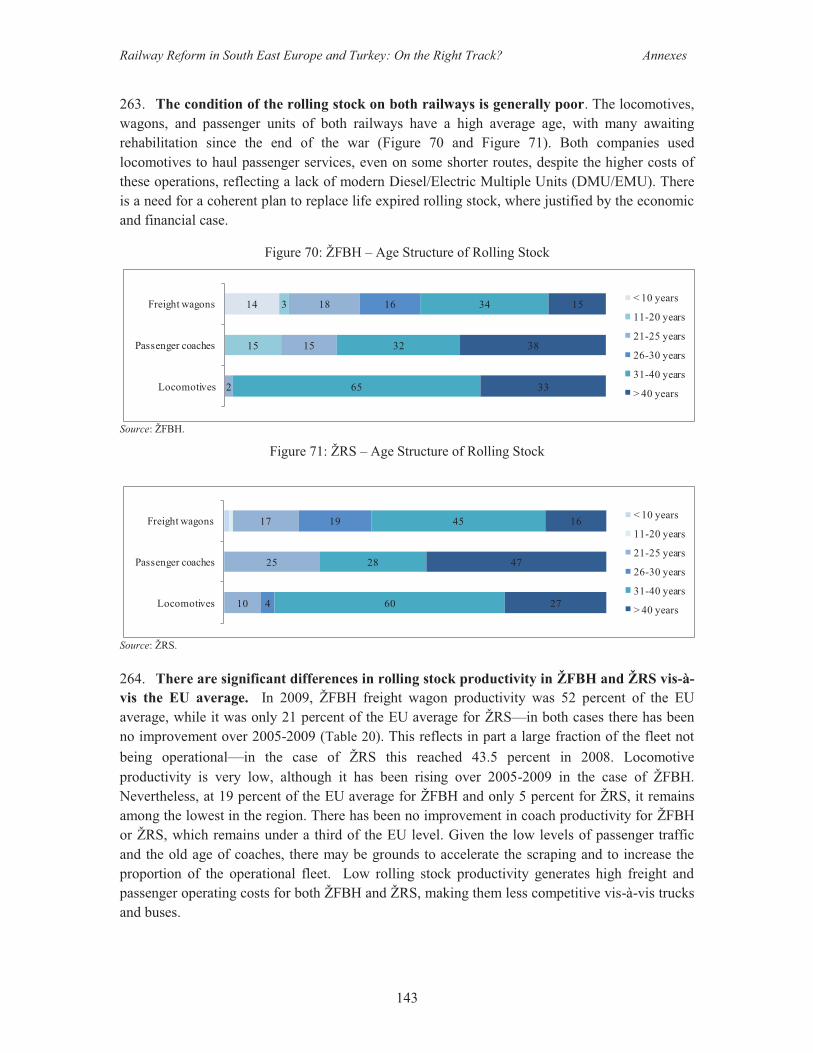
263. The condition of the rolling stock on both railways is generally poor. The locomotives, wagons, and passenger units of both railways have a high average age, with many awaiting rehabilitation since the end of the war (Figure 70 and Figure 71). Both companies used locomotives to haul passenger services, even on some shorter routes, despite the higher costs of these operations, reflecting a lack of modern Diesel/Electric Multiple Units (DMU/EMU). There is a need for a coherent plan to replace life expired rolling stock, where justified by the economic and financial case.
Figure 70: ŽFBH – Age Structure of Rolling Stock
Source: ŽFBH.
Figure 71: ŽRS – Age Structure of Rolling Stock
Source: ŽRS. 264. There are significant differences in rolling stock productivity in ŽFBH and ŽRS vis-à-vis the EU average. In 2009, ŽFBH freight wagon productivity was 52 percent of the EU average, while it was only 21 percent of the EU average for ŽRS—in both cases there has been no improvement over 2005-2009 (Table 20). This reflects in part a large fraction of the fleet not being operational—in the case of ŽRS this reached 43.5 percent in 2008. Locomotive productivity is very low, although it has been rising over 2005-2009 in the case of ŽFBH. Nevertheless, at 19 percent of the EU average for ŽFBH and only 5 percent for ŽRS, it remains among the lowest in the region. There has been no improvement in coach productivity for ŽFBH or ŽRS, which remains under a third of the EU level. Given the low levels of passenger traffic and the old age of coaches, there may be grounds to accelerate the scraping and to increase the proportion of the operational fleet. Low rolling stock productivity generates high freight and passenger operating costs for both ŽFBH and ŽRS, making them less competitive vis-à-vis trucks and buses.
14
15
3
2
15
18 16
65
32
34
33
38
15
Locomotives
Passenger coaches
Freight wagons < 10 years
11-20 years
21-25 years
26-30 years
31-40 years
> 40 years
10
25
17
4
19
60
28
45
27
47
16
Locomotives
Passenger coaches
Freight wagons < 10 years
11-20 years
21-25 years
26-30 years
31-40 years
> 40 years

Railway Reform in South East Europe and Turkey: On the Right Track? Annexes
144
Table 20: ŽFBH and ŽRS – Rolling Stock Productivity
Year Freight Wagon Productivity Coach Productivity Locomotive Productivity
ŽFBH EU average = 100 ŽFBH EU average = 100 ŽFBH EU average = 100
2009 319,251 52 739,130 18 7,206,186 28
2008 432,593 57 847,826 21 9,432,990 34
2007 437,067 53 914,286 20 8,134,021 28
2006 471,320 59 882,353 20 7,340,206 27
2005 461,259 61 201,754 5 7,850,000 29
Year ŽRS EU average = 100 ŽRS EU average = 100 ŽRS EU average = 100
2009 130,137 21 200,000 5 4,929,577 19
2008 140,467 19 288,889 7 5,555,556 20
2007 151,727 18 268,657 6 5,930,556 21
2006 158,017 20 268,657 6 6,166,667 22
2005 156,555 21 255,672 7 6,268,451 23 Source: UIC.
Financial Performance and Investment Plans of Entity Rail Companies 265. The financial performance of both ŽFBH and ŽRS remains poor, with financial losses incurred every year, even when entity contributions are factored in. In the case of ŽFBH, total operating expenses exceed total revenue for each year during 2005-2008, even with the inclusion of support from the entity’s budget. As a result, as Table 21 reveals, there has not been an improvement in the working ratio in the last few years. 121 The proportion of total revenues necessary to cover operating expenses in 2008 was over 145 percent, rising to 151 percent in the second quarter of 2009. The working ratio displays a certain amount of volatility, but after improving in 2007, it has declined since. For 2009 as a whole, the financial situation had worsened considerably, reflecting sharp falls in traffic, with the margin of gross losses equal to 55.6 percent: for every Euro 100 of revenue, ŽFBH realized a loss of Euro 55.6 million, more than double the 22.7 percent in 2008.122
266. ŽRS is in a slightly better situation in terms of its financial performance—revenues with entity contributions broadly cover total operating expenses, as revealed in Table 22. The working ratio again displays a certain amount of volatility, but over the entire period, total income covers total operating expenses, with the exception of the second quarter of 2009. Excluding entity support to the railways, the working ratios of ŽFBH and ŽRS are not so different, but while this improved slightly for ŽFBH, from 1.29 in 2005 to 1.27 in 2008, it has risen sharply for ŽRS, from1.01 in 2005 to 1.23 in 2008. Annual financial losses translated into escalating cumulative 121 The working ratio is defined as the total operating expenses, less depreciation and debt service, divided by revenues. 122 The margin of gross losses is calculated as gross losses divided by total income. See Railways of Federation Bosnia and Herzegovina Ltd (2010a) and Railways of Federation Bosnia and Herzegovina Ltd (2009), Report on Operations Railway of ZFBH During the Period January-December 2008, February 2009.

Railway Reform in South East Europe and Turkey: On the Right Track? Annexes
145
financial losses over the last 5 years. Financial losses not only affect the operations of ŽFBH and ŽRS, but also their future development. As there are no retained earnings with which to finance investments, so investments must be financed by debts, and in the future accession to the EU brings the prospects of extensive EU accession funds.
Table 21: ŽFBH - Financial Performance (Euro millions)
2005 2006 2007 2008
Q1 2008 Q2 2008 2009
Q1 2009 Q2
TOTAL REVENUE 50.2 50.5 56.6 15.4 17.7 68.7 11.6 14.4 Passenger 2.0 2.3 3.2 0.5 1.0 3.7 0.5 1.2 Tickets 0.9 1.0 1.1 0.2 0.3 1.4 0.3 0.3 Freight 33.3 33.5 36.5 10.7 12.4 46.4 7.6 9.6 Other 5.0 4.9 4.1 0.6 0.6 4.0 0.4 0.7 Total operating revenues 40.4 40.7 43.7 11.8 14.1 54.2 8.6 11.5 Entity operating contribution 9.8 9.8 12.8 3.6 3.6 14.5 3.0 3.0 Passenger 1.5 1.0 1.0 0.3 0.3 1.0 0.3 0.3 Freight 0.0 0.0 0.0 0.1 0.1 0.3 0.1 0.1 Infrastructure 8.3 8.8 11.8 3.3 3.3 13.2 2.7 2.7 TOTAL EXPENDITURE 83.2 89.2 77.3 19.1 21.8 89.0 20.1 21.8 Materials 4.7 7.0 4.5 0.8 1.1 4.1 0.9 1.2 Fuel, electricity 5.4 4.7 4.6 1.6 1.4 6.0 1.5 1.0 Salaries and allowances 27.3 29.4 31.4 8.6 10.1 38.8 9.8 9.5 Outsourcing and other services 14.8 17.8 13.5 2.7 4.3 19.9 3.0 5.3 Depreciation 31.0 30.3 23.3 5.3 5.0 20.1 4.9 4.8 Total operating expenditures 83.2 89.2 77.3 19.1 21.8 89.0 20.1 21.8 Non-operating expenditures 0.0 0.0 0.0 0.0 0.0 0.0 0.0 0.0 NET INCOME With entity contribution (33.0) (38.7) (20.7) (3.7) (4.1) (20.3) (8.5) (7.3) Without entity contribution (42.8) (48.5) (33.5) (7.3) (7.8) (34.8) (11.5) (10.3) WORKING RATIO With entity contribution 1.04 1.17 0.95 0.89 0.95 1.00 1.31 1.17 Without entity contribution 1.29 1.45 1.24 1.17 1.19 1.27 1.77 1.48
Source: ŽFBH. 267. Labor costs represent a substantial and growing share of the cost structure of ŽFBH and ŽRS. Salary and allowance expenditures have increased in recent years, rising from 33 percent of operating costs in 2005 to 44 percent in 2008 for ŽFBH (Figure 72); and from 48 percent of operating costs to 61 percent over the same period for ŽRS (Figure 73). This upward trend of expenditures over salaries continued in the first half of 2009. This reflects declining labor productivity as well as overall increases in staff over 2005-2009, with the latter putting upward pressure on the wage bill. Excluding funds from entities, the wage bill stood at 72 percent of revenues for ŽFBH and a whopping 93 percent of revenues for ŽRS, rising very rapidly over the last five years in the latter case. These figures suggest that both railways are suffering from overstaffing, and that the necessary retrenchment is being averted through compensation paid by the entities and the capacity of both joint stock companies to operate year in and year out with financial losses, without this leading to a fundamental rethinking of existing business strategies.

Railway Reform in South East Europe and Turkey: On the Right Track? Annexes
146
Table 22: ŽRS - Financial Performance (Euro millions)
2005 2006 2007 2008
Q1 2008 Q2 2008 2009
Q1 2009 Q2
TOTAL REVENUE 37.7 38.3 38.5 10.2 10.8 42.5 8.6 8.1 Passenger 0.9 0.8 1.0 0.3 0.3 1.1 0.3 0.2 Tickets 0.9 0.8 1.0 0.3 0.3 1.1 0.3 0.2 Freight 15.3 16.9 17.6 4.5 5.0 18.9 3.2 2.5 Other 7.0 6.8 5.9 1.4 1.4 5.9 1.0 1.2 Total operating revenues 23.2 24.6 24.4 6.1 6.6 25.9 4.5 3.9 Entity operating subsidies 14.5 13.7 14.1 4.2 4.2 16.6 4.2 4.2 Passenger 0.0 0.0 3.5 0.5 0.5 2.0 0.5 0.5 Freight 0.0 0.0 0.0 0.0 0.0 0.0 0.0 0.0 Infrastructure 14.5 13.7 10.5 3.6 3.6 14.6 3.6 3.6 TOTAL EXPENDITURE 38.5 46.3 45.5 11.3 12.2 49.9 11.5 12.3 Materials 3.0 4.1 3.7 1.1 0.8 4.0 0.6 1.2 Fuel, electricity 3.2 3.0 2.5 0.6 0.8 2.6 0.4 0.4 Salaries and allowances 14.2 16.9 21.0 5.9 6.1 24.1 6.2 6.6 Outsourcing and other services 3.0 7.1 3.0 0.3 0.2 1.2 0.7 0.3 Depreciation 6.6 6.8 6.8 1.7 1.9 7.7 1.9 1.8 Total operating expenditures 29.9 37.8 37.0 9.5 9.9 39.7 9.7 10.3 Non-operating expenditures 8.6 8.4 8.5 1.8 2.4 10.3 1.8 2.1 NET INCOME With entity contribution (0.9) (8.0) (7.0) (1.0) (1.4) (7.5) (2.9) (4.3) Without entity contribution (15.3) (21.7) (21.1) (5.2) (5.6) (24.1) (7.0) (8.4) WORKING RATIO With entity contribution 0.62 0.81 0.78 0.76 0.74 0.75 0.91 1.04 Without entity contribution 1.01 1.26 1.23 1.27 1.20 1.23 1.75 2.15
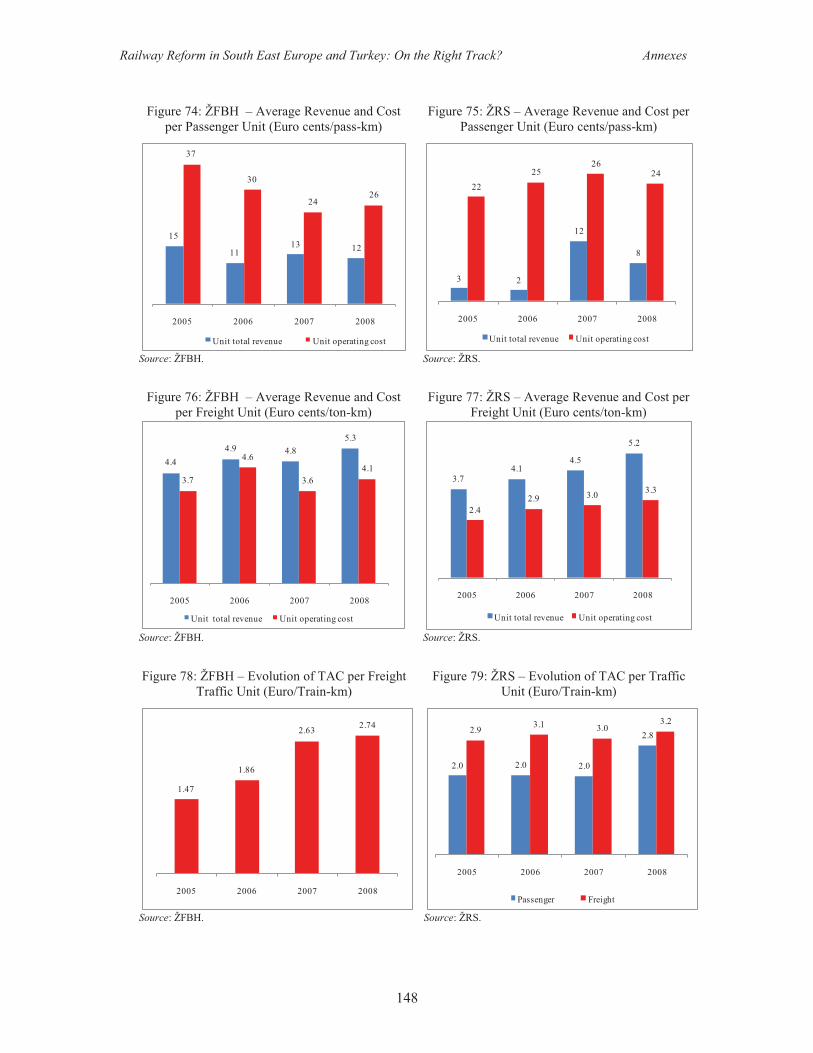
Source: ŽRS. 268. ŽFBH and ŽRS unit revenue for passenger services are a small fraction of unit costs. ŽFBH unit revenue for passenger services has not risen over 2005-2008 and was equal to only 46 percent of passenger unit costs in 2008. Passenger unit revenues, at 12 euro cents in 2008, include entity level funds—entity operating support has declined from 6.67 euro cents in 2005 to 2.62 euro cents in 2008, as passenger traffic has risen much more rapidly than such support (Figure 74). If entity funds are excluded, unit passenger revenues reached 3.56 euro cents in 2008—down from 3.73 euro cents in 2005—and are seven times less than unit costs. Including all sources of revenue, there has been progress as unit passenger transport revenue in 2008 was a higher share of unit costs than in 2005—from 41 percent in 2005 to 46 percent by 2008. ŽRS unit revenue for passenger services is much lower than ŽFBH, rising from 2 euro cents in 2005 to 8 euro cents in 2008 (Figure 75). Likewise, the gap between unit revenue and unit costs is much wider in the case of ŽRS: only 33 percent of unit costs in 2008, up from 14 percent in 2005, but still very low. The unit operating costs for passenger services are the highest among the 10 countries included in study. An important issue is the extent to which the entity contract creates adequate incentives for continued operational efficiency.
Railway Reform in South East Europe and Turkey: On the Right Track? Annexes
147
Figure 72: ŽFBH- Wage Bill Indicators, 2005-08 Figure 73: ŽRS – Wage Bill Indicators, 2005-08
Source: ŽFBH. Source: ŽRS.
269. By contrast, ŽFBH and ŽRS unit revenues for freight transport exceed unit costs by a wide margin. ŽFBH unit revenues from freight transport have risen by 20 percent in the last four years, from 4.4 euro cents to 5.3 euro cents, while unit costs have increased by only 11 percent (Figure 76 and Figure 77). Similarly, ŽRS unit revenues from freight transport increased by 40.5 percent, to 5.2 euro cents, while unit costs have increased by 38 percent. ŽFBH unit costs for freight are 4.1 euro cents, significantly more than the 3.3 euro cents for ŽRS. ŽFBH unit revenues for freight exceeded unit costs by 129 percent in 2008, up from 119 percent in 2005—while for ŽRS unit revenues were equal to 158 percent of costs in 2008, up from 154 percent in 2005. Thus, for both companies, unit net revenues from freight services have been on the rise, and unit costs are a small fraction of unit costs for passenger services.
270. Charges for usage of infrastructure vary between ŽFBH, and ŽRS and there is a need for TAC to be unified in Bosnia and Herzegovina. Only freight pays infrastructure charges in the case of ŽFBH, and the rate is low—this is calculated by dividing charged paid by freight traffic in ton-km—0.50 euro cents per ton-km in 2008, up from 0.27 euro cents in 2005 (Figure 78). By contrast, ŽRS charges both passenger and freight transport for the use of infrastructure. This translates into 2.8 euro cents per traffic unit for passenger services and 3.2 euro cents per traffic unit for freight services (Figure 79). In the case of ŽFBH, charges paid for infrastructure account for 23 percent of total infrastructure revenue in 2008, down from 38 percent in 2005; for ŽRS, the share was 25 percent in 2008, compared to 67 percent in 2005.
271. The structure of track access charges should avoid cross subsidies between freight and passenger transport. The revenue structure for selling transport capacities is broadly in line with these shares for ŽFBH—in 2008 passenger traffic used 4.3 percent of the sold railway transport capacity and did not pay track access charges. On the other hand, in 2008 passenger traffic accounted for 9.8 percent of transport capacity in the ŽRS, but contributed 58.1 percent of revenue. Passenger trains use most of the RS railway lines and need higher speeds—and freight trains use a reduced length of railway network (concentrated on main lines and using a limited number of local railway lines and limited number of railway stations), and do not need as high speeds. Nevertheless, the current distribution of ŽRS revenues might indicate that clients using railway infrastructure for passenger transport cross subsidize freight services.
33 3341 44
6872 72 72
5458 55 56
0
10
20
30
40
50
60
70
80
2005 2006 2007 2008
% of operating costs% of operating revenue (excl state contribution)% of total revenue
48 45
576161
69
8693
3844
55 57
0
10
20
30
40
50
60
70
80
90
100
2005 2006 2007 2008% of operating costs% of operating revenue (excl state contribution)% of total revenue
Railway Reform in South East Europe and Turkey: On the Right Track? Annexes
148
Figure 74: ŽFBH – Average Revenue and Cost per Passenger Unit (Euro cents/pass-km)
Figure 75: ŽRS – Average Revenue and Cost per Passenger Unit (Euro cents/pass-km)
Source: ŽFBH. Source: ŽRS.
Figure 76: ŽFBH – Average Revenue and Cost per Freight Unit (Euro cents/ton-km)
Figure 77: ŽRS – Average Revenue and Cost per Freight Unit (Euro cents/ton-km)
Source: ŽFBH. Source: ŽRS.
Figure 78: ŽFBH – Evolution of TAC per Freight
Traffic Unit (Euro/Train-km) Figure 79: ŽRS – Evolution of TAC per Traffic
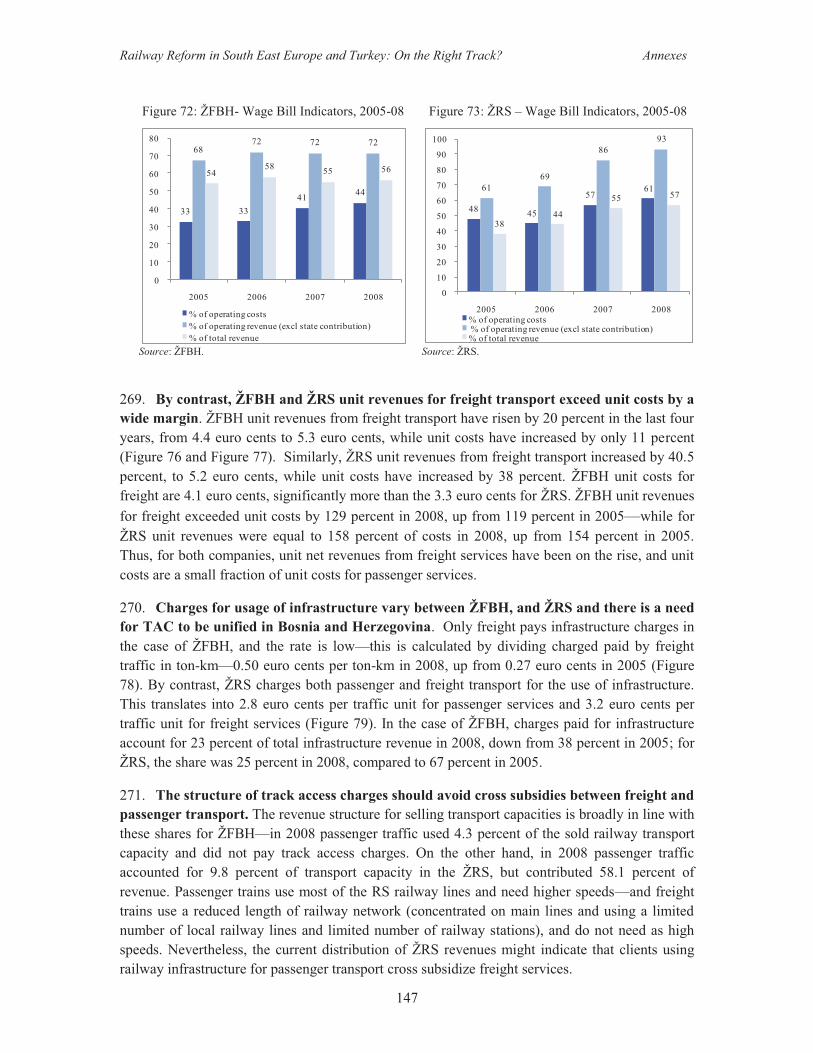
Unit (Euro/Train-km)
Source: ŽFBH. Source: ŽRS.
15
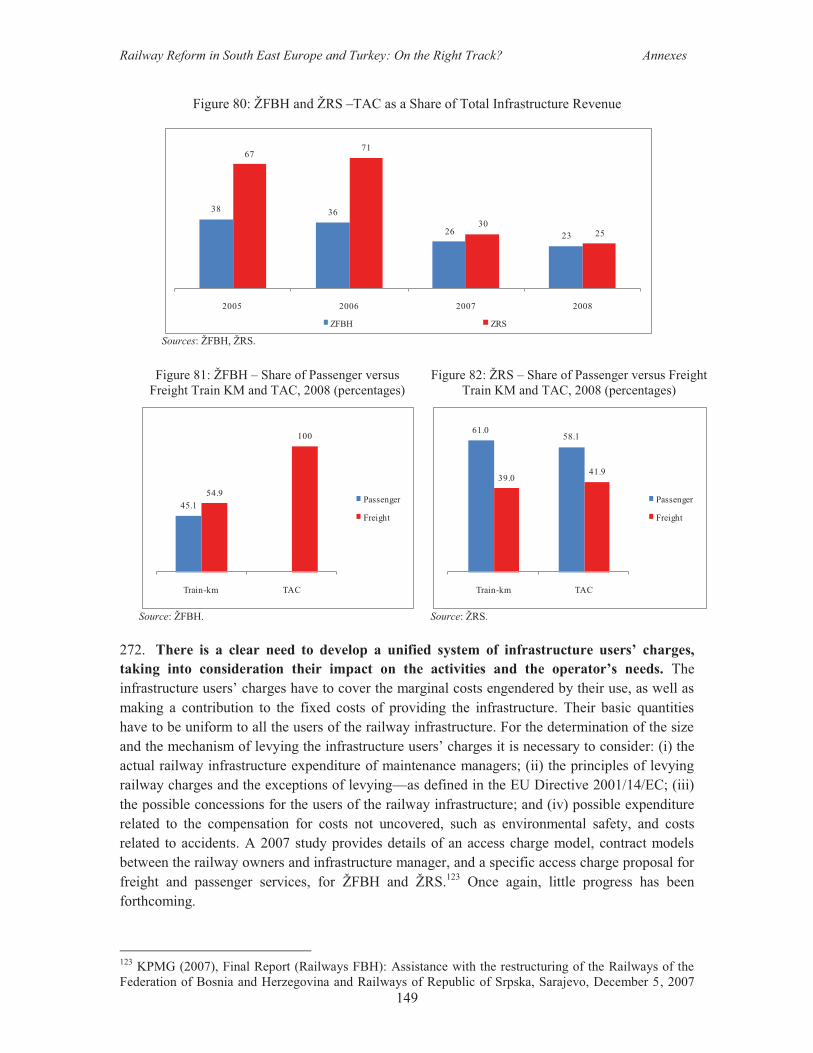
1113 12
37
30
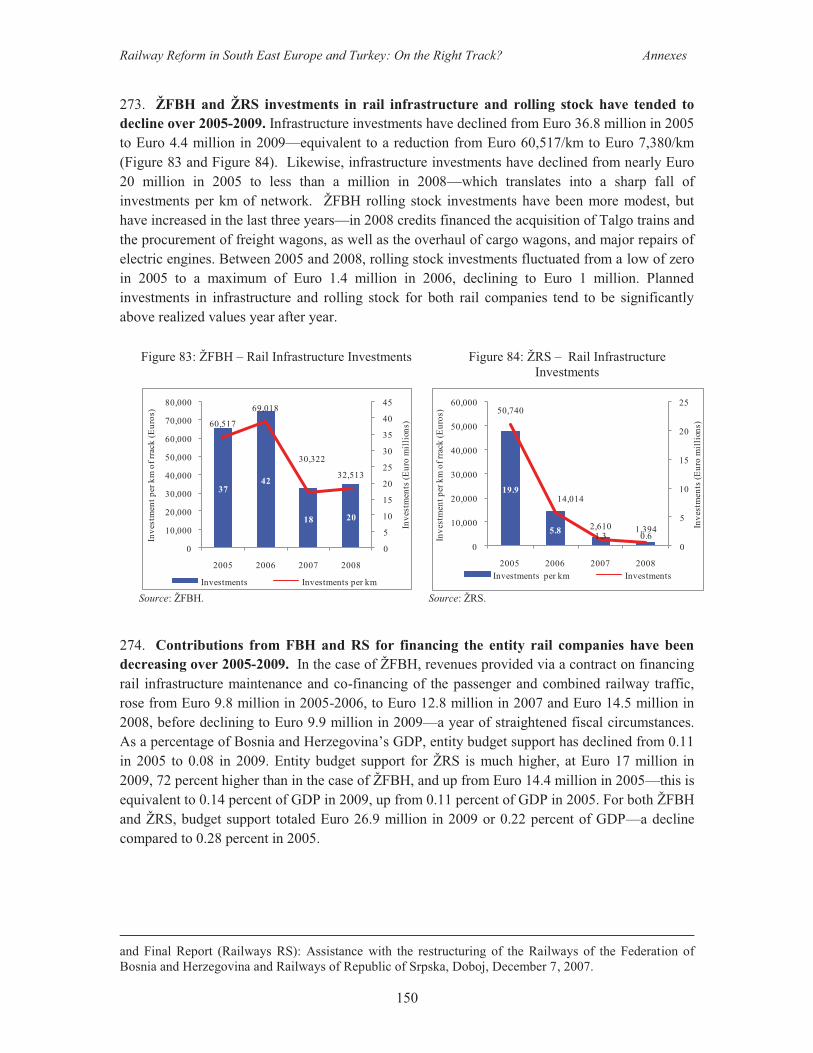
2426
2005 2006 2007 2008
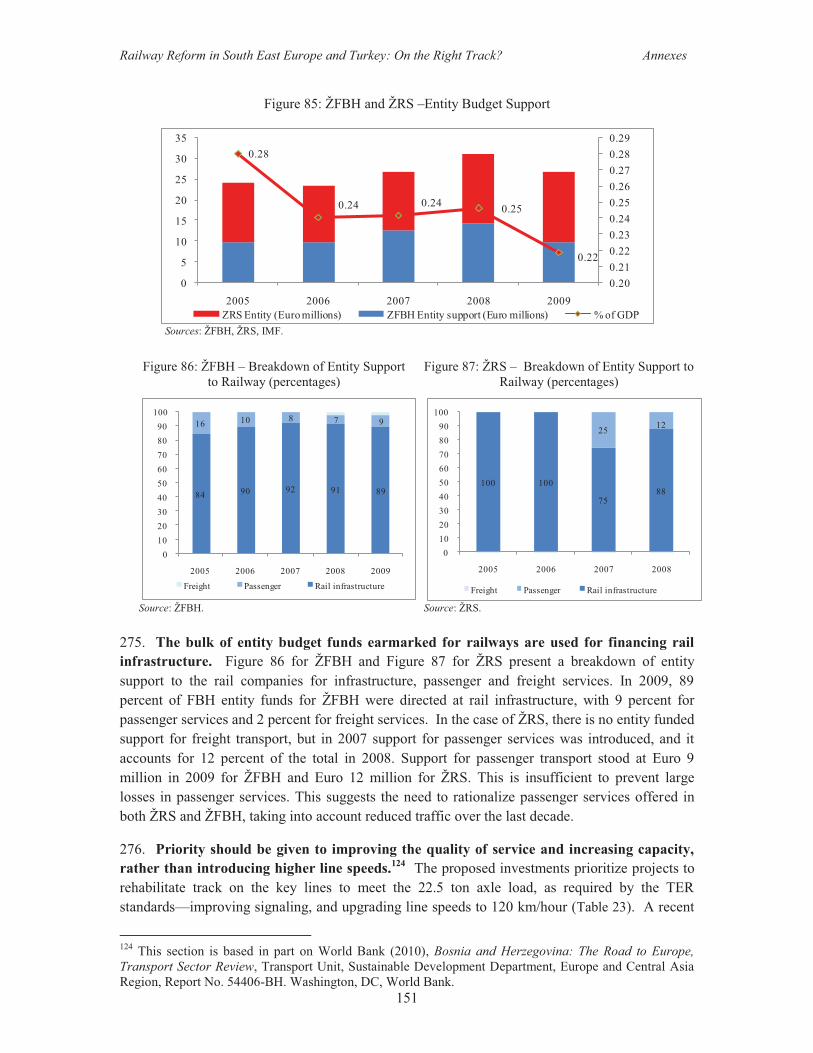
Unit total revenue Unit operating cost
3 2
12
8
22
2526
24
2005 2006 2007 2008
Unit total revenue Unit operating cost
4.44.9 4.8
5.3
3.7
4.6
3.64.1
2005 2006 2007 2008
Unit total revenue Unit operating cost
3.74.1
4.5
5.2
2.42.9 3.0 3.3
2005 2006 2007 2008
Unit total revenue Unit operating cost
1.47
1.86
2.63 2.74
2005 2006 2007 2008
2.0 2.0 2.0
2.82.9 3.1 3.03.2
2005 2006 2007 2008
Passenger Freight
Railway Reform in South East Europe and Turkey: On the Right Track? Annexes
149
Figure 80: ŽFBH and ŽRS –TAC as a Share of Total Infrastructure Revenue
Sources: ŽFBH, ŽRS.
Figure 81: ŽFBH – Share of Passenger versus Freight Train KM and TAC, 2008 (percentages)
Figure 82: ŽRS – Share of Passenger versus Freight Train KM and TAC, 2008 (percentages)
Source: ŽFBH. Source: ŽRS.
272. There is a clear need to develop a unified system of infrastructure users’ charges, taking into consideration their impact on the activities and the operator’s needs. The infrastructure users’ charges have to cover the marginal costs engendered by their use, as well as making a contribution to the fixed costs of providing the infrastructure. Their basic quantities have to be uniform to all the users of the railway infrastructure. For the determination of the size and the mechanism of levying the infrastructure users’ charges it is necessary to consider: (i) the actual railway infrastructure expenditure of maintenance managers; (ii) the principles of levying railway charges and the exceptions of levying—as defined in the EU Directive 2001/14/EC; (iii) the possible concessions for the users of the railway infrastructure; and (iv) possible expenditure related to the compensation for costs not uncovered, such as environmental safety, and costs related to accidents. A 2007 study provides details of an access charge model, contract models between the railway owners and infrastructure manager, and a specific access charge proposal for freight and passenger services, for ŽFBH and ŽRS.123 Once again, little progress has been forthcoming.
123 KPMG (2007), Final Report (Railways FBH): Assistance with the restructuring of the Railways of the Federation of Bosnia and Herzegovina and Railways of Republic of Srpska, Sarajevo, December 5, 2007
38 36
26 23
6771
3025
2005 2006 2007 2008
ZFBH ZRS
45.154.9
100
Train-km TAC
Passenger
Freight
61.058.1
39.041.9
Train-km TAC
Passenger
Freight
Railway Reform in South East Europe and Turkey: On the Right Track? Annexes
150
273. ŽFBH and ŽRS investments in rail infrastructure and rolling stock have tended to decline over 2005-2009. Infrastructure investments have declined from Euro 36.8 million in 2005 to Euro 4.4 million in 2009—equivalent to a reduction from Euro 60,517/km to Euro 7,380/km (Figure 83 and Figure 84). Likewise, infrastructure investments have declined from nearly Euro 20 million in 2005 to less than a million in 2008—which translates into a sharp fall of investments per km of network. ŽFBH rolling stock investments have been more modest, but have increased in the last three years—in 2008 credits financed the acquisition of Talgo trains and the procurement of freight wagons, as well as the overhaul of cargo wagons, and major repairs of electric engines. Between 2005 and 2008, rolling stock investments fluctuated from a low of zero in 2005 to a maximum of Euro 1.4 million in 2006, declining to Euro 1 million. Planned investments in infrastructure and rolling stock for both rail companies tend to be significantly above realized values year after year.
Figure 83: ŽFBH – Rail Infrastructure Investments Figure 84: ŽRS – Rail Infrastructure Investments
Source: ŽFBH. Source: ŽRS.
274. Contributions from FBH and RS for financing the entity rail companies have been decreasing over 2005-2009. In the case of ŽFBH, revenues provided via a contract on financing rail infrastructure maintenance and co-financing of the passenger and combined railway traffic, rose from Euro 9.8 million in 2005-2006, to Euro 12.8 million in 2007 and Euro 14.5 million in 2008, before declining to Euro 9.9 million in 2009—a year of straightened fiscal circumstances. As a percentage of Bosnia and Herzegovina’s GDP, entity budget support has declined from 0.11 in 2005 to 0.08 in 2009. Entity budget support for ŽRS is much higher, at Euro 17 million in 2009, 72 percent higher than in the case of ŽFBH, and up from Euro 14.4 million in 2005—this is equivalent to 0.14 percent of GDP in 2009, up from 0.11 percent of GDP in 2005. For both ŽFBH and ŽRS, budget support totaled Euro 26.9 million in 2009 or 0.22 percent of GDP—a decline compared to 0.28 percent in 2005.
and Final Report (Railways RS): Assistance with the restructuring of the Railways of the Federation of Bosnia and Herzegovina and Railways of Republic of Srpska, Doboj, December 7, 2007.
3742
18 20
60,517
69,018
30,322
32,513
0
5
10
15
20
25
30
35
40
45
0
10,000
20,000
30,000
40,000
50,000
60,000
70,000
80,000
2005 2006 2007 2008
Inve
stm
ents
(Eur
o m
illi
ons)
Inve
stm
ent p
er k
m o
f rra
ck (E
uros
)
Investments Investments per km
19.9
5.8 1.3 0.6
50,740
14,014
2,610 1,394
0
5
10
15
20
25
0
10,000
20,000
30,000
40,000
50,000
60,000
2005 2006 2007 2008
Inve
stm
ents
(Eur
o m
illi
ons)
Inve
stm
ent p
er k
m o
f rra
ck (E
uros
)
Investments per km Investments
Railway Reform in South East Europe and Turkey: On the Right Track? Annexes
151
Figure 85: ŽFBH and ŽRS –Entity Budget Support
Sources: ŽFBH, ŽRS, IMF.
Figure 86: ŽFBH – Breakdown of Entity Support to Railway (percentages)
Figure 87: ŽRS – Breakdown of Entity Support to Railway (percentages)
Source: ŽFBH. Source: ŽRS. 275. The bulk of entity budget funds earmarked for railways are used for financing rail infrastructure. Figure 86 for ŽFBH and Figure 87 for ŽRS present a breakdown of entity support to the rail companies for infrastructure, passenger and freight services. In 2009, 89 percent of FBH entity funds for ŽFBH were directed at rail infrastructure, with 9 percent for passenger services and 2 percent for freight services. In the case of ŽRS, there is no entity funded support for freight transport, but in 2007 support for passenger services was introduced, and it accounts for 12 percent of the total in 2008. Support for passenger transport stood at Euro 9 million in 2009 for ŽFBH and Euro 12 million for ŽRS. This is insufficient to prevent large losses in passenger services. This suggests the need to rationalize passenger services offered in both ŽRS and ŽFBH, taking into account reduced traffic over the last decade.
276. Priority should be given to improving the quality of service and increasing capacity, rather than introducing higher line speeds.124 The proposed investments prioritize projects to rehabilitate track on the key lines to meet the 22.5 ton axle load, as required by the TER standards—improving signaling, and upgrading line speeds to 120 km/hour (Table 23). A recent
124 This section is based in part on World Bank (2010), Bosnia and Herzegovina: The Road to Europe, Transport Sector Review, Transport Unit, Sustainable Development Department, Europe and Central Asia Region, Report No. 54406-BH. Washington, DC, World Bank.
0.28
0.24 0.24 0.25
0.22
0.200.210.220.230.240.250.260.270.280.29
0
5
10
15
20
25
30
35
2005 2006 2007 2008 2009ZRS Entity (Euro millions) ZFBH Entity support (Euro millions) % of GDP
84 90 92 91 89
16 10 8 7 9
0102030405060708090
100
2005 2006 2007 2008 2009
Freight Passenger Rail infrastructure
100 100
7588
25 12
0102030405060708090
100
2005 2006 2007 2008
Freight Passenger Rail infrastructure

Railway Reform in South East Europe and Turkey: On the Right Track? Annexes
152
study noted that if this rehabilitation were implemented and current bottlenecks were addressed, together with other necessary operational improvements (level crossings, signaling, and operational practices), then the capacity of the railway network would be sufficient to meet projected demand until 2030.125 It is important to place emphasis on the capacity of the current network, primarily on the key lines on Corridor Vc, and the quality of service for existing customers, before ambitious and probably unviable projects to introduce even higher line speeds, or high speed passenger services. The latter seem difficult to defend given the current traffic mix on the railways.
Table 23: Bosnia and Herzegovina - Recommended Railway investments 2010-2030
Source: PCI Intl. (2007).
125 DB International, Vienna Consult and via donau (2008), Provision of Studies for Intermodal Transport in Bosnia and Herzegovina. A study funded by the European Union.
Project Cost (BAM Mill)
Period Description
Completing rehabilitation of southern section of Corridor Vc between Sarajevo and Gabela (Croatian border) Total length covered by the project is 73 km (100 km of the 173 km long line is covered by the EBRD- EIB loan).
76.2
Short - Medium
term.
The line is completely electrified and connects to the line Metković - Ploče in Croatia. The rehabilitation of the section Čelebić – Mostar – Čapljina – Croatian border is part of the EIB-EBRD plan. The section Bradina – Konjic, part of this proposal, has a very complex set of tunnels and turns over a 25 km distance.
Completing rehabilitation of northern section of Corridor Vc between Samac and Sarajevo. Total length covered by the project is 235 km.
245.6
Medium – Long term.
The medium term requirements to implement the project includes completing the feasibility and technical studies and determining the further funding needs on the basis of the available EBRD- EIB loans. The project focuses the sections not covered prior by EBRD-EIB or other investments.
Completing Rehabilitation of Sections Novi Grad – Doboj and Doboj – Tuzla (Line parallel to Corridor X). Total length covered by the project is 190 km: 125 km (section 1) + 65 km (section 2).
198.6 Medium – Long term.
The medium term requirements to implement the project includes completing the feasibility and technical studies and determine further funding arrangements on the basis of the available EBRD-EIB loans. The project focuses the sections not covered by the EBRD-EIB investment.
Rehabilitation and electrification of the railway line Brcko – Tuzla. Total length covered by the project is 75 km.
78.4 Long term.
With the expected growth of river transport via Brcko port, Improved railway interconnectivity linking the port with the BiH railway network and Corridor Vc will create opportunities for intermodal transport linking river and railway.