rainfall rate prediction for propagation p r applications
TRANSCRIPT
0018-926X (c) 2017 IEEE. Personal use is permitted, but republication/redistribution requires IEEE permission. See http://www.ieee.org/publications_standards/publications/rights/index.html for more information.
This article has been accepted for publication in a future issue of this journal, but has not been fully edited. Content may change prior to final publication. Citation information: DOI 10.1109/TAP.2017.2754448, IEEETransactions on Antennas and Propagation
> REPLACE THIS LINE WITH YOUR PAPER IDENTIFICATION NUMBER (DOUBLE-CLICK HERE TO EDIT) <
1
Abstract—Three global rainfall rate prediction methods are
evaluated in their ability to estimate local precipitation statistics,
which are key to predict the impact of rain on the propagation of
electromagnetic waves through the atmosphere. Specifically, the
ITU-R P.837-6, MORSE and the ITU-R P.837-7 prediction
methods are tested against long-term rainfall data collected in 19
sites in Ireland. The results indicate that the ITU-R P.837-7
prediction method delivers the best performance, and that both
the ITU-R P.837-6 prediction method and MORSE exhibit a
positive bias, likely due to the overestimation of the yearly rain
amount in the maps used as input to such models. The results of
the testing activity provide information on the accuracy of rainfall
rate prediction methods at regional level, an important factor to
consider given the direct link between the magnitude of
rain-induced attenuation and the operational frequency of
wireless communication links.
Index Terms— Rainfall rate modelling, electromagnetic wave
propagation, satellite communications
I. INTRODUCTION
The propagation of electromagnetic (EM) waves in the
atmosphere at frequencies higher than 10 GHz is severely
impaired by the presence of hydrometeors, mainly by rain:
raindrops induce high levels of absorption and scattering,
which contribute to the decrease in the power density carried by
EM waves [1].
The performance of high-frequency communication
systems (e.g., satellite systems operating in the Ka, Q and V
bands or 5G systems operating beyond the 37 GHz range) is
assessed through the application of propagation prediction
methods, among which those aimed at estimating rain
attenuation play a key role [2],[3]. The accuracy of these
prediction methods is tightly linked to their main input, the
Complementary Cumulative Distribution Function of the
rainfall rate (CCDF, or P(R)). For propagation applications,
rainfall data must be collected at an integration time of at least
1 minute in order to capture the fast temporal dynamics of the
rainfall process [4]. As instruments deployed to monitor rainfall
are usually characterized by much longer integration times (e.g.,
hours or even days), two main types of methodologies have
Manuscript received XXXX.
Lorenzo Luini and Carlo Riva are with the Dipartimento di Elettronica, Informazione e Bioingegneria, Politecnico di Milano, Piazza Leonardo da
Vinci 32, 20133, Milano, Italy, and with the Istituto di Elettronica e di
Ingegneria dell’Informazione e delle Telecomunicazioni (IEIIT), Consiglio Nazionale delle Ricerche, Via Ponzio 34/5, Milano 20133, Italy (e-mail:
Luis Emiliani is with SES S.A., Betzdorf, Luxembourg. (e-mail: [email protected])
Xavier Boulanger and Nicolas Jeannin are with the Electromagnetism and
Radar Department (DEMR), French Aerospace Lab (ONERA) - Université Fédérale de Toulouse (UFTMiP), 2, avenue Edouard Belin, 31055, Toulouse
Cedex 4 (e-mail: [email protected]).
been developed to predict a P(R) suitable for communications
system design: the first – which we call conversion
methodologies – aims at predicting 1-minute integrated P(R)s
from local rainfall statistics with a longer integration time (e.g.,
60 minutes) [4],[5],[6], while the second relies on analytical
formulations for the P(R) whose parameters depend on local
long-term meteorological quantities such as monthly/yearly
rainfall accumulations and average temperature (see e.g., [7]
and [3]). Recommendation ITU-R (International
Telecommunication Union – Radiocommunication Sector)
P.837-6 (Annex 3) [8] is an example of a conversion
methodology, while Recommendation ITU-R P.837-6 (Annex
1) and MORSE (Model for Rainfall Statistics Estimation) [9]
are examples of the analytical category. This paper evaluates
the performance of three rainfall rate prediction methods: a)
Recommendation ITU-R P.837-6 Annex 1 [8], b) MORSE [9],
and c) Recommendation ITU-R P.837-7 Annex 1 [12], a recent
revision of Recommendation ITU-R P.837-6 Annex 1 based on
an improved rainfall rate prediction method developed by
ONERA [10]. Reference [11] demonstrated that
Recommendation ITU-R P.837-7 Annex 1 provides the best
accuracy predicting the rainfall rate exceedance probability on
a global scale.
Though analytical prediction methods generally provide
good overall accuracy, recent in-depth investigations have
shown that, locally, they might deliver quite poor results. See
for example [13], where the prediction method in P.837-6 was
found to strongly overestimate P(R)s collected at several
Norwegian sites. Since the effects of rain become more
important as the communication system’s operational
frequency increases, it is critical to investigate the accuracy of
rainfall rate prediction methods not only at a global scale, but
also at regional level.
Given the weather peculiarity of Ireland, where there is a
higher probability of experiencing rain (compared to the mean
over Europe), and considering that the ITU-R P.837-6
prediction method is expected to deliver biased predictions due
to the overestimation of the rain accumulation in coastal areas
(see [13] and [14]), this 19-site dataset offers a unique
opportunity to investigate the accuracy of global P(R)
prediction methods at a regional level.
The remainder of the paper is organized as follows. Section
II gives an overview of the rainfall rate database used to
evaluate each prediction method’s performance. Section III
briefly describes the ITU-R P.837-6 prediction method,
MORSE and the new ITU-R P.837-7 prediction method, while
Section IV includes the tests against the Irish data. Finally,
Section V draws some conclusions.
II. RAINFALL RATE DATABASE AND DATA PROCESSING
The data used in this analysis consists of 1-minute integrated
rainfall accumulation series, collected over 19 sites that are part
of Met Éireann’s automated monitoring network (TUCSON).
The weather instruments include Casella tipping gauges (with
0.1 mm or 0.2 mm resolution), which provide as output the
number of tips per minute.
The availability of the raingauges during the period of
observation exceeds 97% in all stations. Table 1 and Fig. 1
provide an overview of station location and measurement
Rainfall Rate Prediction for Propagation
Applications: Model Performance
at Regional Level over Ireland
L. Luini, L. Emiliani, X. Boulanger, C. Riva, N. Jeannin
0018-926X (c) 2017 IEEE. Personal use is permitted, but republication/redistribution requires IEEE permission. See http://www.ieee.org/publications_standards/publications/rights/index.html for more information.
This article has been accepted for publication in a future issue of this journal, but has not been fully edited. Content may change prior to final publication. Citation information: DOI 10.1109/TAP.2017.2754448, IEEETransactions on Antennas and Propagation
> REPLACE THIS LINE WITH YOUR PAPER IDENTIFICATION NUMBER (DOUBLE-CLICK HERE TO EDIT) <
2
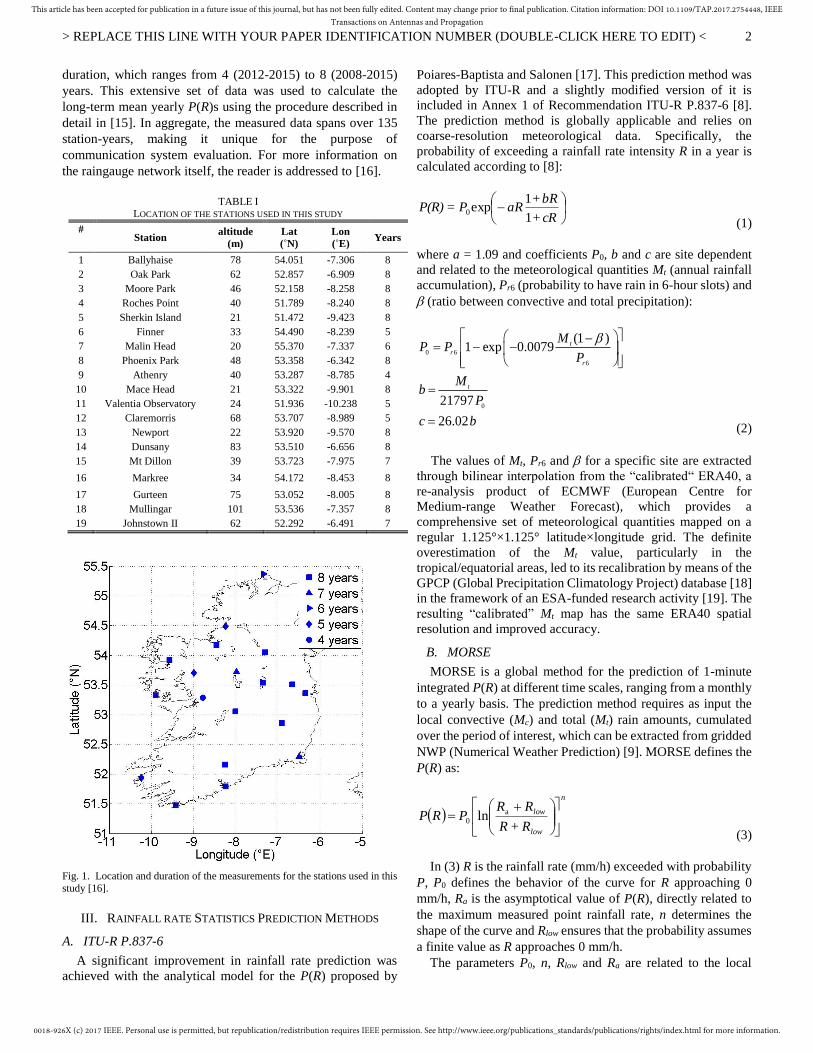
duration, which ranges from 4 (2012-2015) to 8 (2008-2015)
years. This extensive set of data was used to calculate the
long-term mean yearly P(R)s using the procedure described in
detail in [15]. In aggregate, the measured data spans over 135
station-years, making it unique for the purpose of
communication system evaluation. For more information on
the raingauge network itself, the reader is addressed to [16].
Fig. 1. Location and duration of the measurements for the stations used in this
study [16].
III. RAINFALL RATE STATISTICS PREDICTION METHODS
A. ITU-R P.837-6
A significant improvement in rainfall rate prediction was
achieved with the analytical model for the P(R) proposed by
Poiares-Baptista and Salonen [17]. This prediction method was
adopted by ITU-R and a slightly modified version of it is
included in Annex 1 of Recommendation ITU-R P.837-6 [8].
The prediction method is globally applicable and relies on
coarse-resolution meteorological data. Specifically, the
probability of exceeding a rainfall rate intensity R in a year is
calculated according to [8]:
cR+
bR+aRP=P(R)
1
1exp0
(1)
where a = 1.09 and coefficients P0, b and c are site dependent
and related to the meteorological quantities Mt (annual rainfall
accumulation), Pr6 (probability to have rain in 6-hour slots) and
(ratio between convective and total precipitation):
0 6
6
0
(1 )1 exp 0.0079
21797
26.02
t
r
r
t
MP P
P
Mb
P
c b
(2)
The values of Mt, Pr6 and for a specific site are extracted
through bilinear interpolation from the “calibrated“ ERA40, a
re-analysis product of ECMWF (European Centre for
Medium-range Weather Forecast), which provides a
comprehensive set of meteorological quantities mapped on a
regular 1.125°×1.125° latitude×longitude grid. The definite
overestimation of the Mt value, particularly in the
tropical/equatorial areas, led to its recalibration by means of the
GPCP (Global Precipitation Climatology Project) database [18]
in the framework of an ESA-funded research activity [19]. The
resulting “calibrated” Mt map has the same ERA40 spatial
resolution and improved accuracy.
B. MORSE
MORSE is a global method for the prediction of 1-minute
integrated P(R) at different time scales, ranging from a monthly
to a yearly basis. The prediction method requires as input the
local convective (Mc) and total (Mt) rain amounts, cumulated
over the period of interest, which can be extracted from gridded
NWP (Numerical Weather Prediction) [9]. MORSE defines the
P(R) as:
n
low
low
RR
RRPRP
+ln a
0
(3)
In (3) R is the rainfall rate (mm/h) exceeded with probability
P, P0 defines the behavior of the curve for R approaching 0
mm/h, Ra is the asymptotical value of P(R), directly related to
the maximum measured point rainfall rate, n determines the
shape of the curve and Rlow ensures that the probability assumes
a finite value as R approaches 0 mm/h.
The parameters P0, n, Rlow and Ra are related to the local
TABLE I LOCATION OF THE STATIONS USED IN THIS STUDY
# Station
altitude
(m)
Lat
(˚N)
Lon
(˚E) Years
1 Ballyhaise 78 54.051 -7.306 8
2 Oak Park 62 52.857 -6.909 8
3 Moore Park 46 52.158 -8.258 8
4 Roches Point 40 51.789 -8.240 8
5 Sherkin Island 21 51.472 -9.423 8
6 Finner 33 54.490 -8.239 5
7 Malin Head 20 55.370 -7.337 6
8 Phoenix Park 48 53.358 -6.342 8
9 Athenry 40 53.287 -8.785 4
10 Mace Head 21 53.322 -9.901 8
11 Valentia Observatory 24 51.936 -10.238 5
12 Claremorris 68 53.707 -8.989 5
13 Newport 22 53.920 -9.570 8
14 Dunsany 83 53.510 -6.656 8
15 Mt Dillon 39 53.723 -7.975 7
16 Markree 34 54.172 -8.453 8
17 Gurteen 75 53.052 -8.005 8
18 Mullingar 101 53.536 -7.357 8
19 Johnstown II 62 52.292 -6.491 7
0018-926X (c) 2017 IEEE. Personal use is permitted, but republication/redistribution requires IEEE permission. See http://www.ieee.org/publications_standards/publications/rights/index.html for more information.
This article has been accepted for publication in a future issue of this journal, but has not been fully edited. Content may change prior to final publication. Citation information: DOI 10.1109/TAP.2017.2754448, IEEETransactions on Antennas and Propagation
> REPLACE THIS LINE WITH YOUR PAPER IDENTIFICATION NUMBER (DOUBLE-CLICK HERE TO EDIT) <
3
inputs Mt and as follows [9]:
0.1242
1
1.3531
4
0.0086
4
36.1763 36.9178
1.4386
8.43 10
31.8498 31.9399 0.72
10 0.72
a
low
n
nR
R
(4)
where �̅� = max(0.001, 𝛽) to prevent Rlow from approaching
infinity. The last parameter P0 is calculated as follows:
low
lowalowa
t
R
RRnRR
RP
ln,1
0
(5)
with the incomplete gamma function.
In (5), t
R must be expressed in mm/h by dividing the total
rainfall accumulated in the period (mm) by the number of hours
in the same period (e.g., 365·24 = 8760 for a non-leap year).
The inputs to MORSE, i.e., Mt and , are extracted from the
“calibrated” ERA40 database attached to recommendation
ITU-R P.837-6.
C. ITU-R P.837-7 (ONERA)
The P.837-7 prediction method (developed by ONERA) is a
global 1-minute integrated P(R) prediction method. It
originated from the increasing need to investigate the impact of
monthly predictions on system design. The prediction method
relies on three assumptions:
the monthly statistics of rainfall rate, conditioned to the
presence of rain, follow a log-normal distribution;
the monthly scale parameter σi of the log-normal
distribution is independent of the reference site;
the monthly mean rainfall rate conditioned to the presence
of rain ir only depends on the monthly average
temperature collected at 2 meters above the ground1, Ti.
The first two assumptions have been investigated in the past
on a yearly basis [20], but have never been confirmed on a
monthly basis.
From a mathematical point of view, the monthly CCDF of
rainfall rate for the i-th month, Pi(R), can be written as:
i
iii
rRerfc
PRP i
2
ln2ln
2
20 (6)
where i
P0 is the monthly probability of rain given by:
1 2 meters is the standard height of any air temperature measurements
according to the World Meteorology Organization (WMO) guidelines.
ii
T
rN
MP i
i
24
0 (7)
where Ni corresponds to the number of days in the i-th month
(with N2 = 28.25) and iTM is the monthly total rain amount.
The annual rainfall rate CCDF, P(R), is obtained by
combining the monthly distributions:
25.365
12
1
i
ii RPN
RP (8)
An extensive analysis conducted on a large network of rain
gauges deployed across the United States [21] has shown that
ir can be calculated as:
CTforr
CTforr
ii
ii
00.5874
0e0.5874 i*T0.0883
(9)
Further information on the derivation of (9) can be found in
[11]. In particular, the use of (9) can sometimes result into
unrealistic values of 0iP higher than 70% (and even higher than
100%) mainly in winter and for a very restricted area (west
coast of Canada) [11]. In order to obtain more realistic values,
0iP = 70% is set as the maximum reasonable value, which, in
turns, results in a slight modification of the value ir (see Step
6b in [12]). In addition, note that the applicability of (9) to areas
outside the US has been recently corroborated in [22] using
temperature data collected across Spain.
Finally, a fixed value of σi is chosen, i.e., the one returning a
null bias for the annual rainfall rate exceeded for 0.01% of the
time, using the same previous database used to derive (9):
26.1i (10)
Monthly maps of iTM have been generated from a
combination of two digital products: GPCC Climatology
Version 2015 [23] over land (0.25°×0.25° spatial resolution)
and ERA Interim (1979-2014) [24] over water (0.75°×0.75°
spatial resolution). Monthly maps of Ti have been generated
worldwide from the ERA Interim database (1979-2014).
For the sake of clarity, Table II summarizes the inputs to the
three prediction methods considered in this contribution, as
well as their temporal and spatial resolutions.
0018-926X (c) 2017 IEEE. Personal use is permitted, but republication/redistribution requires IEEE permission. See http://www.ieee.org/publications_standards/publications/rights/index.html for more information.
This article has been accepted for publication in a future issue of this journal, but has not been fully edited. Content may change prior to final publication. Citation information: DOI 10.1109/TAP.2017.2754448, IEEETransactions on Antennas and Propagation
> REPLACE THIS LINE WITH YOUR PAPER IDENTIFICATION NUMBER (DOUBLE-CLICK HERE TO EDIT) <
4
IV. PERFORMANCE OF THE PREDICTION METHODS
The accuracy of each method in predicting the rainfall rate
statistics is assessed against the measured data presented in
Section II. Specifically, the prediction performance is
quantified in terms of average value and root mean square value
of the following error figure:
jM
jMjE
jiPR
PRPRP
i
ii
(11)
where jE PRi
and jM PRi
are the rain rates respectively
extracted from the estimated and measured P(R) (for site i), at
the same probability level Pj > 0.001%.
Therefore, the single-site average value, Ei, and single-site
root mean square value, RMSi, are defined as:
in
j
ji
i
i Pn
E1
1 (12)
in
j
ji
i
i Pn
RMS1
21 (13)
where ni is the number of probability levels taken into account
for the P(R) relative to site i. The error figure is limited to
samples for which R > 2 mm/h in order to avoid taking into
account inaccurate low rainfall rate values [11].
Finally, as suggested in [11], the multi-site average value, E,
and multi-site root mean square value, RMS, associated to each
prediction method is calculated by weighting the error figure in
(11) with the number of observation years:
S
S
S
S i
N
i
ii
N
i
iii
N
i
ii
N
i
n
j
jii
n
En
n
P
E
1
1
1
1 1
(14)
s
S
s
S i
N
i
ii
N
i
iii
N
i
ii
N
i
n
j
jii
n
RMSn
n
P
RMS
1
1
2
1
1 1
2
(15)
where i is the number of observation years of rainfall
accumulation data used to calculated the P(R) relative to site i,
and NS is the number of sites (here NS = 19).
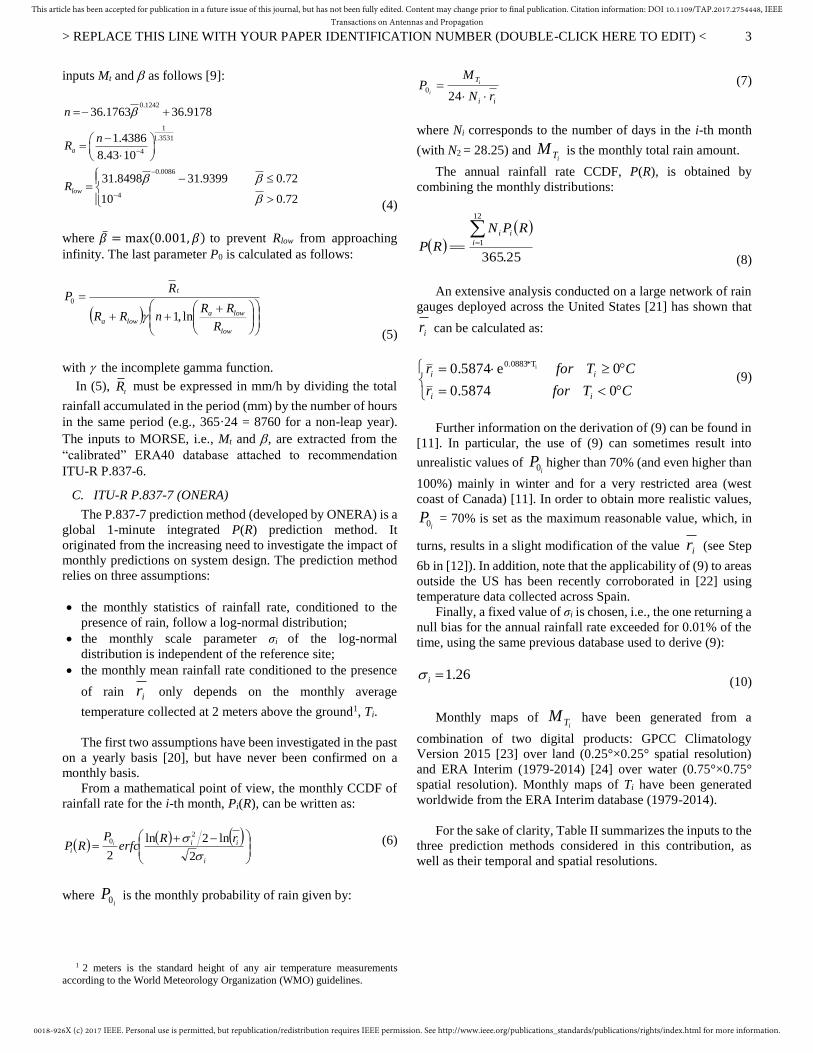
Fig. 2 provides a sample of the measured P(R) (data collected
in Phoenix park, over 8 years, between 2008 and 2015), and the
rainfall rate statistics obtained from the three prediction
methods. As displayed in the figure’s legend, the best and worst
prediction accuracy is achieved by the ITU-R P.837-7 and
P.837-6 prediction methods, respectively.
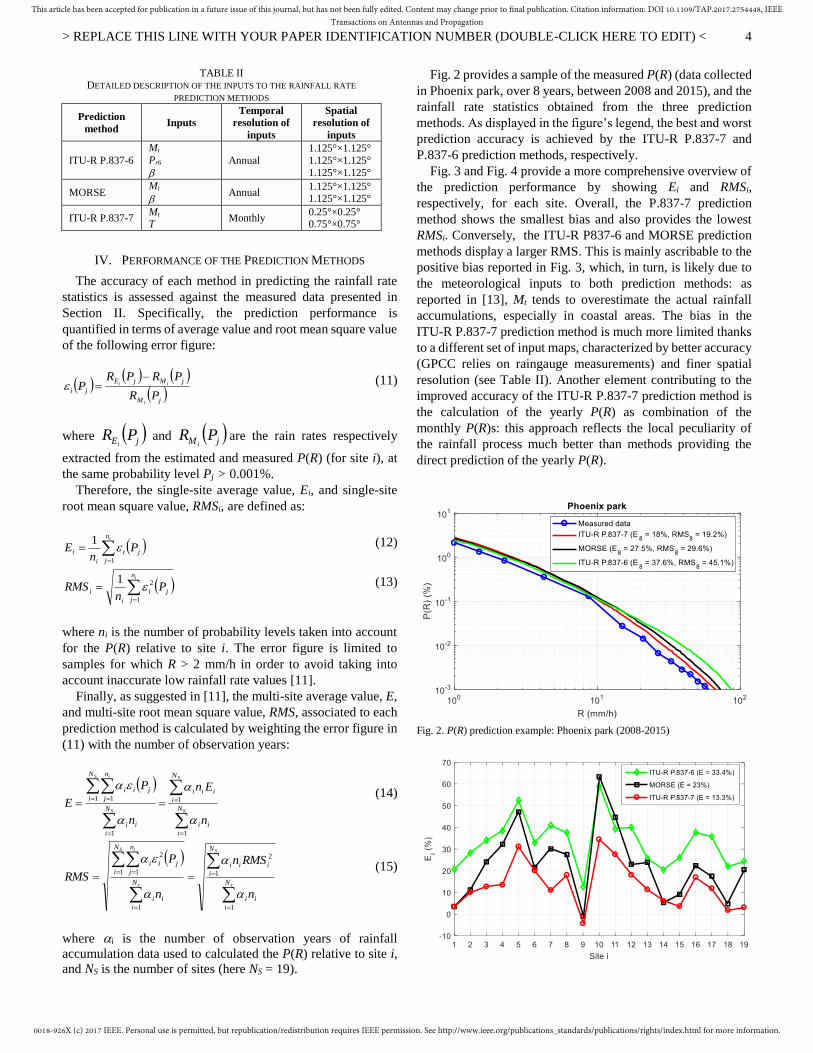
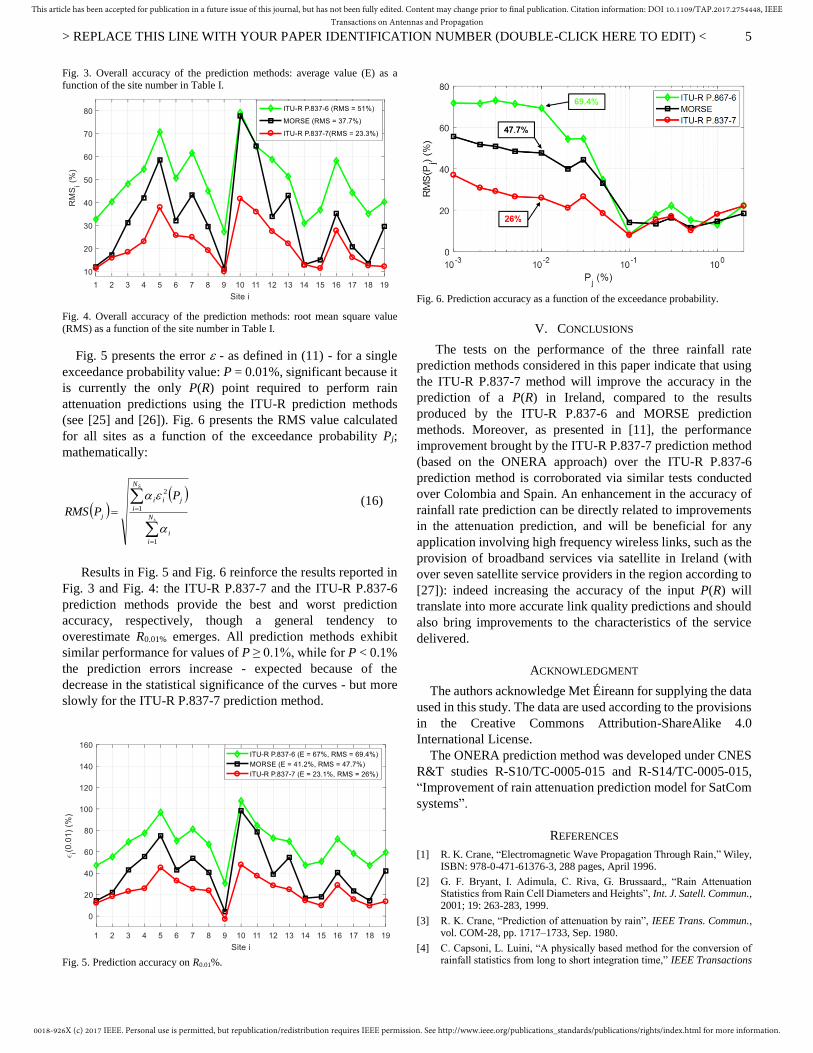
Fig. 3 and Fig. 4 provide a more comprehensive overview of
the prediction performance by showing Ei and RMSi,
respectively, for each site. Overall, the P.837-7 prediction
method shows the smallest bias and also provides the lowest
RMSi. Conversely, the ITU-R P837-6 and MORSE prediction
methods display a larger RMS. This is mainly ascribable to the
positive bias reported in Fig. 3, which, in turn, is likely due to
the meteorological inputs to both prediction methods: as
reported in [13], Mt tends to overestimate the actual rainfall
accumulations, especially in coastal areas. The bias in the
ITU-R P.837-7 prediction method is much more limited thanks
to a different set of input maps, characterized by better accuracy
(GPCC relies on raingauge measurements) and finer spatial
resolution (see Table II). Another element contributing to the
improved accuracy of the ITU-R P.837-7 prediction method is
the calculation of the yearly P(R) as combination of the
monthly P(R)s: this approach reflects the local peculiarity of
the rainfall process much better than methods providing the
direct prediction of the yearly P(R).
Fig. 2. P(R) prediction example: Phoenix park (2008-2015)
TABLE II DETAILED DESCRIPTION OF THE INPUTS TO THE RAINFALL RATE
PREDICTION METHODS
Prediction
method Inputs
Temporal
resolution of
inputs
Spatial
resolution of
inputs
ITU-R P.837-6
Mt
Pr6
Annual
1.125°×1.125°
1.125°×1.125°
1.125°×1.125°
MORSE Mt
Annual
1.125°×1.125° 1.125°×1.125°
ITU-R P.837-7 Mt T
Monthly 0.25°×0.25° 0.75°×0.75°
0018-926X (c) 2017 IEEE. Personal use is permitted, but republication/redistribution requires IEEE permission. See http://www.ieee.org/publications_standards/publications/rights/index.html for more information.
This article has been accepted for publication in a future issue of this journal, but has not been fully edited. Content may change prior to final publication. Citation information: DOI 10.1109/TAP.2017.2754448, IEEETransactions on Antennas and Propagation
> REPLACE THIS LINE WITH YOUR PAPER IDENTIFICATION NUMBER (DOUBLE-CLICK HERE TO EDIT) <
5
Fig. 3. Overall accuracy of the prediction methods: average value (E) as a function of the site number in Table I.
Fig. 4. Overall accuracy of the prediction methods: root mean square value
(RMS) as a function of the site number in Table I.
Fig. 5 presents the error - as defined in (11) - for a single
exceedance probability value: P = 0.01%, significant because it
is currently the only P(R) point required to perform rain
attenuation predictions using the ITU-R prediction methods
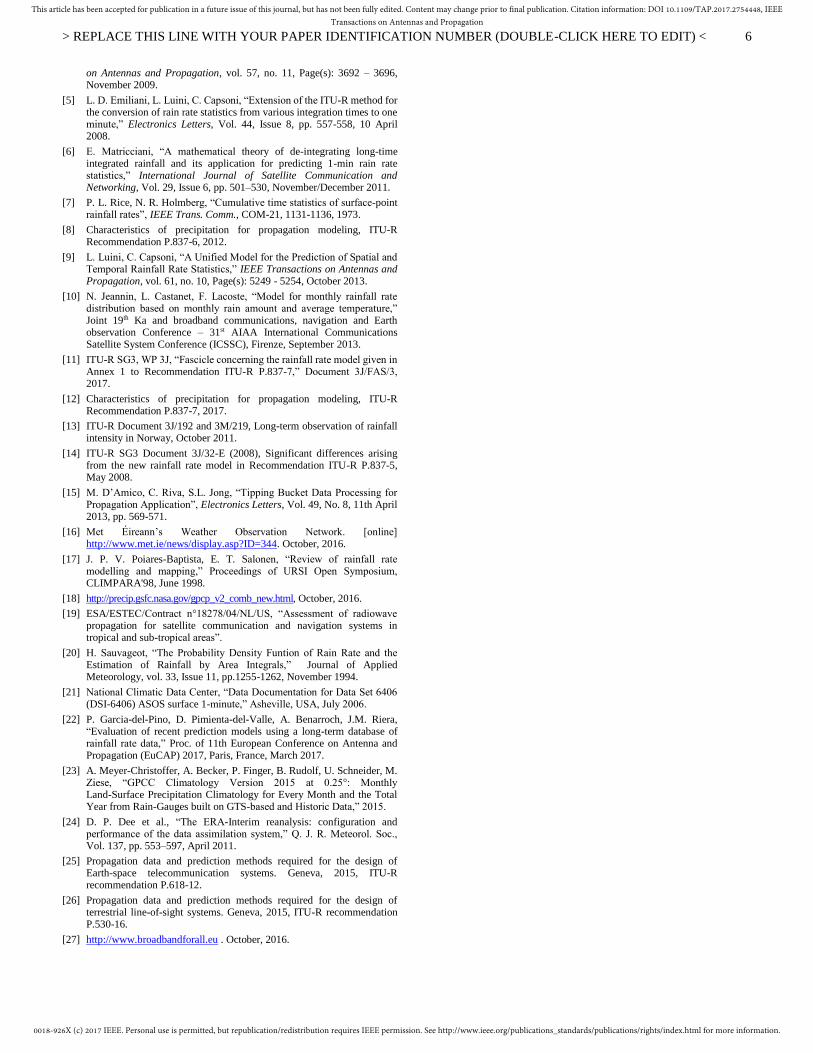
(see [25] and [26]). Fig. 6 presents the RMS value calculated
for all sites as a function of the exceedance probability Pj;
mathematically:
s
S
N
i
i
N
i
jii
j
P
PRMS
1
1
2
(16)
Results in Fig. 5 and Fig. 6 reinforce the results reported in
Fig. 3 and Fig. 4: the ITU-R P.837-7 and the ITU-R P.837-6
prediction methods provide the best and worst prediction
accuracy, respectively, though a general tendency to
overestimate R0.01% emerges. All prediction methods exhibit
similar performance for values of P ≥ 0.1%, while for P < 0.1%
the prediction errors increase - expected because of the
decrease in the statistical significance of the curves - but more
slowly for the ITU-R P.837-7 prediction method.
Fig. 5. Prediction accuracy on R0.01%.
Fig. 6. Prediction accuracy as a function of the exceedance probability.
V. CONCLUSIONS
The tests on the performance of the three rainfall rate
prediction methods considered in this paper indicate that using
the ITU-R P.837-7 method will improve the accuracy in the
prediction of a P(R) in Ireland, compared to the results
produced by the ITU-R P.837-6 and MORSE prediction
methods. Moreover, as presented in [11], the performance
improvement brought by the ITU-R P.837-7 prediction method
(based on the ONERA approach) over the ITU-R P.837-6
prediction method is corroborated via similar tests conducted
over Colombia and Spain. An enhancement in the accuracy of
rainfall rate prediction can be directly related to improvements
in the attenuation prediction, and will be beneficial for any
application involving high frequency wireless links, such as the
provision of broadband services via satellite in Ireland (with
over seven satellite service providers in the region according to
[27]): indeed increasing the accuracy of the input P(R) will
translate into more accurate link quality predictions and should
also bring improvements to the characteristics of the service
delivered.
ACKNOWLEDGMENT
The authors acknowledge Met Éireann for supplying the data
used in this study. The data are used according to the provisions
in the Creative Commons Attribution-ShareAlike 4.0
International License.
The ONERA prediction method was developed under CNES
R&T studies R-S10/TC-0005-015 and R-S14/TC-0005-015,
“Improvement of rain attenuation prediction model for SatCom
systems”.
REFERENCES
[1] R. K. Crane, “Electromagnetic Wave Propagation Through Rain,” Wiley, ISBN: 978-0-471-61376-3, 288 pages, April 1996.
[2] G. F. Bryant, I. Adimula, C. Riva, G. Brussaard,, “Rain Attenuation Statistics from Rain Cell Diameters and Heights”, Int. J. Satell. Commun., 2001; 19: 263-283, 1999.
[3] R. K. Crane, “Prediction of attenuation by rain”, IEEE Trans. Commun., vol. COM-28, pp. 1717–1733, Sep. 1980.
[4] C. Capsoni, L. Luini, “A physically based method for the conversion of rainfall statistics from long to short integration time,” IEEE Transactions
0018-926X (c) 2017 IEEE. Personal use is permitted, but republication/redistribution requires IEEE permission. See http://www.ieee.org/publications_standards/publications/rights/index.html for more information.
This article has been accepted for publication in a future issue of this journal, but has not been fully edited. Content may change prior to final publication. Citation information: DOI 10.1109/TAP.2017.2754448, IEEETransactions on Antennas and Propagation
> REPLACE THIS LINE WITH YOUR PAPER IDENTIFICATION NUMBER (DOUBLE-CLICK HERE TO EDIT) <
6
on Antennas and Propagation, vol. 57, no. 11, Page(s): 3692 – 3696, November 2009.
[5] L. D. Emiliani, L. Luini, C. Capsoni, “Extension of the ITU-R method for the conversion of rain rate statistics from various integration times to one minute,” Electronics Letters, Vol. 44, Issue 8, pp. 557-558, 10 April 2008.
[6] E. Matricciani, “A mathematical theory of de-integrating long-time integrated rainfall and its application for predicting 1-min rain rate statistics,” International Journal of Satellite Communication and Networking, Vol. 29, Issue 6, pp. 501–530, November/December 2011.
[7] P. L. Rice, N. R. Holmberg, “Cumulative time statistics of surface-point rainfall rates”, IEEE Trans. Comm., COM-21, 1131-1136, 1973.
[8] Characteristics of precipitation for propagation modeling, ITU-R Recommendation P.837-6, 2012.
[9] L. Luini, C. Capsoni, “A Unified Model for the Prediction of Spatial and Temporal Rainfall Rate Statistics,” IEEE Transactions on Antennas and Propagation, vol. 61, no. 10, Page(s): 5249 - 5254, October 2013.
[10] N. Jeannin, L. Castanet, F. Lacoste, “Model for monthly rainfall rate distribution based on monthly rain amount and average temperature,” Joint 19th Ka and broadband communications, navigation and Earth observation Conference – 31st AIAA International Communications Satellite System Conference (ICSSC), Firenze, September 2013.
[11] ITU-R SG3, WP 3J, “Fascicle concerning the rainfall rate model given in Annex 1 to Recommendation ITU-R P.837-7,” Document 3J/FAS/3, 2017.
[12] Characteristics of precipitation for propagation modeling, ITU-R Recommendation P.837-7, 2017.
[13] ITU-R Document 3J/192 and 3M/219, Long-term observation of rainfall intensity in Norway, October 2011.
[14] ITU-R SG3 Document 3J/32-E (2008), Significant differences arising from the new rainfall rate model in Recommendation ITU-R P.837-5, May 2008.
[15] M. D’Amico, C. Riva, S.L. Jong, “Tipping Bucket Data Processing for Propagation Application”, Electronics Letters, Vol. 49, No. 8, 11th April 2013, pp. 569-571.
[16] Met Éireann’s Weather Observation Network. [online] http://www.met.ie/news/display.asp?ID=344. October, 2016.
[17] J. P. V. Poiares-Baptista, E. T. Salonen, “Review of rainfall rate modelling and mapping,” Proceedings of URSI Open Symposium, CLIMPARA'98, June 1998.
[18] http://precip.gsfc.nasa.gov/gpcp_v2_comb_new.html, October, 2016.
[19] ESA/ESTEC/Contract n°18278/04/NL/US, “Assessment of radiowave propagation for satellite communication and navigation systems in tropical and sub-tropical areas”.
[20] H. Sauvageot, “The Probability Density Funtion of Rain Rate and the Estimation of Rainfall by Area Integrals,” Journal of Applied Meteorology, vol. 33, Issue 11, pp.1255-1262, November 1994.
[21] National Climatic Data Center, “Data Documentation for Data Set 6406 (DSI-6406) ASOS surface 1-minute,” Asheville, USA, July 2006.
[22] P. Garcia-del-Pino, D. Pimienta-del-Valle, A. Benarroch, J.M. Riera, “Evaluation of recent prediction models using a long-term database of rainfall rate data,” Proc. of 11th European Conference on Antenna and Propagation (EuCAP) 2017, Paris, France, March 2017.
[23] A. Meyer-Christoffer, A. Becker, P. Finger, B. Rudolf, U. Schneider, M. Ziese, “GPCC Climatology Version 2015 at 0.25°: Monthly Land-Surface Precipitation Climatology for Every Month and the Total Year from Rain-Gauges built on GTS-based and Historic Data,” 2015.
[24] D. P. Dee et al., “The ERA-Interim reanalysis: configuration and performance of the data assimilation system,” Q. J. R. Meteorol. Soc., Vol. 137, pp. 553–597, April 2011.
[25] Propagation data and prediction methods required for the design of Earth-space telecommunication systems. Geneva, 2015, ITU-R recommendation P.618-12.
[26] Propagation data and prediction methods required for the design of terrestrial line-of-sight systems. Geneva, 2015, ITU-R recommendation P.530-16.
[27] http://www.broadbandforall.eu . October, 2016.