randd.defra.gov.ukrandd.defra.gov.uk/document.aspx?document=bd1324_5933... · web viewfigure 4.2...
TRANSCRIPT
CEH DorsetWinfrith Technology Centre
Winfrith NewburghDorchester
Dorset DT2 8ZD
Telephone (01305) 213500Main Fax (01305) 213600
www.ceh.ac.uk
* Centre for Ecology and Hydrology Dorset, Winfrith Technology Centre, Winfrith Newburgh, Dorchester, Dorset DT2 8ZD, UK
** Royal Society for the Protection of Birds, The Lodge, Sandy, Bedfordshire, SG19 2DL, UK
Project Leader: Dr Richard A StillmanReport to: DEFRACEH Project No: C03043Date: November 2006
Management of wet grassland habitat to reduce the impact of predation on
breeding waders: Phase 1
Final ReportR. A. Stillman*, M. A. MacDonald**, M. R. Bolton**,
S. E. A. le V. dit Durell*, R. W. G. Caldow*& A. D. West*

INTELLECTUAL PROPERTY RIGHTS
CONFIDENTIALITY STATEMENT
‘In accordance with our normal practice, this report is for the use only of the party to whom it is addressed, and no responsibility is accepted to any third party for the whole or any part of its contents. Neither the whole nor any part of this report or any reference thereto may be included in any published document, circular or statement, nor published or referred to in any way without our written approval of the form and context in which it may appear.’
CONTENTS
Summary 1Chapter 1 Introduction.......................................................................................................4
1.1 Background.................................................................................................................41.2 Project phases 1 and 2.................................................................................................51.3 Objectives of Phase 1..................................................................................................71.4 Structure of the report.................................................................................................81.5 References...................................................................................................................9
Chapter 2 Review of the impact of predators on wader nests......................................102.1 Summary...................................................................................................................102.2 Introduction...............................................................................................................112.3 The habitat................................................................................................................122.4 Nest predation of waders in wet grassland...............................................................132.5 Predators of wader nests...........................................................................................182.6 Behaviour and ecology of key predators of wader nests..........................................262.7 Factors affecting the rates of nest predation.............................................................422.8 Conclusions...............................................................................................................512.9 Acknowledgements...................................................................................................542.10 References.................................................................................................................55
Chapter 3 Analysis of the impact of predators on wader nests....................................683.1 Introduction...............................................................................................................683.2 Methods.....................................................................................................................683.3 Results.......................................................................................................................723.4 Discussion.................................................................................................................763.5 Acknowledgments.....................................................................................................773.6 References.................................................................................................................77
Chapter 4 Models of the impact of predators on wader nests......................................794.1 Summary...................................................................................................................794.2 Introduction...............................................................................................................804.3 Mathematical nest-predator model...........................................................................804.4 Individual-based nest-predator model.......................................................................874.5 Results.......................................................................................................................924.6 Discussion.................................................................................................................994.7 References...............................................................................................................101
Chapter 5 Discussion.......................................................................................................1025.1 Introduction.............................................................................................................1025.2 Overview of project results.....................................................................................1025.3 Preliminary recommendations................................................................................1055.4 Future research........................................................................................................105
i

TABLE LEGENDS
Table 1.1 Link between report chapters and project objectives.
Table 2.1 Predation rates of waders in wet grassland and similar habitats.
Table 2.2 Wader nest predators, means of identification, and relative importance.
Table 2.3 Importance of eggs in diet of potential nest predators, and other important items in diet.
Table 2.4 Density, group size, and home range size of potential predators of wader nests.
Table 2.5 Energy and food requirements of potential predators of wader nests.
Table 2.6 Foraging behaviour of potential predators.
Table 2.7 Relationships between predictor variables and wader nest predation in wet grassland and similar habitats.
Table 3.1 Predictor variables, means, minimum, maximums and quartile values.
Table 3.2 Model term effects and standard errors, for model containing all cases.
Table 3.3 Model term effects and standard errors, for model containing reduced cases.
Table 4.1 Equations (a) and parameters (b) of the mathematical nest-predator model.
Table 4.2 Parameters of the nest-predator simulation model.
Table 4.3 Ways in which the nest predator simulation model could be improved in Phase 2 of the project and data required to make the improvements.
Table 4.4 Parameter values used to apply the mathematical and simulation models to the lapwing-fox system.
ii
FIGURE LEGENDS
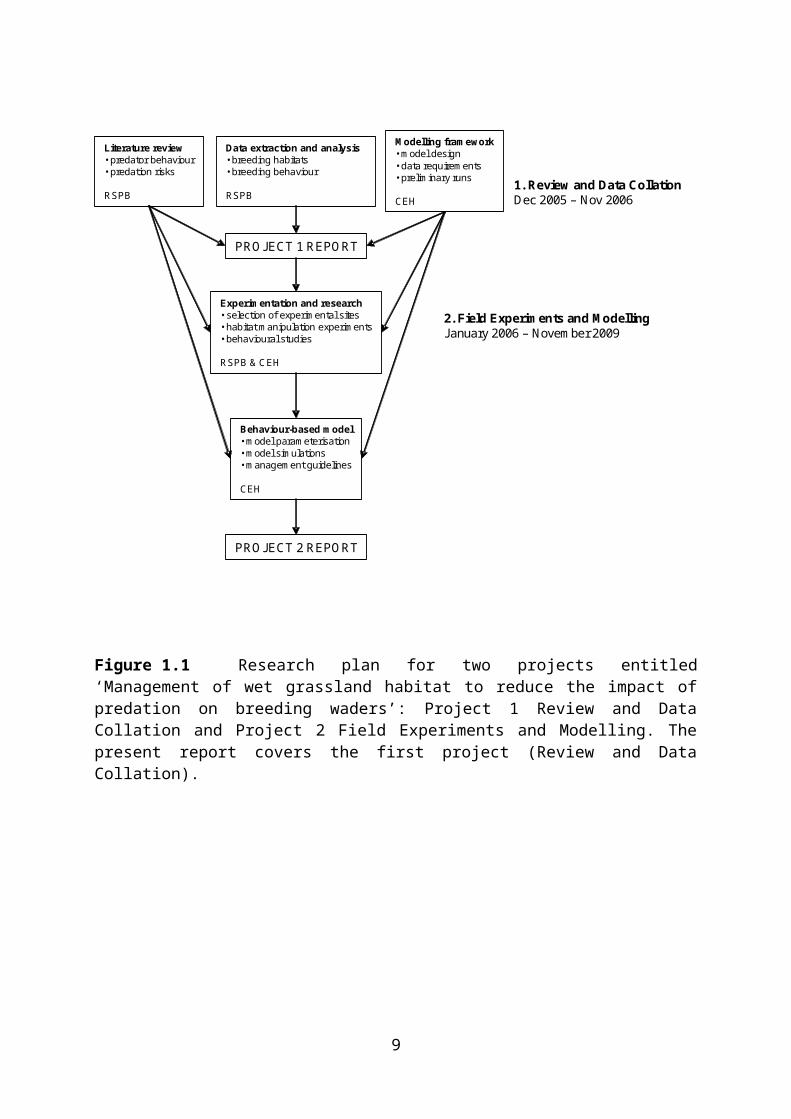
Figure 1.1 Research plan for two projects entitled ‘Management of wet grassland habitat to reduce the impact of predation on breeding waders’: Project 1 Review and Data Collation and Project 2 Field Experiments and Modelling. The present report covers the first project (Review and Data Collation).
Figure 3.1 Location of study sites.
Figure 4.1 Basic spatial assumptions of the mathematical nest-predator model. Nests are within a rectangular field of width x and length y. Nests are located towards the centre of the field (spotted shading), avoiding the edge by a distance dnest. Nests will be located throughout the field if dnest equals 0. Predator foraging is located towards the edge of the field (grey shading), never more than dpred from the field edge. Predators will forage throughout the field if dpred equals the minimum of x / 2 and y / 2.
Figure 4.2 How predator searching is incorporated into the model. The black circle shows the predators initial location. The predator moves at constant speed v, in a straight line, for a time of t, reaching the location of the white circle and moving a distance of v t. At all times, the predator is able to detect any nests within a distance ddetect. The grey shading shows the area searched during this time.
Figure 4.3 Basic spatial assumptions of the nest-predator simulation model. Nests are within a rectangular field of width x and length y, which is divided into an array of square uniform patches. Nests are located towards the centre of the field (spotted shading), avoiding the edge by a distance dnest. Nests will be located throughout the field if dnest equals 0. Predator foraging is located towards the edge of the field (light grey shading), never more than dpred
from the field edge. Predators will forage throughout the field if dpred equals the minimum of x / 2 and y / 2. The field is located within an area of surrounding predator foraging habitat (dark grey rectangle). Within the surrounding habitat are a number of predator dens / nests (black circles), from which predators forage.
Figure 4.4 Screen shots of the nest-predator simulation model showing the distribution of foxes (black circles) and lapwing nests (white circles): (a) night time at start of breeding season; (b) day time at start of breeding season; (c) night time at end of breeding season; (d) day time at end of breeding season. The central array of squares represents the 500x500m nesting field divided into 50x50m patches. The squares of each corner represent dens to which foxes retreat during day time. The rectangles along each side represent the area of surrounding habitat. Dens and surrounding habitat are not drawn to scale. By night, most foxes forage in the surrounding habitat, but occasionally forage in the bounding 100m (patches) of nesting field. When foxes forage in a patch occupied by a nest, there is a probability that the nest will be found and consumed. By the end of the season, predation has substantially reduced nest density in the bordering 100m of the field into which foxes forage, but is unchanged in the field centre. For presentation the numbers of nests and foxes are higher than those used in the simulations.
Figure 4.5 Comparison of the predictions of the mathematical and simulation models. The figure shows the proportion of nests surviving in relation to the time since eggs were laid. Black circles show the predictions of the mathematical model, and open circles show the predictions from 20 replicates of the simulation model. The line shows the mean predictions of the simulation model.
iii
Figure 4.6 Predicted effect of field size and shape on (a) the proportion of lapwing nests at risk of predation (Prisk) and (b) lapwing hatching success (H). The different lines show predictions for different patch shapes: white circles – squares (length = width); grey circles – rectangles with length four times width; black circles – rectangles with length eight times width. See Table 4.4 for default parameter values.
Figure 4.7 Predicted effect of environmental variables, lapwing and fox population size and behaviour on the hatching success of lapwing nests. Each figure shows predictions of the mathematical model as field area and one other parameter are varied, while all other parameters are held constant. Patches were assumed to be square, with patch area calculated as width (x) x length (y). In (h) lapwing were assumed to be able to defend their nests (m = 0.5 ha nest-1) as hatching success is independent of nest density when nests cannot be defended. See Table 4.4 for default parameter values.
iv

SUMMARY
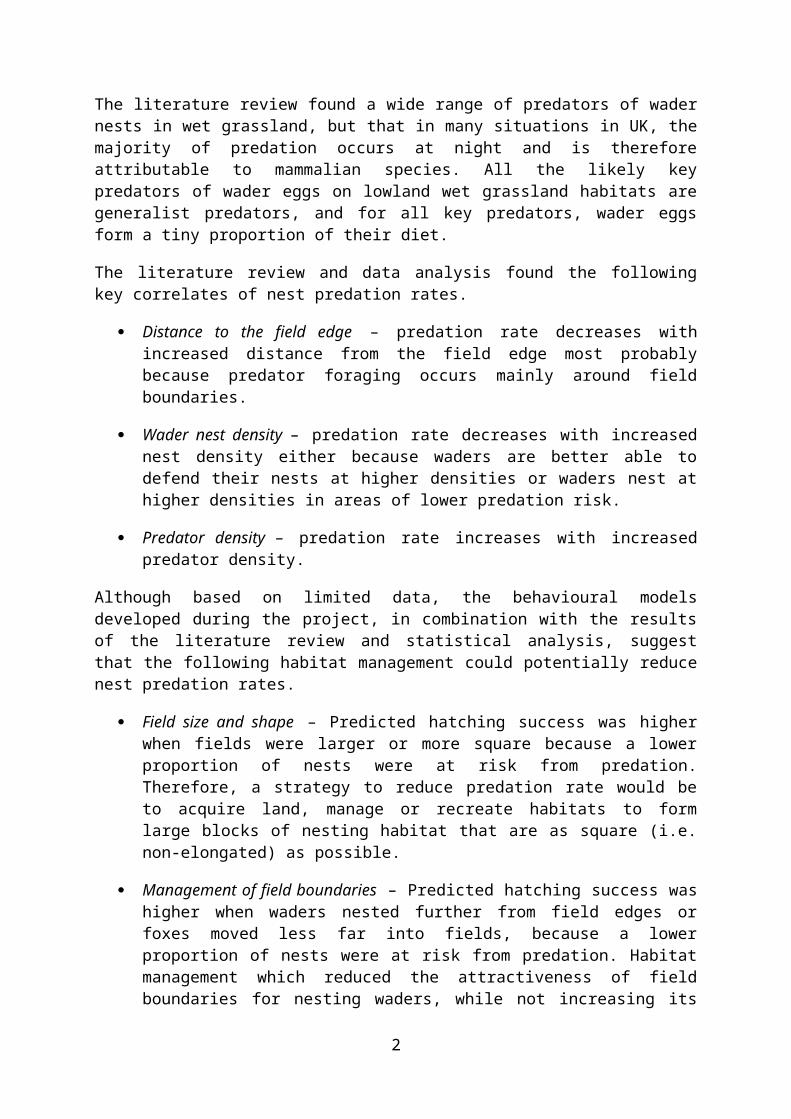
Populations of waders breeding in lowland wet grassland in England and Wales declined rapidly in the late 20th century. The recovery of wader populations on lowland wet grassland depends to a large extent on the number of young successfully reared to fledging and subsequently recruited into the adult population. One of the main factors that can affect wader breeding success is nest predation. Some experimental studies have indicated significant beneficial effects of predator control, and predator control often forms part of 'habitat management' at reserves where the maintenance of healthy breeding bird populations is an objective. Although such practices may be effective at a local scale, they may be impractical, or too controversial, at the larger scale, that needs to be considered in the context of managing land in agri-environment holdings across the whole country.
The aim of the present project was to investigate whether habitat modification might be an alternative means by which the impact of predation on breeding waders can be reduced in order to increase their breeding success. The project was designed as the first of two phases of research and had five key objectives.
Objective 1 – Review literature on foraging behaviour and habitat use of avian and mammalian predators of wader nests on lowland wet grassland.
Objective 2 – Extract and analyse existing data from RSPB databases on wader breeding habitat characteristics, breeding behaviour and levels of nest predation.
Objective 3 – Design a behaviour-based model which can be used to simulate interactions between predators and breeding waders.
Objective 4 – Draw up testable hypotheses concerning the role of various environmental factors in influencing predation on wader eggs and chicks and identify data requirements for the predator-breeding wader model.
Objective 5 – Recommend further research to be undertaken during the second phase of the project.
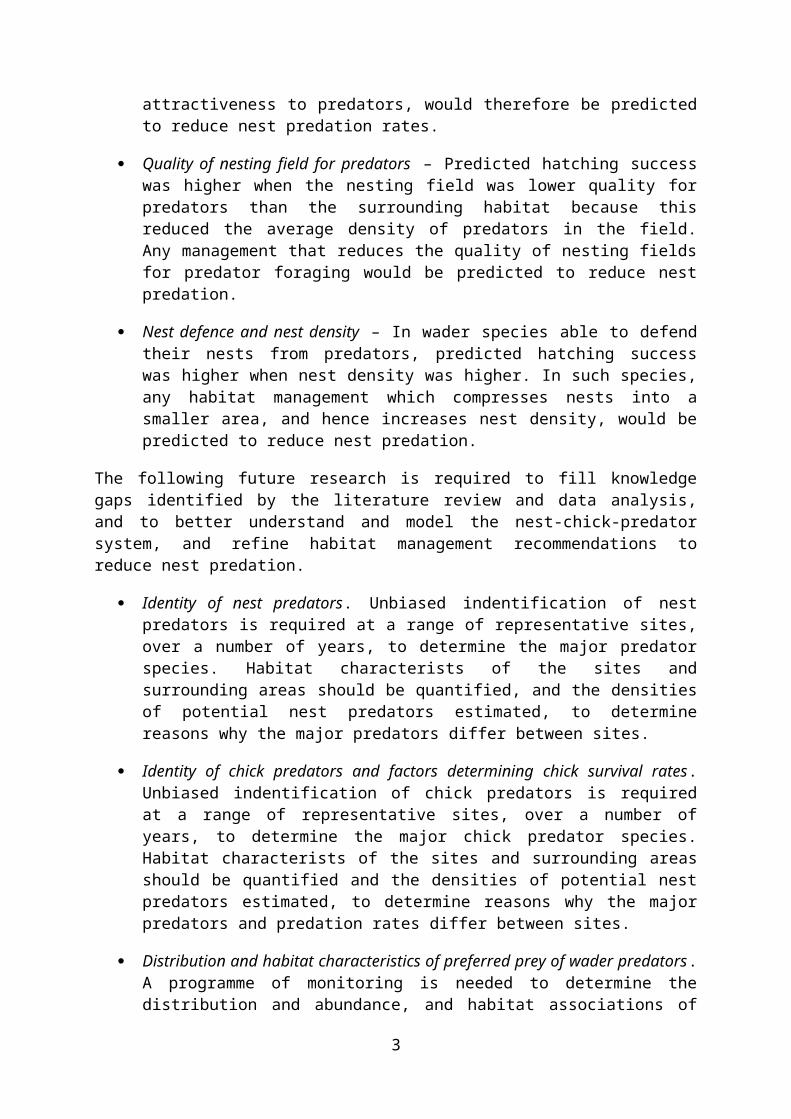
The literature review found a wide range of predators of wader nests in wet grassland, but that in many situations in UK, the majority of predation occurs at night and is therefore attributable to mammalian species. All the likely key predators of wader eggs on lowland wet grassland habitats are generalist predators, and for all key predators, wader eggs form a tiny proportion of their diet.
The literature review and data analysis found the following key correlates of nest predation rates.
Distance to the field edge – predation rate decreases with increased distance from the field edge most probably because predator foraging occurs mainly around field boundaries.
Wader nest density – predation rate decreases with increased nest density either because waders are better able to defend their nests at higher densities or waders nest at higher densities in areas of lower predation risk.
Predator density – predation rate increases with increased predator density.
1
Although based on limited data, the behavioural models developed during the project, in combination with the results of the literature review and statistical analysis, suggest that the following habitat management could potentially reduce nest predation rates.
Field size and shape – Predicted hatching success was higher when fields were larger or more square because a lower proportion of nests were at risk from predation. Therefore, a strategy to reduce predation rate would be to acquire land, manage or recreate habitats to form large blocks of nesting habitat that are as square (i.e. non-elongated) as possible.
Management of field boundaries – Predicted hatching success was higher when waders nested further from field edges or foxes moved less far into fields, because a lower proportion of nests were at risk from predation. Habitat management which reduced the attractiveness of field boundaries for nesting waders, while not increasing its attractiveness to predators, would therefore be predicted to reduce nest predation rates.
Quality of nesting field for predators – Predicted hatching success was higher when the nesting field was lower quality for predators than the surrounding habitat because this reduced the average density of predators in the field. Any management that reduces the quality of nesting fields for predator foraging would be predicted to reduce nest predation.
Nest defence and nest density – In wader species able to defend their nests from predators, predicted hatching success was higher when nest density was higher. In such species, any habitat management which compresses nests into a smaller area, and hence increases nest density, would be predicted to reduce nest predation.
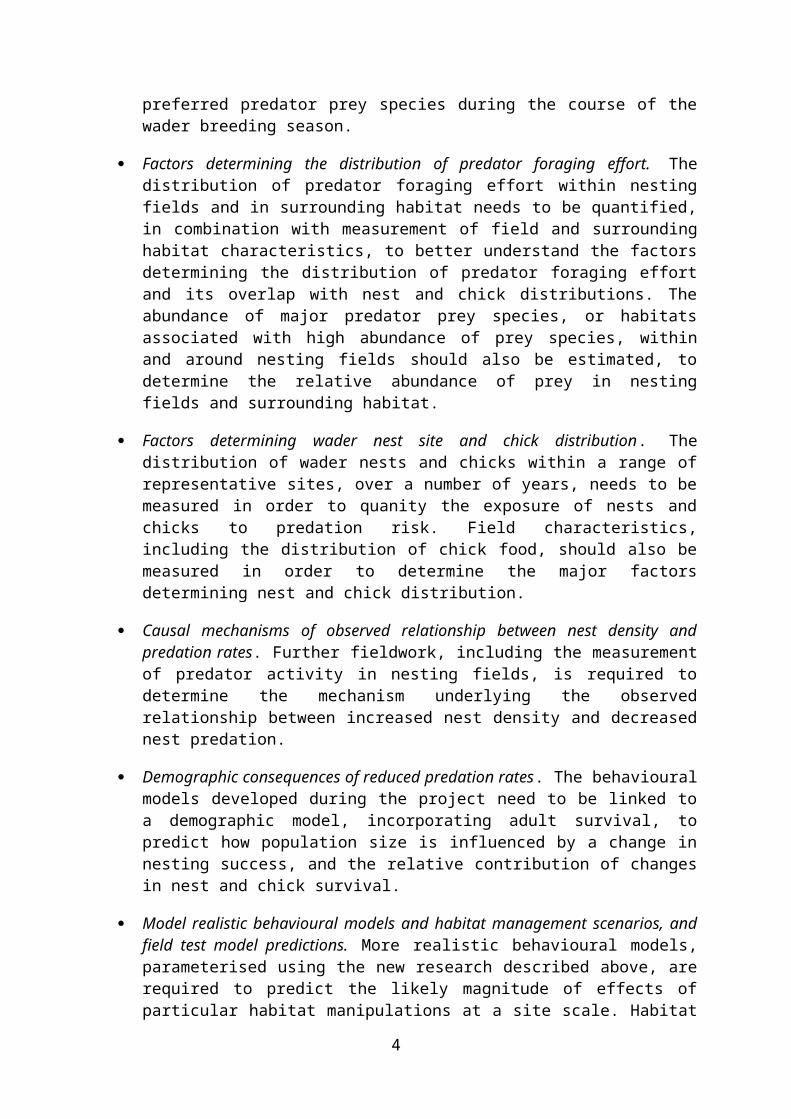
The following future research is required to fill knowledge gaps identified by the literature review and data analysis, and to better understand and model the nest-chick-predator system, and refine habitat management recommendations to reduce nest predation.
Identity of nest predators. Unbiased indentification of nest predators is required at a range of representative sites, over a number of years, to determine the major predator species. Habitat characterists of the sites and surrounding areas should be quantified, and the densities of potential nest predators estimated, to determine reasons why the major predators differ between sites.
Identity of chick predators and factors determining chick survival rates. Unbiased indentification of chick predators is required at a range of representative sites, over a number of years, to determine the major chick predator species. Habitat characterists of the sites and surrounding areas should be quantified and the densities of potential nest predators estimated, to determine reasons why the major predators and predation rates differ between sites.
Distribution and habitat characteristics of preferred prey of wader predators. A programme of monitoring is needed to determine the distribution and abundance, and habitat associations of preferred predator prey species during the course of the wader breeding season.
2
Factors determining the distribution of predator foraging effort. The distribution of predator foraging effort within nesting fields and in surrounding habitat needs to be quantified, in combination with measurement of field and surrounding habitat characteristics, to better understand the factors determining the distribution of predator foraging effort and its overlap with nest and chick distributions. The abundance of major predator prey species, or habitats associated with high abundance of prey species, within and around nesting fields should also be estimated, to determine the relative abundance of prey in nesting fields and surrounding habitat.
Factors determining wader nest site and chick distribution. The distribution of wader nests and chicks within a range of representative sites, over a number of years, needs to be measured in order to quanity the exposure of nests and chicks to predation risk. Field characteristics, including the distribution of chick food, should also be measured in order to determine the major factors determining nest and chick distribution.
Causal mechanisms of observed relationship between nest density and predation rates. Further fieldwork, including the measurement of predator activity in nesting fields, is required to determine the mechanism underlying the observed relationship between increased nest density and decreased nest predation.
Demographic consequences of reduced predation rates. The behavioural models developed during the project need to be linked to a demographic model, incorporating adult survival, to predict how population size is influenced by a change in nesting success, and the relative contribution of changes in nest and chick survival.
Model realistic behavioural models and habitat management scenarios, and field test model predictions. More realistic behavioural models, parameterised using the new research described above, are required to predict the likely magnitude of effects of particular habitat manipulations at a site scale. Habitat manipulations need to be designed to reduce the availability of predators’ target prey in the vicinity of fields used by breeding waders, to reduce the density of the predators themselves at a site-scale or to reduce the overlap between predator, nest and chick distributions. Further fieldwork, involving real-world habitat manipulation on a number of representative sites should then be used to confirm the accuracy of predictions.
3
CHAPTER 1 INTRODUCTION
R. A. Stillman, M. A. MacDonald, M. R. Bolton, S. E. A. le V. dit Durell, R. W. G. Caldow and A. D. West
1.1 Background
Populations of waders breeding in lowland wet grassland in England and Wales declined rapidly in the late 20th century and the loss of once widespread species such as lapwing, redshank and snipe from many areas has been of particular conservation concern (Wilson et al. 2001, 2005). Careful management of key sites, most of them managed as nature reserves, has shown that breeding population declines can be halted, or even reversed in such localities (Wilson et al. 2004). However, at the wider scale, over the same period of time, there has been very little improvement in populations of breeding waders on large areas of wet grasslands managed in line with existing agri-environment agreement prescriptions.
The recovery of wader populations on lowland wet grassland depends to a large extent on the number of young successfully reared to fledging and subsequently recruited into the adult population. One of the main factors that can affect wader breeding success is nest predation. It is possible, therefore, that habitat changes that have led to increased nest predation rates (Baines 1990) and increases in avian and mammalian predators themselves (perhaps due to a decline in the activities of game keepers) have hindered the recovery of wader populations in many areas.
Several experimental studies over the last few decades have explored the efficacy of direct predator control (i.e. culling) in improving the breeding success and population sizes of various types of birds (see Coté & Sutherland 1997 for review). Some studies have indicated significant beneficial effects of predator control. Accordingly, predator control often forms part of 'habitat management' at reserves where the maintenance of healthy breeding bird populations is an objective. Although such practices may be effective at a local scale, they may be impractical at the larger scale that needs to be considered in the context of managing land in agri-environment holdings across the whole country. Furthermore, widespread predator control, even if the most effective means of reducing predation on breeding waders, is likely to be highly controversial. Thus, there is considerable merit in investigating other means by which predation on the nests and chicks of breeding waders might be reduced.
Over the last decade CEH has developed a behaviour-based approach to modelling the interaction between predators and their prey (e.g. Stillman et al. 2000, 2003; 2005; West et al. 2003; Caldow et al. 2004; Durell et al. 2006). To date this has been applied primarily to wintering populations of shorebirds feeding on macro-invertebrates in intertidal habitats. Recently, however, the approach has been applied to herbivorous waterfowl in agricultural landscapes and to sea ducks in offshore waters. The fundamental ecological principles that underlie this approach mean that the model can be applied readily to a far wider range of predator-prey systems than those studied so far. In most studies to date the principal aim of the modelling has been to predict the influence of environmental change on the survival of the predators themselves rather than that of their prey. However, one of the principal outputs of this sort of predator-prey model is the rate of prey consumption by predators. Accordingly, the modelling approach can be used to explore the extent to which environmental change influences the predation pressure exerted by a population of predators on its prey.
4
The aim of the present project is, therefore, to investigate whether modification of the habitat itself might be an alternative means by which the impact of predation on breeding waders can be reduced in order to increase their breeding success, using three approaches: (i) literature review of existing knowledge, (ii) statistical analysis of existing datasets and (iii) development of a predictive model based on the CEH behaviour-based modelling approach. The rationale of the study is that the way in which predators interact with their prey is likely to be influenced by the way in which both interact with their surroundings. If it is possible to understand the environmental factors that influence the probability that eggs and chicks are eaten by a predator and the factors that influence the way in which predators forage it might be possible to manipulate the environment to reduce the probability of predation.
1.2 Project phases 1 and 2
This project is designed as the first of two phases of research on the management of wet grassland habitat to reduce the impact of predation on breeding waders. Outputs from this first phase include: a) a review of existing knowledge on the foraging ecology of the key predators of breeding wader nests, b) an analysis of existing data on nest predation and breeding wader habitats in RSPB databases, c) a series of testable hypotheses concerning the roles of various controllable environmental parameters in influencing predation rates, d) a model framework for modelling the interactions between predators and breeding waders, and e) recommendations for further research and experimentation needed to parameterise and test the predator-breeding wader model. The outputs from this phase of the research will feed into the proposed second phase which will use a combination of field experiments and modelling to quantify the effect of certain habitat manipulations on predation risk and to predict the effects of others. The principal outputs from this second phase of the research are envisaged as being recommendations for habitat management designed to reduce the impact of predation on breeding waders on wet grassland, particularly in agri-environment schemes. The overall aim of the project is to further our understanding of the efficacy of habitat manipulation as a tool with which to minimise the effects of predation on wader breeding success.
5

Literature review• predator behaviour• predation risks
RSPB
Data extraction and analysis• breeding habitats• breeding behaviour
RSPB
Modelling framework• model design• data requirements• preliminary runs
CEH
Experimentation and research• selection of experimental sites• habitat manipulation experiments• behavioural studies
RSPB & CEH
Behaviour-based model• model parameterisation• model simulations• management guidelines
CEH
PROJECT 2 REPORT
PROJECT 1 REPORT
1. Review and Data CollationDec 2005 – Nov 2006
2. Field Experiments and ModellingJanuary 2006 – November 2009
Figure 1.1 Research plan for two projects entitled ‘Management of wet grassland habitat to reduce the impact of predation on breeding waders’: Project 1 Review and Data Collation and Project 2 Field Experiments and Modelling. The present report covers the first project (Review and Data Collation).
6
1.3 Objectives of Phase 1
The objectives of phase 1 of the project were as follows.
Objective 1. Review literature on foraging behaviour and habitat use of avian and mammalian predators of wader nests on lowland wet grassland.
The purpose of this objective was to review published and unpublished literature to synthesise current understanding of the ecology of the key avian and mammalian predators of breeding waders and their habitat utilisation. Apart from highlighting current knowledge, the review was also intended to identify knowledge gaps, and assess ways in which habitat manipulation might reduce predators’ impact on breeding wader populations, by exploiting features of predators’ foraging behaviour/habitat use.
Objective 2. Extract and analyse existing data from RSPB databases on wader breeding habitat characteristics, breeding behaviour and levels of nest predation.
The purpose of this objective was to collate and analyse RSPB datasets in order to statistically model the impact of environmental factors on lapwing nest predation rate. Data were available from 4,000 lapwing nests, over a 10-year period, covering 28 sites throughout England and Wales. Environmental factors included distance from field edge, nest and predator densities, sward height and structure, field size and predator vantage points (trees, hedges and overhead wires). The analyses were intended to give a clearer understanding of the variation in predation rates in space and time and of the environmental factors underlying this variation, and also to provide parameter estimates for objective 3.
Objective 3. Design a behaviour-based model which can be used to simulate interactions between predators and breeding waders.
The purpose of this objective was to use an existing behaviour-based model, developed by CEH over the last decade, to predict the effect of environmental factors on wader nesting success. The model structure and parameter values were to be guided by the results of objectives 1 and 2. The model was intended to identify key parameters and indicate knowledge gaps that need to be addressed in Phase 2 of the project. By the end of Phase 1 of the project the aim was to have a ‘demonstration’ version of the model which, although not fully parameterised, would have the correct structure to simulate a predator-breeding wader system.
Objective 4. Draw up testable hypotheses concerning the role of various environmental factors in influencing predation on wader eggs and chicks and identify data requirements for the predator-breeding wader model.
This objective was to use the results of the literature review (Objective 1) and data analysis (Objective 2) to identify a number of testable hypotheses concerning the influence of habitat on breeding wader-predator interactions. At the same time, development of the demonstration version of the model (Objective 3) would identify those data / parameter values which still need to be measured or collected in order to parameterise a fully-functional model. These hypotheses and data requirements would then inform Objective 5.
7
Objective 5. Recommend further research to be undertaken in Phase 2.
The purpose of this objective was to recommend future research (to be conducted in Phase 2), based on the hypotheses formulated and the data requirements identified under Objective 4.
Objective 6. Prepare a report to DEFRA describing work undertaken to meet each of Objectives 1-5.
The final report was to include a computer disk containing the computer code of the model developed in Objective 3, and a representative parameter file to enable one version of the model (as determined by the values within the parameter file) to be run from the disk for demonstration purposes.
1.4 Structure of the report
This report describes how we addressed project objectives 1 to 5 (Table 1.1). Chapter 2 addresses Objective 1, presenting the results of the literature review conducted during the project. Chapter 3 addresses Objective 2, presenting the results of the analysis of the RSPB lapwing nest predation datasets. The results of Chapters 2 and 3 are used to structure behaviour-based models in Chapter 4, which addresses Objective 3. Chapter 5 addresses Objectives 4 and 5, by identifying future research required to fill knowledge gaps and test hypotheses of the impact of predation on wader breeding success.
Table 1.1 Link between report chapters and project objectives.
Objective Chapter
1. Literature review 2
2. Data analysis 3
3. Model development 4
4. Testable hypotheses 5
5. Future research 5
8
1.5 References
Baines, D. (1990) The roles of predation, food and agricultural practice in determining the breeding success of the lapwing (Vanellus vanellus) on upland grasslands. Journal of Animal Ecology, 59, 915-29.
Caldow, R. W. G., Beadman, H. A., McGrorty, S., Stillman, R. A., Goss-Custard, J. D., Durell, S. E. A. le V. dit, West, A. D., Kaiser, M. J., Mould, K. & Wilson, A. (2004) A behavior-based modeling approach to reducing shorebird-shellfish conflicts. Ecological Applications, 14, 1411-1427.
Côté, I.M. & Sutherland, W.J. (1997) The effectiveness of removing predators to protect bird populations. Conservation Biology, 11(2), 395-405.
Durell, S. E. A. le V. dit, Stillman, R.A., Caldow, R.W.G., McGrorty, S. and West, A.D., (2006) Modelling the effect of environmental change on shorebirds: a case study on Poole Harbour, UK. Biological Conservation, 131, 459-473.
Stillman, R.A., Goss-Custard, J.D., West, A.D., Durell, S. E. A. le V. dit, Caldow, R.W.G., McGrorty, S. and Clarke, R.T. (2000) Predicting mortality in novel environments: tests and sensitivity of a behaviour-based model. Journal of Applied Ecology, 37, 564-588.
Stillman, R. A., West, A. D., Goss-Custard, J. D., Caldow, R. W. G., McGrorty, S., Durell, S. E. A. le V. dit, Yates, M., G., Atkinson, P. W., Clark, N. A., Bell, M. C., Dare, P. J. & Mander, M. (2003) An individual behaviour-based model can predict shorebird mortality using routinely collected shellfishery data. Journal of Applied Ecology, 40, 1090-1101.
Stillman, R.A., West, A.D., Goss-Custard, J.D., McGrorty, S., Frost, N.J., Morrisey, D.J., Kenny, A.J. and Drewitt, A. (2005) Predicting site quality for shorebird communities: a case study on the Humber estuary, UK. Marine Ecology Progress Series, 305, 203-217.
West, A. D., Goss-Custard, J. D., McGrorty, S., Stillman, R. A., Durell, S. E. A. le V. dit, Stewart, B., Walker, P., Palmer, D. W., & Coates, P. (2003) The Burry shellfishery and oystercatchers: using a behaviour-based model to advise on shellfishery management policy. Marine Ecology Progress Series, 248, 279-292.
Wilson AM, Vickery JA and Browne SJ (2001) Numbers and distribution of Northern Lapwings Vanellus vanellus breeding in England and Wales in 1998. Bird Study 48, 2-17.
Wilson, A.M., Ausden, M. & Milsom, T.P. (2004) Changes in breeding wader populations on lowland wet grasslands in England and Wales: causes and potential solutions. Ibis, 146 (Suppl. 2), 32-40
Wilson, A.M., Vickery, J.A., Brown, A., Langston, R.H.W., Smallshire, D., Wotton, S. & Vanhinsbergh, D. (2005) Changes in the numbers of breeding waders on lowland wet grasslands in England and Wales between 1982 and 2002. Bird Study, 52, 55-69.
9
CHAPTER 2 REVIEW OF THE IMPACT OF PREDATORS ON WADER NESTS
M. A. MacDonald and M. R. Bolton
This chapter addresses Objective 1 of the project: to review literature on foraging behaviour and habitat use of avian and mammalian predators of wader nests on lowland wet grassland.
2.1 Summary
The population declines of waders breeding on lowland wet grassland habitat in UK are widely considered to have resulted from habitat loss and degradation due to agricultural changes such as drainage and intensification of grassland management. There is a wealth of evidence that appropriate habitat management is an essential condition to maintain breeding wader numbers. However, recent empirical evidence suggests that levels of predation on nests of wet grassland waders are unsustainably high in many cases and may prevent population recovery, even, on occasion, in situations where breeding habitat is otherwise favourable. There are several possible mechanisms whereby agricultural intensification may lead to increased rates of predation on wader nests:
As wader populations become more dispersed and smaller due to habitat fragmentation and deterioration, adult waders may be less effective at deterring predators by mobbing
Anti-predator vigilance may be compromised in rapidly-growing, taller swards
Nests can become more vulnerable to predation by reducing crypsis in homogeneous swards produced by high fertiliser inputs
High livestock densities associated with grassland intensification can be associated with increased nest predation rates, that may result from increased nest detection by crows as incubating waders are repeated flushed from their nests by stock
Populations of generalist predators may increase
Additionally, numbers of several nest predator species, such as carrion crow and magpie have increased in UK during recent decades, and foxes have increased in density in some parts of UK.
This review examines the published and unpublished literature on levels of nest predation on lowland wet grassland waders. It quantifies the relative importance of the major predator species, collates information on the foraging behaviour of these predators and identifies knowledge gaps that must be filled in order to develop practical models to examine habitat manipulations that may reduce levels of nest predation.
Although there is a considerable literature on the identity of predators inferred from nest and eggshell remains, in almost all such studies there is large proportion of cases where nest remains are inconclusive, which results in large potential biases in the assessment of impacts of individual predator species. We consider that such studies are consequently of little value in assessing the relative impact of different predators. These potential biases are greatly minimised by the use of nests temperature loggers to determine the timing of predation events. The vast majority of studies employing temperature loggers in wader nests (both in UK and elsewhere in Europe) have found that most nest predation occurs at night, indicating
10

mammalian rather than avian predators. More detailed information regarding the specific identity of nest predators has been obtained in a small number of recent studies using remote nest cameras to record images of predation events. The number of such studies is still very small but evidence from both the Netherlands and UK indicate that in most cases foxes accounted for at least 50% of all predation and occasionally more than 90%. It is considered that there is great value in continuing such studies since this represents the most efficient and unbiased method of obtaining quantitative information on predator impacts on nest survival.
Although quantitative, unbiased data on the impacts of individual predators on wader nest survival is still scarce, we focus on fox, badger, stoat and carrion crow, which are likely to include the most important species. All of these predators, with the exception of stoat, are characterised by a broad diet, and none are considered to specialise on wader nests to any extent. Rather, wader eggs form an insignificant proportion of the diet and are taken opportunistically when encountered whilst foraging for other target prey. Foxes feed principally on lagomorphs and small mammals, badgers on earthworms, stoats on lagomorphs and carrion crows take a wide variety of prey including tipulid larvae. The distribution of wader nests coincides extensively with that of the preferred prey species and consequently, these predators will encounter wader nests when searching for their principal prey. Although forming a small proportion of the predators’ diets, opportunistic consumption of wader nests can clearly have severe consequences for wader breeding success.
In order to propose habitat manipulations likely to reduce the impacts of these predators, an improved understanding of their foraging behaviour and population regulation is required. We identify specific knowledge gaps and propose a programme of work to address these issues. In particular, we highlight the current lack of information on predation during the chick stage of breeding, which is likely to be a key driver of wader demographics. The proposed work programme will provide a framework for the development and parameterisation of detailed models of predators’ foraging behaviour to conduct virtual experiments modelling the impact of habitat modifications on wader breeding success. This modelling process would inform future field trials.
2.2 Introduction
The United Kingdom holds internationally important populations of breeding waders. For some of these wader species lowland wet grassland is an important breeding habitat, and both populations and distributions of four of these species (lapwing Vanellus vanellus, snipe Gallinago gallinago, redshank Tringa totanus and curlew Numenius arquata) on lowland wet grassland have declined over recent decades (Wilson et al., 2005). Another rare wader species, the red-listed black-tailed godwit Limosa limosa, is virtually confined to lowland wet grassland in the UK. The declines of these species in lowland wet grassland have been attributed to alterations to habitat associated with agricultural intensification, notably drainage and use of inorganic fertilisers, that have rendered the habitat less suitable (Shrubb, 1990; Wilson, Ausden & Milsom, 2004). There has been an emphasis on the restoration and creation of extensively managed lowland wet grassland. However, while it is undeniable that appropriate habitat management is necessary to maintain or increase populations of waders, increased nest predation has also been suggested as a possible additional cause of wader population declines (Bellebaum, 2002; Chamberlain & Crick, 2003; Milsom, 2005). Predators may cause prey populations to decline to extinction, or to stabilise at lower levels, and they may then be more susceptible to extinction from other causes. However, the identity of the major predators of waders in wet grassland is seldom known (and may vary among wader species, sites and years). Studies of wader nest predation have tended to concentrate on the
11

waders themselves, without incorporating the behaviour and foraging ecology of potential predators. In this review we:
(i) document the extent of wader nest predation in wet grassland
(ii) identify and quantify the key avian and mammalian predators of wader eggs
(iii) provide information on the population densities, territory sizes, foraging behaviour, dietary composition and food requirements of these predators
(iv) identify factors that have been shown to affect rates of wader nest predation in wet grassland
(v) identify knowledge gaps among the preceding points.
The information provided in this review will allow development of model framework to inform decisions regarding potential habitat manipulation to alter predators’ impact on breeding wader populations.
2.3 The habitat
Lowland wet grassland consists of pastures and meadows less than 200 metres above sea level that are periodically flooded or that overlie waterlogged soils (Jefferson & Grice, 1998). Such a definition appears to have been originally used by ornithologists to broadly describe habitat suitable for particular suites of birds, notably breeding waders, and breeding and wintering waterfowl. A study intending to locate and map areas of lowland wet grassland in England defined it as:
managed land periodically inundated by water, predominantly of permanent grassland and fen meadows within a flat area with a network of ditches containing standing water. Such areas may also include some wetter emergent swamp communities, but not extensive areas of emergent hydrophytes (e.g. Typha and Phragmites). Lowland wet grasslands, including grazing marshes, usually occur in lowland river valleys and behind sea defences. Salt marshes are not included (Dargie, 1993).
These grasslands have declined in extent and in quality over the last century, and are therefore of conservation value in their own right. They are included within the UK Biodiversity Action Plan under three priority habitats: coastal and floodplain grazing marsh; lowland meadows; and purple moor grass and rush pastures (Wilson, Ausden & Milsom, 2004). Lowland wet grassland may be managed for grazing and hay cutting, but it is implicit within the definition of lowland wet grassland, from a conservation perspective, that it is unimproved: the processes associated with grassland improvement, such as drainage and the intensive use of fertilisers, are rarely present, if at all. However, insufficient management of lowland wet grassland can also be detrimental, as it tends to lead to invasion by shrubs and trees.
Breeding wader species differ in their habitat requirements in lowland wet grassland, particularly in relation to preferred sward height for foraging and nesting (Ward, 1994; Wilson, Ausden & Milsom, 2004). However, generally speaking, the wader species that are in decline are associated with less intensively managed swards and with high water levels, and strongly prefer to nest in open areas, away from hedgerows, pylons and roads.
12

2.4 Nest predation of waders in wet grassland
Nest predation is considered to be a major factor affecting nest success in birds. Strategies to minimise nest predation include avoidance of landscape features that favour nest predators, nest crypsis, and anti-predator behaviour (which may be aggressive or distracting) (Kis, Liker & Székely, 2000; Valkama, Currie & Korpimäki, 1999). While predation is certainly a potential threat to ground-nesting birds such as waders, there is a need for quantification of the rates of nest predation, and for evidence of its effects on wader populations. There is a growing body of work documenting predation rates on wader nests in a range of habitats, including lowland wet grassland. Because studies of predation have tended to concentrate on individual nests, rather than overall productivity per adult female, effects on wader populations have been largely inferred from concomitant changes in those populations in accordance with predation rates. This has weaknesses, as productivity per pair will also depend on renesting following nest failure (Beintema & Müskens, 1987). In addition, population changes at a site are likely to reflect emigration and immigration as well as productivity, and productivity may well be secondary to migration. Rates of predation on nests of waders breeding in wet grassland or similar habitat are presented in Table 2.1.
Predation of wader nests has been quantified for several species and at several sites in lowland wet grassland, both in the UK and elsewhere in Europe. At two rough/wet grassland sites in Northern Ireland, only 3.6-19.0% of nests were estimated to survive to hatching, and predation was the overwhelming cause of failure (Grant et al., 1999). Productivity (which ranged from 0.14 to 0.56 chicks fledged per pair depending on site and year) was insufficient to maintain the population. Predation caused 60% of snipe nest failures in lowland wet grassland in southern England; in combination with other causes of nest failure, and with chick losses, the majority of breeding attempts failed (Green, 1988). In coastal grazing marsh in Kent, high nest predation rates and low chick survival led to low overall lapwing productivity (Hart et al., 2002). At West Sedgemoor RSPB Reserve, predator control (removal of crows’ Corvus corone nests, trapping of American mink Mustela vison and fox Vulpes vulpes deterrence via fencing) coincided with a decrease in wader nest predation rates (Benstead et al., 1995). A study of predator (crow and fox) control over eight years at various RSPB reserves found that nest survival increased in years of predator control when predator densities in the absence of control were taken in to account; control was more likely to result in increased nest survival at sites where predator density was high in the absence of control (Bolton et al., in press).
Low productivity of redshank in 2000-03 (compared with 1997-99) on Swedish coastal meadows was ascribed to increased predator densities, as there was no apparent change of meadow management (Ottvall, 2005). Predation was the major cause of nest failure for lapwing in German wet grassland over the period 2001-2005, when nest success ranged from 13.3% to 64.2%; combined with chick survival data reproductive success was sufficient to maintain a stable population in only three years out of five (Junker, Düttman & Ehrnsberger, 2006). In German wet grassland, avian predation was not considered to pose a major threat to ground nesting birds, but losses of eggs and chicks to mammals increased from 1990 onwards, and in some populations reached threatening levels (Bellebaum, 2002). Nesting success of waders breeding in Polish grasslands was extremely low due to mammalian (chiefly fox) predation (Chylarecki, Matyjasek & Gmitrzuk, 2006). Predation was the major cause of wader nest failure in Dutch meadows, and the probability of wader clutch predation doubled from the late 1980s to the late 1990s (losses to agricultural activities also increased markedly over the period) (Teunissen, Schekkerman & Willems, 2005).
13
The decline of lapwing in the UK appears to be driven by reduced productivity, as ringing recoveries indicate that first-year and adult survival have increased in recent decades (Peach, Thompson & Coulson, 1994). An examination of lapwing nest records in the UK found that mean lapwing clutch size increased significantly from 1962-1999 (Chamberlain & Crick, 2003). In the 1970s and 1980s clutch failure (from all causes) was highest in grassland (especially unimproved grassland); by the 1990s wet grassland and coastal habitats had the highest clutch failure rates, with daily clutch failure in wet grassland having risen from 0.019 to 0.029 (figures read from graph). Predation was the major cause of nest failure in the 1990s, and constituted over 50% of nest failures in semi-natural habitats (which included wet grassland and other habitats aside from arable and pasture), up from around 30% in the 1960s (Chamberlain & Crick, 2003). Lapwing nest predation rates in lowland English farmland varied between crop types, being highest in grass habitats (Sheldon, 2002), while in Welsh mixed farmland they were highest in rough grassland/set aside (Sharpe, 2006).
Risk analysis of a small black-tailed godwit population breeding on grazed coastal marshes in Sweden concluded that the population would not persist for 40 years without immigration, as only 2-3% of chicks hatched and ringed returned to breed each year (Johansson, 2001). However, as hatching success was quite high (55-60% of nests), and 80% of adults returned, the problem appears to relate to chick survival (which was not estimated) or first-year survival. A population of dunlin Calidris alpina on Swedish coastal wet meadows was also considered unable to reproduce sufficiently to maintain itself beyond 30 years (Jönsson, 1991). Adult survival was high (83%), and in this case fledging success (36%) and first year survival (56%) were estimated from ringed recoveries. As only 0.3-0.4 chicks were hatched per adult bird, and 60% of nests were predated (another 10% failed for other reasons), nest predation was considered the most important cause of the inadequate reproductive rate.
Predation has also been implicated as a major cause of reduced productivity by waders in other graminoid-dominated habitats. In upland grassland, insufficient lapwing young were fledged to maintain the population, largely due to nest predation, although nest destruction and chick predation also contributed (Baines, 1990). In Scottish moorland predator control (of crows and gulls, but not of foxes) led to generally higher hatching success of curlew, lapwing and redshank (but not of golden plover Pluvialis apricaria or oystercatcher Haematopus ostralegus), although there was no increase in overall numbers for any species (Parr, 1993). In Scotland, egg predation accounted for almost 60% of all lapwing egg losses in rough grazing land (Galbraith, 1988). In Scotland, a decline in greenshank Tringa nebularia populations in the 1980s followed a relaxation of predator control; brood predation was thought to be the major cause, although neither this nor nest predation was quantified (Thompson & Thompson, 1991). Redshank nesting in saltmarsh in Germany in 2000-01 suffered high rates of predation, leading to a hatching success rate of only 10.6% (a few nests were lost due to other causes) (Thyen & Exo, 2005). They did not consider overall productivity by pair, but as predation increased with clutch initiation date, re-lays would be even more susceptible.
2.4.1 Weaknesses of measures of nest success
Measures of nest success suffer from two weaknesses as an indicator of overall productivity. The first is that failed pairs frequently lay replacement clutches, depending on the stage of the season at which failure occurs (Klomp & Speek, 1971). Waders are considered not to re-lay following successful fledging of chicks: this has been observed in lapwing in the UK (Parish, Thompson & Coulson, 1997), but is so extraordinary that it may be discounted for the purposes of determining productivity. This weakness can be overcome by following adults through an entire season. Lapwing in central Swedish farmland hatched only 13% of first
14

clutches, but 66% of failures laid second clutches, and 67% of these hatched, so that 55% of females hatched a clutch (predation was not the major cause of nest failure) (Berg, Lindberg & Kallebrink, 1992). Black-tailed godwit on Danish coastal meadows were especially susceptible to gull predation during the laying stage, with only 36% of initiated clutches being completed in the period 1956-59 (Lind, 1961). However, due to replacement clutches, 75% of pairs hatched chicks. Use of a renesting model in Dutch wet grassland found that although predation accounted for roughly half of wader nests, renesting meant that in fact hatching success per pair should be quite high (values depended on management) (Beintema & Müskens, 1987). However, some factors were not accounted for by the model, such as soil moisture, which is likely to affect renesting, and they also noted that one site became practically deserted by waders (mostly lapwings) by halfway through the breeding season, by which time the predation rate was extremely high.
The second weakness is that chick survival, rather than egg survival, may more strongly determine overall productivity of many wader populations (Hudson, Tucker & Fuller, 1994; Teunissen & Schekkerman, 2006; Teunissen, Schekkerman & Willems, 2005). In Dutch meadows and grassland, predation of lapwing and black-tailed godwit chicks was the most important influence on overall productivity at most sites (Teunissen, Schekkerman & Willems, 2005). Chick survival is much more difficult to determine, because waders are nidifugous, and in many species chicks are moved considerable distances from the nest. By using radio-tags attached to adults, mean chick survival of redshank on Swedish coastal marshes was calculated as 0.18 for the years 2000-03 (ranging from 0.06 to 0.27) (Ottvall, 2005). Hatching per breeding pair varied between 0.4 and 1.0, but by considering chick survival, fledging ranged from 0.05 to 0.23 fledged chicks per breeding pair. Overall productivity of avocets in the Wadden Sea coast of Germany was not related to hatching success, but was positively related to chick survival (and to mean June temperature) (Hötker & Segebade, 2000). Chick predation may be more efficient than nest predation for predators: the energy gain of searching for capercaillie broods was calculated as 80 times that of searching for nests, based on detection distances (using hunting dogs), and the fact that chicks were more concentrated in terms of habitat than nests were (Storaas, Kastdalen & Wegge, 1999).
15
Table 2.1 Predation rates of waders in wet grassland and similar habitats.
Species Location Habitata Year(s) Periodb NestsExposure Days DPRc
% Predation survivald
Product-ivitye Reference
black-tailed godwit
Netherlands wet gl 1974-83 l 0.059 Beintema and Müskens, 1987
black-tailed godwit
Netherlands wet gl 1974-83 i 0.011 56.6 Beintema and Müskens, 1987
curlew Sweden meadow 1987-89 14 0.026 39.8 Berg, 1992f
curlew Sweden ley 1987-89 21 0.025 41.2 Berg, 1992f
curlew Sweden gl (various) 1987-89 46 815 0.027 38.4 Berg, 1992f
curlew Sweden mf 1986-87 35 709 0.0113 67.2 Berg, 1996f
curlew Finland mf (forested landscape)
1995-97 t (30) 53 659 0.052 15.4 Valkama et al., 1999
curlew Finland mf (less forested landscape
1995-97 t (30) 63 1232 0.003 90.0 Valkama et al., 1999
curlew N. Ireland rough/wet gl, ml 1993-95 l (4.5) 62-66 163-186 0.104-0.257 Grant et al., 1999curlew N. Ireland rough/wet gl, ml 1993-95 i (28.5) 106-125 1442.5-
1572.50.024-0.078 2.0-27.9 0.14-0.56 Grant et al., 1999
curlew Wales upland gl 1985-86 & 1996
t (35) 49 535 (0.064) (9.9) Bain, 1987; O'Brien, 2001
lapwing S England gl (various) 1999-00 t (32) 17 (0.0449) (24.1) Sheldon, 2002lapwing Wales mf 2003-04 t (30) 286 0.027 42.8 Sharpe, 2006lapwing Czech Rep. meadow 1988-98 19-108 0.0142-0.1688 0.3-68.8 Šálek and Šmilauer, 2002g
lapwing Sweden mf (< 50 from forest edge)
1986-87 161 2524 0.0065 81.7 Berg, 1996f
lapwing Germany gl (Havel valley) 1997-02 i (27.5) 34-67 (0.044-0.054) (17.9-24.8) 0.19-0.58 Bellebaum and Bock, unpub. datah
lapwing Germany gl (Oder valley) 1998-00 i (27.5) 22-38 (0.047-0.064) (12.9-22.5) 0.08-0.37 Bellebaum and Bock, unpub. datah
lapwing Germany wet gl (Oder valley)
1998-00, 2006
i (27.5) 16-70 (0.015-0.098) (4.1-62.6) 0.12-0.70 Bellebaum and Bock, unpub. datah
lapwing Germany wet gl 1999-00 t (30) 11-17 0.0465-0.0807 8-24 0.1-0.2 Köster and Bruns, 2003lapwing Germany improved gl 1999-02 t (30) 28-51 0.0095-0.0465 24-75 0.1-0.9 Köster and Bruns, 2003lapwing Denmark coastal meadow 1998-00 t (32) 210 0.111 2.6 Olsen, 2002lapwing Scotland hill gl 1984-86 154 2342 0.038 30.1 Galbraith, 1988lapwing Kent coastal wet gl
(grazed)1995-97 t (31) 36 (0.0311) (37.6) Hart et al., 2002
16
Species Location Habitata Year(s) Periodb NestsExposure Days DPRc
% Predation survivald
Product-ivitye Reference
lapwing Kent coastal wet gl (ungrazed)
1995-97 t (31) 50 (0.0145) (63.6) Hart et al., 2002
lapwing N England unimproved gl 1985-87 431-444 (38.1) 0.88 Baines, 1988, 1989, 1990i
lapwing N Yorkshire wet meadow 1996-98 t (32) 246 4036 (0.02) (53.5) Seymour et al., 2003lapwing Wales upland gl 1985-86 &
1996t (31) 197 2084 (0.049) (21.1) 0.7j Bain, 1987; O'Brien, 2001
lapwing Netherlands wet gl 1974-83 l 0.072 Beintema and Müskens, 1987lapwing Netherlands wet gl 1974-83 i 0.013 49.0 Beintema and Müskens, 1987redshank Germany saltmarsh 2000-01 t (24) 83 796 0.074 12.1 Thyen and Exo, 2005redshank Sweden coastal meadow 1999-00 t (27.5) 417 4698.5 0.0266-0.0604 18.0-47.6 Ottvall et al., 2005k
redshank Sweden coastal meadow 1997-03 t (27.5) 1038 8706 0.017-0.099 5.7-62.4 0.05-0.23l Ottvall, 2005k
redshank Netherlands wet gl 1974-83 t 0.045 28.2 Beintema and Müskens, 1987redshank E England saltmarsh 2003-05 t (27.5) 102 0.030* 43.3 < 0.01 Smart, 2005redshank E England coastal gl 2003-05 t (27.5) 57 0.064 16.2 < 0.01 Smart, 2005redshank E England wet gl 2001-05 t (27.5) 225 0.025 49.8 0.47 Smart, 2005snipe Netherlands wet gl 1974-83 l 0.000 Beintema and Müskens, 1987snipe Netherlands wet gl 1974-83 i 0.014 75.4 Beintema and Müskens, 1987a all studies included some grassland or similar habitat (eg saltmarsh), but many studies also include other habitat types, notably arable. gl = grassland, mf = mixed farmland, ml = moorland.b l = laying, i = incubation, t = total. Days used for each study are listed, but not used for this table (see note d).c DPR = daily predation rate. Figures in brackets are total failure rates, where predation was the major cause of failure. Some figures are estimated by reading values from published graphs or back-calculating from % survival.d Predation survival over entire laying and incubation period. To allow for comparison between studies, this has been calculated using standardised laying and incubation periods, as follows: black-tailed godwit, l = 5, i = 24; curlew, l = 5, i = 30; lapwing, l = 5, i = 26; redshank, t = 27.5; snipe, l = 4, i = 20. Figures in brackets refer to hatching success from total failure rates, where predation was the major cause of failure. Where a single study has given rates for laying and incubation, these have been used to give a single % survival figure (given in the incubation row). e overall productivity (per pair). Where given by the studies this refers to failure from all causes, and includes chick survival.f these studies overlap in time at the same study area, and presumably use some of the same nests in analysesg highest predation rate was twice that of the next highest; in 6 of 8 years hatching success exceeded 23%h productivity not estimated for year with highest hatching successi calculated per egg rather than per nestj productivity only calculated for 1996k these studies overlap in time at the same study area, and presumably use some of the same nests in analysesm productivity only calculated for 2000-2003
17
2.5 Predators of wader nests
Nest predator-prey relationships are ecologically interesting, because while nest predation is frequently the most common source of nest failure, eggs and chicks are generally relatively unimportant in the predators’ diet, and thus nest predation may be incidental during other foraging behaviour (Roos, 2004; Vickery, Hunter & Wells, 1992). This also has ramifications for the effects on prey populations, as predators at high density that are not regulated by the abundance of nests may apply continuous predation pressure even as prey populations decline (Woods, McDonald & Harris, 2003). Populations of species that are uncommon, or that are declining for other reasons, may be affected by very low levels of predation. For example, predation of adult mallards by foxes in Minnesota was of little importance to the fox diet, but over 11 years it was estimated that they consumed 18.1% of females (and only 5.1% of drakes), skewing the sex ratio and most likely affecting productivity and population size (Sargeant, 1978).
Identifying nest predators, and quantifying their relative importance, is not straightforward, as it is infrequently observed. Studies of nest predation rarely observe the actual event. Human observations are likely to be biased towards diurnal predators, which tend to be avian. Nocturnal predation can be difficult to ascribe to a particular source, and may simply be classified as mammalian. Intensive observations, particularly using nest cameras can overcome this problem. Otherwise, predators may be identified by various, often indirect means, including examination of nest remains (Green, Hawell & Johnson, 1987), timing of predation events, dietary examination of predators, and identification of targets of aggressive behaviour. In some studies species are named as predators of nests without any description of the means by which they were identified. Evidence for the identities of nest predators and the means of identifying them are presented in Table 2.2. Only methods and studies where identity of predators is quantified are included; predators identified by other means are mentioned in the text.
2.5.1 Nest cameras
Use of nest cameras is the most reliable means of determining nest predators. In German grassland use of nest cameras found that the major predators of lapwing nests were carnivorous mammals (figures not available) (Junker, Düttman & Ehrnsberger, 2006). A similar German study recorded predation by foxes in 9 cases and once by polecat (Bluhdorn, 2002, cited in Bellebaum, 2002). In Dutch meadows and grassland, 145 nest predations were recorded on camera (Teunissen, Schekkerman & Willems, 2005). Foxes were the main predators (80 of 115 predations in which the predator was identified), but at one site stoats Mustela erminea took the most eggs, and at another site no single predator predominated. Other nocturnal predators identified were beech marten Martes martes, polecat Putorius putorius and hedgehog Erinaceous europaeus; diurnal predators identified were stoat, dog Canis familiaris, carrion crow, marsh harrier Circus aeruginosus, goshawk Accipiter gentilis and oystercatcher. RSPB nest cameras monitoring lapwing nests at several wet grassland sites in the period 2003-06 documented 33 nest predation events: foxes accounted for 22 of these, badgers Meles meles 5, crows 2, sheep Ovis aries 2, and magpies Pica pica 1. The predator was not identified in one case.
2.5.2 Temperature loggers
Temperature loggers have also been used to identify nest predators, or at least to distinguish between avian predators (which are diurnal) and mammalian predators (which are mainly
18

nocturnal). In wet grassland sites in the UK, use of temperature loggers found that 88% of 54 lapwing nest predation events occurred at night (Bolton et al., in press). In wet grassland in Germany, 65% of unsuccessful nests were taken at night (Bellebaum & Bock, unpub. data). Use of temperature loggers also indicated that nocturnal predation of one nest usually caused disturbance of neighbouring nests, and that on flooded meadows, frequency of nocturnal disturbance tended to increase in the week prior to predation. In Dutch meadows and grassland, temperature loggers showed that nocturnal predation of meadow bird nests was most important where predation rates were high (>50%), and where they were lower, nocturnal and diurnal predation contributed equally (Teunissen, Schekkerman & Willems, 2005). In eastern England (saltmarsh, coastal grassland and inland wet grassland sites), the use of temperature loggers on redshank nests found that seven out of eleven predation events were nocturnal (Smart, 2005). Predated nests had significantly more long (> 1 hour) nocturnal periods without incubation, and that such periods were longer than those at non-predated nests This method was used to establish that nocturnal predation was the major cause of lapwing predation on a Danish coastal meadow, where hooded crows were abundant and were originally considered to be the major cause of nest predation (Olsen, 2002). In these two latter studies, evidence from nest remains suggested that around 50% of diurnal predation was also mammalian. In Germany, examination of nest remains together with the use of temperature loggers revealed that foxes predated 16 curlew nests, but only 7 of these at night (Boschert, 2005). Temperature loggers have also been used to identify hedgehogs as the major predator of wader nests in machair on Uist, where hedgehogs had an effect on wader productivity (Jackson & Green, 2000).
19
Table 2.2 Wader nest predators, means of identification, and relative importance.
Means of identification
Location Habitat Wader Predation1 Reference
Nest cameras (n = 130) Netherlands meadows and grassland black-tailed godwitlapwing
80 fox, 20 stoat, 4 crow, 3 beech marten, 2 hedgehog, 2 marsh harrier, 1 polecat, 1 goshawk, 1 oystercatcher, 16 unknown
Teunissen et al., 2005
nest cameras (n=33)
UK wet grassland lapwing 22 fox, 5 badger, 2 crow, 2 sheep, 1 magpie, 1 unknown
RSPB nest camera data, Sharpe, 2006
temperature loggers and cameras (n=366)
Netherlands (several sites)
meadows and grassland black-tailed godwitlapwing
249 nocturnal, 117 diurnal Teunissen et al., 20052
temperature loggers (n=11) E England wet grassland, saltmarsh redshank 7 nocturnal, 4 diurnal Smart, 2005temperature loggers (n=101) Denmark coastal meadow (restored) lapwing 73 nocturnal, 6 twilight,
12 diurnal, 9 unknownOlsen, 2003
temperature loggers (n=75) Germany wet grassland lapwing 56 nocturnal, 19 unknown Bellebaum and Boschert, 2003temperature loggers (n=36) Germany wet grassland curlew 16 nocturnal, 16 fox, 2 marten, 2
unknownBellebaum and Boschert, 20033
temperature loggers (n=54) Britain (seven sites)
wet grassland lapwing 47 nocturnal, 7 diurnal Bolton et al., in press
temperature loggers and nest remains (n = 38)
Germany (four sites)
wet grassland curlew 16 fox, 2 polecat, 18 other mammal, 2 unknown (21 of 35 nocturnal)
Boschert, 2005
timing of predation (observ-ations) (n=162)
N England Unimproved grassland lapwing 0 nocturnal, 162 diurnal Baines 1990
nest remains (n=282) E England wet grassland, saltmarsh redshank 74 mammalian, 12 avian, 69 unknown Smart, 2005nest remains (n=38) Finland mixed farmland curlew 10 mammalian, 2 avian, 26 unknown Valkama et al., 1999
nest remains (n=161) UK wet grassland snipe, redshank, lapwing
59 mammalian (25 mustelid), 26 avian, 76 unknown
Green et al., 1987
nest remains (n=219) Germany wet grassland lapwing 50 mammalian, 11 avian, 158 unknown Bellebaum and Boschert, 2003nest remains (n=25) Germany wet grassland curlew 8 fox, 2 other mammal, 15 unknown Bellebaum and Boschert, 20031. Figures are read off graph or inferred from text in some cases, and so may only be approximate values2. Camera data is same as that presented in top row of table, but thermologger data are not presented separately 3. Presumably nest remains were also used to give more precise identification of some predators
20

2.5.3 Nest remains
Nest remains can be a useful means of identifying nest predators, although caution should be used in using them to quantify the effects of predators, since no identifying remains are left at a large proportion of predated nests. Nest remains have been used to identify nest predators in wet grassland in Germany (Bellebaum & Boschert, 2003), in Finland (Valkama, Currie & Korpimäki, 1999), and in the UK (Green, Hawell & Johnson, 1987). Eggs predated by birds and by mammals have different characteristics: the former have little shell crushing, may have bill marks, and have small fragments at the edge of openings; the latter typically have crushing of shell edges, and may have toothmarks (Bellebaum & Boschert, 2003; Green, Hawell & Johnson, 1987). In some cases the distances between toothmarks can be measured, and compared to those of specimen skulls. Such methods have shown that mustelids are important ground nest predators in German wet grassland; their importance was greater in regularly flooded areas, where they tended to replace foxes (Bellebaum, 2002). Mustelids were also identified as predators of wader eggs in English wet grassland (and similar habitats) by this method: at one site (Nene Washes), toothmark spacings were within the range for stoats (n = 7, from 5 clutches), while at another (Elmley Marshes) they were within the range of both stoats and ferrets Mustela furo, and mink, which were not seen on site (n=22, from 20 clutches) (Green, Hawell & Johnson, 1987). Of 161 predated nests, evidence was found for mammalian predation of 59 nests, and for avian predation of 26 nests (corvids and black-headed gulls Larus ridibundus were considered responsible). It was noted that it was less likely to find remains adjacent to lapwing nests than those of other waders, possibly due to predators removing eggs from the vicinity in the face of aggressive lapwing behaviour. Remains at predated nests of snipe in lowland wet grassland have also indicated that foxes were responsible (Green, 1988). Eggshells remains indicating fox predation were found near redshank nests in Swedish coastal meadows, although this was not quantified (Ottvall, 2005).
2.5.4 Observation
Anecdotal observation can identify those species which are predators of wader nests but is likely to be biased towards diurnal predators. Corvids, notably the carrion and hooded crows, are considered to be substantial predators of birds’ nests generally, including waterfowl (Opermanis, Mednis & Bauga, 2005), grebes (Salonen & Penttinen, 1988), shrikes in farmland/forest (Roos, 2002), and golden plover in moorland (Parr, 1993). In the last study, gulls and foxes also predated nests; following control of crows and gulls, foxes increased in importance as nest predators. Gulls and carrion crows were also the only observed predators of lapwing nests in an upland grassland site in northern England; no nocturnal predation was noted (Baines, 1990). Elsewhere, jackdaws Corvus monedula have been observed taking lapwing eggs (Spencer, 1953), while a single territorial raven was observed taking eight clutches in a single year at a dry polder site in Germany (Bellebaum & Bock, unpub. data). Corvid predation of nests may also be inferred from the presence of egg dumps near their nests (Olsen & Schmidt, 2004b). In Swedish coastal meadows, hooded crow egg dumps containing redshank eggs were found near meadows in which nests were predated (Ottvall, 2005). Hooded crow were observed taking eggs or chicks, as were (occasionally) raven Corvus corax, jackdaw, common gull, and herring gull Larus argentatus. In the Tipperne Nature Reserve of Denmark, breeding common gulls Larus canus are described as having been the most important predator of meadow bird (including waterfowl and waders) eggs and chicks in the early twentieth century, based on observations by researchers (Thorup, 1998). Crows might become problem predators in certain circumstances, as they can quickly form a search image for eggs, at least in artificial nests (Croze, 1970; Frugis et al., 1983).
21
2.5.5 Reaction of waders to potential predators
The reaction of lapwings to other species can indicate whether these species are considered to be threats. Corvids approaching nests elicit aggressive responses from lapwings, including dive bombing and physical contact (Elliot, 1982). More than 90% of 108 observed attacks on potential predators of lapwing nests in Swedish farmland were on corvids (Berg, Lindberg & Kallebrink, 1992). At the Ouse Washes in southern England, attacks by incubating black-tailed godwit and lapwing were directed at carrion crows and grey herons Ardea cinerea that approached nests (Green, Hirons & Kirby, 1990). At a meadow site in Hungary, the majority of lapwing attacks were against magpies where these nested close by, while further from the magpie nests, marsh harriers were the major target of attacks (Sasvári & Hegyi, 2000). The proximity of the magpie nests affected the daily time budget of nesting lapwings, but in fact lapwings nesting near magpie nests did not suffer higher nest predation rates (measured as percentage of nests predated) than those nesting further away. Elsewhere, on alkaline grassland in Hungary, attacks were mostly directed towards harriers and corvids (Kis, Liker & Székely, 2000). Raptors are more likely to be chick rather than egg predators, and ospreys Pandion pandion have been observed taking lapwing chicks, as have grey herons (Spencer, 1953).
Spatial distribution of nests on the ground has also been used to infer fox predation; abundance of ground nesting birds, notably skylark Alauda arvensis was lower at points closer to fox dens than at random points in farmland (Tryjanowski, Goldyn & Surmacki, 2002). Foxes are certainly perceived as a threat by waders; lapwing on wet meadows in North Yorkshire were stimulated into alarm calls by the presence of foxes (Seymour, 1999). More aggressive attacks on foxes have been observed (Hodson, 1962), but they are uncommon. Similarly, black-tailed godwit in Denmark vigorously attacked common gull, but only hovered above mammals, although up to 16 birds gathered to do so (Lind, 1961).
2.5.6 Dietary examination
Evidence of egg predation by examination of diet is difficult to obtain, as the remains do not last well. It has been stated that egg shells are generally dissolved in fox stomachs within four hours (Lever, 1959), although remains have been identified in scats (Baker et al., 2006), and another source has stated that eggshells are not usually dissolved by stomach acids (Neal & Cheeseman, 1996). In fact, the lack of egg remains in guts and faeces may reflect their true unimportance in the diet. As a result, most studies of diet based on gut contents do not aim to establish the importance of eggs in the diet. A review of the importance of birds (by weight) in the diet of various predators in the British Isles did not distinguish eggs as a separate category (Cotgreave, 1995). The presence and abundance of eggs in potential predators’ diets, and other important dietary items, are presented in Table 2.3.
There are possible biases in dietary assessment depending on whether stomachs or faeces are examined. These can arise both from differential passage from stomach to faeces, and because stomach contents may come from a biased sample of the population. For example, stomach contents of foxes that are shot are usually of young, inexperienced foxes, and are therefore more likely to include non-preferred food items (Cavallini & Volpi, 1995). A further problem with examination of gut contents is that large numbers of individuals need to be obtained, and these are therefore likely to come from a wide range of habitats, so they are limited in terms of identifying prey items that are important at smaller scales. However, egg shells have been found in gut contents of predators, even if rarely. Bird eggs were found to comprise an
22
insignificant part of the diet of foxes in a range of habitats (pastoral, arable, marginal upland and upland) in Britain (Baker & Harris, 2003).
Examination of gut contents of weasels Mustela nivalis and stoats from game estates in the Great Britain found birds’ eggs in 5.2% of stoat guts and 0.9% of weasel guts (McDonald, Webbon & Harris, 2000). Eggs were most frequent in summer (June-August), but were present throughout the year, and so they may have been cached, or may have been poultry eggs. Eggs were present in the guts of both stoats (10%) and weasels (4%) in the summer months in West Sussex farmland (Tapper, 1976). Another study in the same area outside of the summer months found similar occurrences of eggs in stoats’ diet only (Potts & Vickerman, 1974, cited in Tapper, 1976). Birds’ eggs were barely present in a 1960s study that was re-examined (eggs found in 0.8% of stoat guts and in no weasel guts) (Day, 1968; McDonald, Webbon & Harris, 2000). Eggs were found in 1.9% of 687 weasels stomachs examined in Sussex farmland (Tapper, 1979). Other mustelids cited as predators of wader nests include mink and polecat in Denmark (Iversen, 1986, cited in Hudson, Tucker & Fuller, 1994), and badgers; the importance in the badger diet is low, and the impact on bird populations is unknown (Hounsome & Delahay, 2005). It has been suggested that in some years badgers target birds’ nests, possibly due to the unavailability of earthworms in dry weather (Brickle et al., 2000), and partridge eggs were occasionally found in the faeces of badgers in the South Downs (a mixture of chalk grassland and arable land) (Shepherdson, Roper & Lüps, 1990). Egg shells were found in only one of 2004 mink guts examined throughout England and Wales, although birds occurred in over 30% of guts (Day & Linn, 1972).
An examination of the gizzards of corvids in farmland in England and Wales found that birds’ eggs were infrequent (Lockie, 1956), despite corvids being frequently cited as egg predators. Similarly, egg shells were found in only 1 of 56 nestling crow gizzards examined in a study in north-east Scotland (Yom-Tov, 1975).
23
Table 2.3 Importance of eggs in diet of potential nest predators, and other important items in diet.
Species Location Habitat Period Season Method Quantification1 Eggs (%)2
Major food items (%)3 Reference
red fox Britain various 1939-40 year-round guts (n=40), scats (n=18)
% occurrence nm rabbit 55, plant matter 26, sheep 19, insects 16, small birds 16, poultry 10
Southern and Watson, 1941
red fox lowland Britain
not specified 1955-58 year-round guts (n=277), scats (n=95)
% occurrence 0.8 (hen)
birds 63, small rodents 59, insects 27, lagomorphs 25
Lever, 1959
red fox South Devon
mixed pasture and woodland
1974-75 year-round scats and feeding remains (n=250)
% occurrence 1 Grass 66, Carabidae 50, other plants 35, lagomorphs 24, Diptera larvae 23, field voles 18, unknown Coleoptera 17, Annelida 14, fruit 11 brown rat 10
Richards, 1977
red fox Wiltshire organic farm 1995-96 spring scats (n=200) % occurrence 2 rabbits 68, birds 29; field voles 13, insects 10
Baker et al., 2006
red fox Wiltshire organic farm 1995-96 spring scats (n=200) % of diet <0.5 rabbits 73 Baker et al., 2006red fox Scotland moorland 1992-96 April-Sept. scats (n=82) % occurrence 2 rodents 66, lagomorphs 30, gamebirds
28, ungulate carrion 11, insectivores 11Leckie et al., 1998
red fox Poland forest and agric-ultural land
1969-72 year-round scats (c. 1000) % of diet nm small rodents 65 (M. arvalis 93% of this), hares 26
Goszczynski, 1974
badger Essex mostly arable 1984-86 spring scats (n=184) % of diet 1.4 earthworms 33, beetles 19, noctuid larvae 13, mammals 11, birds 10
Skinner and Skinner, 1988
badger Essex mostly arable 1984-86 summer scats (n=68) % of diet 0 wheat 62, beetles 14 Skinner and Skinner, 1988
badger Sussex farmland (65% arable)
1983-86 March-Aprilscats % occurrence nm earthworms 93, grass 58, wheat 20, insects 44, fruit 14
Shepherdson et al., 1990
badger Sussex farmland (65% arable)
1983-86 March-Aprilscats % of diet nm earthworms 57, grass 23 Shepherdson et al., 1990
badger Sussex farmland (65% arable)
1983-86 May-June scats % occurrence nm earthworms 57, wheat 57, insects 54,grass 36, fruit 14
Shepherdson et al., 1990
badger Sussex farmland (65% arable)
1983-86 May-June scats % of diet nm wheat 46, insects 21, earthworms 15grass 14
Shepherdson et al., 1990
badger Great Britain
April scats (n=3846) % occurrence nm earthworms 66, insects 46, cereals 19, birds 13
Bradbury, 1974, in Neal and Cheeseman, 1996
24
Species Location Habitat Period Season Method Quantification1 Eggs (%)2
Major food items (%)3 Reference
stoat Great Britain
game estates 1995-97 year-round guts (n=458) % occurrence 5 lagomorphs 65, small rodents 16 McDonald et al., 2000
stoat West Sussex
farmland (mostly arable)
1971-74 May-July guts (n=46) % occurrence 10 lagomorphs 56, passeriformes 19 Tapper, 1976
weasel West Sussex
farmland (mostly arable)
1971-74 May-July guts (n=151) % occurrence 4 Microtus 38, passeriformes 22, unidentified rodent 11
Tapper, 1976
weasel Great Britain
game estates 1995-97 year-round guts (789) % occurrence 1 small rodents 68, lagomorphs 25 McDonald et al., 2000
carrion crow (nestlings)
Oxford 1952-53 breeding collars % of diet nm earthworms 38-44, Coleoptera, Diptera, Arachnida 15-17
Lockie, 1955
carrion crow Oxfordshire farmland and woodland
1951-53 March-Aprilgizzards (n=12)% occurrence nm earthworms 83, Coleoptera 58 (min), gastropods 42, carrion 33, other insects 33
Lockie, 1956
carrion crow lowland England and Wales
farmland March-June gizzards (n=93)% occurrence 4 (poultry)
grain 63, other insects 45, Coleoptera imagines 28, earthworms 26, small mammals 20, carrion 11
Holyoak, 1968
carrion crow (nestlings)
Scotland farmland 197x breeding gizzards (n=56)% occurrence 2 Coleoptera, small mammals, Tipulidae and grain most common
Yom-Tov, 1975
1. % occurrence is what proportion of guts/faeces contain an item; % of diet is a measure of the item as volume of diet2. Eggs as proportion of diet or % frequency (nm = not mentioned)3. Other items in diet (only those >10% shown)
25
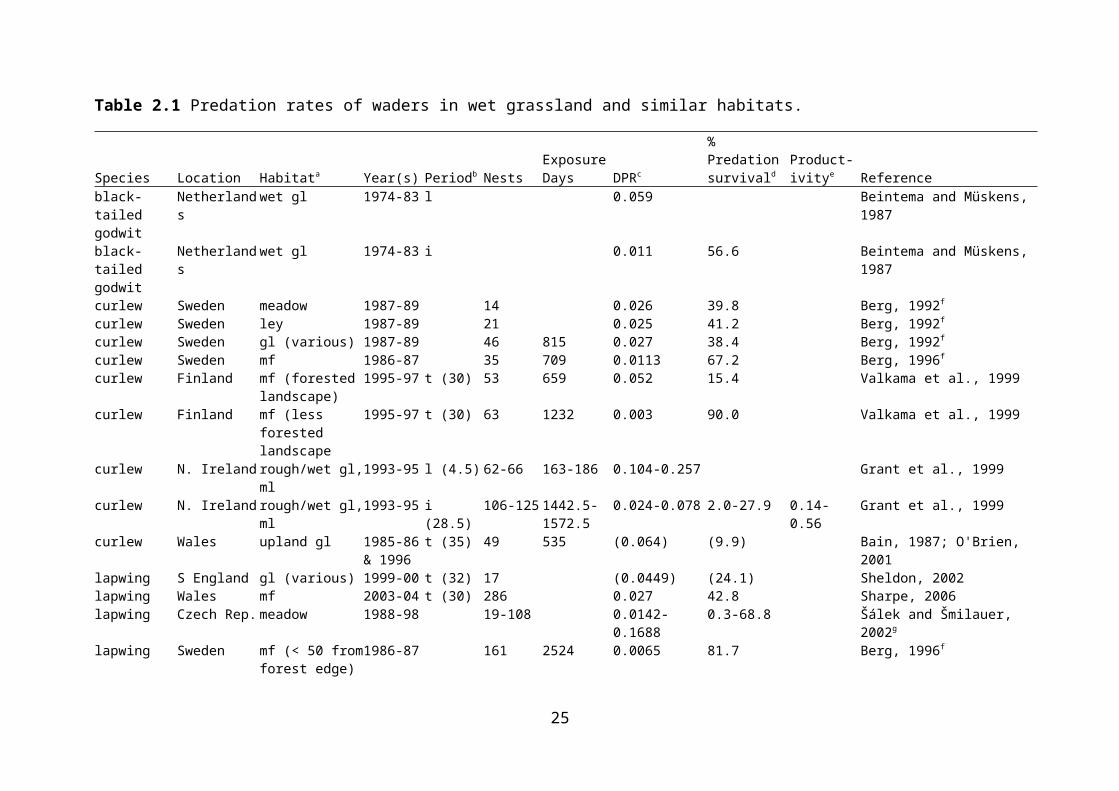
2.5.7 Breeding productivity in relation to predator abundance
The effects of predator removal or reintroduction on prey populations can indicate the importance of predation, but very few experiments have been conducted. Control of red fox and corvids was shown to improve the productivity, and the population size in the following spring, of grey partridge Perdix perdix in southern England (Tapper, Potts & Brockless, 1996), although evidence from this study is limited as an increase in population size was convincingly shown only for one of the two areas (Côté & Sutherland, 1997). In Scandinavia, an epizootic in red foxes led to a decline in the fox population in the 1980s (Lindström et al., 1994). As the fox population recovered, grouse populations fell, suggesting that red fox predation limits grouse numbers. However, the effects on prey populations may vary. A review of the effectiveness of removing predators of birds found that there was generally a large positive effect on hatching success of the target species, and of post-breeding densities, but not of breeding population sizes (Côté & Sutherland, 1997). The effects of predator abundance on nest predation of waders have been addressed in some studies (Bolton et al., in press; O'Brien, 2001), and this is discussed further below. However, given the range of potential predators, and the impracticality of designing an experiment to control each in turn, predator removal is unlikely to be a good way of identifying nest predators.
2.5.8 Artificial nests
One method that has been widely used for identifying and quantifying nest predators is the use of artificial nests. These have the advantage that the researcher can control the number and distribution of nests, allowing for more powerful statistical analyses. However, we consider that there are serious problems in applying the results of artificial nest studies to real nests. A review of artificial bird nest studies concluded that where predation rates on real and artificial nests were compared (which was infrequent), the results differed in unpredictable and inconsistent directions, primarily because the nest types attract different predators (Moore & Robinson, 2004). This has been borne out by several studies of artificial nest predation of wader nests. Artificial nests typically suffer much higher rates of predation than natural nests, and the predators are generally avian, even where the major predators of natural nests are mammalian (Berg, 1996; Ottvall, 2005; Valkama, Currie & Korpimäki, 1999). Therefore we do not use studies of artificial nests to infer patterns of real nest predation.
2.5.9 Conclusion
There is an wide range of potential predators of wader nests in wet grassland, some of which may not be immediately obvious, such as sheep (Pennington, 1992). Even voles have been known to predate eggs of ground nesting birds, albeit smaller ones, such as meadow pipit Anthus pratensis and skylark (Bureš, 1997). Predators of nests may vary greatly between sites, even where habitat and management appear to be the same (Grant et al., 1999). However, while the range of predators is great, we consider that the evidence presented above suggests that the predators that are likely to contribute significantly to nest predation at a large number of lowland wet grassland sites are red fox, mustelids and corvids, and we concentrate on these species.
2.6 Behaviour and ecology of key predators of wader nests
Predation risk results in part from the foraging patterns of the principal predators (Willson et al., 2001). Uncommon prey are more likely to be predated by generalist predators than by specialists, and most of the predators listed above are generalists. Thus there may be no
26
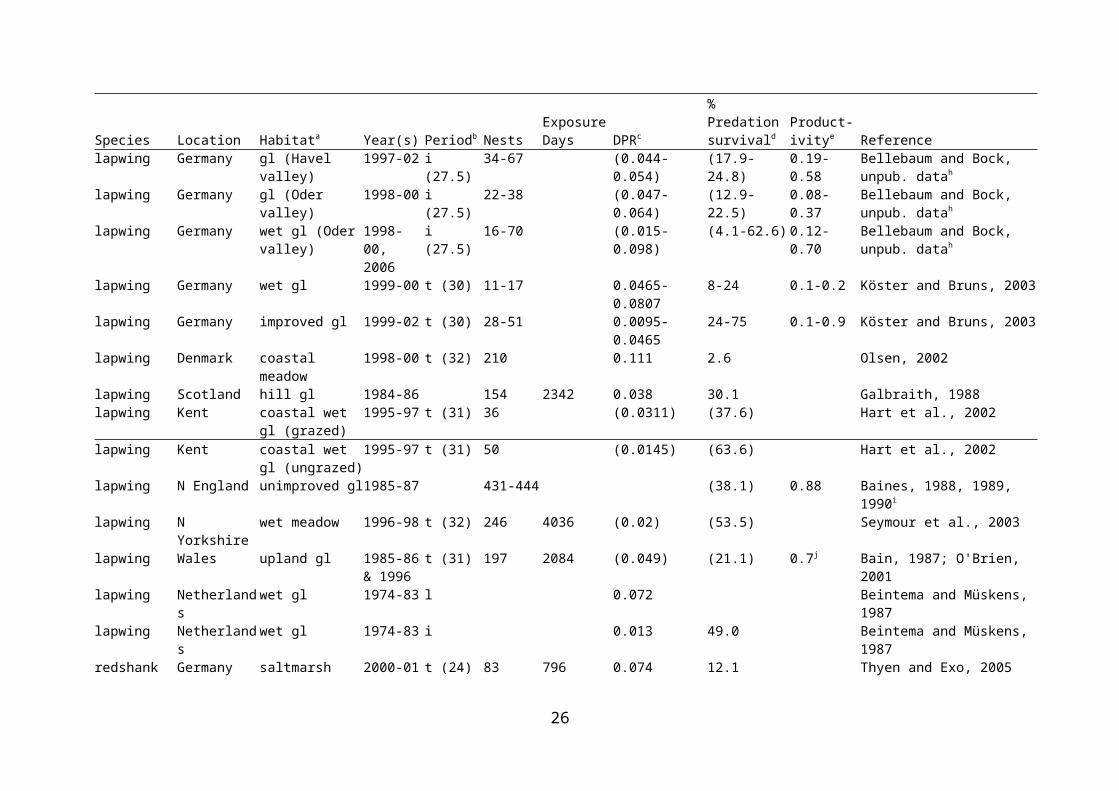
response from predators to changes in nest density. However, they may respond to other factors, such as abundance of targeted prey, or habitat quality, that may affect the rates of incidental nest predation. If targeted prey species respond to environmental factors in similar ways to nesting waders (even if these operate through different pathways), then predator numbers may increase coincidentally with nest density. Estimated densities and home range sizes of the species considered most likely to be major predators of wader nests in wet grassland are summarised in Table 2.4, energy and food requirements are summarised in Table 2.5, and some information on foraging behaviour is presented in Table 2.6.
The energetic value of the eggs of some wader species has been estimated (Jackson & Green, 2000). Assuming a clutch size of four eggs, the energetic value of snipe, redshank and lapwing clutches are 544 kJ, 704 kJ and 836 kJ respectively. These could provide a substantial proportion of the daily energetic requirements of potential predators (see species descriptions below and Table 2.5), but even at high densities, wader nests are unlikely to provide sufficient food over a sustained period. On machair in Uist, it was estimated that wader eggs provided only 07-5.5% of the energy requirements of hedgehogs, even during the season when most eggs were taken (Jackson & Green, 2000).
2.6.1 Red fox
The red fox is a versatile generalist predator. In Britain, historical evidence suggests that it expanded its range and became more numerous from about 1750-1850, and then again from 1950-1965 (Lloyd, 1980a). In Scotland, the latter expansion is thought to have been due to a brief superabundance of food following the introduction of myxomatosis to rabbits, while in East Anglia it is thought to have been due to a reduction in predator control. Foxes are considered to be territorial, following initial dispersal, with a home range being occupied by one male, one or more females, and several cubs (Lloyd, 1980b). The proportion of non-productive vixens in England and Wales averages approximately 20%. Territoriality is considered to be the occupation of a defended and/or exclusive area, whereas overlap in fox home ranges does occur, and fox home ranges show variable stability, with seasonal changes in size, shifts in activity centre, and sudden enlargements of range all being reported (Cavallini, 1996). Borders between home ranges appear to be more rigid near dens, and during spring and summer. The red fox has evolved in the presence of larger predators, and its ecology may reflect this. The ability to alter the home range (in size, location and degree of overlap) may combine with a broad diet to allow foxes to co-habit with larger predators.
The mean weight of foxes in southern England and Wales was 6.4 kg for males and 5.5 kg for females (Lloyd, 1980b). Mean litter size in Wales was 4.7, and in southern England was 5.4. Juveniles typically disperse at the age of 6-10 months, and individual foxes may also be categorised as transient within an area (Dekker, Stein & Heitkönig, 2001).
27
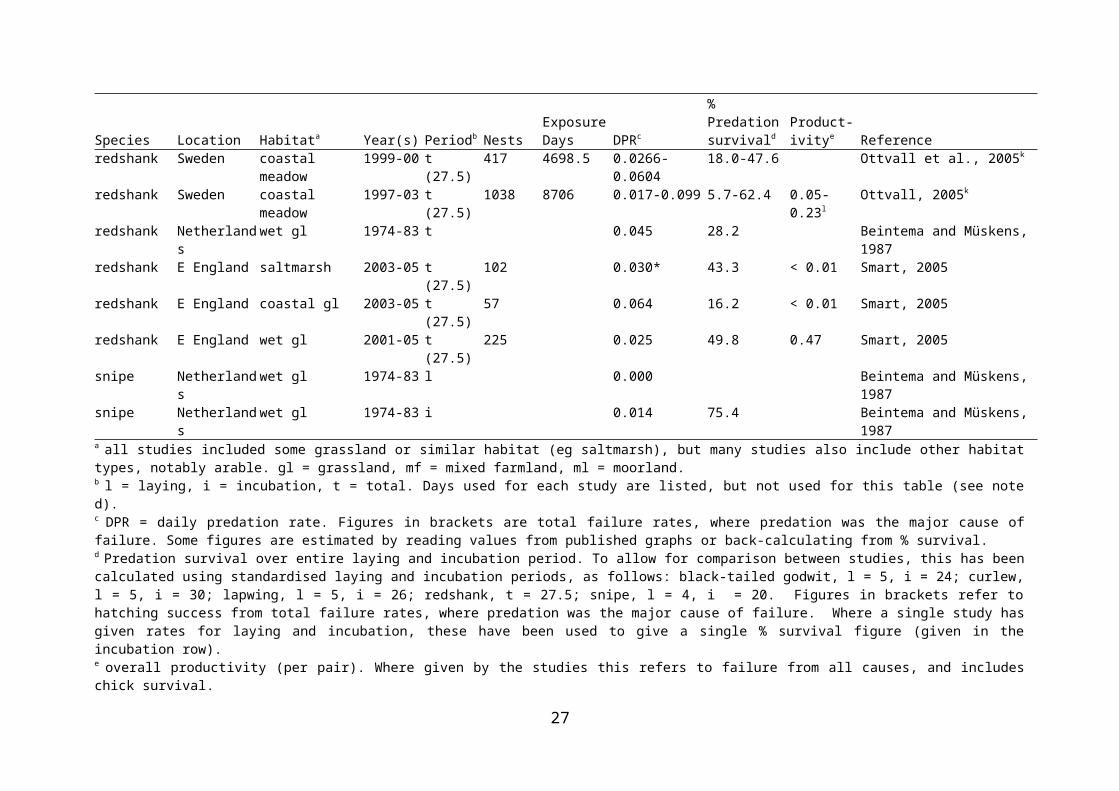
Table 2.4 Density, group size, and home range size of potential predators of wader nests.
Predator Location Habitat Year(s) N Home range (ha)
Density (km2)1 Group size(adults)
Reference
red fox Germany dry polder (Havel Valley)
1997-01 0.28-0.46 families Bellebaum and Bock, unpub. data; Bellebaum, 2002
red fox Germany dry polder (Oder Valley)
1999-00 0.37-0.45 families Bellebaum and Bock, unpub. data; Bellebaum, 2002
red fox Germany wet polder (Oder Valley)
1997-00 0.09-0.18 families Bellebaum and Bock, unpub. data; Bellebaum, 2002
red fox Oxfordshire rural suburbs, farmland1972-82 10? 2. 15 Voigt and MacDonald, 1984
red fox Great Britain pastural class IV2 1.88 Webbon et al., 2004red fox (pre-breeding)
S England mixed farmland & woodland
6 1.0-2.1(0.40-0.85 groups)
2.5 + 0.55 Baker et al., 2006
red fox (post-breeding)
S England mixed farmland & woodland
6 5.68 (0.40-0.85 groups)
2.5 + 0.55 Baker et al., 2006
red fox Britain farmland 84 70-400 0.9-3.7 2.67 Lloyd, 1980bred fox Scotland farmland 1973-78 173 dens 101 (dens) 0.27 Hewson, 1986red fox Netherlands coastal dunes 56 105-200 Mulder, 1985red fox Oxfordshire farmland 1972-82 3 234 Voigt and MacDonald, 1984red fox N France farmland, woodland 11 358 Artois et al., 1990red fox N France farmland 6 approx. 200 Poulle et al., 1994red fox Germany woodland, farmland 1980-82 58 473
(90-1340)Zimen, 1984
stoat Scotland farmland 1977-79 114 (F), 254 (M) Pounds, 1981stoat Sweden pasture and marshes 1973-82 2-7 (F), 8-13 (M) 30-100 (pasture)
up to 220 (marsh)Erlinge, 1977
stoat Switzerland alpine 1977-80 2-7 (F), 8-40 (M) Debrot and Mermod, 1983badger Gloucestershire woodland, farmland 1978 6 groups 22 19.7 4.8 Cheeseman et al., 1981badger Cornwall woodland, farmland 1978 6 groups 75 4.7 4.8 Cheeseman et al., 1981badger Avon woodland, farmland 1979 7 groups 74 4.9 3.6 Cheeseman et al., 1981badger Gloucestershire woodland, farmland 1979 5 groups 25 19.4 5.8 Cheeseman et al., 1981badger Gloucestershire woodland, farmland 1978-93 21 groups 35 25.3 (max.) 8.8 Rogers et al., 1997badger Oxfordshire woodland, farmland 1972-75 13 groups 87 8.4 Kruuk, 1978
28

Predator Location Habitat Year(s) N Home range (ha)
Density (km2)1 Group size(adults)
Reference
badger Great Britain “good badger country” 0.3-0.4 groups Cresswell et al., 1990badger Scotland pasture, moorland,
woodland1978-82 6-7 groups 121 2.2 3.6-5.3 Kruuk and Parish, 1982
badger Staffordshire 5 104 8.6 9 Cheeseman et al., 1985, in Cresswell et al., 1988
badger Great Britain lowland undulating and coastal habitat3
1985-88 627 0.472 + 0.036 main setts
Reason et al., 1993
hooded crow Sweden grassland 1972-79 39-52 1.9-2.5 pairs Loman, 1985hooded crow Norway forest and farmland 26 15 Smedshaug et al., 2002carrion crow Switzerland forest 1974 24 3.7 pairs (min.) Tompa, 1975carrion crow Switzerland farmland 1973-74 36 approx. 3 pairs Tompa, 1975carrion crow Poland estuarine wetland 2000-02 153 3.2 nests Zduniak & Kuczyñski, 2003carrion crow (incubating)
Somerset wet grassland 1985 5 17.5 Bell and Chown, 1985
carrion crow (nestling)
Somerset wet grassland 1985 5 20 Bell and Chown, 1985
carrion crow (fledgling)
Somerset wet grassland 1985 5 8 Bell and Chown, 1985
carrion crow(territorial)
Scotland farmland 1968-72 29 27.9 3.36 pairs Charles, 1972
carrion crow(flock)
Scotland farmland 1968-72 6.74 Charles, 1972
1. Of adult individuals except where specified2. Includes ITE land classes 1, 5, 6, 7, and 8 (Bunce, Barr & Whittaker, 1981): “medium to low altitude, often coastal areas. Undulating lowland farmland, intricate in composition with small fields, many hedges and small woods. Predominantly pasture. S England, SW Midlands and Wales” (Walsh & Harris, 1996).3. Almost overlapping in definition with pastural land class IV (also includes land class 2).
29
Table 2.5 Energy and food requirements of potential predators of wader nests.
Species N Weight (kg) Location Habitat/Situation1 FMR (kJ/kg/day)2
Food requirements (g/individual/day)3
Reference
red fox Great Britain captive 850 Webbon et al., 2004red fox 4F 5M 5.4 (F), 5.6 (M) Australia farmland 318 (F), 421 (M) Winstanley et al., 2003red fox 3F 3M 4.18 (F), 5.14 (M) Bristol urban 318 (F), 326 (M) Saunders et al., 1993red fox 5F 5M 4.7 (F), 4.8 (M) USA captive 350 Sargeant, 1978red fox Great Britain 225-340 Lloyd, 1980bred fox British Isles review/equation 401 Cotgreave, 1995red fox 5.7 UK review/equation 520 g (vertebrates),
569 g (arthropods)Crocker et al., 2002
red fox Scandinavia review/equation 400 Angelstam, 1984red fox 5.5 (F), 6.5 (M)
(assumed)UK adjusted from
Sargeant (1978)361 (F), 409 (M) Baker et al., 2006
stoat West Sussex farmland, woodland 50 Day, 1963, in Tapper, 1976stoat British Isles review/equation 45 Cotgreave, 1995stoat 0.2 UK review/equation 56 (small mammals) Crocker et al., 2002badger British Isles review/equation 567 Cotgreave, 1995badger 10.1 UK review/equation 852 (arthropods),
1842 (worms and slugs)Crocker et al., 2002
badger Scandinavia review/equation 500 Angelstam, 1984rook4 0.49 UK review/equation 159 (arthropods) Crocker et al., 2002crow 0.5 (assumed) Scotland review/equation,
captive birds & field observations
2972 approx. 341(hen chicks, based on 80% digestibility)
Lasiewski and Dawson, 1967; Charles, 1972; Yom-Tov, 1974
carrion crow British Isles review/equation 84 Cotgreave, 1995carrion crow 0.57 UK review/equation 162 (carrion) Crocker et al., 2002hooded crow Scandinavia review/equation 100 Angelstam, 19841. Review/equation – based on previous literature or on equations predicting food requirements from body mass, etc.2. Field metabolic rate – daily energy requirement per kg of predator3. Food items are often not specified and are presumed to be the major prey items. 4. Chosen as nearest relation to crow for which such data were available
30
Table 2.6 Foraging behaviour of potential predators.
Species Location n Detection distance Search effort Movement speed (m/s)
Reference
smell sound sight duration per site time per hared fox captive cubs 4 1.5 m 10 m (max.
possible)Österholm, 1964
red fox N England 17 visits 641 + 489 secs (range 42-1380)
57 secs/ha 0.4 (walking), 2.6 (trotting), 6.0 (running)
Seymour et al., 2003; Seymour et al., 2004
red fox Oxfordshire 28 foraging visits (for earthworms)
e.g. 10-20 mins in 0.0625 ha1
0.38 m/s (walking
while foraging)
Macdonald, 1980
red fox USA 105 individuals (608 movements)
0.15 (lgc), 0.18 (hgc)2
Phillips et al., 2004
hooded crow (predation on willow ptarmigan nests)
Norway 16 and 25 (two years)
81% of nests robbed within 350 m, 32% robbed 351-700 m
Erikstad et al., 1982
carrion crow (artificial larvae tests for grids of various sizes)
UK 4-7 tests per grid mean no. not consumed (of 16): 0.25 m = 0.25; 1 m = 0.57; 2 m = 4.4; 3 m = 1.5; 5 m = 11.25; 6 m = 7.57
Croze, 1970
1. Example value for convoluted search pattern2. Values for pastureland in landscapes with low grassland composition (lgc) and high grassland composition (hgc). Derived from radiotracking with 15-20 mins between fixes, therefore not a measure of absolute speed of fox.
31
2.6.1.1 HOME RANGE SIZE AND DENSITY
Fox density is difficult to determine because of the fox’s secretive habits, and also because density varies temporally. Methods used to estimate density include aerial surveys, questionnaires, scent-post surveys, intensive ground searches, and indices of hunting/trapping (Voigt, 1999). Because of their broad diet, foxes can be found at high density in a variety of habitats, provided other required resources, notably daytime, cover are present (Lloyd, 1980a). Fox density is strongly influenced by food availability (Hewson, 1986), although den site availability is important, and culling can also affect fox density (Heydon & Reynolds, 2000). Foxes feed heavily on small rodents, notably voles of the genus Microtus, which are typical of rough grassland, although they can do well provided other food sources are available (Lloyd, 1980a). In drier areas, lagomorphs may make up the majority of the diet (von Schantz, 1980). Rough permanent grassland with small areas of woodland and scrub cover would provide ideal habitat for foxes. However, because of the breadth of their diet, predicting fox densities from habitat classification alone is difficult, and in Italy, fox home range size was very strongly associated (negatively and exponentially) with the number of habitats per hectare (Lucherini & Lovari, 1996).
Nevertheless, fox density by habitat has been estimated in rural Britain using faecal density, defecation rates having first been measured during a captive breeding trial and a bait-marking trial (Webbon, Baker & Harris, 2004). Mean density ranged from 0.21 to 2.23 foxes/km2, and was highest in one of the land classes incorporating arable farmland. Fox density in the land class most appropriate for this review, pastoral d, was estimated at 1.88/km2 (95% confidence intervals: 1.02-2.74/km2). Pastoral d is an aggregated land class that includes ITE land classes 1, 5, 6, 7 and 8, and is predominantly lowland pasture in southern England and in Wales (Bunce, Barr & Whittaker, 1981; Walsh & Harris, 1996). Predictive ability of habitat variables was generally poor, and the only significant relationship in pastoral d areas was with hunting pressure (positively). Prey abundance and culling, which were not part of the analysis, were thought likely to explain much of the variation (Webbon, Baker & Harris, 2004). On an organic mixed farm in southern England, fox density was estimated as 0.4-0.85 families/km2 (depending on assumptions) (Baker et al., 2006). With an average group size of 2.5 adults, and litter size of 4.17 cubs, this gave a density of 1.0-2.1 adults/km2 pre-breeding, and 2.7-5.7 foxes/km2 post-breeding. In eastern German wet grassland density of foxes increased after the introduction of the rabies vaccination program (Bellebaum, 2002). In occasionally flooded areas in the 1990s, fox density was 0.3-0.46 families/km2, similar to that on farmland, while on one regularly flooded site it was much lower (0.1-0.15 families/km2). The density of adult foxes per km2 in England and Wales ranged from 0.9 to 3.7/km2
depending on site (Lloyd, 1980b), while in agricultural land in Scotland it was only 0.27/ km2 , based on an estimate of the number of foxes to the number of litters found (2.67) (Hewson, 1986; Lloyd, 1980b).
Studies of fox home range size have generally used radiotracking of individuals, and there is difficulty in comparing some of these studies as different methods of estimation are used (including minimum convex polygon, Fourier transformation, and grid). Studies of fox home range size around the world, have found sizes ranging from 27-30 ha (on an Arctic island), to 1611 ha (in Canadian alpine shrub) (Cavallini, 1996). Urban foxes have been found to have home ranges at the smaller end of the scale (Saunders et al., 1993). Home range sizes estimated in habitats relevant to this review (generally a mixture of farmland and woodland) include: 358 ha in northern France (Artois, Aubert & Stahl, 1990); approximately 200 ha in Italy (Cavallini, 1996; Poulle, Artois & Roeder, 1994); 70-400 ha in various parts of Britain (Lloyd, 1980b), 234 ha in Oxfordshire (Voigt & Macdonald, 1984); and 473 ha in Germany
32
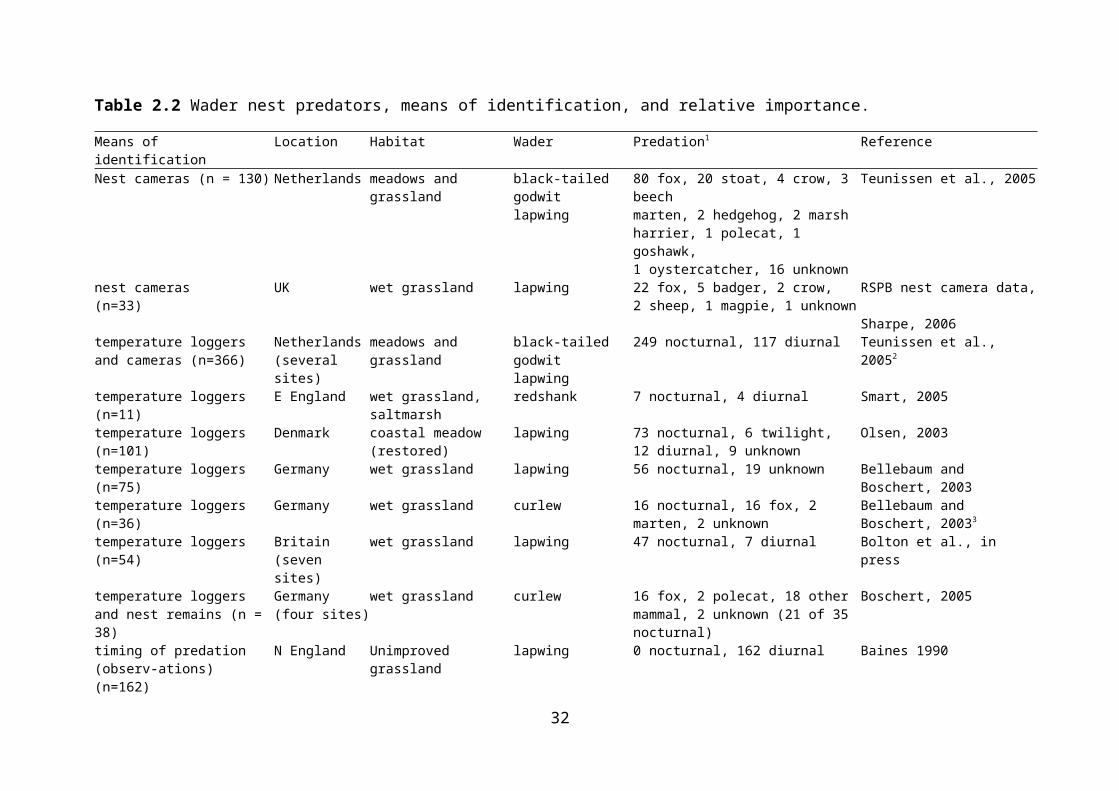
(Zimen, 1984). A report on monitoring of British mammals described home ranges in farmland as ranging from 200 to 600 ha (Macdonald, Mace & Rushton, 1998). Rural foxes with a home range of 250-750 ha may need two weeks to cover the whole area (Sargeant, 1972). A review of fox home range studies in Europe and North America found an inverse relationship between home range size and population density (Trewellha, Harris & McAllister, 1988). In fact, home range size was a better linear fit against mean recovery distance of foxes, indicating that dispersal distance is related to both population density and home range size.
2.6.1.2 DIET
The diet of the fox is very broad, and depends on the availability of food (Lloyd, 1980b). Except in uniform habitats, it is difficult to determine exactly what foods are available, and in what quantities. Foxes can survive equally well on small food items taken frequently, and on fewer, larger items. Where prey is abundant,foxes will kill in excess of immediate requirements and cache food (Macdonald, 1976). Mammals form the bulk of the fox diet in Britain, with birds, other vertebrates, plants and invertebrates also contributing (Baker & Harris, 2003). Foxes seem to prefer small rodents, especially Microtus spp., but whether this reflects relative abundance or susceptibility to predation is uncertain (Lloyd, 1980b). A captive fox in Britain showed an extremely strong preference for Microtus over bank vole Clethrionomys and wood mouse Apodemus, even though it had no experience with any of these beforehand (Macdonald, 1977). Voles were estimated to make up 65.1% of fox diet in a Polish mixed forest-farming landscape (based on faecal analysis following digestibility analysis using caged foxes) (Goszczynski, 1974; Ryszkowski, Goszczynski & Truszkowksi, 1973). This may have changed in German and Polish farmland, where recent studies found carrion and domestic waste to form the majority of biomass in stomach contents especially in winter (Panek & Bresiński, 2002; J. Bellebaum, pers. comm.) while in the Biebrza floodplains in eastern Poland rodents still formed more than 60% of food biomass estimated from scat samples (Kobylińska, 1996). Prey abundance is at its lowest at the point when females are lactating (April), which may put pressure on prey (Lloyd, 1980b).
In lowland Britain, examination of fox diet (by frequency in stomach contents and scats) in comparison with an earlier study, found that lagomorphs declined from 68% to 24.5% from 1939-40 to 1955-57 (with myxomatosis introduced in the intervening years): voles rose from 4% to 41.5% (Lever, 1959). Foxes have an extremely broad diet, which varies spatially and temporally; in Oxfordshire, earthworms were estimated to comprise up to 60% of calorific intake, depending on season (Macdonald, 1980). Rabbits can be much more important in the diet than voles, as found on an organic mixed farm in southern England (Baker et al., 2006); this probably probably occurs when the habitat does not contain much of the voles’ preferred rough grass habitat (Southern & Watson, 1941). Diet varies seasonally, and foxes can shift diet in relation to abundance, particularly in response to changes in abundance of preferred small mammal prey (Ferrari & Weber, 1995; Richards, 1977). Where small rodents make up the bulk of the fox diet, the daily behaviour of the fox probably reflects the daily movements of its prey items (Österholm, 1964). In Scottish moorland, fox consumption of rodents as a proportion of the diet closely tracked the abundance of the rodents (mostly field voles) determined by trapping (Leckie et al., 1998).
2.6.1.3 ENERGETIC REQUIREMENTS AND FOOD CONSUMED
Daily energy expenditure was estimated for a population of urban foxes in Bristol (Saunders et al., 1993). Female energy expenditure was lower in autumn and winter, but in spring and
33
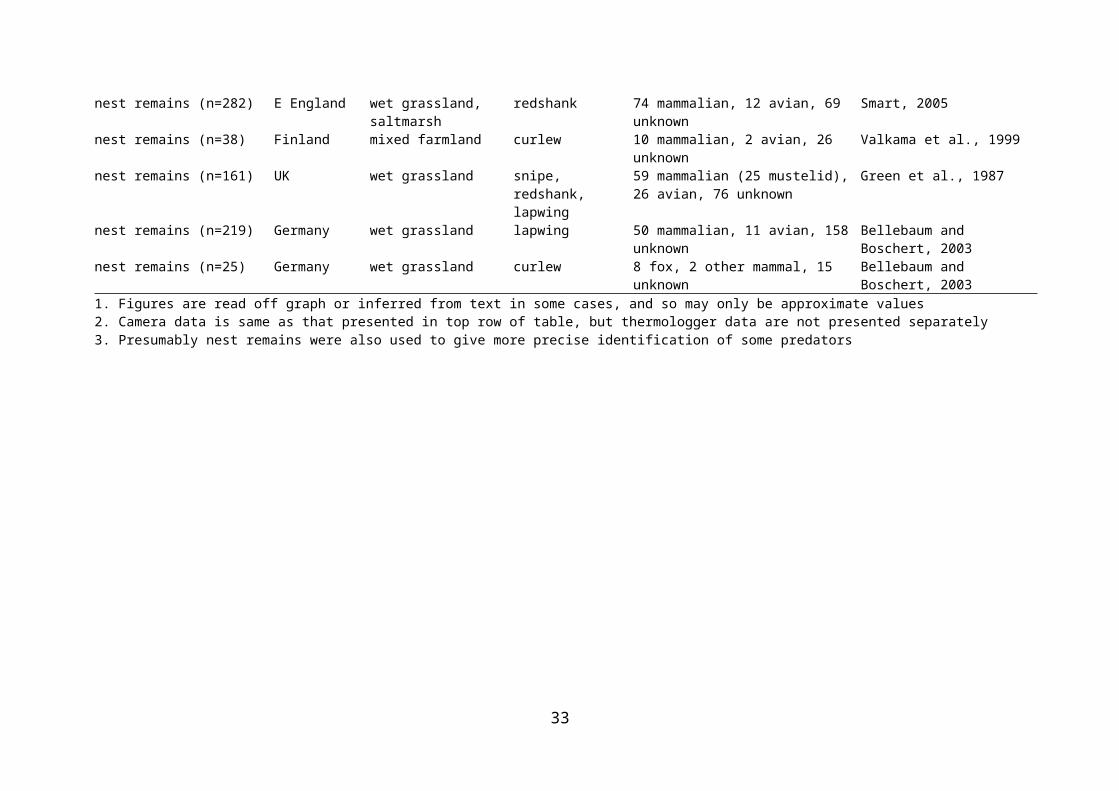
summer (the relevant period for wader predation), daily energy expenditure averaged 326 kJ/kg/day for males and 318 kJ/kg/day for females. In temperate Australia, autumn field metabolic rate was estimated, using doubly labelled water, as 2328 + 67 kJ/day for males (n = 5), and 1681 + 118 kJ/day for females (n = 4) (Winstanley, Buttermer & Saunders, 2003). Average body size was 5.6 + 0.1 kg for males, and 5.4 + 0.2 kg for females, leading to an estimation of 421 kJ/kg/day for males, and 318 kJ/kg/day for females. Daily energy intake of growing captive cubs was estimated as 932 kJ/day (Vogtsberger and Barrett, 1973, in Lloyd, 1980b).
Food requirements of foxes have been estimated in several studies; although the prey eaten is not always specified, we presume that it generally refers to vertebrates. General texts on foxes have estimated food needs as approximately 500 g per individual per day (Macdonald, Mace & Rushton, 1998), 350-500 g per day (Lloyd, 1980b), 400 g per adult (Lockie, 1959, cited in Angelstam, Lindström & Widén), and 401 g (Cotgreave, 1995). Food requirements have been estimated for foxes using estimates of daily energy expenditure based on body weight (Crocker et al., 2002). A fox of 5.7 kg was estimated to require 569 g of arthropods or 520.2 g of bird and mammal prey daily. Weekly prey consumption of North American foxes was recorded as 0.48 kg per kilogram of fox bodyweight (Sargeant, 1978). This was adapted to the larger body size of British foxes to give a weekly prey consumption rate of 0.46 kg per kilogram of fox bodyweight (Baker et al., 2006). Thus a 6 kg fox would consume 390 g of prey per day. Annual consumption of prey by foxes was estimated as 122.6 kg for a 5 kg fox, or 336 g/day (Goszczynski, 1974; Ryszkowski, Goszczynski & Truszkowksi, 1973).
Female consumption increases during the four weeks of lactation, such that for each cub a 5.5 kg female requires 2.54 kg of extra prey weekly (or 362 g daily for each cub) (Baker et al., 2006). Daily growth rate of cubs for the first 30 days is 15-20 g, and during the period of fastest growth (8 to 16 weeks) their food requirements have been estimated as 225-340 g per day (Lloyd, 1980b). Food requirements of cubs has been estimated to peak at 1.3 times the adult requirement at 28 weeks, before declining to the adult rate at 52 weeks (Baker et al., 2006). The annual prey requirements for a typical fox group (consisting of 1 male, 1.5 females and 4 cubs) was estimated as 594 kg if juveniles disperse, and 928 kg if they do not (Baker & Harris, 2003). On an organic farm in southern England, annual prey requirements for a fox group (2.5 adults and 4.17 cubs) were estimated at 608 kg (373 kg in the spring-summer period) (Baker et al., 2006). Based on minimum and maximum estimated densities, this resulted in an annual prey demand of 243-517 kg/km2.
2.6.1.4 FORAGING BEHAVIOUR
It has been assumed that foxes hunt using the sense of smell, have good hearing, but poor sight. However, examination of responses of a small number of trained foxes to optical, auditory and olfactory signals found that smell was less efficient than sight in good light conditions (Österholm, 1964). This was rarely relevant in natural circumstances, as foxes mostly forage in poor light and for cryptic food. Visual ability in daylight is directed towards detection of movement rather than recognition of shapes (Lloyd, 1980b). But the sense of smell was less good than is commonly supposed, and without sound stimulation, foxes needed to be within 1.5 m of a piece of meat to find it, and even then success was not 100%. Even when stimulated by sound, olfactory tracking was initially undirected, and hidden hens’ eggs were never located purely by smell, even when the eggs were rubbed with down. With sound stimulation the foxes then used smell more actively (indicated by loud snufflings), and located meat between 1 and 2 m distant. This suggests that sense of smell in the field is best considered to be a point blank location method (Österholm, 1964). Sound signals were acted
34
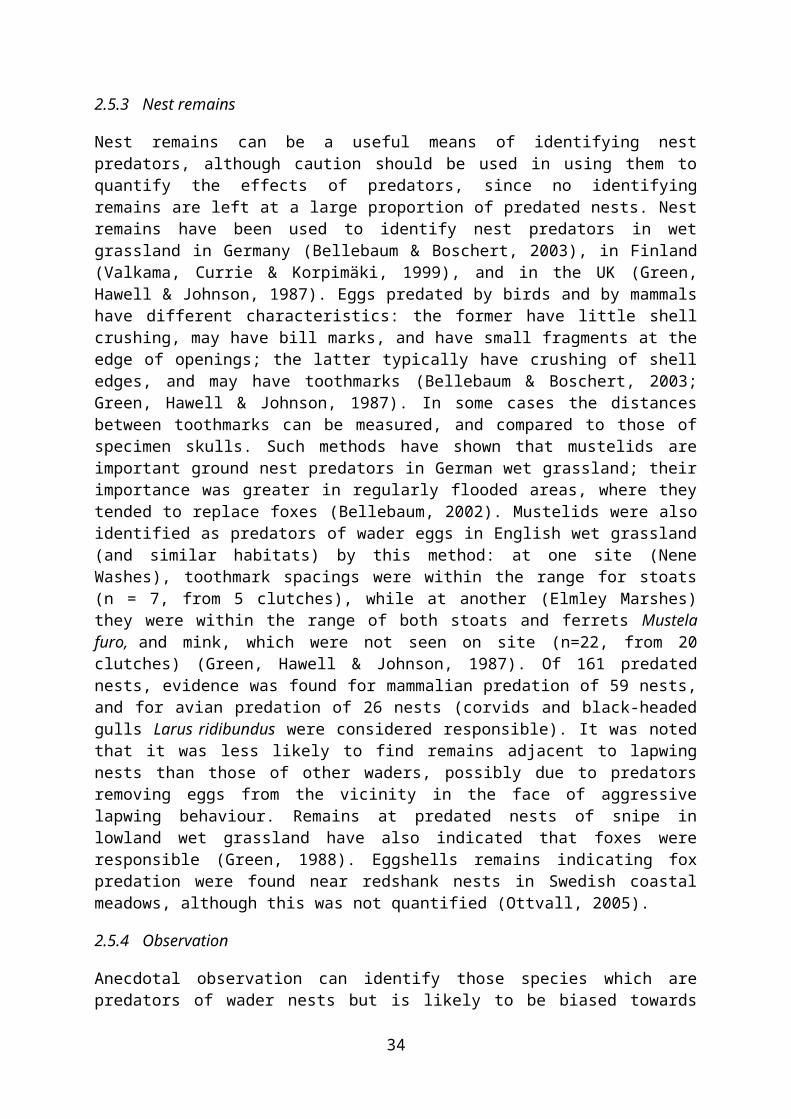
upon by foxes at a distance of 10 m (the maximum possible in the experiments), rushing towards the sound, and then using smell if the sound ceased. Foxes trained to associated sound with food could correctly choose direction 50-68% of the time based on a 1º difference in angle at 2.5 m distance, and 70-97% of the time based on a 10º difference in angle (variation depended on sound frequency).
The results described above with foxes are consistent with those of a study using hunting dogs in forests to search for grouse nests (Storaas, Kastdalen & Wegge, 1999). It was estimated that a mammalian predator would detect a capercaillie nest if it was closer than 1.6 m (95% CI 0.7-2.2 m), and a black grouse nest if closer than 1.1 m (0.8-1.6 m). Use of sound in locating prey may be relevant to nest predation, because chicks just prior to hatching make noises within the shell, which may aid foxes in locating them. Another study of sound location by foxes found that they could locate sounds correctly in 90% of cases from 900 cycles/second to 14 000 cycles/second, and even at 34 000 cycles/second they could locate the source in 71% of cases (Isley & Gysel, 1975; Lloyd, 1980b). The fact that foxes were better at low frequencies in one study (Österholm, 1964) and at high frequencies in another, might be because the latter included only pure-toned sound, which foxes may have adapted to hear, because many bird calls are pure-toned.
Foraging behaviour of foxes was observed in wet meadows and arable fields in northern England (Seymour, 1999). From nocturnal observation, foxes spent longer in areas of high nest density, but when this was adjusted for total area it was not significant. Duration of individual visits to fields averaged 641 + 489 seconds (maximum 1380 seconds), and search effort averaged 57 seconds/ha per visit. There was no association between the time spent by foxes and other nocturnal predators in the vicinity of a colony and nest success. Fox search patterns were observed (n = 17, at five sites), with movements described by gait, number and sharpness of turns, and durations of pauses between movements. Foxes generally moved rapidly in straight lines, but on at least six occasions they moved in convoluted patterns while near lapwing nests or chicks. These movements were never preceded by finding a nest or chick, and foxes did not always respond to lapwing alarms by searching thoroughly. The median time of searching (seconds/ha) was significantly lower for foxes using a direct travel method compared with those doing convoluted searches. Foxes were observed making zigzag searches of narrow bunds, and were frequently observed following habitat edges and linear features (including bunds, vehicle tracks and the edges of Glyceria beds). It was concluded, from a limited data set, that foxes make site restricted searches in response to unknown triggers, and also in particular habitats, notably bunds and Glyceria beds bordering flood water (Seymour, 1999). The likelihood of foxes encountering lapwing nests was modelled using fox movements drawn randomly from frequency distributions derived from observations (Seymour, Harris & White, 2004). In the simulation model, foxes were able to respond to alarms from nesting lapwings by initiating convoluted searches; in further simulations foxes could be stimulated to search thoroughly by cues from random co-ordinates, representing alternative prey.
Movements of foxes in landscapes of different grassland cover (with reference to waterfowl nest predation) were studied on the Great Plains of North Dakota by means of radiotelemetry (Phillips et al., 2004). In areas with low grassland cover, red fox movements were straighter, although movement was not faster, indicating directed movements between isolated patches of planted cover. Foxes exhibited directional movement along wetland edges and movement rates were slower along wetland edges than in planted cover or the agricultural matrix (Phillips et al., 2004). There was no significant directional movement in planted cover or in pastureland.
35
Where foxes feed on earthworms (and other invertebrates), they walk slowly, with frequent pauses, often followed by a change in direction, with ears pricked, apparently locating them by sound (Macdonald, 1980). Foxes followed convoluted paths in a small area (eg 10-20 mins in 25 x 25 m), or more direct paths, interrupted by occasional convolutions. Foxes were observed foraging much more in fields with more earthworms (notably horse pastures), and foraging methods appeared to be linked to weather, and therefore possibly worm availability. However, fox movement did not change following worm capture, suggesting that foxes are able to recognise areas of high worm density from other cues, such as the presence of long (and therefore more highly dunged) grass within a field, although this was not always obvious to the observer (Macdonald, 1980). Foxes tended to deplete the patches before leaving them; earthworms may be food for young and low status foxes which may not have access to other food sources.
2.6.2 Stoat (and other small mustelids)
Small mustelids (stoats, weasels, polecats, and mink) have evolved as predators of small mammals, and may be considered habitat generalists and prey specialists (Erlinge, 1986). Wet grasslands, which support high densities of rodents, provides good habitat for these species. Stoats in particular have been identified as predators of wader nests through the use of nest cameras and from toothmarks on egg shell remains, as described above. In this review we concentrate on stoat diet and behaviour. This is because the evidence for predation of wader nests by other species is limited (e.g. weasel), they have restricted distribution in the UK (e.g. polecat), or because such information is limited (e.g. mink). However, we consider that the information presented for stoats may prove relevant for other small mustelids in the context of wader nest predation.
2.6.2.1 DENSITY
Distribution and abundance of mustelids is strongly determined by distribution of den sites and by abundance of food resources (Gough & Rushton, 2000). Stoat numbers declined in the 1950s following the introduction of myxomatosis, recovered in the 1960s and 1970s, but appears to be declining again (Harris et al., 1995). Wet grassland provides good habitat due to the high prey densities present, as do young woodland and plantation, which are selected by stoats (Erlinge, 1986; King, 1989). Habitat changes, such as loss of linear features (hedgerows and stone walls) may negatively affect them by reducing prey numbers and by increasing their own vulnerability to predation. Home range size averages 40 ha in the UK, with females being more strongly territorial, and males ranging over several female territories (King, 1989; Macdonald, Mace & Rushton, 1998). In rough pasture in Sweden, density of stoats ranges from 3-10/km2, but can reach 220/km2 in marshy areas.
2.6.2.2 DIET AND FOOD REQUIREMENTS
Examination of stoat diet from gut contents (n =789) between 1995 and 1997 in Great Britain found that lagomorphs were the most important item (McDonald, Webbon & Harris, 2000). Lagomorphs had increased in importance since the 1960s following recovery of rabbit populations from myxomatosis. Stoats also take small rodents, and include birds and other small insectivores in the diet, and these elements are more important outside of Britain (King, 1989). The absence of rabbit grazing following myxomatosis increased the amount of tall grass available, and would have increased the number of voles available as prey (McDonald, Webbon & Harris, 2000). Stoats have been found to take birds in summer in West Sussex (probably mostly nestlings or nidifugous chicks), and eggs were found in 10% of stoat guts
36
(Tapper, 1976). In much of Britain, stoat abundance is probably related to rabbit abundance; however, in wet grassland, small rodents may be more important in the diet and may have more impact on stoat density.
Male stoats are estimated to consume 23% of their body weight daily, while females consume only 14% (Macdonald, Mace & Rushton, 1998). A study of food requirements of various mammals estimated that a stoat of 205 g body weight would have daily food requirements of 55.7 g of small mammals (Crocker et al., 2002).
2.6.3 Badger
Badgers occur in a wide variety of habitats where food and sett sites are available, but are most common in undulating mosaics of woodland and pasture below 200 m a.s.l. (Macdonald, Mace & Rushton, 1998). Setts are most commonly found in woodland (particularly deciduous), although scrub, hedges and open fields may also hold setts (Neal & Cheeseman, 1996). Lowland unimproved grassland held no setts in a survey of Britain (Cresswell, Harris & Jeffries, 1990), so the nature of surrounding habitats will determine badger occupancy. Geology and the presence of cover also strongly determine the suitability of sett sites (Neal & Cheeseman, 1996).
2.6.3.1 DENSITY
Badgers occur in their highest densities in Britain (Johnson, Jetz & Macdonald, 2002), and populations have increased markedly in the UK over recent decades (Hounsome & Delahay, 2005; Wilson, Harris & McLaren, 1997). Badger density reflects the distribution of food resources or sett site availability, and there is a suggestion that population densities are constrained by seasonal resource availability associated with winter temperatures (Johnson, Jetz & Macdonald, 2002). Badger density in a series of studies in England ranged from 3.2 to 28.5/km2 (sett density ranged from 0.11 to 4.29/km2); mean group size ranged from 3.5 to 6.4, and mean territory size from 23.5 to 104 ha (Johnson, Jetz & Macdonald, 2002). Surveys of badgers setts in Great Britain found that in typically good badger country, 0.3-0.4 groups/km2
were found, but in exceptionally favourable districts densities could reach 0.6-0.7 groups/km2
(Cresswell, Harris & Jeffries, 1990). Average distance between main setts in Wytham Woods was 500 m (Kruuk & Parish, 1982), while in the Cotswolds the average distance was found to be 325 m (Neal & Cheeseman, 1996). Variation in density is mostly produced by variation in territory size rather than group size (Cheeseman et al., 1981). In Wytham Woods, Oxfordshire, territories split (and mean territory size halved) in response to a change in earthworm abundance in the period 1974-1987 (da Silva, Woodroffe & Macdonald, 1993). Extremely high densities (25.3 adults/km2) were recorded at Woodchester Park, Gloucestershire, where densities (and individuals per group) had increased over time (Rogers et al., 1997).
Badger density in Eurasia is negatively related to percent forest cover, possibly due to the abundance and availability of lumbricid earthworms in pastures and meadows compared with woodlands (Kowalczyk, Bunevich & Jêdrzejewska, 2000). Badger abundance in Britain (at the 1 km2 scale) was most strongly (positively) related to the presence of semi-natural broadleaved woodland (Reason, Harris & Cresswell, 1993). These seemingly contradictory findings may be related to scale: landscapes with little farmland are less attractive to badgers, but at the local scale the presence of woodland provides sett sites, and may provide food resources at times when they are unavailable in grassland. In Wytham Woods, condition of badgers and their productivity were positively related to the amount of deciduous woodland
37
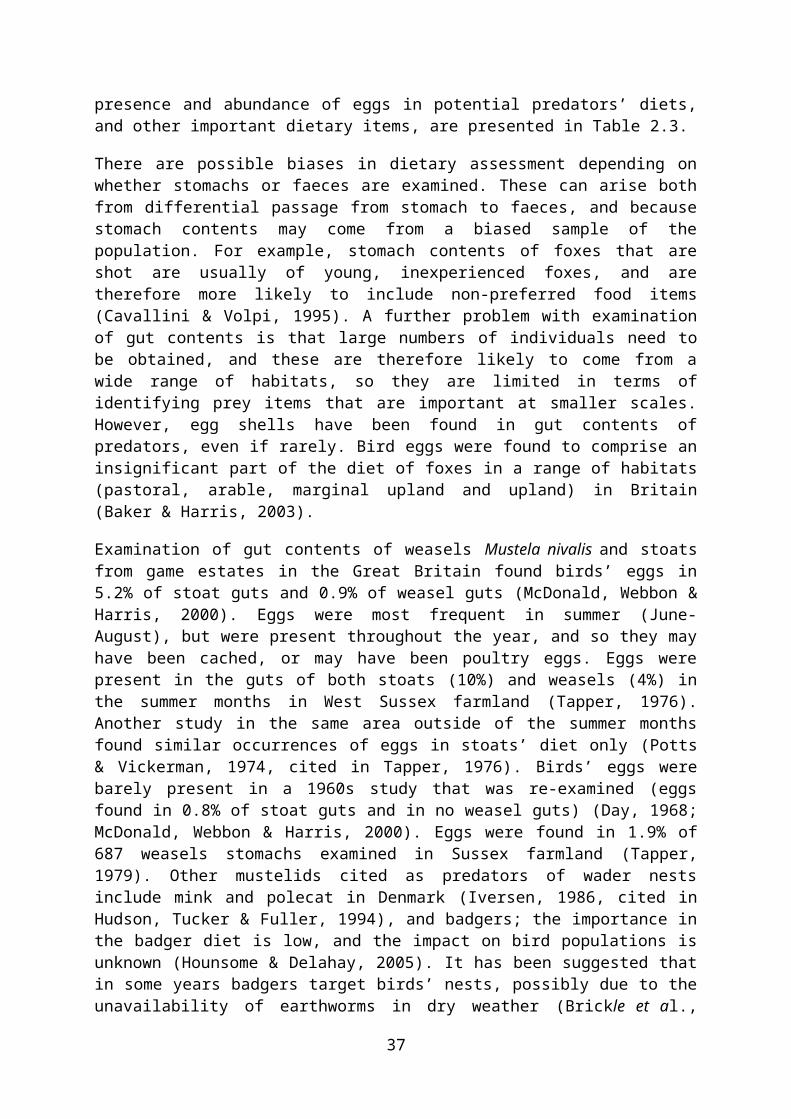
(reflecting food availability) within the territory (da Silva, Woodroffe & Macdonald, 1993). Main sett densities were highest in an amalgamated land class almost equivalent to pastoral d described above - lowland areas of undulating farmland and coastal habitats (Reason, Harris & Cresswell, 1993).
2.6.3.2 DIET AND FOOD REQUIREMENTS
Diet varies throughout Europe, but earthworms are the most important dietary item for badgers in the British Isles (Hounsome & Delahay, 2005). Biomass of worms and their availability affect how much of the diet they comprise. Earthworm availability is related to microclimate, as worms are only available when they are at the soil surface, and this is constrained by temperature and humidity; in dry conditions and/or cold conditions, wooded areas may be better for foraging, even if the biomass of earthworms is lower (da Silva, Woodroffe & Macdonald, 1993). While earthworms are the major prey of badgers, they also rely on a range of other items being available, and so setts tend to be located in a varied countryside, particularly where pasture, arable and woodland are available (Neal & Cheeseman, 1996). Badgers could be considered earthworm specialists that can switch to alternative prey when earthworms are not available (Erlinge, 1986).
Badger diet shifts with season: earthworms decline in importance as summer increases, while insects and cereals increase, and vertebrate prey peaks in mid-summer (Neal & Cheeseman, 1996). There are also strong differences between years, which are strongly affected by climatic conditions. In April and May, earthworms were present in around 60% of faeces (collected throughout Great Britain); in the same period, insects were the only other food item present in more than 50% of faeces (in May only) (Bradbury, 1974). In the South Downs, earthworms were estimated to make up around 50% of the diet by volume in March-April, but by May-June this had fallen to around 15% (Shepherdson, Roper & Lüps, 1990). Wheat (around 50%) and insects (around 20%) became more important in the diet in May-June.
Badger daily food requirements (unspecified) have been estimated as 500 g per adult (Angelstam, Lindström & Widén, 1984; Erlinge et al., 1983, cited in Angelstam, Lindström & Widén, 1984). The basal metabolic rate of a 10 kg badger has been estimated as 2132 kJ/day (Iversen, 1972, cited in Kruuk, 1978). Based on the energetic value of worms, it was estimated that around 722 g of worms would be required. This contrasts with an estimated daily food requirement for a 10.1 kg badger (using energy requirements based on body weight) of 852 g of arthropods or 1842 g of worms and slugs (Crocker et al., 2002).
2.6.3.3 FORAGING BEHAVIOUR
In Britain, where earthworms are available in habitats such as pasture and deciduous woodland, these are selected for foraging (Neal & Cheeseman, 1996). In the South Downs, foraging time was concentrated in pasture (rather than scrub or arable) in spring, and worms and insects were the main prey (Shepherdson, Roper & Lüps, 1990). While earthworms are the preferred food of the badger in Britain, geographically close groups may feed on different items depending on the amount of different habitats that make up their territories. For example, in Wytham woods, wheat comprised more of badger diet in territories that contained more arable fields (Hofer, 1988).
Badgers almost always forage alone. Mild, damp nights are best for earthworm availability; Lumbricus terrestris feeds on the surface when the ground is damp and temperatures are above 2ºC (Neal & Cheeseman, 1996). Worm availability is highly sensitive to microclimate,
38
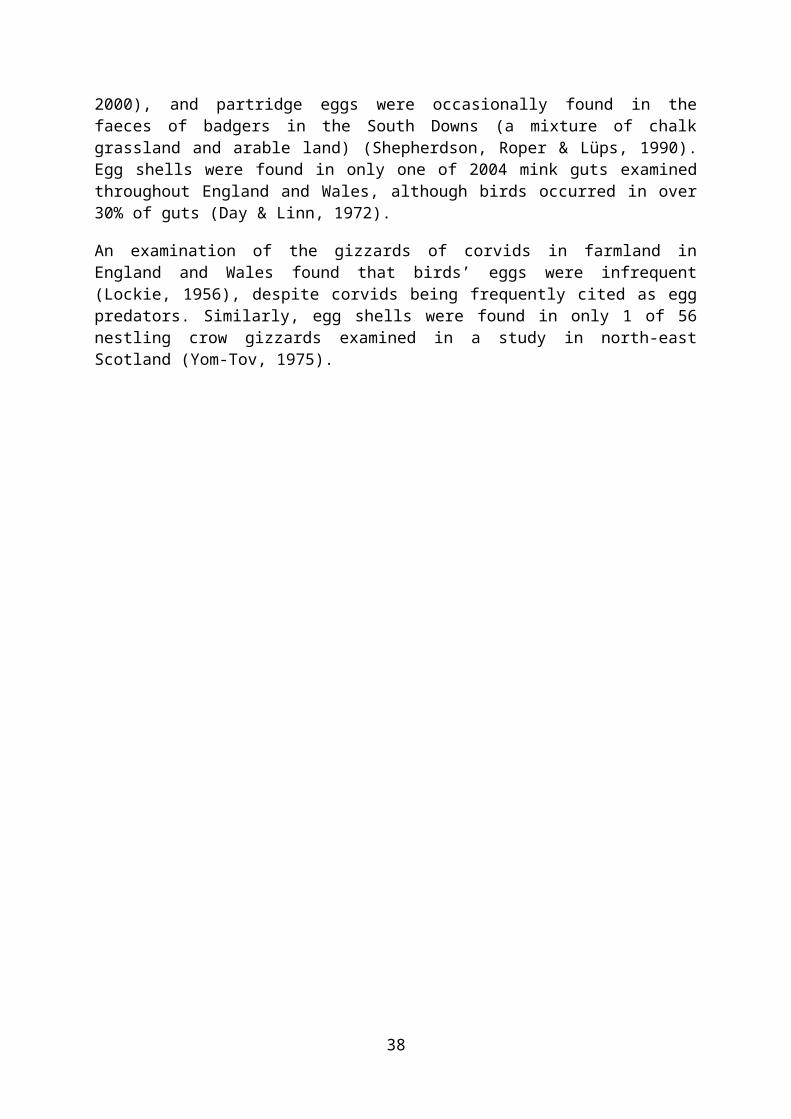
and small patches of abundant worms can appear for short periods (Kruuk, 1978). Such patches, of 20 x 20 m can hold sufficient worms to feed more than 30 badgers for a single night. Badgers may rely on sound rather than smell to locate prey, in the same way as foxes (Notini, 1948, cited in Österholm, 1964); however, it has been suggested elsewhere that smell is the most important sense, particularly in locating earthworms (Macdonald, 1980). Badgers may feel low-frequency vibrations directly through the ground. In farmland in the South Downs, two worm foraging methods were observed: moving slowly and more or less linearly across, picking worms off the surface (occasionally observed and only on wheat fields); and meandering slowly around a restricted area, nose to the ground, then grubbing with the snout and frequently digging turf (Shepherdson, Roper & Lüps, 1990). In good conditions, a worm may be caught every metre or so, at a rate of six or seven a minute, for up to two hours (Neal & Cheeseman, 1996). Short-grass pasture is preferred for foraging, as earthworms are more easily captured, and badgers avoid pasture with long grass (Kruuk et al., 1979). In Oxfordshire, badgers meandered, without showing frequent sharp changes in direction, but often covered the same ground soon after having searched it (Kruuk, 1978). They apparently detected worms only when they were immediately below the snout. Badgers would move quickly to worm-rich areas, where they would spend at least half an hour searching an area no larger than one hectare. During dry periods, badgers wandered further than they did in more favourable conditions, and also searched for worms other than Lumbricus terrestris (the most abundant worm) under cowpats, for example. Pasture was visited less often than expected according to both the area of pasture available or the worm biomass, and was most frequently visited in wet weather (Kruuk, 1978).
Insects tend to be taken later in the summer, when they are most abundant (Neal & Cheeseman, 1996). Mammals and birds are most frequently taken in spring and summer, and in both cases those caught are most likely young.
2.6.4 Carrion crow and other corvids
Corvids are generalist and adaptable predators (Holyoak, 1968; Lockie, 1956). For example, in Lough Hyne Marine Reserve intertidal invertebrates were the most important component of the diet of hooded crows (Berrow, Kelly & Myers, 1992). Eggs and nestlings were reported as important food items on farmland for magpie and jay, and there are numerous anecdotal records for raven, carrion crow, rook and jackdaw preying on these items (Holyoak, 1968). Dietary analysis indicates that eggs form a small part of the diet, although this may reflect poor preservation of eggs, or the fact that corvids tend to swallow relatively little of the shell. While corvids other than hooded crows and carrion crows have been observed predating wader nests, we concentrate on these two subspecies, as there is the most evidence for them as possible major predators.
2.6.4.1 HOME RANGE SIZE AND DENSITY
Carrion crow populations consist of two components at the time of year that is relevant to wader nest predation: territorial breeding pairs, and non-territorial birds that tend to form flocks (Charles, 1972), although cooperative breeding has been observed in a population of carrion crows in northern Spain (Baglione, Marcos & Canestrari, 2002). The non-breeding population can be large compared to the number of breeding pairs. On West Sedgemoor RSPB Reserve in 1985, the non-territorial population was estimated at 200-350 birds, while 35 nests were located (unlocated nests were estimated at around 10) (Bell & Chown, 1985). In 12 km2 of Swiss farmland approximately 36 breeding pairs were accompanied by up to 200 non-territorial birds in spring (Tompa, 1975). Nesting territories are only established where
39
suitable nest trees are present, and control of crows has included the removal of nest trees where possible (Charles, 1972).
The density of territorial crows is very stable, and for much of the year they defend more food resources than they require for their immediate needs (Bell & Chown, 1985; Spray, 1978). This is probably because crows are themselves the major predator of crow nests, and thus pairs hold defence territories rather than food territories, to allow them to defend their nests against other crows. Removal of territorial crows results in reoccupation of the territory from the non-territorial flock. However, studies that have provided extra resources (nest sites and/or supplementary food) in areas occupied by territorial crows, have found that extra breeding territories are not added, even where home range size of breeding pairs reduces in size (Bell & Chown, 1985; Charles, 1972; Spray, 1978; Yom-Tov, 1974). Provision of food to carrion crows did increase productivity in an urban area in Switzerland (Richner, 1992), and in Scottish farmland, although not the condition of fledged chicks (Yom-Tov, 1974). Predation by other crows was considered the major cause of egg and nestling losses, and the major benefit of providing additional food is to allow the adults to remain close to the nest, improving their ability to defend the nest.
Crow density and home range sizes have been estimated in a range of habitats. In wet grassland at West Sedgemoor RSPB Reserve, carrion crow home range was defined using observed locations (Bell & Chown, 1985). Average distance between nests was 311.1 + 138.3 m, and nests were randomly spaced (unlike wader nests, which were clumped). Mean foraging home range size for incubating pairs was 17.5 ha, while for parents with chicks it was 20.0 ha, and home range became much smaller (8.0 ha) for pairs with fledglings.
Crow territory size and population density measured in other habitats may not be directly relevant to those in wet grassland. However, the fact that they hold defence territories may mean that differences between habitats may be less than those observed in other species. In a similar habitat (a partially permanently flooded estuary covered by a mosaic of herbaceous vegetation and willows), hooded crow nest density was 3.2/km2, and no non-territorial birds were present (Zduniak & Kuczyñski, 2003). In mixed forest/farmland landscapes in Norway, hooded crow home ranges averaged 15 ha; there was a strong negative relationship between home range size and proportion of forest edge habitat within the home range, indicating the importance of forest edges to crows (Smedshaug et al., 2002). Within their home ranges, crows used forest edges more than the other habitats available in their home ranges, and home range size decreased as the proportion of forest edge increased. In Scottish farmland, carrion crow territory size (of nesting pairs) averaged 27 ha (Charles, 1972; Yom-Tov, 1974). The area used declined from the nest building to the late incubation stage, and then increased again during the nestling stage. The density of territorial pairs was 3.36 pairs/km2 while the density of flock birds was 6.74 birds/km2 (these birds were in separate but adjoining areas). Density of breeding pairs in Swiss farmland was approximately 3 per km2, while in a wooded landscape in the same area density was at least 3.7 pairs/km2 (Tompa, 1975). Nest densities in other agricultural landscapes in Europe have been estimated as 1.9-2.5/km2 in Sweden, 1.5/km2 in Slovenia, and 2.0/km2 in Norway (reported in Zduniak & Kuczyñski, 2003).
2.6.4.2 DIET AND ENERGETIC REQUIREMENTS
The basal metabolic rate (BMR) of passerines can be calculated using the equation: BMR (kJ/day) = (129 x Wt0.72) x 4.18 (Lasiewski & Dawson, 1967). For a crow weighing 0.5 kg, this equates to 335 kJ/day, and concurs with an estimate of standard metabolic rate for American crow Corvus cryptoleucos weighing 0.64 kg of 330 kJ/day. This equation has also
40
been used to calculate a daily food requirement of 100 g per day for an adult hooded crow (Angelstam, Lindström & Widén, 1984). Observations of hen chick consumption by two captive crows (weighing 532 g and 392 g), found that their daily food consumptions averaged 1027 and 686 kJ respectively (Yom-Tov, 1974). Energy requirements in the field in spring were calculated, based on typical behaviour, as 1486 kJ/day; assuming an average assimilation rate of 80%, this would require food with an energy value of 1860 kJ/day. Estimated energy requirements for a pair of crows with five nestlings peaked at day 25 at over 6500 kJ/day (figures read from graph) (Yom-Tov, 1974).
Gizzard analysis of corvids around Oxford in 1951-53 found that invertebrates (especially earthworms in the spring months) and grain were the most common items (Lockie, 1956), while in Scottish farmland, small mammals, Coleoptera, tipulid larvae and grain were the most frequent items; there was little difference in diet between adults and nestlings (Yom-Tov, 1975). Voles and mice are also important components of the diet of carrion crow, although grain was the food item most frequently found in crow gizzards (Holyoak, 1968). Earthworms and invertebrates (especially Coleoptera, Diptera and Arachnida) formed the greatest proportions of nestling food in Oxford; in one year, nestling birds formed 16% of the diet by volume (Lockie, 1955).
2.6.4.3 FORAGING BEHAVIOUR
It is assumed that crows use perches to locate nests, but perching behaviour may rather be intended to check on predators of their own nests or other territory intruders (Ottvall, 2005). Crows may locate nests by chance while flying over areas, by observation, or while foraging for other items. The foraging behaviour in a Danish coastal meadow of hooded crows in the absence of artificial nests was consistent with them searching for invertebrates, rather than natural nests (Olsen & Schmidt, 2004b). In wet grassland on the West Sedgmoor RSPB Reserve, non-breeding crows favoured recently ploughed fields, and avoided tussocky grassland with sedges present, which is where waders concentrated their breeding efforts (Bell & Chown, 1985). Wader eggs were not thought to form a major part of the diet of territorial crows, as each crow territory would be unlikely to hold more than a couple of wader nests. Non-territorial crows are also likely to concentrate their foraging efforts in areas of high prey abundance, such that wader nests would only be located coincidentally in areas being foraged for other prey. From the literature, this does not appear to be commonplace.
Detection distance of nests may not be important, as territorial hooded crows apparently located willow ptarmigan Lagopus lagopus lagopus nests by observing the movements of sitting adults (Erikstad, Blom & Myrberget, 1982). But there was an effect of distance from nest, as they located a greater proportion of nests located within 350 m of their own nests (81%) than those 351-700 m away (32%). An examination of crow foraging behaviour in experimental conditions found that they tended to search around areas where they had previously found prey, a phenomenon known as area-restricted search (Croze, 1970). This involved small items at high densities (0.5-6 m apart), and is not relevant to a search for widely spaced nests, where each nest is almost always beyond the direct detection distance of another. However, it may help to inform the manner in which corvids search an area with a given alternative prey density, during which they may encounter a wader nest. It may also have relevance for crows locating nests once the general location had been determined by observing adults. Crows feeding on artificial “larvae” laid out in a grid found almost all “larvae” when they were 0.25 or 1 m spaced, but around half survived predation when they were 5 or 6 m spaced (survival was higher for 5 m spaced “larvae”), even though they spent
41
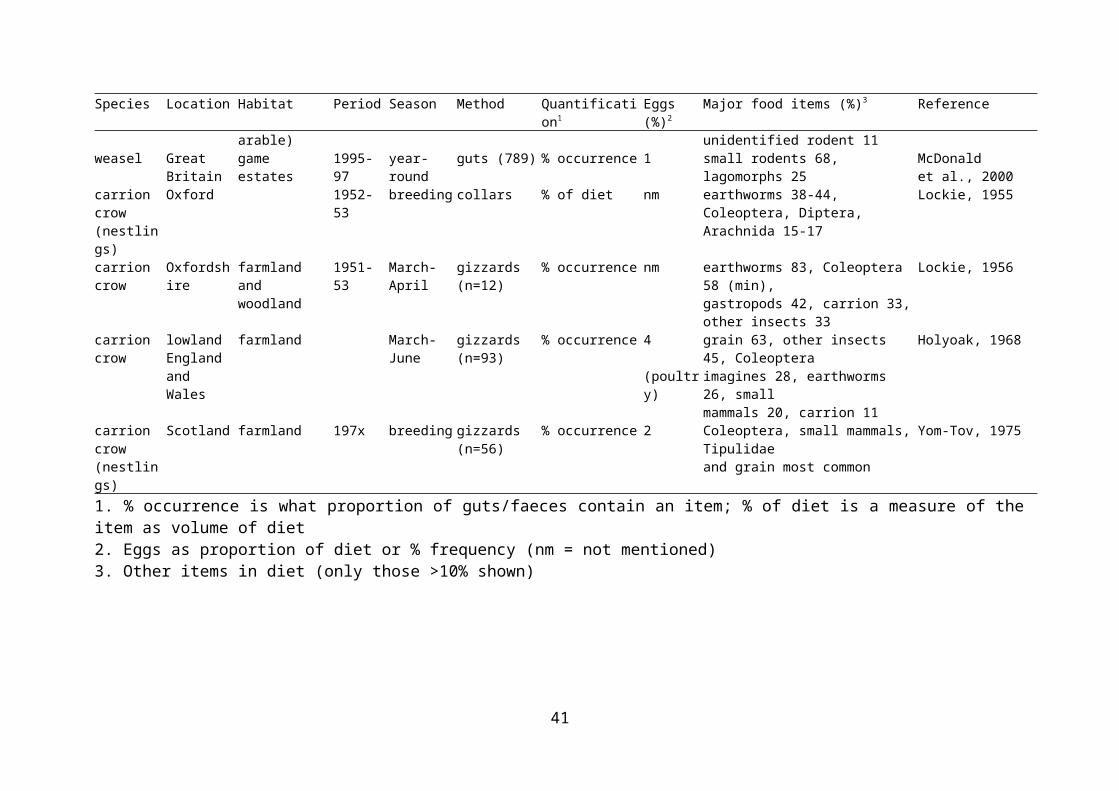
considerable time looking for the remaining “larvae” (Croze, 1970). Crows also tended to return to the place of finding the last prey when removing prey for caching.
The experiments on crow image forming also showed that crows were able to quickly develop a search image for novel prey (Croze, 1970). If nest density were extremely high they could possibly learn to switch to searching for eggs (this also provides a plausible explanation for the high corvid predation rates on artificial nests).
2.7 Factors affecting the rates of nest predation
Nest predation may be affected by various factors related to predator and prey behaviour and ecology, and the nature of the habitat. Below we discuss what we consider are potentially the most important influences. The effects of various factors on wader nest predation are summarised in Table 2.7.
2.7.1 Nest density
Wader nest density is a trade off between the benefits of closer spacing (better nest defence, at least for some species), and the benefits of wider spacing (lower probability of discovery by a predator). Behaviour of adult birds may reduce predation, as has been noted in blackbirds (Weideinger, 2002). However, anti-predator actions such as nest placement may be ineffective if predation is incidental (Vickery, Hunter & Wells, 1992). The density of wader nests on wet grassland West Sedgemoor RSPB reserve was considered insufficient to make it worthwhile for crows to actively search for them, and nests were probably found by chance during other foraging activities (Bell & Chown, 1985).
There are benefits from nesting in aggregations, but only where anti-predator defence is effective. In meadows in the Czech Republic, lapwing nest predation was negatively related to nest density, but positively related to nest clumping (nest density and clumping were negatively correlated)) (Šálek & Šmilauer, 2002). Distance to nearest neighbour did not explain variation in nest predation rates, but large aggregations of nests (>9 nests) suffered lower predation rates than small aggregations or solitary nests. Lapwing defend their nests, and nest in open country, away from the perches of potential predators. Curlew also mob crows, once the chicks hatch (Berg, 1992), and black-tailed godwit were able to successfully exclude avian predators from the vicinity of their nests at the Ouse Washes, although lapwing were not (Green, Hirons & Kirby, 1990). Lapwing in Swedish mixed farmland (including some seasonally flooded meadows) had a significantly lower daily nest predation rate when nesting in colonies than solitarily (Berg, 1996). Avocet defence was generally successful against avian predators in the Wadden Sea of Germany (salt marsh, mudflats and wet grassland); marsh harriers and gulls took some eggs, but didn’t cause mass mortality, whereas when a fox visited a colony, all nests were taken (Hötker & Segebade, 2000). Species that have been reduced by other factors may be more susceptible to predation if their ability to communally defend their nests and eggs from predators is affected (Wilson, Ausden & Milsom, 2004).
In Scottish farmland, lapwings largely prevented carrion crows from approaching nest sites by anti-predator behaviour (mobbing, diving and striking) (Elliot, 1985). Anti-predator behaviour was more effective where the nest territories overlapped or were aggregated. Crows often foraged close to fencelines, to provide cover from lapwing attacks. Nevertheless, six of ten nests were taken by crows, and another by an unknown predator. Lapwing nest density was negatively related to daily nest predation rate in wet meadows in North Yorkshire; the number
42
of lapwing nests within 100 m explained 77.7% of the variation in probability of nest surviving predation (Seymour et al., 2003). Crows were thought to be the most important predators of lapwing nests, even though foxes were present in small numbers, and nest success was generally high. Communal defence is thought to be less successful against mammalian predators, because mammals forage nocturnally, when mobbing behaviour may be less effective (Elliot, 1982). Lapwing nest density was negatively related to predation rates on farmland in Sweden, but it was noted that fox abundance was low, and corvids were thought to be the major nest predators (Berg, Lindberg & Kallebrink, 1992).
Nest predation should vary negatively with nest density when nest predators are avian, as communal defence is more effective. Low nest density was proposed as a possible reason for high predation rates of curlew in a mixed farmland and forest landscape in Finland; predation rates were lower in a landscape with higher nest density (but also with lower predator density) (Valkama, Currie & Korpimäki, 1999). Successful black-tailed godwit nests on a Swedish coastal grazed meadow were more clustered than those that were predated (Johansson, 2001). Distance to neighbouring nests did not explain variation in lapwing nest predation rates in German wet grassland (Bellebaum & Bock, unpub. data) or in Welsh farmland (Sharpe, 2006). However, in upland grassland in Wales, the number of lapwing nests within 200 m were the strongest predictor of nest failure (from all causes, but predation was the major cause) (O'Brien, 2001).
Nest density (measured as number of nest days per week) of four wader species (lapwing, godwit, oystercatcher and redshank) explained variation in nest predation rates in lapwing and redshank (for no species did density of their own nests explain a significant amount of variation) (Beintema & Müskens, 1987). Godwit nest density contributed significantly to lapwing nest predation rates, and godwit and oystercatcher contributed significantly to redshank nest predation rates.
43
Table 2.7 Relationships between predictor variables and wader nest predation in wet grassland and similar habitats.
Species Location Habitat Year(s) Predictor(s)1 Non-significant variables Referenceblack-tailed godwit Sweden coastal meadow
(island)1996-00 clustered < dispersed**;
distance from perches (-)*nest concealment Johansson, 2001
black-tailed godwit Netherlands wet grassland 1974-83 vole density* (3 levels): 1>2 and 3; nest period* (laying > incubation)
nest density Beintema and Muskens, 1987
black-tailed godwit and lapwing
southern England
wet grassland 1984 nesting colony** (godwit colony < lapwing colony and no colony)
Green et al., 1990
curlew Sweden mixed farmland 1987-89 distance to forest; distance to river/ditch; time in season
Berg, 1992; Berg, 1996
curlew Finland mixed farmland 1995-97 % forest cover (between sites) distance to: road, forest edge, ditch, other habitat, perch; other wader nest within 100 m; kestrel nest within 500 m; nest habitat
Valkama et al., 1999
curlew Northern Ireland grassland, moorland 1993-95 nest period (laying > incubating)3; nest location*** (islands < shore)4
vegetation height around nest; cattle in nest field
Grant et al., 1999
lapwing Shropshire/Cambridgeshire
mixed farmland 1999-00 crop type** (grass > other); distance to predator perches** (-)5
Sheldon, 2002
lapwing Wales mixed farmland 2003-04 laying date* (+); distance to field boundary* (-); incubation period*** (hatching > incubating)
colony size; distance to perch; distance to nearest neighbour
Sharpe, 2006
lapwing Germany dry and wet polders
1997-02 laying date; field type; distance to nearest neighbour, perch, fox den
Bellebaum and Bock, unpub. data
lapwing Scotland unimproved hill grassland
1984-86 distance to nearest nest; nests within 100 m
Galbraith, 1988
lapwing Kent coastal grazing marsh
1995-97 grazing regime (grazed vs ungrazed)
Hart et al., 2002
lapwing Czech Republic meadow 1988-98 nest density** (-); nest aggregation* (-); clumping index* (+)
Šálek and Šmilauer, 2002
44
Species Location Habitat Year(s) Predictor(s)1 Non-significant variables Referencelapwing Sweden mixed farmland 1986-90 solitary > aggregated nests*;
distance to nearest tree* (-) ; number of nests within 100 m*** (-); total number of nests in colony* (-)
distance to forest edge Berg, 1996; Berg et al., 19922
lapwing North Yorkshire wet meadows 1996-98 nest density*** (-); site effect* distance to perch; distance to linear feature (p=0.051)
Seymour et al., 2003
lapwing Wales enclosed upland grassland
1985 & 1996
lapwing density** (-); distance to crow nest* (-)6
crow density Bain, 1987; O'Brien, 2001
lapwing northern Britain various upland habitats (32 sites)
1996 index of fox abundance* (+); % arable (-); % improved gl with rushes (-), % improved gl no rushes (-), Easting (+), % bog (+)
indices of abundance of other predators (cat, stoat, crow, common gull, buzzard)
O'Brien, 20017
lapwing Netherlands wet grassland 1974-83 vole density** (3 levels): 1 > 2 and 3; period* (laying > incubation); nest density of four wader species* (-)
grazing pressure (grazed vs ungrazed)
Beintema and Muskens, 1987
redshank Germany saltmarsh 2000-01 date of clutch initiation*; distance from shore*8
nest concealment; distance to perch; vegetation height at nest; lapwing nest density
Thyen and Exo, 2005
redshank Sweden coastal meadow 1999-00 year*** (2000>1999); incubation initiation date** (-)
Ottvall et al., 2005
redshank Netherlands wet grassland 1974-83 period* (laying > incubation); nest density of four wader species* (+)
vole density, grazing pressure (grazed vs ungrazed)
Beintema and Muskens, 1987
redshank eastern England grassland, saltmarsh 2003-05 time in season Smart, 2005
snipe southern England
wet grassland 1982-84 time in season** (-) vegetation height Green, 1988
1. * = p < 0.05, ** = p < 0.01, *** = p < 0.001. + or – relates to predation rate. Studies may have employed more than one analysis to determine significance of variables.2. Two studies conducted in the same area, overlapping in time, but with different analyses. 3. Significant in 2 of 3 years at one site, and 2 of 2 years at other site.4. At one site only. 5. Highly correlated with distance to field boundary. 6. Result not repeated across multiple sites. 7. Three models fitted, and land cover variables were significant in the following number of models: % arable (3), % improved gl (grassland) with rushes (2), % improved gl without rushes (1), % bog (1), Easting (1). Predators indices modelled separately. 8. Distance to shore no significant for logistic regression of predation rates, but predated nests further from nests than non-predated in t-tests.
45

2.7.2 Habitat
Nest predation rates may be independent of habitat variation, but it seems likely that there will frequently be an interaction between the two. Habitat may affect rates of nest predation in several ways. It affects predator density, most obviously at the landscape scale, where predator density is highest where broad habitat is most suitable, but also at the local scale. For example, it was suggested that in suburban Melbourne, Australia, the removal of safe diurnal resting sites (consisting of blackberries Rubus fruticosus and gorse Ulex europaeus) would increase fox home range size and therefore reduce fox density (White, undated). In German wet grassland, it was suggested that removal of raised ground that could act as den sites would reduce fox density (Bellebaum, 2002).
Habitat also affects the location and nature of wader nests, and it affects predators’ behaviour and ability to detect nests. However, where nest predation is incidental to other foraging behaviour of predators, habitat features may have very little impact on predation rates. This was suggested as the reason that no relationship was found between nest predation (mostly by skunks) and vegetation structure or proximity to other habitat in grassland in Maine, USA (Vickery, Hunter & Wells, 1992). Habitat may interact with nest defence in those species with anti-predator behaviours. A review of the effect of habitat structure on bird predation risk considered that lapwings might be less able to defend their nests in longer swards, as they are less able to detect predators (Whittingham and Evans, 2004). Other ways that they suggested habitat could affect predation include: more crowded nesting where suitable habitat has declined in extent; changes to nest concealment; adults foraging further from nest where there is less food due to habitat changes; and changes to the timing and length of breeding season.
While waders other than lapwing tend to select micro-habitat that provides greater concealment than that generally available, there is often no relationship between nest concealment and predation rates: this has been observed in for several species in grassland or similar habitats, including curlew in Northern Ireland (Grant et al., 1999), redshank in Germany (Thyen & Exo, 2005), and Wilson’s Phalarope in Canada (Colwell, 1992). It has been suggested that the effect of nest concealment varies with the predator community; concealment is important where (visual) avian predators dominate, but is relatively ineffective against (aural/olfactory) mammals (Colwell, 1992). In upland grassland, improved pastures were more uniform and lacked the structural diversity of unimproved pastures, and lapwing eggs were thought to be more conspicuous to gulls and crows, which were considered to be the main nest predators (Baines, 1990). Nest predation (calculated as proportion of nests hatching) was higher on unimproved than improved pasture. By contrast, a study of lapwing breeding in a range of upland sites in Britain found that lapwing predation rates tended to be higher where the proportion of agriculturally improved habitats was low (O'Brien, 2001). In the Netherlands, an initial finding that predation was higher in grazed than ungrazed fields was not supported by a later study (Beintema & Müskens, 1987). Avocet and lapwing breeding densities in Klydesø Reserve, Denmark, were positively related to area grazed (oystercatcher numbers were negatively related) (Olsen & Schmidt, 2004a). This was possibly because reduced vegetation cover enabled nest-defending species to detect predators more successfully, although no relationship between habitat variables and predation rates was explored. Lapwing nest predation was higher (although not significantly) in grazed than ungrazed coastal marshes in Kent; it was speculated that the presence of stock increased disturbance of incubating birds, thus increasing the risk of predation (Hart et al., 2002).
Nest predation may also be affected by proximity to habitat features, such as perches, trees, or field boundaries, although again the evidence is mixed. Redshank nesting success in Swedish
46
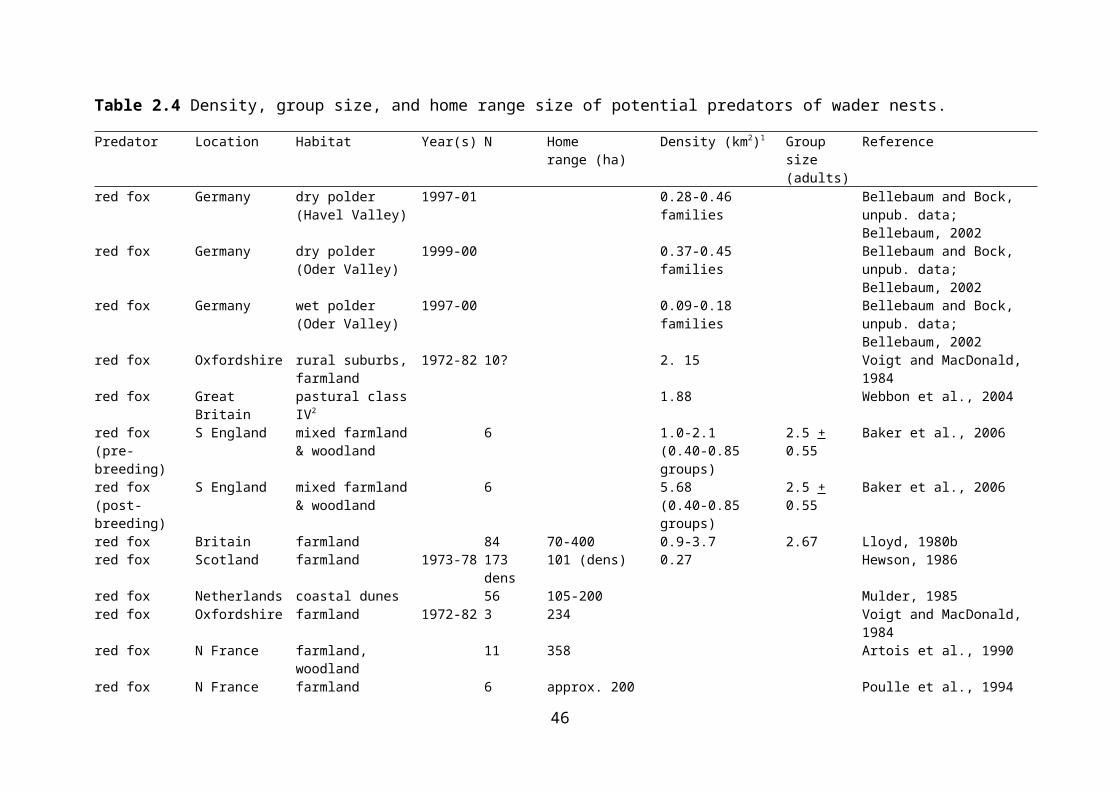
coastal meadows could not be explained by distance to habitat edges or other features used by predators (Ottvall, Larsson & Smith, 2005). On seasonally flooded hay meadows in northern England, distance from possible perches did not affect nest survival: nests further than 20 m from linear features or habitat edges were more likely to survive, but this was confounded with site (Seymour, 1999). There was no effect of proximity to forest edge on curlew and lapwing nest predation rates in Swedish mixed farmland, although very few lapwing nests were located close to forest edges (Berg, 1996). While curlew nests were located further from forest edges (but not from rivers/ditches) than expected from a random distribution, there was no difference in nest survival according to distance from either forest edges or rivers/ditches (Berg, 1992). A study in the same area did find that predation rates on lapwing nests were higher for those located within 50 m of the nearest tree (Berg, Lindberg & Kallebrink, 1992). This effect was more pronounced in grassland compared with other habitats. Corvids were suspected to be the main predators, and the presence of plentiful perches within the farmed landscape may have diluted the effect of proximity to forest edges. Attacks by corvids further from perches might be less effective because: more of the attacks can be beaten off by the lapwings in the air and outside the territory; the duration of attacks is shorter; crows need a longer flying time for each attack; crows alight on the ground less often; crows cannot alight in trees and bushes (where they are seldom attacked by lapwings) (Klomp, 1954).
Successful black-tailed godwit nests on a Swedish grazing meadow were located further from potential predator perches than were predated nests, although vegetation variables at the nest site did not differ (Johansson, 2001). A similar result was obtained for lapwing nests in farmland (predominantly arable, but including some grassland habitat), with nest predation increasing with proximity to predator perches (which was strongly correlated with distance to field boundary) (Sheldon, 2002). Nest failure (from all causes) increased markedly for nests that were less than 50 m from field boundary (also strongly correlated with distance to predator perch). Distance to nearest perch was not a significant predictor of lapwing nest predation in German wet grassland (Bellebaum & Bock, unpub. data), or in Welsh farmland (including rough grassland) (Sharpe, 2006). In both cases, mammals were found to be the major predators (determined by nest cameras or temperature loggers), and in the latter study, distance to field boundary was negatively related to nest predation rates. In a German saltmarsh, pairwise comparisons found that redshank nest survival (predation being the overwhelming cause of failure) was significantly higher for nests further from the shoreline (Thyen & Exo, 2005). It was also higher for nests where Elymus repens or Festuca rubra was the dominant plant species but neither of these was a significant predictor in a multiple logistic regression of daily nest survival.
In wet grassland in the UK, wader nest success appeared to be higher for nests that were further from crow nests, although this was not statistically tested, and overall hatching was used to make comparisons (Bell & Chown, 1985). Within 200 m of a crow’s nest, a wader nest had less than 30% chance of being successful, while further than 400 m from a nest, it was more than 80%. Lapwing nest success was positively related to distance from crow nest at one farmland/moorland site in Wales; however, this result was not repeated at eight other sites in northern Britain (O'Brien, 2001).
Elsewhere, habitat characteristics at the landscape scale have been found to affect nest predation rates. In two Finnish sites with different proportions of forest and farmland (including tillage, hay meadows and fallow land), curlew nest predation was significantly higher in the more forested site; while no measured habitat characteristics (such as distance to forest edge, ditch or perch) explained variation in predation risk at that site, the differences in landscape composition might explain the differences in nest predation between the sites
47
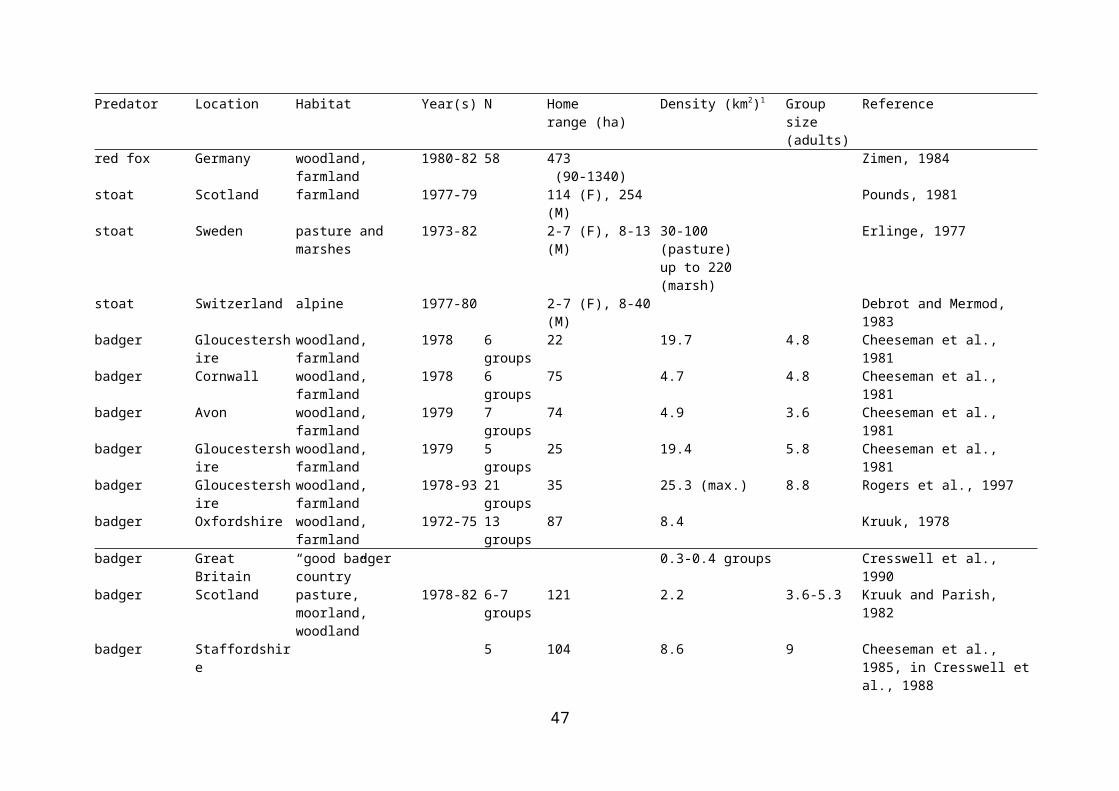
(Valkama, Currie & Korpimäki, 1999). Field (or foraging patch) area may affect incidental predation rates, as in small fields predator routes are more likely to be close to nests, because the predator has a greater chance of spending more time in already depleted areas, and because time constraints may limit the total time available for searching a patch (Seymour, Harris & White, 2004). In North American prairies, foxes foraged preferentially in pasture where it was more common in the landscape, reducing their foraging effort in vegetation that provided cover for nesting ducks; nest success of ducks was significantly higher in landscapes with a greater grassland component (Phillips et al., 2003).
2.7.3 Predator density
The predator community may affect prey density. In Belarusian wetlands, introduced American mink (Mustela vison) have been associated with declines in water vole (Arvicola terrestris) populations (Macdonald et al., 2002). Higher predator density should increase predation pressure, and there is some evidence that this is the case for predation of wader nests. Higher density of mammalian predators (notably foxes and corvids) was proposed as a possible cause of higher curlew nest predation rates at a mixed forest/farmland site in Finland (compared with a less forested site) (Valkama, Currie & Korpimäki, 1999). On shore and island nesting locations in the Wadden Sea coast of Germany, Avocet Recurvirostra avosetta hatching success was related to abundance of red foxes, but not to abundance of avian predators (marsh harriers and gulls) (Hötker & Segebade, 2000). At these sites predation was the overwhelming cause of nest failure; in saltmarshes flooding was the major cause, and there was no relationship between hatching success and predator densities. In wet grassland at the West Sedgemoor RSPB reserve, waders nesting in areas that held reasonable numbers of non-breeding crows appeared to be less successful (7 of 8 nests failed, as opposed to 50% over the whole area) (Bell & Chown, 1985). While lapwing nest survival (all causes) was negatively related to proximity to crow nests in enclosed upland grassland in Wales, an increase in crow density between 1985-86 and 1996 did not lead to a higher rate of nest failure in the study area, (O'Brien, 2001). Daily predation rate was positively related to an index of fox numbers, and the fox index was also higher at sites where lapwing populations had declined (although there was no relationship between predation rates and whether lapwing populations had declined) (O'Brien, 2001).
Removal of one predator may be compensated either by re-colonisation of the same or another predator species . Removal of corvids and of mink (known to be major duck nest predators) from a Latvian lake, did not reduce overall nest predation, and in fact removal of mink led to an increase in nest predation by marsh harriers, the other major nest predators (Opermanis, Mednis & Bauga, 2005). Removal of crows and gulls in Scottish moorland reduced the frequency of their sightings (Parr, 1993). However, the lower density of avian predators did not improve golden plover breeding success, as foxes (which were not controlled) were thought to increase in importance as predators. Nesting success was generally higher for lapwing, curlew and redshank, but did not significantly increase breeding populations. In German wet grassland foxes are a major predator of lapwing nests (Bellebaum, 2002). Fox density was very low in regularly flooded areas, but here the proportion of nest losses through mustelids was much higher (Bellebaum & Bock, unpub. data). Therefore, control of foxes was thought not to be able to improve reproduction of meadow birds, due to predation from other sources. If nest predation is incidental, predator behaviour is likely to be more important than predator density. For example, in North Yorkshire wet meadows, fox search effort in lapwing nesting sites averaged only 57 sec/ha per visit, which would not be expected to give high encounter rates (Seymour et al., 2003).
48
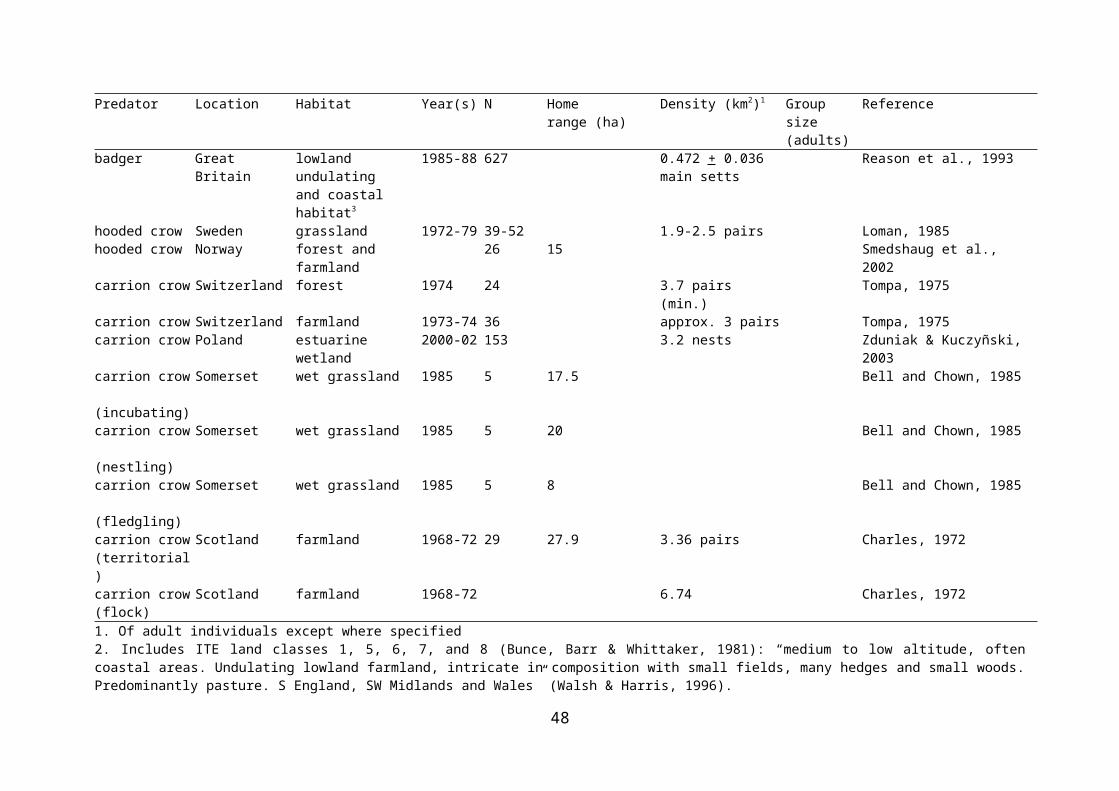
2.7.4 Abundance of alternative food
We have established that it is unlikely that wader nests are a targeted food source of most nest predators, and even in rare cases where they are, they can form only a small part of the diet. Therefore, alternative food must be available for nest predators, and this food may affect the abundance of predators and/or their behaviour. There are several theoretical ways in which nest predation could be affected by abundance of alternative food:
(i) Predator density responds to abundance of alternative food, as does the likelihood of nests being encountered during foraging
(ii) More alternative food does not lead to increased predator density (due to behaviour or other limiting resources), predators need to search smaller areas and are less likely to encounter nests during foraging
(iii) Less alternative food causes predators to actively search for nests, increasing predation pressure.
We discuss the effect of alternative food on the predation pressure of wader nests with particular reference to mammalian predators and small mammal (chiefly vole) prey, because there is more information on this than on other alternative food.
Field voles are most abundant in long grass; spring rolling, intensive grazing and cutting for silage can render leys unsuitable (Tapper, 1979). Density can vary from 12 to more than 500 per hectare, the equivalent of 0.25-10 kg/ha (Lloyd, 1980b). In Poland, vole density in cultivated fields varied seasonally (being low in winter), and annually, reaching 300/ha in summer and autumn of 1971, compared with less than 20/ha in summer and autumn of 1970 (Goszczynski, 1974). Even moderate grazing affects vegetative cover, and thus may be expected to influence the mammal community, and in lowland wet grassland, livestock grazing is a common management practice. In Danish wet grassland, increased grazing intensity had a negative effect on small mammals (in particular field vole Microtus agrestis) (Schmidt et al., 2005). Intensive grazing, whether by cattle or sheep, reduced small mammal biomass and field vole abundance. However, intermediate grazing by sheep (approximately 400 kg/ha maximum livestock biomass) sustained small mammal biomass and field vole abundance at levels similar to (or even higher than) ungrazed areas. Intermediate grazing pressure may create patches of high, dense vegetation in the vicinity of regrowing grass, which is beneficial to small herbivorous mammals. In a Danish coastal meadow, grazed areas held fewer small mammals than ungrazed areas, although the variation was high (Schmidt & Olsen, 2003). Mammals were caught almost exclusively in patches of high, dense vegetation, which are removed by heavy grazing. Reduction of cover by grazing appears to be the most important effect, as it increases predation risk. Edge habitats are probably important, as dominant female meadow voles in North America selected higher quality edge habitats, and reproduced more frequently (Bowers et al., 1996).
In North American grasslands, the structure and productivity of small mammal communities was strongly affected by grazing regime in tall grasslands (grazed sites supported only 24% of the small mammal biomass of ungrazed sites), whereas in short grasslands, grazing had no effect on biomass, as small mammals are already at low densities (Grant et al., 1982). In Ohio grassland, meadow vole Microtus pennsylvanicus abundance and adult female survival were significantly lower in plots experimentally manipulated to reduce cover (vegetation was maintained at a height of around 50 cm) than in control plots, even though reduced-cover
49

plots had a significantly higher biomass of high quality forage species (Peles & Barrett, 1996).
Predators must switch to alternative prey, or perish, when preferred mammalian prey is scarce. There is evidence from habitats other than wet grassland that predation on birds and/or nests increases in such circumstances. Fox consumption of birds in Polish farmland was observed to be higher in years of low vole abundance (Goszczynski, 1974). In Finnish alpine heath over the period 1969-1987, predation (mostly by stoats and weasels) of redstart nests was high in years following small rodent (chiefly grey-sided vole Clethrionomys rufocanus) peak abundance, and breeding density of other birds was significantly correlated with June density of rodents in the period 1979-1986 (Järvinen, 1990). On Sussex farmland, birds were the major alternative prey for weasels when vole numbers were low (Tapper, 1979). The proportions of lagomorphs and other rodents eaten by weasels were independent of vole density, but for birds/eggs combined there was an inverse relationship. Egg predation of greater snow Anser caerulescens atlanticus goose in the Canadian high Arctic (by Arctic foxes Alopex lagopus, parasitic jaegers Stercorarius parasiticus, glaucous gulls Larus hyperboreus and common raven) varied 2-7-fold, and was lowest during peak lemming (Lemmus sibiricus and Dicrostonyx groenlandicus) years, and predator activity in the goose colony were highest 2 and 3 years following lemming peaks (Bêty et al., 2002). Predation of black grouse nests in Swedish boreal forest was inversely related to vole abundance (Angelstam, Lindström & Widén, 1984).
Voles, even at relatively low density can produce sufficient young that predation does not affect their populations, but where vole populations fall dramatically, which may be for other reasons, such as severe winters or flooding, predators such as foxes may seek alternative prey (Baker & Harris, 2003), possibly including nests. In Dutch wet grasslands, lapwing and black-tailed godwit nest predation rates varied between regions and years, and annual predation rates were negatively correlated with vole Microtus arvalis densities (there was no effect on redshank and oystercatcher predation rates) (Beintema & Müskens, 1987). It was suggested that in years following a collapse of vole populations, ground predators switched more to nests, and the effects were strongest on early nesters (lapwing and godwit).
By contrast, increased abundance of voles on a wet grassland reserve, where the intensity of management had reduced in comparison to a neighbouring intensively managed polder on a reserve in Germany, as well as increased amphibian abundance associated with high water levels, was suggested as a possible explanation for high predation rates on lapwing nests (Köster & Bruns, 2003). The lapwing population declined sharply on the reserve, but not on a neighbouring, intensively managed polder, and increased predator density in response to increaseed prey abundance was thought to be a possible cause: changes to vegetation on the reserve that shortened the breeding season or reduced suitability for breeding due to higher water levels were other potential explanations for the observed patterns. In New Zealand forest habitat, increased abundance of alternative prey has been shown to increase predation on birds, as stoats responded to the increased food supply by increasing in numbers (King, 1983, cited in McDonald, Webbon & Harris, 2000). In the Tipperne Nature Reserve in Denmark, reducing small mammal abundance by the use of winter flooding as a management tool has been suggested as a means of reducing mammalian predator abundance, thus also reducing nest predation (Thorup, 1998). Nature reserves may provide extra alternative prey as a result of management for conservation, and this may attract predators into the area, increasing the rate of incidental predation (Seymour, Harris & White, 2004; Vickery, Hunter & Wells, 1992).
50
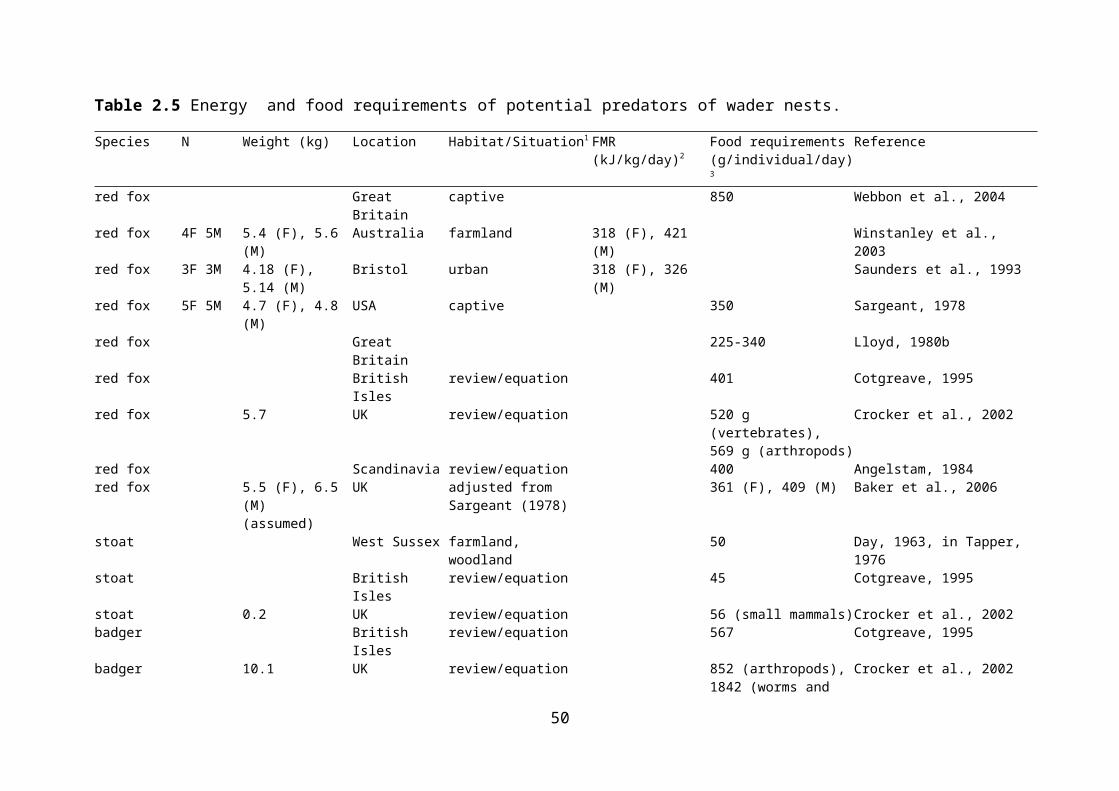
Habitat and the abundance of alternative prey may combine to affect nest predation in complex ways. For example, it has been suggested that in the Thames catchment the distribution of American mink, which prey on coot and moorhen nests (and water voles), may be determined by the abundance of rabbits, which in turn may be affected by raptor predation (Macdonald et al., 1999).
2.8 Conclusions
2.8.1 Levels of nest predation
The majority of empirical studies of nest survival of wet grassland waders have found that predation is the principal cause of nest failure and some studies have found that nest predation rates are so high that without immigration population decline is inevitable, even if chick survival rates were high. Of more concern, the majority of recent studies report losses of more than 50% of nests to predation, which are likely to be associated with declining populations, given average chick survival rates. Of those studies where productivity (number of chicks reared to fledging) was measured, few have reported levels of productivity high enough to maintain a stable population in the last decade, in contrast to the small number of studies conducted in the 1980s, where levels of productivity were higher.
In demographic terms, chick survival is usually likely to be the more important life-history parameter, since early-season nest losses are frequently compensated by the laying of a replacement clutch, whereas renesting following chick loss is rare for some species. Most studies of wader breeding success focus on nest survival and causes of nest failure, since this parameter is more readily quantified in the field: detemination of chick survival rates usually requires more intensive and expensive field methods and unbiassed assessment of the identity of predators of wader chicks is particularly problematic. Future research into chick survival would clearly be of considerable value and in the current absence of such information for UK wet grassland habitats, an examination of nest predation, and associated factors, provides the best approach. Despite these weaknesses, the empirical evidence above suggests that nest predation may have increased in recent years and contributes to reduced productivity of waders in wet grassland.
2.8.2 Key predators of wader nests
Evidence obtained using a wide range of methods, from direct observations, through to remote cameras, indicate a wide range of predators of wader nests in wet grassland, some of which may not be immediately obvious, such as sheep (Pennington, 1992). Predators of nests may vary greatly between sites, even where habitat and management appear to be the same (Grant et al., 1999). However, while the range of predators is great, there is growing evidence from remote monitoring devices, where bias is minimised, that in many situations in UK, the majority of predation occurs at night and is therefore attributable to mammalian species. Massive deployment of nest cameras in the Netherlands found a similar predominance of mammalian predators, with foxes responsible for at least 90% of mammalian predation at three of four sites where predation rates were high (Teunissen, Schekkerman & Willems, 2005). Avian predators had minimal impact at five of six sites. Within UK, where detailed information is sparse, we consider that most important predators on lowland wet grassland sites will include fox, badger, mustelids and corvids, and we concentrate on these species.
51
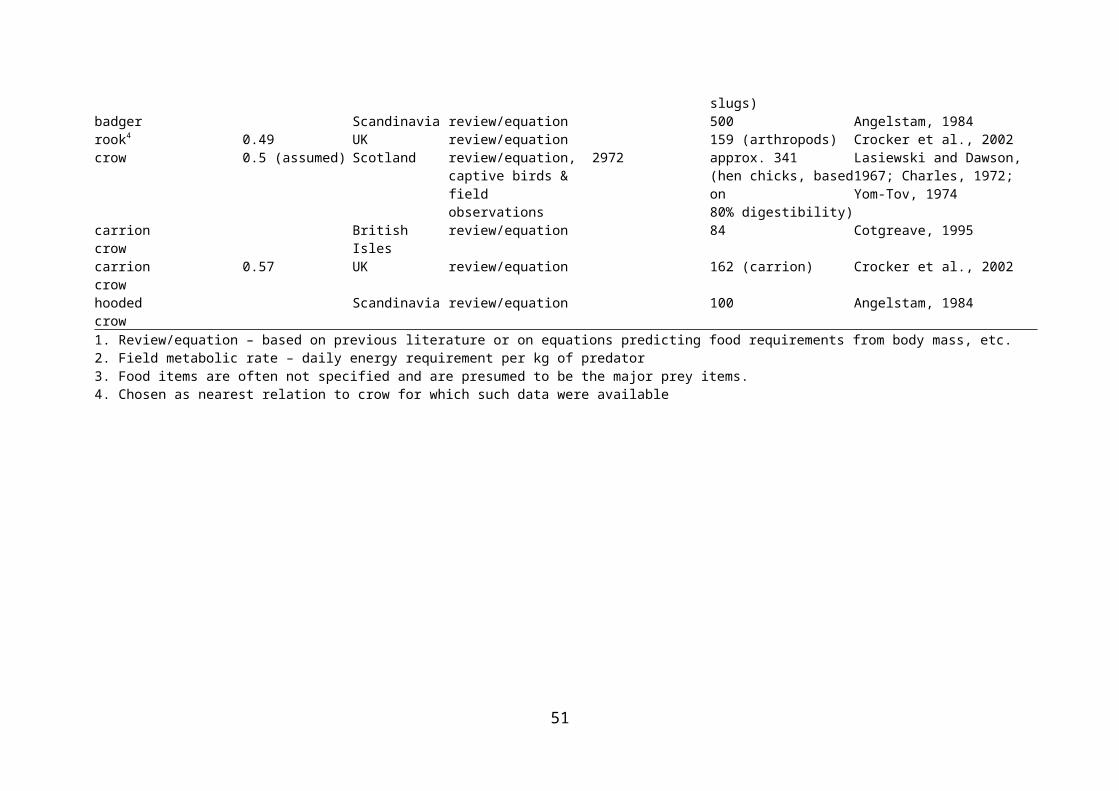
2.8.3 Foraging behaviour of key predators
All the likely key predators of wader eggs on lowland wet grassland habitats are generalist predators (in the sense that none are specialist predators on waders), and for all key predators, wader eggs form a tiny proportion of their diet.
2.8.3.1 FOX
Foxes have a very broad diet, reflecting variation in food availability. Mammals (principally rabbits and voles) generally form the majority of the diet, but at certain times of the year invertebrates such as earthworms can comprise as much as 60% of the calorific intake. Studies of fox foraging behaviour indicate that wader eggs are taken opportunistically as they are encountered when foxes are searching for other prey, and that foxes have poor ability to detect clutches at distances of greater than a few metres, unless the eggs are close to hatching and the chicks are calling from within the eggs. Some studies have found an increase in nest predation rates as clutches approach hatching, which is likely to reflect increased detectability by mammalian predators.
2.8.3.2 STOAT
The distribution and density of mustelids is strongly influenced by the availability of den sites and prey availability. Stoats frequently occur at high density in wet grassland habitats where lagomorphs and small rodents, the most important components of the diet of stoats, are often abundant.
2.8.3.3 BADGER
Earthworms are the most important dietary component of Badgers in the UK, but they will switch to other prey, such as vertebrates, insects and cereals, when earthworms are not available. Badgers take earthworms when they emerge on the surface, which is conditioned by temperature and humidity. Since earthworms are also an important component of the diet of some wader species (particularly snipe and lapwing), habitat management by conservation managers to improve the availability of earthworms for waders may also encourage greater use of wader field by foraging badgers and consequently lead to greater encounter rates between badgers and wader nests.
2.8.3.4 CARRION/HOODED CROW
Crows are extremely versatile generalist predators, taking a wide range of food types depending on local availability. The importance of birds’ eggs in the diet of crows is difficult to assess from gut analysis, since crows consume little of the egg shell and egg contents are rapidly digested. It is generally believed that crows use high vantage points from which to locate wader nests, but such behaviour may rather be used to check on predators of their own nest and territory intruders. Crows can also locate nests while flying over areas, or while foraging for other items such as tipulid larvae. Several studies have shown a relationship between the predation rate of crows on nests of ground-nesting birds (waders, Ptarmigan) and the distance to the nearest crow nest. There are several lines of evidence to suggest that only territorial crows are significant predators of wader eggs. Experiments have demonstrated that crows can rapidly develop a search image for novel prey and consequently could learn to switch to wader clutches where they occur at high density. This response may also explain why experiments with artificial clutches at high density may often yield misleading results.
52

2.8.4 Correlates of nest predation rates
The most consistent correlates of wader predation rates are the distance of the nest from the field edge (higher predation rates close to the field boundary) and lapwing nesting density (lower predation rates on nests occurring at higher density). A plausible underlying causal mechanism for the former is clear, since many predator species will preferentially use the field margins for foraging, or simply follow field boundaries as they navigate the landscape. Chance encounters with nests close to the field edge are therefore likely to be higher than for nests away from the field boundary. A possible causal relationship for the second correlative relationship is more intriguing, since it is a widespread finding, and such a relationship has been found in some studies where remote nest monitoring indicated most predation occurred at night. The effectiveness of mobbing behaviour against avian predators during the daytime has been well demonstrated but these findings imply that when nesting at high densities, waders such as lapwing may be effective at deterring nocturnal mammalian predators. There is some evidence from night-time observations of mobbing behaviour of foxes by lapwing to support this. An alternative explanation is that waders settle to breed at higher local densities in those fields/areas where predator activity is lower. There is some evidence to support this hypothesis also, since lapwing breeding densities have been shown to increase from one year to the next in response to the onset of predator control measures (Bolton et al., in press), which appears to be a behavioural response by lapwing settling to breed at higher densities as predator densities decline. Clearly these two hypotheses are not mutually exclusive.
Other correlates of nest predation rates that have been identified less consistently in studies are the degree of nest concealment and the distance to a predator perch or crow nest. Clearly the importance of such variables in determining nest predation rates will depend on the level of activity of certain predator species or class of predators. Nest concealment can only be of value in minimising predator by species that locate their prey visually (i.e. avian predators) and will offer very limited protection against nocturnal mammalian predators.
In addition to the behavioural (functional) response of predators to the variables discussed above, factors which affect the density of predators (the numerical response) can also influence nest predation rates. Clearly, habitat changes that result in a numerical decrease in predators are likely to reduce nest predation rates, provided they do not result in a compensatory increase in density or activity of another predator species. Such habitat management would include the removal of nesting trees or scrub for corvids, removal of den sites (e.g. wooded copses, earth banks) for foxes, and measures such as prolonged flooding to reduce the main prey source of such predators.
Since the key predators of wader nests are all dietary generalists that principally forage on other prey (simply taking wader eggs opportunistically), the availability of the main prey items can affect predation rates on breeding waders in a variety of ways, via either a functional or numerical response. Firstly, increases in the main prey can result in an increase in predator densities, resulting in higher incidental predation on wader nests. Secondly, if predator density is limited by factors other than the availability of the main prey type (such as availability of den or nest sites), an increase in the main prey can result in a reduced impact on breeding waders as predators search smaller areas to meet their daily food requirements, and are therefore less likely to encounter wader nests. The reverse case, in extreme situations, could potentially result in predators targeting wader nests when availability of their main prey types is low.
53

2.8.5 Knowledge gaps
1. Identity of nest predators
Unbiased data on the identity of nest predators, obtained using remote devices such as nest cameras, are currently scarce. However, recent developments in digital technology have greatly simplified the collection of such data and more work is now needed to increase the number of sites and years for which data are available.
2. Chick survival rates and identity of chick predators
To date, research efforts have focused on predation of wader nests, rather than chicks, since nest predation is more amenable to field study. Collection of data on chick survival rates and causes of mortality is costly and labour-intensive. Consequently there is little information available on rates of chick survival, and the relative contribution of different predator species to chick mortality. In demographic terms, chick survival is likely to be an important component of annual productivity (and therefore population trends), and more data are required on predation of chicks.
3. Foraging behaviour of key predator species
This review has highlighted the key predator species of wader nests and identified the need to determine the key predators of wader chicks, and assess their level of impact assessment in population terms. To identify habitat manipulations likely to reduce the impact of such predators, a greater understanding of their foraging behaviour is required. Such work would focus initially on habitat use by foxes and badgers and any other species consistently found to be important predators of wader chicks. Data on predator foraging behaviour should be used to parameterise individual-based foraging models to conduct virtual experiments to assess the effectiveness of habitat manipulations to reduce impacts on waders.
4. Regulation of predator densities
The approaches described above rely on habitat management to influence predator foraging behaviour via a functional response. Additionally or alternatively, habitat manipulations may be employed to reduce predator densities, by reducing availablility of main prey species and/or suitable den/nesting sites. Little is currently known about the factors limiting densities of key predators on wet grassland habitats, such as winter food availability, or availibity of breeding sites and work should be undertaken to address this.
5. Causal mechanisms of observed relationship between nest density and predation rates
Analysis of RSPB data carried out under this contract revealed a negative relationship between lapwing nest predation rate and nesting density. Such a relationship has been described in similar studies and suggests possibilities for habitat management to manipulate breeding density and therefore reduce predation rates. However, the underlying causal mechanism for the relationship remains unclear, and may simply reflect a preference for nesting in areas of low predator density. Further work is needed to understand the mechanism underlying the observed relationship and assess the utility of such habitat manipulations.
2.9 Acknowledgements
We are very grateful to Jochen Bellebaum for his valuable comments on the literature review.
54
2.10 References
Angelstam, P., Lindström, E. & Widén, P. (1984) Role of predation in short-term population fluctuations of some birds and mammals in Fennoscandia. Oecologia, 62, 199-208.
Artois, M., Aubert, M. & Stahl, P. (1990) Organisation spatiale du renard roux (Vulpes vulpes L. 1758) en zone d'enzootie de rage en Lorraine. Revue d'Écologie (La Terre et la Vie), 45, 113-34.
Baglione, V., Marcos, J.M. & Canestrari, D. (2002) Cooperatively breeding groups of carrion crow (Corvus corone corone) in northern Spain. The Auk, 119, 790-99.
Baines, D. (1990) The roles of predation, food and agricultural practice in determining the breeding success of the lapwing (Vanellus vanellus) on upland grasslands. Journal of Animal Ecology, 59, 915-29.
Baker, P.J., Furlong, M., Southern, S. & Harris, S. (2006) The potential impact of red fox Vulpes vulpes predation in agricultural landscapes in lowland Britain. Wildlife Biology, 12, 39-50.
Baker, P.J. & Harris, S. (2003). A review of the diet of foxes in rural Britain and a preliminary assessment of their impact as a predator. In Conservation and conflict: mammals and farming in Britain (eds F. Tattersall & W. Manley), Vol. 4, pp. 120-40. Linnean Society Occasional Publications.
Beintema, A.J. & Müskens, G.J.D.M. (1987) Nesting success of birds breeding in Dutch agricultural grasslands. Journal of Applied Ecology, 24, 743-58.
Bell, D. & Chown, D. (1985). Foraging activities of carrions crows (Corvus corone) at West Sedgemoor, Somerset 1985. In. RSPB, The Lodge, Sandy.
Bellebaum, J. (2002) Einfluss von Predatoren auf den Bruterfolg von Wiesenbrütern in Brandenburg (dissertation abstract). Journal of Ornithology, 143(143), 506-07.
Bellebaum, J. & Bock, C. (unpub. data) Breeding success of lapwings Vanellus vanellus in two German wetland reserves: stable numbers in spite of high predation rates.
Bellebaum, J. & Boschert, M. (2003) Bestimmung von Predatoren an Nestern von Wiesenlimikolen [In German with English summary: Determining predators at nests of meadow birds]. Vogelwelt, 124, 83-91.
Benstead, P.J., Cadbury, C.J., Evans, C.E., Hirons, G.J., Self, M. & Street, L. (1995). Lowland wet grassland management at West Sedgemoor RSPB Reserve. In. RSPB, The Lodge, Sandy.
Berg, Å. (1992) Factors affecting nest-site choice and reproductive success of curlews Numenius arquata on farmland. Ibis, 134, 44-51.
Berg, Å. (1996) Predation on artificial, solitary and aggregated wader nests on farmland. Oecologia, 107, 343-46.
55
Berg, Å., Lindberg, T. & Kallebrink, K.G. (1992) Hatching success of lapwings on farmland: differences between habitats and colonies of different sizes. Journal of Animal Ecology, 61, 469-76.
Berrow, S.D., Kelly, T.C. & Myers, A.A. (1992) The diet of coastal breeding hooded crows Corvus corone cornix. Ecography, 15, 337-46.
Bêty, J., Gauthier, G., Korpimäki, E. & Giroux, J.-F. (2002) Shared predators and indirect trophic interactions: lemming cycles and arctic-nesting geese. Journal of Animal Ecology, 71, 88-98.
Bluhdorn, I. (2002) Bestansentwicklung und Brutbiologie einer Kiebitzkolonie (Vanellus vanellus) während und Extensivierung in der Oberrheinebene. Naturschutz und Landscahftsplanung, 31, 51-57.
Bolton, M., Tyler, G., Smith, K.W. & Bamford, R. (in press) The impact of experimental fox and crow control on lapwing Vanellus vanellus breeding success on wet grassland nature reserves. Journal of Applied Ecology.
Boschert, M. (2005) Analysis of nest losses of the Eurasian Curlew Numenius arquata in the upper Rhine Valley of Baden - a comparison between results from 2000-2002 and former periods with focus on predation (in German with an English summary). Vogelwelt, 126, 321-32.
Bowers, M.A., Gregario, K., Brame, C.J., Matter, S.F. & Dooley, J.L. (1996) Use of space and habitats by meadow voles at the home range, patch and landscape scales. Oecologia, 105, 107-15.
Bradbury, K. (1974). The badger's diet. In Badgers of Yorkshire and Humberside (eds R.J. Paget & A.L.V. Middleton), pp. 113-25. Ebor, York.
Brickle, N.W., Harper, D.G.C., Aebischer, N.J. & Cockayne, S.H. (2000) Effects of agricultural intensification on the breeding success of corn buntings Milaria calandra. Journal of Applied Ecology, 37, 742-56.
Bunce, R.G.H., Barr, C.J. & Whittaker, H.A. (1981). Land classes in Great Britain: Preliminary Descriptions for Users of the Merlewood Method of Land Classification. In. Institute of Terrestrial Ecology, Grange over Sands, Cumbria.
Bureš, S. (1997) High common vole Microtus arvalis predation on ground-nesting bird eggs and nestlings. Ibis, 139, 173-74.
Cavallini, P. (1996) Variation in the social system of the red fox. Ethology Ecology and Evolution, 8, 323-42.
Cavallini, P. & Volpi, T. (1995) Biases in the analysis of the diet of the red fox Vulpes vulpes. Wildlife Biology, 1, 243-48.
Chamberlain, D.E. & Crick, H.P. (2003) Temporal and spatial associations in aspects of reproductive performance of lapwings Vanellus vanellus in the United Kingdom, 1962-99. Ardea, 91, 183-96.
56
Charles, J.K. (1972) Territorial behaviour and the limitation of population size in crows, Corvus corone and Corvus cornix, University of Aberdeen, Publisher.
Cheeseman, C.L., Jones, G.W., Gallagher, J. & Mallinson, P.J. (1981) The population structure, density and prevalence of tuberculosis (Mycobacterium bovis) in badgers (Meles meles) from four areas in south-west England. Journal of Applied Ecology, 18, 795-804.
Chylarecki, P., Matyjasek, P. & Gmitrzuk, K. (2006). Breeding success of waders in Bug and Narew valleys (East Poland). In Ökologie und Schutz von Wisenvögeln in Mitteleuropa (eds H. Düttman, R. Ehrnsberger & R. Akkermann), p 28. Hochschule Vechta, Vechtaer Fachdidaktische Forschungen und Berichte.
Colwell, M.A. (1992) Wilson's phalarope nest success is not influenced by vegetation concealment. The Condor, 94, 767-72.
Côté, I.M. & Sutherland, W.J. (1997) The effectiveness of removing predators to protect bird populations. Conservation Biology, 11(2), 395-405.
Cotgreave, P. (1995) Relative importance of avian groups in the diets of British and Irish predators. Bird Study, 42, 246-52.
Cresswell, P., Harris, S. & Jeffries, D.J. (1990). The history, distribution, status and habitat requirements of the badger in Britain. In. Nature Conservancy Council, Peterborough.
Crocker, D., Hart, A., Gurney, J. & McCoy, C. (2002). Methods for estimating daily food intake of wild birds and mammals. In. Central Science Laboratory ; DEFRA.
Croze, H. (1970) Searching image in carrion crows: hunting strategy in a predator and some anti=predator devices in camouflaged prey Verlag Paul Parey, Berlin.
da Silva, J., Woodroffe, R. & Macdonald, D.W. (1993) Habitat, food availability and group territoriality in the European badger, Meles meles. Oecologia, 95, 558-64.
Dargie, T.C. (1993). The distribution of lowland wet grassland in England. In English Nature Report Number 49. English Nature, Peterborough.
Day, M.G. (1968) Food habits of British stoats (Mustela erminea) and weasels (Mustela nivalis). Journal of Zoology, 155, 485-97.
Day, M.G. & Linn, I.J. (1972) Notes on the food of feral mink Mustela vison in England and Wales. Journal of Zoology, 167, 463-73.
Dekker, J.J.A., Stein, A. & Heitkönig, I.M.A. (2001) A spatial analysis of a population of red fox (Vulpes vulpes) in the Dutch coastal dune area. Journal of Zoology, 255, 505-10.
Elliot, R.D. (1982) Nesting dispersion of lapwings in relation to predation and anti-predator defence, University of Aberdeen.
Elliot, R.D. (1985) The exclusion of avian predators from aggregations of nesting lapwings (Vanellus vanellus). Animal Behaviour, 33, 308-14.
57
Erikstad, K.E., Blom, R. & Myrberget, S. (1982) Territorial hooded crows as predators on willow ptarmigan nests. Journal of Wildlife Management, 46, 109-14.
Erlinge, S. (1986) Specialists and generalists among the mustelids. Lutra, 29, 5-11.
Erlinge, S., Göransson, G., Högstedt, G., Liberg, O., Nilsson, I., Nilsson, T., v Schanz, T. & Sylvén, M. (1983) Predation regulating small rodent populations in Sweden. Oikos, 40, 36-52.
Ferrari, N. & Weber, J.-M. (1995) Influence of the abundance of food resources on the feeding habits of the red fox Vulpes vulpes, in western Switzerland. Journal of Zoology, 236, 117-29.
Frugis, S., Parmigiani, S., Parmigiani, E. & Pelloni, C. (1983) Field experiments on egg predation by hooded crows Corvus corone cornix. Avocetta, 7, 13-24.
Galbraith, H. (1988) Effects of agriculture on the breeding ecology of lapwings Vanellus vanellus. Journal of Applied Ecology, 25, 487-503.
Goszczynski, J. (1974) Studies on the food of foxes. Acta Theriologica, 21, 527-34.
Gough, M.C. & Rushton, S.P. (2000) The application of GIS-modelling to mustelid landscape ecology. Mammal Review, 30, 197-216.
Grant, M.C., Orsman, C., Easton, J., Lodge, C., Smith, M., Thompson, G., Rodwell, S. & Moore, N. (1999) Breeding success and causes of breeding failure of curlew Numenius arquata in Northern Ireland. Journal of Applied Ecology, 36, 59-74.
Grant, W.E., Birney, E.C., French, N.R. & Swift, D.M. (1982) Structure and productivity of grassland and small mammal communities related to grazing-induced changes in vegetative cover. Journal of Mammalogy, 63, 248-60.
Green, R.E. (1988) Effects of environmental factors on the timing and success of breeding of common snipe Gallinago gallinago (Aves: Scolopacidae). Journal of Applied Ecology, 25, 79-93.
Green, R.E., Hawell, J. & Johnson, T.H. (1987) Identification of predators of wader eggs from egg remains. Bird Study, 34, 87-91.
Green, R.E., Hirons, G.J. & Kirby, J.S. (1990) The effectiveness of nest defence by black-tailed godwits Limosa limosa. Ardea, 78, 405-13.
Harris, S., Morris, P., Wray, S. & Yalden, D. (1995). A review of British mammals: population estimates and conservation status of British mammals other than cetaceans. In. JNCC, Peterborough.
Hart, J.D., Milsom, T.P., Baxter, A., Kelly, P.F. & Parkin, W.F. (2002) The impact of livestock on lapwing Vanellus vanellus breeding densities and performance on coastal grazing marsh. Bird Study, 49, 67-78.
Hewson, R. (1986) Distribution and density of fox breeding dens and the effects of management. Journal of Applied Ecology, 23, 531-38.
58
Heydon, M.J. & Reynolds, J.C. (2000) Demography of rural foxes (Vulpes vulpes) in relation to cull intensity in three contrasting regions of Britain. Journal of Zoology, 251, 265-76.
Hodson, N.L. (1962) Lapwing's persistent attack on fox. British Birds, 55, 590.
Hofer, H. (1988) Variation in resource presence, utilisation and reproductive success within a population of European badgers (Meles meles). Mammal Review, 18, 25-36.
Holyoak, D. (1968) A comparative study of the food of some British Corvidae. Bird Study, 15, 147-53.
Hötker, H. & Segebade, A. (2000) Effects of predation and weather on the breeding success of avocets Recurvirostra avosetta. Bird Study, 47, 91-101.
Hounsome, T. & Delahay, R. (2005) Birds in the diet of the Eurasian badger Meles meles: a review and meta-analysis. Mammal Review, 35, 199-209.
Hudson, R., Tucker, G.M. & Fuller, R.J. (1994). Lapwing Vanellus vanellus populations in relation to agricultural changes: a review. In The ecology and conservation of lapwings Vanellus vanellus (eds G.M. Tucker, S.M. Davies & R.J. Fuller), Vol. 9. JNCC, Peterborough.
Isley, T.E. & Gysel, L.W. (1975) Sound source location by the red fox. Journal of Mammalogy, 56, 397-404.
Iversen, F.M. (1986) The impact of disturbance on the lapwings Vanellus vanellus incubation. Dansk Ornitologisk Forenings Tidsskrift, 80, 97-102.
Iversen, J.A. (1972) Basal energy metabolism of mustelids. . Journal of Comparative Physiology, 81, 341-44.
Jackson, D.B. & Green, R.E. (2000) The importance of the introduced hedgehog (Erinaceous europaeus) as a predators of the eggs of waders (Charadrii) on machair in South Uist, Scotland. Biological Conservation, 93, 333-48.
Jefferson, R.G. & Grice, P.V. (1998). The conservation of lowland wet grassland in England. In European wet grasslands: biodiversity, management and restoration (eds C.B. Joyce & P.M. Wade), pp. 31-48. John Wiley & Sons, Chichester.
Johansson, T. (2001). Nest-site selection in black-tailed godwits (Limosa limosa): implications for conservation. In Habitat selection, nest predation and conservation biology in a black-tailed godwit (Limosa limosa) population. PhD thesis, University of Uppsala (ed T. Johansson).
Johnson, D.D.P., Jetz, W. & Macdonald, D.W. (2002) Environmental correlates of badger social spacing across Europe. Journal of Biogeography, 29, 411-25.
Jönsson, P.E. (1991) Reproduction and survival in a declining population of the southern dunlin Calidris alpina schinzii. Wader Study Group Bulletin, 61 (suppl.), 56-68.
Junker, S., Düttman, H. & Ehrnsberger, R. (2006). Hatching success and chick survival of lapwings (Vanellus vanellus) breeding in grasslands with different agricultural
59
management - results of a long-term study in the Stollhammer Wisch (Wesermarsch district, Lower Saxony). In Ökologie und Schutz von Wisenvögeln in Mitteleuropa (eds H. Düttman, R. Ehrnsberger & R. Akkermann), p 25. Hochschule Vechta, Vechtaer Fachdidaktische Forschungen und Berichte.
King, C. (1989) The natural history of weasels and stoats Christopher Helm, London.
King, C.M. (1983) The relationships between beech (Nothofagus sp.) seedfall and populations of mice (Mus musculus), and the demographic and dietary responses of stoats (Mustela erminea) in three New Zealand forests. Journal of Animal Ecology, 52, 141-66.
Kis, J., Liker, A. & Székely, T. (2000) Nest defence by lapwings: observations on natural behaviour and an experiment. Ardea, 88, 155-63.
Klomp, H. (1954) De terreinkaus van de kievit, Vanellus vanellus (L.) (in Dutch with English summary: Habitat selection in the lapwing, Vanellus vanellus (L.). Ardea, 42, 1-139.
Klomp, H. & Speek, B.J. (1971) Survival of young lapwings in relation to time of hatching. Bird Study, 18, 229-31.
Kobylińska, J. (1996) The red fox and raccoon dog in wetlands of the Biebrza river valley - food composition and burrow use. Journal of Wildlife Research, 1, 189-89.
Köster, H. & Bruns, H.A. (2003) Haben Wiesenvögel in binnenländischen Schutzgebieten ein "Fuchsproblem"? (in German with English summary: Do meadow birds have problems with foxes in inland nature reserves?). Berichte zum Vogelschutz, 40, 57-74.
Kowalczyk, R., Bunevich, A.N. & Jêdrzejewska, B. (2000) Badger density and distribution of setts in Bialowieza Primeval Forest (Poland and Belarus) compared to other Eurasian populations. Acta Theriologica, 45, 395-408.
Kruuk, H. (1978) Foraging and spatial organisation of the European badger, Meles meles L. Behavioral Ecology and Sociobiology, 4, 75-89.
Kruuk, H. & Parish, T. (1982) Factors affecting population density, group size and territory size of the European badger Meles meles. Journal of Zoology, 196, 31-39.
Kruuk, H., Parish, T., Brown, C.A.J. & Carrera, J. (1979) The use of pasture by the European badger (Meles meles). Journal of Applied Ecology, 16, 453-59.
Lasiewski, R.C. & Dawson, W.R. (1967) A re-examination of the relation between standard metabolic rate and body weight in birds. Condor, 69, 13-23.
Leckie, F.M., Thirgood, S.J., May, R. & Redpath, S.M. (1998) Variation in the diet of red foxes on Scottish moorland in relation to prey abundance. Ecography, 21, 599-604.
Lever, R.J.A.W. (1959) The diet of the fox since myxomatosis. Journal of Animal Ecology, 28, 359-75.
Lind, H. (1961) Studies on the behaviour of the black-tailed godwit (Limosa limosa (L.) Munksgaard, Copenhagen.
60
Lindström, E., Andrén, H., Angelstam, P., Cederlund, G., Hörnfeldt, B., Jäderberg, L., Lemnell, P.A., Martinsson, B., Sköld, K. & Swenson, J.E. (1994) Disease reveals the predator: sarcoptic mange, red fox predation, and prey populations. Ecology, 75, 1042-49.
Lloyd, H.G. (1980a). Habitat requirements of the red fox. In The red fox: symposium on behaviour and ecology (Biogeographica Vol. 18) (ed E. Zimen), pp. 7-25. Dr. W. Junk, The Hague.
Lloyd, H.G. (1980b) The red fox B T Batsford, London.
Lockie, J.D. (1955) The breeding and feeding of jackdaws and rooks with notes on carrion crows and other Corvidae. Ibis, 97, 341-69.
Lockie, J.D. (1956) The food and feeding behaviour of the jackdaw, rook and carrion crow. Journal of Animal Ecology, 25, 421-28.
Lockie, J.D. (1959) The estimation of the food of foxes. Journal of Wildlife Management 23: 224-227. . Journal of Wildlife Management, 23, 224-27.
Lucherini, M. & Lovari, S. (1996) Habitat richness affects home range size in the red fox Vulpes vulpes. Behavioural Processes, 36, 103-05.
Macdonald, D.W. (1976) Food caching by red foxes and some other carnivores. Zeitschrifte fur Tierpsychologie, 42, 170-85.
Macdonald, D.W. (1977) On food preference in the red fox. Mammal Review, 7, 7-23.
Macdonald, D.W. (1980) The red fox, Vulpes vulpes, as a predator upon earthworms, Lumbricus terrestris. Zeitschrifte fur Tierpsychologie, 52, 171-200.
Macdonald, D.W., Barreto, G.R., Ferreras, P., Kirk, B., Rushton, S.P., Yamaguchi, N. & Strachan, R. (1999). The impact of American mink, Mustela vison, as predators of native species in British freshwater systems. In Advances in vertebrate pest management (eds D.P. Cowan & C.J. Feare), pp. 5-23. Filander Verlag, Fürth.
Macdonald, D.W., Mace, G. & Rushton, S. (1998). Proposals for future monitoring of British mammals. In. Joint Nature Conservation Committee/Department of Environment, Tarnsport, Regions.
Macdonald, D.W., Sidorovich, V.E., Anisomova, E.I., Sidorovich, N.V. & Johnson, P.J. (2002) The impact of American mink Mustela vison and European mink Mustela lutreola on water voles Arvicola terrestris in Belarus. Ecography, 25(3), 295-302.
McDonald, R.A., Webbon, C. & Harris, S. (2000) The diet of stoats (Mustela erminea) and weasels (Mustela nivalis) in Great Britain. Journal of Zoology, 252, 363-71.
Milsom, T.P. (2005) Decline of northern lapwing Vanellus vanellus breeding on arable farmland in relation to loss of spring tillage. Bird Study, 52, 297-306.
Moore, R.P. & Robinson, W.D. (2004) Artificial bird nests, external validity, and bias in ecological field studies. Ecology, 85, 1562-67.
61
Neal, E. & Cheeseman, C. (1996) Badgers T & AD Poyser, London.
O'Brien, M.G. (2001) Factors affecting breeding wader populations on upland enclosed farmland in northern Britain, University of Edinburgh.
Olsen, H. (2002) Patterns of predation on ground nesting birds. , Royal Veterinarian and Agricultural University, Copenhagen.
Olsen, H. & Schmidt, N.M. (2004a) Impacts of wet grassland management and winter severity on wader breeding numbers in eastern Denmark. Basic and Applied Ecology, 5, 203-10.
Olsen, H. & Schmidt, N.M. (2004b) Response of hooded crow Corvus corone cornix and magpie Pica pica to exposure to artifical nests. Bird Study, 51, 87-90.
Opermanis, O., Mednis, A. & Bauga, I. (2005) Assessment of compensatory predation and re-colonisation using long-term duck nest predator removal data. Acta Universitatis Latviensis, 691, 17-29.
Österholm, H. (1964) The significance of distance receptors in the feeding behaviour of the fox Vulpes vulpes. Acta Zoologica Fennica, 106, 1-31.
Ottvall, R. (2005) Breeding success and adult survival of redshank Tringa totanus on coastal meadows in SE Sweden. Ardea, 93, 225-36.
Ottvall, R., Larsson, K. & Smith, H.G. (2005) Nesting success in redshank Tringa totanus breeding on coastal meadows and the importance of habitat features used as perches by avian predators. Bird Study, 52, 289-96.
Panek, M. & Bresiński, W. (2002) Red fox Vulpes vulpes density and habitat use in a rural area of western Poland in the end of the 1990s, compared with the turn of the 1970s. Acta Theriologica, 47, 433-42.
Parish, D.M.B., Thompson, P.S. & Coulson, J.C. (1997) Attempted double-brooding in the lapwing Vanellus vanellus. Bird Study, 44, 111-13.
Parr, R. (1993) Nest predation and numbers of golden plovers Pluvialis apricaria and other moorland waders. Bird Study, 40, 223-31.
Peach, W.J., Thompson, P.S. & Coulson, J.C. (1994) Annual and long-term variation in the survival rates of British lapwings Vanellus vanellus. Journal of Animal Ecology, 63, 60-70.
Peles, J.D. & Barrett, G.W. (1996) Effects of vegetation cover on the population dynamics of meadows voles. Journal of Mammalogy, 77, 857-69.
Pennington, M.G. (1992) Predation on birds' eggs and chicks by herbivorous mammals. Scottish Birds, 16, 285.
Phillips, M.L., Clark, W.R., Nusser, S.M., Sovada, M.A. & Greenwood, R.J. (2004) Analysis of predator movement in prairie landscapes with contrasting grassland composition. Journal of Mammalogy, 85, 187-95.
62
Phillips, M.L., Clark, W.R., Sovada, M.A., Horn, D.J., Koford, R.R. & Greenwood, R.J. (2003) Predator selection of prairie landscape features and its relation to duck nest success. Journal of Wildlife Management, 67(1), 104-14.
Potts, G.R. & Vickerman, G.P. (1974) Studies on the cereal ecosystem. Advances in Ecological Research, 8, 107-97.
Poulle, M.L., Artois, M. & Roeder, J.J. (1994) Dynamics of spatial relationships among members of a fox group (Vulpes vulpes: Mammalia: Carnivora). Journal of Zoology, 233, 93-106.
Reason, P., Harris, S. & Cresswell, P. (1993) Estimating the impact of past persecution and habitat changes on the numbers of badgers Meles meles in Britain. Mammal Review, 23, 1-15.
Richards, D.F. (1977) Observations on the diet of the red fox (Vulpes vulpes) in South Devon. Journal of Zoology, 183, 495-504.
Richner, H. (1992) The effect of extra food on fitness in breeding carrion crows. Ecology, 73, 330-35.
Rogers, L.M., Cheeseman, C.L., Mallinson, P.J. & Clifton-Hadley, R. (1997) The demography of a high-density badger (Meles meles) population in the west of England. Journal of Zoology, 242, 705-28.
Roos, S. (2002) Functional response, seasonal decline and landscape differences in nest predation risk. Oecologia, 133, 608-15.
Roos, S. (2004) Nest predation processes and farmland birds., University of Uppsala.
Ryszkowski, L., Goszczynski, J. & Truszkowksi, J. (1973) Trophic relationships of Microtus arvalis in cultivated fields. Acta Theriologica, 18, 125-65.
Šálek, M. & Šmilauer, P. (2002) Predation on northern lapwing Vanellus vanellus nests: the effect of population density and spatial distribution of nests. Ardea, 90, 51-60.
Salonen, V. & Penttinen, A. (1988) Factors affecting nest predation in the great crested grebe: field observations, experiments and their statistical analysis. Ornis Fennica, 65, 13-20.
Sargeant, A.B. (1972) Red fox spatial characteristics in relation to waterfowl predation. Journal of Wildlife Management, 36, 225-36.
Sargeant, A.B. (1978) Red fox prey demands and implications to prairie duck production. Journal of Wildlife Management, 42, 520-27.
Sasvári, L. & Hegyi, Z. (2000) Avian predators influence the daily time budget of lapwings Vanellus vanellus. Folia Zoologica, 49, 211-19.
Saunders, G., White, P.C.L., Harris, S. & Rayner, J.M.V. (1993) Urban foxes (Vulpes vulpes): food acquisition, time and energy budgeting of a generalized predator. Symposium of the Zoology Society of London, 65, 215-34.
63

Schmidt, N.M. & Olsen, H. (2003) The response of small mammal communities to cattle grazing on a coastal meadow. Polish Journal of Ecology, 51, 79-84.
Schmidt, N.M., Olsen, H., Bildsoe, M., Sluydts, V. & Leirs, H. (2005) Effects of grazing intensity on small mammal population ecology in wet meadows. Basic and Applied Ecology, 6, 57-66.
Seymour, A.S. (1999) The ecology of nest predation by red foxes Vulpes vulpes, University of Bristol.
Seymour, A.S., Harris, S., Ralston, C. & White, P.C.L. (2003) Factors influencing the nesting success of lapwings Vanellus vanellus and behaviour of red fox Vulpes vulpes in lapwing nesting sites. Bird Study, 50, 39-46.
Seymour, A.S., Harris, S. & White, P.C.L. (2004) Potential effects of reserve size on incidental nest predation by red foxes Vulpes vulpes. Ecological Modelling, 175, 101-14.
Sharpe, F.E. (2006) Productivity and population trends of northern lapwing (Vanellus vanellus) in Britain. PhD, University of Bath.
Sheldon, R.D. (2002) Factors affecting the distribution, abundance and chick survival of the lapwing (Vanellus vanellus), Harper Adams University College.
Shepherdson, D.J., Roper, T.J. & Lüps, P. (1990) Diet, food availability and foraging behaviour of badgers (Meles meles) in southern England. Zeitschrift for Säugetierkunde, 55, 81-93.
Shrubb, M. (1990) Effects of agricultural change on nesting lapwings Vanellus vanellus in England and Wales. Bird Study, 37, 115-27.
Smart, J. (2005) Strategies of sea-level rise mitigation for breeding redshank, University of East Anglia.
Smedshaug, C.A., Lund, S.E., Brekke, A., Sonerud, G.A. & Rafoss, T. (2002) The importance of the farmland-forest edge for area use of breeding hooded crows as revealed by radio telemetry. Ornis Fennica, 79, 1-13.
Southern, H.N. & Watson, J.S. (1941) Summer food of the red fox (Vulpes vulpes) in Great Britain: a preliminary report. Journal of Animal Ecology, 10, 1-11.
Spencer, K.G. (1953) The lapwing in Britain: some account of its distribution and behaviour, and of its rôle in dialect, folk-lore, and literature A. Brown and Sons, London.
Spray, C.J. (1978) Territorial behaviour of the carrion crow, Corvus corone L., in relation to food supply: an experimental study, University of Aberdeen.
Storaas, T., Kastdalen, L. & Wegge, P. (1999) Detection of forest grouse by mammalian predators: a possible explanation for high brood losses in fragmented landscapes. Wildlife Biology, 5, 187-92.
64
Tapper, S. (1976) The diet of weasels, Mustela nivalis and stoats, Mustela erminea during early summer, in relation to predation on gamebirds. Notes from the Mammal Society, 32, 219-24.
Tapper, S. (1979) The effects of fluctuating vole numbers (Microtus agrestis) on a population of weasels (Mustela nivalis) on farmland. Journal of Animal Ecology, 48, 603-17.
Tapper, S.C., Potts, G.R. & Brockless, M.H. (1996) The effect of an experimental reduction in predation pressure on the breeding success and population density of grey partridges Perdix perdix. Journal of Applied Ecology, 33, 965-78.
Teunissen, W. & Schekkerman, H. (2006). Predation on meadowbirds in The Netherlands - results of a four-year study. In Ökologie und Schutz von Wisenvögeln in Mitteleuropa (eds H. Düttman, R. Ehrnsberger & R. Akkermann), pp. 26-27. Hochschule Vechta, Vechtaer Fachdidaktische Forschungen und Berichte.
Teunissen, W., Schekkerman, H. & Willems, F. (2005). Predatie bij weidevogels: Op zoek naar de mogelijke effecten van predatie op de weidevogelstand (in Dutch with an English summary). In. Sovon Vogelonderzoek Nederland.
Thompson, P.S. & Thompson, D.B.A. (1991) Greenshanks Tringa nebularia and long-term studies of breeding waders. Ibis, 133 (Suppl. 1), 99-112.
Thorup, O. (1998) Ynglefuglene på Tipperne 1928-1992 [in Danish with English summary: The breeding birds on Tipperne 1928-1992]. Dansk Ornithologisk Forenings Tidsskrift, 92, 1-192.
Thyen, S. & Exo, K.-M. (2005) Interactive effects of time and vegetation on reproduction of redshanks (Tringa totanus) breeding in Wadden Sea salt marshes. Journal of Ornithology, 146, 215-25.
Tompa, F.S. (1975) A preliminary investigation of the carrion crow Corvus corone problem in Switzerland. Ornithologische Beobachter, 72, 181-98.
Trewellha, W.J., Harris, S. & McAllister, F.E. (1988) Dispersal distance, home-range size and population density in the red fox (Vulpes vulpes): a quantitative analysis. Journal of Applied Ecology, 25, 423-34.
Tryjanowski, P., Goldyn, B. & Surmacki, A. (2002) Influence of the red fox (Vulpes vulpes, Linnaeus 1758) on the distribution and number of breeding birds in an intensively used farmland. Ecological Research, 17, 395-99.
Valkama, J., Currie, D. & Korpimäki, E. (1999) Differences in the intensity of nest predation in the curlew Numenius arquata: a consequence of land use and predator densities? Ecoscience, 6, 497-504.
Vickery, P.D., Hunter, M.L.J. & Wells, J.V. (1992) Evidence of incidental nest predation and its effects on nests of threatened grassland birds. Oikos, 63, 281-88.
Voigt, D.R. (1999). Red fox. In Wild furbearer management and conservation in North America (eds M. Novak, J.A. Baker, M.E. Obbard & B. Malloch), pp. 380-93. Ontario Trappers Association, North Bay, Ontario.
65
Voigt, D.R. & Macdonald, D.W. (1984) Variation in the spatial and social behaviour of the red fox, Vulpes vulpes. Acta Zoologica Fennica, 171, 261-65.
von Schantz, T. (1980). Prey consumption of a red fox population of southern Sweden. In The red fox: symposium on hebaviour and ecology (Biogeographica Vol. 18) (ed E. Zimen). Dr W. Junk, The Hague.
Walsh, A.L. & Harris, S. (1996) Foraging habitat preferences of vespertilionid bats in Britain. Journal of Applied Ecology, 33, 508-18.
Ward, D. (1994) Management of lowland wet grassland for breeding waders. British Wildlife, 6, 89-98.
Webbon, C., Baker, P.J. & Harris, S. (2004) Faecal density counts for monitoring changes in red fox numbers in rural Britain. Journal of Applied Ecology, 41, 768-79.
Weidinger, K. (2002) Interactive effects of concealment, parental behaviour and predators on the survival of open passerine nests. Journal of Animal Ecology, 71, 424-37.
White, J. (undated). An assessment of habitat manipulation as a fox control strategy. In. National Feral Animal Control Program ; Department of Agriculture, Fisheries and Forestry, Australian Government.
Willson, M.F., Morrison, J.L., Sieving, K.E., de Santo, T.L., Santisteban, L. & Díaz, I. (2001) Patterns of predation risk and survival of bird nests in a Chilean agricultural landscape. Conservation Biology, 15, 447-56.
Wilson, A.M., Ausden, M. & Milsom, T.P. (2004) Changes in breeding wader populations on lowland wet grasslands in England and Wales: causes and potential solutions. Ibis, 146 (Suppl. 2), 32-40.
Wilson, A.M., Vickery, J.A., Brown, A., Langston, R.H.W., Smallshire, D., Wotton, S. & Vanhinsbergh, D. (2005) Changes in the numbers of breeding waders on lowland wet grasslands in England and Wales between 1982 and 2002. Bird Study, 52, 55-69.
Wilson, G., Harris, S. & McLaren, G. (1997). Changes in the British badger population, 1988 to 1997. In. People's Trust for Endangered Species, London.
Winstanley, R.K., Buttermer, W.A. & Saunders, G. (2003) Field metabolic rate and body water turnover of the red fox Vulpes vulpes in Australia. Mammal Review, 33, 295-301.
Woods, M., McDonald, R.A. & Harris, S. (2003) Predation of wildlife by domestic cats Felis catus in Great Britain. Mammal Review, 33, 174-88.
Yom-Tov, Y. (1974) The effect of food and predation on breeding density and success, clutch size and laying date of the crow (Corvus corone L.). Journal of Animal Ecology, 43, 479-98.
Yom-Tov, Y. (1975) Food of nestling crows in north-east Scotland. Bird Study, 22, 47-51.
Zduniak, P. & Kuczyñski, L. (2003) Breeding biology of the hooded crow Corvus corone cornix in Warta river valley (W Poland). Acta Ornithologica, 38, 143-50.
66
Zimen, E. (1984) Long range movements of the red fox, Vulpes vulpes L. Acta Zoologica Fennica, 171, 267-70.
67
CHAPTER 3 ANALYSIS OF THE IMPACT OF PREDATORS ON WADER NESTS
M. A. MacDonald and M. R. Bolton
This chapter addresses Objective 2 of the project: to extract and analyse existing data from RSPB databases on wader breeding habitat characteristics, breeding behaviour and levels of nest predation.
3.1 Introduction
This chapter details an analysis of data that have been collected by RSPB staff during the course of an ongoing programme of research into the breeding ecology and predation of lapwing on lowland wet grassland between 1996 and 2003. Previous analyses of some of these data were submitted for publication in 2005 (Bolton et al., in press) and this report details additional data collation and analysis carried out under the terms of DEFRA Contract Number: C03043. The aim of the analysis reported here was to examine potential relationships between lapwing nest predation rates, nesting densities, habitat features and the densities of two key predator species, foxes and carrion crows. A clearer understanding of the factors influencing nest predation rates is a key precursor to future work to design habitat manipulations to reduce the impact of predators on breeding waders.
3.2 Methods
3.2.1 Study sites
Lapwing nests were monitored over the period 1996-2003 at seven sites within two blocks of wet grassland habitat: Aber Leri (ABL), Ynys-Hir (YNH), Pen Llyn (PNL), Pen Maen Isa (PMI) and Lodge Park Farm (LPK) on the Dyfi estuary, Wales; and two sections of the Ouse Washes (OWA and OWB) that were separated by a 2 km section (Figure 3.1). During this time these sites formed part of a predator control experiment. Foxes and crows were therefore controlled at some of these sites in some years, as detailed in (Bolton et al., in press). Three of these sites were RSPB reserves, and were thus managed in accordance with plans that characterise the operation of lowland wet grassland bird reserves, for which the provision of breeding habitat for waders is a high priority.
3.2.2 Lapwing nest survival
Lapwing nests were located by initially observing lapwing behaviour from a suitable distance, usually from a vehicle, using binoculars and/or telescope. When behavioural observations indicated the presence of a nest, the area was searched on foot, and the nest marked with a cane placed at least 20 m away to avoid attracting predators (Galbraith, 1987). The number of eggs was noted and the eggs were weighed and measured to determine the likely interval to hatching (Galbraith & Green, 1985; Green, 1984). Nest locations were mapped and grid references recorded. The fate of each clutch was determined by monitoring nests every 3-4 days, recording the number of eggs present each visit, and the number that hatched. Clutch fate and the cause of nest failure (predation, flooding, trampling or desertion) were determined by reference to a set of standard criteria contained in the manual of methods provided to all fieldworkers. Nests were considered successful if they were not predated. Nest predation was recorded as a binary outcome (predated, not predated) and the exposure days (number of trials) for each nest was calculated following Mayfield (1961; 1975). In dealing with nests of uncertain outcome, we followed (Manolis, Andersen & Cuthbert, 2000).
68
Figure 3.1 Location of study sites.
3.2.3 Predictor variables
Variables that were considered potential predictors of nest predation rates were either collected during the original field work, or were obtained later using nest locations and digitised maps created in Mapinfo Professional v7.8 (see Table 3.1).
3.2.4 Nest concealment
An index of concealment was measured when each nest was first located. The maximum distance from which the nest was visible was recorded in three directions separated by arcs of 1200.The mean of the three values was used as the predictor variable.
3.2.5 Field area
The area of the field in which each nest was located was calculated from MapInfo. Nest shape (perimeter divided by area) was also calculated, but proved to be too highly correlated with nest area to be usefully modelled. This finding indicated that there was little variation in field shape.
69
3.2.6 Distance to habitat features
During original field work, the distances to cover (typically tall vegetation, such as irises or reeds), and to vantage points (such as posts, trees or bushes) were recorded. Following mapping of nest locations and digitising maps of the sites, we calculated the distance to the following features: field boundary, ditch, riverbank (which formed the boundary of many fields at the Ouse Washes) and footdrain. A footdrain is a shallow linear surface wet feature originally designed to drain wet fields, but now commonly used to retain surface water in fields holding breeding waders. All study sites were re-visited during the course of this project to ground-truth GIS data. We calculated three variables to use as predictors: (1) distance to field boundary; (2) distance to any linear drainage feature (ditch, river bank or footdrain); and (3) distance to any linear feature (the same as (2) but including fence lines). We expected these variables to be highly correlated, as (2) and (3) were identical for most nests, and because most field boundaries consisted of a ditch (with or without fence). This proved to be the case, and initial modelling suggested that distance to field boundary was the variable best able to explain variation in nest predation rates, so we did not use (2) or (3) in our final models.
3.2.7 Distance to crow nest or fox earth
During original field work, fox earths and crow nests were mapped, and the distance from these to lapwing nests was calculated using MapInfo. We categorised these into three categories: near (0-300 m for crow nests, 0-500 m for fox earths); moderate (300-1000 m for crow nest, 500-1000 m for fox earths); and distant (>1000 m for both). We used these categories to ensure sufficient cases in each distance class, for biological reasons (foxes are more likely to forage further from dens than crows from nests), and because although all nests and earths were mapped on each study site, no data were available on the location of crow nest and fox dens on land adjacent to study sites. Therefore, on study sites where no fox earths or crow dens were present, nests were categorised as distant from earths/nests, although there may have been nests/earths on adjacent land. We used distance categories, rather than raw data to reduce a false indication of precision in these measures.
3.2.8 Predator density
While the sites in this study were under predator control for some or all of the study period, we were not interested in predator control per se, but the resulting density of predators, regardless of the management regime. Fortnightly surveys of the suspected major predators (crows and foxes) of lapwing nests were made (Bolton et al., in press). We used a single figure representing crow and fox density at each site for each year: the number of territorial crows per hour of survey (averaged across all surveys); and the number of adult foxes per hour of survey (averaged across all surveys).
3.2.9 Lapwing nest density
Using the mapped locations of lapwing nests and data on their period of activity, the number of nests within 100 m of the active nest was calculated in MapInfo as a measure of nest density. This was calculated on a weekly basis, so includes all nests that were concurrent within one week. This measure represents a considerable improvement on the crude assessment of nest density that is commonly used in such studies, namely the total number of nests within an area over the course of the breeding season. The method adopted here avoids
70
the possibility of counting several consecutive nesting attempts by the same pair that would artificially inflate the measure of nest density.
3.2.10 Data analysis
We modelled the daily predation rate of each nest as a binomial trial (predation outcome/exposure days), following the principles outlined by Aebischer (1999) for nest survival analysis. To investigate the contribution of the predictor variables to variation in daily nest predation rate a generalised linear mixed model (GLMM) was fitted to the data, using a binomial error distribution, logit link function, and exposure days as the binomial denominator. Models were implemented using PROC GLIMMIX of the SAS (v. 9.1) statistical package (Littell et al., 1996), specifying site as a random term. We anticipated that the habitat features (such as nest crypsis) affecting nest predation rates were more likely to be important in situations where the predator species dependent on such features (in this case, visual predators such as crows) occurred at high density. We therefore included the interactions between predictor variables and both crow density and fox density in the models, in addition to the main effects. We did not fit other interaction effects since they did not represent biologically meaningful hypotheses. The maximal model was therefore:
Predation risk = Block + Site + Year + Vis + Vant + Area + M100 + FEbins + CNbins + Cover + Foxdens + Crowdens + Foxdens x (Vis + Vant + Area + M100 + FEbins + Cover)+ Crowdens x (Vis + Vant + Area + M100 + CNbins + Cover)+ Foxdens x Crowdens
The minimal significant model was obtained using a backwards deletion procedure that involved fitting the maximal model, then sequentially removing non-significant interaction effects and non-significant main effects that did not appear in significant interactions, and then refitting the model until no non-significant variables or interactions remained. Block (Dyfi estuary or Ouse Washes), site and year were forced into the model at all times, except as explained below. Due to missing data, complete data on all variables existed for about one third of the nests monitored. Using the method described above, removing variables would result in a continuously increasing number of samples, meaning that decisions to remove a variable at one step might affect the significance of another variable at a future step. To address this, we examined the fit of three models, as follows:
1. A model using the subsample of nests for which all variables were measured (n = 505).
2. A model in which we did allow the sample size to increase as variables were removed.
3. A model using only those variables that were measured for all (or almost all) nests (n = 1373):
Predation risk = Block + Site + Year + M100 + Area + Bound + FEbins + Foxdens + Foxdens x (M100 + Area + Bound + FEbins).
The latter model examines those variables most likely to be related to fox predation, with the exception of distance to cover, so we carried out some additional exploratory modelling based on the nests for which this variable was measured.
71
3.3 Results
3.3.1 Variation in nest survival among sites and years
A total of 1,390 nests were monitored on the seven sites, giving a total of 20,719 nest exposure days. Mayfield estimates of the proportion of nests surviving to hatching for each site-year indicate a wide variation in nest survival to hatching among site-years, although there was no main effect of site or year in the selected models. Across all sites and years, almost 50% of nests failed due to predation.
3.3.2 Relationships between predictor variables and nest predation
Nest density was the strongest predictor of daily nest predation rates, in both the model using all cases, and the reduced subset of cases for which all data were available, although the non-significant Block term could not be retained in the final model on the reduced subset, due to limitations imposed by reduced degrees of freedom (Tables 3.2 and 3.3). Nest predation was less likely for nests that had more lapwing nests within 100 m (p < 0.001). The model in which the number of cases was allowed to expand resulted in the same model as that using all cases. Year and Block did not prove to be significant predictors, but were retained in the final model.
In the model using all cases, distance to field boundary was also a significant predictor (p < 0.05), with nests further from field boundaries suffering lower rates of predation. In the model using the reduced number of cases, there was a significant main effect of distance to vantage point, as well as significant interactions between crow density and nest visibility, and crow density and distance to vantage point (all p < 0.05). Nest predation rates decreased further from vantage points, but the interaction indicated that as crow density increased, nest predation increased further from vantage points. Nest predation increased with decreasing nest visibility as crow density increased, although the (non-significant) relationship between nest predation rates and nest visibility was negative. We did some further modelling using as many cases as were available for these variables and their interactions: the main effect of distance to vantage point was retained (in a model based on 1025 cases), but using this dataset the interaction effects were not significant.
72
Table 3.1 Predictor variables, means, minimum, maximums and quartile values.
Variable name count mean SD min 25% 75% max
Distance (m) to: Vantage Vant 1163 77.6 66.9 2 30 100 500
Cover Cover 1113 75.3 66.5 0 28 100 400
Fieldboundary
Bound 1390 52.2 34.2 0 26.7 70.3 212.9
Lineardrain
Ldrain 1390 35.9 30.0 0 14.7 49.1 211.9
Linearfeature
Lfeature 1390 33.3 24.8 0 14.4 47.1 142.7
Mean visibility (m) Vis 820 6.6 2.6 0 5 7.3 24
Field area (ha) Area 1373 11.8 8.8 0.9 5.7 14.0 40.5
Field shape (perimeter/area)
Shape 1373 0.165 0.058 0.067 0.122 0.201 0.562
Nests within 100 m m100 1390 1.72 2.09 0 0 2 15
Fox density (mean no. seen per survey hour)
Foxdens 1373 0.541 0.668 0 0 0.87 2.6
Crow density (mean no. seen per survey hour)
Crowdens 1252 1.650 1.917 0 0.29 2.82 6.18
0-300 m 300-1000m
> 1000 m
Distance to nearest crow nest
CNbins 1086 161 309 616
0-500 m 500-1000m
> 1000 m
Distance to nearest fox earth
FEbins 1390 194 596 600
73
Table 3.2 Model term effects and standard errors, for model containing all cases.
Effect block year Estimate Error DF t Value Pr > |t|
Intercept -4.3382 0.3978 23.18 -10.91 <0.0001
block DYF 0.4211 0.3079 5.179 1.37 0.2277
block OWW 0 . . . .
year 1996 1.0683 0.396 36.4 2.70 0.0105
year 1997 1.1464 0.4012 38.43 2.86 0.0069
year 1998 0.6086 0.4423 51.09 1.38 0.1749
year 1999 0.6263 0.4223 39.23 1.48 0.1461
year 2000 0.4657 0.4300 49.36 1.08 0.2841
year 2001 0.8623 0.4808 42.42 1.79 0.0800
year 2002 0.9221 0.4213 37.46 2.19 0.0349
year 2003 0 . . . .
m100 -0.2288 0.03408 1379 -6.71 <0.0001
bound -0.0033 0.0015 1379 -2.23 0.0257
Main effects for block and year for above model:
Term DF F Value Sig.
Block 5.179 1.87 0.2277
Year 34.27 1.70 0.1427
74
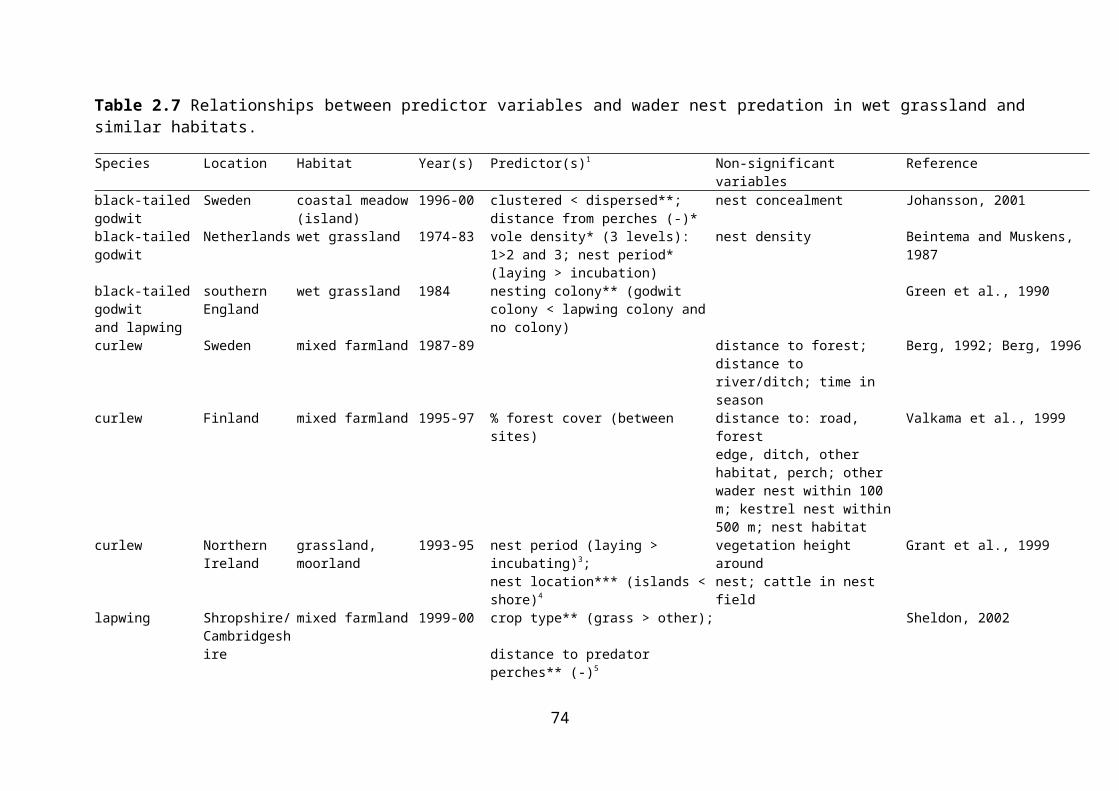
Table 3.3 Model term effects and standard errors, for model containing reduced cases.
Effect site year Estimate Error DF t Value Pr > |t|
Intercept -4.0441 1.034 42.57 -3.91 0.0003
site ABL -0.3318 0.8565 25.34 -0.39 0.7017
site LPK -0.107 0.8208 23.40 -0.13 0.8974
site OWA -0.6352 0.9162 19.58 -0.69 0.4963
site OWB 0.2597 0.7921 17.76 0.33 0.7469
site PMI -0.8086 0.7659 26.53 -1.06 0.3006
site PNL 0.2625 0.8017 22.89 0.33 0.7463
site YHR 0 . . . .
year 1997 0.8673 0.6498 22.24 1.33 0.1955
year 1998 0.2351 0.7221 21.39 0.33 0.7479
year 2000 0.2391 0.6707 24.66 0.36 0.7245
year 2001 0.3909 0.9488 24.02 0.41 0.684
year 2002 0.9939 0.7069 19.6 1.41 0.1754
year 2003 0 . . . .
m100 -0.3298 0.06774 487 -4.87 <0.0001
vis 0.09822 0.0634 487 1.55 0.122
vant -0.0093 0.00369 487 -2.51 0.0123
crowdens 0.3222 0.264 54.94 1.22 0.2275
vis*crowdens -0.055 0.02764 487 -1.99 0.0474
vant*crowdens 0.0042 0.00197 487 2.13 0.0334
Main effects for site and year for above model:
Term DF F Value Sig.
Site 17.66 0.76 0.6128
Year 18.49 0.80 0.5640
75
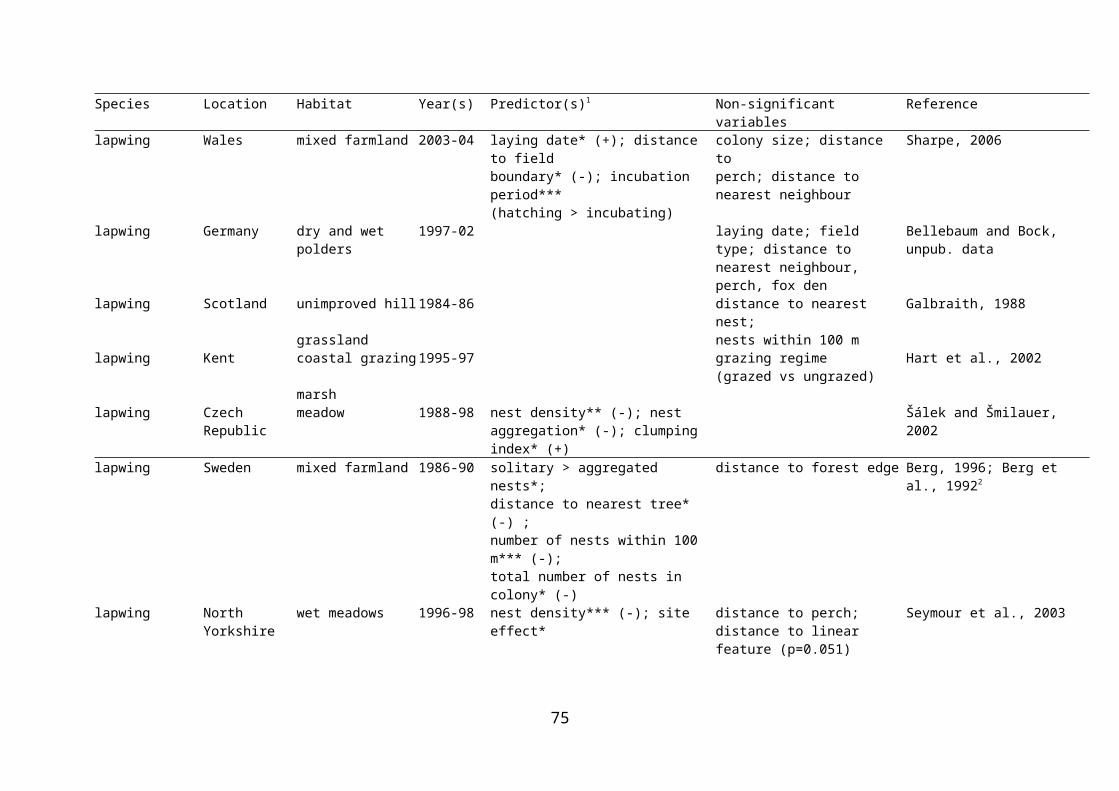
3.4 Discussion
Predation rates observed at the sites over the period indicated that 50% of nests are lost to predation. In combination with losses to other causes, such levels of nest predation may result in hatching rates that are insufficient to maintain stable populations. However, the effects of nest failure rates on lapwing populations, even at the local scale, are difficult to determine, because re-nesting has not been taken into account, and because population trends are strongly influenced by immigration and emigration (Bellebaum, 2001; Bolton et al., in press).
All models showed a strong relationship between nest predation rate and lapwing nest density. This could be explained by two separate causal mechanisms: firstly, lapwings may be able to deter nest predators by aggressive mobbing behaviour when nesting at high densities. Use of nest temperature loggers at the study sites showed that 80 - 100% of predation took place at night (depending on site), indicating mammalian predators. This finding raises the intriguing possibility that lapwing may be better able to defend their nests against predation by mammals, such as foxes, than is commonly supposed. It is noteworthy that recent studies have revealed that lapwing will actively mob nocturnal predators (Seymour, 1999). The second explanation of the observed relationship between nest density and predation rate is that lapwing can identify areas of low predation pressure and settle in such areas at high densities. These two hypotheses are not mutually exclusive: lapwings may select areas of low predation pressure and be more successful at excluding nest predators from such sites. However, on current analysis it is not possible to differentiate between these alternatives and further data collection is necessary to examine the relationships between predation pressure, nesting density and nest predation rate. If the first hypothesis were shown to be correct, nest predation rates could potentially be reduced by habitat management measures to ensure high local nesting density (for example by creating limited areas of habitat suitable for nesting on each site).
The second consistent relationship with nest predation rate, was the distance of nests from the field boundary. The finding that nests further from the field edge suffered lower predation rates is common to a number of previous studies of lapwing nesting in arable habitats (Sharpe, 2006; Sheldon, 2002). It is probably related to the preferential use of field margins by several predator species for navigation through the landscape and as foraging areas (e.g. foxes hunt voles in rank vegetation commonly associated with field margins) and the use of fences and boundary trees as vantage points. The lack of any significant interaction between either fox or crow density and distance from field boundary, indicates that the effect is related to predation by several predator species. This finding suggest that management of the interiors of the largest field to create nesting habitat as far from the field boundary as possible would minimise nest predation rates.
There was some evidence for effects of nest crypsis and distance from predator vantage point on predation rate, in smaller subsets of cases that did not encompass all site-years. A relationship with distant to vantage points has been found in some previous studies for both lapwing (Berg, Lindberg & Kallebrink, 1992; Sheldon, 2002) and black-tailed godwit Limosa limosa (Johansson, 2001), though more commonly, authors have failed to find such an effect (e.g. Bellebaum & Bock, in prep.; Ottvall, 2005; Seymour et al., 2003; Sharpe, 2006; Valkama, Currie & Korpimäki, 1999). The lack of consistency of effect among previous studies was reflected in the analysis of different data sets here and suggests that the influence of vantage points varies, probably according to the densities of predators that use such features (crows, magpies). The majority of sites included in the current analysis were managed primarily for breeding waders, and predator vantage points would have been
76
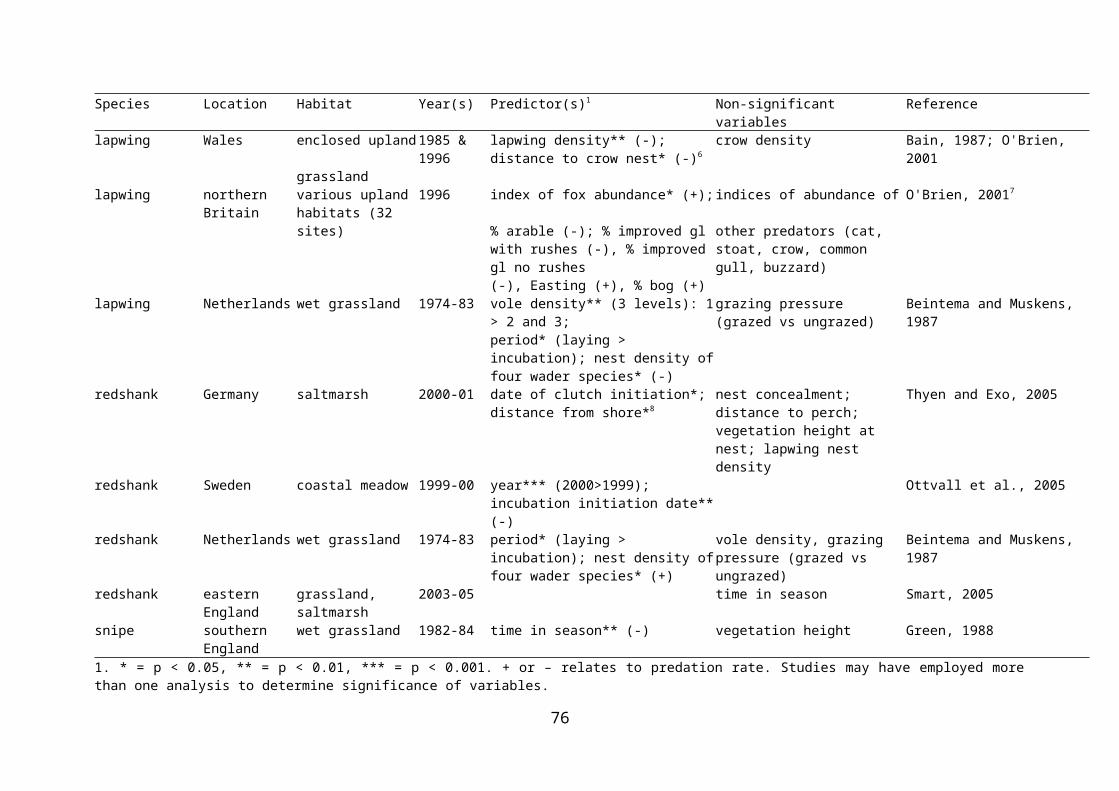
removed as far as possible as part of the reserve manage plan, so the lack of such relationships in the current dataset is likely.
3.5 Acknowledgments
We thank the many reserve staff and research assistants for collection of data on nest survival and predator densities. We are grateful to landowners and CCW for access permission to sites that were not RSPB reserves. Steven Ewing assisted with the data preparation. Paul Britten gave GIS support, and Stijn Bierman gave statistical support.
3.6 References
Aebischer, N.J. (1999) Multi-way comparisons and generalized linear models of nest success: extensions of the Mayfield method. Bird Study, 46, 522-31.
Bellebaum, J. (2001) Breeding success of lapwing Vanellus vanellus at two German wetland reserves: stable numbers in spite of high predation rates. Wader Study Group Bulletin, 96, 21.
Bellebaum, J. & Bock, C. (in prep.) Breeding success of lapwings Vanellus vanellus in two German wetland reserves: stable numbers in spite of high predation rates.
Berg, Å., Lindberg, T. & Kallebrink, K.G. (1992) Hatching success of lapwings on farmland: differences between habitats and colonies of different sizes. Journal of Animal Ecology, 61, 469-76.
Bolton, M., Tyler, G., Smith, K.W. & Bamford, R. (in press) The impact of experimental fox and crow control on lapwing Vanellus vanellus breeding success on wet grassland nature reserves. Journal of Applied Ecology.
Galbraith, H. (1987) Marking and visiting lapwing Vanellus vanellus nests does not affect clutch survival. Bird Study, 34, 137-38.
Galbraith, H. & Green, R.E. (1985) The prediction of hatching dates of lapwing clutches. Wader Study Group Bulletin, 43, 16-18.
Green, R.E. (1984) Nomograms for estimating the stage of incubation of wader eggs in the field Wader Study Group Bulletin, 42, 36-39.
Johansson, T. (2001). Nest-site selection in black-tailed godwits (Limosa limosa): implications for conservation. In Habitat selection, nest predation and conservation biology in a black-tailed godwit (Limosa limosa) population. PhD thesis, University of Uppsala (ed T. Johansson).
Littell, R.C., Milliken, G.A., Stroup, W.W. & Wolfinger, R.D. (1996) SAS system for Mixed Models SAS Institute, Cary, N.C., USA.
Manolis, J.C., Andersen, D.E. & Cuthbert, F.J. (2000) Uncertain nest fates in songbird studies and variation in Mayfield estimation. The Auk, 117, 615-26.
Mayfield, H. (1961) Nesting success calculated from exposure. The Wilson Bulletin, 73, 255-61.
77
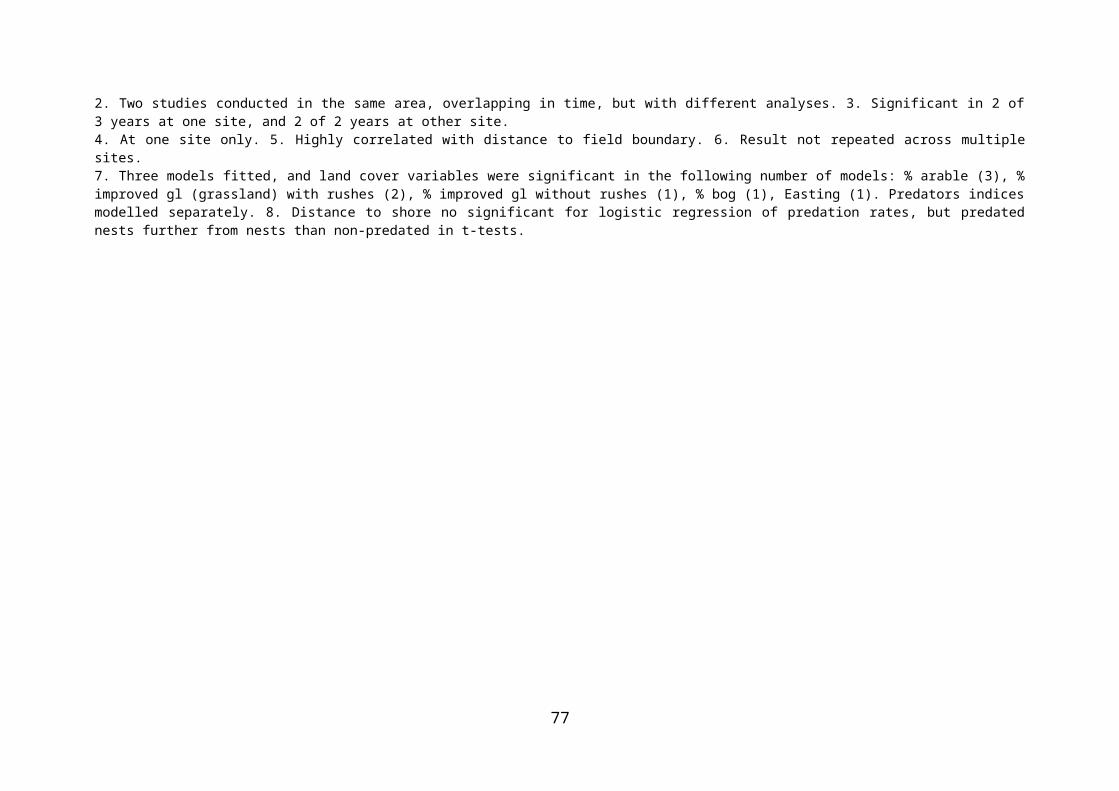
Mayfield, H. (1975) Suggestions for calculating nest success. The Wilson Bulletin, 87, 456-66.
Ottvall, R. (2005) Breeding success and adult survival of redshank Tringa totanus on coastal meadows in SE Sweden. Ardea, 93, 225-36.
Seymour, A.S. (1999) The ecology of nest predation by red foxes Vulpes vulpes, University of Bristol.
Seymour, A.S., Harris, S., Ralston, C. & White, P.C.L. (2003) Factors influencing the nesting success of lapwings Vanellus vanellus and behaviour of red fox Vulpes vulpes in lapwing nesting sites. Bird Study, 50, 39-46.
Sharpe, F.E. (2006) Productivity and population trends of northern lapwing (Vanellus vanellus) in Britain. PhD, University of Bath.
Sheldon, R.D. (2002) Factors affecting the distribution, abundance and chick survival of the lapwing (Vanellus vanellus), Harper Adams University College.
Valkama, J., Currie, D. & Korpimäki, E. (1999) Differences in the intensity of nest predation in the curlew Numenius arquata: a consequence of land use and predator densities? Ecoscience, 6, 497-504.
78
CHAPTER 4 MODELS OF THE IMPACT OF PREDATORS ON WADER NESTS
R. A. Stillman, M. A. MacDonald, M. R. Bolton, S. E. A. le V. dit Durell, R. W. G. Caldow and A. D. West
This chapter addresses Objective 3 of the project: to design a behaviour-based model which can be used to simulate interactions between predators and breeding waders.
4.1 Summary
Mathematical and simulation models are developed to predict the impact of predators on the hatching success of wader nests. The mathematical model represents the system in a simple way. The simulation model can represent the system in more detail, once suitable parameters are available. The simulation model is parameterised in a simple way to show that in this form it makes the same predictions as the mathematical model. The models incorporate all of the important features of the lapwing-fox system identified in Chapters 2 and 3. Both models represent the predation of wader nests by a single type of predator in a single field. The predators move throughout the field, consuming any nests that they encounter. The models assume that the wader nests are not the major prey of the predator, and hence that the distribution of predators is not determined by nest density. Wader nests may be located towards the centre of the field, and predator foraging located towards the field edges. Both models have the following parameters.
Field width and length. Minimum distance from nest to field edge. Maximum distance from predator to field edge. Initial density of nests in field. Ability of waders to defend nests from predators. Distance over which predator detects a nest. Speed with which predator moves through field. Proportion of day for which predators occupy field. Density of predators in field relative to that in surrounding habitat. Density of predators in surrounding habitat. Time taken for eggs to hatch.
The models predict that nest predation rate is lower under the following conditions.
Field area, field width or length are larger. Waders nest further from field edges, or predators move less far into fields. Nest density is higher, provided that waders are able to defend their nests from
predators. Predators detect nests over shorter distances or move more slowly through fields. Predators spend less time in the field. Predators are at a lower density in surrounding habitat, or the quality of the field is
lower than surrounding habitat.
The models predict that the following management would decrease predation rates.
Increase field area, and ensure that fields are as square as possible. Manage field boundaries to provide unsuitable wader nesting and predator foraging
habitat.
79

Manage fields to provide unsuitable predator foraging habitat. If waders are able to defend their nests, manage for high local densities of wader nests.
4.2 Introduction
This chapter presents the results of the behavioural modelling of nest predation conducted during the project. The original plan was to modify an existing behaviour-based simulation model, developed by CEH over the last decade, to produce a ‘demonstration’ version of the model which, although not fully parameterised, would have the correct structure to simulate a predator-breeding wader system. As the project progressed, it became apparent that a demonstration model with the correct structure could either be created from the simulation model, or by creating a new mathematical model. The mathematical approach has the advantage of simplicity and more clearly expressed assumptions, but the disadvantage that it will be unable to incorporate more detailed aspects of biology required, as parameters become available, during Phase 2 of the project. The simulation approach is not as simple, but has the flexibility to incorporate all of the required biology during Phase 2. Given that both approaches have advantages, it was decided that both should be adopted during this phase of the project.
In this chapter, the derivation of the mathematical and simulation models are initially described. Both are then parameterised in a simple way, using data from Chapters 2 and 3, for predation of lapwing nests by foxes. Due to the current lack of suitable data, several simplifying assumptions are made about the location of nests within fields and the foraging behaviour of foxes. The predictions of the two models are compared to check that both produce the same predictions when parameterised in the same way. The mathematical model is then used to predict how nest predation rate is influenced by environmental factors, lapwing nesting and fox foraging behaviour. Lastly, recommendations are made on how habitat management could reduce predation rates.
4.3 Mathematical nest-predator model
The purpose of the mathematical model is to predict hatching success as a function of environmental variables, nesting and predator foraging behaviour. It is designed to represent the nest-predator system in a very simple way and hence makes several simplifying assumptions. It is not designed to represent any particular bird or predator species, but incorporates all of the important features of the lapwing-fox system identified in Chapters 2 and 3. This section describes the derivation of the model. Its equations and parameters are summarised in Table 4.1.
The model considers a rectangular field of nesting and predator foraging habitat (Fig. 4.1). It assumes that nests are located away from the field edge, represented by a minimum distance between a nest and the field edge. Nests are assumed to be uniformly distributed within an area (Anest) given by
(4.1)
where x = field width (m), y = field length (m), dnest =minimum distance between nest and field edge (m). Nests will be located throughout the field if dnest equals 0.
80
The model assumes that predators tend to forage around the edge of the field, represented by a maximum distance from the field edge within which foraging occurs. Predator foraging is assumed to be uniformly distributed within an area around the edge of the field.
Nests are at risk of predation in the area of overlap (Arisk) between nests and predator foraging, which is given by
(4.2)
where dpred = maximum distance predators forage from field edge (m). Foragers will forage throughout the field if dpred equals the minimum of x / 2 and y / 2, in which case nests will be at risk throughout the field. For simplicity in subsequent calculations, we assume that dpred > dnest and hence that some nests are always at risk of predation.
The proportion of nests at risk (Prisk) is found from the proportion of the nesting area overlapping the predator foraging area.
(4.3)
which can be rearranged to give
(4.4)
81
Figure 4.1 Basic spatial assumptions of the mathematical nest-predator model. Nests are within a rectangular field of width x and length y. Nests are located towards the centre of the field (spotted shading), avoiding the edge by a distance dnest. Nests will be located throughout the field if dnest equals 0. Predator foraging is located towards the edge of the field (grey shading), never more than dpred from the field edge. Predators will forage throughout the field if dpred equals the minimum of x / 2 and y / 2.
The model assumes that all nests are created simultaneously and that no relaying occurs after predation. The average density of nests in the whole field (Dfield) is found from the nest densities in the risky and non-risky areas from
(4.5)
where Dinit = initial density of nests (m-2), Drisk = density of nests in risky area and (1 – Prisk) = proportion of nests in non-risky area. The model assumes that predation is the only source of nest loss and so the density of nests in the non-risky area remains constant. Changes in overall nest density are due to the predation of nests in the risky area, and hence changes in Drisk
through time.
The rate of change of nest density in the risky area (dDrisk / dt) is assumed to depend on nest density, the proportion of time for which predators occupy the field, predator density and the area of field searched by predators per unit time.
82
x
ydpred
dnest
(4.6)
where a = area of field searched by each predator per unit time (m2s-1), Pforage = proportion of time for which predators forage, Ffield = predator density in occupied part of field (m-2) and m = coefficient of nest defence (m2). The “–” sign at the start of the equation accounts for the fact the nest density decreases through time (i.e. it has a negative rate of change). The rate of change is proportional to the search area (a) of predators (e.g. if predators have double the search area, they find nests at twice the rate), the proportion of time for which predators forage (Pforage) (e.g. nests are found at half the rate if predators only forage, and hence occupy the field, for half the time) and predator (Ffield) and nest density (Drisk) (e.g. nests are found at twice the rate if either predator or nest density doubles). The possibility that nest predation rate may decrease with increased nest density because of nest defence (Chapter 3) is incorporated through the term (1 – mDrisk). This term measures the extent to which the probability of a nest being predated depends on the density of nests in the risky area. Predation probability per nest is independent of nest density when m = 0 (no nest defence) and decreases with increased nest density when m > 0 (i.e. increasing nest defence). When Drisk = 1 / m the probability of nest predation is zero (i.e. nest defence prevents predation).
Predator searching rate is found by assuming that predators move at constant speed through the field, locating all nests with a fixed distance of their location (Fig. 4.2). For simplicity it is assumed that the time taken to consume nests is insignificant relative to the time taken to find nests and so consumption time is excluded calculations. The area searched by a predator during time t (at) is shown in Fig. 4.2 and calculated from
(4.7)
where ddetect = distance over which nests are detected (m), v = movement speed of predator (ms-1) and t = time predator spends searching (s). The π ddetect
2 / 2 terms are the semicircular search areas at the start and end of searching, and the 2 ddetect v t term is the rectangular search area while moving (Fig. 4.2). The area searched per unit time (a) (i.e. search rate) is found from the derivative of equation 4.7
(4.8)
83
Figure 4.2 How predator searching is incorporated into the model. The black circle shows the predators initial location. The predator moves at constant speed v, in a straight line, for a time of t, reaching the location of the white circle and moving a distance of v t. At all times, the predator is able to detect any nests within a distance ddetect. The grey shading shows the area searched during this time.
Predator density in the field boundary is assumed to be related to the predator density in the surrounding habitat (Fsurround).
(4.9)
where q = density of predators in field relative to that in surrounding habitat (m -2). The parameter q is a measure of the habitat quality of the field for predators in comparison to surrounding habitat. Predator density in the field is higher than in surrounding habitat if q > 1, lower than in surrounding habitat if q < 1, and equal to surrounding habitat if q = 1.
Substituting equations 4.8 and 4.9 into equation 4.6 gives
(4.10)
The model needs to predict the density of nests in the field, rather than the rate of change in nest numbers, and so equation 4.10 needs to be integrated. To simplify integration, the reciprocal of equation 4.10 is taken
(4.11)
Integration then gives
(4.12)
84
v t
ddetect
ddetect
ddetectddetect
where c = integration constant.
The model assumes that the density of nests in the risky area equals the initial nest density when t = 0. Substituting t = 0 and Drisk = Dinit in equation 4.12 and rearranging then gives
(4.13)
Substituting equation 4.13 into equation 4.12 then gives
(4.14)
Which can be rearranged to give
(4.15)
Substituting equation 4.15 in equation 4.5 then gives
(4.16)
The model assumes that eggs hatch after a fixed time period, Thatch, and that hatching success (Phatch) is measured as the proportion of nests that survive until Thatch. Hatching success is calculated by substituting Thatch for t and expressing surviving nest density as a proportion of initial nest density
(4.17)
Which can be simplified to give
(4.18)
85
Table 4.1 Equations (a) and parameters (b) of the mathematical nest-predator model.
(a) Equations
Equation Units
Hatching success(H)
proportion of nests
Proportion of nests at risk of predation(Prisk)
proportion of field area
(b) Parameters
Parameter Description Units
x Field width m
y Field length m
dnest Minimum distance from nest to field edge m
dpred Maximum distance from predator to field edge m
Dinit Initial density of nests in field nests m-2
m Coefficient of nest defence. 1 / m = nest density at which predation rate is zero.
m2
ddetect Distance over which predator detects a nest m
v Speed with which forager moves through field ms-1
Pforage Proportion of time for which predators forage, and hence occupy field
proportion of time
q Density of predators in field relative to that in surround habitat
proportion
Fsurround Density of predators in surrounding habitat predators m-2
Thatch Time taken for eggs to hatch s
86
4.4 Individual-based nest-predator model
The purpose of the model is to predict hatching success as a function of environmental variables, nesting and predator foraging behaviour. It is designed to represent the nest-predator system at a range of complexities. In its most simple form the model reduces to the mathematical model described in the Section 4.3, but it can also incorporate more detail of the system when suitable parameters become available during Phase 2 of the project. It is not designed to represent any particular bird or predator species, but incorporates all of the important features of the lapwing-fox system identified in Chapters 2 and 3. This section describes the structure and parameters (Table 4.2) of demonstration version of the model developed during the project, and ways in which the model could be made more realistic in Phase 2 of the project (indicated by italic text and summarised in Table 4.3).
4.4.1 Time
The model considers the time between egg laying and hatching. Time progresses in discrete, fixed duration, time steps. The model could be improved in Phase 2 by addressing chick as well as nest predation.
4.4.2 Wader and predator populations
The model considers a population of one breeding wader species and a population of one nest predator species. For simplicity, it is assumed that all nests are created simultaneously, that all eggs take the same time to hatch, and that no relaying occurs after predation. No predators are assumed to die during the course of simulations, and the total number of predators is assumed to remain constant. The model could be improved in Phase 2 by incorporating variation in laying date and fledging time, by allowing birds to relay after nest predation and by incorporating changes in predator abundance through time.
4.4.3 Patches
Wader nests are located within a rectangular field, divided into an array of uniform quality, square patches (Fig. 4.3). Within-field variation in habitat quality is simulated by varying the quality of different patches within the field. The field is surrounded by an area of habitat, and the predator uses both the surrounding habitat and the field for foraging. A number of predator dens / nests / roosts are located in the surrounding habitat, which the predators occupy at times during which foraging is not possible (e.g. day or night). The surrounding habitat and dens / nests / roosts are represented as two patches. The model could be made more realistic in Phase 2 by allowing the field to be of any shape.
4.4.4 Wader behaviour
During the first time step wader pairs decide where to position their nest in the field, based on the relative quality of the different patches in the field. For simplicity, quality is assumed to just depend on distance to field edge, with all patches greater than a minimum distance from the field edge assumed to be of equal quality. This means that waders have an equal probability of locating their nest in any patch greater than this distance from the field edge. Nests remain in the same patch throughout the course of simulations and are assumed to be successful if they are not predated (i.e. predation is assumed to be the only source of nest loss). The model could be made more realistic in Phase 2 by allowing nest site quality to
87
depend on more than just distance to field edge and by using more realistic rules to determine the distribution of nests within the field.
4.4.5 Predator behaviour
Each predator remains at a single location during a time step, either a patch within the field, in the surrounding habitat or in a den / nest / roost. During each time step, foragers decide which patch to occupy. It is assumed that during certain times (e.g. day or night) predators are unable to forage and hence remain in their den or nest. When they are able to forage, predators either occupy the surrounding habitat or one of the patches within the field. For simplicity, it is assumed that the surrounding habitat and field are perceived by predators to be of the same quality and hence the density of foragers in the field is the same as that in surrounding habitat. It is assumed that predators tend to forage around the edge of the field, and so only occupy patches up to a maximum distance from the field edge. It is assumed that nests form an insignificant proportion of the total diet of predators and hence that the distribution of predators is not influenced by nest density. The consumption of other prey by the predators is ignored. The model could be made more realistic in Phase 2 by allowing the quality of the field to differ from that of surrounding habitat, incorporating more realistic rules to determine the distribution of predators within the field, and by incorporating the density of other prey in the field and surrounding habitat, to allow predators to aggregate in areas of high prey abundance.
4.4.6 Nest predation
The predation probability (Ppred) of a nest is calculated from the density of predators within the same patch, the duration of a time step and the area of the field searched by predators per unit time
(4.19)
where Npred = number of predators in patch, Apatch = area of patch (m2), a = area of patch searched by each predator per unit time (m2s-1), tstep = time step length (s) and Npred / Apatch = density of predators in patch (m-2). The parameter a is derived from predator behaviour by substituting equation 4.8
(4.20)
During each time step equation 4.20 is calculated for each nest to find the probability that the nest will be predated. A uniform random number between 0 and 1 is then calculated, and the nest assumed to be predated if the number is less than Ppred. It is assumed that waders cannot defend their nests and hence that predation rate does not depend on nest density. The model could be improved in Phase 2 by incorporating nest defence, and hence making predation probability depend on nest density.
The model runs for a fixed number of time steps and calculates hatching success as the proportion of nests that are not predated.
88
Figure 4.3 Basic spatial assumptions of the nest-predator simulation model. Nests are within a rectangular field of width x and length y, which is divided into an array of square uniform patches. Nests are located towards the centre of the field (spotted shading), avoiding the edge by a distance dnest. Nests will be located throughout the field if dnest equals 0. Predator foraging is located towards the edge of the field (light grey shading), never more than dpred
from the field edge. Predators will forage throughout the field if dpred equals the minimum of x / 2 and y / 2. The field is located within an area of surrounding predator foraging habitat (dark grey rectangle). Within the surrounding habitat are a number of predator dens / nests (black circles), from which predators forage.
89
x
y
dpred
dnest
Table 4.2 Parameters of the nest-predator simulation model.
Parameter Units
Number of time steps (nstep)
Duration of each time step (tstep) s
Field width (x) m
Field length (y) m
Initial density of nests in field (Dinit) nests m-2
Minimum distance from nest to field edge (dnest) m
Density of predators in surrounding habitat (Fsurround) predators m-2
Proportion of time for which predators forage (Pforage) proportion of time
Maximum distance from predator to field edge (dpred) m
Distance over which predator detects a nest (ddetect) m
Speed with which forager moves through field (v) ms-1
90
Table 4.3 Ways in which the nest predator simulation model could be improved in Phase 2 of the project and data required to make the improvements.
Improvements Requirements
1) Incorporate chick predation. Chick foraging behaviour and habitat selection. Distance over which predators detect chicks.
2) Incorporate variation in laying date and time to fledge.
Field data on variation in laying date and time to fledge.
3) Allow birds to relay after nest predation. Field data on probability of relaying against stage of the nesting season.
4) Include changes in predator abundance through time.
Field data on seasonal changes in predator abundance.
5) Allow the nesting field to be of any shape.
Real field shapes.
6) Use more realistic rules to determine the distribution of nests.
Field data on the distribution of nests in relation to location within a field and other environmental factors.
7) Allow the quality of the field to differ from that of surrounding habitat.
Field data on the abundance of predator food in nesting fields and surrounding habitat.
8) Incorporate more realistic rules to determine the distribution of predators within the field.
Field data on the distribution of predators in nesting fields in relation to location within a field and other environmental factors. Data to test the assumption that the distribution of predators is not determined by nest density.
9) Incorporate the density of other prey in the field and surrounding habitat, to allow predators to aggregate in areas of high prey abundance.
Field data on the density of other prey, and relationships between predator feeding rate and prey abundance, or predator abundance and prey abundance.
10) Incorporate nest defence, and hence make predation probability depend on nest density.
Field data on the probability that a nest is predated and the density of other nests in the field.
91
4.5 Results
4.5.1 Parameters
The models were parameterised using data on the predation of lapwing nests by foxes presented in Chapters 2 and 3. Table 4.4 shows parameter values and sources.
4.5.2 Comparison of simulation and mathematical models
Figure 4.4 shows an example of the graphical output of the simulation model. The model displays the nesting field and distribution of lapwing nests across the nesting field. It also displays the fox dens and habitat surrounding the nesting field, although these are not drawn to scale. The model displays the changes in fox distribution through time, foraging by night, in dens by day, and the changes in lapwing nest distribution and abundance through time as nests close to the field edge are predated. The model outputs the number of nests surviving during the period between egg laying and hatching, and calculates hatching success as the proportion of nests surviving to egg hatching.
The simulation and mathematical models are alternative ways of representing the same system and so should produce the same predictions when the simulation model is parameterised in a simple way. To test this the two models were parameterised using the parameter values listed in Table 4.4 for a square nesting field measuring 500 by 500 m. The simulation model split this field into a 10 x 10 array of 50 x 50 m patches as shown in Figure 4.4. The predictions of the simulation model vary each time it is run because of random variation in the initial distribution of lapwing nests, the frequency with which foxes forage within patches occupied by nests and the chances that a fox locates a nest within a patch, and so 20 replicates were run for this model. Figure 4.5. shows the predicted changes in lapwing nest survival. The simulation model predicts a range of survival rates, but the average survival predicted by this model exactly coincides with the predictions of the mathematical model. This confirms that the two models have the same predictions when the simulation model is parameterised in a simple way.
For convenience, all subsequent predictions are made using the mathematical model, but Figure 4.5 shows that the same predictions would have been produced from the average of a number of runs of the simulation model. The simulation model is available to incorporate increased realism during Phase 2 of the project which it may not be possible to express using a simple mathematical model.
92
Table 4.4 Parameter values used to apply the mathematical and simulation models to the lapwing-fox system.
Parameter Description Value(s) Source / reason
Thatch Time taken for eggs to hatch1
26 days = 2246400 s Table 2.1, footnote d.
tstep Duration of each time step2
0.25 hr = 900 s Assumed to be the time a foraging fox would spend in a 50 x 50 m patch.
nstep Number of time steps2 2496 26 days with 0.25 hr time step
x Field width 200 – 1000 m Varied with field length to cover the full range of field areas (Table 3.1).
y Field length 200 – 1000 m Varied with field width to cover the full range of field areas (Table 3.1).
dnest Minimum distance from nest to field edge
0 m Unknown, but for simplicity, assumed that lapwing nest up to field edge.
dpred Maximum distance from predator to field edge
100 m Unknown, but assumed to be 100m as foxes known to forage around field boundaries.
Dinit Initial density of nests in field
0.86 ha-1 Table 3.1. Density of nests within 100 m of focal nests, including focal nest.
Fsurround Density of predators in surrounding habitat
0.023 ha-1 Table 2.4. Mean of 0.009-0.037 foxes ha-1. Lloyd (1980).
q Density of predators in field relative to that in surround habitat
1 For simplicity, quality of nesting field assumed to be the same as in surrounding habitat.
Pforage Proportion of time for which predators forage
night time only = 0.5 Chapter 2. Foxes assumed to just forage at night, which is assumed to last for 12 hours.
ddetect Distance over which predator detects a nest
1.5 m Table 2.6. Österholm 1964.
v Speed with which forager moves through field
0.4 ms-1 Table 2.6. Mean speed of walking / foraging foxes. Seymour et al., 2003, 2004; Macdonald, 1980
m Coefficient of nest defence. 1 / m = nest density at which predation rate is zero.
0 m2 For simplicity, and as the exact mechanism not known (Chapter 3), nest defence is assumed to be absent.
1 Mathematical model only. 2 Simulation model only.
93
(a) Start of season – night time (b) Start of season – day time
(c) End of season – night time (d) End of season – day time
Figure 4.4 Screen shots of the nest-predator simulation model showing the distribution of foxes (black circles) and lapwing nests (white circles): (a) night time at start of breeding season; (b) day time at start of breeding season; (c) night time at end of breeding season; (d) day time at end of breeding season. The central array of squares represents the 500x500m nesting field divided into 50x50m patches. The squares of each corner represent dens to which foxes retreat during day time. The rectangles along each side represent the area of surrounding habitat. Dens and surrounding habitat are not drawn to scale. By night, most foxes forage in the surrounding habitat, but occasionally forage in the bounding 100m (patches) of nesting field. When foxes forage in a patch occupied by a nest, there is a probability that the nest will be found and consumed. By the end of the season, predation has substantially reduced nest density in the bordering 100m of the field into which foxes forage, but is unchanged in the field centre. For presentation the numbers of nests and foxes are higher than those used in the simulations.
94
0.0
0.2
0.4
0.6
0.8
1.0
0 5 10 15 20 25
Time (days)
Pro
porti
on s
urvi
ving
SimulationSimulation meanMathematical
Figure 4.5 Comparison of the predictions of the mathematical and simulation models. The figure shows the proportion of nests surviving in relation to the time since eggs were laid. Black circles show the predictions of the mathematical model, and open circles show the predictions from 20 replicates of the simulation model. The line shows the mean predictions of the simulation model.
95
4.5.3 Predictions of the mathematical model
The mathematical model predicts hatching success from two components: (i) the proportion of nests at risk of predation (Prisk) as determined by the shape and size of the nesting field; and (ii) the survival rate of nests within the risky area as determined by fox numbers and behaviour, and lapwing nest defence behaviour. Predictions were made separately for these two components of hatching success.
Figure 4.6 shows the effect of field size and shape on the proportion of nests at risk, and how this influences hatching success. The proportion of nests at risk is predicted to be smaller in larger fields, and for a given field area, smaller in fields that are more square (less elongated) in shape (Fig. 4.6a). This happens because a larger proportion of field area is located close to the field edge (i.e. within 100 m) in smaller and more elongated fields, and hence within the area in which foxes forage. The majority of nests are predicted to be predated within the risky area, and so hatching success is predicted to be greater in larger and more square-shaped fields.
Figure 4.7 shows the effect of the model’s parameters on hatching success in square fields of varying size. The model predicts that hatching success is greater under the following conditions.
Waders nest further from field edges (Fig. 4.7a), or foxes move less far into fields (Fig. 4.7b), as in either case the proportion of nests at risk of predation is decreased.
Foxes detect nests over shorter distances (Fig. 4.7c) or move more slowly through fields, as in either case the area of habitat searched per unit time by foxes is decreased.
Foxes spend less time in the field (Fig. 4.7d), and hence the opportunity to find nests is decreased.
Foxes are at a lower density in surrounding habitats (Fig. 4.7e), or the quality of the field is lower than surrounding habitat (Fig. 4.7f), as in either case the average density of foxes in the field is reduced, and hence the rate at which nests are predated.
Waders are able to defend their nests from foxes (Fig. 4.7g) and nest density is higher (Fig. 4.7h). The default model assumes lapwing do not defend their nests and so hatching success is unrelated to nest density
96
(a) Proportion at risk (P risk )
0.0
0.2
0.4
0.6
0.8
1.0
0 25 50 75 100
Patch area (ha)
Pris
k
length = widthlength = 4 x widthlength = 8 x width
(b) Hatching success (H )
0.0
0.2
0.4
0.6
0.8
1.0
0 25 50 75 100
Patch area (ha)
H
Figure 4.6 Predicted effect of field size and shape on (a) the proportion of lapwing nests at risk of predation (Prisk) and (b) lapwing hatching success (H). The different lines show predictions for different patch shapes: white circles – squares (length = width); grey circles – rectangles with length four times width; black circles – rectangles with length eight times width. See Table 4.4 for default parameter values.
97
(b) d pred
0.0
0.2
0.4
0.6
0.8
1.0
0 25 50 75 100
Patch area (ha)
Hat
chin
g su
cces
s
10 m50 m100 m
(a) d nest
0.0
0.2
0.4
0.6
0.8
1.0
0 25 50 75 100
Patch area (ha)
Hat
chin
g su
cces
s
75 m50 m0 m
(e) F surround
0.0
0.2
0.4
0.6
0.8
1.0
0 25 50 75 100
Patch area (ha)
Hat
chin
g su
cces
s
0.5 /km22.3 /km25 /km2
(f) q
0.0
0.2
0.4
0.6
0.8
1.0
0 25 50 75 100
Patch area (ha)
Hat
chin
g su
cces
s
0.512
(c) d detect
0.0
0.2
0.4
0.6
0.8
1.0
0 25 50 75 100
Patch area (ha)
Hat
chin
g su
cces
s
0.5 m1.5 m10 m
(d) p occupy
0.0
0.2
0.4
0.6
0.8
1.0
0 25 50 75 100
Patch area (ha)
Hat
chin
g su
cces
s
0.250.50.75
(g) m
0.0
0.2
0.4
0.6
0.8
1.0
0 25 50 75 100
Patch area (ha)
Hat
chin
g su
cces
s
1 ha/nest0.5 ha/nest0 ha/nest
(h) D init
0.0
0.2
0.4
0.6
0.8
1.0
0 25 50 75 100
Patch area (ha)
Hat
chin
g su
cces
s
1.5 nests/ha0.86 nests/ha0.1 nests/ha
Figure 4.7 Predicted effect of environmental variables, lapwing and fox population size and behaviour on the hatching success of lapwing nests. Each figure shows predictions of the mathematical model as field area and one other parameter are varied, while all other parameters are held constant. Patches were assumed to be square, with patch area calculated as width (x) x length (y). In (h) lapwing were assumed to be able to defend their nests (m = 0.5 ha nest-1) as hatching success is independent of nest density when nests cannot be defended. See Table 4.4 for default parameter values.
98
4.6 Discussion
The requirement of the modelling conducted under the current phase of the project was to create a demonstration model which, although not fully parameterised, would have the correct structure to simulate a nest-predator system. Both the mathematical and simulation models fulfil this requirement, and highlight areas in which more precise parameter estimates are needed. The mathematical model had the advantage of simplicity and more clearly defined assumptions and relationships between parameters. For this reason it was used to generate most of the predictions for this phase of the project. An important test was that both models produced the same predictions when parameterised in the same way. The simulation model is now available to incorporate more realistic parameters and assumptions during Phase 2 of the project.
The following sections discuss (i) how the demonstration models can be used to advise habitat management to reduce predation rates and (ii) the changes needed to make the simulation model more realistic during Phase 2 of the project.
4.6.1 Habitat management to reduce predation rates
The mathematical model predicted that hatching success was sensitive to variation in any of the model’s parameters (Figs. 4.6 and 4.7). Habitat management must influence one or more of these parameters if it is to increase hatching success. The following bullet points highlight how the model’s predictions can be used to advise appropriate management to reduce nest predation rates.
Field size and shape. Predicted hatching success was higher when fields were larger or more square because a lower proportion of nests were at risk from predation. Therefore, a strategy to reduce predation rate would be to acquire land, manage or recreate habitats to form large blocks of nesting habitat that are as square (i.e. non-elongated) as possible.
Management of field boundaries. Predicted hatching success was higher when waders nested further from field edges or foxes moved less far into fields, because a lower proportion of nests were at risk from predation. Habitat management which reduced the attractiveness of field boundaries for nesting waders, while not increasing its attractiveness to predators, would therefore be predicted to reduce nest predation rates. For waders preferring short grass for nesting, one possibility would be to manage for long grass in field boundaries early in the nesting season, cutting or grazing back this vegetation once nests have been positioned.
Predator searching efficiency. Predicted hatching success was higher when predators detected nests over shorter distances or moved more slowly through fields. Management to reduce predator foraging efficiency could be to increase vegetation height and structure, but such management may also increase the abundance of predator prey and will also be unsuitable nesting habitat for most wader species. It is thought unlikely that habitat management could reduce predator searching efficiency without having other adverse effects on waders.
Quality of nesting field for predators. Predicted hatching success was higher when the nesting field was lower quality for predators than the surrounding habitat because this reduced the average density of predators in the field. Any management that reduces
99
the quality of nesting fields for predator foraging would be predicted to reduce nest predation.
Nest defence and nest density. In wader species able to defend their nests from predators, predicted hatching success was higher when nest density was higher. In such species, any habitat management which compresses nests into a smaller area, and hence increases nest density, will be predicted to reduce nest predation. One way to achieve this would be to extend the field boundary management described above. For waders preferring short grass for nesting, management for long grass in the field boundary and additional areas during the start of the season could restrict the total area of suitable habitat, thus both excluding nests from the field boundary and increasing nest density. As described above this vegetation could be cut or grazed back once nests have been positioned.
4.6.2 Additions to increase the realism of the simulation model
The following bullet points discuss the ways in which the simulation model could be made more realistic during Phase 2 of the project.
Incorporate chick predation. The current project and model addresses nest predation, but predation of chicks may be as, or more important. This could be incorporated in a relatively straightforward way, allowing the fledglings to move within the nesting field once they hatch. To do this data would be required either on the distribution of adult and young birds within fields, or on the distribution and abundance of wader food in fields, and the rate at which this is consumed by adults and chicks.
Incorporate variation in laying date and time to fledge. The current models assumed that all eggs were laid at the same time and all took exactly the same amount of time to hatch. Variation could be incorporated using existing data on laying dates and replacement of nests after predation.
Allow birds to relay after nest predation. The current models assumed that birds did not relay eggs after predation, but this could be incorporated given suitable field data.
Include changes in predator abundance through time. The models assumed constant predator density, but changes through the season could be incorporated given suitable data.
Allow the nesting field to be of any shape. The principles of the models do not depend on the actual shape of field used, rectangles were just used for convenience. Therefore, real field shapes could be used in the simulation model.
Use more realistic rules to determine the distribution of nests. One of the key model parameters relates to the distribution of wader nests within fields, as this determines the proportion of nests that are at risk of predation. We used the simplest assumptions that nests are uniformly distributed beyond a fixed distance from a field boundary. However, the true distributions are unlikely to be determined by such all-or-nothing rules, and the extent to which different wader species avoid field edges is unknown. A key requirement for Phase 2 of the project is to use existing data to better understand the factors determining the spacing of nests, to incorporate more realistic rules on nest distribution.
100
Allow the quality of the field to differ from that of surrounding habitat. For simplicity, it was assumed that the density of predators was the same in the field and surrounding habitat, but differing densities could be assumed provided that suitable data could be obtained.
Incorporate more realistic rules to determine the distribution of predators within the field. Another key model parameter relates to the distribution of predator foraging within fields, as this determines the proportion of nests that are at risk of predation. We used the simplest assumption that predator foraging is uniformly distributed around the field boundary, but this is likely to be over-simplistic. A key requirement for Phase 2 is to better understand the factors determining the distribution of forager search effort.
Incorporate the density of other prey in the field and surrounding habitat, to allow predators to aggregate in areas of high prey abundance. Field data on the density of other prey, and relationships between predator feeding rate and prey abundance, or predator abundance and prey abundance.
Incorporate nest defence, and hence make predation probability depend on nest density. The simulation model ignored nest defence, and nest defence was incorporated in a very simple way in the mathematical model. Further, work is required to understand the mechanism whereby increased wader nest densities reduce predation rates, before nest defence can be more realistically incorporated into the models.
4.7 References
Lloyd, H.G. (1980b) The red fox B T Batsford, London.
Österholm, H. (1964) The significance of distance receptors in the feeding behaviour of the fox Vulpes vulpes. Acta Zoologica Fennica, 106, 1-31.
101

CHAPTER 5 DISCUSSION
R. A. Stillman, M. A. MacDonald, M. R. Bolton, S. E. A. le V. dit Durell, R. W. G. Caldow and A. D. West
This chapter addresses Objectives 4 and 5 of the project: Objective 4 – to draw up testable hypotheses concerning the role of various environmental factors in influencing predation on wader eggs and chicks and identify data requirements for the predator-breeding wader model; Objective 5 – to recommend further research to be undertaken in Phase 2 of the project.
5.1 Introduction
This project was designed as the first of two phases of research on the management of wet grassland habitat to reduce the impact of predation on breeding waders. The project had the following five objectives (one other objective was to write this final report).
Objective 1. Review literature on foraging behaviour and habitat use of avian and mammalian predators of wader nests on lowland wet grassland.
Objective 2. Extract and analyse existing data from RSPB databases on wader breeding habitat characteristics, breeding behaviour and levels of nest predation.
Objective 3. Design a behaviour-based model which can be used to simulate interactions between predators and breeding waders.
Objective 4. Draw up testable hypotheses concerning the role of various environmental factors in influencing predation on wader eggs and chicks and identify data requirements for the predator-breeding wader model.
Objective 5. Recommend further research to be undertaken during Phase 2 of the project.
Objective 1 was addressed in Chapter 2 which reviewed published and unpublished literature to synthesise current understanding of the ecology of the key avian and mammalian predators of breeding waders and their habitat use. Objective 2 was addressed in Chapter 3 which collated and analysed RSPB datasets in order to statistically model the impact of environmental factors on lapwing nest predation rate. Objective 3 was addressed in Chapter 4 which developed two demonstration behavioural models to predict the effect of predators on wader nesting success. The current chapter gives an overview of the project results and addresses Objectives 4 and 5.
5.2 Overview of project results
This section gives an overview of the project results highlighting the key nest predators identified during the literature review, key factors correlated with nest predation rates, and knowledge gaps that need to be filled in order to more realistically model nest predation.
5.2.1 Key predators of wader nests
Evidence indicates a wide range of predators of wader nests in wet grassland. Predators of nests may vary greatly between sites, even where habitat and management appear to be the
102
same. However, while the range of predators is great, there is growing evidence from remote monitoring devices, where bias is minimised, that in many situations in UK, the majority of predation occurs at night and is therefore attributable to mammalian species. Within UK, we consider that most important predators on lowland wet grassland sites will include fox, badger, mustelids and corvids.
All the likely key predators of wader eggs on lowland wet grassland habitats are generalist predators (in the sense that none are specialist predators on waders), and for all key predators, wader eggs form a tiny proportion of their diet.
5.2.2 Key correlates of nest predation rates
The literature review and statistical analysis indicated that the key factors influencing wader nest predation rates were distance to the field edge, nest and predator density. The behavioural modelling also predicted that the risk of nest predation was greater closer to the field edge, lower at higher nest densities, provided that waders could defend their nests, and higher at higher predator densities.
Distance to the field edge. The importance of distance to the field edge could be caused by the preferential use of field margins by several predator species for navigation through the landscape and as foraging areas and the use of fences and boundary trees as vantage points by avian predators. Chance encounters with nests close to the field edge are therefore likely to be higher than for nests away from the field boundary.
Wader nest density. The importance of nest density could be explained by two separate causal mechanisms. Firstly, waders may be able to deter nest predators by aggressive mobbing behaviour when nesting at high densities. Secondly, waders may be able to identify areas of low predation pressure and settle in such areas at high densities. These two hypotheses are not mutually exclusive: waders may select areas of low predation pressure and be more successful at excluding nest predators from such sites.
Predator density. A numerical decrease in predators is likely to reduce nest predation rates, provided they do not result in a compensatory increase in density or activity of another predator species. Since the key predators of wader nests are all dietary generalists that principally forage on other prey (simply taking wader eggs opportunistically), the numerical abundance of the predators is likely to be determined by the abundance of their main prey or the availability of dens or nest sites. Changes in the abundance of the main prey species may either increase or decrease nest predation rates. Firstly, increases in the main prey can result in an increase in predator densities, resulting in higher incidental predation on wader nests. Secondly, if predator density is limited by factors other than the availability of the main prey type (such as availability of den or nest sites), an increase in the main prey can result in a reduced impact on breeding waders as predators search smaller areas to meet their daily food requirements, and are therefore less likely to encounter wader nests. The reverse case, in extreme situations, could potentially result in predators targeting wader nests when availability of their main prey types is low.
103
5.2.3 Knowledge gaps
The following knowledge gaps need to be filled in order to better understand the factors determining nest predation rates and to develop more realistic models of nest predation.
Identity of nest predators. Unbiased data on the identity of nest predators, obtained using remote devices such as nest cameras, are currently scarce. More work is now needed to increase the number of sites and years for which unbiased data are available, so that models can be developed for the most important nest predators.
Identity of chick predators and factors determining chick survival rates. To date, research efforts have focused on predation of wader nests, rather than chicks, since nest predation is more amenable to field study. Consequently there is little information available on rates of chick survival, and the relative contribution of different predator species to chick mortality. In demographic terms, chick survival is likely to be an important component of annual productivity (and therefore population trends), and more data are required on predation of chicks. Chick predation could be modelled in a relatively straightforward way, allowing the fledglings to move within the nesting field once they hatch. To do this data would be required either on the distribution of adult and young birds within fields, or on the distribution and abundance of wader food in fields, and the rate at which this is consumed by adults and chicks.
Factors regulating predator densities and use of nesting fields and surrounding habitat. Little is currently known about the factors limiting densities of key predators on wet grassland habitats, or the use of nesting fields relative to that of surround habitats. Further work is required to better understand the factors determining predator abundance in the wider landscape and within nesting fields, such as habitat structure or the abundance of major prey species, so that more realistic use of nesting fields can be modelled.
Factors determining wader nest site distribution. One of the key correlates of nest predation (distance from field edge) relates to the distribution of wader nests within fields, as this determines the proportion of nests that are at risk of predation. The models made the simplest assumptions that nests were uniformly distributed beyond a fixed distance from a field boundary, but the true distributions are unlikely to be determined by such all-or-nothing rules. Further work is required to better understand the factors determining the distribution of wader nests, so that more realistic nest distributions can be modelled.
Factors determining the distribution of predator foraging effort within nesting fields. Distance from field edge also relates to the distribution of predator foraging within fields, as this determines the proportion of nests that are at risk of predation. Again the models made the simplest assumption that predator foraging was uniformly distributed around the field boundary, but this is likely to be over-simplistic. Further work is required to better understand the factors determining the distribution of predator foraging effort, such as habitat structure or the abundance of major prey species, so that more realistic predator distributions can be modelled.
Causal mechanisms of observed relationship between nest density and predation rates. The simulation model ignored nest defence, and nest defence was incorporated in a very simple way in the mathematical model. Further, work is required to
104
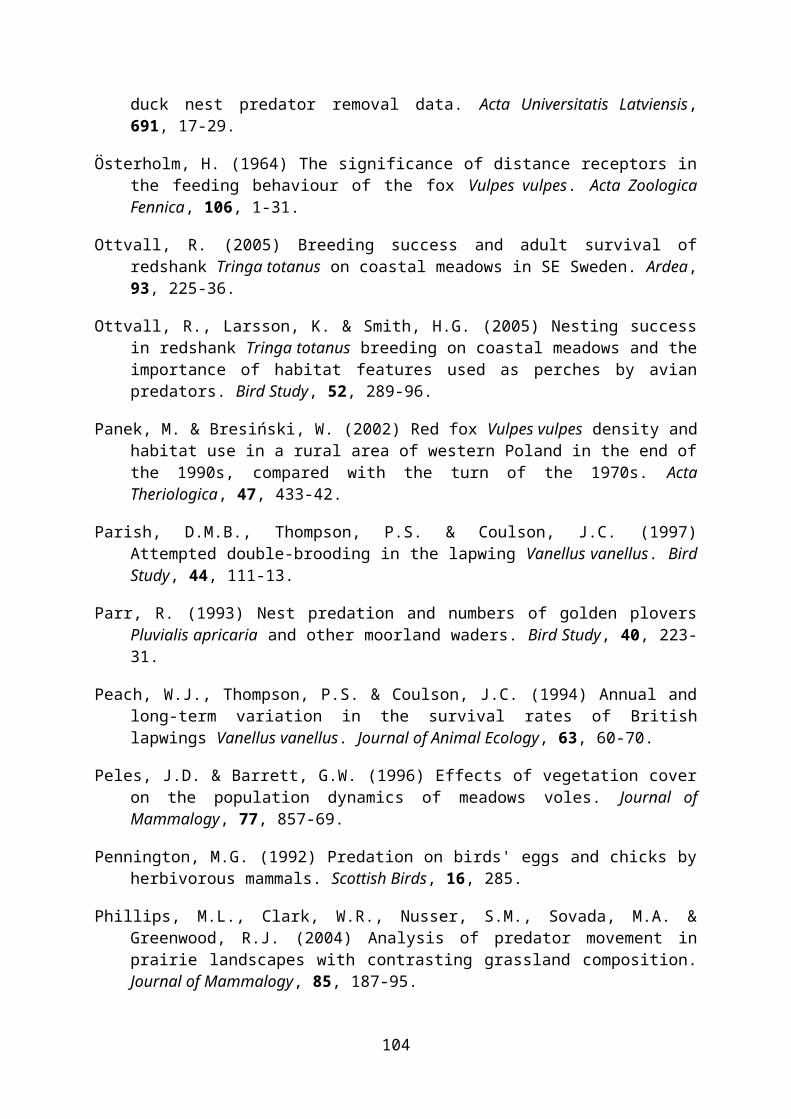
understand the mechanism whereby higher wader nest densities are related to lower predation rates, before nest defence can be more realistically incorporated into the models. Nest predation rate is typically lower at higher nest densities but the causal mechanism for this relationship is unknown, and may simply reflect a preference for nesting in areas of low predator density. Further work is needed to understand the mechanism underlying the observed relationship and assess the utility of such habitat manipulations.
5.3 Preliminary recommendations
Although based on limited data, the models developed during this project, in combination with the results of the literature review and statistical analysis, suggest that the following habitat management could potentially reduce nest predation rates.
Field size and shape. Predicted hatching success was higher when fields were larger or more square because a lower proportion of nests were at risk from predation. Therefore, a strategy to reduce predation rate would be to acquire land, manage or recreate habitats to form large blocks of nesting habitat that are as square (i.e. non-elongated) as possible.
Management of field boundaries. Predicted hatching success was higher when waders nested further from field edges or foxes moved less far into fields, because a lower proportion of nests were at risk from predation. Habitat management which reduced the attractiveness of field boundaries for nesting waders, while not increasing its attractiveness to predators, would therefore be predicted to reduce nest predation rates. For waders preferring short grass for nesting, one possibility would be to manage for long grass in field boundaries early in the nesting season, cutting or grazing back this vegetation once nesting sites have been selected.
Quality of nesting field for predators. Predicted hatching success was higher when the nesting field was lower quality for predators than the surrounding habitat because this reduced the average density of predators in the field. Any management that reduces the quality of nesting fields for predator foraging would be predicted to reduce nest predation.
Nest defence and nest density. In wader species able to defend their nests from predators, predicted hatching success was higher when nest density was higher. In such species, any habitat management which compresses nests into a smaller area, and hence increases nest density, will be predicted to reduce nest predation. One way to achieve this would be to extend the field boundary management described above. For waders preferring short grass for nesting, management for long grass in the field boundary and additional areas during the start of the season could restrict the total area of suitable habitat, thus both excluding nests from the field boundary and increasing nest density. As described above this vegetation could be cut or grazed back once nesting sites have been selected.
5.4 Future research
Future research should fill the knowledge gaps identified during this project (Section 5.2.3), focusing in particular on the mechanisms underlying the key correlates of nest predation (Section 5.2.2), to better understand and model the nest-chick-predator system, and refine and
105
test habitat management recommendations to reduce nest predation (Section 5.3). These research requirements are discussed in the following bullet points.
Identity of nest predators. Unbiased indentification of nest predators, using nest cameras and nest temperature loggers, is required at a range of representative sites, over a number of years, to determine the major predator species. Habitat characterists of the sites and surrounding areas should be quantified, and the densities of potential nest predators assessed, to determine reasons for any differences in the major predators between sites.
Identity of chick predators and factors determining chick survival rates. Unbiased indentification of chick predators is required at a range of representative sites, over a number of years, to determine the major chick predator species. Techniques for identifying predators should include (i) using radio transmitters designed to maximise detection range and durability to withstand predation events, in combination with regular searches for tags at predator den and nest sites, (ii) collecting mammal scats from transects across fields and identification of prey remains and (iii) predator stomach analysis from sites with predator control. Habitat characterists of the sites and surrounding areas should be quantified and the densities of potential chick predators estimated, to determine reasons for any differences in the major predators and variation in predation rates between sites.
Distribution and habitat characteristics of preferred prey of wader predators. In assessing options for habitat management to reduce the impact of predators on waders, it is important to understand the factors determining the distribution of their preferred prey. A programme of monitoring, using established methods, is needed to determine the distribution and abundance, and habitat associations of these prey items during the course of the wader breeding season.
Factors determining the distribution of predator foraging effort. The distribution of predator foraging effort within nesting fields and in surrounding habitat needs to be quantified, in combination with measurement of field and surrounding habitat characteristics, to better understand the factors determining the distribution of predator foraging effort and its overlap with nest and chick distributions. Techniques for measuring predator distribution should include (i) fine-scale GPS tracking, and (ii) camera traps to assess activity of mammalian predators at a field-scale. The abundance of major predator prey species, or habitats associated with high abundance of prey species, within and around nesting fields should also be estimated, to determine the relative abundance of prey in nesting fields and surrounding habitat.
Factors determining wader nest site and chick distribution. The distribution of wader nests and chicks within a range of representative sites, over a number of years, needs to be measured in order to quantify the exposure of nests and chicks to predation risk. Nest distribution should be derived from existing datasets and new field work. Chick distribution should be recorded by using radio transmitters designed to maximise detection range. Field characteristics, including the distribution of chick food, should also be measured in order to determine the major factors determining nest and chick distribution.
Causal mechanisms of observed relationship between nest density and predation rates. Nest predation rate is typically lower at higher nest densities but the causal
106
mechanism for this relationship is unknown, and may simply reflect a preference for nesting in areas of low predator density, rather than an ability of waders to defend their nests from predation. Further fieldwork, including the measurement of predator activity in nesting fields, is required to determine the mechanism underlying the observed relationship.
Demographic consequences of reduced predation rates. In order to determine the value of alternative management techniques it is important to determine whether any reductions in nest or chick predation rates result in changes in population size. The behavioural models need to be linked to a demographic model, incorporating adult survival, to predict how population size is influenced by a change in nesting success, and the relative contribution of changes in nest and chick survival.
Model realistic behavioural models and habitat management scenarios, and field test model predictions. The new research described above will allow the behavioural models to be parameterised more realistically, for a wider range of predator species, to address more realistic habitat management scenarios, and to determine the relative impacts of nest and chick predation on population size. The development of such models will facilitate “virtual experiments” to assess the likely magnitude of effects of particular habitat manipulations at a site scale. Habitat manipulations need to be designed to reduce the availability of predators’ target prey in the vicinity of fields used by breeding waders, to reduce the density of the predators themselves at a site-scale or to reduce the overlap between predator, nest and chick distributions. Further fieldwork, involving real-world habitat manipulation on a number of representative sites should then be used to confirm the accuracy of predictions.
107