rapid assessment of the bacteriological quality of milk by
TRANSCRIPT

Louisiana State UniversityLSU Digital Commons
LSU Historical Dissertations and Theses Graduate School
1998
Rapid Assessment of the Bacteriological Quality ofMilk by the Use of Adenosine TriphosphateBioluminescence.Pushpa John SamkuttyLouisiana State University and Agricultural & Mechanical College
Follow this and additional works at: https://digitalcommons.lsu.edu/gradschool_disstheses
This Dissertation is brought to you for free and open access by the Graduate School at LSU Digital Commons. It has been accepted for inclusion inLSU Historical Dissertations and Theses by an authorized administrator of LSU Digital Commons. For more information, please [email protected].
Recommended CitationSamkutty, Pushpa John, "Rapid Assessment of the Bacteriological Quality of Milk by the Use of Adenosine TriphosphateBioluminescence." (1998). LSU Historical Dissertations and Theses. 6758.https://digitalcommons.lsu.edu/gradschool_disstheses/6758

INFORMATION TO USERS
This manuscript has been reproduced from the microfilm master. UMI
films the text directly from the original or copy submitted. Thus, some
thesis and dissertation copies are in typewriter face, while others may be
from any type of computer printer.
The quality of this reproduction is dependent upon the quality o f the
copy submitted. Broken or indistinct print, colored or poor quality
illustrations and photographs, print bleedthrough, substandard margins,
and improper alignment can adversely affect reproduction.
In the unlikely event that the author did not send UMI a complete
manuscript and there are missing pages, these will be noted. Also, if
unauthorized copyright material had to be removed, a note will indicate
the deletion.
Oversize materials (e.g., maps, drawings, charts) are reproduced by
sectioning the original, beginning at the upper left-hand comer and
continuing from left to right in equal sections with small overlaps. Each
original is also photographed in one exposure and is included in reduced
form at the back of the book.
Photographs included in the original manuscript have been reproduced
xerographically in this copy. Higher quality 6” x 9” black and white
photographic prints are available for any photographs or illustrations
appearing in this copy for an additional charge. Contact UMI directly to
order.
UMIA Bell & Howell Information Company
300 North Zeeb Road, Ann Arbor MI 48106-1346 USA 313/761-4700 800/521-0600
Reproduced with permission of the copyright owner. Further reproduction prohibited without permission.

Reproduced with permission of the copyright owner. Further reproduction prohibited without permission.

RAPID ASSESSMENT OF THE BACTERIOLOGICAL QUALITY OF MILK BY THE USE OF ADENOSINE
TRIPHOSPHATE BIOLUMINESCENCE
A Dissertation
Submitted to the Graduate Faculty of the Louisiana State University and
Agricultural and Mechanical College in partial fulfillment of the
requirements for the degree of Doctor of Philosophy
in
The Department of Dairy Science
by
Pushpa J. Samkutty B.A., Kerala University, India, 1978 B.S., Mississippi State University, 1983 M.S., Mississippi State University, 1987
August, 1998
Reproduced with permission of the copyright owner. Further reproduction prohibited without permission.

UMI Number: 99 02 660
UMI Microform 9902660 Copyright 1998, by UMI Company. AI1 rights reserved.
This microform edition is protected against unauthorized copying under Title 17, United States Code.
UMI300 North Zeeb Road Ann Arbor, MI 48103
Reproduced with permission of the copyright owner. Further reproduction prohibited without permission.

ACKNOWLEDGMENTS
The author wishes to express her gratitude and humble submissions to the
Almighty God who bestowed His blessings upon her. Further, she would like to extend
her sincere appreciation to her major professor, Dr. Ronald H. Gough, for his
invaluable suggestions, most scholarly and constructive criticism, and personal
kindness, which made this research possible. Grateful appreciation is extended to
Dr. R.W. Adkinson for his invaluable assistance throughout the analyses of the
experimental data.
Special thanks to Dr. J.U. McGregor and Dr. J. D. Roussel of the Department
of Dairy Science, Dr. R. M. Grodner of the Department of Food Science and
Dr. Kathleen Morden of the Department of Biochemistry for reviewing the manuscript
and offering constructive suggestions. Acknowledgement is also extended to
Dr. Bruce Jenny, Head of the Department of Dairy Science, Ms. Paula McGrew, and
other staff and faculty in the department for their help and cooperation when it was
needed. The assistance provided by the Howard Hughes Medical Institute program
with the help of Dr. Harold Silverman, Professor and Chair of the Dept, of Biological
Sciences at L.S.U. and Director of the HHMI program and Dr. Earl Doomes, Dean of
the College of Sciences at Southern University is gratefully acknowledged.
The author is indebted to the unlimited patience, encouragement, moral
support, and sincere prayers of her huband, Dr. E. C. Samkutty, her children, Ranjith
and Bindu and her mother, Mrs. Chinnamma John.
ii
Reproduced with permission of the copyright owner. Further reproduction prohibited without permission.

TABLE OF CONTENTS
ACKNOWLEDGEMENTS........................................................................................... ii
LIST OF TABLES......................................................................................................... v
LIST OF FIGURES.......................................................................................................vi
ABSTRACT...................................................................................................................vii
CHAPTER1 INTRODUCTION.............................................................................................. 1
2 LITERATURE REVIEW.................................................................................. 42.1 Direct methods for evaluating bacteriological quality of milk............ 5
2.1.1 Standard plate count............................................................... 52.1.2 Petrifilm aerobic count method.............................................. 62.1.3 Plate loop count......................................................................62.1.4 Pectin gel plate count............................................................. 82.1.5 Spiral plate count method.......................................................82.1.6 Hydrophobic grid membrane filter method........................... 92.1.7 Direct microscopic count method.........................................102.1.8 Direct epifluorescent filter technique....................................11
2.2 Indirect methods for evaluating bacteriological quality of milk 122.2.1 Dye reduction.......................................................................122.2.2 Impedance method................................................................122.2.3 Bioluminescence...................................................................14
2.3 Application of ATP bioluminescence in the dairy and foodindustry.......................................................................................... 152.3.1 Determination of bacteriological quality o f raw milk 162.3.2 Prediction of shelf-life of pasteurized milk and cream 192.3.3 Monitoring starter culture activity.................................... 212.3.4 Detection of enzymes.........................................................212.3.5 Detection of antibiotics in milk..........................................222.3.6 Evaluation of the somatic cell content o f milk..................222.3.7 Estimation of microbial levels in meat............................... 232.3.8 Evaluation of microbial activity in orange juice................242.3.9 Monitoring recovery of microorganisms from freeze
injury.............................................................................. 242.3.10 Hygiene monitoring............................................................. 24
iii
Reproduced with permission of the copyright owner. Further reproduction prohibited without permission.
2.4 Clinical applications of ATP bioluminescence......................................252.5 Psychrotrophic bacteria.............................................................262.6 Preliminary incubation..............................................................27
3 MATERIALS AND METHODS.................................................................... 303.1 Collection of milk samples..................................................................30
3.1.1 Raw milk............................................................................... 303.1.2 Pasteurized milk.................................................................. 30
3.2 Preliminary incubation........................................................................ 303.3 Standard plate count...............................................................313.4 Bioluminescence assay........................................................................ 32
3.4.1 Preparation of reagents....................................................... 333.4.2 Assay procedure.................................................................. 33
3.5 Statistical analyses................................................................. 34
4 RESULTS AND DISCUSSION.......................................................................384.1 Relationship between relative light unit measurements and
standard plate count: raw milk.............. 384.2 Relationship between relative light unit measurements and
standard plate count: pasteurized milk............................................... 56
5 SUMMARY AND CONCLUSIONS...............................................................66
BIBLIOGRAPHY......................................................................................................... 70
VITA............................................................................................................................... 83
iv
Reproduced with permission of the copyright owner. Further reproduction prohibited without permission.
LIST OF TABLES
1. Summary of results from the SAS® Univariate procedure for standardplate count (SPC) and relative light units (RLU) of all raw milk samples by treatment.............................................................................................................. 39
2. Summary of results from the SAS® Univariate procedure for logio standardplate count (LSPC) and logio relative light units (LRLU) of raw milk samples by treatment...........................................................................................40
3. Results of the multiple slope and intercept regression model.......................... 49
4. Results o f regression analysis of LSPC and LRLU of FRESH sampleswithin the SPC range of 1 x 10⁴ to 1 x 10® cfu/ml and samples preliminarily incubated at 12.8 °C and 15.6 °C for 18 hours.................................................. 57
5. Summary of results from the SAS® Univariate procedure for standard plate count (SPC) and relative light units (RLU) of pasteurized milk samplesby treatment..........................................................................................................58
6. Summary of results from the SAS® Univariate procedure for logio standardplate count (LSPC) and logio relative light units (LRLU) of pasteurized milk samples by treatment............................................................................................59
v
Reproduced with permission of the copyright owner. Further reproduction prohibited without permission.

LIST OF FIGURES
1. Residual LSPC by predicted LSPC for fresh raw milk samples........................43
2. Residual LSPC by predicted LSPC for PI-12.8 °C raw milk samples..............44
3. Residual LSPC by predicted LSPC for PI-15.6 °C raw milk samples..............45
4. Predicted and observed values of LSPC resulting from multiple slopes andintercepts regression model (4) of raw milk samples (FRESH, PI-12.8, and PI-15.6)..............................................................................................................48
5. Predicted values for LSPC + 1 standard deviation for an individualprediction in fresh raw milk..............................................................................50
6 . Predicted values for LSPC + 1 standard deviation for an individualprediction in PI-12.8 raw milk.........................................................................51
7. Predicted values for LSPC + 1 standard deviation for an individualprediction in PI-15.6 raw milk.........................................................................52
8. Predicted values for LSPC + 1 standard deviation for an individualprediction in all raw milk samples combined.................................................... 53
9. Residual LSPC by predicted LSPC for PI-21 pasteurized milk samples 62
10. Predicted and observed values for LSPC by LRLU in PI-21 pasteurized milk.................................................................................................................... 63
11. Predicted values for LSPC + 1 standard deviation for an individual prediction in PI-21 pasteurized milk.................................................................64
vi
Reproduced with permission of the copyright owner. Further reproduction prohibited without permission.

ABSTRACT
Raw milk samples (n = 246) and pasteurized milk samples (n = 104) were
analyzed to determine adenosine triphosphate (ATP) and compared with the standard
plate count (SPC). An ATP filtration method was used to filter milk samples prior to
ATP determination, which was measured in relative light units (RLU). The ATP assay
took approximately 7 minutes to complete and could allow rapid prediction of SPC
which is a measure of raw milk quality.
Linear regression analysis was performed on data from three raw milk
treatments defined as; fresh milk samples, samples preliminarily incubated at
12.8 and 15.6 °C for 18 hours. Linear regression coefficients were significantly
different from zero (P < 0.01). The R2 calculated using logio transformed SPC (LSPC)
and logio RLU (LRLU) for fresh and preliminarily incubated samples at 12.8 and
15.6 °C were 0.58, 0.78, and 0.80, respectively and R2 for all milk samples combined
was 0.78. Differences in regressions among treatments were tested using a multiple
slope and intercept model. The R2 for the multiple slope model was 0.83 and the
treatment intercepts and slopes were significantly different (P < 0.01). Analysis of
predicted values of LSPC and one standard deviation of a single prediction above and
below the regression line indicated that SPC could be predicted with sufficient accuracy
using ATP in raw milk samples.
Pasteurized milk samples were subjected to two preliminary incubation
temperatures: 12.8 and 15.6 °C for 18 hours. All of the 104 fresh pasteurized milk
vii
Reproduced with permission of the copyright owner. Further reproduction prohibited without permission.

samples had a SPC count below 104 cfii/ml. Regression analyses as described for raw
milk samples revealed that preliminary incubation at 15.6 °C for 18 hours did not result
in a significant increase in the standard plate count of the same samples. The ATP
method was not effective in predicting bacterial numbers of freshly pasteurized milk or
PI-15.6°C milk samples using linear regression. However, the SPC and RLU values
increased for PI-21 °C pasteurized milk and the regression analyses revealed that there
was a linear relationship between LSPC and LRLU for PI-21°C samples.
viii
Reproduced with permission of the copyright owner. Further reproduction prohibited without permission.

CHAPTER 1
INTRODUCTION
In the dairy industry there is an increasing demand for rapid determination of
the bacteriological quality of raw milk being received at dairy processing plants.
Production of superior quality dairy products requires high quality raw milk.
The standard plate count is considered an official method for measuring
bacterial populations in most types of daiiy products. Results o f the standard plate
count can be affected by many factors such as composition and temperature of the
nutrient medium, time and temperature of incubation, and skill o f the technician who
performs the tests and counts the bacterial colonies. Therefore, a definite need to
evaluate alternate methods for determination of bacterial numbers in raw and
pasteurized milk exist.
Of the emerging technologies used for rapid microbiological analysis, the
technique giving results in the shortest time is adenosine triphosphate (ATP)
bioluminescence. The ATP molecule can be assayed using an enzyme and coenzyme
complex (luciferin - luciferase) found in the tail of the firefly, Photinus pyralis. The
reaction is the conversion of the ATP to photons of light:
Luciferin + ATP + Mg2+ + luciferase > oxyluciferin + AMP + C02 + light.
The amount of light emitted during the reaction is assumed to be proportional to the
number of bacteria present.
1
Reproduced with permission of the copyright owner. Further reproduction prohibited without permission.

2
The ATP bioluminescence assay has been used for a variety of applications in
the dairy and the food industry (45, 49, 50). In 1970, Sharp et al. (102) were the first
to determine ATP levels in milk contaminated by bacteria. Since then, bioluminescence
has been used with varying degrees of success to determine bacterial numbers in
milk (49). The most widely used current application is for the estimation of surface
cleanliness (49, 50).
Availability of purified reagents to remove non microbial ATP as well as semi
automated instruments to measure the light output have improved the sensitivity o f the
ATP bioluminescence assay. Thus, a need exists to investigate the potential of these
improvements in the ATP bioassay in estimating the bacterial numbers in raw and
pasteurized milk exist.
An important concern of milk processors today is the need for a rapid method
to determine the quality of raw milk received and potential shelf-life of their
products(l 1). Preliminary incubation (PI) count is a good index of the microbiological
quality of raw milk (99). The low temperature incubation of milk allows the growth
of psychrotrophic contaminants only and is a good indication of unsanitary production
and handling practices (58). Preliminary incubation at 12.8 °C for 18 hours followed
by a plate count is a recommended method for assessing the microbiological quality of
raw milk.
Many tests have been evaluated to predict shelf-life of pasteurized milk (8, 9,
10, 11, 14). Initial bacteria counts have proven to be of limited value in predicting the
Reproduced with permission of the copyright owner. Further reproduction prohibited without permission.

3
keeping quality of milk(l 1). The Mosely test has been widely accepted as an indicator
of shelf-life of milk, but the time needed to obtain results limits the practicality of its
use in monitoring the quality of a perishable product.
The basis o f any test for keeping quality of pasteurized milk must emphasize
those organisms that can grow fast and spoil the product under refrigerated conditions.
Several researchers have reported that the preliminary incubation count, which is a
plate count following incubation of milk at 21°C for 18 hours, was a better indicator
of the shelf-life of pasteurized milk than a standard plate count (11, 13, 14). Therefore,
a need to investigate the use of ATP analysis on preliminarily incubated pasteurized
milk samples exists.
The objectives of this research were as follows:
1. To determine the relationship between adenosine triphosphate (ATP)
content as measured in relative light units (RLU) and bacterial numbers
using an ATP filtration method and standard plate count (SPC) in raw,
pasteurized, and preliminarily incubated raw and pasteurized milk samples.
2. To investigate prediction of standard plate counts using regression modeling
and RLU values.
3. To compare relationships between SPC and ATP found in fresh samples to
samples preliminarily incubated at 12.8 and 15.6 °C for raw milk and 15.6
and 21 °C for pasteurized milk.
Reproduced with permission of the copyright owner. Further reproduction prohibited without permission.

CHAPTER 2
LITERATURE REVIEW
Milk is an excellent medium for the growth of most microorganisms due to its
protein, carbohydrate, vitamin, minerals, and water content. The major sources of
bacteria in raw milk are udder contaminants and improperly cleaned and sanitized
equipment (28). Enumeration of bacteria in raw and pasteurized milk is of public
health and economic importance.
In 1905, the American Public Health Association standardized the procedures
for the microbiological examination of milk (96). Since then, research has been
directed toward the development of more suitable methods for determining the
bacteriological quality of raw and pasteurized milk (7). The dairy industry has a critical
need for rapid methods to evaluate the bacteriological quality of milk received at the
dairy plant.
There are many different methods available for testing the microbiological
quality of milk. These methods can be divided into two groups: direct methods and
indirect methods. In direct methods bacterial cells are counted and in the indirect
methods, either a chemical constituent, enzyme, metabolite, or changes produced by
bacteria during growth are measured.
4
Reproduced with permission of the copyright owner. Further reproduction prohibited without permission.

2.1 DIRECT METHODS FOR EVALUATINGBACTERIOLOGICAL QUALITY OF MILK
2.1.1 Standard Plate Count
The standard plate count (SPC) is a widely accepted method for
determining the bacterial count of raw and pasteurized milk for regulatory
purposes (74). In the determination of SPC, an aliquot of milk sample is aseptically
transferred to a sterile petri dish and liquefied standard methods agar at 45 °C is poured
into the dish. After spreading the mixture evenly over the bottom o f the plate, the agar
is allowed to solidify and plates incubated at 32 + 1 °C for 48 + 3 hours. After
incubation, colonies are counted according to a specific set of rules(74).
The basic assumption of the standard plate count is that a single viable cell,
when placed in an appropriate medium and incubated at an appropriate temperature,
will multiply to the point where a visible colony is produced (106). However, the basic
assumption of the standard plate count procedure may be invalid in some instances
when colonies arise from pairs, chains, or clusters of cells (57, 74). In addition, the
standard plate count has also been criticized as time consuming, expensive, and slow as
a means of estimating bacterial population. (3, 38, 43). Another drawback of the
method has been that it enumerates only those bacteria that are capable of growing
aerobically on standard methods agar and producing visible colonies at 32 °C within 48
hours. The standard plate count does not differentiate between those organisms that
survived pasteurization and those that entered the product after pasteurization (15).
Reproduced with permission of the copyright owner. Further reproduction prohibited without permission.
6
2.1.2 Petrifilm Aerobic Count Method
Petrifilm ™ aerobic count method uses a base paper film coated with nutrients
of standard methods agar and an overlay of thin transparent film coated with a cold
water soluble gelling agent and 2,3,5-triphenyltetrazolium chloride as an indicator (27).
One ml of diluted or undiluted sample is placed in the center o f the bottom layer
and the upper film is carefully rolled into place over the bottom film. The sample is
distributed evenly over 20 cm2 by means of a plastic plate (27). The gelling agent
solidifies within a few minutes, and the plates are incubated as in the SPC method.
When bacteria grow on the film, they reduce the tetrazolium indicator, resulting in the
production of red colonies (76). The petrifilm system eliminates the need of media
preparation, sterilization, and pouring of plates. The usefulness of this method for the
determination of bacteriological examination of milk and dairy products has been
studied in depth (26, 42). Mian (79) reported a correlation coefficient of 0.99
between the petrifilm and standard plate count methods. Bishop and Juan (12)
compared the petrifilm technique with the agar pour plate method for the modified
psychrotrophic bacteria count and reported a correlation coefficient of 0.96 between
the two.
2.1.3 Plate Loop Count
The plate loop count procedure, originally developed by Thompson et al.(l 18),
was an alternative method for standard plate count and was specifically used for the
examination of raw milk (74). This method required a standardized loop, calibrated to
Reproduced with permission of the copyright owner. Further reproduction prohibited without permission.

7
deliver 0.01 or 0.001 ml of milk. The loop, made of platinum rhodium or platinum
iridium wire, was inserted into a syringe and sterile dilution water was pumped into the
syringe. A loopful of milk was removed from the sample container and transferred by
rinsing with a 1 ml discharge from the syringe into a sterile petri dish. The pouring of
agar, incubation of plates and counting of colonies etc. are similar to the standard plate
count.
Several studies have been reported which compare the plate loop counts to
standard plate count. Thompson et al. (118) reported that the plate loop count is a
faster method than the standard plate count while Tatini et al. (114) reported that when
raw milk samples exceeded 100,000 bacteria per ml, the plate loop count
underestimated the bacterial population. The explanation for the latter observation was
that a larger number of bacterial clumps are associated with a higher bacterial
population. In the standard plate count procedure, shaking of dilution bottles could
reduce the clump size and increase the count.
Brodsky and Ciebin (21) reported a collaborative evaluation of the plate loop
count method done with 29 technicians in 13 laboratories. The plate loop count was
found to be as accurate as the standard plate count for measuring the bacterial content
of raw milk samples. Olsen and Richardson (86) modified the plate loop count
procedure by reducing the volume of the diluent from 1.0 to 0.5 ml and spreading the
dilution over pre-poured agar plates using a glass spreader. A correlation of 0.91 was
reported between this modified technique and the original method.
Reproduced with permission of the copyright owner. Further reproduction prohibited without permission.

8
The most critical factor involved in performing the plate loop count is volume
of milk delivered by the loop (61, 119). One of the most commercially successful
automated plate loop machines is the Petrifoss, which is widely used in the milk testing
laboratories in Europe (92).
2.1.4 Pectin Gel Plate Count
The pectin gel plate count, as outlined in Standard Methods fo r the
Examination o f Dairy Products (74) is an alternate method for determining the
bacterial count o f raw milk. Pretreated petri dishes containing a thin “hardener” and a
liquid nutrient medium containing pectin as the gelling agent are used. A sample is
added to the poured plates which are rotated to mix the sample. The medium
solidifies at room temperature and the plates are incubated and counted as in the
standard plate count method. The method has been collaboratively studied with milk,
cream, and cultured products (97).
2.1.5 Spiral Plate Count Method
The spiral plating technique does not differ significantly from SPC, yet has the
advantage of requiring less time, space, and equipment. This technique was developed
by Gilchrist et al. (41) in 1973 and was used for the estimation of viable bacterial
counts in raw and pasteurized milk and milk products. The method avoided the use of
a dilution series and worked well for samples containing 500 to 500,000 bacteria per
ml. The spiral plater deposited a known volume of sample on a rotating plate in a
decreasing amount in the form of an Archimedes spiral (41). After incubation, closely
Reproduced with permission of the copyright owner. Further reproduction prohibited without permission.

packed or confluent colonies could be observed in the center and well isolated colonies
on the outside. A counting grid which related to the area of the plate to the volume of
the sample was used to convert the count in a certain area to the number of bacteria per
ml o f the sample. A laser colony counter or image analyser can be used to count the
plate in a few seconds.
Using this method, milk with a bacterial count in the range of 500-500,000 per
ml can be analyzed much faster than the standard plate count method. O’Connor and
Fleming (83) found that the overall geometric mean of the spiral plate count was 33%
lower than the standard plate count while Peeler et al., ( 89) found no difference
between the spiral plate count and the standard plate count.
2.1.6 Hydrophobic Grid Membrane Filter Method
The hydrophobic grid membrane filter method is a most probable number
method for estimating the bacterial count in milk and milk products (74). The method,
described by Sharpe and Michaud (103) in 1974, reduced the need for dilutions of the
sample before enumeration, and reduced the processing time, and gave better recovery
than conventional filters.
The hydrophobic grid membrane filter method uses a membrane filter imprinted
with hydrophobic material in a grid pattern. The filter is divided into a number of
compartments, usually 2000-4000 depending on the size of the grids. Following
filtration of the sample, the filter is placed on a pad soaked in nutrient medium and after
48 hours of incubation at 32 °C, colonies are counted (74).
Reproduced with permission of the copyright owner. Further reproduction prohibited without permission.

10
In 1979, Sharpe et al. (104) used the hydrophobic grid membrane filters
successfully to enumerate coliforms in a variety of foods. A year later, Peterkin and
Sharpe (90) found that pre-treatment of milk and milk products with either a
proteolytic enzyme, a detergent, or both, improved the filtration sufficiently to enable
3-5 g to be filtered. This method required a lengthy incubation period like the standard
plate count, but had the advantage of reducing the operator time.
2.1.7 Direct Microscopic Count Method
The direct microscopic count can be used for the examination of milk for
numbers of bacterial clumps or somatic cells. The method allows the evaluation of
distinctive morphology and arrangement of bacteria. This is a procedure which takes
approximately 15 minutes and involves preparation of milk films, staining with
Newman-Lampert stain, and microscopic examination.
The direct microscopic count method has been studied by several researchers
(54, 55, 84). It has been pointed out that the results of direct microscopic counts
were to be considered as estimates only. A very small sample volume (0.01 ml) is used
which may lead to increased errors and lack of sensitivity. Other disadvantages
reported were failure of some bacteria to stain, irregular distribution of bacteria in the
films, and operator fatigue resulting from prolonged use of the microscope (92).
Moreover, direct microscopic counts of raw milk are not sufficiently accurate (74).
Reproduced with permission of the copyright owner. Further reproduction prohibited without permission.

11
2.1.8 Direct Epifluorescent Filter Technique
The direct epifluorescent filter technique (DEFT) was originally developed by
Pettipher et al. (91) as a rapid method for the determination of bacteria in raw milk.
The procedure used membrane filtration, fluorescent staining, and epifluorescence
microscopy and involved pretreatment of the milk with a proteolytic enzyme and
surfactant in order to disperse somatic cells and fat sufficiently to enable at least 2 ml to
filter through a 0.6 jim membrane filter. Bacterial cells remained intact and were
concentrated on the membrane. After staining with acridine orange, the bacteria
fluoresce orange-red under blue light to allow counting using an epifluorescence
microscope. The DEFT count was rapid and correlated well with the standard plate
count (33). One of the major disadvantages of the DEFT method is operator fatigue
associated with prolonged use of the microscope.
Byrne and Bishop (23) evaluated three techniques- Limulus Amoebocyte Lysate
Assay, DEFT, and modified psychrotrophic bacteria count (mPBC)- after preliminary
incubation, for their ability to predict shelf-life of pasteurized fluid milk. They reported
a correlation of -0.85 between DEFT in conjunction with preliminary incubation and
shelf-life.
Reproduced with permission of the copyright owner. Further reproduction prohibited without permission.

12
2.2 INDIRECT METHODS FOR EVALUATING BACTERIOLOGICAL QUALITY OF MILK
2.2.1 Dye Reduction
The dye reduction test is based on the ability o f bacterial enzymes to transfer
hydrogen from a substrate to a redox dye, which then undergoes a change in color.
The rate o f reduction is based on enzyme activity and can be used as an index of the
number of bacteria present in milk (92). The reduction time is inversely related to the
bacterial content of the sample. Dye reduction tests were developed during the 1930s
and used for the bacteriological examination of raw milk. Commonly used redox dyes
are methylene blue and resazurin.
The primary advantage of dye reduction tests is that it requires small amounts
o f equipment. Luck (71) in 1982 observed a correlation coefficient of 0.90 between
logio plate count and methylene blue reduction time, but in some cases, the dye
reduction times failed to correlate with the bacterial population because the reducing
activity of bacterial species may vary.
2.2.2 Impedance Method
The impedance method is applicable for estimating bacteria in raw and
pasteurized milk (40). Impedance is the resistance to flow of an alternating current
through a conducting material. Bacterial concentrations are determined by measuring
the changes in the electrical conductivity caused by the metabolic activity o f the
Reproduced with permission of the copyright owner. Further reproduction prohibited without permission.

13
microbes present in a particular sample (39). This method is listed in the Standard
Methods for the Examination o f Dairy Products (74) as an alternative
method for standard plate count to estimate the bacterial numbers in raw and
pasteurized milk.
The metabolic activity of microorganisms resulted in the conversion of
nonelectrolytes such as lactose to ionic compounds like pyruvic acid which caused
impedance changes in the medium (74). Automated instruments are available to
monitor bacterial growth based on impedance measurements. The impedance signal of
the nutrient media remains constant until microorganisms in the sample reaches a
threshold level of 106 colony forming units (cfii) per ml. (9). The interval between the
inoculation of the sample into a module and the detection of a change in impedance is
called the impedance detection time (52). The shorter the impedance detection time,
the larger the bacterial population in a particular sample.
In 1978, Cady et al. (24) studied the usefulness of the electrical impedance
method for testing the bacteriological quality of raw milk samples and reported that
impedance detection time correlated well with the bacterial population. Bishop et al.
(9) studied the usefulness of the impedimetric method for determining the potential
shelf-life of pasteurized whole milk. They reported that none of the direct methods
(SPC, PBC, and mPBC) correlated well enough with shelf-life to allow shelf-life
prediction. However, impedance detection time at 21 °C and 18 °C proved to have the
most significant relationships to shelf-life with correlation coefficients of 0.88 and 0.87,
Reproduced with permission of the copyright owner. Further reproduction prohibited without permission.

14
respectively. Firstenberg-Eden and Tricarcio (37) reported a correlation of 0.95
between impedance detection time and standard plate count for raw milk samples.
Phillips and Griffiths (93) investigated the suitability of impedance detection time for
predicting the shelf-life of pasteurized milk and cream. The impedance measurements
on pasteurized milk and cream, preliminarily incubated at 21 °C for 25 hours in the
presence of crystal violet-penicillin-nisin solution, was directly proportional to shelf-life
with regression coefficients ranging from 0.62 to 0.82. Martins et al. (75) reported the
impedance method to be superior to the standard plate count and the psycrotrophic
plate count for prediction of pasteurized milk shelf-life.
2.2.3 Bioluminescence
Adenosine triphosphate (ATP) bioluminescence assay is another indirect
method for determining bacterial population in milk samples. The significance of ATP
in the metabolism of living cells indicates that ATP assay should be an excellent
monitor of microbial activity (92). All living cells contain the ATP molecule as an
energy storing substrate(34, 68, 106). Cells maintain a relatively constant level of
ATP when kept under specific environmental conditions and dead cells rapidly lose
their ATP through autolysis(32). There is a fairly constant ratio of ATP to
biomass/number of cells for all microbial taxa, independent of metabolic activity or
environmental conditions (45).
In 1947, McElroy (77) showed that the luminescence of extracts from firefly
could be restored by addition of ATP. D’Eustachio and Johnson (35) sought a
Reproduced with permission of the copyright owner. Further reproduction prohibited without permission.

15
means of enumerating microorganisms based on ATP and found that the amount of
ATP/cell was relatively constant across all phases of growth. Studies of the
cellular ATP content of Escherichia coli, Pseudomonas fluorescens, and Bacillus
subtilis, throughout the three phases of growth showed that very little variation of
ATP content occurred (32).
Adenosine triphosphate may be assayed using the enzyme and coenzyme
complex, luciferase-luciferin, found in the tail of the firefly, Photinuspyralis. The
reaction is the conversion of ATP to photons of light which is shown by the following
chemical equation:
Luciferin + ATP + Mg2+ + Luciferase > oxyluciferin + AMP + CO2 + light.
The applications of ATP bioluminescence assay to determine the microbial populations
of various substances have been studied by several researchers (4, 47, 49, 50, 67, 82,
87, 88, 107, 109, 110, 111, 112, 115 121, 125).
2.3 APPLICATION OF ATP BIOLUMINESCENCE IN THE DAIRY AND FOOD INDUSTRY
There have been broad applications of ATP bioluminescence in the food
industry such as determination of the bacteriological quality of fluid milk (20, 116),
carbonated beverages (70), meat (6), enumeration of somatic cells in milk (73, 109),
detection of antibiotics in milk (133), prediction of shelf-life of pasteurized milk (11,
132) and limited use in the assessment of water quality (32, 62, 69).
Reproduced with permission of the copyright owner. Further reproduction prohibited without permission.

16
2.3.1 Determination of Bacteriological Quality of Raw Milk
Sharpe et al. (102) were the first to determine ATP levels in milk with the use
of a Luminescence Biometer and the reagents utilized were luciferin/luciferase,
n-Butanol, and n-Octanol with buffer solution. The ATP levels of microorganisms or
foods were determined.
In 1981, Bossuyt (17) developed an ATP assay technique for determination of
bacteriological quality of raw milk using NRS (nucleotide releasing reagent for somatic
cells) and an EDTA-apyrase solution which destroyed most of the somatic cell ATP.
Bossuyt found a correlation coefficient of 0.93 between the bacterial ATP content and
plate count. The correlation coefficient was lower in samples having a total colony
count below 10s bacteria per ml.
In 1982, Bossuyt (18) developed a rapid ATP platform test for judging the
bacteriological quality of raw milk, which took only 5 minutes and allowed a distinction
between bacteriologically poor milk and ‘normal’ milk. A correlation coefficient of
0.83 was observed between the standard plate count and ATP platform test, but the
method failed to correlate well with colony counts below 106 cfii/ml milk.
Botha et al. (19) modified Bossuyt’s procedure by reducing the incubation time
of the milk with somase. It was reported that the method was not very sensitive
for estimating the bacterial population of raw milk due to the presence of ATP from
the somatic cell.
Reproduced with permission of the copyright owner. Further reproduction prohibited without permission.
17
Theron et al. (117) studied the effectiveness of somatic cell extraction reagents
and ATPase (apyrase) in destroying non-bacterial ATP in raw milk and the effect of
these reagents on the bacterial ATP content. Treatments to release the ATP from
somatic cells significantly reduced the ATP content of Enterobacter cloacae in skim
and raw milk. Somatic cell ATP releasing reagents used were EDTA and apyrase. It
was reported that the reagents available were not appropriate for selectively destroying
all non-bacterial ATP without affecting the ATP of the bacterial cells.
In 1986, Botha et al. (20) studied the presence and origin of ATP converting
enzymes in milk and the extent to which they were responsible for the variations found
in the ATP assay technique. The ATPase activity of both somatic cells and bacterial
cells (Pseudomonas fluorescens) was determined in milk. Somatic cells, when present
in large numbers, produced sufficient enzyme to hydrolyze extracted ATP and a strong
relationship existed between ATPase activity and somatic cell counts. They reported a
highly significant correlation (r = 0.91) between the count of Pseudomonas fluorescens
and the resultant ATPase activity. However, the ATPase activity did not influence the
ATP assay because the enzyme was produced in the late exponential phase and the
early stationary phase of growth.
Langeveld et al. (65) compared three rapid methods for estimating the microbial
quality of raw milk; the ATP platform test, the Delta ATP test and the direct
Reproduced with permission of the copyright owner. Further reproduction prohibited without permission.

18
microscopic counting method. Results obtained with these tests carried out on raw
milk samples with different bacterial counts, were compared. They concluded that the
ATP platform test appeared to be too insensitive to be useful for raw milk application.
The Delta ATP method and the direct microscopic count are useful when the colony
count is over 105/ml.
Crombrugge et al. (30) developed an ATP bioluminescence assay procedure
which was an improvement of the ATP platform test developed by Bossuyt (18) for
judging the bacteriological quality of milk. Webster et al. (129) used a nucleotide
releasing agent for bacteria in his work on ATP in raw milk samples.
Griffiths et al. (48) described another test which utilized a new somatic cell
lysing reagent to remove non-microbial ATP from milk and reported a significant
correlation between log ATP and log plate count (r= 0.64; n=240; P<0.001). Bautista
et al. (5) evaluated the suitability of the new ATP bioluminescence assay described by
Griffiths et al. (48) using several raw milk samples. These workers reported a good
correlation (regression coefficient = 0.78) between the ATP method and plate count for
milk samples with counts above 1 X 10⁴ cfu/ml. They concluded the test procedure
may best be employed as a platform test only because of the lack of sensitivity of the
technique to estimate bacterial numbers of milk containing less than 1 x 10⁴ cfu/ml.
Reproduced with permission of the copyright owner. Further reproduction prohibited without permission.

19
2.3.2 Prediction of Shelf-life of Pasteurized Milk and Cream
The shelf-life of pasteurized milk is associated with post pasteurization
contamination by Gram-negative psychrotrophic bacteria (5, 101). Several chemical
inhibitors in combination with preliminaiy incubation have been used to select for
Gram-negative bacteria. Benzalkonium chloride, a combination of benzalkonium
chloride and crystal violet, and a combination of crystal violet, penicillin, and nisin
were some of the chemical inhibitors used for the selective growth of Gram-negative
bacteria (94).
The applicability o f ATP bioluminescence assay for predicting the shelf-life of
pasteurized milk and cream was studied by several researchers (5, 46, 93, 128). Waes
and Bossuyt (128) discussed the usefulness of benzalkon-crystal violet-ATP (BC-ATP)
method for predicting the keeping quality of pasteurized milk. They indicated that by
using the method, post-pasteurization contamination of pasteurized milk caused by
Gram-negative bacteria could be determined within 24 hours. The benzalkon-crystal
violet-ATP method not only was useful for detecting post-pasteurization contamination
of pasteurized milk but also for predicting keeping quality. Both the shelf life test and
the Moseley test showed a good relationship with the BC-ATP method.
Griffiths et al. (46) reviewed different methods for the rapid detection of
post-pasteurization contamination in cream. They suggested that pre-incubation of the
cream at 21 °C for 25 hours in the presence of inhibitors for the Gram-positive
organisms provided a good index of the level of post-pasteurization contamination.
Reproduced with permission of the copyright owner. Further reproduction prohibited without permission.

20
Enumeration of the organisms in the pre-incubated sample was carried out by standard
plate count, ATP bioluminescence, and direct epifluorescent filter technique. It was
concluded that all three methods were useful in enumerating bacteria. However, in the
case o f ATP bioluminescence and direct epifluorescent filter technique, an indication of
the extent of post-pasteurization contamination may be obtained within 26 hours of
processing.
Phillips et al. (93) investigated the use of bioluminescence and impedimetric
methods for assessing the shelf-life o f pasteurized milk and cream. The bacterial
content of pasteurized milk and cream after incubation at 21 °C for 25 hours in the
presence of crystal violet-penicillin-nisin solution was found to be inversely
proportional to the shelf-life of the product at 6 °C. The regression coefficient ranged
from -0.76 to -0.87. The bacterial enumeration by plate count took approximately 50
hours, whereas ATP estimation by bioluminescence took only 26 hours. Impedance
measurements on pasteurized milk and cream containing crystal violet- penicillin-nisin
solution at 21 °C showed that detection times are directly proportional to shelf-life;
regression coefficients ranged from 0.62 to 0.82.
Bautista et al. (5) investigated the use of ATP bioluminescence assay with
preincubation procedures for predicting the shelf-life of pasteurized milk. It was
reported that the best correlations were obtained when milk samples were preincubated
at 15 °C or at 21 °C for 25 hours in the presence of an inhibitor system to prevent gram
positive bacterial growth.
Reproduced with permission of the copyright owner. Further reproduction prohibited without permission.
21
Waes et al. (127) described a rapid method for the detection of non-sterile UHT
milk by the determination of the bacterial ATP. The method was compared with
the commonly used pH method. The UHT milk, in the original package, was incubated
at 30 °C and after 1, 2, and/or 3 days, the bacterial ATP content in 50 1 of milk was
determined by means of a luminometer. They indicated that UHT milk was not
commercially sterile if the bacterial ATP content was higher than 1000 RLU per 50 1
of milk. The conclusion was the ATP method was more sensitive than the pH method
for detecting non-sterility in UHT milk.
2.3.3 Monitoring Starter Culture Activity
Griffiths (50) discussed the use of ATP bioluminescence assay for monitoring
starter culture activity. He suggested that the concentration of ATP may provide a
better indication o f the activity of lactic acid bacteria than measurement of pH changes
because ATP was an integral part of the metabolism of bacterial cells. Cardwell and
Sasso (25) observed a strong correlation between acid production and ATP
concentration for a number of lactic acid bacteria, including Lactococcus lactis and
Lactobacillus acidophilus.
2.3.4 Detection of Enzymes
The development of bioluminescence assays for the detection of a variety of
enzymes of importance in the dairy industry have been described by several researchers
(49, 98, 123, 134) . Proteases, produced by psychrotrophic bacteria during growth in
milk are not easily destroyed by pasteurization and thus reduce the shelf-life of
Reproduced with permission of the copyright owner. Further reproduction prohibited without permission.

22
pasteurized milk (95). Rowe et al. (98) described an assay for the detection of
proteases. The assay was based on the rate of inactivation of luciferase, due to
proteolysis by the protease. The rate of proteolysis of luciferase was directly
proportional to the protease concentration and they concluded that protease could be
detected in milk at concentrations as low as 0.01 U/ml.
Griffiths (49) discussed the possibilities for the development of bioluminescence
assays for the detection of thermostable lipases produced by psychrotrophic bacteria
that limit the shelf-life of pasteurized milk. Ugarova et al. (123) were successful in
synthesizing a bioluminescent substrate, D-luciferin-0-/?-galactoside, which may be
useful in detecting /7-galactosidase in milk. /J-galactosidase hydrolyzes the lactose in
milk so that it can be consumed by the lactose-intolerant population.
2.3.5 Detection of Antibiotics in Milk
Westhoff and Engler (130) developed a procedure using the measurement of
ATP by bioluminescence for detection of penicillin in milk. Following an incubation
period of 3 hours, the method detected penicillin at 0.015 unit per ml when a 5%
inoculum of Bacillus subtilis was used as the test culture.
2.3.6 Evaluation of the Somatic Cell Content of Milk
Bossuyt (16) discussed the usefulness of an ATP assay technique in evaluating the
somatic cell content of milk. The concentration of ATP in milk was determined
following treatment with a nonionic detergent, Triton X-100. Bossuyt indicated that
the technique could be used as an index of mastitis. Malkamaki et al. (73) proposed
Reproduced with permission of the copyright owner. Further reproduction prohibited without permission.

23
an alternative method for detecting mastitis by bioluminescence assay. Bacterial
growth was monitored by ATP concentration and the increase in bacterial ATP
concentration correlated well with inflammatory markers for mastitis
2.3.7 Estimation of Microbial Levels in Meat
Kennedy and Oblinger (60) investigated the application of a commercially
available rapid bioluminescent ATP assay system for estimating total microbial levels
in ground beef. They reported a correlation coefficient of 0.86 between logio
microbial ATP and log]0 plate count for samples from the retail markets and a
correlation of 0.99 for samples from a processing facility.
Bautista et al. (6) have developed a rapid method, which took less than 15
minutes, to assess the microbiological quality of chicken carcasses using the ATP
bioluminescence assay. Their modified ATP bioluminescence assay produced an
acceptable correlation with plate counts ( r = 0.85, p < 0.001). Siragusa et al. (105)
developed a new microbial ATP bioluminescence assay for determining the levels of
bacterial contamination on beef and pork carcasses sampled in commercial processing
plants. The correlation between microbial ATP assay and standard plate count for beef
and pork carcasses sampled in commercial processing were 0.91 and 0.93, respectively.
Cutter et al. (31) developed a new rapid ATP bioluminescence assay
(R-mATP) that could be used to determine the levels of generic bacterial contamination
on meat-animal carcasses. They concluded that the R-mATP assay was a rapid means
of estimating the microbial load of an animal carcass.
Reproduced with permission of the copyright owner. Further reproduction prohibited without permission.

24
2.3.8 Evaluation of Microbial Activity in Orange Juice
Graumlich (44) investigated the feasibility of applying bioluminescent
measurement of microbial ATP for the evaluation of microbial activity in orange juice.
A high correlation was reported between bioluminescent measurement and microbial
plate count for orange juice samples incubated for 24 hours after reconstituting.
2.3.9 Monitoring Recovery of Microorganisms From Freeze Injury
Ellison et al. (36) described the application of in vivo bioluminescence to
monitor the recovery of Salmonella typhimurium from freeze injury. They suggested
that bioluminescence may provide a novel tool with which time required for the
recovery of microorganisms from sub-lethal injury can be probed. This is an
important aspect in the enumeration of microorganisms in food and environmental
samples.
2.3.10 Hygiene Monitoring
There is an increasing demand for application of ATP bioluminescence for
hygiene monitoring in the food industry (5, 50, 63). Swabbing and plate count
procedures detect only microbial contamination of the surface and may not tell whether
the surface has been cleaned properly. Whereas, ATP bioluminescence detected
microbial contamination as well as cleanliness for it measures contamination by both
microorganisms and food residues (5). The ATP hygiene monitoring technique has
been used in a variety of processing plants such as breweries, dairy plants, and fruit
juice operations (5). Successful application of ATP bioluminescence to the dairy
Reproduced with permission of the copyright owner. Further reproduction prohibited without permission.

25
industry for monitoring the cleaning efficiency of a variety of surfaces such as milk
tankers, silos, bottle/carton fillers, fermentation vats and cheese molds was reported
(64).
Griffiths (51) reviewed the development of ATP bioluminescence assays in the
food industry, especially for hygiene monitoring. He stated that although there was an
interest in the application of ATP bioluminescence for assessing microbial
contamination of food, it was not until the early 1990s that the technique came of age
in the food industry. This resurgence of interest in ATP bioluminescence techniques
was the result of advances in reagent and instrument technology. Some o f the hygiene
monitoring instruments on the market are: Bio-Orbit®, GEM, Hy-Lite®, Inspector®/
System Sure™, Lightning®, Lumac®, Luminator®/PocketSwab™, and
Uni-Lite/Uni-Lite®Xcel (51).
2.4 CLINICAL APPLICATIONS OF ATP BIOLUMINESCENCE
The clinical applications of the technique include detection of bacteriuria (45,
81, 108, 120), bacteremia (45, 80, 82), and antibiotic susceptibility testing (45, 72,
78). Osterberg et al. (88) studied the use of an ATP test for the diagnosis of urinary
tract infection. Urine samples from patients with urinary tract infections were
evaluated by the ATP bioluminescence assay and the conventional urine culture
method. They concluded that with some methodological improvement the ATP test
could be useful.
Reproduced with permission of the copyright owner. Further reproduction prohibited without permission.

2.5 PSYCHROTROPHIC BACTERIA
26
Psychrotrophic bacteria are those organisms that can grow relatively rapid at a
temperature of 7 °C or less, regardless of their optimum growth temperatures (8, 13,
29, 56, 66). In the dairy industry, the term “psychrotrophic” is used to indicate
organisms that exhibit appreciable growth in milk and milk products at commercial
refrigeration temperatures. Psychrotrophs can cause a wide variety of off-flavors,
texture defects, and reduce the shelf-life of milk and dairy products (122, 131). The
ultimate cause of milk quality degradation is contamination by Gram-negative
psychrotrophic bacteria, especially the Pseudomonas species (22, 131).
Several different genera of psychrotrophs have been isolated from milk which
include Gram negative rods such as Pseudomonas, Achromobacter, Alcaligenes,
Flavobacterium, Enterobacter, and Acinetobacter and gram positive, spore formers
such as Bacillus and Clostridium. There are also some psychrotrophic streptococci,
yeasts, and molds found in dairy products.
Sanitary conditions during milking, particularly poorly cleaned and sanitized
equipment constitute a major source of contamination of raw milk with psychrotrophs.
Psychrotrophs are introduced into milk after pasteurization from contaminated
equipment. Therefore, milk produced under unsanitary conditions could contain more
than 75% of the total microbial flora as psychrotrophs (14).
Many researchers (53, 59) believe that the psychrotrophic bacteria count is a
better indicator of raw milk microbiological quality than standard plate count since
Reproduced with permission of the copyright owner. Further reproduction prohibited without permission.

27
many psychrotrophs found in milk are gram negative organisms, capable of producing
heat-stable enzymes, and produce off-flavors in pasteurized milk. Johns (59) indicated
that the level o f psychrotrophic bacteria in the raw milk was an index of the
microbiological quality of the raw milk. Hartley et al. (53) suggested that the
psychrotrophic count of raw milk and the sanitation conditions of the farm were closely
related.
The psychrotrophic bacteria count involves plating the sample in standard
methods agar and incubating the plate at 7 °C for 10 days (74). The disadvantage of
this method is the time required and Oliveria and Parmalee (85) reported a faster
technique, which is known as the modified psychrotrophic count (mPBC). Modified
psychrotrophic bacteria count involves enumeration of colonies after incubation of
plates at 21 °C for 25 hours. They reported a correlation coefficient of 0.99 between
the standard psychrotrophic count and the modified psychrotrophic bacteria count.
Bishop and White (10) were successful in using the mPBC in conjunction with a
preliminary incubation of milk at 21 °C for 14 h for shelf-life estimation.
2.6 PRELIMINARY INCUBATION
Preliminaiy incubation count is based on the theory that low temperature
incubation of milk allows the growth of psychrotrophic contaminants only and the
normal flora o f the udder does not grow. Thus, preliminary incubation count is a good
indication of unsanitary production and handling practices. According to Johns and
Reproduced with permission of the copyright owner. Further reproduction prohibited without permission.

28
Berzins (58) preliminary incubation of raw milk at 12.8 °C for 18 hours reflected the
conditions of sanitation on a farm.
Barnard (2) concurred that there was a better correlation between preliminary
incubation count and unsanitary practices on the farm than there was with the standard
plate count. Ryan et al. (99) supported the conclusions of other researchers that the
preliminary incubation count was superior to the standard plate count in evaluating the
microbiological quality o f raw milk.
The different rapid methods for estimation and prediction of shelf-life of milk
and dairy products were reviewed by White (132). He stated that preliminary
incubation was extremely important for the successful prediction o f shelf-life and
suggested the preliminary incubation of products at a temperature of 21 °C for 18
hours. According to White, preliminary incubation of dairy products followed by a
rapid detection method was the most feasible way for dairy plants to assess the
predicted shelf-life. The different rapid methods for estimating shelf-life include
bioluminescence, impedance microbiology, limulus amoebocyte lysate, direct
reflectance colorimetry, Virginia Tech shelf-life procedure, and the Moseley keeping
quality test.
Waes and Bossuyt (126) developed a method which allowed the determination
of post-pasteurization contamination of pasteurized milk caused by Gram-negative
bacteria. Determination of bacterial ATP content was made after addition of
benzalkon and crystal violet to pasteurized milk followed by incubation for 24 h at
Reproduced with permission of the copyright owner. Further reproduction prohibited without permission.
30 °C. Results obtained with the BC-ATP method for 100 samples of pasteurized milk
were compared with those recorded in the shelf-life test (total bacteria count after 10
days of storage of samples at 7 °C ) and the Moseley test (bacterial count after 5 days
of storage at 7 °C) (128). They reported that using the shelf-life test and the Moseley
test, 14 and 8% of the results, respectively, did not correspond with those obtained
with the BC-ATP method. It was concluded that a quantitative estimation of the
degree of post-pasteurization contamination can be obtained satisfactorily by applying
the BC-ATP method.
Bishop (14) stated that the preliminary incubation count was superior to the
standard plate count for assessing raw milk quality. It has taken microbiological testing
from the point of a total, aerobic, mesophilic count to that of estimating the potential
psychrotrophic contamination.
Reproduced with permission of the copyright owner. Further reproduction prohibited without permission.

CHAPTER 3
MATERIALS AND METHODS
3.1 COLLECTION OF MILK SAMPLES
3.1.1 Raw Milk
A total o f246 raw milk samples were collected randomly from three Louisiana
milk plants for this study. All samples consisted of commingled milk from raw milk
transport tankers and were collected in sterile containers and transported on ice to the
laboratory and stored at 4 °C until tested within 4 hours.
3.1.2 Pasteurized Milk
A total of 104 fresh commercially pasteurized milk samples were collected from
the same milk processing plants. Samples were collected the day they were processed
and packaged and then transported on ice to the laboratory and stored at 4 °C and
tested within 4 hours.
3.2 PRELIMINARY INCUBATION
After reaching the laboratory, each milk sample was aliquoted into three
sub-samples by aseptically transferring three 20 ml portions from each original milk
sample into sterile, screw cap tubes. One sub-sample (FRESH) was used immediately
to determine standard plate count and ATP content as measured in relative light units
30
Reproduced with permission of the copyright owner. Further reproduction prohibited without permission.

31
(RLU) and the other two sub-samples underwent preliminary incubation. The two
preliminary incubation temperatures used for raw milk samples were 12.8 °C and
15.6 °C; one sub-sample incubated at 12.8 °C for 18 hours (PI-12.8) and the other
sub-sample incubated at 15.6 °C for 18 hours (PI-15.6). All of the FRESH raw milk
samples analyzed did not undergo preliminary incubation because the decision to use
PI-12.8 was made after 44 FRESH samples were collected and analyzed and PI-15.6
was started only after the analysis of a total of 96 FRESH samples. A decision was
also made to not discard any FRESH samples to obtain equal numbers in all treatments
since unequal numbers can be properly analyzed statistically using least squares and
information would be lost if the data were discarded. The two preliminary incubation
temperatures used for pasteurized milk samples were 15.6 °C and 21 °C; one
sub-sample incubated at 15.6 °C for 18 hours (PI-15.6) and the other sub-sample
incubated at 21 °C for 18 hours (PI-21). Following preliminary incubation, the
standard plate count and ATP analysis were performed in duplicate on the preliminary
incubated samples as for the fresh samples.
3.3 STANDARD PLATE COUNT
The standard plate count was determined by the methods outlined in Standard
Methods for the Examination o f Dairy products (74). Phosphate buffered distilled
water was used for making dilutions and plate count agar was used as the culture
medium. Plates were incubated at 32 + 1 °C for 48 + 3 hours and counted immediately
after the incubation period.
Reproduced with permission of the copyright owner. Further reproduction prohibited without permission.

32
3.4 BIOLUMINESCENCE ASSAY
The bioluminescence assay to determine the ATP content was conducted
using equipment and reagents marketed by Lumac B.V., Landgraaf, the Netherlands
(1).
Reagents consisted of:
1. Lumit-QM : purified luciferin-luciferase reagent.
2. Lumit-QM diluent:0.025 M Hepes buffer, MgSO* EDTA, and sodium
azide.
3. NRM : nucleotide releasing reagent for microbial cells.
4. L-NRS : nucleotide releasing reagent for somatic cells.
5. Ringer solution : dilute salt solution for rinsing of the filter.
Additional materials required for the assay included:
1. Filters : 0.8 /*m filter membranes, 8.3 mm diameter.
2. Luminescence photometer : Biocounter M 2500.
3. Lumac Biofiltration system : a temperature controlled filtration unit for
filtration o f milk samples.
4. Vacuum pump : for use with the biofiltration system.
5. Lumacuvette™-F : cuvette.
6. Forceps : for filter transfer.
7. Sterile water : to rinse the filtration unit.
8. Adjustable automatic pipettes with disposable tips.
Reproduced with permission of the copyright owner. Further reproduction prohibited without permission.

33
3.4.1 Preparation of Reagents
Lumit-QM was purchased in freeze dried form and rehydrated with 3 ml o f
Lumit-QM diluent and connected to an injector of the Biocounter M 2500.
Nucleotide releasing reagent for microbial cells (NRM), L-NRS and Ringer solution
were available in ready to use form. The NRM vial was connected to an injector of
the Biocounter M 2500. The L-NRS and Ringer solution were preheated to 40 °C and
Lumit-QM and NRM were allowed to reach room temperature before use.
3.4.2 Assay Procedure
The Lumac Biofiltration system was preheated to 40 °C and the Biocounter
M 2500 was programmed for ATP filtration assay. After rinsing the filtration funnel
with sterile water, a filter paper was placed on the filter support of the filtration device
using sterile forceps. A 300 pi 1 aliquot o f L-NRS was pipetted into the funnel and a
300//I of well mixed milk sample was added. After incubating the mixture for 4
minutes, the vacuum line connected to the filtration unit was opened (600- 800 mm
Hg) to filter the sample. During the incubation of the milk-LNRS mixture, ATP from
the somatic cells was extracted by L-NRS and the extracted ATP was eliminated by
the filtration step with the microorganisms being retained on the filter.
After the sample was filtered, the vacuum was closed and the filter was rinsed
with 600 fx 1 of Ringer solution and transferred into a cuvette which was placed in the
Reproduced with permission of the copyright owner. Further reproduction prohibited without permission.

34
counting chamber of the Biocounter and the ATP measurement started. The
Biocounter was programmed to automatically add 200 p.\ of NRM and, after an
extraction time of 30 seconds, 100//I of Lumit-QM. The microbial ATP was
extracted by NRM, which then reacted with Lumit-QM (luciferin-luciferase) to
produce light. The Biocounter recorded the photons of light from this reaction in
RLU after a 10 second integration period.
3.5 STATISTICAL ANALYSES
The data were analyzed using SAS ® System for Microsoft Windows, Release
6.12 (100). Distributions of RLU and SPC values were first examined using the SAS®
PROC UNIVARIATE procedure to determine the distributions and test for normality.
Normality was achieved by logio transformation. Regression techniques were utilized
to describe the relationship between logio RLU (LRLU) and logio SPC (LSPC) for
the fresh, and preliminarily incubated milk samples. Regression analysis was also used
to construct a prediction equation for predicting the standard plate count from RLU
values.
Polynomial regression models were fitted for logio transformed data to
determine the best model. Linear, quadratic, and cubic regressions were applied to
fresh and preliminary incubated samples and to all samples combined. The
best fit model was used to develop a prediction equation to predict the SPC from the
RLU of milk samples.. The following equations were used to generate these models:
(1) log(Yi) =/*, + # (log Xi) + e s
Reproduced with permission of the copyright owner. Further reproduction prohibited without permission.

35
(2) log(Yi) =p0 + /Ji(logXi) + y?2(logX,)2 + e,
(3) log(Yi) =p0 + /Ji(logXi) + ̂ (logXi)2 + /KlogX,)3 + e,
where
i = observation 1, 2, 3, 4 , ........,n.
log(Yi) = ith observation of the dependent variable, LSPC.
po = intercept
P\ = regression coefficient for linear regression.
(logXi) = ith observation of the independent variable, LRLU, for linear
regression.
p 2 = regression coefficient for quadratic regression.
(logXi)2 = logio transformed RLU, for quadratic regression.
y?3 = regression coefficient for cubic regression.
(logXi)3 = logio transformed RLU, for cubic regression,
e, = error term.
The difference in regressions among the treatment groups (fresh as well as
preliminary incubated milk samples) with respect to SPC and RLU was examined using
a multiple slope linear regression model. The following multiple slope model was used:
(4) Yy = y?0, + /?ii (logio X,j) + e,j
where
i = treatment (fresh, PI-12.8, PI-15.6 etc.).
j = observations (fresh milk, PI-12.8, PI-15.6).
Reproduced with permission of the copyright owner. Further reproduction prohibited without permission.

36
log(Yij ) = jth observation in ith treatment for dependent variable LSPC.
fioi = intercept for the ith treatment.
flu = slope for the ith treatment group.
(logXij) = jth observation in ith treatment for independent variable
LRLU.
ey = error term assessed NID (0, 2)
Residual plots were utilized in order to examine the validity of assumptions of
linear regression such as independence of random error e and constant variance.
Residuals of regression of logio SPC on log]0 RLU for milk samples of different
treatments were plotted against predicted LSPC. Least square means was used to
determine whether the overall average LSPC differed between treatments.
The multiple slope and intercept model for this study was:
(5) Yjj = /?<* + puX + €ij
where,
i = treatment level (1, 2, or 3)
j = observation (1, n)
Yy = observed value of dependent variable LSPC for the jth
observation associated with the ith treatment level.
X = value of dependent variable (LRLU) for observation i
Gij = random error NID (0, 2)
Reproduced with permission of the copyright owner. Further reproduction prohibited without permission.

37
The regression parameters fioi, /?02, and fioi represent intercepts for the three treatments,
while f in, f in , f in represent slopes. In the GLM procedure of SAS®, this model can be
specified by assigning treatment as a classification variable and including treatment and
the interaction between treatment and LRLU in the model statement. Type III mean
square for treatment can be used to test overall intercept differences and treatment by
LSPC interaction mean square to test overall slope differences. Individual intercept
and slope comparisons of interest can be made using appropriate CONTRAST
statements.
Reproduced with permission of the copyright owner. Further reproduction prohibited without permission.
CHAPTER 4
RESULTS AND DISCUSSION
4.1 RELATIONSHIP BETWEEN RELATIVE LIGHTUNIT MEASUREMENTS AND STANDARD PLATE COUNT : RAW MILK
One of the purposes of this study was to investigate the practical use of
adenosine triphosphate (ATP) bioluminescence assay as an estimator of standard plate
count (SPC) for the assessment of raw milk quality. Standard plate count o f fresh raw
milk samples (FRESH) and samples that were preliminarily incubated at 12.8 °C for 18
hours (PI-12.8), and 15.6 °C for 18 hours (PI-15.6) were compared to respective ATP
values. The ATP was measured in relative light units (RLU) and in the following
discussion, RLU will be used synonymously with ATP.
Relationships between SPC and RLU were investigated using least squares and
linear modeling techniques. First, data were analyzed for distribution properties such
as means, standard deviations, ranges, normality, and outliers using the SAS®
Univariate procedure (100). Results of the SAS® Univariate procedures are
presented in Tables 1 and 2. Data in Table 1 show that FRESH raw milk had more
samples (n =246) than PI-12.8 (n = 202) and PI-15.6 (n = 150). The reason for this
inequality was that the decision to include PI-12. 8 was made after 44 FRESH samples
had been collected and analyzed and PI-15.6 began after the analysis of a total of 96
FRESH samples. A decision was made not to discard any FRESH samples to obtain
38
Reproduced with permission of the copyright owner. Further reproduction prohibited without permission.

39
Table 1. Summary of results from the SAS® Univariate procedure for standard plate count (SPC) and relative light units (RLU) of all raw milk samples by treatment.
Treatment*
Variable
DistributionCharacteristic
FRESH PI-12.8 PI-15.6
SPC RLU SPC RLU SPC RLU
nb 246 246 202 202 150 150
Mean 3.5 x 10⁵ 1.4 x 10³ 4.2 x 10⁶ 4.2 x 10³ 6.5 x 10s 6.0 x 10³
Minimum 3.2 x 10³ 2.5 x 10² 4.0 x 10³ 3.3 x 10² 1.4 x 10⁴ 3.4 x 10²
Maximum 3.9 x 10⁷ 4.8 x 10" 8.2 x 10⁷ 6.3 x 10⁴ 1.0 x 10s 7.0 x 10⁴
Wc 0.14 0.27 0.52 0.55 0.58 0.60
SEd 1.6 x 10⁵ 244 6.4 x 10⁵ 494 9.7 x 10⁵ 737
‘FRESH = sample assayed without preliminary incubation;PI-12.8 = sample assayed after preliminary incubation at 12.8 °C for 18 hours; and PI-15.6 = sample assayed after preliminary incubation at 15.6 °C for 18 hours.
bn = number of observations.CW = Shapiro-Wilk test.dSE = standard error of the mean.
Reproduced with permission of the copyright owner. Further reproduction prohibited without permission.

40
Table 2. Summary of results from the SAS® Univariate procedure for logio standard plate count (LSPC) and logio relative light units (LRLU) of raw milk samples by treatment.
Treatment*
Variable
DistributionCharacteristic
FRESH PI-12.8 PI-15.6
LSPC LRLU LSPC LRLU LSPC LRLU
nb 246 246 202 202 150 150
Mean 4.7 2.9 5.64 3.27 6.10 3.45
Minimum 3.5 2.4 3.60 2.52 4.13 2.53
Maximum 7.6 4.7 7.91 4.80 8.01 4.85
Wc 0.89 0.77 0.91 0.90 0.92 0.94
SEd 0.04 0.02 0.07 0.04 0.08 0.04
•FRESH = sample assayed without preliminary incubation;PI-12.8 = sample assayed after preliminary incubation at 12.8 °C for 18 hours; and PI-15.6 = sample assayed after preliminary incubation at 15.6 °C for 18 hours.
bn = number of observations.CW = Shapiro-Wilk test.dSE = standard error of the mean.
Reproduced with permission of the copyright owner. Further reproduction prohibited without permission.

41
equal numbers in all treatments since unequal numbers can be properly analyzed
statistically using least squares and information would be lost if the data were
discarded.
The Shapiro-Wilk (W) test was used to evaluate the reasonableness of the
assumption of normality. Using the W statistic, one rejects the hypothesis of normality
for small values of W. The W values presented in Table 1 indicated that SPC and RLU
in FRESH were not normally distributed. A logio transformation normalized SPC and
RLU in FRESH, as indicated by increased W for SPC and RLU from 0.14 to 0.89 and
0.27 to 0.77, respectively. The decision was made to transform all data since W
increased for all variables(Table 2). For the transformed SPC values (LSPC), outliers
were defined as those 2.5 or more standard deviations away from the mean and were
discarded. There were 5 outliers in FRESH which were discarded.
Polynomial regression was used to model the relationship of LRLU with LSPC.
Polynomial models with gaps in order were not allowed (for example one with a linear
and cubic term but no quadratic term). To determine the “best” model, a step-up
regression was applied with the criteria that an order would only be added if the entry
alpha level was 0.05 or less. This was done by testing the sequential mean square for
the potential order to come into the model against residual mean square. If the alpha
was not less than or equal to 0.05, the process stopped and the resultant highest order
model was selected as “best”. The model selected under these conditions was linear in
all cases.
Reproduced with permission of the copyright owner. Further reproduction prohibited without permission.

42
As a result, a linear regression model was applied to treatment data. The
assumptions underlying regression analysis are as follows:
The random error (e) is independently and normally distributed, with mean zero and
constant variance a2. The dependent variable is assumed fixed and measurable
without error. Obviously, LRLU does not meet these two assumptions. However,
RLU is a continuous variable and sampling was dense across most of the X axis.
Linear regression is robust under these conditions and violation of the assumptions of
X being fixed and measurable without error should have little consequence. Also, this
approach has been used extensively in research and readers will be familiar with it.
Validity of assumptions were examined by visualization and analysis of residuals.
Residual plots were utilized in order to examine the appropriateness of models
and reasonableness of assumptions of equality and independence of e. Residuals are
the differences between the observed and predicted values. A plot of residuals against
values of the dependent variable may reveal problems related to model fit. Nonrandom
patterns in distribution of the residuals can result from changes in error, lack of
independence or inappropriate models.
Residuals from linear regression of LSPC on LRLU for raw milk samples were
plotted against their corresponding predicted LSPC values in Figures 1-3. Plot of
residuals of LSPC vs. predicted LSPC for FRESH (Figure 1), PI-12. 8 (Figure 2), and
PI-15.6 (Figure 3) samples were uniformly distributed in a horizontal band around zero
Reproduced with permission of the copyright owner. Further reproduction prohibited without permission.

43
0 cuGOl - J
1Qxn
0.8
0.6
0.4
0.2
0.0
- 0.2
-0.4
- 0.6
- 0.8
- 1.0
1.0
4.0
• • : •
•* ' i- -V'• • • • •
. • •• *.U M • . .. ,%s * •
• ' .
4.5 5.0
PREDICTED LSPC
Wa= 0.99 (R2)b=0.58
5.5
Figure 1. Residual LSPC by predicted LSPC for fresh raw milk samples.
aW = Shapiro-Wilk W-test statistic (test for normality of residuals). k(R2) = coefficient of determination for prediction model.
Reproduced with permission of the copyright owner. Further reproduction prohibited without permission.

44
0OhC/5-I
1eC/5
- 2 .
Wd = 0.97 (R2)b = 0.78
10 1 1 12 13 14 15 16 17 18 19 20
PREDICTED LSPC
Figure 2. Residual LSPC by predicted LSPC for PI-12.8 °C raw milk samples.
aW = Shapiro-Wilk W-test statistic (test for normality of residuals). b(R2) = coefficient of determination for prediction model.
Reproduced with permission of the copyright owner. Further reproduction prohibited without permission.

45
CJCMVihJ5*E3BVi
1.00
0.75
0.50
0.25
0.00
-0.25
-0.50
-0.75
Wd = 0.97 (R2)b = 0.80- 1.00
-1.25
-1.50
PREDICTED LSPC
Figure 3. Residual LSPC by predicted LSPC for PI-15.6 °C raw milk samples.
aW = Shapiro-Wilk W-test statistic (test for normality of residuals). b(R2) = coefficient of determination for prediction model.
Reproduced with permission of the copyright owner. Further reproduction prohibited without permission.
46
and did not demonstrate any specific pattern which supports the validity of the
regression procedure.
Coefficient of determination (R2) reflect the proportion of variation in LSPC
accounted for by LRLU. The R2 values for FRESH, PI-12.8 and PI-15.6 were 0.58,
0.78, and 0.80, respectively and the R2 for all milk samples combined was 0.78. The
highest R2 was observed for PI-15.6 (R2 = 0.80) and the lowest for FRESH raw milk
samples (R2 = 0.58).
Previous research (115) has indicated that environmental factors such as
growth medium composition and temperature have a significant affect on the cell ATP
content of Enterobacter aerogenes, a common contaminant in milk. It has been
reported (115) that the levels of ATP per bacterial cell declines upon cold storage of
the organism in skim milk for long periods of time and activation of the bacteria at
higher temperatures for only 30 minutes increase the cell ATP concentration.
Organisms growing at higher temperatures in the preliminarily incubated milk samples
are possibly in a higher metabolic state and may have increased concentrations of
intracellular ATP. Therefore, the higher R2 observed for preliminarily incubated raw
milk samples could be due to the higher levels of cellular ATP.
The purpose of preliminary incubation (PI) was not only to increase the number
of bacteria, but also to develop a method that would effectively estimate the
bacteriological quality of raw milk using ATP bioluminescence. Such a procedure
would have the advantage of requiring less time than is required for standard plate
Reproduced with permission of the copyright owner. Further reproduction prohibited without permission.

47
count. Several researchers (11, 14, 99) have reported that PI count may be a better
indicator of raw milk microbiological quality than the standard plate count since the
low temperature o f PI allows the growth of psychrotrophic contaminants only and the
normal flora of the udder does not grow. Thus, PI count is a good indication of
unsanitary production and handling practices.
Differences in regression among treatments were tested using a multiple
slope linear regression model. Treatment regression lines and observed values are
shown in Figure 4. Results of the multiple slope analysis are presented in Table 3.
The intercepts (/? o i) of the regression analyses were 1.90, -0.08, and 1.36 for FRESH,
PI-12.8, and PI-15.6 respectively. The slopes (flu) were 1.33, 1.73, and 1.59 for
FRESH, PI-12.8, and PI-15.6 milk samples, respectively. The R2 for the multiple slope
model was 0.83. The treatment intercepts were different (P < = 0.0005) and the
slopes were also significantly different ( P < = 0.0001).
Results of the regressions were used to construct prediction equations to
predict LSPC from LRLU. Predicted values of LSPC and one standard deviation of a
single prediction above and below the regression line were plotted and are presented in
Figures 5 through 8 . Figure 5 depicts the regression results for FRESH raw milk
samples. Similar graphs for PI-12.8, PI-15.6, and all milk samples combined are
illustrated in Figures 6 , 7, and 8 , respectively.
It can be observed from Figure 5 that at an LRLU value of 3.0 (1,000 cfu/ml),
a single predicted LSPC would be 4.75 (56,000 cfu/ml) and there is 6 6 % (+ 1 SD)
Reproduced with permission of the copyright owner. Further reproduction prohibited without permission.

48
8
7
6
5
FRESH
n PI-15.64
PI-12. 8
■
2.0 2.5 3.0 3 5 4.0 4.5 5.0
LRLU
Figure 4. Predicted and observed values of LSPC resulting from multiple slopes and intercepts regression model (4) of raw milk samples (FRESH, PI-12.8, and PI-15.6).
Reproduced with permission of the copyright owner. Further reproduction prohibited without permission.

49
Table 3. Results o f the multiple slope and intercept regression model.
ANOVA
Source d.f. MS a*
Model 6 15467 0 . 0 0 0 1
Error 586 1.015 —
Intercepts 3 6.083 0.0005
Slopes 3 575.299 0 . 0 0 0 1
ESTIMATES
RegressionCoefficient
FRESH” PI-12.8 C PI-15.6d
Intercept + SE' 1.903 + 0.561 -0.080 + 0.448 1.364 + 0.536
Slope + SE 1.334 + 0.084 1.735 +0.059 1.594 + 0.067
*a = Probability of making a Type I error. bFRESH = samples without preliminary incubation .T I-^ .S = samples preliminarily incubated at 12.8 °C for 18 hours, dPI- 15.6 = samples preliminarily incubated at 15.6 °C for 18 hours. eSE = standard error.
Reproduced with permission of the copyright owner. Further reproduction prohibited without permission.

PRED
ICTE
D LS
PC
50
8.0
7.5
7.0
6.5
6.0
5.5
5.0
4.5
4.0
3.5
3.02.0 2.5 3.0 3.5 4.0 4.5 5.0
LRLU
Figure 5. Predicted values of LSPC + 1 standard deviation for an individual prediction in fresh raw milk.
aPLSPC = predicted LSPC ^SD = standard deviation
Reproduced with permission of the copyright owner. Further reproduction prohibited without permission.

PRED
ICTE
D LS
PC
51
X3
8.0
7.5
7.0
6.5
6.0
5.5
5.0
4.5
4.0
3.5
3.05.04.0 4.53.52.0 3.02.5
LRLUFigure 6 . Predicted values of LSPC ± 1 standard deviation for an individual prediction in PI-12.8 raw milk.
aPLSPC = predicted LSPC ^SD = standard deviation
Reproduced with permission of the copyright owner. Further reproduction prohibited without permission.

PRED
ICTE
D LS
PC
52
K>
8 .0 ,
7.5
7.0
6.5
6.0
5.5
5.0
4.5
4.0
3.5
3.02.0 2.5 3.0 4.0 5.03.5 4.5
LRLU
Figure 7. Predicted values of LSPC ± 1 standard deviation for an individual prediction in PI-15.6 raw milk.
aPLSPC = predicted LSPC ^SD = standard deviation
Reproduced with permission of the copyright owner. Further reproduction prohibited without permission.

PRED
ICTE
D LS
PC
53
*«
8.0
7.5
7.0
6.5
6.0
5.5
5.0
Rz = 0.78 r = 0 . 8 8
4.5
4.0
3.5
3.05702.0 4.52.5 3.0 3.5 4.0
LRLU
Figure 8 . Predicted values of LSPC ± 1 standard deviation for an individual prediction in all raw milk samples combined.
aPLSPC = predicted LSPC ^SD = standard deviation
Reproduced with permission of the copyright owner. Further reproduction prohibited without permission.

54
probability that the actual LSPC would be between 4.4 and 5.1 (25,000 and 130,000
cfu/ml). Results depicted in Figure 5 can be used to demonstrate using RLU to
predict SPC. The Pasteurized Milk Ordinance(124) states that the SPC in fresh raw
milk cannot exceed 300,000 cfu/ml. The RLU of a sample can be measured quickly
and used to predict the SPC that will result some time later. However, the prediction is
not exact and deciding to keep or discard milk based upon RLU has inherent error. An
error results when the prediction is that the SPC will be below 300,000 cfu/ml and it is
in fact greater. To ensure that this would never occur, one would have to reject all
samples. However, often an acceptable error rate can be determined based upon what
an error costs and a critical value of RLU can be determined that will protect against
error at this level.
For example, if an acceptable error rate was determined to be 17%, the LRLU
that would provide this level of protection corresponds to the value where the upper
confidence line of one standard deviation has a predicted LSPC value of 5.47 (300,000
cfu/ml). In Figure 5, the corresponding LRLU is 3.2 and all samples with LRLU above
3.2 would be discarded, even though the predicted LSPC at this point is 5.0 or 100,000
cfu/ml. The critical LRLU is 1.06 standard deviations above the mean and should
result in a 0.16 sample rejection rate or 16% of the samples would be rejected. In the
FRESH samples, only 8.4% are expected to exceed 300,000 cfu/ml based upon the
SPC mean and variance. Rejecting 16% of samples when only 8.4% are above 300,000
cfu/ml results from the precision of the estimator and depends upon the location of the
Reproduced with permission of the copyright owner. Further reproduction prohibited without permission.

55
critical point. The extra 8 % rejected in error would be the cost of using the screening
procedure.
Another objective of this research was to investigate the usefulness of ATP
bioluminescence assay for assessing the quality of raw milk using preliminary sample
incubation and subsequent RLU measurement. Preliminary incubation is based on the
theory that low temperature incubation of milk allows the growth of psychrotrophic
contaminants only and the normal flora of the udder will not grow. Johns and Berzins
(58) suggested that preliminary incubation was a good indication of unsanitary
production and handling practices. Preliminary incubation of milk for 18 hours and
subsequent standard plate count (48 hours) would take approximately 6 6 hours while
predicting SPC using RLU would be a faster method for assessing the bacteriological
quality of FRESH raw milk.
Results are depicted in Figures 6 and 7 for PI-12.8 and PI-15.6, respectively.
The standard deviation of a single prediction is smaller in both preliminary incubated
treatments than FRESH samples across the LRLU range. In addition, R2 values are
higher indicating that prediction would be as good or slightly better than in FRESH.
A majority of the FRESH raw milk samples fell within the range of 1 x 10⁴ to
1 x 10⁶ cfu/ml and FRESH samples in this range were selected along with aliquots of
the same samples subjected to PI-12.8 and PI-15.6 and examined separately. There
were a total of 129 FRESH raw milk samples within the SPC range of 1 x 10⁴ to
Reproduced with permission of the copyright owner. Further reproduction prohibited without permission.

56
1 x 10⁶ cfu/ml that were subjected to all three treatments. The regression analysis
results are in Table 4. Linear regression coefficients were significantly different from
zero (P < 0.01) for all treatments. The R2 increased for PI-12.8 and PI-15.6 samples
because the upper limit of the SPC range was increased to 6 x 10⁷ cfu/ml for the PI
samples and the slope also increased for PI samples.
4.2 RELATIONSHIP BETWEEN RELATIVE LIGHT UNIT MEASUREMENTS AND STANDARD PLATE COUNT : PASTEURIZED MILK
Another purpose of this study was to investigate the practical use of ATP
bioluminescence assay as an estimator of SPC for the assessment o f pasteurized milk
quality. Standard plate counts of fresh pasteurized milk samples (FRESH) and
samples that were preliminarily incubated atl5.6 °C for 18 hours (PI-15.6) and 21 °C
for 18 hours (PI-21) were compared to respective RLU values. Preliminary incubation
at 21 °C for 18 hours followed by a plate count is a recommended method for
estimating the shelf-life of pasteurized milk (74).
Relationships between SPC and RLU were investigated using least squares and
linear modeling techniques. First, data were analyzed for distribution properties such
as means, standard deviations, ranges, normality, and outliers using the SAS®
Univariate procedure (100). Results of the SAS®Univariate procedures are presented
in Tables 5 and 6 .
Reproduced with permission of the copyright owner. Further reproduction prohibited without permission.

57
Table 4. Results of regression analysis of LSPC and LRLU of FRESH raw milk samples within the SPC range of 1 x 10⁴ to 1 x 10⁶ cfu/ml and samples preliminarily incubated at 12.8 °C and 15.6 °C for 18 hours.
Treatment8 cfu/ml range nb b0 bi R2 MSEC
FRESH 1 x 1 0 4 - 1 x 1 0 6 129 2 . 6 8 0.69 0.25 0.13PI- 12.8 2 x 1 0 4 - 6 x 1 0 7 129 0.37 1.65 0.77 0 . 2 2
PI- 15.6 2 x 1 0 4 - 6 x 1 0 7 129 0.69 1.56 0.76 0.19
‘Fresh = samples without preliminary incubation .PI-12.8 = samples preliminarily incubated at 12.8 °C for 18 hours, PI- 15.6 = samples preliminarily incubated at 15.6 °C for 18 hours.
bn = number of observations.CMSE = mean square error
Reproduced with permission of the copyright owner. Further reproduction prohibited without permission.

58
Table 5. Summary of results from the SAS® Univariate procedure for standard plate count (SPC) and relative light units (RLU) of pasteurized milk samples by treatment.
Treatment*
Variable
DistributionCharacteristic
FRESH PI-15.6 PI-21
SPC RLU SPC RLU SPC RLU
nb 104 104 104 104 104 104
Mean 8.7 x 10² 5.9 x 10² 1.8 x 10⁴ 5.4 x 10² 1.2 x 10⁶ 9.5 x 10²
Minimum 5.0 x 10' 4.1 x 10² 7.5 x 10' 3.6 x 10² 5.5 x 10² 3.4 x 10²
Maximum 9.4 x 10³ 8.0 x 10² 1.7 x 10s 7.8 x 10² 1.2 x 10® 4.1 x 10*
Wc 0.54 0.96 0.10 0.96 0.10 0.12
SEd 136 9.5 1.7 x 10⁴ 9.5 1.1 x 10⁶ 387
•FRESH = fresh pasteurized milk samples without preliminary incubation; PI-15.6 = samples preliminarily incubated at 15.6 °C for 18 hours; and PI-21 = samples preliminarily incubated at 21.0 °C for 18 hours.
bn = number of observations.CW = Shapiro-Wilk W-test. dSE = standard error of the mean.
Reproduced with permission of the copyright owner. Further reproduction prohibited without permission.

59
Table 6 . Summary of results from the SAS® Univariate procedure for logio standard plate count (LSPC) and logio relative light units (LRLU) of pasteurized milk samples by treatment.
Treatment* FRESH PI-15.6 PI-21
Variable LSPC LRLU LSPC LRLU LSPC LRLU
DistributionCharacteristic
nb 104 104 104 104 104 104
Mean 2.7 2.8 2.7 2.73 4.0 2.73
Minimum 1.7 2.6 1.87 2.6 2.74 2.53
Maximum 4.0 2.9 3.82 2.9 5.8 3.16
Wc 0.97 0.96 0.86 0.95 0.89 0.48
SEd 0.04 0.01 0.04 0.01 0.06 0.05
•FRESH = fresh pasteurized milk samples without preliminary incubation; PI-15.6 = samples preliminarily incubated at 15.6 °C for 18 hours; and PI-21 = samples preliminarily incubated at 21.0 °C for 18 hours.
bn = number of observations.CW = Shapiro-Wilk W-test. dSE = standard error of the mean.
Reproduced with permission of the copyright owner. Further reproduction prohibited without permission.

60
The Shapiro-Wilk (W) test was used to evaluate the reasonableness of the
assumption of normality. Using the W statistic, one rejects the hypothesis of
normality for small values of W. The W values presented in Table 5 indicate that SPC
and RLU in PI-21 and SPC in PI-15.6 were not normally distributed. A logio
transformation normalized SPC and RLU in PI-21 and SPC in PI-15.6 data. The
decision was made to transform all data since W increased for all variables(Table 6 ).
Polynomial regression was used to model the relationship of LRLU with
LSPC. Polynomial models with gaps in order were not allowed (for example one with
a linear and cubic term but no quadratic). To determine the “best” model, a step-up
regression was applied with the criteria that an order would only be added if the entry
alpha level was 0.05 or less. This was done by testing the sequential mean square for
the potential order to come into the model against residual mean square. If the alpha
was not less than or equal to 0.05, the process stopped and the resultant highest order
model was selected as “best”. For FRESH as well as PI-15.6 pasteurized milk, no
order met the 0.05 significance level for entry into the model. Therefore, no
regression analysis (linear, quadratic or cubic) was significant for FRESH or PI-15.6
samples. But, for PI-21 milk samples the linear regression model was significant.
As a result, a linear regression model was applied to PI-21 treatment data.
Residual plots were utilized in order to examine the appropriateness of models used
and reasonableness of assumptions of equality and independence of e.
Reproduced with permission of the copyright owner. Further reproduction prohibited without permission.

61
Residuals from linear regression of LSPC on LRLU for PI-21 pasteurized milk
samples were plotted against their corresponding predicted LSPC values in Figure 9.
Regression coefficients were significantly different from zero (P < 0.01) for PI-21
samples. The R2 was 0.45 and the intercept and the slope were -2.10 and 2.48,
respectively. The slope for the PI-21 pasteurized milk was higher than the FRESH
and the PI samples of raw milk because preliminary incubation at 21 °C allowed rapid
growth of the microorganisms and most of the organisms were probably at the
logarithmic phase of the growth.
Of the 104 pasteurized milk samples used in this project, a majority of the
samples had SPC values below 104 cfu/m and preliminary incubation at 15.6 °C for 18
hours did not significantly increase the standard plate count or the RLU measurements.
Pasteurized milk samples incubated at different temperatures were compared in order
to determine whether the treatments were significantly different from each other using
least square means (LSMEANS). It was found that the SPC and RLU of FRESH
samples were not significantly different from PI-15.6. However, SPC and RLU of
PI-21 were significantly different from FRESH and PI-15.6.
Scatter plot illustrating the relationship between LSPC and LRLU is shown in
Figure 10, which depicts the actual data, and fitted linear regression line for LSPC and
LRLU of PI-21 pasteurized milk samples. A linear relationship between LSPC and
LRLU can be seen for PI-21 samples.
Reproduced with permission of the copyright owner. Further reproduction prohibited without permission.

62
UCuC/3_)3O=GO
2.0
1.5
1.0
0.5
0.0
-0.5
- 1.0
-1.54.03.6 4.83.2 5.64.4 5.2
PREDICTED LSPC
Figure 9. Residual LSPC by predicted LSPC for PI-21 pasteurized milk samples.
aW = Shapiro-Wilk W-test statistic (test for normality).
Reproduced with permission of the copyright owner. Further reproduction prohibited without permission.
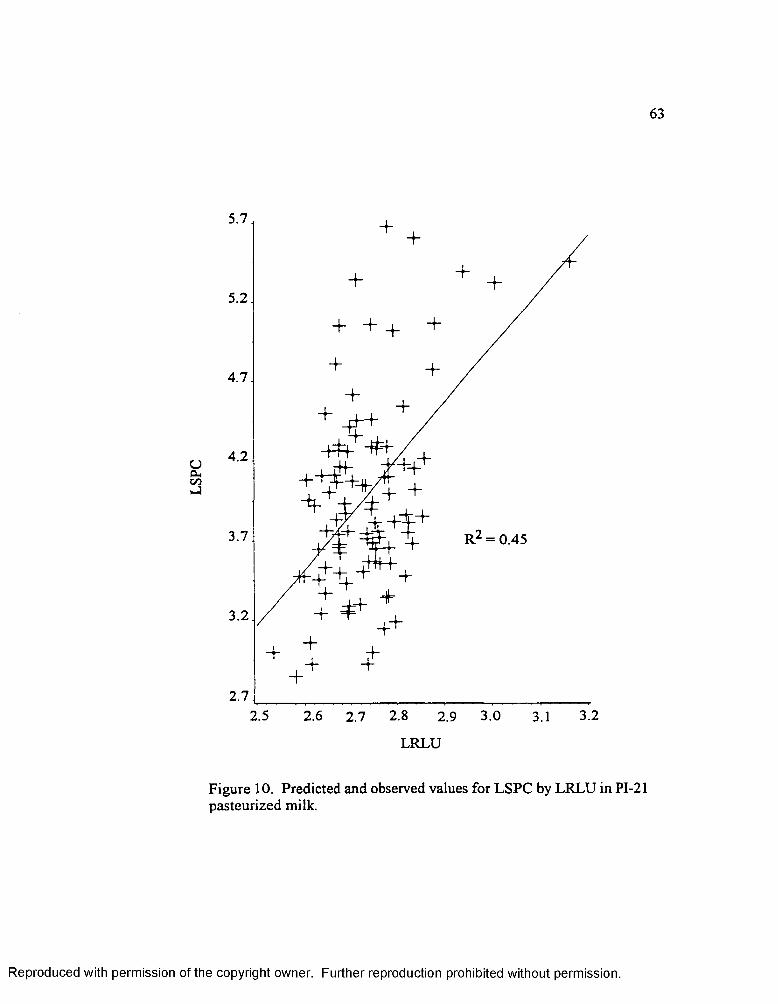
63
5.7
5.2
4.7
OCL,C/3
4.2
3.7
3.2
+ -y i++
R2 = 0.45
2.72.5 2.6 2.7 2.8 2.9
LRLU
3.0 3.1 3.2
Figure 10. Predicted and observed values for LSPC by LRLU in PI-21 pasteurized milk.
Reproduced with permission of the copyright owner. Further reproduction prohibited without permission.

PRED
ICTE
D LS
PC
64
8 .0 ,
7.5
7.0
6.5
6.0
5.5
5.0
4.5 R = 0.45 r = 0.674.0
3.5
3.04.03.0 4.52.0 3.52.5 5.0
LRLU
Figure 11. Predicted values of LSPC _± 1 standard deviation for an individual prediction in PI-21 pasteurized milk.
a PLSPC = predicted LSPC ^SD = standard deviation
Reproduced with permission of the copyright owner. Further reproduction prohibited without permission.

65
Results of the regressions on PI-21 samples were used to construct a
prediction equation to predict LSPC from LRLU. Predicted values of LSPC and one
standard deviation of a single prediction above and below the regression line were
plotted and is presented in Figure 11.
It can be observed from Figure 11 that at a LRLU value of 2.9 (794), the
predicted LSPC would be 4.3 (20,000 cfu/ml) and there is 6 6 % (+ 1 SD)probability
that the actual LSPC would be between 3.75 and 5.0 (5,600 and 100,000). This wide
confidence interval indicates that the predictability of LSPC using LRLU in PI-21
pasteurized milk is not as accurate as the raw milk.
A majority of the samples had SPC values below 104 cfu/ml and preliminary
incubation at 15.6 °C for 18 hours did not significantly increase the standard plate
count or the RLU measurements. Based on the results o f the different statistical
analyses, it can be concluded that ATP bioluminescence assay may not be very effective
in estimating bacterial numbers o f freshly pasteurized milk or pasteurized milk
preliminarily incubated at 15.6 °C or 21 °C for 18 hours. Further research is needed
to improve the sensitivity of the ATP bioluminescence assay so that it can be effectively
used for estimating bacterial numbers in pasteurized milk.
Reproduced with permission of the copyright owner. Further reproduction prohibited without permission.
CHAPTER 5
SUMMARY AND CONCLUSIONS
One of the objectives of this study was to investigate the practical use o f
adenosine triphosphate (ATP) bioluminescence assay as an estimator of standard plate
count (SPC) in an effort to reduce the amount of time required to determine the total
number of viable microorganisms in milk samples. Another objective was to investigate
the usefulness of this assay as a screening test for the assessment of microbiological
quality of raw milk. It was also of interest to develop a prediction equation for SPC
(measured in colony forming units(cfu) per ml.) using ATP values which were
measured in relative light units (RLU).
Two hundred and forty six fresh raw milk samples and 104 fresh pasteurized
milk samples were analyzed to determine bacteriological quality by ATP assay and
compared with the standard plate count (SPC) method. Raw milk samples were
subjected to two different preliminary incubation (PI) temperatures: 12.8 °C and
15.6 °C for 18 hours. Pasteurized milk samples were also subjected to two PI
incubation temperatures: 15.6 °C and 2 1 °C for 18 hours.
The SPC of fresh (FRESH) raw milk samples and after preliminary incubation
of these samples at 12.8 °C(PI-12.8) and 15.6 °C(PI-15.6) for 18 hours were compared
to the respective RLU values. Some of the distributions of RLU and SPC values were
66
Reproduced with permission of the copyright owner. Further reproduction prohibited without permission.

67
found to be non-normal and transformation using logio function was necessary to
achieve normality.
Step-up polynomial regression of log transformed SPC (LSPC) and log
transformed RLU (LRLU) was used to model the relationships and the resulting
highest order model (a = 0.05) was linear for all raw milk treatment data. Linear
regression analysis performed on the treatment data revealed that regression
coefficients were significantly different from zero (P < 0.01) for all treatments. The R2
calculated for FRESH, PI-12.8, and PI-15.6 raw milk were 0.58, 0.78, and 0.80,
respectively.
Differences in regression among treatments of raw milk were tested using a
multiple slope linear regression model. The R2 for the multiple slope was 0.83 and the
treatment intercepts and slopes were significantly different. Results of the regressions
were used to construct prediction equations to predict LSPC from LRLU. Analysis of
predicted values of LSPC and one standard deviation of a single prediction above and
below the regression line indicated that SPC can be predicted from RLU even though
prediction is not exact and has inherent error.
Preliminary incubation is based on the theory that low temperature incubation
of raw milk allows the growth of psychrotrophic contaminants and not the normal
flora of the udder. It has been reported that preliminary incubation is a good
indication o f unsanitary production and handling practices. Predicting SPC using an
RLU “screen” on preliminarily incubated milk samples would be a faster method for
Reproduced with permission of the copyright owner. Further reproduction prohibited without permission.

68
determining milk quality. The standard deviation of a single prediction was smaller in
both preliminary incubated treatments than FRESH samples across the RLU range.
In addition, R2 values were higher indicating that prediction would be as good or
slightly better than in FRESH.
The practical use of ATP bioluminescence assay as an estimator of SPC for the
assessment of pasteurized milk quality was also investigated. Of the 104 pasteurized
milk samples used in this study, the majority had SPC values below 1 x 10³ cfu/ml and
preliminary incubation at 15.6 °C for 18 hours did not significantly increase the
standard plate count or the RLU values. Step-up polynomial regression at an entry
alpha level of 0.05 revealed that no regression model, linear quadratic or cubic, was
significant for fresh or PI-15.6 pasteurized milk samples and a linear model was “best”
for PI-21 pasteurized milk. Results of the regression analysis were used to construct a
prediction equation to predict LSPC form LRLU. Based on the results, it can be
concluded that the predictability o f LSPC using LRLU in PI-21 pasteurized milk is not
as effective as the raw milk treatments. Preliminary incubation at 21 °C significantly
increased the SPC and RLU values of pasteurized milk samples and a linear
relationship between LSPC and LATP was observed for PI-21 samples. This study has
indicated that ATP bioluminescence assay could be used for the analysis of fresh and
preliminarily incubated raw milk, but is not as effective for pasteurized milk because of
the lack of sensitivity of the method to detect levels o f bacteria below
Reproduced with permission of the copyright owner. Further reproduction prohibited without permission.

69
1 x 10⁴ cfu/ml. Limited work has been done to determine the usefulness of the ATP
assay for the assessment of pasteurized milk. This is a possible area to expand
research in the future. Improving the sensitivity of the ATP bioluminescence assay to
detect bacterial levels below 1 x 1 0 4 cfu/ml would enhance the applicability of this
method in the dairy industry.
Reproduced with permission of the copyright owner. Further reproduction prohibited without permission.

BIBLIOGRAPHY
1 Anonymous. 1993. Lumac Raw Milk Microbial Kit. Tech. Bull. Lumac BV. Landgraaf, The Netherlands.
2 Barnard, S. E. 1986. What bacteria counts tell you. Hoard’s Dairyman. 131:47.
3 Bamum, Harold. 1969. The evils of the standard plate count. J. Milk FoodTechnol.32 : 219.
4 Basolijn, Annemieke, and R. Mackintosh. 1993. Rapid assessment of thebacteriological quality of raw milk using an novel filtration concept. Tech.Bull. Lumac BV. Landgraaf, The Netherlands.
5 Bautista, D. A., L. McIntyre, and M. W. Griffiths. 1992. The application ofATP bioluminescence for the assessment of milk quality and factory hygiene.J. Rapid Methods and Automation in Microbiol. 1:179.
6 Bautista, D. A., J. P. Valliancourt, R. A. Clarke, S. Renwick, and M. W.Griffiths. 1995. Rapid assessment of the microbiological quality of poultry carcasses using ATP bioluminescence. J. Food Prot.58(5): 551.
7 Bigalke, D. 1974. Relationship between the conditions of production andhandling of raw milk on the farm and bacteriological quality. M.S. Thesis,Univ. Minnesota, St. Paul.
8 Bishop, J. R., and C. H. White. 1984. Estimation of potential shelf - life ofpasteurized fluid milk utilizing bacterial numbers and metabolites. J. Dairy Science 67 (suppl):49. (Abstr.)
9 Bishop, J. R., C. H. White, and R. Firstenberg-Eden. 1984. Rapidimpedimetric method for determining the potential shelf-life o f pasteurized whole milk. J. Food Prot. 47(6): 471.
10 Bishop, J. R., and C. H. White.1985. Estimation of potential shelf life ofpasteurized fluid milk utilizing bacterial numbers and metabolites. J. Food Prot. 48(8): 663.
11 Bishop, J. R., and C. H. White. 1986. Assessment of dairy product quality andpotential shelf-life - a review. J. Food Prot. 49(9): 739.
70
Reproduced with permission of the copyright owner. Further reproduction prohibited without permission.

71
12 Bishop, J. R., and Jia-Ying Juan. 1988. Improved methods for quality assessment of raw milk. J. Food Prot. 51(12): 955.
13 Bishop, J. R. 1989. A simple shelf-life estimation method as an integral part of a total dairy quality assurance program. Dairy Food Environ. Sanit.9(12):698.
14 Bishop, J. R. 1989. The preliminary incubation count- is it good enough?Dairy Food Environ. Sanit.9(3):122.
15 Blankenagel, G. 1976. An examination of methods to assess post - pasteurization contamination. J. Milk Food Technol. 39:301.
16 Bossuyt, R. 1978. Usefulness of an ATP assay technique in evaluating the somatic cell content o f milk. Milchwissenschaft 33:11.
17 Bossuyt, R. 1981. Determination of bacteriological quality of raw milk by an ATP assay technique. Milchwissenschaft 36 (5): 257.
18 Bossuyt, R. 1982. A 5-minute ATP platform test forjudging the bacteriological quality of raw milk. Neth. Milk Dairy J. 36: 355.
19 Botha, W. C., H. Luck, and P. J. Jooste. 1985. The applicability of the adenosine triphosphate as a rapid bacteriological platform test. S. Aft. J. Dairy Technol. 17:59.
20 Botha, W. C., H. Luck, and P. J. Jooste. 1986. Determination of bacterial ATP in milk - the influence of Adenosine Triphosphate- hydrolizing enzymes from somatic cells and Pseudomonas fluorescens. J. Food Prot. 49(10): 822.
21 Brodsky, M. H., and B. W. Ciebin. 1980. Collaborative evaluation of the plate loop technique for determining viable bacterial counts in raw milk. J.Food Prot. 43:287.
22 Byrne, R. D. Jr., J. R. Bishop, and M. L. McGilliard. 1989. Selective preliminary incubation for gram negative psychrotrophic bacteria in milk. J. Food Prot. 52(6):396.
23 Byrne, R. D. Jr., and J. R. Bishop. 1990. The limulus amoebocyte lysate assay and the direct epifluorescent filter technique as estimators of potential shelf-life of pasteurized fluid milk. J. Food Prot.53(2):151.
Reproduced with permission of the copyright owner. Further reproduction prohibited without permission.

72
24 Cady, P., D. Hardy, S. Martins, S. W. Dufour, and S. J. Kraegen. 1978. Automated impedance measurements for rapid screening of microbial content.J. Food Prot. 41:277.
25 Cardwell, J. T., and Y. Sasso. 1985. The relation of adenosine triphosphate activity to titratable activity in three dairy cultures. J. Dairy Sci. 6 8 (Suppl. 1): 6 6 . (Abstr.)
26 Chain, V. S. 1987. Comparison of Redigel, Petrifilm™, spiral plates, Isogrid and standard plate count for the aerobic plate counts o f selected foods. M.S. Thesis, Kansas State Univ., Kansas.
27 Christen, G. L. 1993. Microbiological methods. Page 120 in Dairy science and technology handbook, Vol. 1: Principles and properties. Y. H. Hui ed. VCH Publ. Inc., USA.
28 Cousins, C. M., and A. J. Bramley. 1981. The microbiology of raw milk.Dairy Microbiology, 1:119. The microbiology of milk. R. K. Robinson ed., Applied Science Publishers, England.
29 Cousin, M. A. 1982. Presence and activity of psychrotrophic microorganisms in milk and dairy products: a review. J. Food Prot. 45(2): 172.
30 Crombrugge, J. Van., G. Waes, and W. Reybroeck. 1989. The ATP -F test for estimation o f bacteriological quality of raw milk. Neth. Milk Dairy J. 43: 347.
31 Cutter, C.N., W. J. Dorsa, and G. R. Siragusa. 1996. A rapid microbial ATP bioluminescence assay for meat carcasses. Dairy, Food Environ. Sanit.l6 (l 1): 726.
32 Daly, K. F. 1974. The luminescence biometer in the assessment of water quality and waste-water analysis. American Laboratory: pp38-44.
33 Dasen, A., C. Piton, R. Grappin, and P.Guerry. 1987. Assessment of the direct epifluorescent filter technique (DEFT) with visual or image analyzer counting for the enumeration of the total flora in raw milk. Le Lait. 67:77.
34 Davis, B. D., R. Dulbecco, H. N. Eisen, H. S. Ginsberg, W. B. Wood, Jr., and M. McCarty. 1973. Microbiology, 2nd ed. Harper and Row, New York.
35 D ’Eustachio, A. J., and D. R. Johnson. 1968. Du Pont Internal Study.
Reproduced with permission of the copyright owner. Further reproduction prohibited without permission.
73
36 Ellison, A., S.F. Perry, and G. S. Stewart. 1994. Bioluminescence as a real-time monitor of injury and recovery in Salmonella typhimurium. Int. J. Food Microbiol. Amsterdam. Elsivier Science Publishers 12(4) 323.
37 Firstenberg-Eden, R., and M. K. Tricarico. 1983. Impedimetric determination o f total, mesophilic, and psychrotrophic counts in raw milk. J. Food Sci. 48:1750.
38 Fung, D. Y. C., and A. A. Kraft. 1969. Rapid evaluation of viable cell counts using microtiter system and MPN technique. J. Milk Food Technol. 32:408.
39 Fung, D. Y. C., R. A. Hart, and V. S. Chain. 1987. Rapid methods and automation procedures for microbiological evaluation of seafood. Page 247 in Seafood quality determination. D. E. Kramer, and J. Listen, ed. Elselvier Sci. Publ. Amsterdam, The Netherlands.
40 Fung, D. C. 1991. Rapid methods and automation for food microbiology.Page 1 in Instrumental methods for quality assurance in foods. D. C. Fung and R. F. Matthews, ed. Marcel Dekker, Inc., New York, NY.
41 Gilchrist, J. E., J. E. Campbell, C. B. Donnelly, J. T. Peeler, and J. M. Delaney. 1973. Spiral plate method for bacterial determination. Appl. Microbiol. 25:244.
42 Ginn, R. E., V. S. Packard, and T. L. Fox. 1984. Evaluation of the 3M medium culture plate (Petrifilm™ SM) method for determining numbers of bacteria in raw milk. J. Food Prot. 47:753.
43 Gnan, S., and L. O. Luedecke. 1982. Impedance measurements in raw milk asan alternative to the standard plate count. J. Food Prot. 45:4.
44 Graumlich, T. R. 1985. Estimation of microbial populations in orange juice bybioluminescence. J. Food Sci. 50(1) : 116.
45 Gregg, C. T. 1991. Bioluminescence in clinical microbiology. Page 1 In Physical Methods for Microorganisms Detection. W. H. Nelson, ed., CRC Press, Boca Raton, FL.
46 Griffiths, M. W., J. D. Phillips, and D. D. Muir. 1984. Methods for rapid detection of post - pasteurization contamination in cream. J. Soc. Dairy Technol. 37(1): 22.
Reproduced with permission of the copyright owner. Further reproduction prohibited without permission.

74
47 Griffiths, M. W., and J. D. Phillips. 1989. Rapid assessment o f the bacterial content of milk by bioluminescent techniques. Page 13 in Rapid microbiological methods for foods, beverages and pharmaceuticals. Soc. Appl. Bacteriol. Tech. Ser. No. 25. C. J. Stannard, S. B. Petitt, and F. A. Skinner ed., Blackwell Sci. Publ., Oxford, Engl.
48 Griffiths, M. W., L. McIntyre, M. Sully, and I. Johnson. 1991. Enumerationof bacteria in milk. Page 479 in Bioluminescence and Chemiluminescence, Current Concepts. P. E. Stanley and L. J. Kricka, ed. John Wiley & Sons, Chichester, Engl.
49 Griffiths, M. W. 1991. Rapid estimation of microbial numbers in dairy productsusing ATP technology. Page 29 in Physical Methods for Microorganisms Detection. W. H. Nelson, ed., CRC Press, Boca Raton, FL.
50 Griffiths, M. W. 1993. Applications of bioluminescence in the dairy industry.J. Dairy Sci. 76:3118.
51 Griffiths, M.W. 1996. The role of ATP bioluminescence in the food industry;new light on old problems. Food Technol. 6 : 62.
52 Hadley, W. K., and D. M. Yajko. 1985. Detection of microorganisms and their metabolism by measurement of their electrical impedance. Page 193 in Instrumental methods for rapid microbiological analysis. W. H. Nelson, ed. VCH Publ. Inc., USA.
53 Hartley, J. C., G. W. Reinbold, E. R. Vedamuthu, and W. S. Clark, Jr. 1968. Bacterial test results of Grade A raw milk samples as a measure o f farm production conditions. J. Milk Food Technol. 31:388.
54 Hinz, C. W. 1988. Comparison of two stains for use in making directmicroscopic somatic cell count. Dairy Food Sanit. 8 : 57.
55 Huhtanen, C. N., and C. O. Jones. 1989. A procedure for the direct microscopic count of bacteria in non-fat dry milk. J. Food Prot. 52:404.
56 Janzen, J.J., J. R. Bishop, and A. B. Bodine. 1982. Relationship of proteaseactivity to shelf-life of skim and whole milk. J. Dairy Sci. 65: 2237.
57 Johns, C. K. 1959. Applications and limitations of quality tests for milk andmilk products. J. Dairy Sci. 42:1625.
Reproduced with permission of the copyright owner. Further reproduction prohibited without permission.

75
58 Johns, C. K., and I. Berzins. 1959. The value of preliminary incubation in bacteriological tests for milk. Proc. 15th Intern. Dairy Congr. 3:1293.
59 Johns, C. K. 1971. Bacteriological testing of milk for regulatory purposes- usefulness of current procedures and recommendations for change. 1 1 . bacteriological testing of raw milk for regulatory puposes. J. Milk Food Technol. 34 :173.
60 Kennedy, J. E. Jr., and J. L. Oblinger. 1985. Application of bioluminescence to rapid determination o f microbial levels in ground beef. J. Food Prot.8 (4):334.
61 King, J. S., and L. A. Mabbit. 1984. Factors affecting the volume of milk delivered by a standard loop in the plate loop method for bacterial count. J. Dairy Res. 51:317.
62 Kuenerowioz, F., and W. Verstraete. 1979. Direct measurement of microbial ATP in activated sludge samples. J. Chem. Tech. Biophys. 29: 707.
63 Kyriakides, A. L., S. M. Costello, M. C. Easter, and I. Johnson. 1991. Rapid Hygiene monitoring using ATP bioluminescence. Page 519 In Bioluminescence and Chemiluminescence: Current Status. P. E. Stanley and L. J. Kricka, eds. John Wiley & Sons, Chichester, U.K.
64 Kyriakides, Alec. 1992. ATP bioluminescence applications for microbiological quality control in the dairy industry. J. Soc. Dairy Technol. 45(4): 91.
65 Langeveld, L.P.M., and C. B. van derWaals. 1988. The ATP platform test, the ATP test and the direct microscopic count procedure as methods of estimating the microbial quality of raw milk. Neth. Milk Dairy J. 42: 173.
6 6 Langeveld, L. P. M., F. Cuperus, P. van Breemen, and J. Dijkers. 1976. A rapid method for the detection of post-pasteurization contamination in HTST pasteurized milk. Neth. Milk Dairy J. 30: 157.
67 Larocco, K., K. J. Littel, and M. D. Pierson. 1986. The bioluminescent ATP assay for determining the microbial quality of foods. Page 145 in Foodbome Microrganisms and Their Toxins: Developing Methodology. M. D. Person and N. J. Stem ed., Marcel Dekker, New York.
6 8 Lehninger, A. L. 1975. Biochemistry, 2nd ed. Worth, New York.
Reproduced with permission of the copyright owner. Further reproduction prohibited without permission.

76
69 Levin, G., J. R. Schrot, and W. C. Hess. 1975. Methodology for application of ATP determination in wastewater treatment. Environ. Sci.. & Technol. 9(10): 961.
70 Littel, K., and K. A. LaRocco. 1985. Bioluminescent standard curves for quantitative determination of yeast contaminants in carbonated beverages. (A research note). J. Food Prot. 48 (12): 1022.
71 Luck, H. 1982. Kieler Milchwirtschaftliche Forschungsberichte 34:108.
72 Lundin, A. 1989. ATP assays in routine microbiology: From visions to realitiesin the 1980s. Page 11 in ATP Luminescence : Rapid methods in Microbiology. Soc. Appl. Bacteriol. Tech. Ser. No. 26. P. E. Stanley, B. J.McCarthy and R. Smither ed., Blackwell Sci. Publ., Oxford, Engl.
73 Malkamaki, M., T. Mattila, and M. Sandholm. 1986. Bacterial growth inmastitic milk and whey. J. Vet. Med. Ser. B. 33:174.
74 Marshall, Robert. 1992. Standard methods for the examination of dairy products. 16th ed. Am. Public Health Assoc., Washington, DC.
75 Martins, S. B., S. Hodapp, S. W. Dufour, and S. J. Kraeger. 1982.Evaluation of a rapid impedimetric method for determining the keeping quality o f milk. J. Food Prot. 45 (13): 1221.
76 McAllister, J. S. M. S. Ramos, and T. L. Fox. 1987. Evaluation of the 3M dry medium culture plate (Petrifilm™ SM) method for enumerating bacteria in processed fluid milk samples. Dairy Food Sanit. 7:632.
77 McElroy, W. D. 1947. The energy source for bioluminescence in an isolated system. Proc. Nat. Acad. Sci. USA 33:342.
78 McWalter, P. W. 1984. Determination of susceptibility of Staphylococcus aureus to methicillin by luciferin-luciferase assay of bacterial adenosine triphosphate. J. Appl. Bacteriol. 56: 145.
79 Mian, Abdul Ghafoor. 1992. Applicability o f bioluminescence assay and aerobic bacterial counts for the evaluation of raw milk quality. Ph.D. Diss., Louisiana State Univ., Baton Rouge.
Reproduced with permission of the copyright owner. Further reproduction prohibited without permission.

77
80 Molin, O., L. Nilsson, and S. Ansehn. 1983. Rapid detection of bacterial growth in blood cultures by bioluminescent assay of bacterial ATP. J. Clin. Microbiol. 18:521.
81 Nichols. W. W., G. D. W. Curtis, and H. H. Johnson. 1982. Analysis of the disagreement between automated bioluminescence-based and culture methods for detecting significant bacteriuria, with proposals for standardizing evaluations of bacteriuria detection methods. J. Clin. Microbiol. 15:802.
82 Nilsson, L., O. Molin, and S. Ansehn. 1984. Rapid detection of bacteriemiaby bioluminescent assay of bacterial ATP. Page 25 in Analytical Applications of Bioluminescence and Chemiluminescence. L. J. Kricka, P. E. Stanley, G. H. G. Thorpe, and T. P. Whitehead ed., Academic Press, Orlando.
83 O’Connor, F., and Fleming, M. G. 1979. An evaluation of the spiral count method in grading farm milk supplies. Irish J. Food Sci. Technol. 3:11
84 O’Conner, F. 1983. Rapid methods for estimating microbial quality o f foods. Ir. J. Fd. Sci. Technol., 7 (1): 61.
85 Oliveria, J. S., and C. E. Parmelee. 1976. Rapid enumeration of psychrotrophic bacteria in raw and pasteurized milk. J. Milk Food Technol.39 (4): 269.
8 6 Olsen, R. L., and G. H. Richardson. 1980. A flooded plate loop count procedure. J. Food Prot. 43:534.
87 Olsen, Ole. 1991. Rapid food microbiology: applications of bioluminescence inthe dairy and food industry - A review. Page 63 in Physical Methods for Microorganisms Detection. W. H. Nelson ed., CRC Press, Boca Raton, London.
8 8 Osterberg, E., H. O. Hallander, A. Kallner, A. Lundin, and H. Aberg. 1991. Evaluation of the ATP test in the diagnosis of urinary tract infection. European J. Clin. Microbiol. Infect. Diseases 10 (2): 70.
89 Peeler, J. T., Gilchrist, J. E., Donnelley, C. B. and Campbell, J. E. 1977. A collaborative study of the spiral plate method for examining milk samples. J. Food Prot. 40:462.
90 Peterkin, P. I., and A. N. Sharp. 1980. Membrane filtration of dairy products for microbiological analysis. Appl. Environ. Microbiol. 39:1138.
Reproduced with permission of the copyright owner. Further reproduction prohibited without permission.

78
91 Pettipher, G. L., R. Mansell, and C. M. Cousins. 1980. Rapid membrane filtration epifluorescent microscopy technique for direct enumeration of bacteria in raw milk. Appl. Environ. Microbiol. 39:423.
92 Pettipher, G. L. 1993. Modem laboratory practice - 2: Microbiological Analyses. Page 417 in Modem Dairy Technology, Vol. 2. R. K. Robinson ed., Elsevier Science Publ., Engl.
93 Phillips, J. D., and M. W. Griffiths. 1985. Bioluminescence and impedimetric methods for assessing shelf-life of pasteurized milk and cream. Food Microbiol. 2:39.
94 Phillips, J. D., and M. W. Griffiths. 1986. Estimation of Gram-negative bacteria in milk: A comparison of inhibition systems for preventing Gram-positive bacteria growth. J. Appl. Bacteriol. 60: 491.
95 Phillips, J. D., and M. W. Griffiths. 1990. Pasteurized dairy products - the constraints imposed by environmental bacterial contamination. Page 387 in Advances in Environmental Science and Technology: Food Contamination from Environmental Sources. J. O. Nriagu and M. S. Simmons, ed. John Wiley & Sons, New York, NY.
96 Prescot, S. C. 1905. The need for uniform methods in sanitary examination of milk. Pub. Health Papers and Reports of APHA. 31(2): p. 246.
97 Roth, J. N. 1988. A temperature - independent pectin gel method for aerobic plate count in dairy and nondairy food products: collaborative study. JAOAC 71:343.
98 Rowe, M., J. Pearce, L. Crone, M. Sully, and I. Johnson. 1991. Bioluminescence assay for psychrotroph proteases. Page 515 in Bioluminescence and Chemiluminescence, Current Concepts. P. E. Stanley and L. J. Kricka, ed. John Wiley & Sons, Chichester, Engl.
99 Ryan, J. J., R. H. Gough, and C. H. White. 1984. Preliminary incubation count as an index of raw milk microbiological quality during storage. J. Food Prot. 47(3): 206.
100 SAS Institute Inc., SAS° System for Microsoft® Windows™, Release 6.12. Cary, NC: SAS Institute Inc., 1996.
Reproduced with permission of the copyright owner. Further reproduction prohibited without permission.

79
101 Schroder, M., and M. A. Bland. 1983. Post-pasteurization contamination and shelf-life of HTST pasteurized milk when filled in a liqui-pak conventional or model 820A cartoning machine. J. Soc. Dairy Technol. 36(2): 43.
102 Sharpe, A. N., M. N. Woodrow, and A. K. Jackson. 1970. ATP levels in foods contaminated by bacteria. J. Appl. Bacteriol. 33: 758.
103 Sharpe, A. N., and G. L. Michaud. 1974. Hydrophobic grid-membrane filters: New approach to microbiological enumeration. Appl. Microbiol.28:223.
104 Sharp, A. N., P. I. Peterkin, and N. Malik. 1979. Improved detection of coliforms and Escherichia coli in foods by a membrane filter method. Appl. Environ. Microbiol. 38:431.
105 Siragusa, G. R., C. N. Cutter, W. J. Dorsa, and M. Koohmaraie. 1995. Use of rapid microbial ATP bioluminescence assay to detect contamination on beef and pork carcasses. J. Food Prot. 58 (7): 770.
106 Stanier, R. Y., E. A. Adelberg, and J. Ingraham. 1976. The microbial world, 4th ed. Englewood Cliffs: Prentice Hall.
107 Stanley, Philip. 1982. Rapid microbial counting using ATP technology. Food Flavorings, Ingredients, Packaging, & Processing. 4 (10): 29.
108 Stanley, P. E. 1989. A concise beginner’s guide to rapid microbiologyusing ATP and luminescence. Page 1 in ATP Luminescence : Rapid methods in Microbiology. Soc. Appl. Bacteriol. Tech. Ser. No. 26. P. E. Stanley, B.J. McCarthy and R. Smither ed., Blackwell Sci. Publ., Oxford, Engl.
109 Stanley, P. 1986. Extraction of Adenosine Triphosphate from microbial and somatic cells. Methods in Enzymology. 133: 14.
110 Stannard, C. J. 1984. ATP assay as a rapid method for estimating microbial growth in foods. Page 53 in Analytical Applications of Bioluminescence and Chemiluminescence. L. J. Kricka, P. E. Stanley, G. H. G. Thorpe, and T. P. Whitehead ed., Academic Press, Orlando.
111 Stannard, C. J., and J. M. Wood. 1983. The rapid estimation of microbial contamination of raw meat by measurement of ATP. J. Appl. Bacteriol. 55: 429.
Reproduced with permission of the copyright owner. Further reproduction prohibited without permission.

80
112 Stannard, C. J., and P. A. Gibbs. 1986. Rapid microbiology: applications of bioluminescence in the food industry - A review. J. Bioluminescence and Chemiluminescence 1:3.
113 Sutherland, A. D., C. Bell, A. Limond, J. Deakin, and E. A. Hunter. 1994. The Biotrace method for estimating bacterial numbers in milk by bioluminescence. J. Soc. Dairy Technol. 47 (4): 117.
114 Tatini, S. R., R. Rabbah, and J. C. Olsen, Jr. 1967. Comparison of plate loop and agar plate loop method for bacteriological examination of manufacturing grade raw milk. J. Milk Food Technol. 30:112.
115 Theron, D. P., B. A. Prior, and P. M. Lategan. 1983. Effect of temperature and media on ATP cell content in Enterobacter aerogenes ( a research note). J. Food Prot. 46 (3): 196.
116 Theron, D. P., B. A. Prior, and P. M. Lategan. 1986. Sensitivity and precision of bioluminescent techniques for enumeration of bacteria in skim milk. J. Food Prot. 49(1): 8 .
117 Theron, D. P., B. A. Prior, and P. M. Lategan. 1986. Determination of bacterial ATP levels in raw milk: selectivity of non-bacterial ATP hydrolysis.J. Food Prot. 49(1): 4.
118 Thompson, D. I., C. B. Donnelly, and L.A. Black. 1960. A plate loop method for determining viable counts of raw milk. J. Milk Food Technol. 23:167.
119 Thompson, D. I., and L. A. Black. 1967. The use of the 0.01 ml loop in the plate loop method for making viable counts of milk. J. Milk Food Technol. 30:273.
120 Thore, A., A. Lundin, and S. Ansehn. 1983. Firefly luciferase ATP assay as a screening method for bacteriuria. J. Clin. Microbiol. 17:218.
121 Tifft, E. C. Jr., and S. J. Spiegel. 1976. Use of ATP assay in disinfection control. Environ. Sci. Technol.10 (13): 1268.
122 Trobaugh, W. S. 1982. Quality assurance through the preliminary incubation count. Dairy Food Sanit. 2 (5): 184.
Reproduced with permission of the copyright owner. Further reproduction prohibited without permission.

81
123
124
125
126
127
128
129
130
131
132
133
Ugarova, N., Y. Vosny, G. Kutuzova, and E. Dementieva. 1991. Bioluminescent assay ob B-galactosidase using D-luciferin-O-B-galactoside. Page 511 in Bioluminescence and Chemiluminescence, Current Concepts. P. E. Stanley and L. J. Kricka, ed. John Wiley & Sons, Chichester, Engl.
U. S. Department of Health and Human Services. 1995. Grade A Pasteurized Milk Ordinance. 1995 Recommendations. Publ. No. 229. US Publ. Health Serv., Washington, DC.
VandeWerf, H., and W. Verstraete. 1984. ATP measurement by bioluminescence: environmental applications. Page 33 in Analytical Applications of Bioluminescence and Chemiluminescence. L. J. Kricka, P. E. Stanley, G. H. G. Thorpe, and T. P. Whitehead ed., Academic Press,Orlando.
Waes, G., and R. Bossuyt. 1981. A rapid method to detect postcontamination in pasteurized milk. Milchwissenschaft 36 (9): 548.
Waes, G., R. Bossuyt, and J. Mottar. 1985. A rapid method for the detection of non-sterile UHT milk by the determination of the bacterial ATP. Milchwissenschaft 39 (12): 707.
Waes, G. M., and R. G. Bossuyt. 1982. Usefulness of the benzalkon - crystal violet - ATP method for predicting the keeping quality of pasteurized milk. J. Food Prot. 45 (10): 928.
Webster, Jo Ann J., M. S. Hall, C. N. Rich, S. E. Gilliland, S. R. Ford. 1988. Improved sensitivity of the bioluminescent determination of numbers o f bacteria in milk samples. J. FoodProt.51 (12):949.
Westhoff, D., and T. Engler. 1975. Detection of penicillin in milk by bioluminescence. J. Milk Food Technol. 38 (9): 537.
White, C. H. 1982. Bacteriological testing a useful tool in predicting fluid milk shelf-life. Dairy Record 83 (5): 112.
White, C. H. 1993. Rapid methods for estimation and prediction of shelf-life of milk and dairy products. J. Dairy Sci. 76:3126.
Williams, G. R. 1984. Use of bioluminescence in the determination of the antibiotic content o f milk. J. Soc. Dairy Technol. 37:40.
Reproduced with permission of the copyright owner. Further reproduction prohibited without permission.

82
134 Zomer, E., S. Trivedi, and S. Charm. 1991. A rapid bioluminescence assay of alkaline phosphatase in milk and dairy products using the Charm II system. J. Food Prot. 54:813.
Reproduced with permission of the copyright owner. Further reproduction prohibited without permission.

VITA
Pushpa J. Samkutty was bom in Kerala, India. She received her baccalaureate
degree in 1978 in Economics from Kerala University, Kerala, India. In 1978, she
married Dr. E. C. Samkutty and came to the United States. In 1981, she entered
Mississippi State University in Starkville and graduated with a bachelor of science
degree in Microbiology in August, 1983.
In 1984, she entered the graduate school of Mississippi State University and
graduated with a master of science degree in Microbiology in August, 1987. In 1987,
she joined the Biology Department at Southern University, Baton Rouge, as an
instructor. In August 1992, she entered the graduate school of Louisiana State
University in Baton Rouge to pursue the Doctor of Philosophy degree in Dairy
Science under the guidance of Dr. Ronald H. Gough. In the earlier phases of the
graduate program she was a part-time student while working as a full-time Instructor at
Southern University. Later, she was the first recipient of the Howard Hughes Medical
Institute grant supporting the partnership between L.S.U. and Southern University,
which allowed her some release time from teaching duties.
She has a son, Ranjith, and a daughter, Bindu. Currently, she is an Assistant
Professor in the Department of Biological Sciences at Southern University, Baton
Rouge. She is a candidate for the degree of Doctor of Philosophy, which will be
awarded in August, 1998.
83
Reproduced with permission of the copyright owner. Further reproduction prohibited without permission.

DOCTORAL E X A M IN A T IO N AND D IS S E R T A T IO N REPORT
C a n d i d a t e s Pushpa J. Samkutty
M a j o r F i e l d : Dairy Science
T i t l e o f D i s s e r t a t i o n : Rapid Assessment of the Bacteriological Qualityof Milk by the Use of Adenosine Triphosphate Bioluminescence
A p p r o v e d :
ie G r a d u a t e S c h o o lD e,
EXAMINING COMMITTEE:
D a t e o f E x a m i n a t i o n :
July 6, 1998_______
Reproduced with permission of the copyright owner. Further reproduction prohibited without permission.

IMAGE EVALUATION TEST TARGET (Q A -3 )
A
✓
,<fV .M s . ' *
I-?.
1.0
l.l
u ||2.8
~ I S !f iS
I I 2.5
2.2
2.0
1.8
1.25 1.4 1.6
1 50mm
/^ P P L IE O J , IIW IGE . Inc_ = 1653 East Main Street
■ = ’■ Rochester, NY 14609 USA - = = ^ Phone: 716/482-0300
- = Fax: 716/288-5989
© 1993 , A pplied Im ag e . Inc.. All R ig h ts R e s e rv e d
Reproduced with permission of the copyright owner. Further reproduction prohibited without permission.