rapid spectroscopic techniques for monitoring and control ... jp - icomst ghent 2011.pdf · rapid...
TRANSCRIPT

20.09.2011 1
Rapid spectroscopic techniques for
monitoring and control of meat processing
and for effective meat science
Jens Petter Wold
Nofima - Norwegian Food Research Institute
ICoMST 2011

20.09.2011 2
Background: Nofima• Peak competence in applied
biospectroscopy for food analysis
• On-line
– NIR, VIS, spectral imaging
• At-line
– Fluorescence, VIS, NIR, Raman, FT-IR, spectral imaging
• Microscopy of tissues and cells
– Raman, FT-IR
• Chemometrics, multivariate calibration
700 800 900 1000 1100 1200 1300 1400 15001000
2000
3000
4000
5000
6000
7000

20.09.2011 3
Food industry today: Under pressure!
• Consumers demand low prices and high quality
• Increasing focus on nutrition and health
• Increasing demands for product documentation and traceability
• Food production is more and more industrialised
• Strong need for advanced quality measurements for process and
product control
• The ideal measurements is
• rapid non-destructive
• on-line robust
• accurate

20.09.2011 4
Established on-line methods for meat
• Near-infrared spectroscopy (NIR): fat, water, protein in ground meat
• X-rays: fat/water, foreign objects, CT for carcass description
• Microwaves: Water (indirect fat)
• Ultrasound: pork back fat
• Vision systems
• Raman spectroscopy
• Fluorescence spectroscopy
• FT-IR spectroscopy
• and others
Not so established methods for meat
20.09.2011 5
Challenges with non-destructive measurements
• Foods (meat) are very complex from a measurement point of view!
• Large variations in muscle structures, chemical composition, texture, shape and size
• Main challenge: Representative sampling!
• Different products needs different solutions: Tailor made systems
– Can be too costly for the food industry
– Only profitable “need to have” applications will be implemented
– “Nice to have” is seldom sufficient
• Our focus has been on industry needs
– Not always easy, since the industry does not always know what it needs
– Business strategy?

20.09.2011 6
Our on-line strategy:
• Focus on ”easy” quality attributes: fat, water, protein, fatty acid
composition, oxidation
– Causal relation between chemistry and spectroscopy
• Difficult heterogeneous samples
• Little emphasis on ”difficult” attributes such as tenderness, water
holding capacity, sensory properties where there is little or no clear
connections between spectroscopy and the chemical/physical
properties.

20.09.2011 7
Examples of analytical challenges
Bacalao
Salmon
Beef Crabs

20.09.2011 8
NIR Reflection: Measures absorption at the surface
Detector

20.09.2011 9
Interactance: Forces light into product, measures inside
Spec.
20.09.2011 10
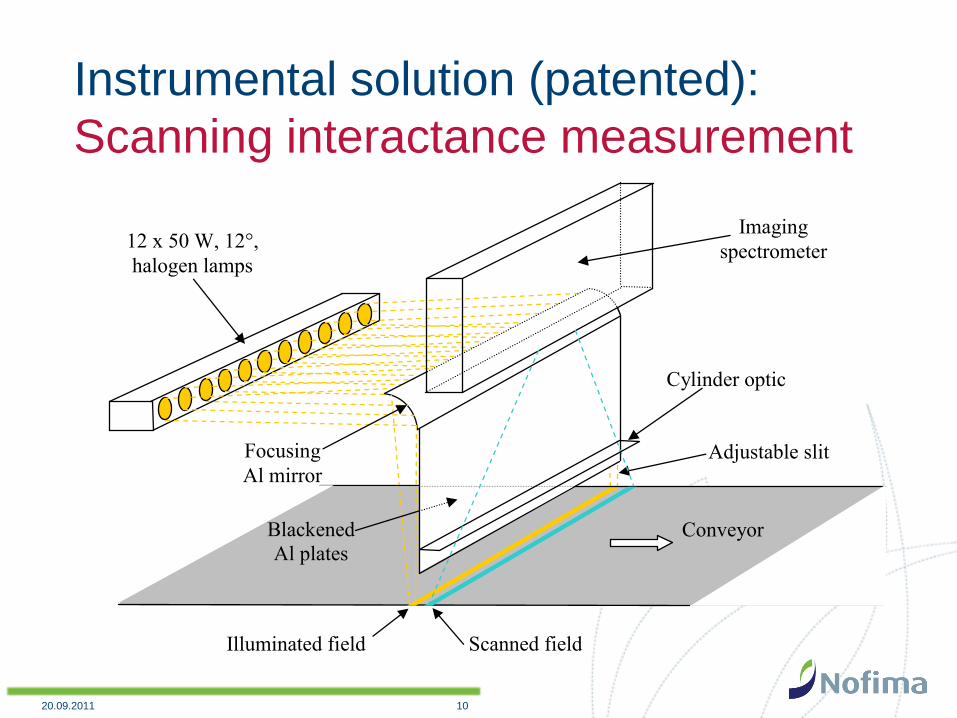
Instrumental solution (patented):
Scanning interactance measurement
Conveyor
12 x 50 W, 12°,
halogen lamps
Cylinder optic
Adjustable slit
Illuminated field Scanned field
Imaging
spectrometer
Focusing
Al mirror
Blackened
Al plates
20.09.2011 11
NIR/VIS interactance imaging scanner
• Produces a 3D multispectral image of the conveyor belt
• 15 wavelengths in VIS/ 15 in NIR
• Handles a conveyor belt speed of 3 m/s
• Does about 10.000 measurements/sec
20.09.2011 12
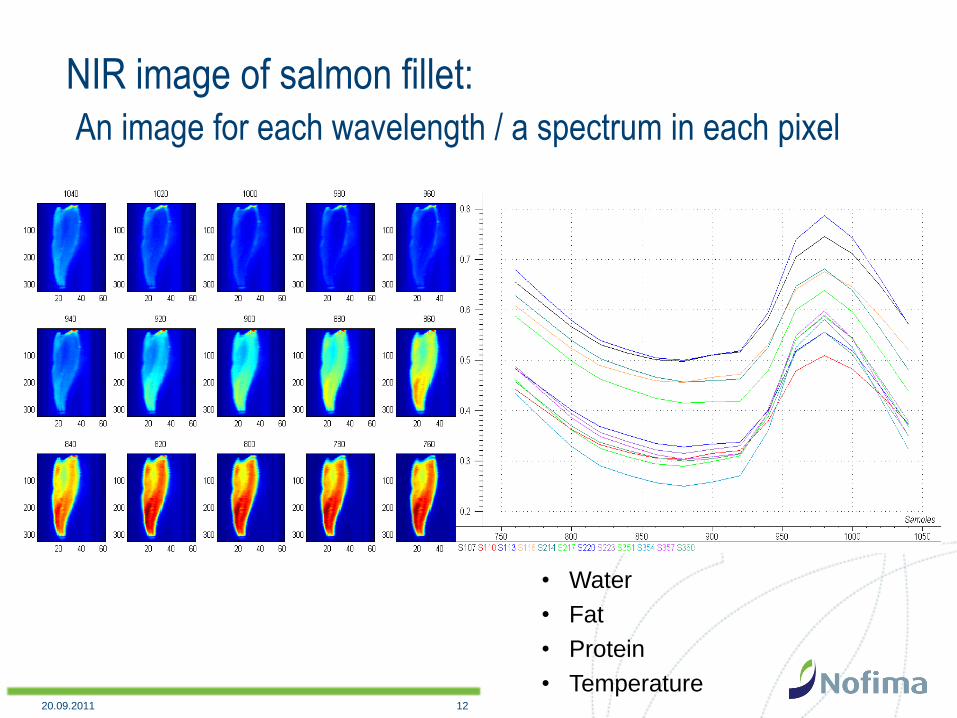
NIR image of salmon fillet:
An image for each wavelength / a spectrum in each pixel
• Water
• Fat
• Protein
• Temperature

20.09.2011 13
Has become commercial available

20.09.2011 14
Quantitative chemical imaging• Every application requires careful consideration of
– Sampling
– Calibration regime (how to match spectroscopy and reference
values)
– Image segmentation, image processing
– Spectral pre-processing at pixel level
• to avoid effects of variation in sample height, temperature,
colour, etc.
– Multivariate modelling (regression, curve resolution)
– How to apply model on new data
Fisk: 20 FettFisk: 19.8969% Share: 23.6285
10 20 30 40 50 60
50
100
150
200
250
300
0
5
10
15
20
25
30
35
40
45
50

20.09.2011 15
Chemical images: Fat content in each pixel
Fisk: 20 FettFisk: 19.8969% Share: 23.6285
10 20 30 40 50 60
50
100
150
200
250
300
0
5
10
15
20
25
30
35
40
45
50Fisk: 16 FettFisk: 17.2034% Share: 20.2078
10 20 30 40 50 60
50
100
150
200
250
0
5
10
15
20
25
30
35
40
45
50
17.2 % 19.9 %
• Calculates average fat content
• Fat distribution can guide
– Automatic trimming/cutting
– Selection of phenotypes for breeding (genetic selection)
17.2% 21.4%

20.09.2011 16
Application: Water content in dried salted cod
Challenges:
• Water is unevenly distributed
• Dry on the outside, wet inside
• Covered with salt
• Varying size and shape
Alternatives:
• Traditional manual grading is expensive and inaccurate
• Lab measurements of water are tedious and destructive
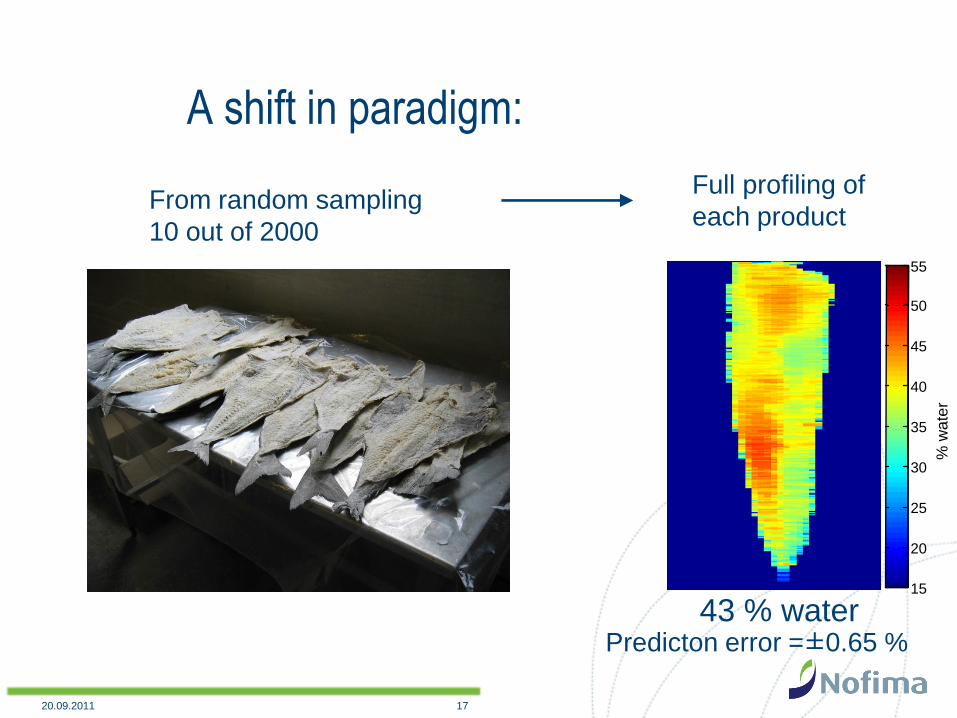
20.09.2011 17
A shift in paradigm:
From random sampling
10 out of 2000
Full profiling of
each product
43 % water15
20
25
30
35
40
45
50
55
% w
ate
r
Predicton error =±0.65 %

20.09.2011 18
Industrial installation
• Sorting according to water content
• Producer gets correct price
• Avoids reclamations
• Enables optimization of drying process

20.09.2011 19
• 40 tons per day
• Manual grading is difficult
• Capacity need: 2 crabs per sec.
• Need to sort crabs into 4 quality
classes to optimize production
line
Industrial system for crab grading according to
meat content
20.09.2011 2020.09.2011 20
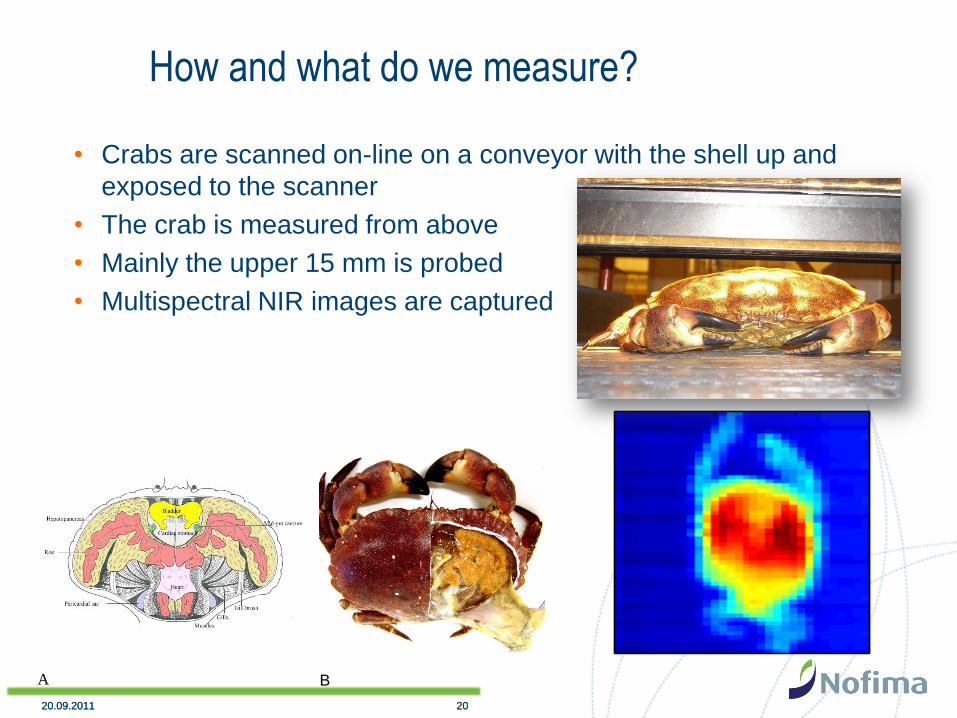
How and what do we measure?
• Crabs are scanned on-line on a conveyor with the shell up and
exposed to the scanner
• The crab is measured from above
• Mainly the upper 15 mm is probed
• Multispectral NIR images are captured
A B
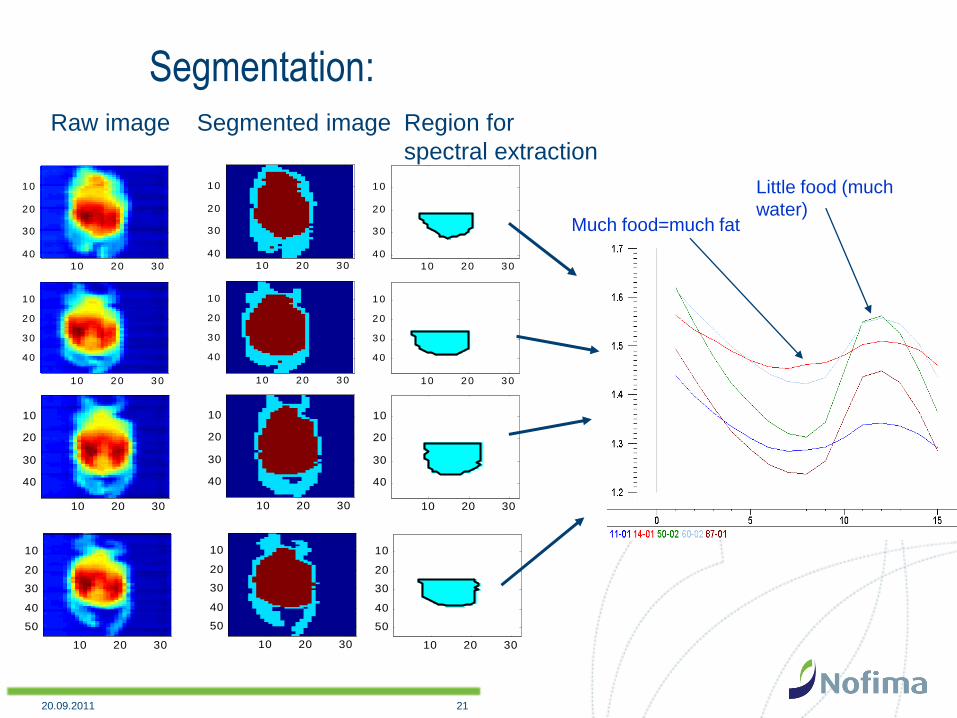
20.09.2011 21
Segmentation:
10 20 30
10
20
30
40
10 20 30
10
20
30
40
10 20 30
10
20
30
40
10 20 30
10
20
30
40
10 20 30
10
20
30
40
10 20 30
10
20
30
40
10 20 30
10
20
30
40
10 20 30
10
20
30
40
10 20 30
10
20
30
40
10 20 30
10
20
30
40
50
10 20 30
10
20
30
40
50
10 20 30
10
20
30
40
50
Raw image Segmented image Region for
spectral extraction
10 20 30
10
20
30
40
10 20 30
10
20
30
40
10 20 30
10
20
30
40
10 20 30
10
20
30
40
10 20 30
10
20
30
40
10 20 30
10
20
30
40
10 20 30
10
20
30
40
10 20 30
10
20
30
40
10 20 30
10
20
30
40
10 20 30
10
20
30
40
50
10 20 30
10
20
30
40
50
10 20 30
10
20
30
40
50
10 20 30
10
20
30
40
10 20 30
10
20
30
40
10 20 30
10
20
30
40
10 20 30
10
20
30
40
10 20 30
10
20
30
40
10 20 30
10
20
30
40
10 20 30
10
20
30
40
10 20 30
10
20
30
40
10 20 30
10
20
30
40
10 20 30
10
20
30
40
50
10 20 30
10
20
30
40
50
10 20 30
10
20
30
40
50
Little food (much
water)Much food=much fat

20.09.2011 22
Calibration model for food index

20.09.2011 23

20.09.2011 2420.09.2011 24
Practical results• The crabs are automatically sorted on-line into 4 quality classes.
• Quicker and much more reliable than manual grading, 1-2 crabs /sec
• Yield in process has increased, less waste
• Can guarantee high quality of superior crabs, which is extremely
important to keep the crab market alive
• Systemized data gives overview of seasonal and regional variations
• Will be used to adjust payments to the fisherman
20.09.2011 25
Spin-offs to meat?
• Fat grading of certain high value cuts
• Fat determination in boxed pork meat
• Online control of fat in batches of beef/pork
• Fat is important to control for quality and profit
• Fat is ”easy” to measure

20.09.2011 26
Beef processing• 60% of the carcass ends up as beef trimmings
– for meat products
• Batches of beef trimmings are priced according
to fat content
– Low fat gives higher price
– Batch sizes vary from 20 – 400 kg
– Very important for the company
to optimize in order to make profit
• No good way to measure fat content in intact trimmings
– The cutters try to reach target fat content, but difficult
• Fat can be measured in ground meat, but most customers prefer intact trimmings
• Reliable measurements on trimmings would be very valuable for
– Getting the correct price
– Optimised use of raw-materials
– Optimised logistics

20.09.2011 27
NIR-spectra from beef
63 % fat
3% fat30% fat
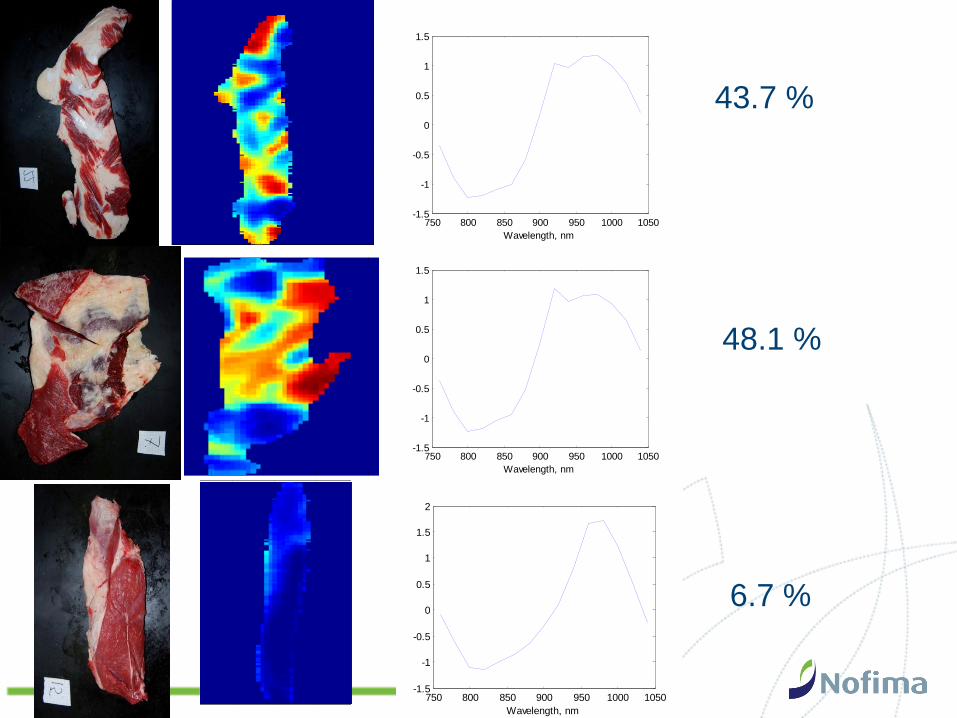
20.09.2011 28
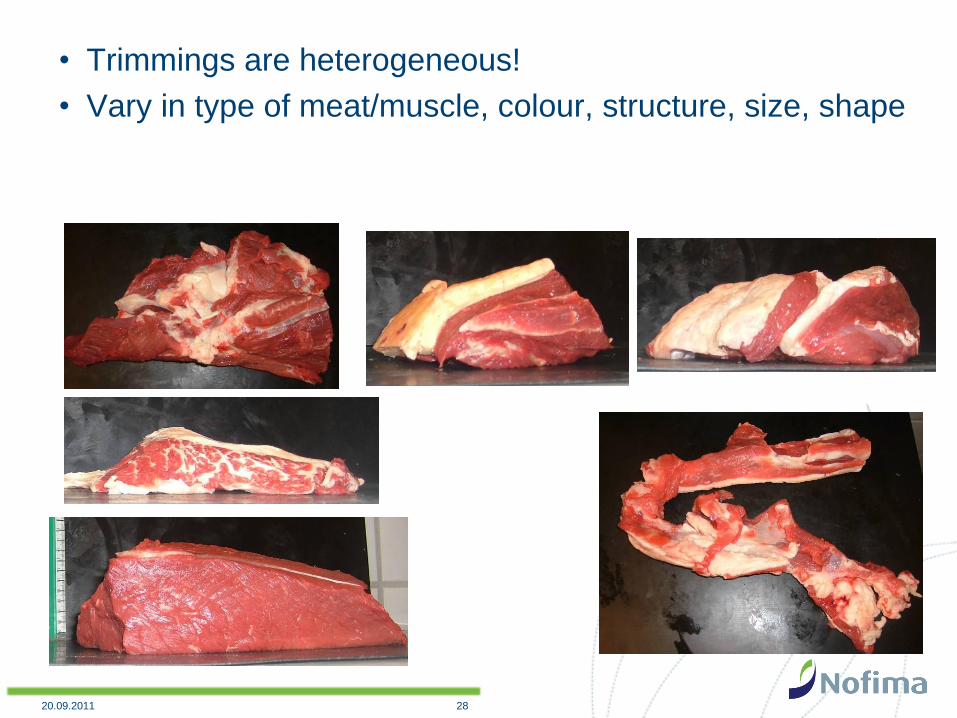
• Trimmings are heterogeneous!
• Vary in type of meat/muscle, colour, structure, size, shape
20.09.2011 29
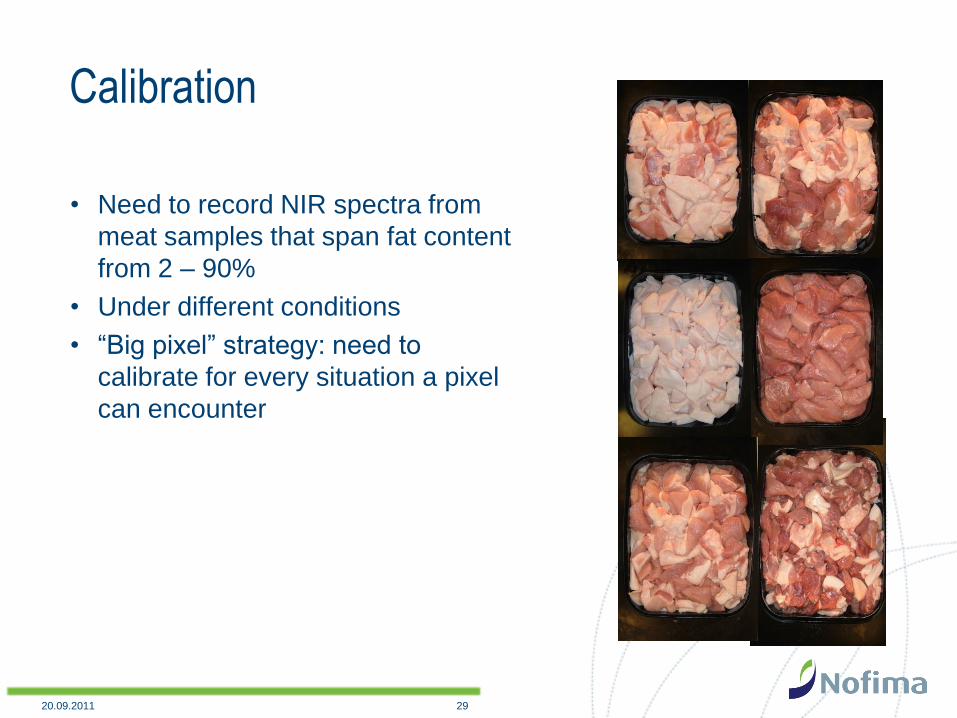
Calibration
• Need to record NIR spectra from
meat samples that span fat content
from 2 – 90%
• Under different conditions
• “Big pixel” strategy: need to
calibrate for every situation a pixel
can encounter
20.09.2011 30
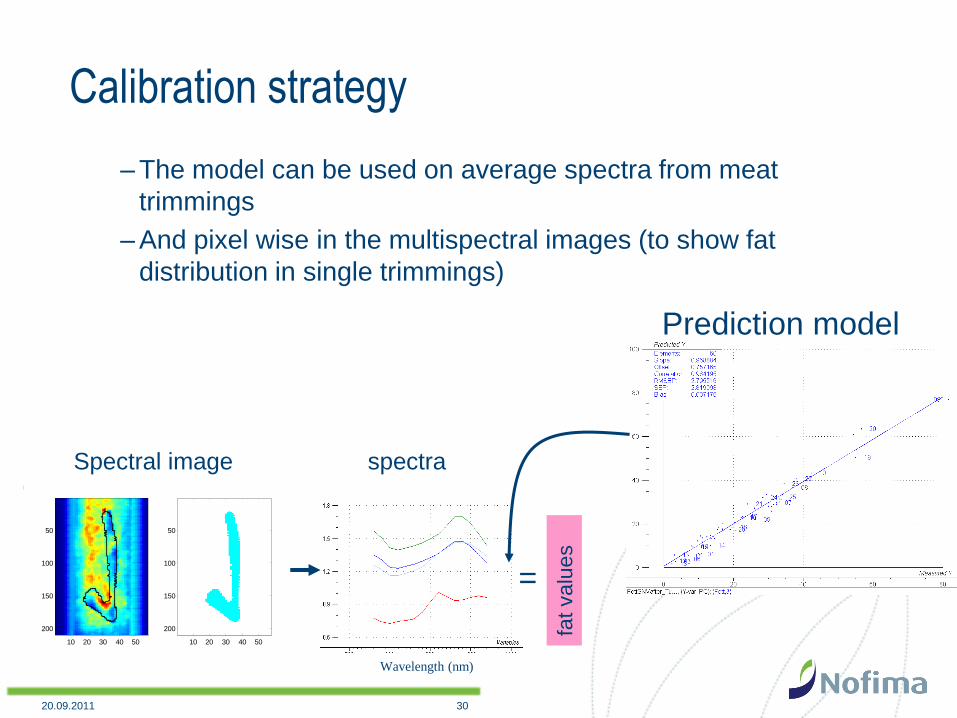
Calibration strategy
– The model can be used on average spectra from meat
trimmings
– And pixel wise in the multispectral images (to show fat
distribution in single trimmings)
10 20 30 40 50
50
100
150
200
10 20 30 40 50
50
100
150
200
Wavelength (nm)
spectra
=fa
t valu
es
Spectral image
Prediction model
20.09.2011 31
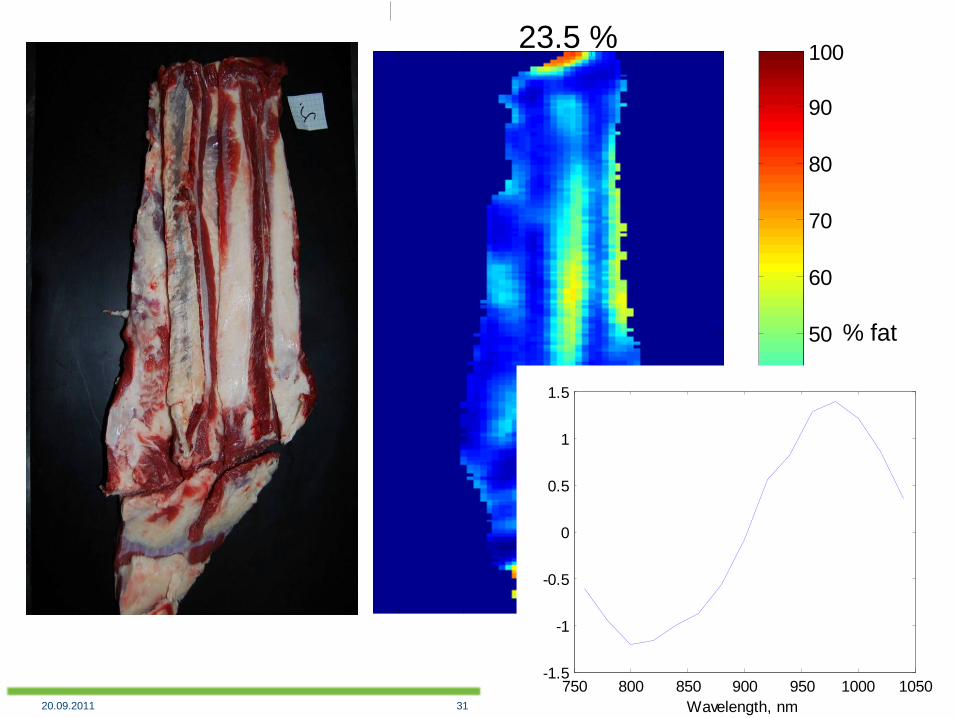
23.5645
10 20 30 40 50 60
20
40
60
80
100
120
140
160
180
0
10
20
30
40
50
60
70
80
90
100
% fat
750 800 850 900 950 1000 1050-1.5
-1
-0.5
0
0.5
1
1.5
Wavelength, nm
23.5 %
20.09.2011 32
44.2913
10 20 30 40 50 60
20
40
60
80
100
120
140
160
180
0
20
40
60
80
100
43.7 %
750 800 850 900 950 1000 1050-1.5
-1
-0.5
0
0.5
1
1.5
Wavelength, nm48.4798
10 20 30 40 50 60
20
40
60
80
1000
50
100
750 800 850 900 950 1000 1050-1.5
-1
-0.5
0
0.5
1
1.5
Wavelength, nm
48.1 %
7.188
10 20 30 40 50 60
20
40
60
80
1000
20
40
60
80
100
750 800 850 900 950 1000 1050-1.5
-1
-0.5
0
0.5
1
1.5
2
Wavelength, nm
6.7 %
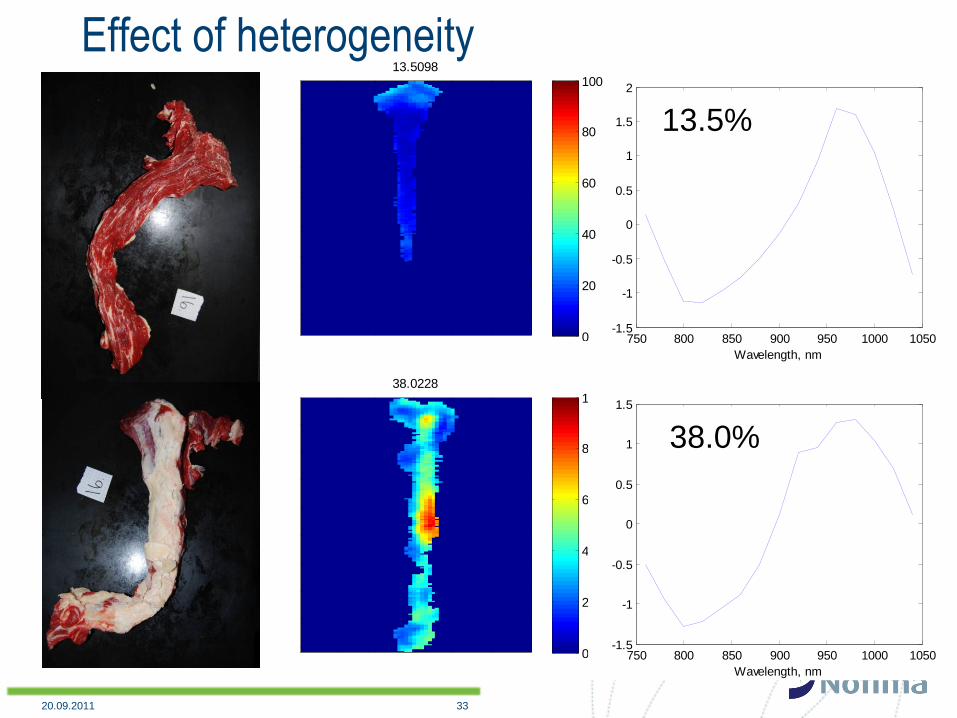
20.09.2011 33
Effect of heterogeneity13.5098
10 20 30 40 50 60
20
40
60
80
100
120
140
160
0
20
40
60
80
100
750 800 850 900 950 1000 1050-1.5
-1
-0.5
0
0.5
1
1.5
2
Wavelength, nm
38.0228
10 20 30 40 50 60
20
40
60
80
100
120
140
160
180 0
20
40
60
80
100
750 800 850 900 950 1000 1050-1.5
-1
-0.5
0
0.5
1
1.5
Wavelength, nm
13.5%
38.0%
20.09.2011 34
56.2416
10 20 30 40 50 60
10
20
30
40
50
60
70
80
0
20
40
60
80
100
750 800 850 900 950 1000 1050-1.5
-1
-0.5
0
0.5
1
1.5
Wavelength, nm
28.3564
10 20 30 40 50 60
20
40
60
80
100
120
140
1600
20
40
60
80
100
750 800 850 900 950 1000 1050-1.5
-1
-0.5
0
0.5
1
1.5
Wavelength, nm
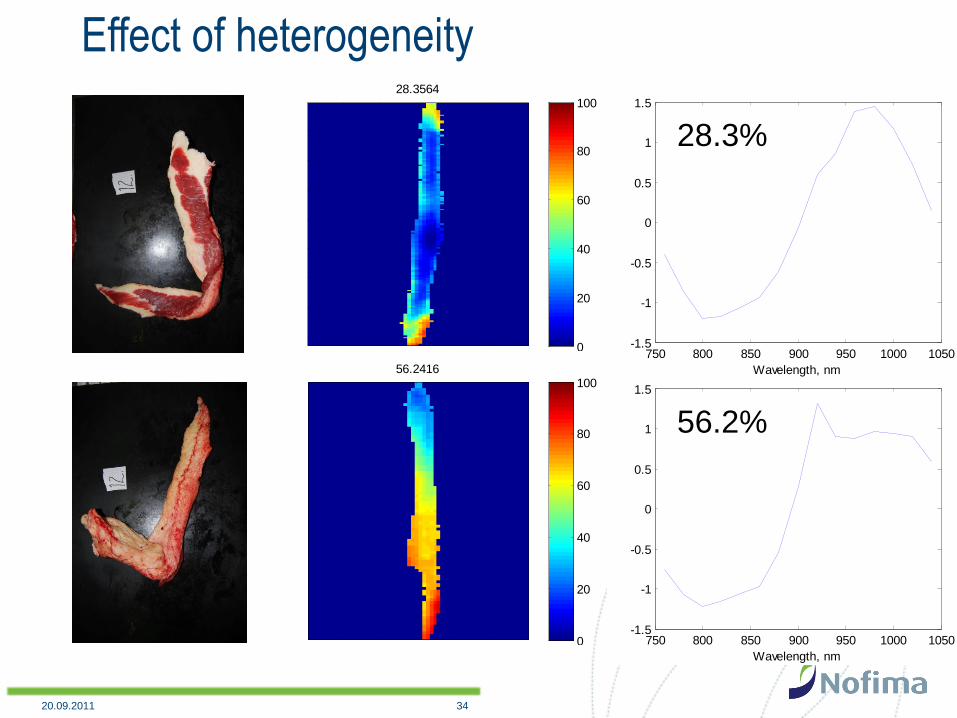
Effect of heterogeneity
28.3%
56.2%

20.09.2011 35
Applying model on single trimmings• Large prediction errors, especially on fat samples
• As expected…
NMR measured fat (%)
NIR
estimated
fat (%)
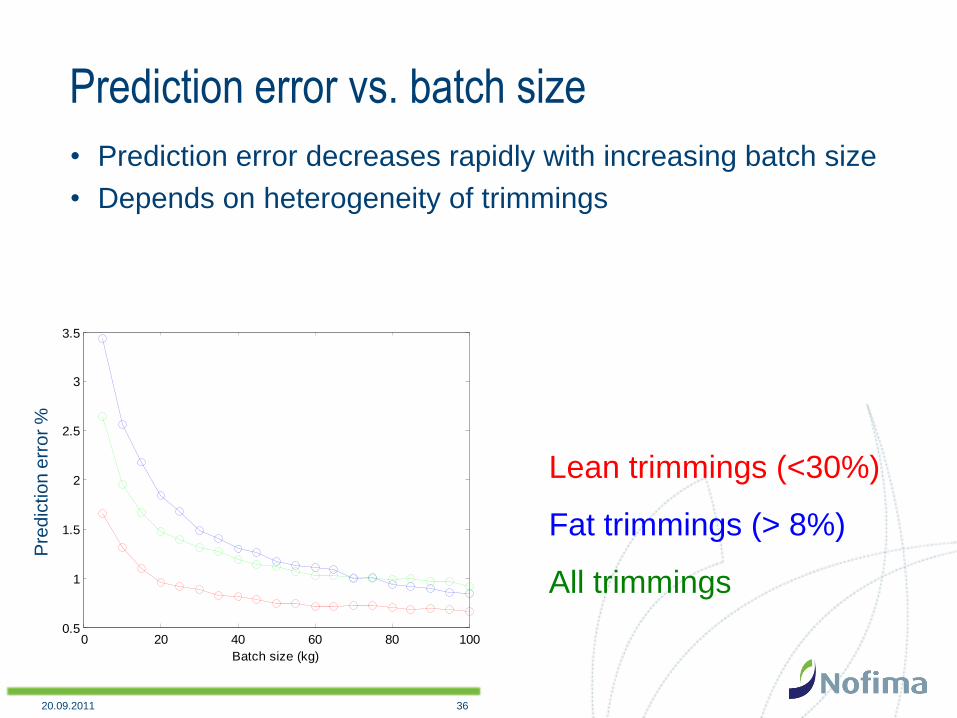
20.09.2011 36
Prediction error vs. batch size
• Prediction error decreases rapidly with increasing batch size
• Depends on heterogeneity of trimmings
Lean trimmings (<30%)
Fat trimmings (> 8%)
All trimmings
0 20 40 60 80 1000.5
1
1.5
2
2.5
3
3.5
Batch size (kg)
RM
SE
P (
%)
Pre
dic
tio
n e
rro
r %

20.09.2011 37
On-line estimation of fat in batch
• Gives good opportunity to control batch against desired fat content
0
5
10
15
20
25
30
35
40
45
50
1
11
20
30
38
48
56
66
75
84
93
105
115
125
135
145
153
162
170
Accumulated weight (kg)
Fat
(%)
Fat
Accumulated average fat
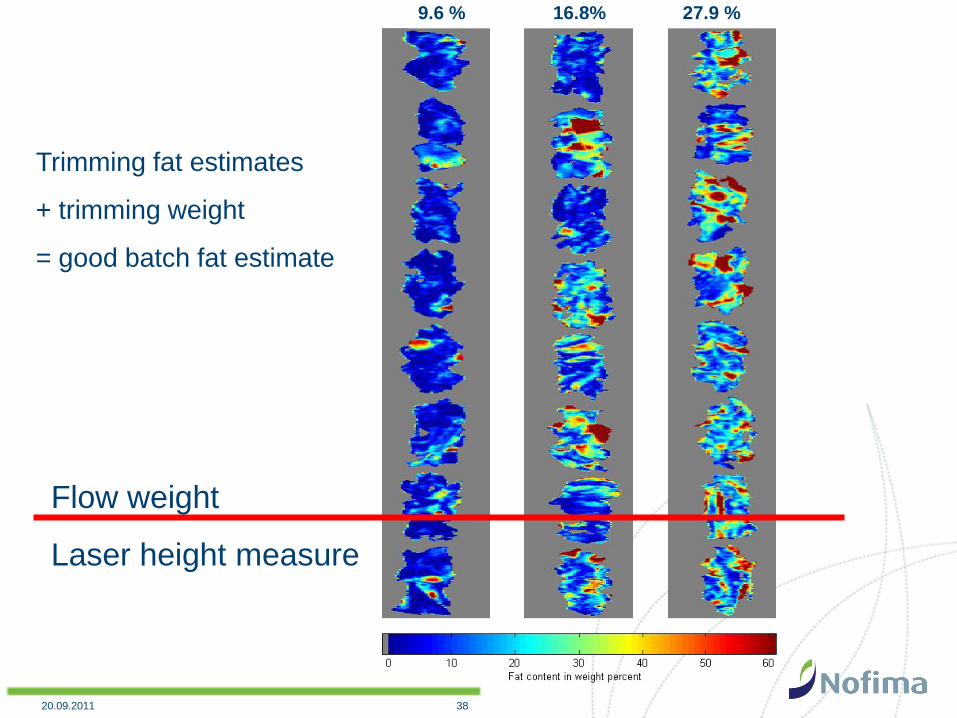
20.09.2011 38
9.6 % 16.8% 27.9 %
Flow weight
Laser height measure
Trimming fat estimates
+ trimming weight
= good batch fat estimate
20.09.2011 3939
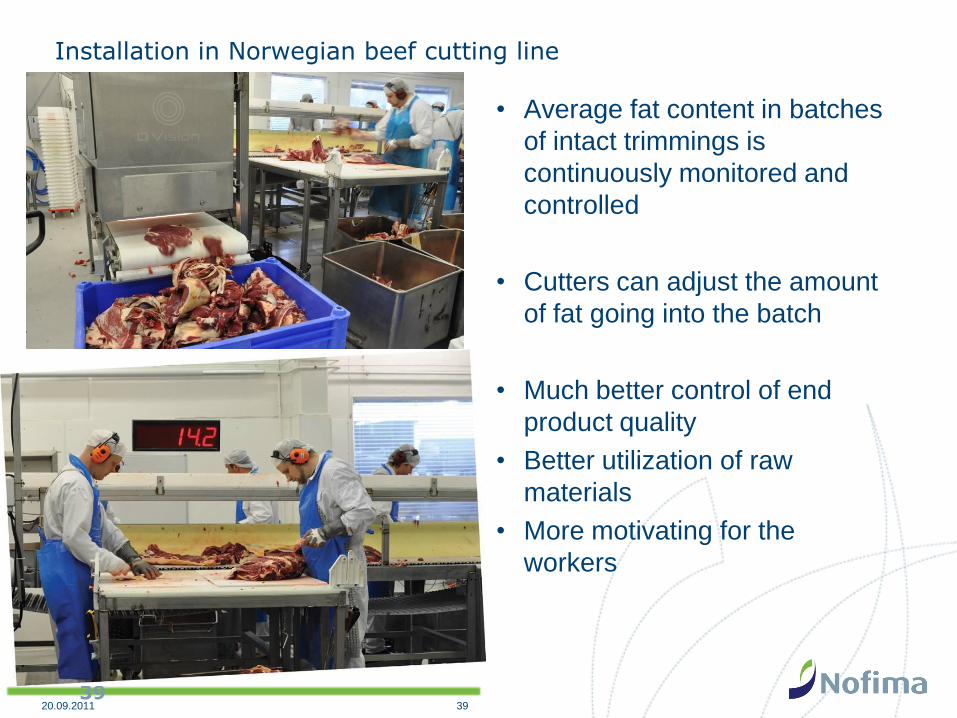
Installation in Norwegian beef cutting line
• Average fat content in batches
of intact trimmings is
continuously monitored and
controlled
• Cutters can adjust the amount
of fat going into the batch
• Much better control of end
product quality
• Better utilization of raw
materials
• More motivating for the
workers

20.09.2011 40
Repeatability for 250 kg batches
NIR estimated fat in 250 kg batches
0,0
5,0
10,0
15,0
20,0
25,0
30,0
0,0 10,0 20,0 30,0
Referenced fat
NIR
Es
tim
ted
fa
t
MicroWave
NIR run1
NIR run2
Ref. NIR 1 NIR 2
3,7 6,5 6,1
1,1 1,2 1,4
9,7 11,7 12,6
11,0 13,8 14,9
19,1 18,2 19,4
17,0 18,2 18,6
23,9 24,2 24,3

20.09.2011 41
Automatic detection of connective tissue (CT)
• Can detect surface
connective tissue (CT)
• Can be used to produce
batches of different
qualities
• Batch quality can be
based on
– Fat
– CT
– A-priori knowledge
about cutting patterns
Sample: CT3B
Sample: CT3B
Fat prediction: 3.5 % mean fat
5 10 15 20
20
40
60
80
100
120
140
160
180
200
0
5
10
15
20
25
30
35
40
45
50
Sample: CT3B
Connective tissue
5 10 15 20
20
40
60
80
100
120
140
160
180
200
Sample: CT3B
Whiteness
5 10 15 20
20
40
60
80
100
120
140
160
180
200
Sample: CT2B
Sample: CT2B
Fat prediction: 25.2 % mean fat
10 20 30 40
50
100
150
200
250
300
350 0
5
10
15
20
25
30
35
40
45
50
Sample: CT2B
Connective tissue
5 10 15 20 25 30 35 40
50
100
150
200
250
300
350
Sample: CT2B
Whiteness
5 10 15 20 25 30 35 40
50
100
150
200
250
300
350
Fat image CT image

20.09.2011 42
Summary meat batches1. From manual, subjective sorting: imprecise fat levels, difficult to control
2. To measurement on intact beef trimmings, which enables simple control of the
cutting line (implemented today)
3. To automatic sorting of intact trimmings into batches of pre-defined fat content.
14%
10%
+ CT
18%
26%
Automatic fat and
CT determination
scanner
18.3% sca
nn
er
Automatic sorting
into batches of
specified quality
Today Tomorrow
5%
5%
14 % & 21 % requires grinding and standardization
14 % / 21%
26%
Fat
Cutters
Yesterday
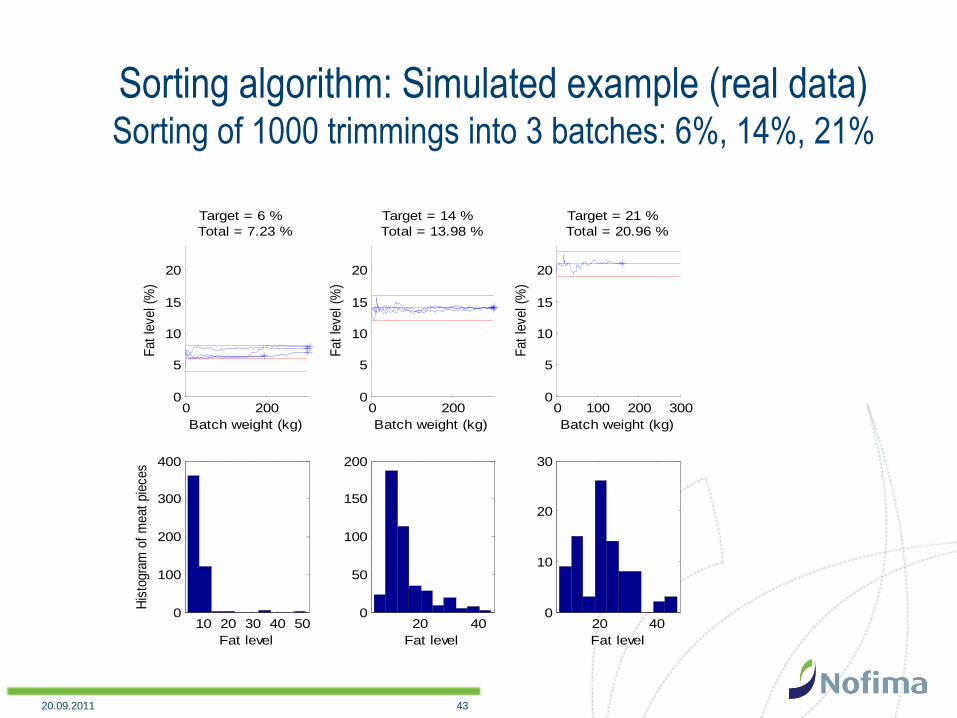
20.09.2011 43
Sorting algorithm: Simulated example (real data)Sorting of 1000 trimmings into 3 batches: 6%, 14%, 21%
0 2000
5
10
15
20
Batch weight (kg)
Fat
leve
l (%
)
Target = 6 %
Total = 7.23 %
10 20 30 40 500
100
200
300
400
His
togr
am o
f m
eat
piec
es
Fat level
0 2000
5
10
15
20
Batch weight (kg)
Fat
leve
l (%
)
Target = 14 %
Total = 13.98 %
20 400
50
100
150
200
Fat level
0 100 200 3000
5
10
15
20
Batch weight (kg)
Fat
leve
l (%
)
Target = 21 %
Total = 20.96 %
20 400
10
20
30
Fat level

20.09.2011 44
Grading of high value cuts: pork loins
• Scan of whole pork loins
was calibrated against
– Fat content
• Probably good enough for
sorting into 3 fat classes
Fat Average= 25.6275
10 20 30 40 50 60
50
100
150
200
250
300
350
400
450
10
20
30
40
50
60
70
80
90
100

20.09.2011 45
Fat content in boxed pork trimmings
0 10 20 30 40 50 600
10
20
30
40
50
60
Cutting Method Reference Fat Value
Pre
dic
ted F
atV
alu
e u
sin
g E
MS
C M
odel
Performance of EMSC
Cold Cut
Warm Cut
Ideal
• 20 kg boxes
• Accurracy of about ±2.8%
• But: Probes only 2 cm of upper layer,
so this layer needs to be representative
for the whole box
EMSC, Uneven Surface (Fat = 4.567)
10 20 30 40 50
100
200
300
400
500
600
700
0 20 40 60 80
SNV, Uneven Surface (Fat = 11.1491)
10 20 30 40 50 60
100
200
300
400
500
600
700
0 20 40 60 80
Log(1/T), Uneven Surface, (Fat = 12.8857)
10 20 30 40 50 60
100
200
300
400
500
600
700
0 20 40 60 80
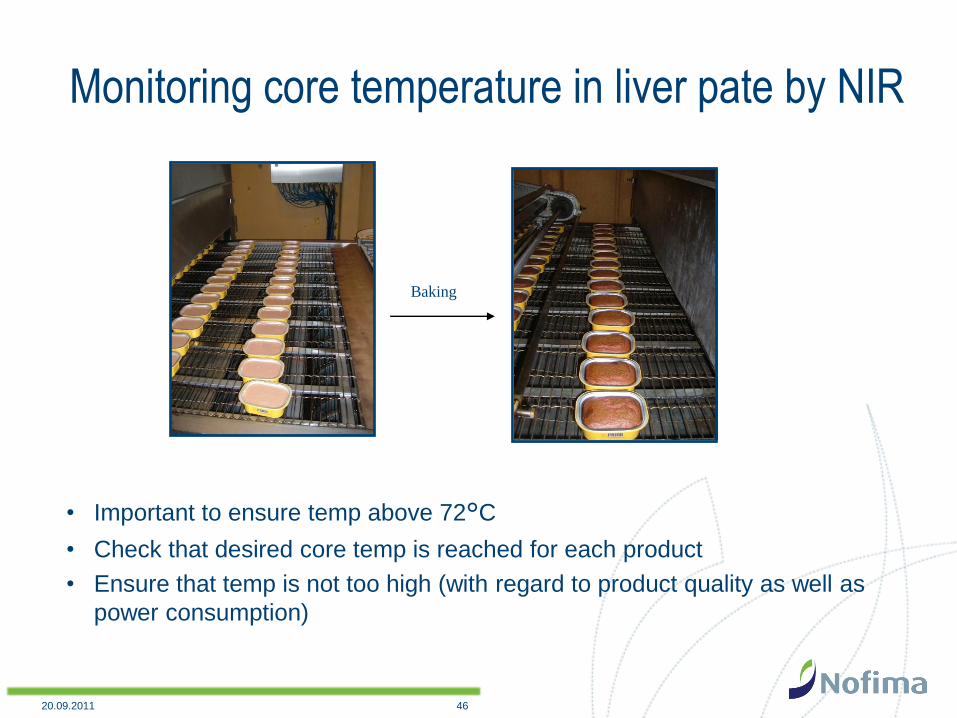
20.09.2011 46
Monitoring core temperature in liver pate by NIR
• Important to ensure temp above 72°C
• Check that desired core temp is reached for each product
• Ensure that temp is not too high (with regard to product quality as well as
power consumption)
Baking

20.09.2011 47
How does it work?
• A shift in the water peak as function of temperature
• Works on products of max thickness of about 4 cm
• Products should be fairly equal in shape and size
70°C
83°C
99°C

20.09.2011 48
Prediction model for core temperature
Accuracy: ± 1.75oC
R2 = 0.95
Accuracy: ± 2.5oC
R2 = 0.91
Different heating
procedure

20.09.2011 49
On-line core temp in fish cakes – no contact• Possible to measure core
temp in fish cakes and liver
pate with accuracy of about +/- 2°C
• Good enough for process
control
• Enables optimisation and
control of heating process
• Can also be used to check
cooling chains
65
5 10 15 20 25 30
100
200
300
400
500
20
30
40
50
60
70
80
90
100
Co
re t
em
p °
C

20.09.2011 50
Ice fraction in super chilled meat and fish
• Can be used to tune in super chilling
processes where an important aim is to
obatain the optimal ice fraction in the
product
20.09.2011 51
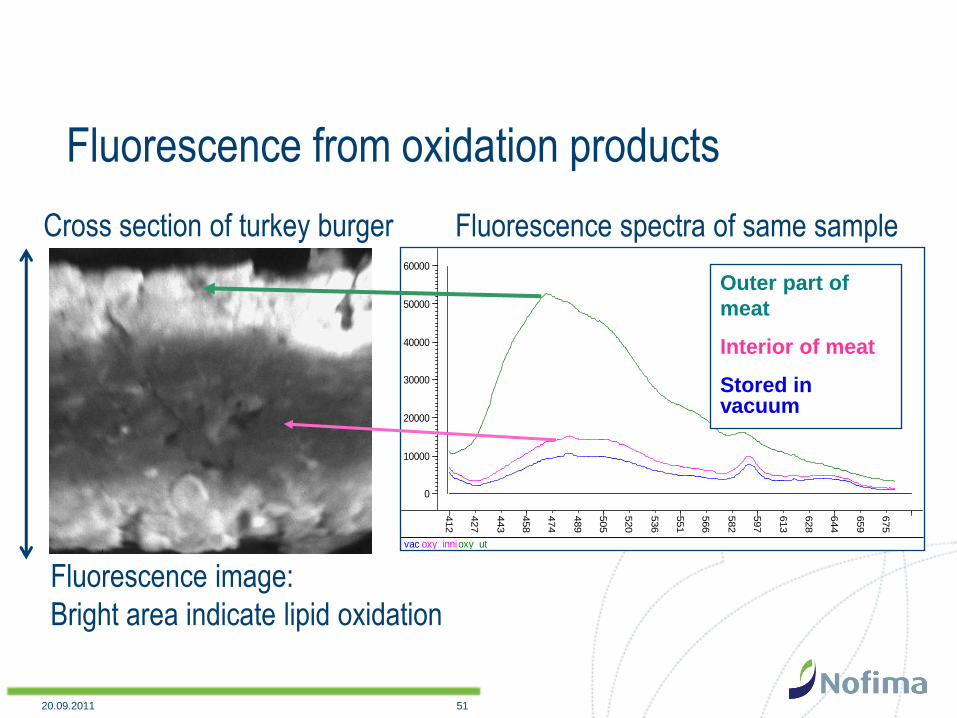
Fluorescence from oxidation products
Cross section of turkey burger
0
10000
20000
30000
40000
50000
60000
412
427
443
458
474
489
505
520
536
551
566
582
597
613
628
644
659
675
vac oxy_inni oxy_ut
Fluorescence image:
Bright area indicate lipid oxidation
Outer part of
meat
Interior of meat
Stored in vacuum
Fluorescence spectra of same sample

20.09.2011 52
Low cost instrument
• For rapid screening of samples
• Not specific but effective
• Used by companies for shelf life
studies of new products
• Quality control of e.g. freeze stored
pork fat
20.09.2011 53
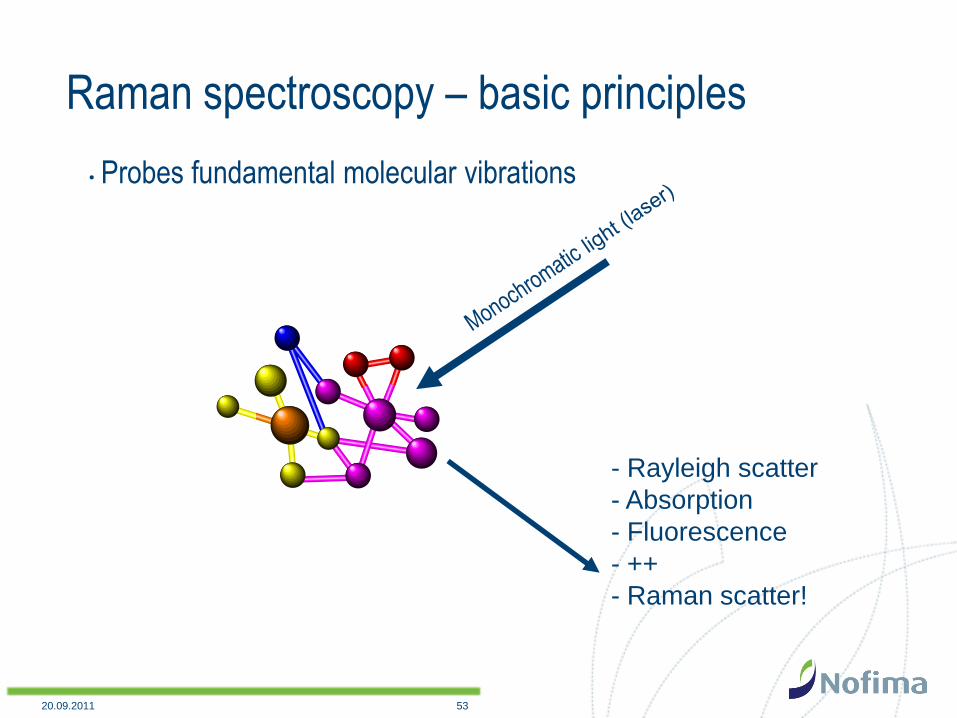
Raman spectroscopy – basic principles
- Rayleigh scatter
- Absorption
- Fluorescence
- ++
- Raman scatter!
• Probes fundamental molecular vibrations
20.09.2011 54
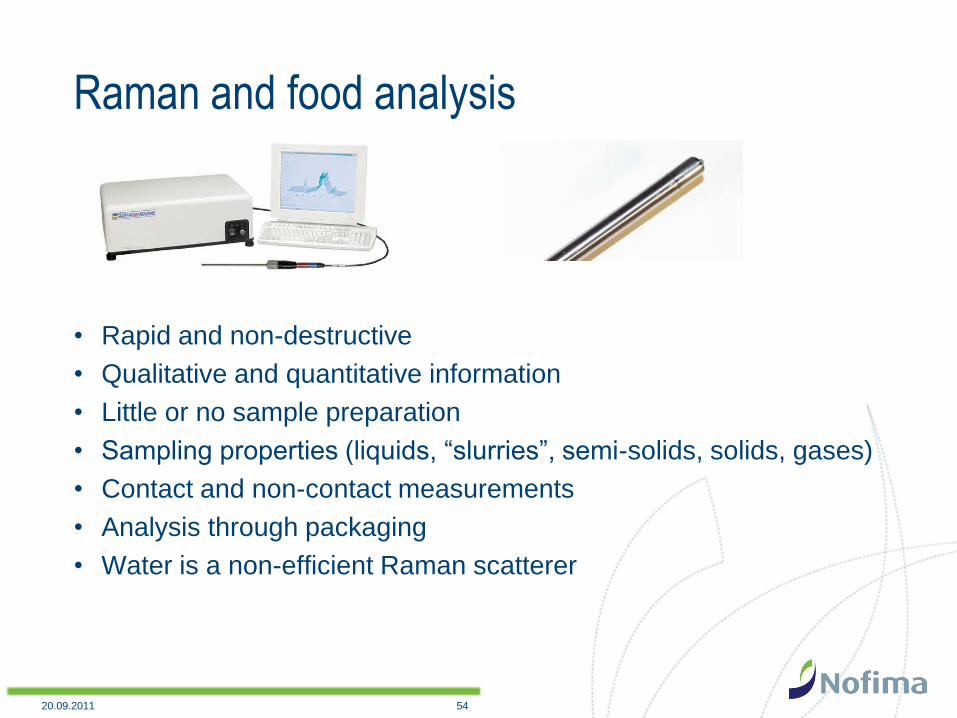
Raman and food analysis
• Rapid and non-destructive
• Qualitative and quantitative information
• Little or no sample preparation
• Sampling properties (liquids, “slurries”, semi-solids, solids, gases)
• Contact and non-contact measurements
• Analysis through packaging
• Water is a non-efficient Raman scatterer
20.09.2011 55
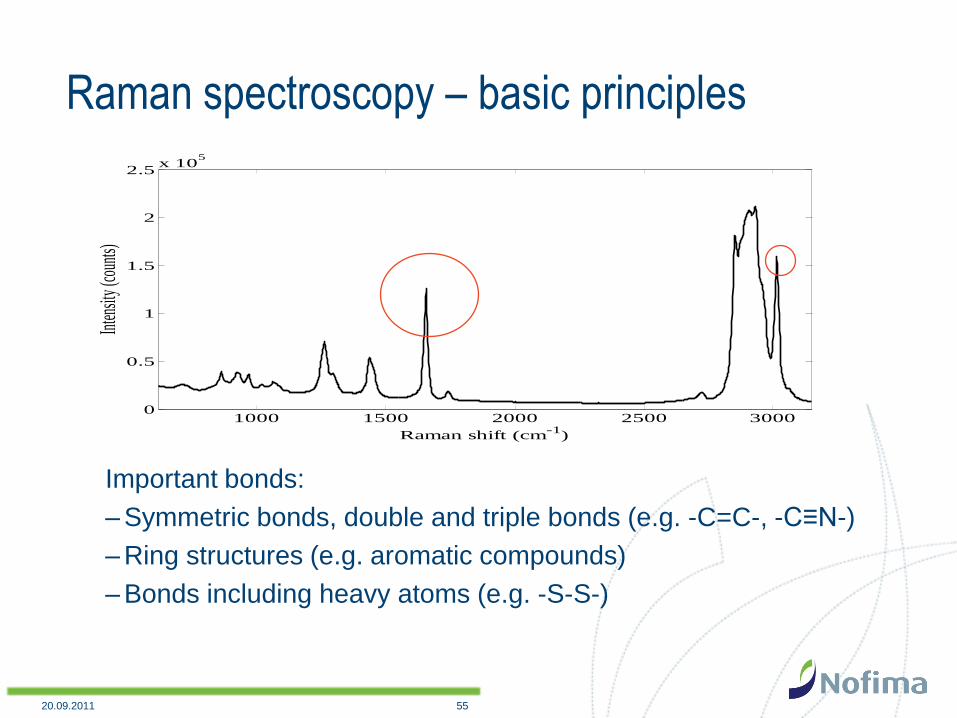
Raman spectroscopy – basic principles
1000 1500 2000 2500 30000
0.5
1
1.5
2
2.5x 10
5
Raman shift (cm-1
)
Inten
sity (
coun
ts)
Important bonds:
– Symmetric bonds, double and triple bonds (e.g. -C=C-, -C≡N-)
– Ring structures (e.g. aromatic compounds)
– Bonds including heavy atoms (e.g. -S-S-)

20.09.2011 56
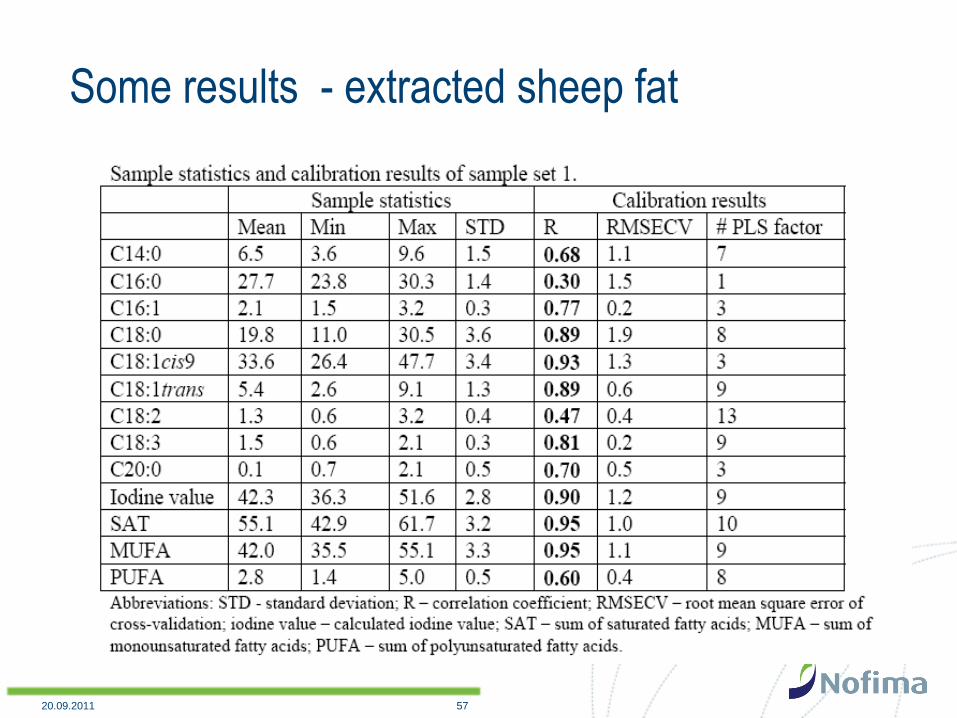
Raman and fatty acid characterisation
• Potential known for several decades
– Level of carbon-carbon unsaturation
– Conjugation
– Cis/trans content
– Carbon chain length
– Groups of fatty acids (SAT, MUFA, and PUFA)
– Single fatty acid content
• Majority of work on pure fats and oils
• Few studies on adipose tissue
Refs.:
Beattie, J.R. et al. Lipids. 41, 287 (2006).
Afseth, N.K. et al. Anal. Chim. Acta 572, 85 (2006).
Olsen, E.F. et al. Meat science. 76, 628 (2007).
20.09.2011 57
Some results - extracted sheep fat

20.09.2011 58
Some results - bovine adipose tissue
20.09.2011 59
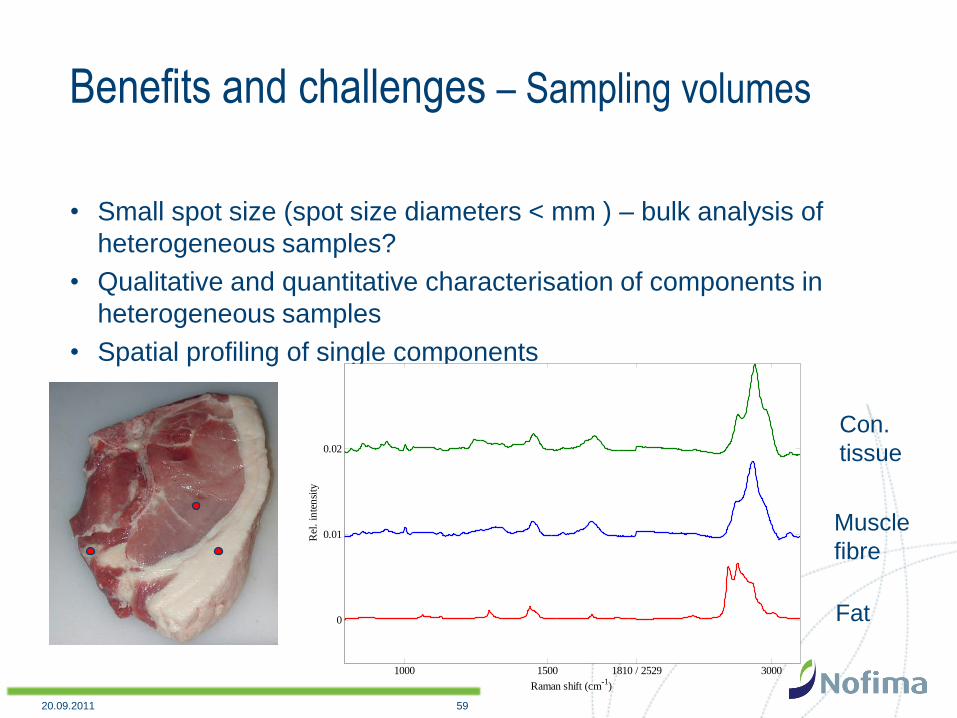
Benefits and challenges – Sampling volumes
• Small spot size (spot size diameters < mm ) – bulk analysis of
heterogeneous samples?
• Qualitative and quantitative characterisation of components in
heterogeneous samples
• Spatial profiling of single components
1000 1500 1810 / 2529 3000
0
0.01
0.02
Raman shift (cm-1
)
Rel
. in
ten
sity
Fat
Con.
tissue
Muscle
fibre
20.09.2011 60
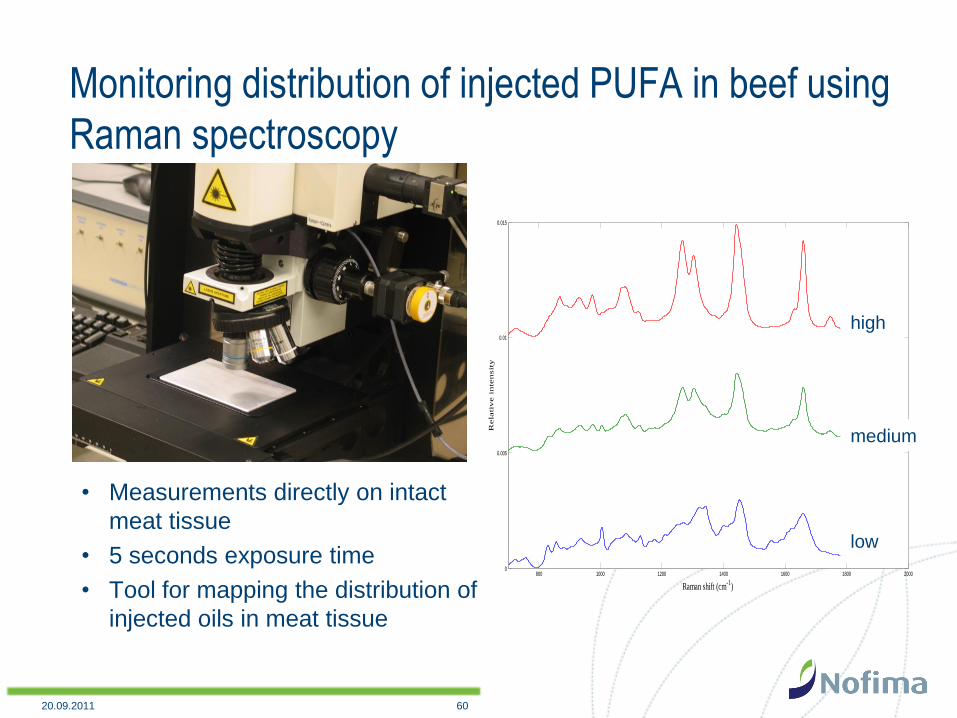
Monitoring distribution of injected PUFA in beef using
Raman spectroscopy
• Measurements directly on intact
meat tissue
• 5 seconds exposure time
• Tool for mapping the distribution of
injected oils in meat tissue
800 1000 1200 1400 1600 1800 20000
0.005
0.01
0.015
Raman shift (cm-1
)
Rela
tive i
nte
nsit
y
High contents
Medium contents
Low contents
high
low
medium
20.09.2011 61
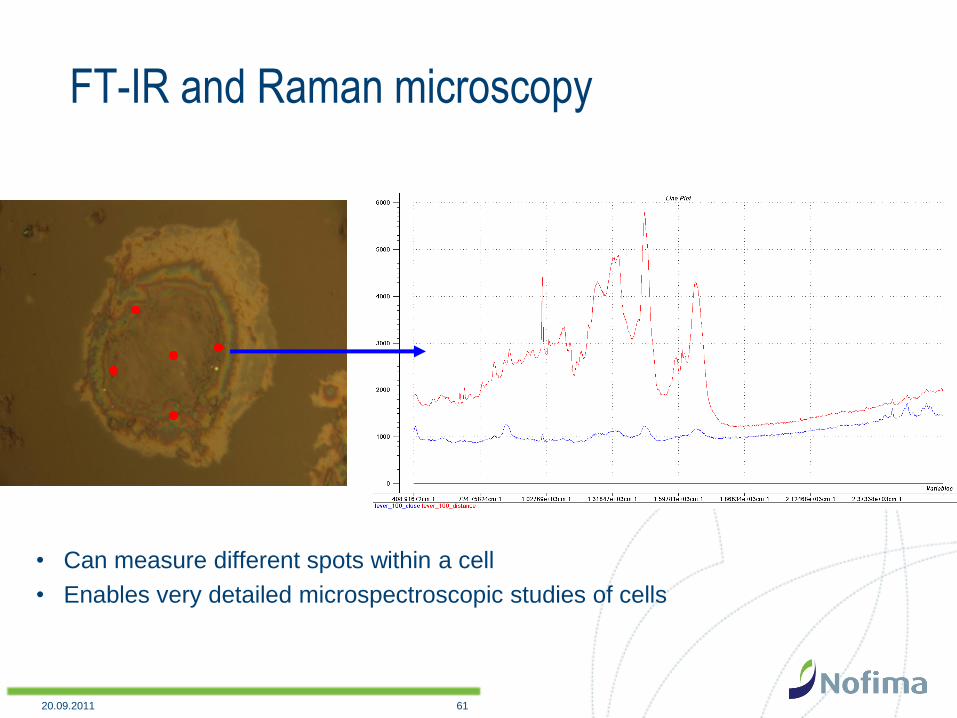
FT-IR and Raman microscopy
• Can measure different spots within a cell
• Enables very detailed microspectroscopic studies of cells

20.09.2011 62
Raman: Conclusive remarks and future thoughts
• Good and promising results obtained for parameters like C18:0,
C18:1, trans fatty acids, CLA, SAT, MUFA, and the iodine value
• Promising rapid tool for crude estimation of the fatty acid composition
of animal tissue – screening and selection of samples for thorough
chromatographic analysis.
• Powerful tool for microscopic studies.
08.10.2008 63
Predicting the future:
Downlowding meat
quality ”app’s”
20.09.2011 64
Summary• Imaging will replace spot sampling for most heterogeneous food samples
• Distributional information through NIR imaging is and will be beneficial in process optimisation
• The success of an application relies on adequate setup for spectral sampling and reference sampling (which needs careful consideration!)
• New technology is sophisticated, while competence in the meat industry is limited (challenge!)
• New technology requires changes in traditional processes and craftsmanship (challenge!)
• New technology is adapted only when it increases profit notably
– Only when “need to have”, never when “nice to have”
• Spectroscopic techniques can also be used as effective and novel approaches within meat science
20.09.2011 65
Acknowledgements
• Nofima
– Martin Høy, Vegard Segtnan, Nils Kristian Afseth, Silje Ottestad,
Heidi Njabjerg
• Sintef ICT
– Jon Tschudi, Marion O’Farrel
• The companies QVision, Animalia, Nortura, Faccsa, Rendalen
Kjøtt, Mills, Hitramat
• The projects MeatVision, MeatAutoSort, ProSafeBeef, Crustasea,
KMB Competitive processing

20.09.2011 66
Novel VIS/NIR instrument • 10 measurements / sec
• Accuracy: ± 1.1% unit for fat in
whole salmon
• To be used within breeding and
genetics
• Continuous evaluation of feeding
regimes
• Measurements in production:
– sorting to different retail
– different markets
– product labelling
VIS/NIR
Spectrometer
E
D A

20.09.2011 67
Effective breeding and selection• Measurement of fat and pigment in
4500 live salmon
• Heritability factor for fat/pigment can be
calculated
• Selection of the best families for
production
• Saves one generation of fish + a lot of
costly wet chemistry
0,0
5,0
10,0
15,0
20,0
25,0
30,0
1 500 999 1498 1997 2496 2995 3494 3993 4492
Estimated fat%
Estimated fat%
Fa
t %
Salmon no.
Two happy salmon
20.09.2011 68
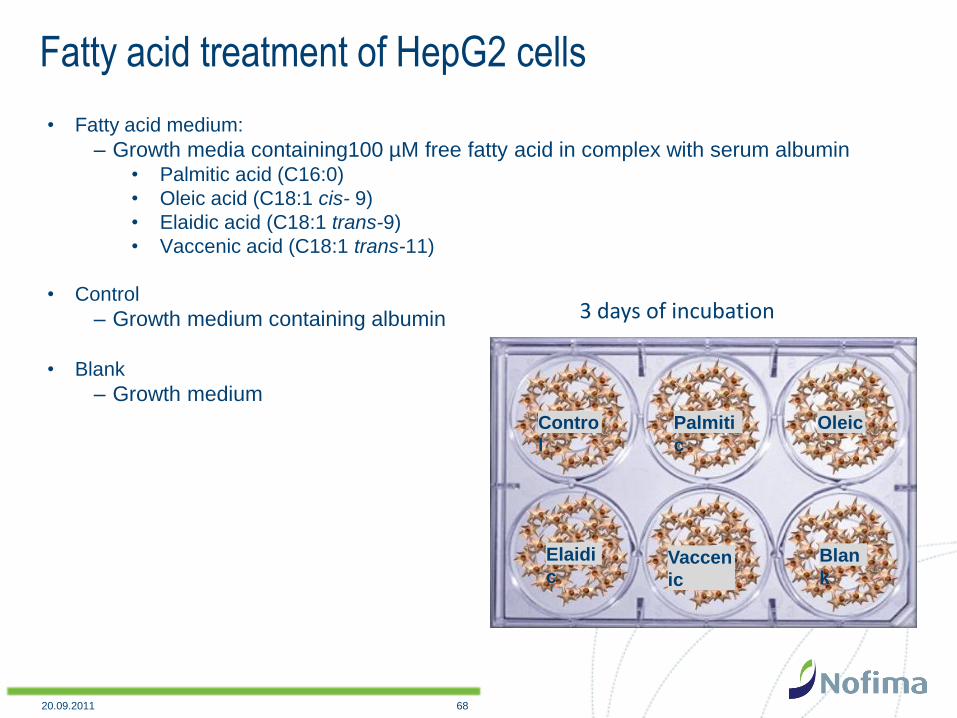
Fatty acid treatment of HepG2 cells
• Fatty acid medium:
– Growth media containing100 µM free fatty acid in complex with serum albumin• Palmitic acid (C16:0)
• Oleic acid (C18:1 cis- 9)
• Elaidic acid (C18:1 trans-9)
• Vaccenic acid (C18:1 trans-11)
• Control
– Growth medium containing albumin
• Blank
– Growth medium
Contro
l
Blan
kVaccen
ic
Elaidi
c
OleicPalmiti
c
3 days of incubation

20.09.2011 69
Cell harvest
Transfer of cell pellets to FT-IR transmission plate
Multivariate
data analysis
(PCA)
• Cells washed with proliferation medium and saline buffer
• Cells mechanical dissociated
• Cell suspensions centrifuged
Data pre-processing
(EMSC)
2. Derivative
FT-IR measurements
FT-IR measurements
Acquisition of spectra

20.09.2011 70
-6 -4 -2 0 2 4 6
x 10-4
-2
-1
0
1
2
3
4
x 10-4
PC 1 67.5%
PC
2
1
8.6%
PPP
P
O
O O
O
EE
EE
VV
VV
-2 -1 0 1 2 3 4
x 10-4
-3
-2
-1
0
1
2
x 10-4
PC 2 18.6%P
C 3
8.
8%
P
PPP
O
OO
O
E
EE
EVV
VV
Grouping according to fatty acid treatment
20.09.2011 71
• FT-IR suggests that vaccenic acid (18:1trans-11) treatment
induces production of conjugated species (likely CLA), whereas
elaidic acid(18:1trans-9) do not.
• GC verification is difficult due to minute concentrations and
extraction challenges
• FT-IR useful for detailed studies of metabolite production in cells.
High-throughput screening of HepG2 cells