raytheon technologies corporation - climate change 2021
TRANSCRIPT
Raytheon Technologies Corporation - Climate Change 2021
C0. Introduction
C0.1
(C0.1) Give a general description and introduction to your organization.
Raytheon Technologies Corporation with 2020 pro forma sales of $64 billion and more than 180,000 employees, is an aerospace and defense company that providesadvanced systems and services for commercial, military and government customers worldwide. With four industry-leading businesses ― Collins Aerospace Systems, Pratt &Whitney, Raytheon Intelligence & Space and Raytheon Missiles & Defense ― the company delivers solutions that push the boundaries in avionics, cybersecurity, directedenergy, electric propulsion, hypersonics, and quantum physics. The company, formed in 2020 through the combination of Raytheon Company and the United TechnologiesCorporation aerospace businesses, is headquartered in Waltham, Massachusetts.
C0.2
(C0.2) State the start and end date of the year for which you are reporting data.
Start date End date Indicate if you are providing emissions data for past reportingyears
Select the number of past reporting years you will be providing emissions datafor
Reportingyear
January 12020
December 312020
No <Not Applicable>
C0.3
(C0.3) Select the countries/areas for which you will be supplying data.CanadaChinaIsraelMexicoPolandSingaporeUnited Kingdom of Great Britain and Northern IrelandUnited States of America
C0.4
(C0.4) Select the currency used for all financial information disclosed throughout your response.USD
C0.5
(C0.5) Select the option that describes the reporting boundary for which climate-related impacts on your business are being reported. Note that this option shouldalign with your chosen approach for consolidating your GHG inventory.Operational control
C1. Governance
C1.1
(C1.1) Is there board-level oversight of climate-related issues within your organization?Yes
CDP Page of 481
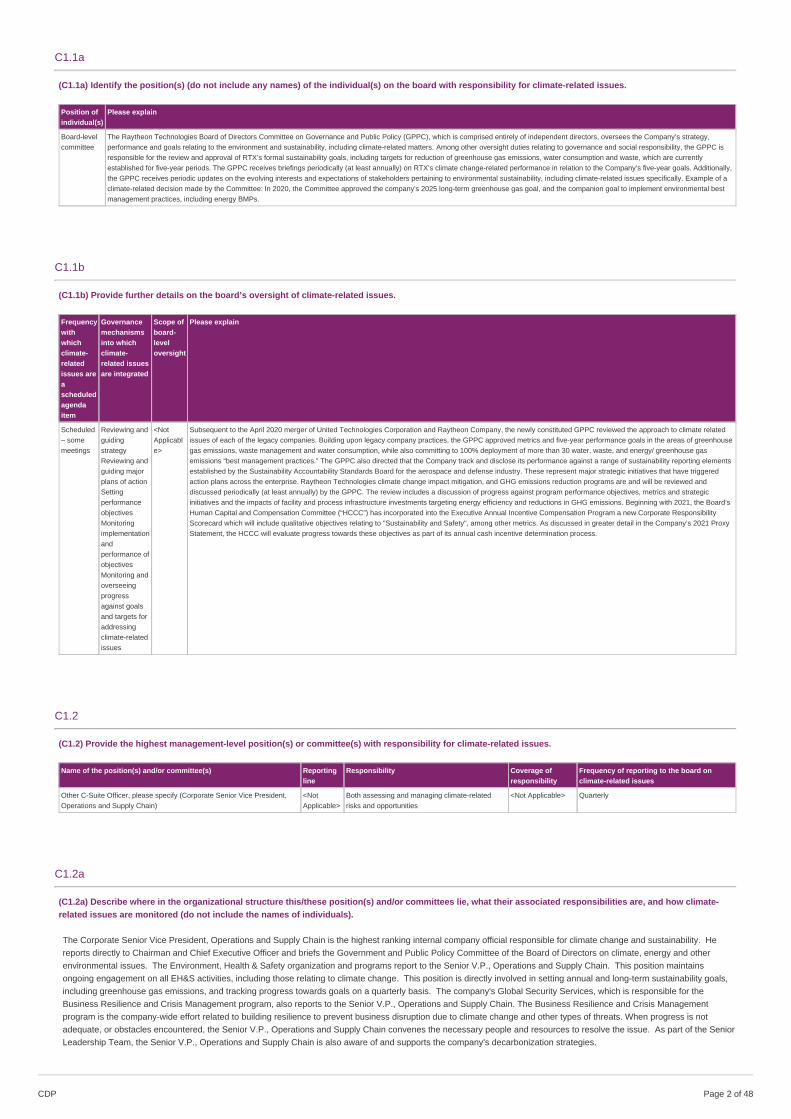
C1.1a
(C1.1a) Identify the position(s) (do not include any names) of the individual(s) on the board with responsibility for climate-related issues.
Position ofindividual(s)
Please explain
Board-levelcommittee
The Raytheon Technologies Board of Directors Committee on Governance and Public Policy (GPPC), which is comprised entirely of independent directors, oversees the Company’s strategy,performance and goals relating to the environment and sustainability, including climate-related matters. Among other oversight duties relating to governance and social responsibility, the GPPC isresponsible for the review and approval of RTX’s formal sustainability goals, including targets for reduction of greenhouse gas emissions, water consumption and waste, which are currentlyestablished for five-year periods. The GPPC receives briefings periodically (at least annually) on RTX’s climate change-related performance in relation to the Company’s five-year goals. Additionally,the GPPC receives periodic updates on the evolving interests and expectations of stakeholders pertaining to environmental sustainability, including climate-related issues specifically. Example of aclimate-related decision made by the Committee: In 2020, the Committee approved the company's 2025 long-term greenhouse gas goal, and the companion goal to implement environmental bestmanagement practices, including energy BMPs.
C1.1b
(C1.1b) Provide further details on the board’s oversight of climate-related issues.
Frequencywithwhichclimate-relatedissues areascheduledagendaitem
Governancemechanismsinto whichclimate-related issuesare integrated
Scope ofboard-leveloversight
Please explain
Scheduled– somemeetings
Reviewing andguidingstrategyReviewing andguiding majorplans of actionSettingperformanceobjectivesMonitoringimplementationandperformance ofobjectivesMonitoring andoverseeingprogressagainst goalsand targets foraddressingclimate-relatedissues
<NotApplicable>
Subsequent to the April 2020 merger of United Technologies Corporation and Raytheon Company, the newly constituted GPPC reviewed the approach to climate relatedissues of each of the legacy companies. Building upon legacy company practices, the GPPC approved metrics and five-year performance goals in the areas of greenhousegas emissions, waste management and water consumption, while also committing to 100% deployment of more than 30 water, waste, and energy/ greenhouse gasemissions “best management practices.” The GPPC also directed that the Company track and disclose its performance against a range of sustainability reporting elementsestablished by the Sustainability Accountability Standards Board for the aerospace and defense industry. These represent major strategic initiatives that have triggeredaction plans across the enterprise. Raytheon Technologies climate change impact mitigation, and GHG emissions reduction programs are and will be reviewed anddiscussed periodically (at least annually) by the GPPC. The review includes a discussion of progress against program performance objectives, metrics and strategicinitiatives and the impacts of facility and process infrastructure investments targeting energy efficiency and reductions in GHG emissions. Beginning with 2021, the Board’sHuman Capital and Compensation Committee (“HCCC”) has incorporated into the Executive Annual Incentive Compensation Program a new Corporate ResponsibilityScorecard which will include qualitative objectives relating to "Sustainability and Safety", among other metrics. As discussed in greater detail in the Company’s 2021 ProxyStatement, the HCCC will evaluate progress towards these objectives as part of its annual cash incentive determination process.
C1.2
(C1.2) Provide the highest management-level position(s) or committee(s) with responsibility for climate-related issues.
Name of the position(s) and/or committee(s) Reportingline
Responsibility Coverage ofresponsibility
Frequency of reporting to the board onclimate-related issues
Other C-Suite Officer, please specify (Corporate Senior Vice President,Operations and Supply Chain)
<NotApplicable>
Both assessing and managing climate-relatedrisks and opportunities
<Not Applicable> Quarterly
C1.2a
(C1.2a) Describe where in the organizational structure this/these position(s) and/or committees lie, what their associated responsibilities are, and how climate-related issues are monitored (do not include the names of individuals).
The Corporate Senior Vice President, Operations and Supply Chain is the highest ranking internal company official responsible for climate change and sustainability. Hereports directly to Chairman and Chief Executive Officer and briefs the Government and Public Policy Committee of the Board of Directors on climate, energy and otherenvironmental issues. The Environment, Health & Safety organization and programs report to the Senior V.P., Operations and Supply Chain. This position maintainsongoing engagement on all EH&S activities, including those relating to climate change. This position is directly involved in setting annual and long-term sustainability goals,including greenhouse gas emissions, and tracking progress towards goals on a quarterly basis. The company's Global Security Services, which is responsible for theBusiness Resilience and Crisis Management program, also reports to the Senior V.P., Operations and Supply Chain. The Business Resilience and Crisis Managementprogram is the company-wide effort related to building resilience to prevent business disruption due to climate change and other types of threats. When progress is notadequate, or obstacles encountered, the Senior V.P., Operations and Supply Chain convenes the necessary people and resources to resolve the issue. As part of the SeniorLeadership Team, the Senior V.P., Operations and Supply Chain is also aware of and supports the company's decarbonization strategies.
CDP Page of 482
C1.3
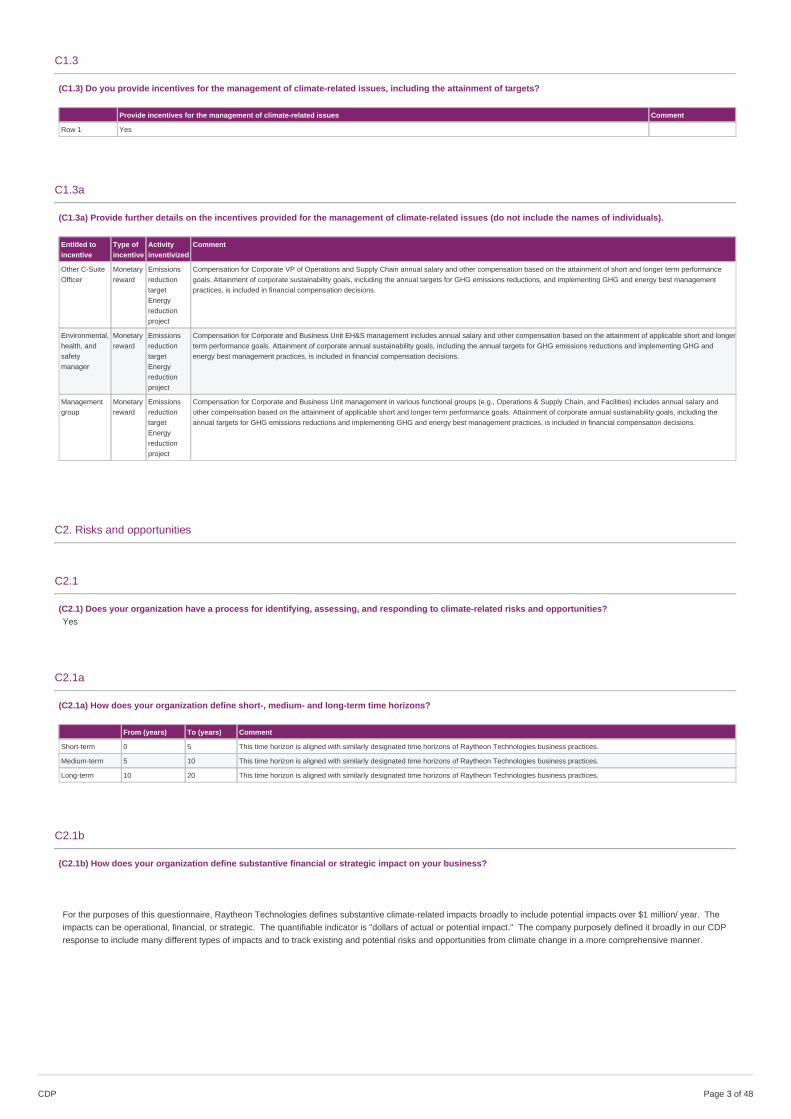
(C1.3) Do you provide incentives for the management of climate-related issues, including the attainment of targets?
Provide incentives for the management of climate-related issues Comment
Row 1 Yes
C1.3a
(C1.3a) Provide further details on the incentives provided for the management of climate-related issues (do not include the names of individuals).
Entitled toincentive
Type ofincentive
Activityinventivized
Comment
Other C-SuiteOfficer
Monetaryreward
EmissionsreductiontargetEnergyreductionproject
Compensation for Corporate VP of Operations and Supply Chain annual salary and other compensation based on the attainment of short and longer term performancegoals. Attainment of corporate sustainability goals, including the annual targets for GHG emissions reductions, and implementing GHG and energy best managementpractices, is included in financial compensation decisions.
Environmental,health, andsafetymanager
Monetaryreward
EmissionsreductiontargetEnergyreductionproject
Compensation for Corporate and Business Unit EH&S management includes annual salary and other compensation based on the attainment of applicable short and longerterm performance goals. Attainment of corporate annual sustainability goals, including the annual targets for GHG emissions reductions and implementing GHG andenergy best management practices, is included in financial compensation decisions.
Managementgroup
Monetaryreward
EmissionsreductiontargetEnergyreductionproject
Compensation for Corporate and Business Unit management in various functional groups (e.g., Operations & Supply Chain, and Facilities) includes annual salary andother compensation based on the attainment of applicable short and longer term performance goals. Attainment of corporate annual sustainability goals, including theannual targets for GHG emissions reductions and implementing GHG and energy best management practices, is included in financial compensation decisions.
C2. Risks and opportunities
C2.1
(C2.1) Does your organization have a process for identifying, assessing, and responding to climate-related risks and opportunities?Yes
C2.1a
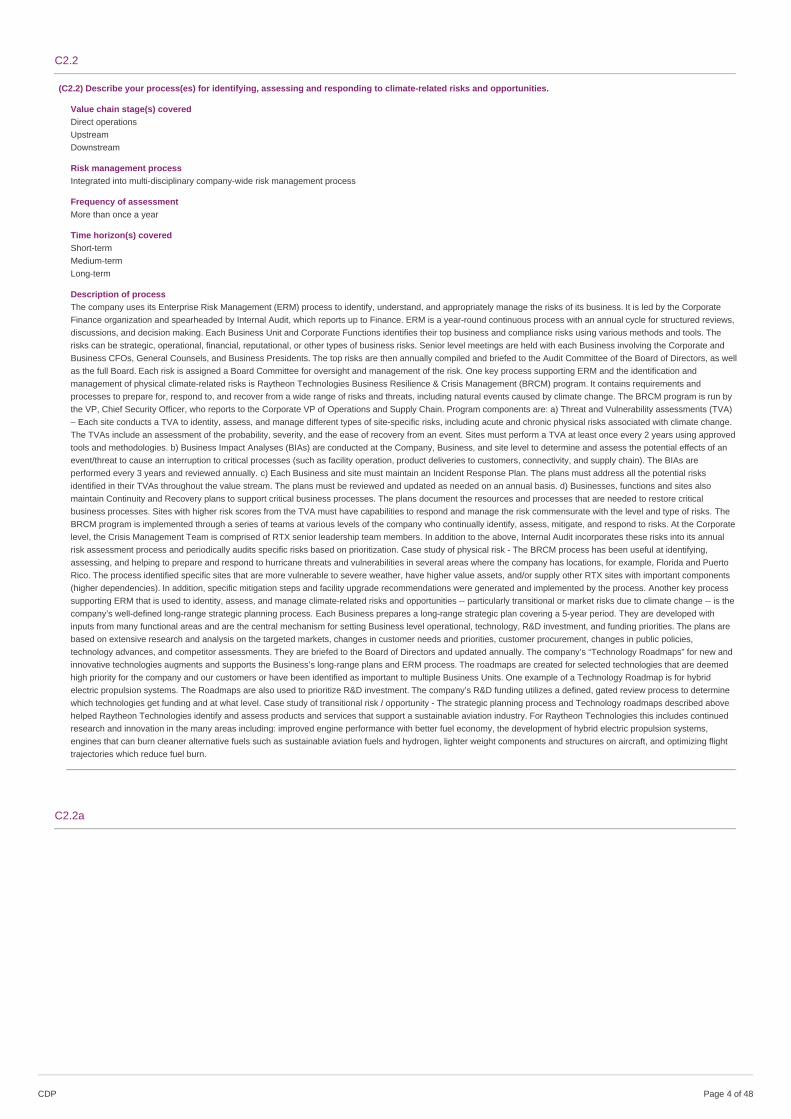
(C2.1a) How does your organization define short-, medium- and long-term time horizons?
From (years) To (years) Comment
Short-term 0 5 This time horizon is aligned with similarly designated time horizons of Raytheon Technologies business practices.
Medium-term 5 10 This time horizon is aligned with similarly designated time horizons of Raytheon Technologies business practices.
Long-term 10 20 This time horizon is aligned with similarly designated time horizons of Raytheon Technologies business practices.
C2.1b
(C2.1b) How does your organization define substantive financial or strategic impact on your business?
For the purposes of this questionnaire, Raytheon Technologies defines substantive climate-related impacts broadly to include potential impacts over $1 million/ year. Theimpacts can be operational, financial, or strategic. The quantifiable indicator is "dollars of actual or potential impact." The company purposely defined it broadly in our CDPresponse to include many different types of impacts and to track existing and potential risks and opportunities from climate change in a more comprehensive manner.
CDP Page of 483
C2.2
(C2.2) Describe your process(es) for identifying, assessing and responding to climate-related risks and opportunities.
Value chain stage(s) coveredDirect operationsUpstreamDownstream
Risk management processIntegrated into multi-disciplinary company-wide risk management process
Frequency of assessmentMore than once a year
Time horizon(s) coveredShort-termMedium-termLong-term
Description of processThe company uses its Enterprise Risk Management (ERM) process to identify, understand, and appropriately manage the risks of its business. It is led by the CorporateFinance organization and spearheaded by Internal Audit, which reports up to Finance. ERM is a year-round continuous process with an annual cycle for structured reviews,discussions, and decision making. Each Business Unit and Corporate Functions identifies their top business and compliance risks using various methods and tools. Therisks can be strategic, operational, financial, reputational, or other types of business risks. Senior level meetings are held with each Business involving the Corporate andBusiness CFOs, General Counsels, and Business Presidents. The top risks are then annually compiled and briefed to the Audit Committee of the Board of Directors, as wellas the full Board. Each risk is assigned a Board Committee for oversight and management of the risk. One key process supporting ERM and the identification andmanagement of physical climate-related risks is Raytheon Technologies Business Resilience & Crisis Management (BRCM) program. It contains requirements andprocesses to prepare for, respond to, and recover from a wide range of risks and threats, including natural events caused by climate change. The BRCM program is run bythe VP, Chief Security Officer, who reports to the Corporate VP of Operations and Supply Chain. Program components are: a) Threat and Vulnerability assessments (TVA)– Each site conducts a TVA to identity, assess, and manage different types of site-specific risks, including acute and chronic physical risks associated with climate change.The TVAs include an assessment of the probability, severity, and the ease of recovery from an event. Sites must perform a TVA at least once every 2 years using approvedtools and methodologies. b) Business Impact Analyses (BIAs) are conducted at the Company, Business, and site level to determine and assess the potential effects of anevent/threat to cause an interruption to critical processes (such as facility operation, product deliveries to customers, connectivity, and supply chain). The BIAs areperformed every 3 years and reviewed annually. c) Each Business and site must maintain an Incident Response Plan. The plans must address all the potential risksidentified in their TVAs throughout the value stream. The plans must be reviewed and updated as needed on an annual basis. d) Businesses, functions and sites alsomaintain Continuity and Recovery plans to support critical business processes. The plans document the resources and processes that are needed to restore criticalbusiness processes. Sites with higher risk scores from the TVA must have capabilities to respond and manage the risk commensurate with the level and type of risks. TheBRCM program is implemented through a series of teams at various levels of the company who continually identify, assess, mitigate, and respond to risks. At the Corporatelevel, the Crisis Management Team is comprised of RTX senior leadership team members. In addition to the above, Internal Audit incorporates these risks into its annualrisk assessment process and periodically audits specific risks based on prioritization. Case study of physical risk - The BRCM process has been useful at identifying,assessing, and helping to prepare and respond to hurricane threats and vulnerabilities in several areas where the company has locations, for example, Florida and PuertoRico. The process identified specific sites that are more vulnerable to severe weather, have higher value assets, and/or supply other RTX sites with important components(higher dependencies). In addition, specific mitigation steps and facility upgrade recommendations were generated and implemented by the process. Another key processsupporting ERM that is used to identity, assess, and manage climate-related risks and opportunities -- particularly transitional or market risks due to climate change -- is thecompany’s well-defined long-range strategic planning process. Each Business prepares a long-range strategic plan covering a 5-year period. They are developed withinputs from many functional areas and are the central mechanism for setting Business level operational, technology, R&D investment, and funding priorities. The plans arebased on extensive research and analysis on the targeted markets, changes in customer needs and priorities, customer procurement, changes in public policies,technology advances, and competitor assessments. They are briefed to the Board of Directors and updated annually. The company’s “Technology Roadmaps” for new andinnovative technologies augments and supports the Business’s long-range plans and ERM process. The roadmaps are created for selected technologies that are deemedhigh priority for the company and our customers or have been identified as important to multiple Business Units. One example of a Technology Roadmap is for hybridelectric propulsion systems. The Roadmaps are also used to prioritize R&D investment. The company’s R&D funding utilizes a defined, gated review process to determinewhich technologies get funding and at what level. Case study of transitional risk / opportunity - The strategic planning process and Technology roadmaps described abovehelped Raytheon Technologies identify and assess products and services that support a sustainable aviation industry. For Raytheon Technologies this includes continuedresearch and innovation in the many areas including: improved engine performance with better fuel economy, the development of hybrid electric propulsion systems,engines that can burn cleaner alternative fuels such as sustainable aviation fuels and hydrogen, lighter weight components and structures on aircraft, and optimizing flighttrajectories which reduce fuel burn.
C2.2a
CDP Page of 484
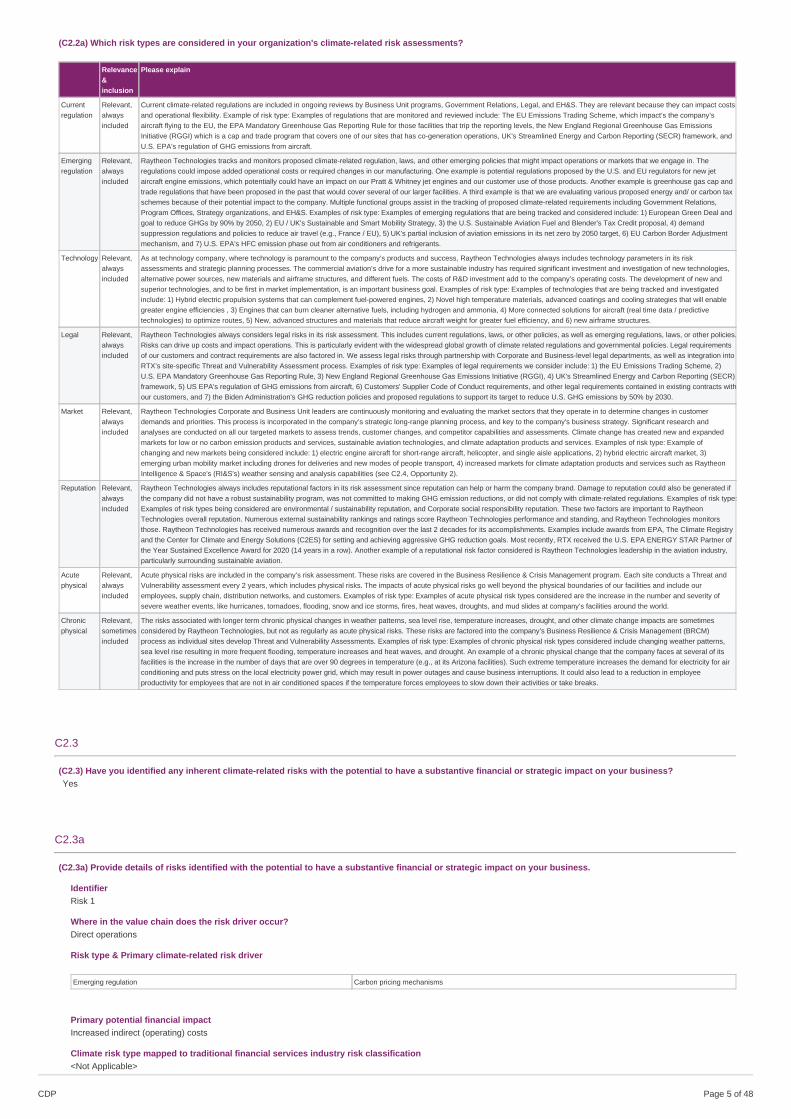
(C2.2a) Which risk types are considered in your organization's climate-related risk assessments?
Relevance&inclusion
Please explain
Currentregulation
Relevant,alwaysincluded
Current climate-related regulations are included in ongoing reviews by Business Unit programs, Government Relations, Legal, and EH&S. They are relevant because they can impact costsand operational flexibility. Example of risk type: Examples of regulations that are monitored and reviewed include: The EU Emissions Trading Scheme, which impact’s the company’saircraft flying to the EU, the EPA Mandatory Greenhouse Gas Reporting Rule for those facilities that trip the reporting levels, the New England Regional Greenhouse Gas EmissionsInitiative (RGGI) which is a cap and trade program that covers one of our sites that has co-generation operations, UK's Streamlined Energy and Carbon Reporting (SECR) framework, andU.S. EPA's regulation of GHG emissions from aircraft.
Emergingregulation
Relevant,alwaysincluded
Raytheon Technologies tracks and monitors proposed climate-related regulation, laws, and other emerging policies that might impact operations or markets that we engage in. Theregulations could impose added operational costs or required changes in our manufacturing. One example is potential regulations proposed by the U.S. and EU regulators for new jetaircraft engine emissions, which potentially could have an impact on our Pratt & Whitney jet engines and our customer use of those products. Another example is greenhouse gas cap andtrade regulations that have been proposed in the past that would cover several of our larger facilities. A third example is that we are evaluating various proposed energy and/ or carbon taxschemes because of their potential impact to the company. Multiple functional groups assist in the tracking of proposed climate-related requirements including Government Relations,Program Offices, Strategy organizations, and EH&S. Examples of risk type: Examples of emerging regulations that are being tracked and considered include: 1) European Green Deal andgoal to reduce GHGs by 90% by 2050, 2) EU / UK's Sustainable and Smart Mobility Strategy, 3) the U.S. Sustainable Aviation Fuel and Blender's Tax Credit proposal, 4) demandsuppression regulations and policies to reduce air travel (e.g., France / EU), 5) UK's partial inclusion of aviation emissions in its net zero by 2050 target, 6) EU Carbon Border Adjustmentmechanism, and 7) U.S. EPA's HFC emission phase out from air conditioners and refrigerants.
Technology Relevant,alwaysincluded
As at technology company, where technology is paramount to the company’s products and success, Raytheon Technologies always includes technology parameters in its riskassessments and strategic planning processes. The commercial aviation’s drive for a more sustainable industry has required significant investment and investigation of new technologies,alternative power sources, new materials and airframe structures, and different fuels. The costs of R&D investment add to the company’s operating costs. The development of new andsuperior technologies, and to be first in market implementation, is an important business goal. Examples of risk type: Examples of technologies that are being tracked and investigatedinclude: 1) Hybrid electric propulsion systems that can complement fuel-powered engines, 2) Novel high temperature materials, advanced coatings and cooling strategies that will enablegreater engine efficiencies , 3) Engines that can burn cleaner alternative fuels, including hydrogen and ammonia, 4) More connected solutions for aircraft (real time data / predictivetechnologies) to optimize routes, 5) New, advanced structures and materials that reduce aircraft weight for greater fuel efficiency, and 6) new airframe structures.
Legal Relevant,alwaysincluded
Raytheon Technologies always considers legal risks in its risk assessment. This includes current regulations, laws, or other policies, as well as emerging regulations, laws, or other policies.Risks can drive up costs and impact operations. This is particularly evident with the widespread global growth of climate related regulations and governmental policies. Legal requirementsof our customers and contract requirements are also factored in. We assess legal risks through partnership with Corporate and Business-level legal departments, as well as integration intoRTX’s site-specific Threat and Vulnerability Assessment process. Examples of risk type: Examples of legal requirements we consider include: 1) the EU Emissions Trading Scheme, 2)U.S. EPA Mandatory Greenhouse Gas Reporting Rule, 3) New England Regional Greenhouse Gas Emissions Initiative (RGGI), 4) UK's Streamlined Energy and Carbon Reporting (SECR)framework, 5) US EPA's regulation of GHG emissions from aircraft, 6) Customers' Supplier Code of Conduct requirements, and other legal requirements contained in existing contracts withour customers, and 7) the Biden Administration's GHG reduction policies and proposed regulations to support its target to reduce U.S. GHG emissions by 50% by 2030.
Market Relevant,alwaysincluded
Raytheon Technologies Corporate and Business Unit leaders are continuously monitoring and evaluating the market sectors that they operate in to determine changes in customerdemands and priorities. This process is incorporated in the company’s strategic long-range planning process, and key to the company's business strategy. Significant research andanalyses are conducted on all our targeted markets to assess trends, customer changes, and competitor capabilities and assessments. Climate change has created new and expandedmarkets for low or no carbon emission products and services, sustainable aviation technologies, and climate adaptation products and services. Examples of risk type: Example ofchanging and new markets being considered include: 1) electric engine aircraft for short-range aircraft, helicopter, and single aisle applications, 2) hybrid electric aircraft market, 3)emerging urban mobility market including drones for deliveries and new modes of people transport, 4) increased markets for climate adaptation products and services such as RaytheonIntelligence & Space's (RI&S's) weather sensing and analysis capabilities (see C2.4, Opportunity 2).
Reputation Relevant,alwaysincluded
Raytheon Technologies always includes reputational factors in its risk assessment since reputation can help or harm the company brand. Damage to reputation could also be generated ifthe company did not have a robust sustainability program, was not committed to making GHG emission reductions, or did not comply with climate-related regulations. Examples of risk type:Examples of risk types being considered are environmental / sustainability reputation, and Corporate social responsibility reputation. These two factors are important to RaytheonTechnologies overall reputation. Numerous external sustainability rankings and ratings score Raytheon Technologies performance and standing, and Raytheon Technologies monitorsthose. Raytheon Technologies has received numerous awards and recognition over the last 2 decades for its accomplishments. Examples include awards from EPA, The Climate Registryand the Center for Climate and Energy Solutions (C2ES) for setting and achieving aggressive GHG reduction goals. Most recently, RTX received the U.S. EPA ENERGY STAR Partner ofthe Year Sustained Excellence Award for 2020 (14 years in a row). Another example of a reputational risk factor considered is Raytheon Technologies leadership in the aviation industry,particularly surrounding sustainable aviation.
Acutephysical
Relevant,alwaysincluded
Acute physical risks are included in the company’s risk assessment. These risks are covered in the Business Resilience & Crisis Management program. Each site conducts a Threat andVulnerability assessment every 2 years, which includes physical risks. The impacts of acute physical risks go well beyond the physical boundaries of our facilities and include ouremployees, supply chain, distribution networks, and customers. Examples of risk type: Examples of acute physical risk types considered are the increase in the number and severity ofsevere weather events, like hurricanes, tornadoes, flooding, snow and ice storms, fires, heat waves, droughts, and mud slides at company’s facilities around the world.
Chronicphysical
Relevant,sometimesincluded
The risks associated with longer term chronic physical changes in weather patterns, sea level rise, temperature increases, drought, and other climate change impacts are sometimesconsidered by Raytheon Technologies, but not as regularly as acute physical risks. These risks are factored into the company’s Business Resilience & Crisis Management (BRCM)process as individual sites develop Threat and Vulnerability Assessments. Examples of risk type: Examples of chronic physical risk types considered include changing weather patterns,sea level rise resulting in more frequent flooding, temperature increases and heat waves, and drought. An example of a chronic physical change that the company faces at several of itsfacilities is the increase in the number of days that are over 90 degrees in temperature (e.g., at its Arizona facilities). Such extreme temperature increases the demand for electricity for airconditioning and puts stress on the local electricity power grid, which may result in power outages and cause business interruptions. It could also lead to a reduction in employeeproductivity for employees that are not in air conditioned spaces if the temperature forces employees to slow down their activities or take breaks.
C2.3
(C2.3) Have you identified any inherent climate-related risks with the potential to have a substantive financial or strategic impact on your business?Yes
C2.3a
(C2.3a) Provide details of risks identified with the potential to have a substantive financial or strategic impact on your business.
IdentifierRisk 1
Where in the value chain does the risk driver occur?Direct operations
Risk type & Primary climate-related risk driver
Emerging regulation Carbon pricing mechanisms
Primary potential financial impactIncreased indirect (operating) costs
Climate risk type mapped to traditional financial services industry risk classification<Not Applicable>
CDP Page of 485
Company-specific descriptionGovernmental policies and regulations that put a price on carbon are considered a likely outcome as countries try to adhere to their greenhouse gas reduction targetspursuant to the Paris Climate Accords. This is particularly true in the shorter term in the European Union where Raytheon Technologies has numerous facilities (e.g., UK,France, Poland, Germany, Italy, and the Netherlands). Several carbon pricing schemes are explicitly identified in the International Energy Agency's (IEA's) Stated Policiesclimate scenario (STEPS) (e.g., EU carbon pricing with an increased minimum price in accordance with the 2030 Climate and Energy Framework, and Netherland industrycarbon tax for major emissions sources to complement the EU ETS). Carbon pricing is also likely to be mandated to achieve many countries' Paris Agreementcommitments (Nationally Determined Contributions) of net zero by 2050 or before, like the UK's climate targets contained in the UK Sixth Carbon Budget target. Some formof carbon pricing may be needed to achieve the U.S.'s target of 50% reduction of GHGs by 2030.
Time horizonMedium-term
LikelihoodLikely
Magnitude of impactMedium
Are you able to provide a potential financial impact figure?Yes, an estimated range
Potential financial impact figure (currency)<Not Applicable>
Potential financial impact figure – minimum (currency)7200000
Potential financial impact figure – maximum (currency)14400000
Explanation of financial impact figureA review of carbon costs in countries and regions around the world demonstrates an extremely wide range. Raytheon Technologies assumed an average cost of$20/mtCO2e as a potential regulatory price on carbon emissions. In 2019, our scope 1 and scope 2 GHG emissions were approximately 1.8 million mtCO2e. 2020emissions were not used in the calculation due to the influence of COVID on emissions levels. It is assumed that a range of between 20 - 40% of our total scope 1 and 2emissions would be subject to this carbon pricing within the next 10 years. The potential financial impact was calculated as follows: $20/mtCO2e x 1.8M emissions = $36Mx 20% of emissions = $7.2 M. This is the low end of the potential financial impact. The high end of the potential financial impact assumes 40% of the company's emissionsare subject to this carbon pricing ($20/mtCO2e x 1.8M emissions = $36M x 40% of emissions = $14.4M).
Cost of response to risk10000000
Description of response and explanation of cost calculationThe primary methods for managing this risk are to continue to implement initiatives and programs to reduce the company’s energy consumption, increase energy efficiencyof its buildings and manufacturing equipment, reduce greenhouse gas emissions, and increase the use of renewable energy in order to stay under regulatory applicabilitythreshold levels. This is driven by the company's GHG reduction goal, and a companion goal to implement 11 energy/GHG best management practices throughout thecompany. These projects include investing in building and equipment upgrades, and pursuing changes in operations and manufacturing processes. Case Studies: 1) Acase study of how Raytheon Technologies is implementing energy projects in order to manage this risk includes its robust energy management program, which in 2020resulted in the completion of numerous LED lighting upgrades at many of our sites, replacing several chillers, compressed air optimization, and implementation of numerousbuilding HVAC control enhancements to reduce energy consumption. In addition, a new Corporate Policy on Energy and Greenhouse Gas Emission Reductions waspublished in 2020. 2) Another method for managing this risk is investigating the feasibility of renewable energy projects, both on-site and off-site, such as off-site wind andon-site solar. Energy generated with renewable resources would not be covered by most carbon pricing schemes or climate regulations. In the last several years, RTX hasinvestigated numerous renewable projects. In 2020, Raytheon Technologies launched 6 new renewable electricity projects in Texas, Maine, Virginia, and Singapore. 2 ofthe projects were on-site projects, and 4 were off-site renewable projects. The estimated cost of response to the risk was calculated as follows: Typical annual investmentsto reduce energy /GHGs is approximately $10 million per year from facility energy projects. Raytheon Technologies maintains a centralize database of completedenergy/GHG projects, along with costs and estimated project savings. The $10 M number was pulled from the database and represents the average annual investmentcost.
Comment
IdentifierRisk 2
Where in the value chain does the risk driver occur?Direct operations
Risk type & Primary climate-related risk driver
Acute physical Increased severity and frequency of extreme weather events such as cyclones and floods
Primary potential financial impactIncreased indirect (operating) costs
Climate risk type mapped to traditional financial services industry risk classification<Not Applicable>
Company-specific descriptionRaytheon Technologies (RTX) has approximately 550 significant properties in approximately 30 countries, with approximately 80 million square feet of productive space.Approximately 55% of these properties are leased and 45% are owned. Approximately 70% of our significant properties are in the U.S. Some of the properties are locatedin areas historically impacted by extreme weather events, such as hurricanes, tornadoes, severe lighting storms, floods, heat waves, and drought conditions that causeforest fires. For example, RTX has facilities in “hurricane” alley in the U.S., including FL, MS and TX. It has several facilities in the mid-west and central U.S. that are proneto tornadoes. Severe weather events have the potential to cause several impacts to the company: business interruption, property damage, damage to products and otherassets, the welfare of RTX's employees and their property, and damage to suppliers', subcontractors' and service providers' property/assets. Potential financial impacts willbe greater at sites with higher asset values and those with more interdependencies with other company sites (e.g., they supply parts or components to other sites). Thenumber and severity of severe weather events are forecasted to increase over time due to the impacts of climate change. An example of the impacts of physical risks to thecompany was the powerful 2020 derecho storm that swept across the Mid-Western U.S. and caused significant damage to one of our sites in Cedar Rapids, Iowa. A
CDP Page of 486
derecho is a fast-moving, violent wind event associated with a thunderstorm complex. This storm brought winds gusting to more than 70 mph for almost 1 hour to a largeregion and was one of the most destructive thunderstorm clusters on record in terms of damage costs, which NOAA estimated at $7.5 billion. The RTX facility sustainedsubstantial property damage and related business interruptions. Another example of this potential risk occurred when Hurricane Maria struck Puerto Rico in 2017 and tooka key facility off-line for an extended period. The site was without grid supplied power for over two months, fuel for backup generators and employees' homes was scarce,internet and other telecommunications on the island were non-existent, road transport and public service were severely curtailed, and many of the site's essential supplierswere also dealing with similar disruptions to their business operations and were unable to meet our site's needs.
Time horizonShort-term
LikelihoodVirtually certain
Magnitude of impactMedium-low
Are you able to provide a potential financial impact figure?Yes, an estimated range
Potential financial impact figure (currency)<Not Applicable>
Potential financial impact figure – minimum (currency)300000
Potential financial impact figure – maximum (currency)5000000
Explanation of financial impact figureThe range of potential financial impacts in any given year varies significantly and is estimated between $300,000 - $5 million. It is impossible to predict the number andseverity of weather events that would impact our facilities. Therefore, the financial impact range is highly speculative. The range was calculated based on estimatedpotential loss expectancies (including business interruptions) and an assumed number and severity of weather events impacting the company. On the low end, it isassumed that the company is impacted by 1 weather event leading to relatively small impacts ($300,000). On the high end of the range, it is assumed that RaytheonTechnologies is impacted by 2 events that cause significant impact to the facilities and the company (assumed $2.5M per storm x 2 = $5M). The probability of incurring thehigh estimate value is very low. Severe weather events can damage property, damage assets within the facility, cause business interruptions at the site, and lead to secondorder business disruptions if there are key interdependencies with other sites and product lines. Damage will be higher at larger sites, those with higher asset values, sitesthat have more interconnections with other sites (i.e., they supply parts or components to other company sites), and sites with greater natural hazards. There are additionalfinancial implications to our business operations if one or more of our supplier’s facilities was damaged or otherwise impacted, especially if it is a critical or sole-sourcesupplier.
Cost of response to risk780000
Description of response and explanation of cost calculationThe cost to respond to this risk was based on data from Raytheon Technologies property insurer for legacy Raytheon facilities. It estimated that legacy Raytheon spent $2.6M over a 10-year period to upgrade its facilities in response to their recommendations relating to natural hazards. That translates to $260K/yr average. We extrapolated thenumber to legacy UTC, which has almost double the sites. The calculation is as follows: $2.6M / 10 yr = $260K/yr + $520K/yr (legacy UTC sites) = $780K / year CaseStudies: The company manages this risk in several different ways: 1) We work with our property insurance company to conduct Facility Hazard Audits of our facilities. Theinsurance company assesses risks and provides recommendations to enhance facility resiliency. In addition, sites have capital expenditure budgets that include manydifferent building envelope improvements. We do not currently have 1 central repository of all the facility improvements. Therefore, the estimated costs above is likely to beunderestimated. 2) We maintain a strong Business Resiliency & Crisis Management (BRCM) program (as reported in C2.2) which requires sites to conduct Threat andVulnerability assessments, conduct Business Impact Analyses, and develop Continuity and Recovery plans to prepare for events. 3) We maintain property and businessinterruption insurance which protects the company against significant losses. One recent example of how the company is managing this type of risk is a collaboration withthe University of California Santa Barbara’s Bren School of Environmental Science & Management on a project that assessed physical climate risks to the company. RI&S’sEH&S organization led the project with UCSB graduate students and Faculty. The project quantified physical climate risks for 21 locations posed by 5 climate hazards. Italso examined risks over 3 time horizons: 2025, 2030, and 2040 under 2 different climate scenarios. Climate risk was quantified through hazard-specific risk scores andestimated financial costs for each site. This relied on hazard and climate data from public sources and site-specific data such as total site asset values. Color-coded riskscore heat maps were generated for each site to graphically show the sites with the greatest risk from each hazard. The results of the project are being widely shared withthe Business Resiliency & Crisis Management organization, EH&S, Facilities, and other functional groups.
Comment
IdentifierRisk 3
Where in the value chain does the risk driver occur?Downstream
Risk type & Primary climate-related risk driver
Technology Transitioning to lower emissions technology
Primary potential financial impactIncreased direct costs
Climate risk type mapped to traditional financial services industry risk classification<Not Applicable>
Company-specific descriptionThe Chief Technology Officers of 7 of the world’s leading aviation manufacturers, including Pratt & Whitney (P&W), jointly signed a statement at the 2019 Paris Air Show,and re-affirmed the commitment in 2020 to demonstrate how they are collaborating to drive the sustainability of aviation and reach the aviation industry CO2 reductiontarget. The group identified 3 key elements to sustainable aviation: 1) Continuing to develop aircraft and engine design and technology in a relentless pursuit ofimprovements in fuel efficiency and CO2 emissions, 2) Supporting the commercialization of sustainable, alternate aviation fuels, and 3) Developing radically new aircraftand propulsion technology and accelerating technologies that will enable the “third generation” of aviation. Some of the areas RTX is focused on include: 1) Engineperformance with better fuel economy 2) Hybrid electric propulsion systems that can complement fuel-powered engines 3) Engines that can burn cleaner alternative fuels
CDP Page of 487
4) More connected solutions for aircraft (real time data / predictive technologies) to optimize routes 5) New, advanced structures and materials that reduce aircraft weightfor greater fuel efficiency There will be strong competition among companies to develop and roll out new, workable technologies and/or designs that support the aviationindustry’s sustainability goals. Companies will seek to be first to market with new technologies. P&W's introduction of the next generation GTF engine architecture in 2016 isa prime example. Companies that are able to innovate quicker and more cost-efficiently will gain competitive advantage and market share. Many of the new technologieswill benefit from support and funding from governmental agencies and customers. There is a risk if funding and support are not provided at appropriate levels. Additionaltypes of risk include: 1) Potential decrease in demand for previously certified RTX aircraft engines / aircraft products due to competing technologies, or requirements thatRTX's engines be retrofitted or upgraded 2) Future engine CO2 or fuel efficiency rules can introduce additional market dynamics 3) Change in climate regulation andairworthiness requirements may lead to the obsolesce of components or equipment resulting in reduced aftermarket sales, coupled with new equipment sales opportunities4) Future climate related taxes such as carbon border adjustment mechanisms may impact the economics of fleet renewal
Time horizonMedium-term
LikelihoodVery likely
Magnitude of impactMedium-high
Are you able to provide a potential financial impact figure?No, we do not have this figure
Potential financial impact figure (currency)<Not Applicable>
Potential financial impact figure – minimum (currency)<Not Applicable>
Potential financial impact figure – maximum (currency)<Not Applicable>
Explanation of financial impact figureThe potential financial impact of transitioning to lower emissions technology cannot be reasonably estimated due to many uncontrollable variables. Raytheon Technologieshas 2 businesses with significant focus on the commercial aviation market: Pratt & Whitney, and Collins Aerospace. Their 2020 adjusted revenues were $17.2 billion, and$19.4 billion respectively, with revenues significantly lower than 2019 primarily due to the economic environment principally driven by the COVID-19 pandemic. Jet enginesand aircraft components produced by Raytheon Technologies are used by customers around the world.
Cost of response to risk
Description of response and explanation of cost calculationWe are unable to reasonably estimate the cost of responding to this risk due to too many variables such as technology advancements, R&D funding, customerrequirements, regulatory landscape, market competitors, governmental incentives for new technologies, etc. Case Studies: Two of the key strategies RaytheonTechnologies uses to respond to this potential risk are disciplined investment in advanced technologies, and partnerships with governmental agencies, customers,universities, and industry groups. In 2020, RTX spent $6.7 B in Research and Development. A large share of that budget was for innovative technologies supportingcommercial aviation. Of this investment, $2.6 B was company-funded R&D expense and $4.1 B was customer- funded R&D. A second important strategy RaytheonTechnologies utilizes to respond to this risk is the continual engagement with our customers, trade associations, regulating bodies, and other organizations to identifycustomer needs, monitor technology developments, and integrate this information into our business strategies. See C12.3 for a description of some of the key associationsand organizations we engage with.
Comment
C2.4
(C2.4) Have you identified any climate-related opportunities with the potential to have a substantive financial or strategic impact on your business?Yes
C2.4a
(C2.4a) Provide details of opportunities identified with the potential to have a substantive financial or strategic impact on your business.
IdentifierOpp1
Where in the value chain does the opportunity occur?Downstream
Opportunity typeProducts and services
Primary climate-related opportunity driverDevelopment and/or expansion of low emission goods and services
Primary potential financial impactIncreased revenues resulting from increased demand for products and services
Company-specific descriptionClimate change and the aviation industry’s aggressive GHG goals are driving the industry to innovate. RTX is well positioned to be a leader in sustainable aviationtechnologies and capture new business opportunities including: 1) more fuel-efficient engines, 2) hybrid electric propulsion systems, 3) use of sustainable aviation fuels, 4)hydrogen-powered engines, 5) connectivity applications creating more use of real time data and predictive technologies to optimize flight routes, and 5) new, advancedstructures and materials that reduce aircraft weight for greater fuel efficiency. Other potential new product offerings are upgrade kits, SAF conversion packages, carbonoffsetting services, and mission optimized control software. We’ve already seen examples of these opportunities by the sales of the Geared Turbofan (GTF) engine, whichdelivers 16% lower fuel consumption and carbon emissions compared to previous-generation engines. Hybrid electric technologies hold great promise to deliver the fuel
CDP Page of 488
economy needed for the next large commercial engine program. We are aiming to increase the fuel efficiency of gas turbine engines by feeding them supplemental powerfrom electric motors and operating both in smart, optimized combinations through different parts of the flight envelope. Fully hybrid electric engine aircraft are beingexamined for short-range aircraft, helicopter, and single aisle applications. SAFs have a critical role in meeting our industry’s GHG reduction goals. All of our currentengines accept certified SAFs and are used in commercial service daily. We have been testing SAFs at up to 100% for more than 15 years and supporting the developmentof global certification standards. Limited production of SAF remains a concern. Beyond propulsion, aircraft system benefits are delivered by Collins Aerospace, whichdevelops a full portfolio of equipment, products and solutions that enable customers to reduce GHG emissions on their products. Examples include fuel gaugingtechnologies that enable the use of a large variety of SAFs, electrically driven cabin air compression that reduces engine bleed requirements and thus improves engineefficiency, lower weight components throughout the aircraft that improve fuel economy, compact, electromechanical actuators (EMA) enabling more efficient wing design,and advanced structures such as thermoplastics and composites. The demand for these types of products is likely to increase with climate change.
Time horizonMedium-term
LikelihoodVirtually certain
Magnitude of impactMedium-high
Are you able to provide a potential financial impact figure?No, we do not have this figure
Potential financial impact figure (currency)<Not Applicable>
Potential financial impact figure – minimum (currency)<Not Applicable>
Potential financial impact figure – maximum (currency)<Not Applicable>
Explanation of financial impact figureIt is not yet possible to assess the potential financial opportunities created by climate change and the transition to a sustainable aviation industry due to too many unknownparameters such as speed of technology developments, level of R&D funding and governmental support, regulatory schemes, market competition, customer demand, etc.Raytheon Technologies has 2 businesses with significant focus on the commercial aviation market: Pratt & Whitney, and Collins Aerospace. Their 2020 adjusted revenueswere $17.2 billion, and $19.4 billion respectively, with revenues significantly lower than 2019 primarily due to the economic environment principally driven by the COVID-19pandemic. Jet engines and aircraft components produced by Raytheon Technologies are used by customers around the world.
Cost to realize opportunity
Strategy to realize opportunity and explanation of cost calculationWe are unable to reasonably estimate the cost of realizing this opportunity due to too many variables such as speed of technology advancements, R&D funding levels,customer requirements, regulatory landscape, market competitors, governmental incentives for new technologies, etc. Case Studies: A key strategy RaytheonTechnologies is pursuing to realize these opportunities is disciplined investment in advanced technologies. In 2020, Raytheon Technologies spent $6.7 B in Research andDevelopment. A large share of that budget was for innovative technologies supporting commercial aviation. Of this investment, $2.6 B was company-funded R&D expenseand $4.1 B was customer-funded R&D. The company has "Technology Roadmaps" for technologies that are deemed high priority for the company and its customers orhave been identified as important to multiple Businesses over multiple product platforms. These roadmaps identify key steps needed to advance technological knowledgein these areas. The roadmaps also help prioritize R&D investment. The company's R&D funding utilizes a defined, gated review process to determine which technologiesget funding and at what level. Another example of what the company is doing to realize these potential opportunities is collaborating with other stakeholders to investigatekey technologies. In one recent example: Pratt & Whitney was awarded a contract from NASA to collaborate with Penn State University, Georgia Tech and HowardUniversity on the design of a gas turbine engine that could power hybrid electric single-aisle, medium- and short-haul aircraft. Another key strategy is to actively engage withour customers, trade associations, universities, and other organizations to identify and understand future needs, requirements, and opportunities. See C12.3 for adescription of the numerous associations and organizations Raytheon Technologies is engaged with on climate-related topics.
CommentPratt & Whitney is the manufacturer of one of the world’s most fuel-efficient jet engines, is committed to helping reduce the impact of air travel on climate change byproviding customers with the most environmentally responsible products and services. To do this, we target sustainable innovation across our value chain. Since enteringinto service in early 2016, the GTF engine family has delivered on its promise to reduce fuel burn by 16% and to significantly reduce regulated emissions and noisefootprint. Since that time, customers have saved an estimated 500 million gallons of fuel worth approximately $1 billion and avoided 5 million metric tons of carbon dioxideemissions, which is equivalent to the energy use of approximately 602,000 homes in the U.S. for 1 year. Pratt & Whitney has industry-leading expertise in the evaluationand approval of sustainable aviation fuels (SAF) through its participation in International committees. More than 300,000 commercial flights have used SAF blends through2020. Today, all its jet engine types can operate efficiently with these approved SAF blends. Collins Aerospace is a leader in technologically advanced and intelligentsolutions for the global aerospace and defense industry. They innovate for - and with – their customers to drive more sustainable solutions that solve unique businesschallenges and pave a better path for the industry and our planet. Collins Aerospace is amplifying and accelerating its efforts to drive more sustainable solutions and createmore environmentally responsible technologies. Four focus areas are: 1) Connected Ecosystem – Developing a range of technologies that use advanced data, analyticsand artificial intelligence to improve flight efficiency and enable fuel savings. 2) Alternative Power Sources – Investing in breakthrough technologies that help reduce fuelburn and the resulting emissions through a more electric aircraft and hybrid-electric propulsion. 3) Advanced Structures - Working to reduce aircraft weight for greater fuelefficiency through forward-thinking design and employment of more environmentally responsible materials in aircraft components. 4) Integrated Solutions – Taking a holisticand systems perspective of the aircraft to find new opportunities to design for sustainability that simplify systems, eliminate parts, reduce weight, improve efficiency andincrease reliability.
IdentifierOpp2
Where in the value chain does the opportunity occur?Downstream
Opportunity typeProducts and services
Primary climate-related opportunity driverDevelopment of climate adaptation, resilience and insurance risk solutions
Primary potential financial impactIncreased revenues resulting from increased demand for products and services
CDP Page of 489
Company-specific descriptionPhysical impacts of climate change (e.g., hurricanes, tornadoes, severe storms, rising sea level, rising temperatures, etc.) may present potential business opportunities forboth existing and new Raytheon Technologies products and services as a result of increased demand for climate-adaptation solutions. The company has several types ofproducts and services related to weather and climate instrumentation and analysis that are likely to increase in demand including: 1) EVI-5 GLIMR (Geosynchronous LittoralImaging and Monitoring Radiometer): A new NASA mission utilizes this instrument which is designed to closely monitor the health of our oceans and assess risks forcoastal communities to protect both our environment and our economy. It will provide unique observations of ocean biology, chemistry, and ecology in the Gulf of Mexico,portions of the southeast U.S. coastline, and the Amazon River plume (where it enters the Atlantic). 2) MODIS (Moderate Resolution Imaging Spectroradiometer): Thissystem is flying on NASA Earth Observation System (EOS) satellites Aqua and Terra, and helps scientists determine the amount of water vapor in a column of theatmosphere and the vertical distribution of temperature and water vapor—measurements crucial to understanding Earth's climate system. 3) VIIRS (Visible Infrared ImagingRadiometer Suite): Part of the Joint Polar Satellite System (JPSS) for NASA and NOAA. Using VIIRS data, scientists can measure cloud and atmospheric particleproperties, ocean color, sea and land surface temperature, ice motion and temperature, fires, and the amount of sunlight reflected from the Earth's surface. There are twoVIIRS on orbit with three additional VIIRS on order for continuity of observations. 4) TWICC (Theatre Weather Imagery and Cloud Characterization): TWICC is being builtfor the U.S. Space Force to replace the aging DoD Meteorological Satellite Program satellites. It will provide critical environmental sensing to the warfighting community andshared continuity of observations to NASA and NOAA.
Time horizonShort-term
LikelihoodVery likely
Magnitude of impactMedium
Are you able to provide a potential financial impact figure?No, we do not have this figure
Potential financial impact figure (currency)<Not Applicable>
Potential financial impact figure – minimum (currency)<Not Applicable>
Potential financial impact figure – maximum (currency)<Not Applicable>
Explanation of financial impact figureIt is not yet possible to assess the potential financial impacts of this opportunities due to too many unknown parameters such as customer demand and expectations, levelof R&D funding, market competition, etc. Raytheon Technologies has several different products, services, and expertise that may increase in demand due to climatechange and as the need increases for improved data and analysis relating to climate data and weather forecasting. This is likely to lead to additional revenues. In addition, itis likely new programs will be developed by current and new customers. The potential financial impact (revenue) figure could be in the billions over the 10 -year period or so.There are current NASA and NOAA weather-related programs of this financial size.
Cost to realize opportunity
Strategy to realize opportunity and explanation of cost calculationWe are unable to reasonably estimate the cost of realizing this opportunity due to too many variables and unknowns such as customer requirements, technologyadvancements, market competitors, etc. Raytheon Technologies plans to continue investing research and development dollars to maintain its leadership in the science ofthis area. The company actively manages and maintains existing products and services and is continually looking for new ways and new markets in which to deploy them.We also evaluate methods to enhance the products to meet new customer demands. Case Study: A key strategy Raytheon Technologies is pursing to realize this potentialopportunity is to engage and dialogue with our customers, governmental agencies, trade associations, military experts, universities, and think tank organizations onpotential future needs and requirements of existing and future customers. Another strategy we pursue is to invest in research and development to continue to lead in thescience in this field. That is a discriminating factor that is important to continue our leadership position in this area.
Comment
IdentifierOpp3
Where in the value chain does the opportunity occur?Direct operations
Opportunity typeResource efficiency
Primary climate-related opportunity driverMove to more efficient buildings
Primary potential financial impactReduced indirect (operating) costs
Company-specific descriptionIncreased resource efficiency is a potential climate-related opportunity which would reduce the company’s utility costs, reduce operating costs and make it morecompetitive. Many new innovative building and manufacturing processes and equipment are being developed as a result of the focus on climate change. As the companyseeks to minimize the financial impact of future energy and climate regulations, we are aggressively pursuing energy and GHG reduction measures. Many of these projectsare energy conservation and energy efficiency projects, which ultimately lowers our energy bill and makes the company more resource efficient. These projects includeimplementing building upgrades, enhancing maintenance activities, installing energy efficient equipment and control systems, and installing onsite solar projects. One ofRaytheon Technologies 2025 Sustainability goals is to implement energy best management practices at over 200 facilities in order to increase the energy efficiency of itsbuildings and reduce costs.
Time horizonShort-term
LikelihoodVirtually certain
Magnitude of impactLow
CDP Page of 4810
Are you able to provide a potential financial impact figure?Yes, a single figure estimate
Potential financial impact figure (currency)6900000
Potential financial impact figure – minimum (currency)<Not Applicable>
Potential financial impact figure – maximum (currency)<Not Applicable>
Explanation of financial impact figureThe $6.9M / year financial impact number represents an estimate of potential energy savings as a result of our continued investment in energy efficient and GHG emissionsreduction projects. The estimate is based on a historical average project savings to reduce a metric ton of CO2. The average unit savings was derived from a largeenergy/GHG project database spanning from 2006 – 2019. We multiplied the average unit savings by the total metric ton reduction needed to achieve the company’s GHGgoal between the 2019 – 2025 period, and then divided it by 6 to derive the annual savings.
Cost to realize opportunity11600000
Strategy to realize opportunity and explanation of cost calculationThe $11.6 M / year cost represents an estimate of potential costs associated with our continued investment in energy efficiency and GHG emissions reduction projects.The estimate is based on a historical average project cost to reduce a metric ton of CO2. The average unit cost was derived from a large energy/GHG project databasespanning from 2006 – 2019. We multiplied the average unit cost by the total metric ton reduction needed to achieve the company’s GHG goal between the 2019 – 2025period, and then divided it by 6 to derive an annual cost. Increasing energy efficiency at our facilities will require capital and operating expenses. The costs are dependenton the size, type and number of energy projects that are implemented. Many of the less expensive projects, and those with a short payback period have already beenimplemented at many of our facilities, therefore investment cost may rise over time. However, this may be offset by increased costs of energy, resulting in higher savingsfrom the investment. Case Studies: We address the risks in order to realize this opportunity in several different ways: 1) Our sites conduct periodic energy audits. Auditteams are comprised of in-house energy efficiency experts and/ or outside contractors. The audits are required by our Corporate Energy and Greenhouse GasManagement Policy. Projects and recommendations identified by the audits are then considered for funding and implementation. 2) We set a long-term goal to reduce GHGemissions by 10% by 2025. Each Business Unit has the same goal. The goal helps drive sites to continually identify, assess, and implement energy projects. 3) Thecompany also has a formal sustainability goal to implement 11 energy/GHG best management practices at most sites by the end of 2025. These BMPs include establishingan energy/GHG team, identifying significant users, creating a plan to upgrade lighting to LED where practical, evaluating automated building management systems, andexamining building systems such as HVAC, boilers, insulation, and compressed air. 4) We also are an active member of the U.S. EPA ENERGY STAR program and havewon the Partner of the Year Sustained Excellence Award for 14 consecutive years. Our participation in the program has helped us enhance our energy program throughvarious ENERGY STAR tools, campaigns and guidelines, as well as the ability to leverage best practices from other member companies at conferences and workshops.
Comment
C3. Business Strategy
C3.1
(C3.1) Have climate-related risks and opportunities influenced your organization’s strategy and/or financial planning?Yes
C3.1b
(C3.1b) Does your organization intend to publish a low-carbon transition plan in the next two years?
Intention topublish a low-carbontransition plan
Intention to include thetransition plan as ascheduled resolutionitem at Annual GeneralMeetings (AGMs)
Comment
Row1
No, we do notintend to publisha low-carbontransition plan inthe next twoyears
<Not Applicable> Raytheon Technologies supports the aviation industry's goal to reduce aviation greenhouse gas emissions by 50% by 2050, relative to 2005 levels. We areactively working on technologies and processes to support this target. In addition, we continue to pursue decarbonization strategies to reduce GHG emissionsfrom our own facilities and to develop plans and strategies to do so. The 2 main strategies we are using are reducing our energy consumption and switching torenewable electricity where feasible. We do not believe we will be ready to publish a low-carbon transition plan within the next 2 years that meets therequirements laid out by CDP's guidance document.
C3.2
(C3.2) Does your organization use climate-related scenario analysis to inform its strategy?Yes, qualitative and quantitative
C3.2a
CDP Page of 4811
(C3.2a) Provide details of your organization’s use of climate-related scenario analysis.
Climate-relatedscenariosand modelsapplied
Details
Other,pleasespecify(InternationalEnergyAgency (IEA)StatedPoliciesScenario(STEPS),IEASustainableDevelopmentScenario(SDS), IEANet ZeroEmissions by2050 case(NZE2050))
Raytheon Technologies (RTX) selected these scenarios to examine current state, one that aligns with the Paris Agreement target, and one that aligns with a 1.5 degree C outcome. We chose IEAscenarios since we had used them previously and selected the 3 since they were all very recent and up to date. Inputs, assumptions & methods - The inputs and assumptions to the scenario arethose outlined in the scenarios. We included applicable global energy transformation drivers from IEA’s Net Zero by 2050 roadmap. In addition, RTX included in its analysis a number of relevantclimate related drivers specific to the company’s commercial aviation businesses. The potential impacts to RTX operations, suppliers and customers were examined for each of the scenario elements.Potential impacts were assessed as being low, medium or high. Time Horizons: 2030, 2040, and 2050. We included 3 time horizons to help understand impacts over time. 10- and 20- year horizonsalign with our medium and long term business horizons. 2050 was included since it is the key target date referenced in the Paris Agreement. Areas of the organization: We included all of RTX globallyin the analysis but focused more on our commercial aviation businesses. Summary of results: Scenario elements in the transport and industry sectors have the highest potential impact to thecompany. Of the 3 scenarios, the NZE2050 has the greatest potential impact. Three key policy drivers with potential high impacts are: 1) Level of aircraft travel – Policies that depress the demand orlimit aircraft travel, such as regulations, shift travel to other modes of transportation, or from environmental concerns from consumers. A reduction in aircraft travel would potentially negatively impactRTX, its customers, and suppliers. 2) Sustainable Aviation Fuel (SAF) – Policies that increase the supply and use of SAFs. Significantly scaling up the use of SAFs is likely the single largestopportunity to meet the aviation industry’s emission reduction goal but will be a significant challenge. The impact to RTX would likely be very favorable. RTX’s engines are already designed to operateusing SAF. 3) New Technologies – The scenarios assume aviation emissions are reduced but vary as to how that is achieved. One method is through innovative technologies. The drive for newtechnologies could favorably impact RTX if it is able to innovate more quickly and cost efficiently than its competitors. Conversely, it could potentially negatively impact RTX if technology advancesare slower than planned, more costly, or if competitors get to market first. How results have informed our business objectives and strategy: Representatives from RTX’s businesses and strategygroups were involved, and results were shared in the organizations. The analysis provided a valuable survey of current and potential future climate policies and fostered good dialogue on potentialimpacts. The analysis identified many of the same risks and opportunities that had been previously identified through other means (e.g., strategic planning, market analysis, industry associations)and reinforced many of our earlier conclusions. In addition, it aligns with many of the findings set forth in ATAG’s recent Waypoint 2050 report (September 2020) where they assessed 3 climatescenarios. Case study on how results have directly influenced your business objectives and strategy: Continued refinement of our Technology Roadmaps for sustainable aviation technologies, andmore investment in next-gen technologies such as electric, hybrid electric, and hydrogen-powered propulsion systems. We have won additional R&D contracts to investigate technologies andcontinue to look for ways to partner with governmental agencies, customers, or other public funding bodies. We are also increasing our work with industry associations to promote the expansion ofSAF and develop a global SAF standard.
C3.3
(C3.3) Describe where and how climate-related risks and opportunities have influenced your strategy.
Have climate-related risksandopportunitiesinfluencedyour strategyin this area?
Description of influence
Productsandservices
Yes Climate related risks and opportunities related to our products/services (see C2.3a Risk 3, and C2.4a Opportunity 1) have influenced our product-related strategies. This is particularlyevident in commercial aviation where climate change is driving innovation. This has led RTX to focus on many new technologies and processes. Examples include: 1) continuedimproved engine efficiency, 2) development of hybrid electric propulsion systems that can assist gas-powered engines, 3) engines that can burn cleaner alternative fuels such assustainable aviation fuels (including 100% SAF) and hydrogen, 4) pursuing connectivity applications creating more connected solutions for aircraft that use real time data and predictivetechnologies to optimize flight routes and use less fuel, and 5) new, advanced structures and materials that will reduce aircraft weight for greater fuel efficiency, including compositematerials. Time horizon: Near, medium, & long-term Case studies of substantial strategic decisions: 1) P&W is pursuing further fuel efficiency enhancements to the GTF engine. Areasbeing worked on include even greater propulsive efficiency derived from the geared architecture and enabling higher gas temperatures in the turbine section to enhance engineefficiency. This will require the use of novel high temperature materials, advanced coatings and cooling strategies. They are also investigating low carbon intensity fuels such ashydrogen and ammonia. 2) Collins Aerospace, as part of a unique, long-term collaboration with Airbus, Emirates Airlines, GE Aviation and Thales, in partnership with the Dubai FutureFoundation, co-created Aviation X Lab to focus on technological innovations in aviation. 3) In 2019, Collins joined 23 other leaders in aerospace, research organizations andassociations across Europe to sign the Joint Declaration of European Aviation Research Stakeholders related to Clean Aviation in the Horizon Europe research and innovation fundingprogram. The program aims to lead the way towards the de-carbonization of aviation by 2050. 4) In 2020, P&W launched a Carbon Offset Service for its business jet customers, the firstservice of its kind offered by an engine maker. The service makes it simple to buy carbon offsets based on the engine’s flight hours. RTX has also enrolled its corporate aircraft in thisprogram to offset its emissions.
Supplychainand/orvaluechain
Yes Suppliers are essential to our business, and to our competitive advantage in the industry. Raytheon Technologies has encountered supply chain disruptions, including logistic suppliers,due to extreme weather events, such as Hurricane Maria in Puerto Rico, forest fires in California, ice storms in Texas, and heat waves. These weather events not only impact ourfacilities, but also those of our suppliers. These weather events have led to delays in receiving parts and materials used at some of our manufacturing facilities, and in a small number ofincidents resulted in having to obtain additional suppliers or maintain extra inventory to mitigate potential future disruptions. More attention is being paid to supplier readiness andresiliency. Raytheon Technologies has a robust supply chain management program. It seeks to ensure that there can be no single point failures in the supply chain by ensuring morethan one supplier for all critical components that are isolated both geographically and geopolitically. Time horizon: Near-term Case study of substantial strategic decision: RaytheonTechnologies published a new Corporate Policy on Business Resilience & Crisis Management in 2020. Risks to suppliers and logistical channels are one of the types of potentialincidents that are explicitly identified in the policy that sites and Businesses must address in their Threat and Vulnerability Assessments and Continuity and Recovery Plans. Sites with ahigher risk scores and/or more supplier dependencies are required to have more robust assessments and recovery plans.
Investmentin R&D
Yes Climate-related risks and opportunities associated with transitioning to lower emission technologies (as reported in C2.3a Risk 3, and C2.4a Opportunity 1) have influenced thecompany’s R&D investment decisions. We are investing more in sustainable aviation technologies. The company has developed Technology Roadmaps (see C2.2) for many differenttechnology areas that have been identified as high priority for the company and our customers. Many relate to technologies that are critical in transitioning to a sustainable aviationindustry, such as hybrid electric propulsion and alternative fuel systems. Some of the technologies RTX is focused on include: 1) continued improved engine performance with better fueleconomy, 2) the development of hybrid electric propulsion systems that can assist gas-powered engines, 3) engines that can burn cleaner alternative fuels such as sustainable aviationfuels and hydrogen, 4) pursuing connectivity applications creating more connected solutions for aircraft that use real time data and predictive technologies to optimize flight routes anduse less fuel, and 5) new, advanced structures and materials that will reduce aircraft weight for greater fuel efficiency, including composite materials. Time horizon: Near-term, medium-term, and long-term Case studies of substantial strategic decisions: 1) Collins Aerospace invested heavily in R&D of hybrid-electric propulsion technologies. They are working to designand test a 1-megawatt motor, motor controller, and battery system–expected to be the aerospace industry’s most power-dense and efficient to date. In 2019, they initiated the buildingof a state-of-the art electric systems lab called the GRID in their Rockford, Illinois facility. In the UK, they are working with the University of Nottingham on a 500-kilowatt motor for HybridAir Vehicles’ Airland hybrid airship. 2) With the support of the French government and local communities, and in collaboration with local industry, Collins Propeller Systems in Figeac,France, invested $32M to create a new development to design the next generation of propeller systems for turboprop engine-powered aircraft. Turboprop engines may be burningsustainable fuels or hydrogen in the future, or these engines may be replaced with electric engines or hybrid systems that us both fuel and electricity at different times.
Operations Yes Climate related risks and opportunities are influencing how we operate our facilities around the world. Raytheon Technologies (RTX) sites are influenced by the potential acute physicalrisks relating to climate change as severe weather events - hurricanes, tornadoes, fires, mudslides, flooding, severe snow / ice storms. (See C2.3 a, Risk 2). This has led to enhancedThreat and Vulnerability Assessments that are conducted at sites and which address physical hazards, as well as Continuity and Recovery planning. This has also led to facilityinvestments to enhance asset management to better survive a severe storm event (e.g., roof and window enhancements in hurricane-prone areas, installation of backup powergenerators). Second, climate change has influenced the company to continue to reduce energy use and become more energy efficient in its buildings and processes in order to reduceenergy costs and potential carbon prices and mitigate the impact of current or potential climate/energy regulation (See C2.4a Opportunity 3). Time horizon: Near-term Case study ofsubstantial strategic decision: In 2020, the company issued 2 long-term sustainability goals influenced by climate change. The first is a goal to reduce GHGs by 10% by 2025 from 2019levels. The majority of our GHG emissions are from energy consumption, so energy reduction is a critical focus area. The second climate related goal is 100% implementation of a set ofenergy/GHG best management practices that the company defined by the end of 2025. Both of these goals will drive energy reductions and improved energy efficiencies.
C3.4
CDP Page of 4812
(C3.4) Describe where and how climate-related risks and opportunities have influenced your financial planning.
Financialplanningelementsthat havebeeninfluenced
Description of influence
Row1
RevenuesCapitalexpenditures
Revenues: Raytheon Technologies (RTX) is working on sustainable aviation technologies and processes to meet customer needs and demands while positioning itself to increase revenues.This includes enhancements to the fuel efficiency of the GTF engine, more connected aircraft systems to optimize flight path and flight efficiency, hybrid electric propulsion systems, on boardmicro grids, next generation propeller systems, Nacelle Enhancement Program (NEP) which reduces aircraft weight, and the development of composite fuel pipes to replace heavier metalcomponents. Time horizon: Near, medium, and long-term Case study of substantial strategic decision: Pratt & Whitney's (P&W's) GTF engine family was specifically designed to be significantlymore fuel efficient than previous engine models, thereby reducing greenhouse gas emissions when using jet fuel. The engine reduces greenhouse gas emissions by 16%. It was first released in2016 and since then its demand has significantly increased. Currently there are more than 960 GTF-powered aircraft that have been delivered, and another 5,000 on order. The GTF enginerepresents approximately 20% of Pratt & Whitney's sales in its large commercial engine business, and those sales are integrated into the company’s financial planning. In 2020, even with theCOVID-19 pandemic and the significant downturn in the aviation sector, the company continued to implement upgrades to the engine due to its strategic importance. Sales of the GTF engine areexpected to grow to about 60% of that market by the end of 2025 due to strong customer demand and the significant gain in fuel efficiency, which will continue to be enhanced. In addition,aftermarket revenues of the GTF are also expected to grow significantly. Capital expenditures: Potential climate related risks and opportunities are also influencing the company's current andplanned capital expenditures in several different ways: 1) Capital expenditures are needed to support the transition to a sustainable aviation industry and deployment of new technologies,systems, and processes. This includes new facilities (see example below) and upgrades to existing facilities. 2) To continue to reduce the greenhouse gas emissions from our facilities, thecompany implements numerous energy reduction and energy efficiency projects each year, many of them needing capital expenditures. Each year EH&S, in coordination with Facilities, developsan EH&S plan that includes funding requirements, including capital projects to meet annual and long-term sustainability goals, including the GHG goal. 3) Capital expenditures are also requiredin some cases to make our facilities more resilient to severe storm events caused by climate change. Facilities that are located in higher risk areas may need to budget more capitalexpenditures as part of their Business Resilience and Crisis Management planning. The company’s property insurer provides a service to assess physical hazard risks to facilities, especiallythose with high asset values, and makes recommendations for mitigation measures. Time horizon: Near-term Case studies of substantial strategic decisions: 1) In 2020, Pratt & Whitneyannounced plans to invest at least $650 million through 2027 in a world-class turbine airfoil production facility in Asheville, North Carolina. Turbine airfoils are a critical component across ourengine portfolio and demand will increase significantly as the market recovers over the next several years. The facility will create airfoils for the fuel efficient GTF engine, among others, which isin significant demand and has more than 5,000 orders in backlog. The new, state-of-the-art, 1,000,000-square-foot facility is being designed and constructed to be LEED (Leadership in Energyand Environmental Design) certified, making it a highly energy efficient facility and minimizing its GHG emissions. The facility enables Pratt & Whitney to continue to modernize and transform itsoperations with cutting-edge technologies, while implementing best-in-class manufacturing technologies and processes exemplifying industry 4.0 manufacturing principles. It will complementexisting turbine airfoil work that is done across other Pratt & Whitney facilities. This investment directly supports Pratt & Whitney's goal to transform its business and strengthen its position byimplementing modern solutions to prepare for the future, while reducing structural costs to emerge from the pandemic stronger. 2) In late 2019, Pratt & Whitney announced that it will open anew ceramic matrix composites (CMCs) research & development facility in Carlsbad, California. With the addition of this dedicated 60,000 square-foot R&D facility, Pratt & Whitney will adddozens of employees focused on the design, development and production of CMCs for aerospace applications. Compared to traditional materials in the hot section of a jet engine, CMCs areknown to be lighter and have higher temperature capability, which can enable improved thermal efficiency for gas turbine engines, and ultimately reduce fuel burn and carbon emissions. CMCswill enhance Pratt & Whitney's next-generation commercial and military engines to deliver benefits that include increased range, increased fuel efficiency and reduced emissions. 3) Energyreduction capital projects completed in 2020 include HVAC replacements at sites in Massachusetts and New Hampshire, several boiler replacements in Rhode Island, Arizona and Canada, andcooling tower upgrades in facilities located in Singapore and France.
C3.4a
(C3.4a) Provide any additional information on how climate-related risks and opportunities have influenced your strategy and financial planning (optional).
No additional information.
C4. Targets and performance
C4.1
(C4.1) Did you have an emissions target that was active in the reporting year?Absolute target
C4.1a
(C4.1a) Provide details of your absolute emissions target(s) and progress made against those targets.
Target reference numberAbs 1
Year target was set2015
Target coverageCompany-wide
Scope(s) (or Scope 3 category)Other, please specify (Scope 1, Scope 2 location based, and Scope 3 Business Travel)
Base year2015
Covered emissions in base year (metric tons CO2e)1932751
Covered emissions in base year as % of total base year emissions in selected Scope(s) (or Scope 3 category)100
Target year2020
CDP Page of 4813
Targeted reduction from base year (%)12
Covered emissions in target year (metric tons CO2e) [auto-calculated]1700820.88
Covered emissions in reporting year (metric tons CO2e)1593681
% of target achieved [auto-calculated]146.194896980177
Target status in reporting yearAchieved
Is this a science-based target?Yes, we consider this a science-based target, but it has not been approved by the Science-Based Targets initiative
Target ambition2°C aligned
Please explain (including target coverage)The 2020 goal covers scopes 1, 2, and scope 3 business travel. Both legacy companies had 2020 GHG reduction goals spanning the timeframe between 2015 - 2020. Thisgoal combines the 2 company goals into 1 Raytheon Technologies goal. There are small differences in methodologies and scopes between the 2 legacy goals. TheRaytheon Technologies rebaselined 2020 goal was a 12% reduction in GHGs from 2015 levels. The company exceeded this goal and cut GHG emissions by 18% by theend of 2020.
Target reference numberAbs 2
Year target was set2020
Target coverageCompany-wide
Scope(s) (or Scope 3 category)Other, please specify (Scope 1, 2 location-based and Scope 3 Business Travel)
Base year2019
Covered emissions in base year (metric tons CO2e)1968303
Covered emissions in base year as % of total base year emissions in selected Scope(s) (or Scope 3 category)100
Target year2025
Targeted reduction from base year (%)10
Covered emissions in target year (metric tons CO2e) [auto-calculated]1771472.7
Covered emissions in reporting year (metric tons CO2e)1593681
% of target achieved [auto-calculated]190.327403860076
Target status in reporting yearNew
Is this a science-based target?Yes, we consider this a science-based target, but it has not been approved by the Science-Based Targets initiative
Target ambition2°C aligned
Please explain (including target coverage)This is a company wide GHG goal and covers scopes 1, 2, and scope 3 business travel (commercial air and employee car rentals). The 2025 goal period is between 2021 -2025, and the company's first reporting year against this new goal will be 2021. The baseline year for the goal would normally be the year prior, 2020, but it was decided notto use that year as the baseline due to the severe impacts of COVID on emissions. Therefore, we selected calendar year 2019 as the baseline year. The company's GHGemissions in 2020 are much lower than normal due to the significant, world-wide effects of the COVID pandemic on the economy and to the aviation industry. 2020emissions are not a representative number. The 2019 baseline will be used as Raytheon Technologies' goal baseline throughout the 2025 goal period.
C4.2
(C4.2) Did you have any other climate-related targets that were active in the reporting year?No other climate-related targets
CDP Page of 4814
C4.3
(C4.3) Did you have emissions reduction initiatives that were active within the reporting year? Note that this can include those in the planning and/orimplementation phases.Yes
C4.3a
(C4.3a) Identify the total number of initiatives at each stage of development, and for those in the implementation stages, the estimated CO2e savings.
Number of initiatives Total estimated annual CO2e savings in metric tonnes CO2e (only for rows marked *)
Under investigation 996 81987
To be implemented* 30 2469
Implementation commenced* 10 823
Implemented* 98 8067
Not to be implemented 332 27329
C4.3b
(C4.3b) Provide details on the initiatives implemented in the reporting year in the table below.
Initiative category & Initiative type
Energy efficiency in buildings Other, please specify (All of the above (e.g., Lighting, HVAC, building energy management systems, motors and drives, insulation, boilers))
Estimated annual CO2e savings (metric tonnes CO2e)8067
Scope(s)Scope 1Scope 2 (location-based)
Voluntary/MandatoryVoluntary
Annual monetary savings (unit currency – as specified in C0.4)1533896
Investment required (unit currency – as specified in C0.4)11868619
Payback period>25 years
Estimated lifetime of the initiative11-15 years
Comment
C4.3c
(C4.3c) What methods do you use to drive investment in emissions reduction activities?
Method Comment
Dedicatedbudget forenergyefficiency
Business unit and site managers develop dedicated budgets to meet their GHG reduction commitments under the formal Raytheon Technologies GHG reduction targets.
Internalfinancemechanisms
Since the majority of Scope 1 and 2 GHG emissions are related to energy use, energy reduction investments drive our GHG reductions. The company examines the costs and benefits of energy andbuilding projects and calculates a Rate on Investment (ROI). This assists in selecting the most cost-effective projects.
Other(GreenhouseGasEmissiongoalsestablishedand tracked)
Raytheon Technologies established formal GHG reduction targets for each business unit. Meeting the annual goals is one of the drivers behind Business unit and site emission reduction investments.
Other (R&Dbudgets andTechnologyRoadmaps)
The company has a large R&D budget. In 2020, Raytheon Technologies spent $6.7 billion in Research and Development. A large share of that budget was for innovative technologies supportingcommercial aviation. Of this investment, $2.6 B was company-funded and $4.1 B was customer-funded. The company has developed Technology Roadmaps (see C2.2) for many differenttechnology areas that have been identified as high priority for the company and our customers. Many relate to technologies that are critical in transitioning to a sustainable aviation industry, such ashybrid electric propulsion and alternative fuel systems. These roadmaps identify key steps needed to advance technological knowledge in these areas. The roadmaps also help prioritize R&Dinvestment. The company's R&D funding utilizes a defined, gated review process to determine which technologies get funding and at what level.
CDP Page of 4815
C4.5
(C4.5) Do you classify any of your existing goods and/or services as low-carbon products or do they enable a third party to avoid GHG emissions?Yes
C4.5a
(C4.5a) Provide details of your products and/or services that you classify as low-carbon products or that enable a third party to avoid GHG emissions.
Level of aggregationProduct
Description of product/Group of productsPratt & Whitney's Geared Turbofan (GTF) engine - Since entering service in 2016, the GTF engine family has made air travel significantly more sustainable. Theserevolutionary engines deliver 16% lower fuel consumption and carbon emissions compared to previous-generation engines. Its novel construction allows the fan and theturbine that drives it to spin at their different optimal speeds, increasing overall efficiency. The GTF offers approximate savings of 100 gallons of fuel per flight hour andreduction in C02 of 1 metric ton per flight hour. GTF engines have already saved airlines 500 million gallons of fuel worth an estimated $1 billion, and 5 million metric tons ofCO2. In addition, the GTF family of engines were designed to be fully capable of using certified Sustainable Aviation Fuel (SAF) products. Fueling aircraft with SAFproducts dramatically reduces greenhouse gas (GHG) emissions. The GTF engines also reduce noise by 75% and reduce nitrogen oxide emissions by 50%. The GTFengine's fan-drive gear system is just one component of this next-generation engine. The Pratt & Whitney GTF engine also incorporates advances in aerodynamics,lightweight materials and other major technology improvements in the high-pressure spool, low-pressure turbine, combustor, controls, engine health monitoring and more.More than 960 GTF-powered aircraft have been delivered, and there is a strong backlog of more than 5,000 orders. Collins Aerospace products/services - CollinsAerospace provides numerous systems and components for aircraft and engines. CO2 emission reductions may be achieved through reduction of weight, energyconsumption and aerodynamic drag as well as improved operational efficiency using connected aircraft solutions and artificial intelligence. Weight-saving example: Since2010, Collins Aerospace has reduced the weight of aircraft seats from 14kg to 10kg per seat for our latest generation of seats. For a 200-seat layout of a single aisle aircraftperforming 1000 flights per year with an average of 4 hours flight length, a rough estimation results in approximate CO2 savings of 350 metric tons per year per aircraft.
Are these low-carbon product(s) or do they enable avoided emissions?Avoided emissions
Taxonomy, project or methodology used to classify product(s) as low-carbon or to calculate avoided emissionsOther, please specify (RTX's engineering calculations applicable to CO2 emission reductions associated with the use of the GTF engine. In addition, RTX utilized weight-emission reduction data provided in the "Destination 2050-A route to net zero European aviation" report.)
% revenue from low carbon product(s) in the reporting year
% of total portfolio value<Not Applicable>
Asset classes/ product types<Not Applicable>
CommentThe company does not publicly report sales revenue from individual products or general product classes. At the May 2021 Raytheon Technologies Investor Day, Pratt &Whitney's President indicated the GTF engine represents a little more than 20% of its sales in the large commercial engine business. It is expected to grow to about 60% inthat area by the end of 2025 due to strong customer demand.
C5. Emissions methodology
C5.1
CDP Page of 4816
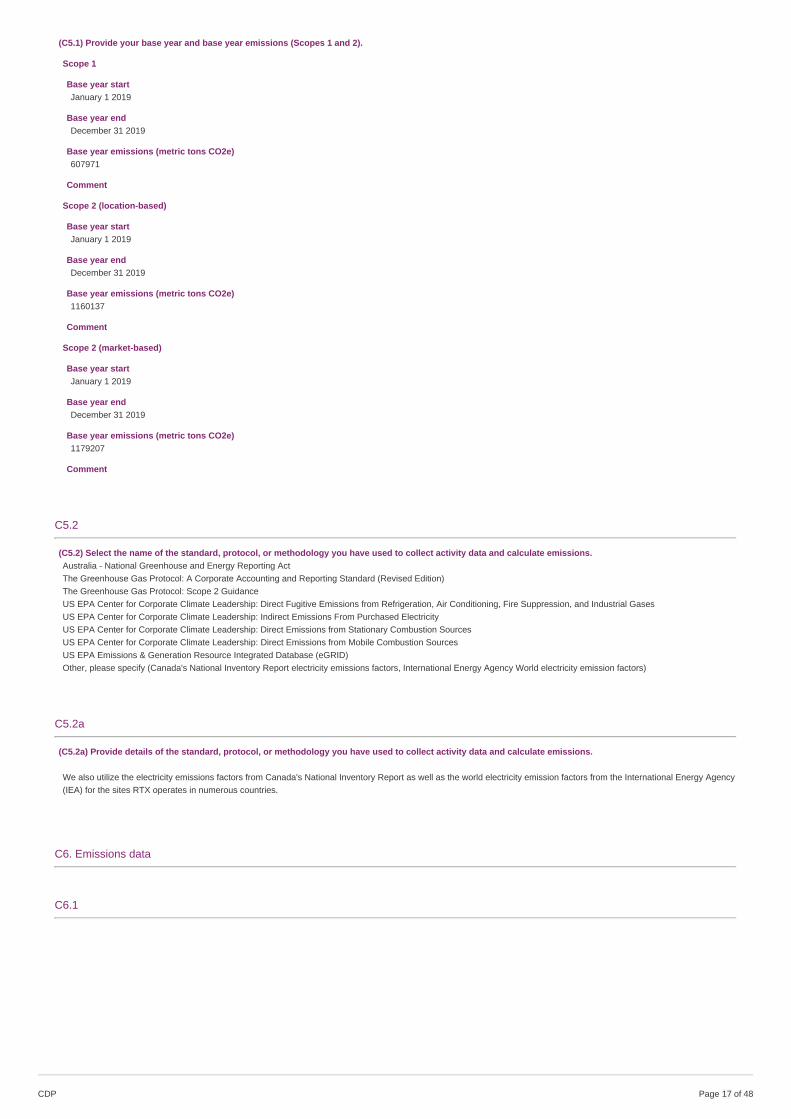
(C5.1) Provide your base year and base year emissions (Scopes 1 and 2).
Scope 1
Base year startJanuary 1 2019
Base year endDecember 31 2019
Base year emissions (metric tons CO2e)607971
Comment
Scope 2 (location-based)
Base year startJanuary 1 2019
Base year endDecember 31 2019
Base year emissions (metric tons CO2e)1160137
Comment
Scope 2 (market-based)
Base year startJanuary 1 2019
Base year endDecember 31 2019
Base year emissions (metric tons CO2e)1179207
Comment
C5.2
(C5.2) Select the name of the standard, protocol, or methodology you have used to collect activity data and calculate emissions.Australia - National Greenhouse and Energy Reporting ActThe Greenhouse Gas Protocol: A Corporate Accounting and Reporting Standard (Revised Edition)The Greenhouse Gas Protocol: Scope 2 GuidanceUS EPA Center for Corporate Climate Leadership: Direct Fugitive Emissions from Refrigeration, Air Conditioning, Fire Suppression, and Industrial GasesUS EPA Center for Corporate Climate Leadership: Indirect Emissions From Purchased ElectricityUS EPA Center for Corporate Climate Leadership: Direct Emissions from Stationary Combustion SourcesUS EPA Center for Corporate Climate Leadership: Direct Emissions from Mobile Combustion SourcesUS EPA Emissions & Generation Resource Integrated Database (eGRID)Other, please specify (Canada's National Inventory Report electricity emissions factors, International Energy Agency World electricity emission factors)
C5.2a
(C5.2a) Provide details of the standard, protocol, or methodology you have used to collect activity data and calculate emissions.
We also utilize the electricity emissions factors from Canada's National Inventory Report as well as the world electricity emission factors from the International Energy Agency(IEA) for the sites RTX operates in numerous countries.
C6. Emissions data
C6.1
CDP Page of 4817
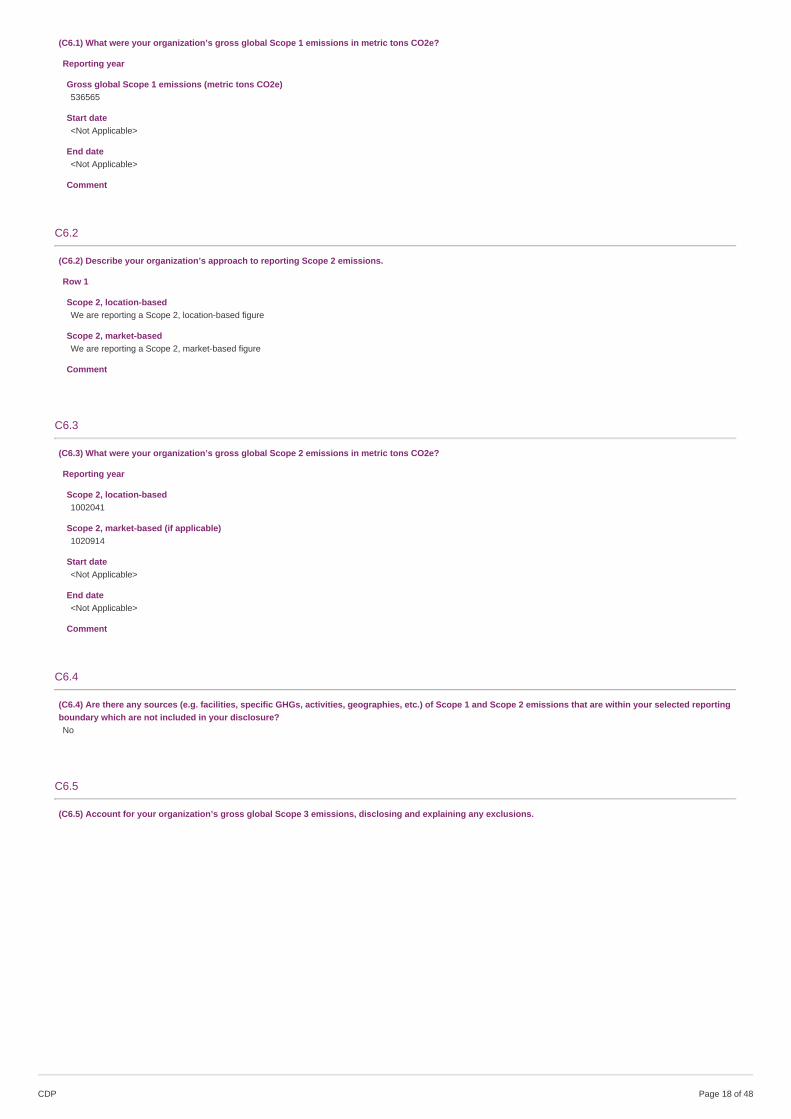
(C6.1) What were your organization’s gross global Scope 1 emissions in metric tons CO2e?
Reporting year
Gross global Scope 1 emissions (metric tons CO2e)536565
Start date<Not Applicable>
End date<Not Applicable>
Comment
C6.2
(C6.2) Describe your organization’s approach to reporting Scope 2 emissions.
Row 1
Scope 2, location-based We are reporting a Scope 2, location-based figure
Scope 2, market-basedWe are reporting a Scope 2, market-based figure
Comment
C6.3
(C6.3) What were your organization’s gross global Scope 2 emissions in metric tons CO2e?
Reporting year
Scope 2, location-based1002041
Scope 2, market-based (if applicable)1020914
Start date<Not Applicable>
End date<Not Applicable>
Comment
C6.4
(C6.4) Are there any sources (e.g. facilities, specific GHGs, activities, geographies, etc.) of Scope 1 and Scope 2 emissions that are within your selected reportingboundary which are not included in your disclosure?No
C6.5
(C6.5) Account for your organization’s gross global Scope 3 emissions, disclosing and explaining any exclusions.
CDP Page of 4818
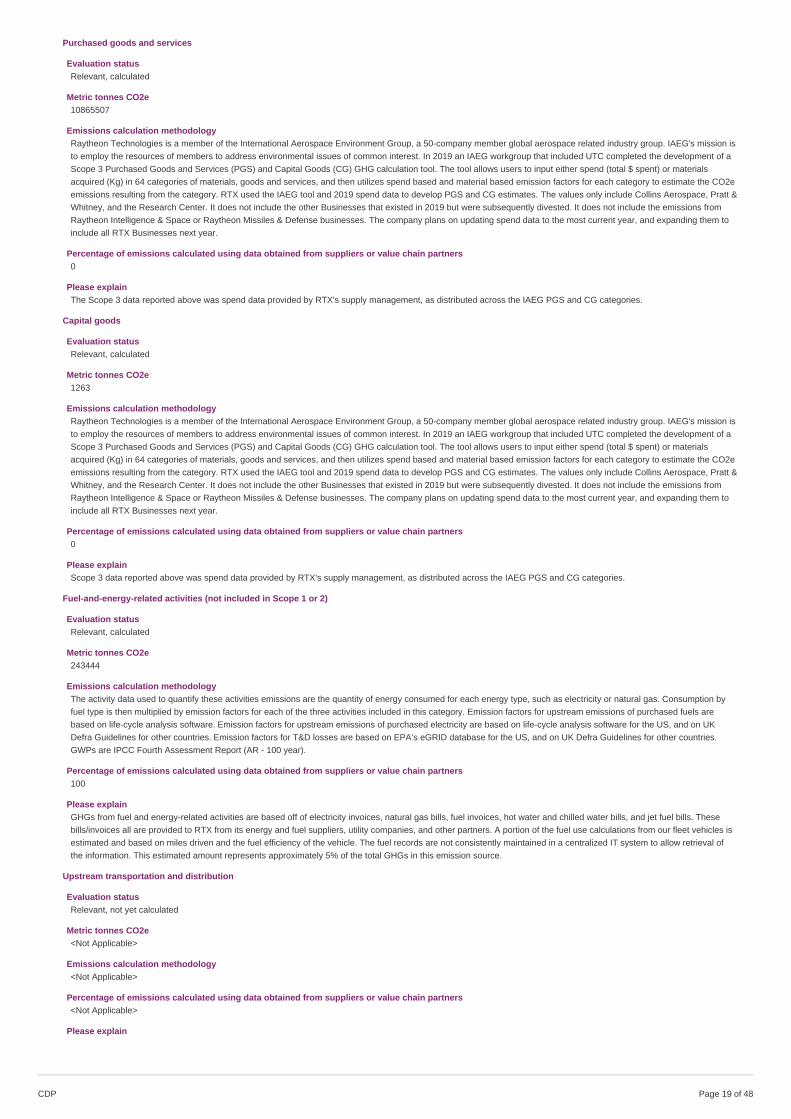
Purchased goods and services
Evaluation statusRelevant, calculated
Metric tonnes CO2e10865507
Emissions calculation methodologyRaytheon Technologies is a member of the International Aerospace Environment Group, a 50-company member global aerospace related industry group. IAEG's mission isto employ the resources of members to address environmental issues of common interest. In 2019 an IAEG workgroup that included UTC completed the development of aScope 3 Purchased Goods and Services (PGS) and Capital Goods (CG) GHG calculation tool. The tool allows users to input either spend (total $ spent) or materialsacquired (Kg) in 64 categories of materials, goods and services, and then utilizes spend based and material based emission factors for each category to estimate the CO2eemissions resulting from the category. RTX used the IAEG tool and 2019 spend data to develop PGS and CG estimates. The values only include Collins Aerospace, Pratt &Whitney, and the Research Center. It does not include the other Businesses that existed in 2019 but were subsequently divested. It does not include the emissions fromRaytheon Intelligence & Space or Raytheon Missiles & Defense businesses. The company plans on updating spend data to the most current year, and expanding them toinclude all RTX Businesses next year.
Percentage of emissions calculated using data obtained from suppliers or value chain partners0
Please explainThe Scope 3 data reported above was spend data provided by RTX's supply management, as distributed across the IAEG PGS and CG categories.
Capital goods
Evaluation statusRelevant, calculated
Metric tonnes CO2e1263
Emissions calculation methodologyRaytheon Technologies is a member of the International Aerospace Environment Group, a 50-company member global aerospace related industry group. IAEG's mission isto employ the resources of members to address environmental issues of common interest. In 2019 an IAEG workgroup that included UTC completed the development of aScope 3 Purchased Goods and Services (PGS) and Capital Goods (CG) GHG calculation tool. The tool allows users to input either spend (total $ spent) or materialsacquired (Kg) in 64 categories of materials, goods and services, and then utilizes spend based and material based emission factors for each category to estimate the CO2eemissions resulting from the category. RTX used the IAEG tool and 2019 spend data to develop PGS and CG estimates. The values only include Collins Aerospace, Pratt &Whitney, and the Research Center. It does not include the other Businesses that existed in 2019 but were subsequently divested. It does not include the emissions fromRaytheon Intelligence & Space or Raytheon Missiles & Defense businesses. The company plans on updating spend data to the most current year, and expanding them toinclude all RTX Businesses next year.
Percentage of emissions calculated using data obtained from suppliers or value chain partners0
Please explainScope 3 data reported above was spend data provided by RTX's supply management, as distributed across the IAEG PGS and CG categories.
Fuel-and-energy-related activities (not included in Scope 1 or 2)
Evaluation statusRelevant, calculated
Metric tonnes CO2e243444
Emissions calculation methodologyThe activity data used to quantify these activities emissions are the quantity of energy consumed for each energy type, such as electricity or natural gas. Consumption byfuel type is then multiplied by emission factors for each of the three activities included in this category. Emission factors for upstream emissions of purchased fuels arebased on life-cycle analysis software. Emission factors for upstream emissions of purchased electricity are based on life-cycle analysis software for the US, and on UKDefra Guidelines for other countries. Emission factors for T&D losses are based on EPA’s eGRID database for the US, and on UK Defra Guidelines for other countries.GWPs are IPCC Fourth Assessment Report (AR - 100 year).
Percentage of emissions calculated using data obtained from suppliers or value chain partners100
Please explainGHGs from fuel and energy-related activities are based off of electricity invoices, natural gas bills, fuel invoices, hot water and chilled water bills, and jet fuel bills. Thesebills/invoices all are provided to RTX from its energy and fuel suppliers, utility companies, and other partners. A portion of the fuel use calculations from our fleet vehicles isestimated and based on miles driven and the fuel efficiency of the vehicle. The fuel records are not consistently maintained in a centralized IT system to allow retrieval ofthe information. This estimated amount represents approximately 5% of the total GHGs in this emission source.
Upstream transportation and distribution
Evaluation statusRelevant, not yet calculated
Metric tonnes CO2e<Not Applicable>
Emissions calculation methodology<Not Applicable>
Percentage of emissions calculated using data obtained from suppliers or value chain partners<Not Applicable>
Please explain
CDP Page of 4819
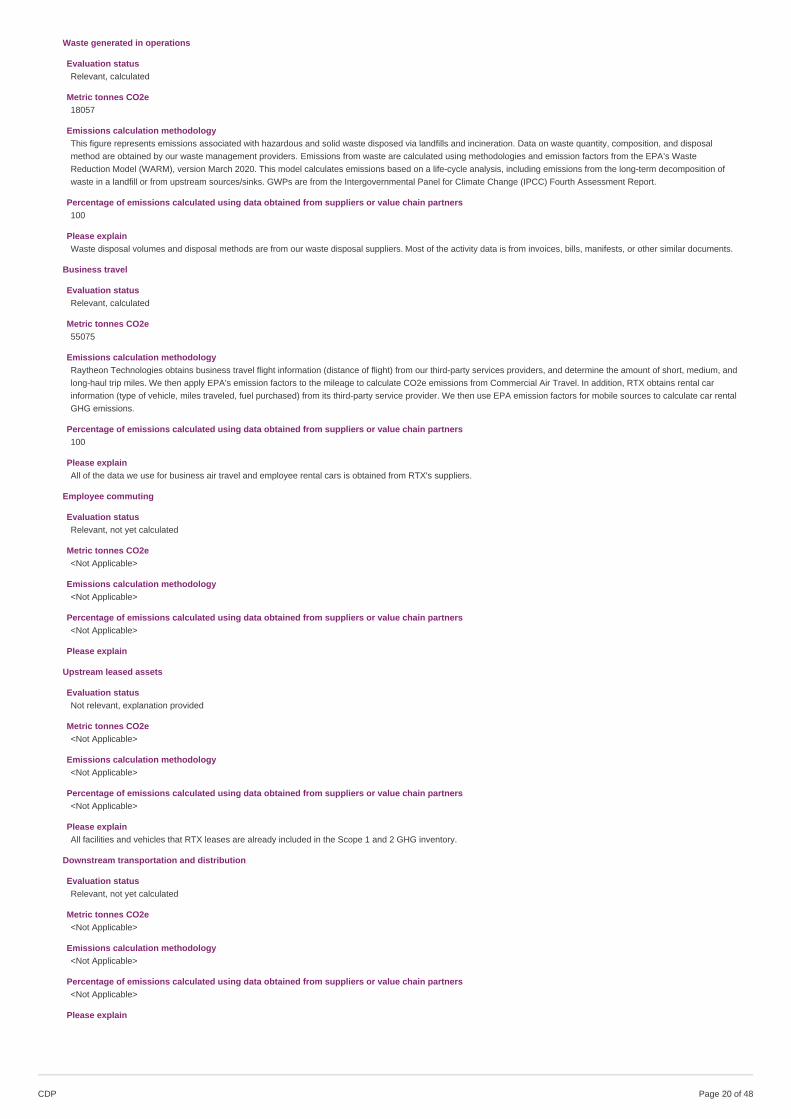
Waste generated in operations
Evaluation statusRelevant, calculated
Metric tonnes CO2e18057
Emissions calculation methodologyThis figure represents emissions associated with hazardous and solid waste disposed via landfills and incineration. Data on waste quantity, composition, and disposalmethod are obtained by our waste management providers. Emissions from waste are calculated using methodologies and emission factors from the EPA’s WasteReduction Model (WARM), version March 2020. This model calculates emissions based on a life-cycle analysis, including emissions from the long-term decomposition ofwaste in a landfill or from upstream sources/sinks. GWPs are from the Intergovernmental Panel for Climate Change (IPCC) Fourth Assessment Report.
Percentage of emissions calculated using data obtained from suppliers or value chain partners100
Please explainWaste disposal volumes and disposal methods are from our waste disposal suppliers. Most of the activity data is from invoices, bills, manifests, or other similar documents.
Business travel
Evaluation statusRelevant, calculated
Metric tonnes CO2e55075
Emissions calculation methodologyRaytheon Technologies obtains business travel flight information (distance of flight) from our third-party services providers, and determine the amount of short, medium, andlong-haul trip miles. We then apply EPA's emission factors to the mileage to calculate CO2e emissions from Commercial Air Travel. In addition, RTX obtains rental carinformation (type of vehicle, miles traveled, fuel purchased) from its third-party service provider. We then use EPA emission factors for mobile sources to calculate car rentalGHG emissions.
Percentage of emissions calculated using data obtained from suppliers or value chain partners100
Please explainAll of the data we use for business air travel and employee rental cars is obtained from RTX's suppliers.
Employee commuting
Evaluation statusRelevant, not yet calculated
Metric tonnes CO2e<Not Applicable>
Emissions calculation methodology<Not Applicable>
Percentage of emissions calculated using data obtained from suppliers or value chain partners<Not Applicable>
Please explain
Upstream leased assets
Evaluation statusNot relevant, explanation provided
Metric tonnes CO2e<Not Applicable>
Emissions calculation methodology<Not Applicable>
Percentage of emissions calculated using data obtained from suppliers or value chain partners<Not Applicable>
Please explainAll facilities and vehicles that RTX leases are already included in the Scope 1 and 2 GHG inventory.
Downstream transportation and distribution
Evaluation statusRelevant, not yet calculated
Metric tonnes CO2e<Not Applicable>
Emissions calculation methodology<Not Applicable>
Percentage of emissions calculated using data obtained from suppliers or value chain partners<Not Applicable>
Please explain
CDP Page of 4820
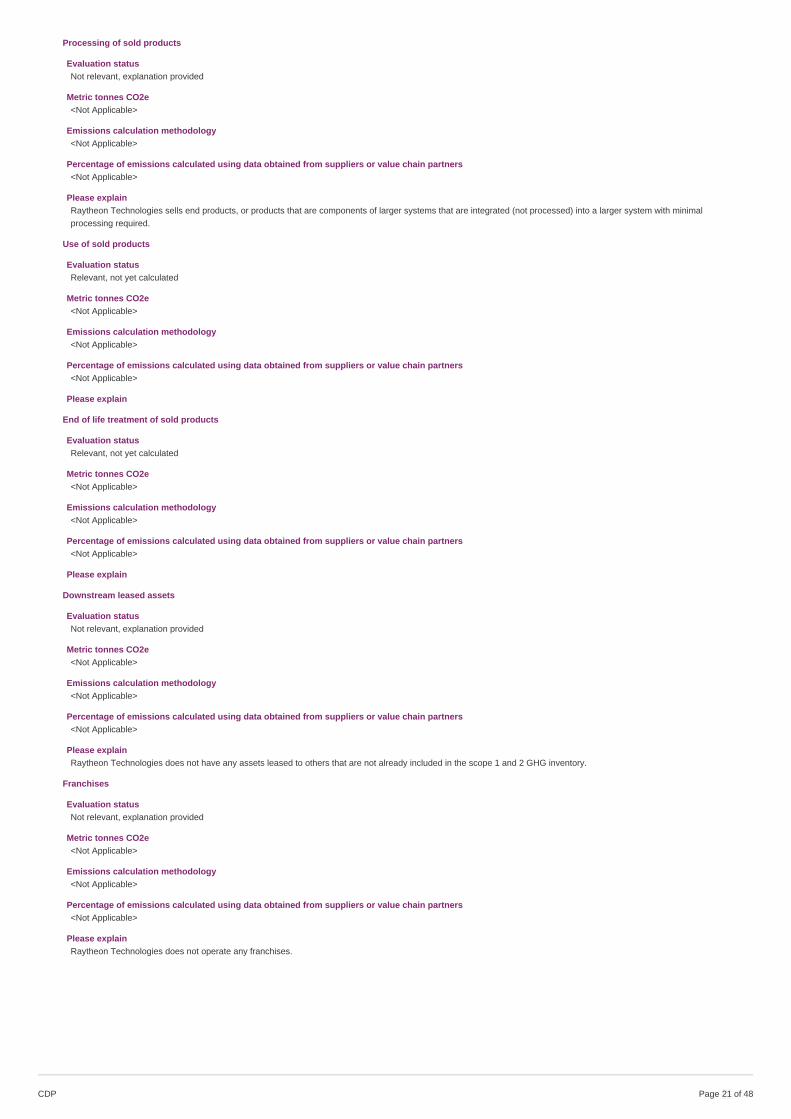
Processing of sold products
Evaluation statusNot relevant, explanation provided
Metric tonnes CO2e<Not Applicable>
Emissions calculation methodology<Not Applicable>
Percentage of emissions calculated using data obtained from suppliers or value chain partners<Not Applicable>
Please explainRaytheon Technologies sells end products, or products that are components of larger systems that are integrated (not processed) into a larger system with minimalprocessing required.
Use of sold products
Evaluation statusRelevant, not yet calculated
Metric tonnes CO2e<Not Applicable>
Emissions calculation methodology<Not Applicable>
Percentage of emissions calculated using data obtained from suppliers or value chain partners<Not Applicable>
Please explain
End of life treatment of sold products
Evaluation statusRelevant, not yet calculated
Metric tonnes CO2e<Not Applicable>
Emissions calculation methodology<Not Applicable>
Percentage of emissions calculated using data obtained from suppliers or value chain partners<Not Applicable>
Please explain
Downstream leased assets
Evaluation statusNot relevant, explanation provided
Metric tonnes CO2e<Not Applicable>
Emissions calculation methodology<Not Applicable>
Percentage of emissions calculated using data obtained from suppliers or value chain partners<Not Applicable>
Please explainRaytheon Technologies does not have any assets leased to others that are not already included in the scope 1 and 2 GHG inventory.
Franchises
Evaluation statusNot relevant, explanation provided
Metric tonnes CO2e<Not Applicable>
Emissions calculation methodology<Not Applicable>
Percentage of emissions calculated using data obtained from suppliers or value chain partners<Not Applicable>
Please explainRaytheon Technologies does not operate any franchises.
CDP Page of 4821
Investments
Evaluation statusNot relevant, explanation provided
Metric tonnes CO2e<Not Applicable>
Emissions calculation methodology<Not Applicable>
Percentage of emissions calculated using data obtained from suppliers or value chain partners<Not Applicable>
Please explainRaytheon Technologies does not hold investments that would present a relevant impact to our Scope 3 emissions.
Other (upstream)
Evaluation statusNot relevant, explanation provided
Metric tonnes CO2e<Not Applicable>
Emissions calculation methodology<Not Applicable>
Percentage of emissions calculated using data obtained from suppliers or value chain partners<Not Applicable>
Please explainNo other upstream emissions.
Other (downstream)
Evaluation statusNot relevant, explanation provided
Metric tonnes CO2e<Not Applicable>
Emissions calculation methodology<Not Applicable>
Percentage of emissions calculated using data obtained from suppliers or value chain partners<Not Applicable>
Please explainNo other downstream emissions.
C-CG6.6
(C-CG6.6) Does your organization assess the life cycle emissions of any of its products or services?
Assessment of life cycle emissions Comment
Row 1 No, and we do not plan to start doing so within the next two years
C6.7
(C6.7) Are carbon dioxide emissions from biogenic carbon relevant to your organization?No
C6.10
CDP Page of 4822
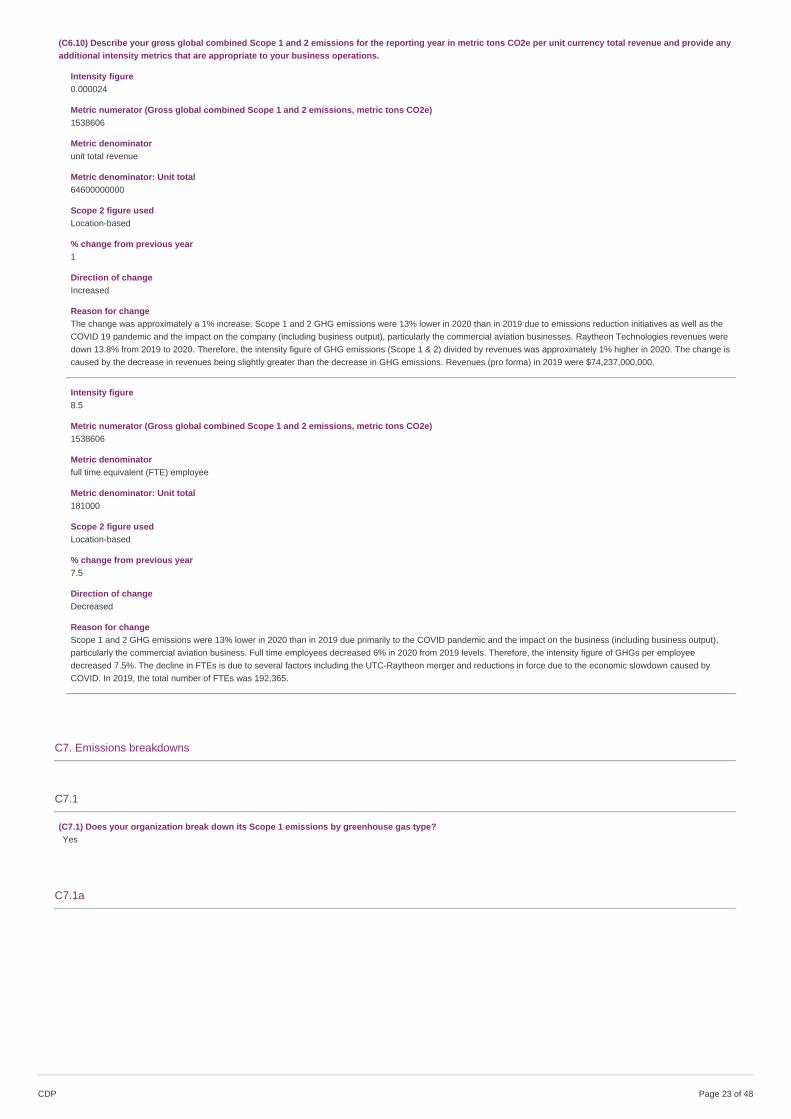
(C6.10) Describe your gross global combined Scope 1 and 2 emissions for the reporting year in metric tons CO2e per unit currency total revenue and provide anyadditional intensity metrics that are appropriate to your business operations.
Intensity figure0.000024
Metric numerator (Gross global combined Scope 1 and 2 emissions, metric tons CO2e)1538606
Metric denominatorunit total revenue
Metric denominator: Unit total64600000000
Scope 2 figure usedLocation-based
% change from previous year1
Direction of changeIncreased
Reason for changeThe change was approximately a 1% increase. Scope 1 and 2 GHG emissions were 13% lower in 2020 than in 2019 due to emissions reduction initiatives as well as theCOVID 19 pandemic and the impact on the company (including business output), particularly the commercial aviation businesses. Raytheon Technologies revenues weredown 13.8% from 2019 to 2020. Therefore, the intensity figure of GHG emissions (Scope 1 & 2) divided by revenues was approximately 1% higher in 2020. The change iscaused by the decrease in revenues being slightly greater than the decrease in GHG emissions. Revenues (pro forma) in 2019 were $74,237,000,000.
Intensity figure8.5
Metric numerator (Gross global combined Scope 1 and 2 emissions, metric tons CO2e)1538606
Metric denominatorfull time equivalent (FTE) employee
Metric denominator: Unit total181000
Scope 2 figure usedLocation-based
% change from previous year7.5
Direction of changeDecreased
Reason for changeScope 1 and 2 GHG emissions were 13% lower in 2020 than in 2019 due primarily to the COVID pandemic and the impact on the business (including business output),particularly the commercial aviation business. Full time employees decreased 6% in 2020 from 2019 levels. Therefore, the intensity figure of GHGs per employeedecreased 7.5%. The decline in FTEs is due to several factors including the UTC-Raytheon merger and reductions in force due to the economic slowdown caused byCOVID. In 2019, the total number of FTEs was 192,365.
C7. Emissions breakdowns
C7.1
(C7.1) Does your organization break down its Scope 1 emissions by greenhouse gas type?Yes
C7.1a
CDP Page of 4823
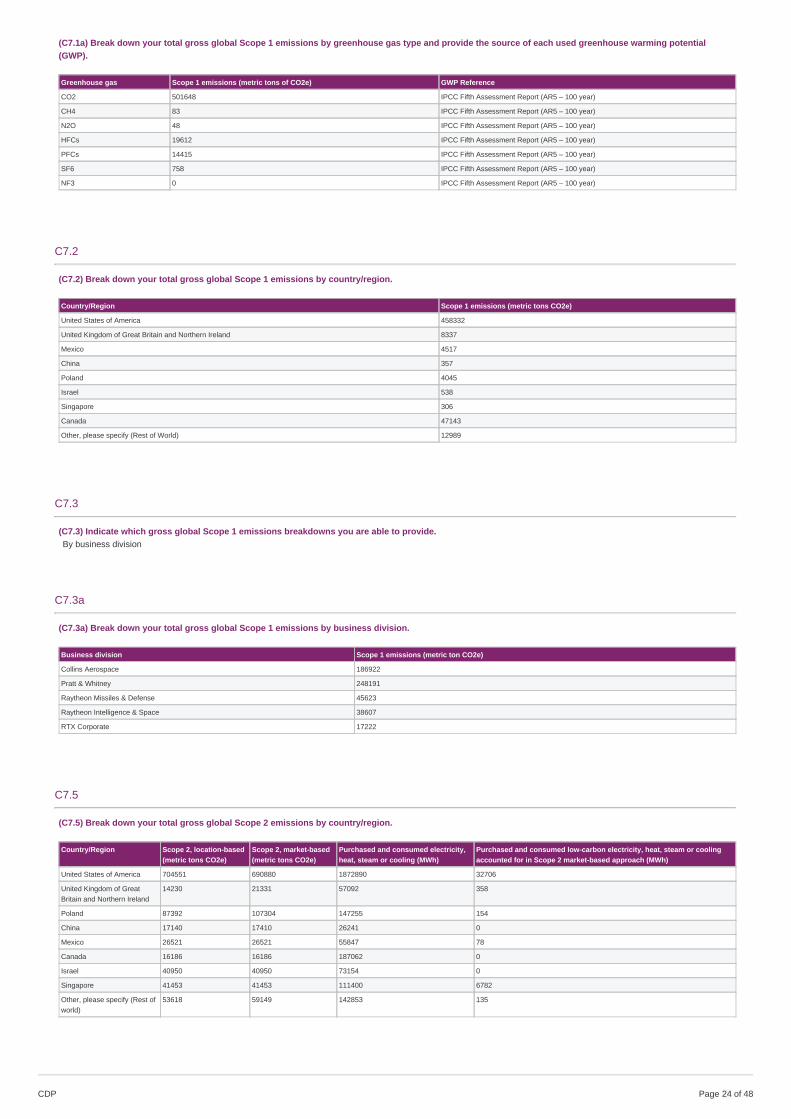
(C7.1a) Break down your total gross global Scope 1 emissions by greenhouse gas type and provide the source of each used greenhouse warming potential(GWP).
Greenhouse gas Scope 1 emissions (metric tons of CO2e) GWP Reference
CO2 501648 IPCC Fifth Assessment Report (AR5 – 100 year)
CH4 83 IPCC Fifth Assessment Report (AR5 – 100 year)
N2O 48 IPCC Fifth Assessment Report (AR5 – 100 year)
HFCs 19612 IPCC Fifth Assessment Report (AR5 – 100 year)
PFCs 14415 IPCC Fifth Assessment Report (AR5 – 100 year)
SF6 758 IPCC Fifth Assessment Report (AR5 – 100 year)
NF3 0 IPCC Fifth Assessment Report (AR5 – 100 year)
C7.2
(C7.2) Break down your total gross global Scope 1 emissions by country/region.
Country/Region Scope 1 emissions (metric tons CO2e)
United States of America 458332
United Kingdom of Great Britain and Northern Ireland 8337
Mexico 4517
China 357
Poland 4045
Israel 538
Singapore 306
Canada 47143
Other, please specify (Rest of World) 12989
C7.3
(C7.3) Indicate which gross global Scope 1 emissions breakdowns you are able to provide.By business division
C7.3a
(C7.3a) Break down your total gross global Scope 1 emissions by business division.
Business division Scope 1 emissions (metric ton CO2e)
Collins Aerospace 186922
Pratt & Whitney 248191
Raytheon Missiles & Defense 45623
Raytheon Intelligence & Space 38607
RTX Corporate 17222
C7.5
(C7.5) Break down your total gross global Scope 2 emissions by country/region.
Country/Region Scope 2, location-based(metric tons CO2e)
Scope 2, market-based(metric tons CO2e)
Purchased and consumed electricity,heat, steam or cooling (MWh)
Purchased and consumed low-carbon electricity, heat, steam or coolingaccounted for in Scope 2 market-based approach (MWh)
United States of America 704551 690880 1872890 32706
United Kingdom of GreatBritain and Northern Ireland
14230 21331 57092 358
Poland 87392 107304 147255 154
China 17140 17410 26241 0
Mexico 26521 26521 55847 78
Canada 16186 16186 187062 0
Israel 40950 40950 73154 0
Singapore 41453 41453 111400 6782
Other, please specify (Rest ofworld)
53618 59149 142853 135
CDP Page of 4824
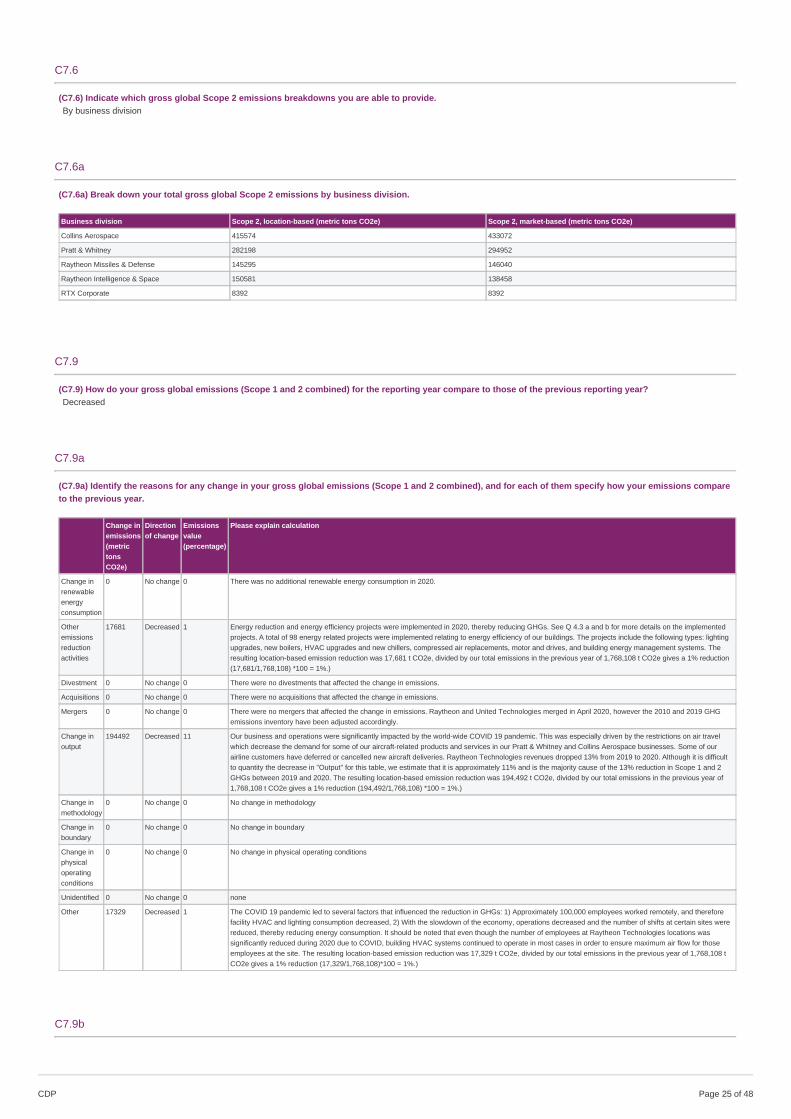
C7.6
(C7.6) Indicate which gross global Scope 2 emissions breakdowns you are able to provide.By business division
C7.6a
(C7.6a) Break down your total gross global Scope 2 emissions by business division.
Business division Scope 2, location-based (metric tons CO2e) Scope 2, market-based (metric tons CO2e)
Collins Aerospace 415574 433072
Pratt & Whitney 282198 294952
Raytheon Missiles & Defense 145295 146040
Raytheon Intelligence & Space 150581 138458
RTX Corporate 8392 8392
C7.9
(C7.9) How do your gross global emissions (Scope 1 and 2 combined) for the reporting year compare to those of the previous reporting year?Decreased
C7.9a
(C7.9a) Identify the reasons for any change in your gross global emissions (Scope 1 and 2 combined), and for each of them specify how your emissions compareto the previous year.
Change inemissions(metrictonsCO2e)
Directionof change
Emissionsvalue(percentage)
Please explain calculation
Change inrenewableenergyconsumption
0 No change 0 There was no additional renewable energy consumption in 2020.
Otheremissionsreductionactivities
17681 Decreased 1 Energy reduction and energy efficiency projects were implemented in 2020, thereby reducing GHGs. See Q 4.3 a and b for more details on the implementedprojects. A total of 98 energy related projects were implemented relating to energy efficiency of our buildings. The projects include the following types: lightingupgrades, new boilers, HVAC upgrades and new chillers, compressed air replacements, motor and drives, and building energy management systems. Theresulting location-based emission reduction was 17,681 t CO2e, divided by our total emissions in the previous year of 1,768,108 t CO2e gives a 1% reduction(17,681/1,768,108) *100 = 1%.)
Divestment 0 No change 0 There were no divestments that affected the change in emissions.
Acquisitions 0 No change 0 There were no acquisitions that affected the change in emissions.
Mergers 0 No change 0 There were no mergers that affected the change in emissions. Raytheon and United Technologies merged in April 2020, however the 2010 and 2019 GHGemissions inventory have been adjusted accordingly.
Change inoutput
194492 Decreased 11 Our business and operations were significantly impacted by the world-wide COVID 19 pandemic. This was especially driven by the restrictions on air travelwhich decrease the demand for some of our aircraft-related products and services in our Pratt & Whitney and Collins Aerospace businesses. Some of ourairline customers have deferred or cancelled new aircraft deliveries. Raytheon Technologies revenues dropped 13% from 2019 to 2020. Although it is difficultto quantity the decrease in "Output" for this table, we estimate that it is approximately 11% and is the majority cause of the 13% reduction in Scope 1 and 2GHGs between 2019 and 2020. The resulting location-based emission reduction was 194,492 t CO2e, divided by our total emissions in the previous year of1,768,108 t CO2e gives a 1% reduction (194,492/1,768,108) *100 = 1%.)
Change inmethodology
0 No change 0 No change in methodology
Change inboundary
0 No change 0 No change in boundary
Change inphysicaloperatingconditions
0 No change 0 No change in physical operating conditions
Unidentified 0 No change 0 none
Other 17329 Decreased 1 The COVID 19 pandemic led to several factors that influenced the reduction in GHGs: 1) Approximately 100,000 employees worked remotely, and thereforefacility HVAC and lighting consumption decreased, 2) With the slowdown of the economy, operations decreased and the number of shifts at certain sites werereduced, thereby reducing energy consumption. It should be noted that even though the number of employees at Raytheon Technologies locations wassignificantly reduced during 2020 due to COVID, building HVAC systems continued to operate in most cases in order to ensure maximum air flow for thoseemployees at the site. The resulting location-based emission reduction was 17,329 t CO2e, divided by our total emissions in the previous year of 1,768,108 tCO2e gives a 1% reduction (17,329/1,768,108)*100 = 1%.)
C7.9b
CDP Page of 4825

(C7.9b) Are your emissions performance calculations in C7.9 and C7.9a based on a location-based Scope 2 emissions figure or a market-based Scope 2emissions figure?Location-based
C-CG7.10
(C-CG7.10) How do your total Scope 3 emissions for the reporting year compare to those of the previous reporting year?Decreased
C-CG7.10a
CDP Page of 4826
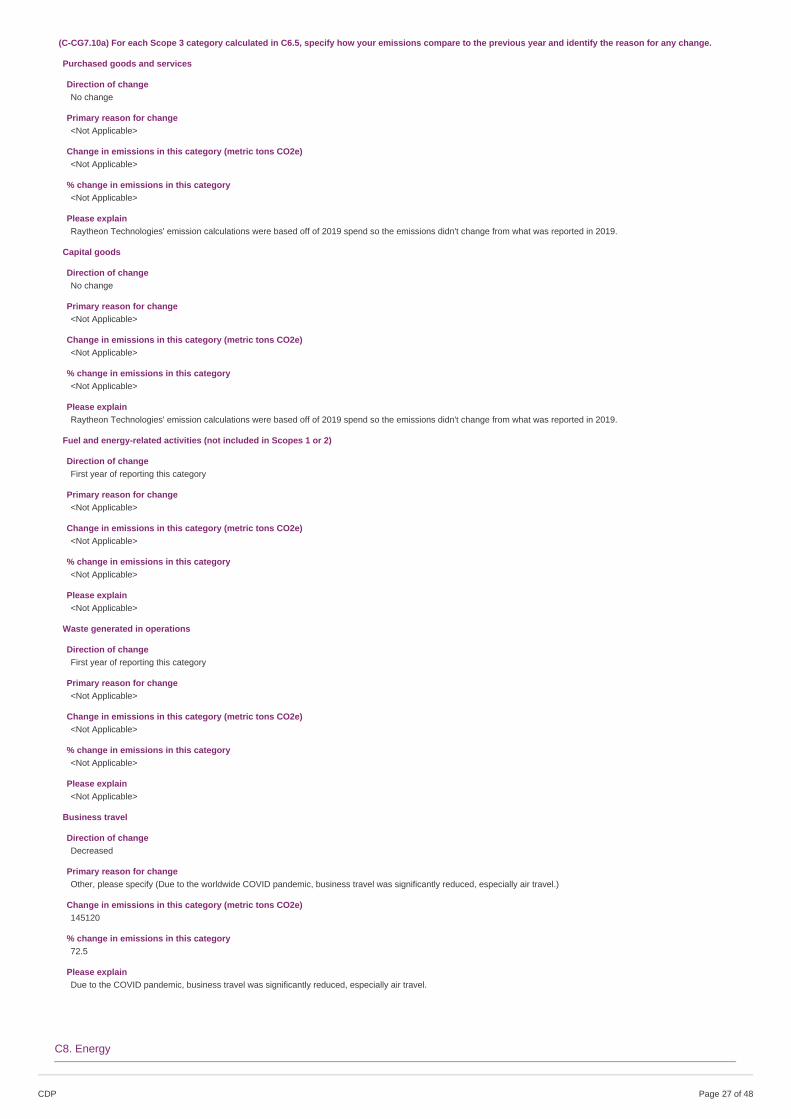
(C-CG7.10a) For each Scope 3 category calculated in C6.5, specify how your emissions compare to the previous year and identify the reason for any change.
Purchased goods and services
Direction of changeNo change
Primary reason for change<Not Applicable>
Change in emissions in this category (metric tons CO2e)<Not Applicable>
% change in emissions in this category<Not Applicable>
Please explainRaytheon Technologies' emission calculations were based off of 2019 spend so the emissions didn't change from what was reported in 2019.
Capital goods
Direction of changeNo change
Primary reason for change<Not Applicable>
Change in emissions in this category (metric tons CO2e)<Not Applicable>
% change in emissions in this category<Not Applicable>
Please explainRaytheon Technologies' emission calculations were based off of 2019 spend so the emissions didn't change from what was reported in 2019.
Fuel and energy-related activities (not included in Scopes 1 or 2)
Direction of changeFirst year of reporting this category
Primary reason for change<Not Applicable>
Change in emissions in this category (metric tons CO2e)<Not Applicable>
% change in emissions in this category<Not Applicable>
Please explain<Not Applicable>
Waste generated in operations
Direction of changeFirst year of reporting this category
Primary reason for change<Not Applicable>
Change in emissions in this category (metric tons CO2e)<Not Applicable>
% change in emissions in this category<Not Applicable>
Please explain<Not Applicable>
Business travel
Direction of changeDecreased
Primary reason for changeOther, please specify (Due to the worldwide COVID pandemic, business travel was significantly reduced, especially air travel.)
Change in emissions in this category (metric tons CO2e)145120
% change in emissions in this category72.5
Please explainDue to the COVID pandemic, business travel was significantly reduced, especially air travel.
C8. Energy
CDP Page of 4827
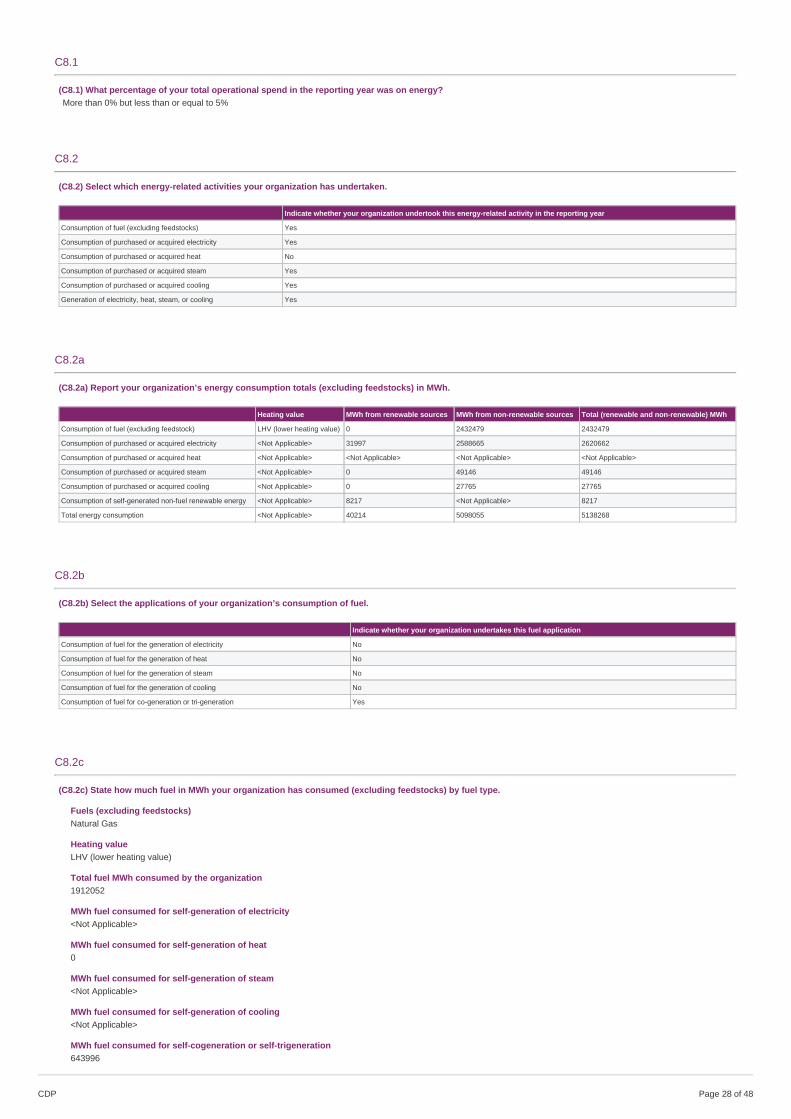
C8.1
(C8.1) What percentage of your total operational spend in the reporting year was on energy?More than 0% but less than or equal to 5%
C8.2
(C8.2) Select which energy-related activities your organization has undertaken.
Indicate whether your organization undertook this energy-related activity in the reporting year
Consumption of fuel (excluding feedstocks) Yes
Consumption of purchased or acquired electricity Yes
Consumption of purchased or acquired heat No
Consumption of purchased or acquired steam Yes
Consumption of purchased or acquired cooling Yes
Generation of electricity, heat, steam, or cooling Yes
C8.2a
(C8.2a) Report your organization’s energy consumption totals (excluding feedstocks) in MWh.
Heating value MWh from renewable sources MWh from non-renewable sources Total (renewable and non-renewable) MWh
Consumption of fuel (excluding feedstock) LHV (lower heating value) 0 2432479 2432479
Consumption of purchased or acquired electricity <Not Applicable> 31997 2588665 2620662
Consumption of purchased or acquired heat <Not Applicable> <Not Applicable> <Not Applicable> <Not Applicable>
Consumption of purchased or acquired steam <Not Applicable> 0 49146 49146
Consumption of purchased or acquired cooling <Not Applicable> 0 27765 27765
Consumption of self-generated non-fuel renewable energy <Not Applicable> 8217 <Not Applicable> 8217
Total energy consumption <Not Applicable> 40214 5098055 5138268
C8.2b
(C8.2b) Select the applications of your organization’s consumption of fuel.
Indicate whether your organization undertakes this fuel application
Consumption of fuel for the generation of electricity No
Consumption of fuel for the generation of heat No
Consumption of fuel for the generation of steam No
Consumption of fuel for the generation of cooling No
Consumption of fuel for co-generation or tri-generation Yes
C8.2c
(C8.2c) State how much fuel in MWh your organization has consumed (excluding feedstocks) by fuel type.
Fuels (excluding feedstocks)Natural Gas
Heating valueLHV (lower heating value)
Total fuel MWh consumed by the organization1912052
MWh fuel consumed for self-generation of electricity<Not Applicable>
MWh fuel consumed for self-generation of heat0
MWh fuel consumed for self-generation of steam<Not Applicable>
MWh fuel consumed for self-generation of cooling<Not Applicable>
MWh fuel consumed for self-cogeneration or self-trigeneration643996
CDP Page of 4828
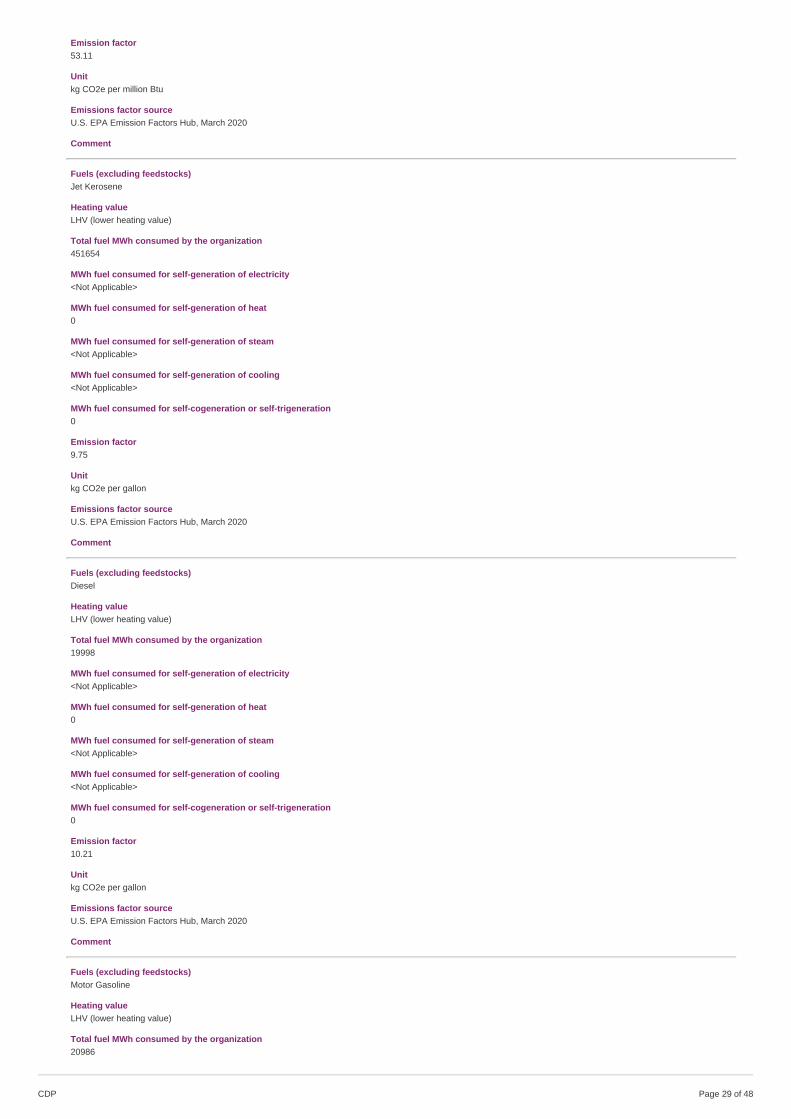
Emission factor53.11
Unitkg CO2e per million Btu
Emissions factor sourceU.S. EPA Emission Factors Hub, March 2020
Comment
Fuels (excluding feedstocks)Jet Kerosene
Heating valueLHV (lower heating value)
Total fuel MWh consumed by the organization451654
MWh fuel consumed for self-generation of electricity<Not Applicable>
MWh fuel consumed for self-generation of heat0
MWh fuel consumed for self-generation of steam<Not Applicable>
MWh fuel consumed for self-generation of cooling<Not Applicable>
MWh fuel consumed for self-cogeneration or self-trigeneration0
Emission factor9.75
Unitkg CO2e per gallon
Emissions factor sourceU.S. EPA Emission Factors Hub, March 2020
Comment
Fuels (excluding feedstocks)Diesel
Heating valueLHV (lower heating value)
Total fuel MWh consumed by the organization19998
MWh fuel consumed for self-generation of electricity<Not Applicable>
MWh fuel consumed for self-generation of heat0
MWh fuel consumed for self-generation of steam<Not Applicable>
MWh fuel consumed for self-generation of cooling<Not Applicable>
MWh fuel consumed for self-cogeneration or self-trigeneration0
Emission factor10.21
Unitkg CO2e per gallon
Emissions factor sourceU.S. EPA Emission Factors Hub, March 2020
Comment
Fuels (excluding feedstocks)Motor Gasoline
Heating valueLHV (lower heating value)
Total fuel MWh consumed by the organization20986
CDP Page of 4829
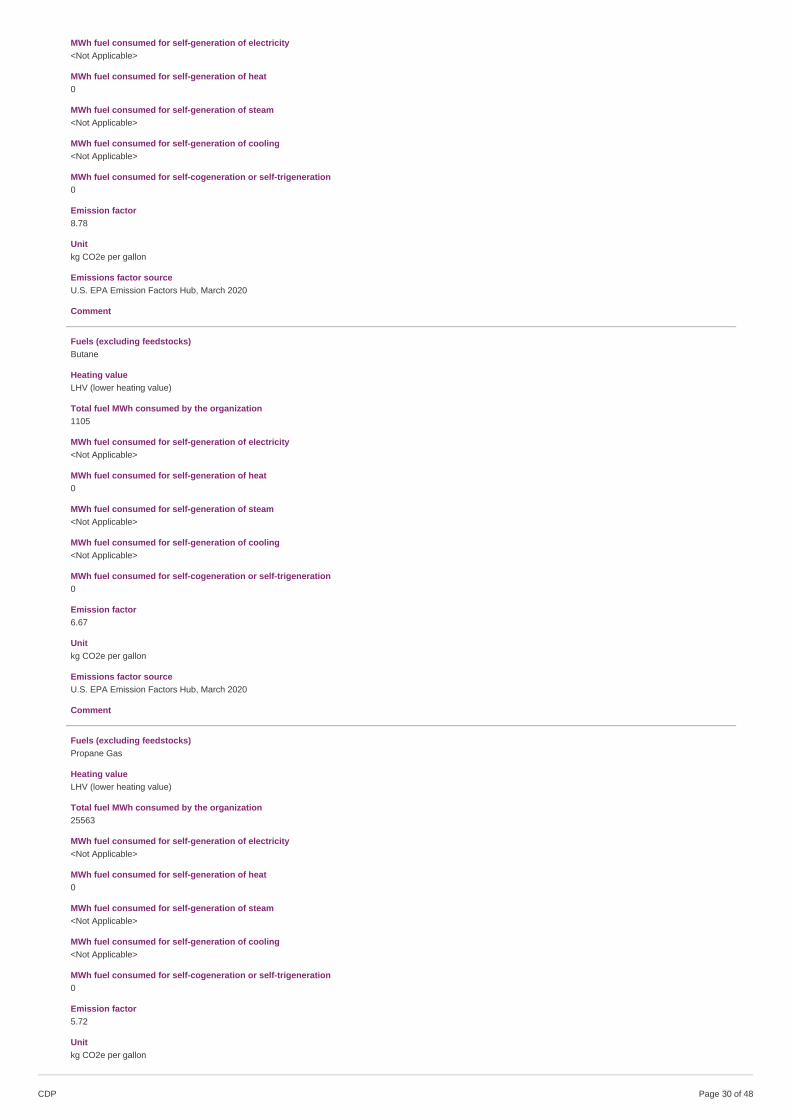
MWh fuel consumed for self-generation of electricity<Not Applicable>
MWh fuel consumed for self-generation of heat0
MWh fuel consumed for self-generation of steam<Not Applicable>
MWh fuel consumed for self-generation of cooling<Not Applicable>
MWh fuel consumed for self-cogeneration or self-trigeneration0
Emission factor8.78
Unitkg CO2e per gallon
Emissions factor sourceU.S. EPA Emission Factors Hub, March 2020
Comment
Fuels (excluding feedstocks)Butane
Heating valueLHV (lower heating value)
Total fuel MWh consumed by the organization1105
MWh fuel consumed for self-generation of electricity<Not Applicable>
MWh fuel consumed for self-generation of heat0
MWh fuel consumed for self-generation of steam<Not Applicable>
MWh fuel consumed for self-generation of cooling<Not Applicable>
MWh fuel consumed for self-cogeneration or self-trigeneration0
Emission factor6.67
Unitkg CO2e per gallon
Emissions factor sourceU.S. EPA Emission Factors Hub, March 2020
Comment
Fuels (excluding feedstocks)Propane Gas
Heating valueLHV (lower heating value)
Total fuel MWh consumed by the organization25563
MWh fuel consumed for self-generation of electricity<Not Applicable>
MWh fuel consumed for self-generation of heat0
MWh fuel consumed for self-generation of steam<Not Applicable>
MWh fuel consumed for self-generation of cooling<Not Applicable>
MWh fuel consumed for self-cogeneration or self-trigeneration0
Emission factor5.72
Unitkg CO2e per gallon
CDP Page of 4830
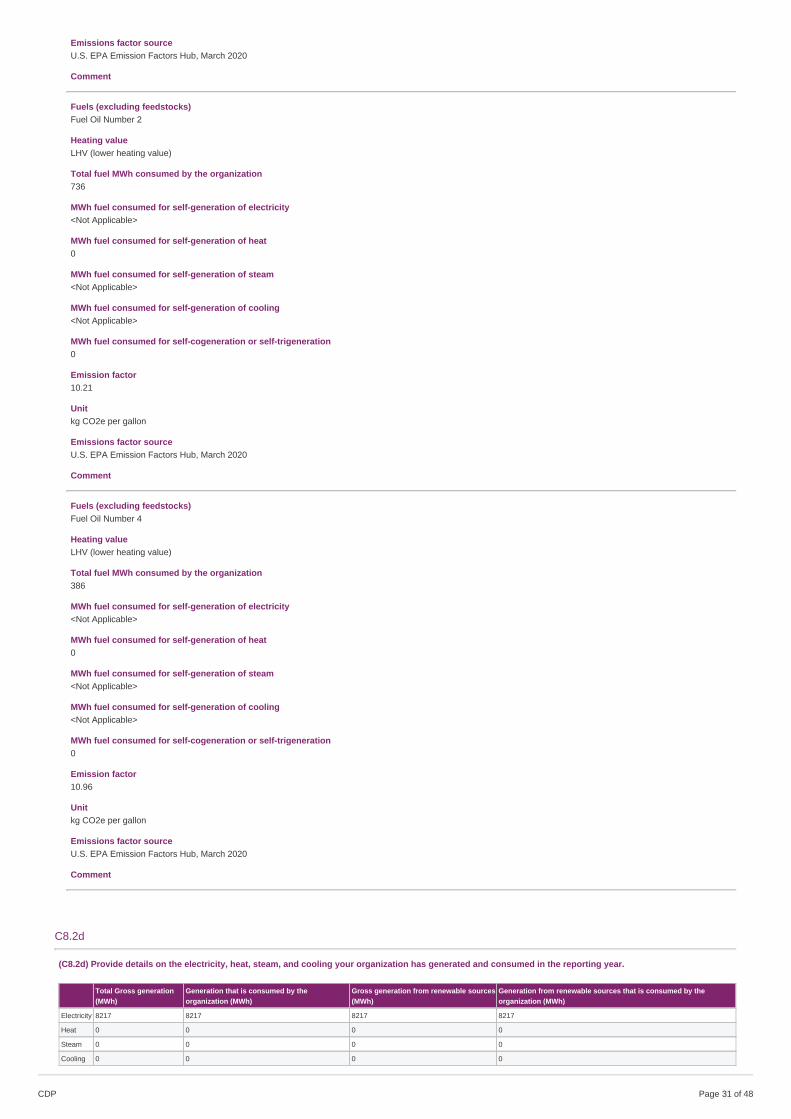
Emissions factor sourceU.S. EPA Emission Factors Hub, March 2020
Comment
Fuels (excluding feedstocks)Fuel Oil Number 2
Heating valueLHV (lower heating value)
Total fuel MWh consumed by the organization736
MWh fuel consumed for self-generation of electricity<Not Applicable>
MWh fuel consumed for self-generation of heat0
MWh fuel consumed for self-generation of steam<Not Applicable>
MWh fuel consumed for self-generation of cooling<Not Applicable>
MWh fuel consumed for self-cogeneration or self-trigeneration0
Emission factor10.21
Unitkg CO2e per gallon
Emissions factor sourceU.S. EPA Emission Factors Hub, March 2020
Comment
Fuels (excluding feedstocks)Fuel Oil Number 4
Heating valueLHV (lower heating value)
Total fuel MWh consumed by the organization386
MWh fuel consumed for self-generation of electricity<Not Applicable>
MWh fuel consumed for self-generation of heat0
MWh fuel consumed for self-generation of steam<Not Applicable>
MWh fuel consumed for self-generation of cooling<Not Applicable>
MWh fuel consumed for self-cogeneration or self-trigeneration0
Emission factor10.96
Unitkg CO2e per gallon
Emissions factor sourceU.S. EPA Emission Factors Hub, March 2020
Comment
C8.2d
(C8.2d) Provide details on the electricity, heat, steam, and cooling your organization has generated and consumed in the reporting year.
Total Gross generation(MWh)
Generation that is consumed by theorganization (MWh)
Gross generation from renewable sources(MWh)
Generation from renewable sources that is consumed by theorganization (MWh)
Electricity 8217 8217 8217 8217
Heat 0 0 0 0
Steam 0 0 0 0
Cooling 0 0 0 0
CDP Page of 4831
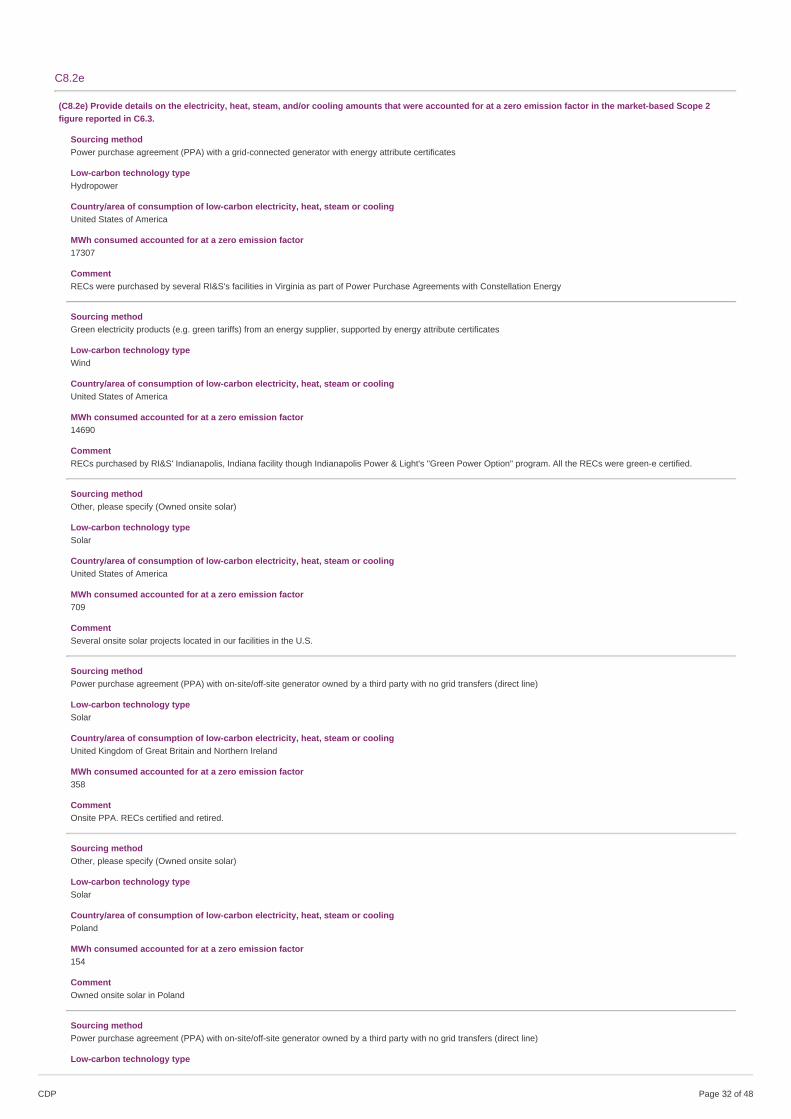
C8.2e
(C8.2e) Provide details on the electricity, heat, steam, and/or cooling amounts that were accounted for at a zero emission factor in the market-based Scope 2figure reported in C6.3.
Sourcing methodPower purchase agreement (PPA) with a grid-connected generator with energy attribute certificates
Low-carbon technology typeHydropower
Country/area of consumption of low-carbon electricity, heat, steam or coolingUnited States of America
MWh consumed accounted for at a zero emission factor17307
CommentRECs were purchased by several RI&S's facilities in Virginia as part of Power Purchase Agreements with Constellation Energy
Sourcing methodGreen electricity products (e.g. green tariffs) from an energy supplier, supported by energy attribute certificates
Low-carbon technology typeWind
Country/area of consumption of low-carbon electricity, heat, steam or coolingUnited States of America
MWh consumed accounted for at a zero emission factor14690
CommentRECs purchased by RI&S' Indianapolis, Indiana facility though Indianapolis Power & Light's "Green Power Option" program. All the RECs were green-e certified.
Sourcing methodOther, please specify (Owned onsite solar)
Low-carbon technology typeSolar
Country/area of consumption of low-carbon electricity, heat, steam or coolingUnited States of America
MWh consumed accounted for at a zero emission factor709
CommentSeveral onsite solar projects located in our facilities in the U.S.
Sourcing methodPower purchase agreement (PPA) with on-site/off-site generator owned by a third party with no grid transfers (direct line)
Low-carbon technology typeSolar
Country/area of consumption of low-carbon electricity, heat, steam or coolingUnited Kingdom of Great Britain and Northern Ireland
MWh consumed accounted for at a zero emission factor358
CommentOnsite PPA. RECs certified and retired.
Sourcing methodOther, please specify (Owned onsite solar)
Low-carbon technology typeSolar
Country/area of consumption of low-carbon electricity, heat, steam or coolingPoland
MWh consumed accounted for at a zero emission factor154
CommentOwned onsite solar in Poland
Sourcing methodPower purchase agreement (PPA) with on-site/off-site generator owned by a third party with no grid transfers (direct line)
Low-carbon technology type
CDP Page of 4832
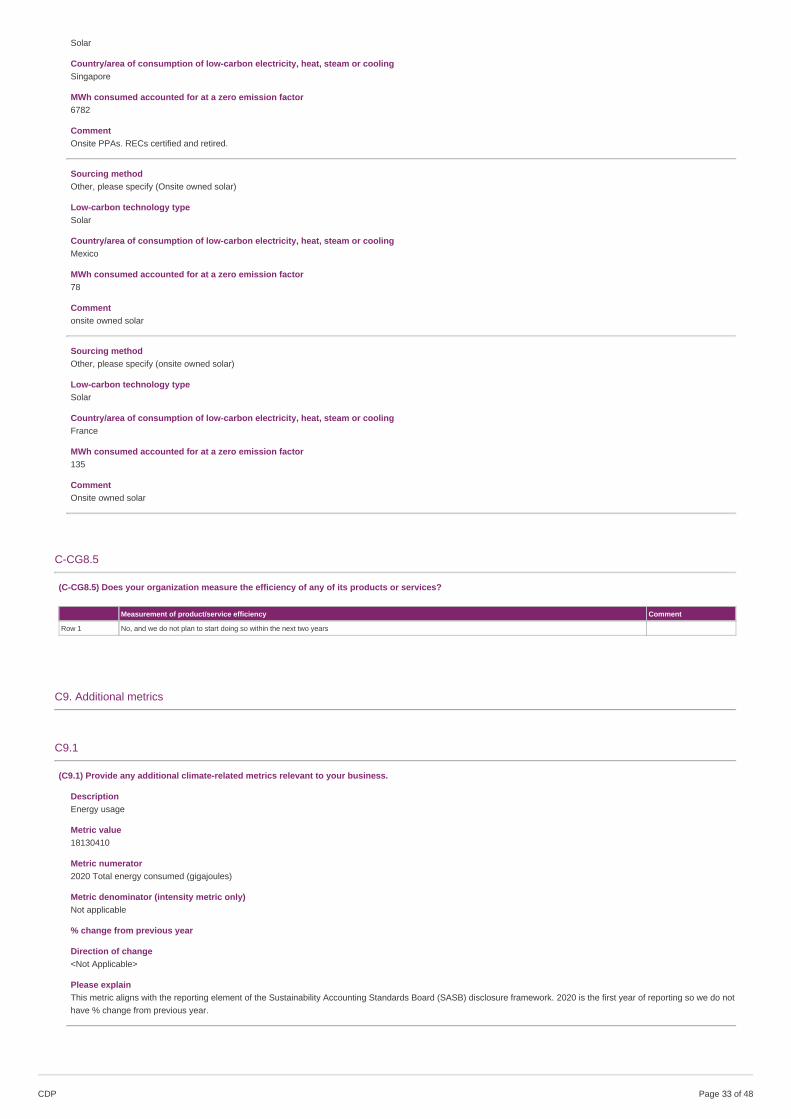
Solar
Country/area of consumption of low-carbon electricity, heat, steam or coolingSingapore
MWh consumed accounted for at a zero emission factor6782
CommentOnsite PPAs. RECs certified and retired.
Sourcing methodOther, please specify (Onsite owned solar)
Low-carbon technology typeSolar
Country/area of consumption of low-carbon electricity, heat, steam or coolingMexico
MWh consumed accounted for at a zero emission factor78
Commentonsite owned solar
Sourcing methodOther, please specify (onsite owned solar)
Low-carbon technology typeSolar
Country/area of consumption of low-carbon electricity, heat, steam or coolingFrance
MWh consumed accounted for at a zero emission factor135
CommentOnsite owned solar
C-CG8.5
(C-CG8.5) Does your organization measure the efficiency of any of its products or services?
Measurement of product/service efficiency Comment
Row 1 No, and we do not plan to start doing so within the next two years
C9. Additional metrics
C9.1
(C9.1) Provide any additional climate-related metrics relevant to your business.
DescriptionEnergy usage
Metric value18130410
Metric numerator2020 Total energy consumed (gigajoules)
Metric denominator (intensity metric only)Not applicable
% change from previous year
Direction of change<Not Applicable>
Please explainThis metric aligns with the reporting element of the Sustainability Accounting Standards Board (SASB) disclosure framework. 2020 is the first year of reporting so we do nothave % change from previous year.
CDP Page of 4833
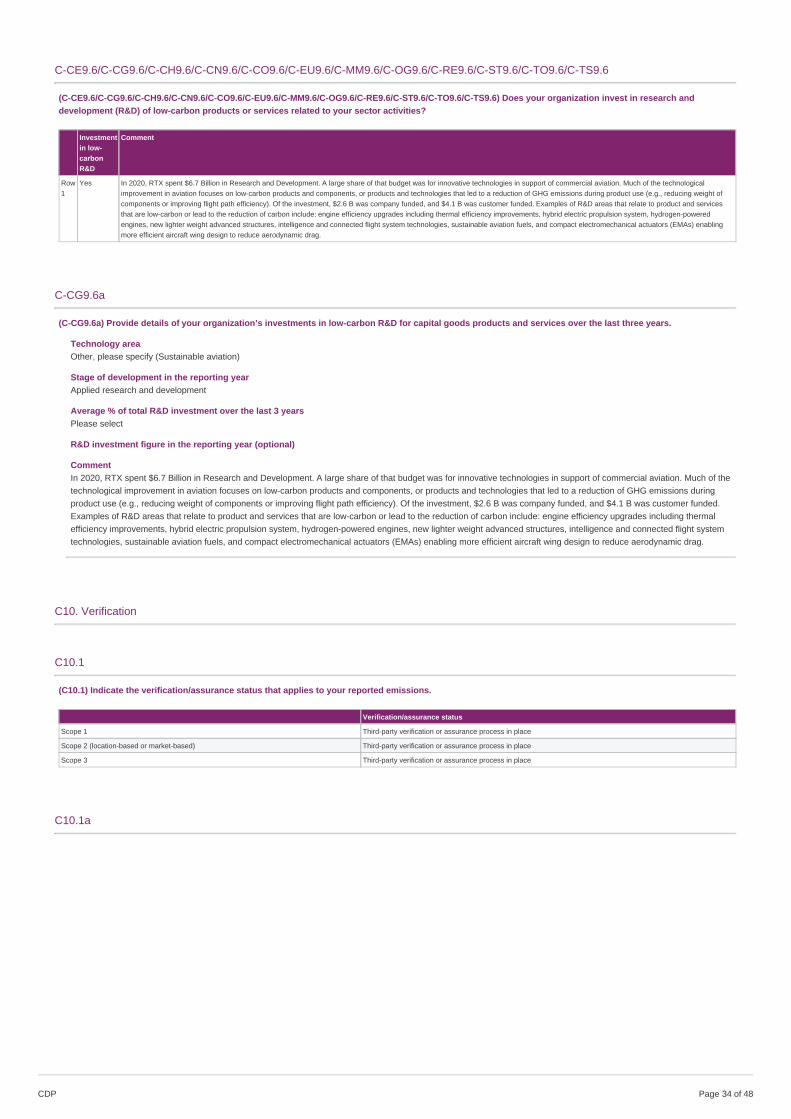
C-CE9.6/C-CG9.6/C-CH9.6/C-CN9.6/C-CO9.6/C-EU9.6/C-MM9.6/C-OG9.6/C-RE9.6/C-ST9.6/C-TO9.6/C-TS9.6
(C-CE9.6/C-CG9.6/C-CH9.6/C-CN9.6/C-CO9.6/C-EU9.6/C-MM9.6/C-OG9.6/C-RE9.6/C-ST9.6/C-TO9.6/C-TS9.6) Does your organization invest in research anddevelopment (R&D) of low-carbon products or services related to your sector activities?
Investmentin low-carbonR&D
Comment
Row1
Yes In 2020, RTX spent $6.7 Billion in Research and Development. A large share of that budget was for innovative technologies in support of commercial aviation. Much of the technologicalimprovement in aviation focuses on low-carbon products and components, or products and technologies that led to a reduction of GHG emissions during product use (e.g., reducing weight ofcomponents or improving flight path efficiency). Of the investment, $2.6 B was company funded, and $4.1 B was customer funded. Examples of R&D areas that relate to product and servicesthat are low-carbon or lead to the reduction of carbon include: engine efficiency upgrades including thermal efficiency improvements, hybrid electric propulsion system, hydrogen-poweredengines, new lighter weight advanced structures, intelligence and connected flight system technologies, sustainable aviation fuels, and compact electromechanical actuators (EMAs) enablingmore efficient aircraft wing design to reduce aerodynamic drag.
C-CG9.6a
(C-CG9.6a) Provide details of your organization’s investments in low-carbon R&D for capital goods products and services over the last three years.
Technology areaOther, please specify (Sustainable aviation)
Stage of development in the reporting yearApplied research and development
Average % of total R&D investment over the last 3 yearsPlease select
R&D investment figure in the reporting year (optional)
CommentIn 2020, RTX spent $6.7 Billion in Research and Development. A large share of that budget was for innovative technologies in support of commercial aviation. Much of thetechnological improvement in aviation focuses on low-carbon products and components, or products and technologies that led to a reduction of GHG emissions duringproduct use (e.g., reducing weight of components or improving flight path efficiency). Of the investment, $2.6 B was company funded, and $4.1 B was customer funded.Examples of R&D areas that relate to product and services that are low-carbon or lead to the reduction of carbon include: engine efficiency upgrades including thermalefficiency improvements, hybrid electric propulsion system, hydrogen-powered engines, new lighter weight advanced structures, intelligence and connected flight systemtechnologies, sustainable aviation fuels, and compact electromechanical actuators (EMAs) enabling more efficient aircraft wing design to reduce aerodynamic drag.
C10. Verification
C10.1
(C10.1) Indicate the verification/assurance status that applies to your reported emissions.
Verification/assurance status
Scope 1 Third-party verification or assurance process in place
Scope 2 (location-based or market-based) Third-party verification or assurance process in place
Scope 3 Third-party verification or assurance process in place
C10.1a
CDP Page of 4834
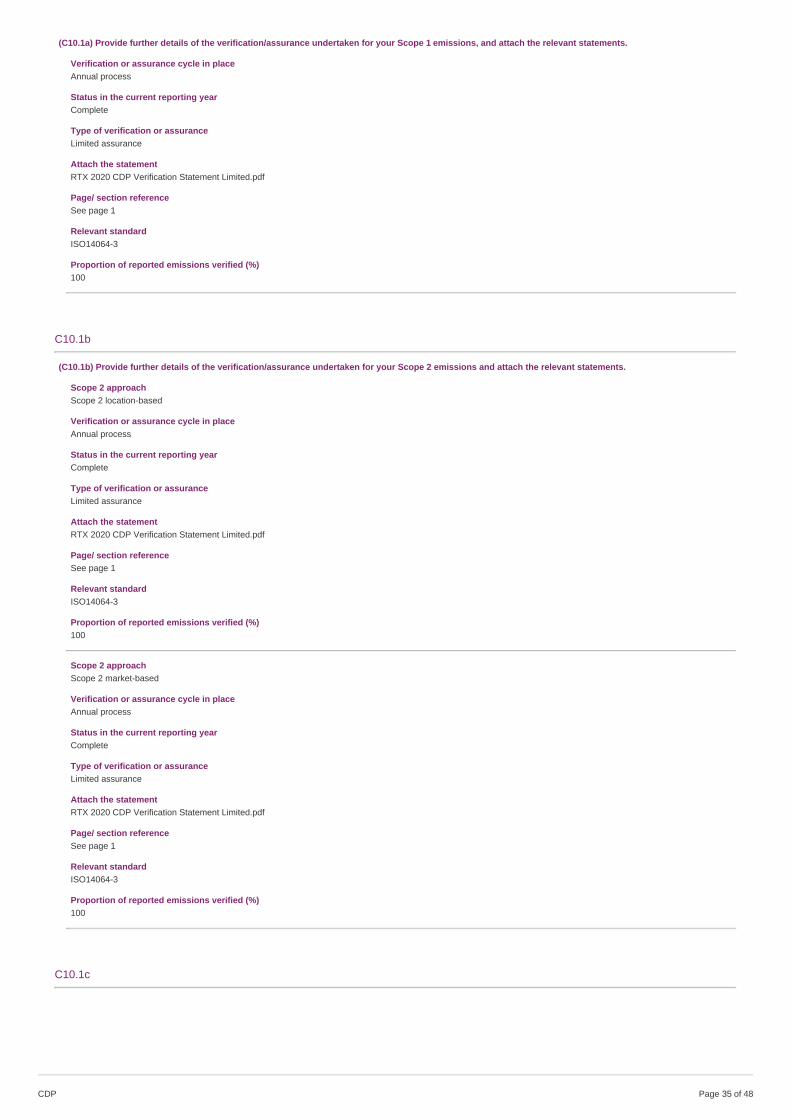
(C10.1a) Provide further details of the verification/assurance undertaken for your Scope 1 emissions, and attach the relevant statements.
Verification or assurance cycle in placeAnnual process
Status in the current reporting yearComplete
Type of verification or assuranceLimited assurance
Attach the statementRTX 2020 CDP Verification Statement Limited.pdf
Page/ section referenceSee page 1
Relevant standardISO14064-3
Proportion of reported emissions verified (%)100
C10.1b
(C10.1b) Provide further details of the verification/assurance undertaken for your Scope 2 emissions and attach the relevant statements.
Scope 2 approachScope 2 location-based
Verification or assurance cycle in placeAnnual process
Status in the current reporting yearComplete
Type of verification or assuranceLimited assurance
Attach the statementRTX 2020 CDP Verification Statement Limited.pdf
Page/ section referenceSee page 1
Relevant standardISO14064-3
Proportion of reported emissions verified (%)100
Scope 2 approachScope 2 market-based
Verification or assurance cycle in placeAnnual process
Status in the current reporting yearComplete
Type of verification or assuranceLimited assurance
Attach the statementRTX 2020 CDP Verification Statement Limited.pdf
Page/ section referenceSee page 1
Relevant standardISO14064-3
Proportion of reported emissions verified (%)100
C10.1c
CDP Page of 4835
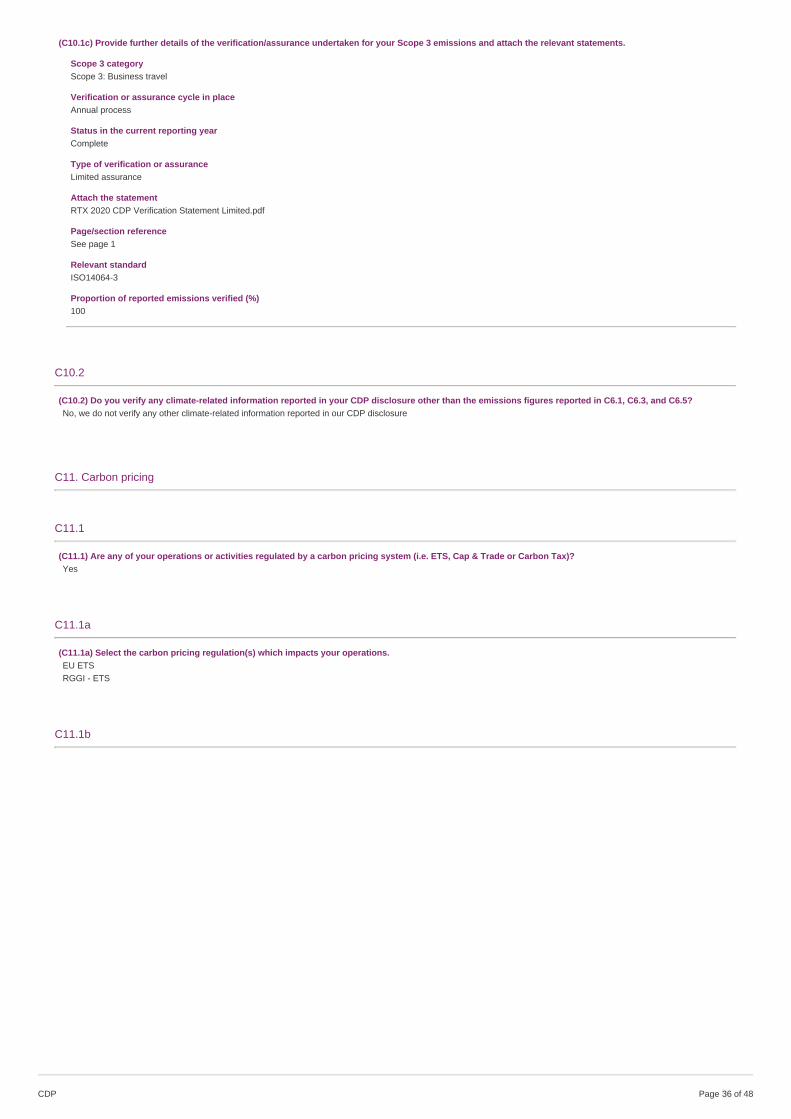
(C10.1c) Provide further details of the verification/assurance undertaken for your Scope 3 emissions and attach the relevant statements.
Scope 3 categoryScope 3: Business travel
Verification or assurance cycle in placeAnnual process
Status in the current reporting yearComplete
Type of verification or assuranceLimited assurance
Attach the statementRTX 2020 CDP Verification Statement Limited.pdf
Page/section referenceSee page 1
Relevant standardISO14064-3
Proportion of reported emissions verified (%)100
C10.2
(C10.2) Do you verify any climate-related information reported in your CDP disclosure other than the emissions figures reported in C6.1, C6.3, and C6.5?No, we do not verify any other climate-related information reported in our CDP disclosure
C11. Carbon pricing
C11.1
(C11.1) Are any of your operations or activities regulated by a carbon pricing system (i.e. ETS, Cap & Trade or Carbon Tax)?Yes
C11.1a
(C11.1a) Select the carbon pricing regulation(s) which impacts your operations.EU ETSRGGI - ETS
C11.1b
CDP Page of 4836
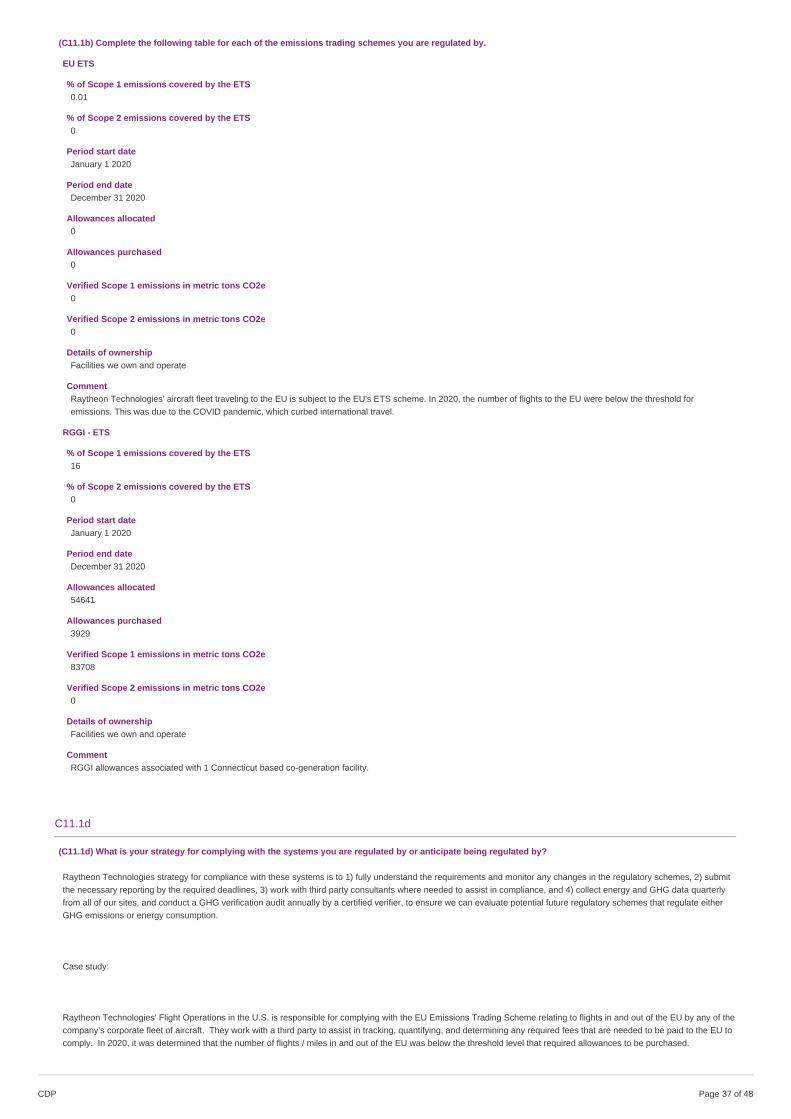
(C11.1b) Complete the following table for each of the emissions trading schemes you are regulated by.
EU ETS
% of Scope 1 emissions covered by the ETS0.01
% of Scope 2 emissions covered by the ETS0
Period start dateJanuary 1 2020
Period end dateDecember 31 2020
Allowances allocated0
Allowances purchased0
Verified Scope 1 emissions in metric tons CO2e0
Verified Scope 2 emissions in metric tons CO2e0
Details of ownershipFacilities we own and operate
CommentRaytheon Technologies' aircraft fleet traveling to the EU is subject to the EU's ETS scheme. In 2020, the number of flights to the EU were below the threshold foremissions. This was due to the COVID pandemic, which curbed international travel.
RGGI - ETS
% of Scope 1 emissions covered by the ETS16
% of Scope 2 emissions covered by the ETS0
Period start dateJanuary 1 2020
Period end dateDecember 31 2020
Allowances allocated54641
Allowances purchased3929
Verified Scope 1 emissions in metric tons CO2e83708
Verified Scope 2 emissions in metric tons CO2e0
Details of ownershipFacilities we own and operate
CommentRGGI allowances associated with 1 Connecticut based co-generation facility.
C11.1d
(C11.1d) What is your strategy for complying with the systems you are regulated by or anticipate being regulated by?
Raytheon Technologies strategy for compliance with these systems is to 1) fully understand the requirements and monitor any changes in the regulatory schemes, 2) submitthe necessary reporting by the required deadlines, 3) work with third party consultants where needed to assist in compliance, and 4) collect energy and GHG data quarterlyfrom all of our sites, and conduct a GHG verification audit annually by a certified verifier, to ensure we can evaluate potential future regulatory schemes that regulate eitherGHG emissions or energy consumption.
Case study:
Raytheon Technologies' Flight Operations in the U.S. is responsible for complying with the EU Emissions Trading Scheme relating to flights in and out of the EU by any of thecompany’s corporate fleet of aircraft. They work with a third party to assist in tracking, quantifying, and determining any required fees that are needed to be paid to the EU tocomply. In 2020, it was determined that the number of flights / miles in and out of the EU was below the threshold level that required allowances to be purchased.
CDP Page of 4837
C11.2
(C11.2) Has your organization originated or purchased any project-based carbon credits within the reporting period?No
C11.3
(C11.3) Does your organization use an internal price on carbon?No, and we do not currently anticipate doing so in the next two years
C12. Engagement
C12.1
(C12.1) Do you engage with your value chain on climate-related issues?Yes, our suppliersYes, our customers
C12.1a
CDP Page of 4838
(C12.1a) Provide details of your climate-related supplier engagement strategy.
Type of engagementCompliance & onboarding
Details of engagementOther, please specify (RTX maintains a supplier code of conduct that includes expectations that suppliers conserve natural resources, prevent pollution, and minimizeemissions and energy consumption)
% of suppliers by number100
% total procurement spend (direct and indirect)95
% of supplier-related Scope 3 emissions as reported in C6.50
Rationale for the coverage of your engagementBy establishing a mandatory supplier code of conduct, the company believes we can influence supplier CO2e emissions and other environmental impacts and send a clearmessage that environmental protection is a company priority.
Impact of engagement, including measures of successRaytheon Technologies does not measure the GHG reduction impact from our engagement with suppliers. Our measurement of success is anecdotal, and success islargely judged by the feedback we receive from our suppliers.
Comment
Type of engagementEngagement & incentivization (changing supplier behavior)
Details of engagementRun an engagement campaign to educate suppliers about climate change
% of suppliers by number0.5
% total procurement spend (direct and indirect)1
% of supplier-related Scope 3 emissions as reported in C6.50
Rationale for the coverage of your engagementOne of legacy Raytheon's long-term 2020 Sustainability goals (established in 2015) was to obtain sustainability commitments from 90% of our key and preferred suppliers.The goal was met in 2020. The goal was measured by whether the targeted suppliers have 2 or more goals that were aligned with Raytheon's 14 sustainability goals, whichinclude energy, greenhouse gas emissions, and renewable energy. Legacy Raytheon's Supply Chain engaged with its strategic suppliers (i.e., Strategic Enterprise AlignedCommodities suppliers, approximately 400 suppliers) and encouraged them to align with 2 or more of Raytheon's sustainability goals. This group of suppliers was selectedfor the engagement due to their strategic importance and the fact that they are "preferred" suppliers and as such, they wanted to continue to meet Raytheon's needs andstay "preferred suppliers". They are also a well-defined set of suppliers with established and frequent contacts. To measure progress toward the goal / engagement,Raytheon's supply chain organization surveyed the suppliers and followed up with letters and phone calls. Raytheon communicated to the suppliers that it valuedsustainability and that sustainability and aggressive goals helps companies be more resource efficient, which can lower costs.
Impact of engagement, including measures of successImpact of the engagement: By the third quarter of 2020, 90% of the targeted suppliers had 2 or more sustainability goals aligned with Raytheon's sustainability goals. Byengaging with our strategic suppliers and communicating Raytheon's sustainability program and goals (including energy and GHG emission reduction goals), Raytheon wascommunicating that it valued sustainability and resource-efficient suppliers. Positive Outcomes: Enhancing suppliers’ sustainability programs along with setting targets. Inaddition, we believe another positive outcome in the long term will be a reduction in their environmental footprint. Raytheon also encouraged these suppliers to becomemembers of the U.S. EPA ENERGY STAR program as a way to reduce their energy and GHG emissions and lower their energy costs. This type of engagement is effectivein incentivising suppliers to reduce their GHG emissions and energy consumption. Measures of success: The way that we measured the success of this engagement iswhether we meet our 2020 goal of getting 90% of these SEAC suppliers to set 2 sustainability goals that are aligned with Raytheon's. Since the goal was achieved, weconsider it a success.
Comment
C12.1b
CDP Page of 4839
(C12.1b) Give details of your climate-related engagement strategy with your customers.
Type of engagementCollaboration & innovation
Details of engagementOther, please specify (Collaboration, discussion, and joint R&D investment in sustainable aviation technologies)
% of customers by number
% of customer - related Scope 3 emissions as reported in C6.50
Portfolio coverage (total or outstanding)<Not Applicable>
Please explain the rationale for selecting this group of customers and scope of engagementRaytheon Technologies actively engages with its commercial aviation customers to collaborate and innovate with our customers towards a more sustainable aviationindustry. One of the forums Raytheon Technologies uses to accomplish this is through the Air Transport Action Group (ATAG), an organization with approximately 40members worldwide representing all sectors of the air transport industry. These include airports, airlines, airframe and engine manufacturers (including RTX – Pratt &Whitney), air navigation service providers, airline pilot and air traffic controller unions, and others. The organization provides an effective venue to discuss critical issuesrelated to aviation’s sustainability and seek coordinated solutions. ATAG developed a set of climate goals that were eventually adopted by the International Civil AviationOrganization (ICAO), specialized United Nations organization, in 2016. The goals are: 1) improving fuel efficiency by an average of 1.5% per year from 2009-2020; 2)stabilizing emissions from 2020 with carbon-neutral growth; and 3) an aspirational goal to reduce net emissions from aviation by 50% by 2050 compared to 2005 levels. Thecompany also engages with Customers in other forums. For example, in 2019, RTX Collins Aerospace joined 23 other leaders in aerospace, research organizations andassociations across Europe to sign the Joint Declaration of European Aviation Research Stakeholders related to Clean Aviation in Horizon Europe research and innovationfunding program to lead the way toward the de-carbonization of aviation by 2050. Another example is RTX - Collins Aerospace, as part of a unique, long-term collaborationwith Airbus, Emirates Airlines, GE Aviation and Thales, in partnership with the Dubai Future Foundation, co-created Aviation X Lab to focus on technological innovations inaviation, including those enabling the next era of sustainable air travel.
Impact of engagement, including measures of successWe measure the success of engagement with customers on climate issues in various ways. For example, attendance at ATAG's Global Sustainability Aviation Summit,issuance of various publications that advance sustainable aviation (e.g., ATAG's Waypoint 2050 report which identifies several pathways for the aviation industry to achieveits carbon reduction goals), successful project demonstrations of new technologies. The ultimate measure of success is achieving the aviation industries milestones andcarbon reduction goals.
C12.3
(C12.3) Do you engage in activities that could either directly or indirectly influence public policy on climate-related issues through any of the following?Direct engagement with policy makersTrade associationsFunding research organizationsOther
C12.3a
(C12.3a) On what issues have you been engaging directly with policy makers?
Focus oflegislation
Corporateposition
Details of engagement Proposed legislative solution
Other,pleasespecify(Globalaviationemissionsreduction)
Supportwith minorexceptions
Pratt & Whitney engineers regularly provide expert testimony and publiccommentary in response to jet engine emissions reduction programs andregulations as proposed by the United Nation's International Civil AviationOrganization (ICAO), U.S. EPA and European Union regulators. Pratt &Whitney personnel serve on industry workgroups that engage directly withpolicy makers on the reduction of aviation GHG emissions, including theAir Transport Action Group (ATAG), and the Commercial AviationAlternative Fuels Initiative (CAAFI).
The UN's International Civil Aviation Organization (ICAO) has been charged with developing a global regulatoryregime that will reduce commercial aviation CO2 emissions in keeping with UN and COP 21 targets limitingaverage global temperature increases to no more than 2 degrees C by 2100. In 2016, the ICAO program wasapproved, and focuses on meeting three objectives: 2% annual fuel efficiency improvements; carbon neutralgrowth from 2020 forward utilizing the Carbon Offsetting and Reduction Scheme for International Aviation(CORSIA) where needed; and 50% reduction in global aviation CO2 absolute emissions by 2050 vs. 2005 usinga variety of measures including aircraft technology improvements, operational improvements, sustainableaviation fuels, and market-based mechanisms.
C12.3b
(C12.3b) Are you on the board of any trade associations or do you provide funding beyond membership?Yes
C12.3c
(C12.3c) Enter the details of those trade associations that are likely to take a position on climate change legislation.
Trade associationAir Transport Action Group (ATAG)
Is your position on climate change consistent with theirs?Consistent
CDP Page of 4840
Please explain the trade association’s positionThe Air Transport Action Group (ATAG) is an aviation trade association that advocates for the adoption of a global, three-part global aviation GHG emissions program thatincludes: 1.5% average annual fuel efficiency improvement between 2009 - 2020, stabilization of net aviation CO2 emissions at 2020 levels through carbon neutral growth,and a reduction of aviation net CO2 emissions to 50% of 2005 by 2050. These goals are included in the International Civil Aviation Organization (ICAO) program to controlglobal aviation emissions, as approved and recognized by the UN Intergovernmental Panel on Climate Change in 2016.
How have you influenced, or are you attempting to influence their position?Raytheon Technologies' Pratt & Whitney business unit is a participating sponsor of ATAG, holds a seat on its Board of Directors, and provides technical expertise to thegroup in the development of its positions.
Trade associationCommercial Aviation Alternative Fuels Initiative (CAAFI)
Is your position on climate change consistent with theirs?Consistent
Please explain the trade association’s positionThe Commercial Aviation Alternative Fuels Initiative (CAAFI) is a coalition of aerospace manufacturers and service providers seeking to enhance US energy security andgreater sustainability for aviation through the use of alternative jet engine fuels. CAAFI's goal is to promote the development of alternative jet fuel options that offerequivalent safety and favorable costs compared with petroleum-based jet fuel, while offering environmental improvement and energy supply security for aviation. CAAFIparticipants collaborate on technical aspects of alternative fuel chemistry and production capacity, and have developed various tools that facilitate the use of alternative fuelsand demonstrate the viability of alternative fuels to regulators and legislators.
How have you influenced, or are you attempting to influence their position?RTX's Pratt &Whitney technical experts serve on a variety of CAAFI workgroups to provide input to CAAFI studies, working papers and public testimony.
Trade associationAerospace Industries Association (AIA)
Is your position on climate change consistent with theirs?Consistent
Please explain the trade association’s positionAIA’s position on climate change as outlined in February, 2021 letter to the U.S. Department of Transportation, U.S. Special Presidential Envoy for Climate, U.S. FederalAviation Administration, and the U.S. National Climate Advisor. In 2008, AIA and U.S. manufacturers were part of the industry-wide agreement that saw aviation became thefirst industrial sector to set goals to reduce its climate impact: • 1.5% per year fuel efficiency improvements from 2010 to 2020 (already achieved – 2.3% improvement) •Carbon-neutral growth from 2020. With ICAO’s Carbon Offsetting and Reduction Scheme for International Aviation (CORSIA), aviation became the first industry to agree toa voluntary global cap on CO2 emissions. International emissions above 2020 levels will be required to be offset by the aviation sector. • 50% reduction in net aircraftemissions by 2050, compared to 2005 levels. Building on these established climate goals, AIA advocates for 3 important principles to follow to address climate impacts ofaviation. 1) Coordinated international solutions should be prioritized in recognition of the cross-border nature of the aviation industry and aircraft emissions. Maintain U.S.leadership in the International Civil Aviation Organization (ICAO). 2) Successfully decarbonizing the industry will rely on using the array of tools at our disposal to reduceaviation’s climate impacts, not just one measure in isolation (e.g., new aircraft technologies, expanded sustainable aviation fuel use, operational improvements, and market-based measures). This is particularly important since new aircraft technologies have a long development time and take years to filter through the fleet. 3) Domestic policiesmust provide the industry with the capability to transition to a green future without jeopardizing the essential role aviation plays in our economy and society. Sustainedgovernment support is needed for the aviation sector to meet our climate goals including measures to accelerate the production and use of SAF, enhanced public-privatepartnerships to accelerate Next-Generation aircraft and engine technology development, and modernization of our Nation’s airspace by implementing performance-basednavigation (PBN) routes that enable shorter, more direct routes.
How have you influenced, or are you attempting to influence their position?Raytheon Technologies is active in AIA's Civil Aviation Committee, along with other AIA committees.
Trade associationNational Association of Manufacturers (NAM)
Is your position on climate change consistent with theirs?Consistent
Please explain the trade association’s positionNAM compiled its recommendations on climate in a paper called “The Promise Ahead.” Excerpts are below: PLAN FOR ACTION A successful climate policy must have 3core components: 1) International Treaty: Negotiate and ratify a fair, binding international treaty, while continuing to drive reduction. This will ensure that the United Statesdoes not suffer a competitive disadvantage and can lead the way in developing job-creating technologies and products. 2) Unified domestic framework: The U.S. shouldenact a single, unified federal policy to manage GHG emissions that meets 3 principles: • One unified policy: Instead of the patchwork of federal, state and local climatechange regulations that manufacturers currently face, the industry needs a clear federal policy that offers predictability, consistency and certainty while meeting science-based targets. Businesses should be able to plan for the future—and shouldn’t have to worry that the policies of today will be different tomorrow. • A level playing field: Anynational policy to address emissions should be economy-wide and apply to all emitters. Congress should develop plans that don’t unduly burden one sector over another,and manufacturers shouldn’t be expected to shoulder the already-high cost of new regulations alone. • Consumer choice and competitiveness: This policy approachshouldn’t automatically involve a mandated phaseout of any manufactured product. Instead, policymakers should lead with the tools and strategies manufacturers need toimprove products, preserving consumer choice and supporting the innovation that manufacturing provides. 3) Immediate actions that it recommends the U.S. pursue toachieve near-term emission reductions are: • Significant investing in energy and water efficiency • Funding and expanding climate and clean energy R&D programs •Paving the way for a smart grid • Commercializing and deploying carbon capture, utilization and storage technology • Ratifying the Kigali Amendment, which sets a globalpath for phasing down HFCs
How have you influenced, or are you attempting to influence their position?Raytheon Technologies is a board member on NAM and actively participates on numerous Committees.
Trade associationBusiness Roundtable
Is your position on climate change consistent with theirs?Consistent
Please explain the trade association’s positionBusiness Roundtable believes corporations should lead by example, support sound public policies and drive the innovation needed to address climate change. To this end,it believes that the United States should adopt a more comprehensive, coordinated and market-based approach to reduce emissions. This approach must be pursued in a
CDP Page of 4841
manner that ensures environmental effectiveness while fostering innovation, maintaining U.S. competitiveness, maximizing compliance flexibility, and minimizing costs tobusiness and society. International cooperation and diplomacy backed by a broadly supported U.S. policy will be the key to achieving the collective global action required tomeet the scope of the challenge and position the U.S. economy for long-term success. The consequences of climate change for global prosperity and socioeconomic well-being are significant; the world simply cannot afford the costs of inaction. The Business Roundtable supports a comprehensive policy to reduce GHG emissions andultimately stabilize atmospheric concentrations at levels that will avoid the worst effects and mitigate the impacts of climate change. The transition to a low-carbon future willrequire a significant evolution in the way businesses and consumers operate. Key principles to guide public policy: • Align policy goals and GHG emissions reduction targetswith scientific evidence. • Increase global engagement, cooperation and accountability. • Leverage market-based solutions wherever possible. • Provide for adequatetransition time and long-term regulatory certainty. • Preserve the competitiveness of U.S. businesses, including avoiding economic and emissions “leakage.” • Minimizesocial and economic costs for those least able to bear them. • Support both public and private investment in low-carbon and GHG emissions reduction technologies alongthe full innovation pipeline. • Minimize administrative burdens and duplicative policies while maximizing compliance flexibility. • Ensure that U.S. policies account forinternational emissions reduction programs. • Advance climate resilience and adaptation. • Eliminate barriers to the deployment of emissions reduction technologies andlow-carbon energy.
How have you influenced, or are you attempting to influence their position?Raytheon Technologies' CEO is a board member of the Business Roundtable and other company representatives participate on its Committees.
C12.3d
(C12.3d) Do you publicly disclose a list of all research organizations that you fund?No
C12.3e
(C12.3e) Provide details of the other engagement activities that you undertake.
International Aerospace Environmental Group (IAEG) - Raytheon Technologies sits on the IAEG board of directors and also participates in a variety of IAEG workgroups. IAEG is an aerospace industry organization with approximately 90 company members. The organization's mission is to develop common approaches for the aerospaceindustry to address environmental issues and concerns faced by all IAEG members. IAEG has established thirteen subject area workgroups, each of which is supported bymember company subject matter experts and is dedicated to solving a specific challenge.
One of the working groups is the "Greenhouse Gas Reporting Work Group". This work group had developed an aerospace-oriented approach to GHG reporting, which wascertified by the GHG Reporting Protocol as an official adjunct companion to the GHG Reporting Protocol. In 2019, the workgroup developed a Scope 3 emissions datacollection and reporting tool for the calculation of Products, Goods and Services and Capital Goods scope 3 emissions.
C12.3f
(C12.3f) What processes do you have in place to ensure that all of your direct and indirect activities that influence policy are consistent with your overall climatechange strategy?
Raytheon Technologies' direct policy activities are centrally controlled by the company's Corporate Government Relations organization. They coordinate with affectedBusinesses and functional organizations, and therefore the activities reflect the company's overall climate change strategy. Government Relations adheres to formal policiesand procedures in their outreach to legislators and regulators. Indirect activities on climate change policy are governed and coordinated by our Corporate Senior VicePresidents of Government Relations, Operations and Supply Chain, Engineering, and Communications. There are sustainability teams and / or EH&S teams in eachBusiness that oversees and coordinates these indirect activities.
C12.4
CDP Page of 4842
(C12.4) Have you published information about your organization’s response to climate change and GHG emissions performance for this reporting year in placesother than in your CDP response? If so, please attach the publication(s).
PublicationIn mainstream reports
StatusComplete
Attach the documentRaytheon Technologies 2020 Annual Report.pdf
Page/Section referencePage 17 of the Raytheon Technologies 2020 Annual Report
Content elementsEmissions figuresEmission targets
Comment
PublicationIn mainstream reports
StatusComplete
Attach the documentRaytheon Technologies 2021 Proxy Statement.pdf
Page/Section referencePage 32 of the Raytheon Technologies 2021 Proxy Statement
Content elementsEmissions figuresEmission targets
Comment
PublicationOther, please specify (Company external website)
StatusComplete
Attach the document
Page/Section referenceClimate change and GHG emissions performance is included in the EH&S / Sustainability webpages on the company's external website. Please see link:https://www.rtx.com/social-impact/environment-health-and-safety/environment-health-safety
Content elementsEmissions figuresEmission targets
CommentThe disclosure also includes a link to the company's CDP response for 2020, which addresses all of these content elements.
C15. Signoff
C-FI
(C-FI) Use this field to provide any additional information or context that you feel is relevant to your organization's response. Please note that this field is optionaland is not scored.
No additional information.
C15.1
(C15.1) Provide details for the person that has signed off (approved) your CDP climate change response.
Job title Corresponding job category
Row 1 Corporate Senior Vice President, Operations and Supply Chain Other C-Suite Officer
CDP Page of 4843
SC. Supply chain module
SC0.0
(SC0.0) If you would like to do so, please provide a separate introduction to this module.
Please see C0. Introduction for an overview of Raytheon Technologies.
SC0.1
(SC0.1) What is your company’s annual revenue for the stated reporting period?
Annual Revenue
Row 1 64000000000
SC0.2
(SC0.2) Do you have an ISIN for your company that you would be willing to share with CDP?Yes
SC0.2a
(SC0.2a) Please use the table below to share your ISIN.
ISIN country code (2 letters) ISIN numeric identifier and single check digit (10 numbers overall)
Row 1 US 75513E1010
SC1.1
(SC1.1) Allocate your emissions to your customers listed below according to the goods or services you have sold them in this reporting period.
Requesting memberAirbus SE
Scope of emissionsScope 1
Allocation levelCompany wide
Allocation level detail<Not Applicable>
Emissions in metric tonnes of CO2e64388
Uncertainty (±%)80
Major sources of emissionsNatural gas for building heating and equipment operation, jet fuel for engine testing, jet fuel for Corporate jet travel, onsite use of diesel, propane and other fuels, use ofrefrigerants for building and equipment cooling, and gasoline and diesel for fleet vehicles.
VerifiedNo
Allocation methodAllocation based on the market value of products purchased
Please explain how you have identified the GHG source, including major limitations to this process and assumptions madeWe utilized a revenue model to allocate GHG emissions. Sales to Airbus in 2020 represented approximately 12% of Raytheon Technologies' total revenues ($64B). Weapplied that percentage to each scope to estimate the amount of GHG emissions relating to products and services we sell to Airbus. The uncertainty of this number is highgiven the methodology of allocation. There are many challenges of allocating GHGs to individual products, services, and customers because most of the company'slocations work on many products and components for many different customers. Workflow at individual sites for individual customers vary throughout the year. A largemajority of our GHG emissions are related to energy consumption (e.g., electricity and natural gas) at the facilities and it is not possible to accurately allocate energyconsumption to various customers.
Requesting memberAirbus SE
CDP Page of 4844
Scope of emissionsScope 2
Allocation levelCompany wide
Allocation level detail<Not Applicable>
Emissions in metric tonnes of CO2e120245
Uncertainty (±%)80
Major sources of emissionsPurchased electricity primarily with some purchased steam. The electricity was used for building lighting as well as to power electrical equipment.
VerifiedNo
Allocation methodAllocation based on the market value of products purchased
Please explain how you have identified the GHG source, including major limitations to this process and assumptions madeWe utilized a revenue model to allocate GHG emissions. Sales to Airbus in 2020 represented approximately 12% of Raytheon Technologies' total revenues ($64B). Weapplied that percentage to each scope to estimate the amount of GHG emissions relating to products and services we sell to Airbus. The uncertainty of this number is highgiven the methodology of allocation. There are many challenges of allocating GHGs to individual products, services, and customers because most of the company'slocations work on many products and components for many different customers. Workflow at individual sites for individual customers vary throughout the year. A largemajority of our GHG emissions are related to energy consumption (e.g., electricity and natural gas) at the facilities and it is not possible to accurately allocate energyconsumption to various customers.
Requesting memberAirbus SE
Scope of emissionsScope 3
Allocation levelCompany wide
Allocation level detail<Not Applicable>
Emissions in metric tonnes of CO2e1342244
Uncertainty (±%)80
Major sources of emissionsScope 3 categories included are: Employee business travel (commercial air travel and car rental, 2020, all RTX), Purchased goods and services (2019, only for Pratt &Whitney and Collins Aerospace), Capital goods (2019, only for Pratt & Whitney and Collins Aerospace), Fuel and energy related activities (2020, all RTX), and Wastegenerated in operations (2020, all RTX).
VerifiedNo
Allocation methodAllocation based on the market value of products purchased
Please explain how you have identified the GHG source, including major limitations to this process and assumptions madeWe utilized a revenue model to allocate GHG emissions. Sales to Airbus in 2020 represented approximately 12% of Raytheon Technologies' total revenues ($64B). Weapplied that percentage to each scope to estimate the amount of GHG emissions relating to products and services we sell to Airbus. The uncertainty of this number is highgiven the methodology of allocation. There are many challenges of allocating GHGs to individual products, services, and customers because most of the company'slocations work on many products and components for many different customers. Workflow at individual sites for individual customers vary throughout the year. A largemajority of our GHG emissions are related to energy consumption (e.g., electricity and natural gas) at the facilities and it is not possible to accurately allocate energyconsumption to various customers.
Requesting memberCalifornia Department of General Services (DGS)
Scope of emissionsPlease select
Allocation levelPlease select
Allocation level detail<Not Applicable>
Emissions in metric tonnes of CO2e
Uncertainty (±%)
Major sources of emissions
Verified
CDP Page of 4845
Please select
Allocation methodPlease select
Please explain how you have identified the GHG source, including major limitations to this process and assumptions madeRaytheon Technologies is not able to allocate GHG emissions on a customer by customer basis. The challenges of allocating GHGs to individual products, services, andcustomers are significant at this time. This is due to the fact that most of the company's locations work on many products and components for many different customers.Workflow at individual sites for individual customers vary throughout the year. In addition, a large majority of GHG emissions are related to its energy consumption (e.g.,electricity and natural gas) at the facilities, such as air conditioning and heating, and it is not possible to allocate energy consumption to various customers. One way tomake a gross estimate of allocated emissions would be to use sales figures. Customers could calculate what percent of sales they represent of Raytheon Technologies'total 2020 pro forma sales of $64 billion, and then apply that percentage to Raytheon Technologies' total GHG emissions (see section 6). As a manufacturer of a wide rangeof products and services, the use of an "overall percentage of total revenue = overall percentage of total emissions" approach would provide limited accuracy.
Requesting memberNEC Corporation
Scope of emissionsPlease select
Allocation levelPlease select
Allocation level detail<Not Applicable>
Emissions in metric tonnes of CO2e
Uncertainty (±%)
Major sources of emissions
VerifiedPlease select
Allocation methodPlease select
Please explain how you have identified the GHG source, including major limitations to this process and assumptions madeRaytheon Technologies is not able to allocate GHG emissions on a customer by customer basis. The challenges of allocating GHGs to individual products, services, andcustomers are significant at this time. This is due to the fact that most of the company's locations work on many products and components for many different customers.Workflow at individual sites for individual customers vary throughout the year. In addition, a large majority of GHG emissions are related to its energy consumption (e.g.,electricity and natural gas) at the facilities, such as air conditioning and heating, and it is not possible to allocate energy consumption to various customers. One way tomake a gross estimate of allocated emissions would be to use sales figures. Customers could calculate what percent of sales they represent of RTX's total 2020 pro formasales of $64 billion, and then apply that percentage to RTX's total GHG emissions (see section 6). As a manufacturer of a wide range of products and services, the use of an"overall percentage of total revenue = overall percentage of total emissions" approach would provide limited accuracy.
Requesting memberTransurban Group
Scope of emissionsPlease select
Allocation levelPlease select
Allocation level detail<Not Applicable>
Emissions in metric tonnes of CO2e
Uncertainty (±%)
Major sources of emissions
VerifiedPlease select
Allocation methodPlease select
Please explain how you have identified the GHG source, including major limitations to this process and assumptions madeRaytheon Technologies is not able to allocate GHG emissions on a customer by customer basis. The challenges of allocating GHGs to individual products, services, andcustomers are significant at this time. This is due to the fact that most of the company's locations work on many products and components for many different customers.Workflow at individual sites for individual customers vary throughout the year. In addition, a large majority of GHG emissions are related to its energy consumption (e.g.,electricity and natural gas) at the facilities, such as air conditioning and heating, and it is not possible to allocate energy consumption to various customers. One way tomake a gross estimate of allocated emissions would be to use sales figures. Customers could calculate what percent of sales they represent of Raytheon Technologies'total 2020 pro forma sales of $64 billion, and then apply that percentage to RTX's total GHG emissions (see section 6). As a manufacturer of a wide range of products andservices, the use of an "overall percentage of total revenue = overall percentage of total emissions" approach would provide limited accuracy.
Requesting memberU.S. General Services Administration - OMB ICR #3090-0319
Scope of emissionsPlease select
Allocation levelPlease select
CDP Page of 4846
Allocation level detail<Not Applicable>
Emissions in metric tonnes of CO2e
Uncertainty (±%)
Major sources of emissions
VerifiedPlease select
Allocation methodPlease select
Please explain how you have identified the GHG source, including major limitations to this process and assumptions madeRaytheon Technologies is not able to allocate GHG emissions on a customer by customer basis. The challenges of allocating GHGs to individual products, services, andcustomers are significant at this time. This is due to the fact that most of the company's locations work on many products and components for many different customers.Workflow at individual sites for individual customers vary throughout the year. In addition, a large majority of GHG emissions are related to its energy consumption (e.g.,electricity and natural gas) at the facilities, such as air conditioning and heating, and it is not possible to allocate energy consumption to various customers. One way tomake a gross estimate of allocated emissions would be to use sales figures. Customers could calculate what percent of sales they represent of RTX's total 2020 pro formasales of $64 billion, and then apply that percentage to RTX's total GHG emissions (see section 6). As a manufacturer of a wide range of products and services, the use of an"overall percentage of total revenue = overall percentage of total emissions" approach would provide limited accuracy.
SC1.2
(SC1.2) Where published information has been used in completing SC1.1, please provide a reference(s).
Not applicable.
SC1.3
(SC1.3) What are the challenges in allocating emissions to different customers, and what would help you to overcome these challenges?
Allocation challenges Please explain what would help you overcome these challenges
Customer base is too large and diverse to accurately trackemissions to the customer level
Multiple products are made at most sites, spanning many different customers. Most of the GHGs are energy related (electricity and natural gas)so they couldn't be allocated to individual products or customers.
Diversity of product lines makes accurately accounting for eachproduct/product line cost ineffective
Multiple products are made at most sites, spanning many different customers. Most of the GHGs are energy related so they couldn't beallocated to individual products or customers.
SC1.4
(SC1.4) Do you plan to develop your capabilities to allocate emissions to your customers in the future?No
SC1.4b
(SC1.4b) Explain why you do not plan to develop capabilities to allocate emissions to your customers.
The challenges of allocating GHGs to individual products, services, and customers are significant at this time. This is due to the fact that most of the company's locations workon many products and components for many different customers. Workflow at individual sites for individual customers vary throughout the year. In addition, a large majorityof GHG emissions are related to its energy consumption (e.g., electricity and natural gas) at the facilities and it is not possible to allocate energy consumption to variouscustomers. The company would need to install an enterprise wide, metered tracking system that allocated all energy use and process inputs to each of the tens of thousandsof products produced annually, along with a method to link that to individual customers. The development of this scheme is cost prohibitive. Raytheon Technologies plans towait until improved methods and guidance have been developed and tested.
SC2.1
(SC2.1) Please propose any mutually beneficial climate-related projects you could collaborate on with specific CDP Supply Chain members.
SC2.2
(SC2.2) Have requests or initiatives by CDP Supply Chain members prompted your organization to take organizational-level emissions reduction initiatives?No
CDP Page of 4847

SC4.1
(SC4.1) Are you providing product level data for your organization’s goods or services?No, I am not providing data
Submit your response
In which language are you submitting your response?English
Please confirm how your response should be handled by CDP
I am submitting to Public or Non-Public Submission Are you ready to submit the additional Supply Chain questions?
I am submitting my response InvestorsCustomers
Public Yes, I will submit the Supply Chain questions now
Please confirm belowI have read and accept the applicable Terms
CDP Page of 4848