dover corporation - climate change 2020
TRANSCRIPT

Dover Corporation - Climate Change 2020
C0. Introduction
C0.1
(C0.1) Give a general description and introduction to your organization.
Dover is a diversified global manufacturer and solutions provider with annual revenue of approximately $7 billion delivering innovative equipment and components,consumable supplies, aftermarket parts, software and digital solutions, and support services through five operating segments: Engineered Products, Fueling Solutions,Imaging & Identification, Pumps & Process Solutions, and Refrigeration & Food Equipment. The Company's entrepreneurial business model encourages, promotes andfosters deep customer engagement and collaboration, which has led to Dover's well-established and valued reputation for providing superior customer service and industry-leading product innovation. Dover is headquartered in Downers Grove, Illinois and currently employs over 23,000 people worldwide.
Dover's five operating segments are as follows:
· Our Engineered Products segment is a provider of a wide range of products, software and services that have broad customer applications across a number of markets,including aftermarket vehicle service, solid waste handling, industrial automation, aerospace and defense, industrial winch and hoist, and fluid dispensing.
· Our Fueling Solutions segment is focused on providing components, equipment and software and service solutions enabling safe transport of fuels and other hazardousfluids along the supply chain, as well as the safe and efficient operation of retail fueling and vehicle wash establishments.
· Our Imaging & Identification segment supplies precision marking and coding, product traceability and digital textile printing equipment, as well as related consumables,software and services.
· Our Pumps & Process Solutions segment manufactures specialty pumps, fluid handling components, plastics and polymer processing equipment, and highly engineeredcomponents for rotating and reciprocating machines.
· Our Refrigeration & Food Equipment segment is a provider of innovative and energy-efficient equipment and systems that serve the commercial refrigeration, heating andcooling and food equipment markets.
C0.2
(C0.2) State the start and end date of the year for which you are reporting data.
Start date End date Indicate if you are providing emissions data for past reportingyears
Select the number of past reporting years you will be providing emissions datafor
Reportingyear
January 12019
December 312019
No <Not Applicable>
C0.3
CDP Page of 411

(C0.3) Select the countries/areas for which you will be supplying data.ArgentinaAustraliaBelgiumBrazilCanadaChinaCzechiaDenmarkDominican RepublicFranceGermanyIndiaItalyMalaysiaMexicoNetherlandsPolandSingaporeSlovakiaSwedenSwitzerlandThailandUnited Kingdom of Great Britain and Northern IrelandUnited States of America
C0.4
(C0.4) Select the currency used for all financial information disclosed throughout your response.USD
C0.5
(C0.5) Select the option that describes the reporting boundary for which climate-related impacts on your business are being reported. Note that this option shouldalign with your chosen approach for consolidating your GHG inventory.Operational control
C-TO0.7/C-TS0.7
(C-TO0.7/C-TS0.7) For which transport modes will you be providing data?Please select
C1. Governance
C1.1
(C1.1) Is there board-level oversight of climate-related issues within your organization?Yes
C1.1a
(C1.1a) Identify the position(s) (do not include any names) of the individual(s) on the board with responsibility for climate-related issues.
Position ofindividual(s)
Please explain
ChiefExecutiveOfficer(CEO)
Our Board of Directors (the “Board”) oversees our Environmental, Social, and Governance (“ESG”) strategy and the incorporation of sustainability related risks and opportunities into its overallstrategic decision-making process across all of our portfolio companies. The Board’s oversight spans a wide array of ESG issues, including those related to climate change, health and safety,diversity and inclusion, ethics and compliance, and long-term environmental protection. Dover’s CEO, who is a member of the Board, has management responsibility over ESG issues, includingthose related to climate change. As part of its continued focus on sustainability, the Board incorporates ESG oversight into our CEO’s annual performance and compensation evaluation as one of theCEO's strategic objectives. In 2019, as an example of a climate-related decision, the CEO developed a multi-year plan for strategic oversight of ESG matters that integrates awareness andmanagement of material ESG risks including climate related risk, opportunities, objectives, metrics, and other sustainability factors into our strategy, operations, and governance.
C1.1b
CDP Page of 412
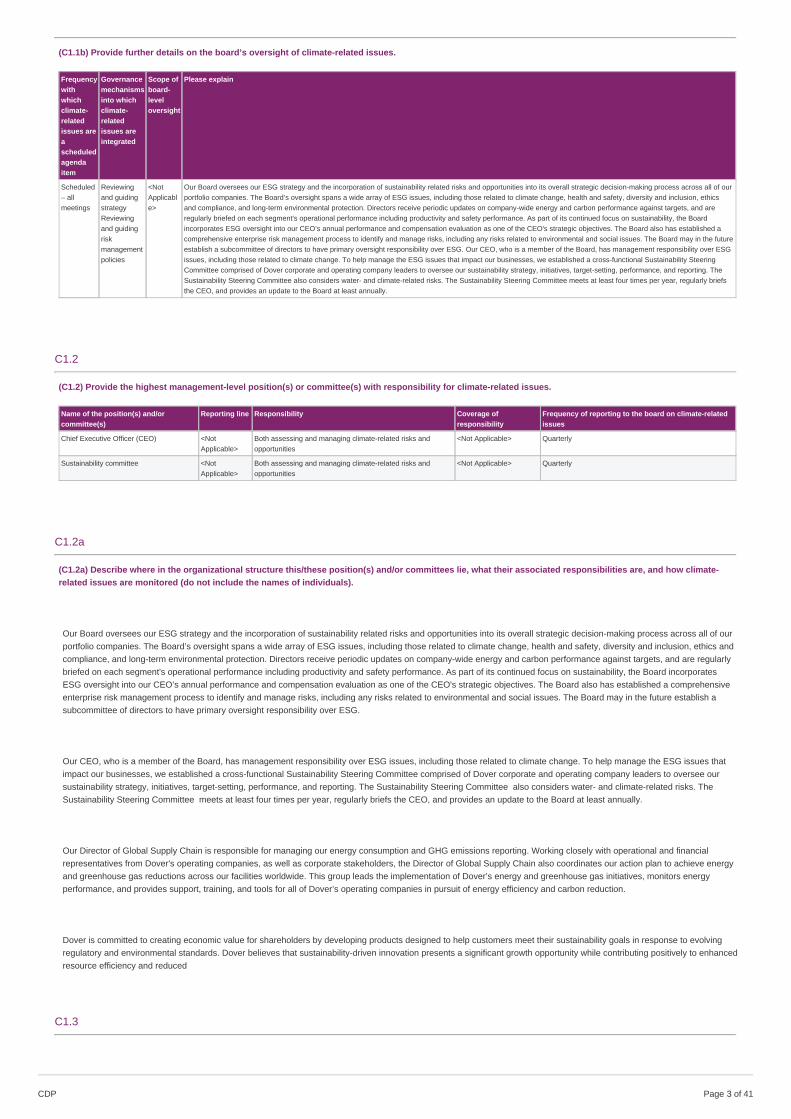
(C1.1b) Provide further details on the board’s oversight of climate-related issues.
Frequencywithwhichclimate-relatedissues areascheduledagendaitem
Governancemechanismsinto whichclimate-relatedissues areintegrated
Scope ofboard-leveloversight
Please explain
Scheduled– allmeetings
Reviewingand guidingstrategyReviewingand guidingriskmanagementpolicies
<NotApplicable>
Our Board oversees our ESG strategy and the incorporation of sustainability related risks and opportunities into its overall strategic decision-making process across all of ourportfolio companies. The Board’s oversight spans a wide array of ESG issues, including those related to climate change, health and safety, diversity and inclusion, ethicsand compliance, and long-term environmental protection. Directors receive periodic updates on company-wide energy and carbon performance against targets, and areregularly briefed on each segment's operational performance including productivity and safety performance. As part of its continued focus on sustainability, the Boardincorporates ESG oversight into our CEO’s annual performance and compensation evaluation as one of the CEO's strategic objectives. The Board also has established acomprehensive enterprise risk management process to identify and manage risks, including any risks related to environmental and social issues. The Board may in the futureestablish a subcommittee of directors to have primary oversight responsibility over ESG. Our CEO, who is a member of the Board, has management responsibility over ESGissues, including those related to climate change. To help manage the ESG issues that impact our businesses, we established a cross-functional Sustainability SteeringCommittee comprised of Dover corporate and operating company leaders to oversee our sustainability strategy, initiatives, target-setting, performance, and reporting. TheSustainability Steering Committee also considers water- and climate-related risks. The Sustainability Steering Committee meets at least four times per year, regularly briefsthe CEO, and provides an update to the Board at least annually.
C1.2
(C1.2) Provide the highest management-level position(s) or committee(s) with responsibility for climate-related issues.
Name of the position(s) and/orcommittee(s)
Reporting line Responsibility Coverage ofresponsibility
Frequency of reporting to the board on climate-relatedissues
Chief Executive Officer (CEO) <NotApplicable>
Both assessing and managing climate-related risks andopportunities
<Not Applicable> Quarterly
Sustainability committee <NotApplicable>
Both assessing and managing climate-related risks andopportunities
<Not Applicable> Quarterly
C1.2a
(C1.2a) Describe where in the organizational structure this/these position(s) and/or committees lie, what their associated responsibilities are, and how climate-related issues are monitored (do not include the names of individuals).
Our Board oversees our ESG strategy and the incorporation of sustainability related risks and opportunities into its overall strategic decision-making process across all of ourportfolio companies. The Board’s oversight spans a wide array of ESG issues, including those related to climate change, health and safety, diversity and inclusion, ethics andcompliance, and long-term environmental protection. Directors receive periodic updates on company-wide energy and carbon performance against targets, and are regularlybriefed on each segment's operational performance including productivity and safety performance. As part of its continued focus on sustainability, the Board incorporatesESG oversight into our CEO’s annual performance and compensation evaluation as one of the CEO's strategic objectives. The Board also has established a comprehensiveenterprise risk management process to identify and manage risks, including any risks related to environmental and social issues. The Board may in the future establish asubcommittee of directors to have primary oversight responsibility over ESG.
Our CEO, who is a member of the Board, has management responsibility over ESG issues, including those related to climate change. To help manage the ESG issues thatimpact our businesses, we established a cross-functional Sustainability Steering Committee comprised of Dover corporate and operating company leaders to oversee oursustainability strategy, initiatives, target-setting, performance, and reporting. The Sustainability Steering Committee also considers water- and climate-related risks. TheSustainability Steering Committee meets at least four times per year, regularly briefs the CEO, and provides an update to the Board at least annually.
Our Director of Global Supply Chain is responsible for managing our energy consumption and GHG emissions reporting. Working closely with operational and financialrepresentatives from Dover's operating companies, as well as corporate stakeholders, the Director of Global Supply Chain also coordinates our action plan to achieve energyand greenhouse gas reductions across our facilities worldwide. This group leads the implementation of Dover’s energy and greenhouse gas initiatives, monitors energyperformance, and provides support, training, and tools for all of Dover’s operating companies in pursuit of energy efficiency and carbon reduction.
Dover is committed to creating economic value for shareholders by developing products designed to help customers meet their sustainability goals in response to evolvingregulatory and environmental standards. Dover believes that sustainability-driven innovation presents a significant growth opportunity while contributing positively to enhancedresource efficiency and reduced
C1.3
CDP Page of 413

(C1.3) Do you provide incentives for the management of climate-related issues, including the attainment of targets?
Provide incentives for the management of climate-related issues Comment
Row 1 Yes
C1.3a
(C1.3a) Provide further details on the incentives provided for the management of climate-related issues (do not include the names of individuals).
Entitledtoincentive
Type ofincentive
Activityinventivized
Comment
ChiefExecutiveOfficer(CEO)
Monetaryreward
Other (pleasespecify)(Managementover ESGmatters)
The effective oversight and management of ESG matters is one of the CEO’s strategic objectives under our Annual Incentive Plan with a weighting of 25%. In 2019, the specificactions accomplished included: evaluated Dover’s approach to managing ESG matters, including studying operational practices, soliciting shareholder feedback, andconsidering other external perspectives and developed a multi-year plan for strategic oversight of ESG matters that integrates awareness and management of material ESGrisks including climate related risks, opportunities, objectives, metrics, and other sustainability factors into our strategy, operations, and governance.
C2. Risks and opportunities
C2.1
(C2.1) Does your organization have a process for identifying, assessing, and responding to climate-related risks and opportunities?Yes
C2.1a
(C2.1a) How does your organization define short-, medium- and long-term time horizons?
From (years) To (years) Comment
Short-term 0 3
Medium-term 3 10
Long-term 10 30
C2.1b
(C2.1b) How does your organization define substantive financial or strategic impact on your business?
One way that Dover defines a substantive financial or strategic impact on our business is an event or trend that could drive a significant positive or negative change in oursales revenue, pre-tax earnings, market position, competitive landscape or product innovation. Examples include innovative new products that would meet significantcustomer needs, or a sustained downturn in a key market that would reduce demand for our products and services. We use a number of criteria to identify a substantivefinancial or strategic impact including an evaluation of the potential impact on our finances, operations, reputation, business strategy, and legal and regulatory compliance. Wealso assess the likelihood and severity of the impact, and our ability to implement controls to mitigate impact. Financial impact is based on a scale which ranks impact into fivecategories, from a “Low” impact event with a potential financial impact of $2 million to a “Critical” impact event with a potential financial impact of $10 million.
Additionally, risks that impact our ability to operate that may not meet the financial thresholds defined above may also be considered to be of substantive impact. For example,shut downs of manufacturing facilities due to extreme weather events.
C2.2
CDP Page of 414

(C2.2) Describe your process(es) for identifying, assessing and responding to climate-related risks and opportunities.
Value chain stage(s) coveredDirect operationsUpstreamDownstream
Risk management processIntegrated into multi-disciplinary company-wide risk management process
Frequency of assessmentMore than once a year
Time horizon(s) coveredShort-termMedium-termLong-term
Description of processThe assessment of risk includes consideration of the potential impact of the risk on our overall market position, competitive landscape, product innovation, sales revenueand pre-tax earnings, as well as the likelihood and severity of the impact and mitigating controls in place. We have established a risk assessment team consisting of seniorexecutives, which annually, with the assistance of a consultant, oversees a risk assessment made at the segment and operating company levels and, with that informationin mind, performs an assessment of the overall risks our company may face, including with respect to any climate related risks. Each quarter, this team reassesses therisks at the Dover level, the severity of these risks and the status of efforts to mitigate them and reports to the Board on that reassessment. For example, our responseplanning process for natural disasters and severe weather evaluates physical risks posed by climate change for our facilities, operations, and, most importantly, the healthand safety of our employees. To address these risks, our operating companies have business continuity plans in place to protect people, property, and assets fromdisruptions that may be posed by the physical impacts of climate change such as flooding from sea-level rise and increased incidence and strength of storms. These planshelp us prepare in the event of a catastrophic event and will help ensure timely recovery of business operations. We recognize the business risks that may presentthemselves as society considers shifting to a lower-carbon economy, as proposed by the ambitious EU Green Deal. We believe we address these transition risks throughour environmental initiatives, such as our energy and GHG reduction initiatives and use of renewable energy. In addition, operating companies in our Fuelling Solutionssegment have also started and plan to continue to explore opportunities to diversify the types of fuel their products support. Further, many of our operating companies aredirectly involved in industries that will likely be impacted by climate change policy and the associated potential for a transition to a low carbon economy, such asenvironmental and waste management, retail fuelling, refrigeration and food equipment, packaging, and printing. A central part of our sustainability efforts is to enable ourcustomers to reduce waste, energy, and to achieve their sustainability goals through our innovative and sustainable products. As demand is expected to grow for theseproducts and services in the future, we anticipate significant opportunities to provide the solutions our customers depend on. At this time, there have been no materialeffects upon our earnings and competitive position resulting from our compliance with laws or regulations enacted or adopted relating to climate change. Our competitiveenvironment is complex because of the wide diversity of the products that our businesses manufacture and the markets they serve. In general, most of our businessescompete with only a few companies, and the key competitive factors are customer service, product quality, price and innovation. Our ability to compete effectively dependson how successfully we anticipate and respond to various competitive factors, including new products, digital solutions and support services that may be introduced bycompetitors, changes in customer preferences, evolving regulations, new business models and technologies, and pricing pressures. If our businesses are unable toanticipate their competitors’ developments or identify customer needs and preferences on a timely basis, or successfully introduce new products, digital solutions andsupport services in response to such competitive factors, they could lose customers to competitors. If our businesses do not compete effectively, we may experience lowerrevenue, operating profits, and cash flow.
C2.2a
CDP Page of 415

(C2.2a) Which risk types are considered in your organization's climate-related risk assessments?
Relevance&inclusion
Please explain
Currentregulation
Relevant,alwaysincluded
Our businesses’ domestic and international sales and operations are subject to risks associated with changes in laws, regulations and policies, including carbon emission regulations andenergy efficiency and design regulations. Failure to comply with any of the foregoing could result in civil and criminal, monetary and non-monetary penalties as well as potential damage toour reputation. We cannot provide assurance that our costs of complying with new and evolving regulatory reporting requirements and current or future laws will not exceed our estimates.An example of current regulations that are included in our evaluation is compliance of our facilities in Europe with the EU ETS. At this time, there have been no material effects upon ourearnings and competitive position resulting from our compliance with laws or regulations enacted or adopted relating to climate change. We are aware of a number of existing or upcomingregulatory initiatives intended to reduce emissions in geographies where our manufacturing and warehouse/distribution facilities are located and have evaluated the potential impact ofthese regulations on our businesses. We anticipate that direct impacts from current regulations will not be significant in the short- to medium-term. We expect the regulatory impactsassociated with current and future climate change regulation would be primarily indirect and would result in "pass through" costs from energy suppliers, suppliers of raw materials and otherservices related to our operations. Currently Dover is not subject to country or regional cap and trade regulations.
Emergingregulation
Relevant,alwaysincluded
Our businesses’ domestic and international sales and operations are subject to risks associated with changes in laws, regulations and policies, including carbon emission regulations andenergy efficiency and design regulations. Failure to comply with any of the foregoing could result in civil and criminal, monetary and non-monetary penalties as well as potential damage toour reputation. We cannot provide assurance that our costs of complying with new and evolving regulatory reporting requirements and current or future laws will not exceed out estimates.For example, we recognize the business risks that may present themselves as society considers shifting to a lower-carbon economy, as proposed by the ambitious EU Green Deal. Webelieve we address these transition risks through our environmental initiatives, such as our energy and GHG reduction initiatives and use of renewable energy. We anticipate that directimpacts from regulatory actions will not be significant in the short- to medium-term. We expect the regulatory impacts associated with climate change regulation would be primarily indirectand would result in "pass through" costs from energy suppliers, suppliers of raw materials and other services related to our operations. As an example of an indirect impact, the EUEmissions Trading System covers large emitters, many of which provide power or raw materials to Dover. As the cost for EU Allowances goes up for these large emitters, the pass throughcosts for Dover may rise.
Technology Relevant,alwaysincluded
We believe that sustainability-driven innovation presents a significant growth opportunity while contributing positively to enhanced resource efficiency and reduced waste. In that regard,our businesses have accelerated efforts and processes around innovation. In addition to product innovation, we plan to grow by developing digital technologies. In 2018, we opened ourDigital Labs center and continue to invest in this facility and our team to enhance our digital capability. The Digital Labs team is driving digital transformation across our businesses alongthe following three areas: (i) e-commerce – more efficient and streamlined digital customer interfaces that make it easy to do business with Dover companies; (ii) connected products –development of value-add connected, sensorized and software-augmented solutions built on top of Dover’s core equipment and component offerings in our end-markets; and (iii) digitalmanufacturing – driving increased efficiency, safety and quality in our manufacturing operations by employing cutting-edge automation and “digital factory” solutions. We believe that theDigital Labs center will enhance the effectiveness of our products and fuel our commercial growth strategy. By leveraging a central resource for Industrial Internet of Things ("IIoT") andconnected product initiatives, we reduce redundancy of support infrastructure while managing the proliferation of common parts, such as sensors, to keep our projects cost-competitive.Our businesses will now be able to leverage cross-company capabilities developed at the Digital Labs center. For example, with the support of the Digital Labs center, Hydro, whichmanufactures chemical injecting, proportioning, dispensing and medicating equipment within our Pumps & Process Solutions segment, launched Hydro Connect in 2018. Hydro Connect isa cloud-based IIoT platform that gives end users increased visibility into their operations, optimizes production, reduces costs and increases customer satisfaction. Building on thismomentum, we launched a digital initiative in 2018 to help our businesses increase sales and further improve customer satisfaction through digital technology, starting with Dover FoodRetail within our Refrigeration & Food Equipment segment. We continue to prioritize innovation and research and development activities; our R&D spend in 2019 represented 2% of ourannual revenue, an increase over our five-year average R&D spend of 1.7% of revenue.
Legal Relevant,alwaysincluded
Our businesses’ domestic and international sales and operations must comply with a wide variety of laws, regulations and policies (including environmental, employment and health andsafety regulations, data security laws, data privacy laws, export/import laws, tax policies such as export subsidy programs and research and experimentation credits, carbon emissionregulations and energy efficiency and design regulations and other similar programs). These laws, regulations and policies are complex, change frequently, have tended to become morestringent over time and may be inconsistent across jurisdictions. Failure to comply (or any alleged or perceived failure to comply) with any of the foregoing could result in civil and criminal,monetary and non-monetary penalties as well as potential damage to our reputation and disruption to our business. We cannot provide assurance that our costs of complying with new andevolving regulatory reporting requirements and current or future laws will not exceed our estimates. As described in the regulatory sections above, climate-related compliance risk isincluded in our risk assessments. Currently Dover is not subject to country or regional cap and trade or other climate-related regulation. Dover was not subject to any climate-relatedlitigation claims in 2019.
Market Relevant,alwaysincluded
Dover is constantly assessing shifts in supply and demand for certain commodities, products, and services. We are committed to creating economic value for shareholders by developingproducts designed to help our customers meet their sustainability goals in response to evolving regulatory and environmental standards. We believe that sustainability-driven innovationpresents a significant growth opportunity while contributing positively to enhanced resource efficiency and reduced waste. In that regard, we have accelerated our efforts and processesaround innovation, focusing on technologies that create tangible value for our customers. Each of Dover’s segments is dedicated to this important initiative. In our Refrigeration & FoodEquipment segment, SWEP, a manufacturer of brazed plate heat exchangers, focuses on opportunities created by the conversion to sustainable and renewable energy usage in heattransfer. Brazed plate heat exchangers (BPHEs) by SWEP are specifically designed to maximize heating and cooling performance while simultaneously minimizing energy loss. SWEP’sBPHEs are extremely compact compared with other technologies. In addition, BPHEs have a smaller carbon footprint, are significantly smaller and lighter than other technologies such asshell and tube and, more importantly, are more efficient. Over the last 7 years, Markem-Imaje, a marking and coding business within Dover’s Engineered Systems segment, has reducedits carbon emissions by 40% and produced 18% less waste by implementing an Environmental, Health and Safety program. Lastly, in Dover’s Fluids segment, OPW, provide fuel solutionsfor lower-carbon alternative fuels, such as compressed natural gas (CNG) and fueling solutions. Our Dover Fueling Solutions business provides charging stations for Electric Vehicles(EVs) via partnerships with ABB in Europe and with ChargePoint in North America. Providing charging stations for EVs, as well as other alternative clean fueling solutions, creates anopportunity to reduce GHGs from transportation. We continue to prioritized innovation and research and development activities; our R&D spend in 2019 represented 2% of our annualrevenue, an increase over our five-year average R&D spend of 1.7% of revenue.
Reputation Relevant,alwaysincluded
The Company's entrepreneurial business model encourages, promotes and fosters deep customer engagement and collaboration, which has led to Dover's well-established and valuedreputation for providing superior customer service and industry-leading product innovation. The success of new and improved products, digital solutions and support services depends ontheir initial and continued acceptance by our customers. Certain of our businesses sell in industries that are characterized by rapid technological changes, frequent new productintroductions, changing industry standards and corresponding shifts in customer demand, which may result in unpredictable product transitions, shortened life cycles and increasedimportance of being first to market. Failure to correctly identify and predict customer needs and preferences, to deliver high quality, innovative and competitive products to the market, toadequately protect our intellectual property rights or to acquire rights to third-party technologies and to stimulate customer demand for, and convince customers to adopt, new products,digital solutions and support services could adversely affect our consolidated results of operations, financial condition and cash flows.
Acutephysical
Relevant,alwaysincluded
While Dover has a global portfolio, approximately 75% of Dover's facilities are located in the US and Europe. Risk analysis indicates potential impacts in low lying areas with specific highrisk sites identified. Dover incorporates physical risk analysis into business continuity planning. Physical risks are assessed annually, particularly around extreme weather events likehurricanes and floods. We work with our insurers to identify potential acute risks to our assets. We have incorporated mitigation measures through our business continuity plans to protectpeople, property, and assets from disruptions that may be posed by the physical impacts of climate change such as flooding from sea-level rise and increased incidence and strength ofstorms. These plans help us prepare in the event of a catastrophic event and will help ensure timely recovery of business operations. Based on Dover’s focus sites, key locations wherephysical impacts are potentially highest include: North America: California, Great Lakes, SE and NE Coastline Asia: SE Asia and East Asia, especially Malaysia and China Europe:Northern Europe, especially the UK sites Based on the current predictions associated with the physical impacts of climate change, the principle risks are flooding from sea-level rise,inundation events at the margin of rivers and estuaries, flash flooding, increased incidence and strength of storms and in some cases, drought and heat waves. However, based on theability of the developed world to adapt more quickly and extensively to major climate shocks, there will likely be a higher risk factor associated with climatic events in developing countries.In this context, the high concentration of Dover’s larger and more asset-rich facilities in the US and Europe would likely help to reduce possible physical risks associated with climatechange going forward.
Chronicphysical
Relevant,alwaysincluded
While Dover has a global portfolio, approximately 75% of Dover's facilities are located in the US and Europe. Risk analysis indicates potential impacts in low lying areas with specific highrisk sites identified. Dover incorporates physical risk analysis into business continuity planning. Direct and indirect chronic physical risks such as droughts and wildfires are assessedannually. For example, in 2019, our Sylmar site in California was identified as high risk with respect to wildfires. Our risk management process enabled the site to receive early warning andutilize our business continuity plans (mitigation/evacuation plans) to prepare the site. There were no impacts to the site from wildfires. Our businesses have business continuity plans toprotect people, property, and assets, prepare for any catastrophic events, and ensure timely recovery of business operations. Based on the current predictions associated with thephysical impacts of climate change, the principle risks are flooding from sea-level rise, direct and indirect impacts from drought and heat waves. However, based on the ability of thedeveloped world to adapt more quickly and extensively to major climate shocks, there will likely be a higher risk factor associated with climatic events in developing countries. In thiscontext, the high concentration of Dover’s larger and more asset-rich facilities in the US and Europe would likely help to reduce possible physical risks associated with climate change goingforward.
C2.3
(C2.3) Have you identified any inherent climate-related risks with the potential to have a substantive financial or strategic impact on your business?Yes
CDP Page of 416

C2.3a
(C2.3a) Provide details of risks identified with the potential to have a substantive financial or strategic impact on your business.
IdentifierRisk 1
Where in the value chain does the risk driver occur?Upstream
Risk type & Primary climate-related risk driver
Emerging regulation Carbon pricing mechanisms
Primary potential financial impactIncreased direct costs
Climate risk type mapped to traditional financial services industry risk classification<Not Applicable>
Company-specific descriptionIncreased pricing of GHG emissions could potentially result in increased costs for compliance for our businesses. Our businesses’ domestic and international sales andoperations are subject to risks associated with changes in laws, regulators and policies, including carbon emission regulations and energy efficiency and designregulations. Failure to comply with any of the foregoing could result in civil and criminal, monetary and non-monetary penalties as well as potential damage to ourreputation. An example of an emerging carbon pricing mechanism is the EU Green Deal and other emerging carbon tax or ETS schemes. Our current facilities in the EUaccount for approximately 6% of our total Scope 1 and 2 emissions. We cannot provide assurance that our costs of complying with new and evolving regulatory reportingrequirements and current or future laws will not exceed our estimates.
Time horizonLong-term
LikelihoodMore likely than not
Magnitude of impactLow
Are you able to provide a potential financial impact figure?Yes, a single figure estimate
Potential financial impact figure (currency)4000000
Potential financial impact figure – minimum (currency)<Not Applicable>
Potential financial impact figure – maximum (currency)<Not Applicable>
Explanation of financial impact figureAn average carbon price of $20 per metric tonne over the next 10-30 years, conservatively applied to all of Dover's Scope 2 emissions, could result in additional utility costsof $4 million annually. This is less than 0.1% of Dover’s annual revenue in 2019.
Cost of response to risk0
Description of response and explanation of cost calculationDover tracks regulatory updates and evaluates potential risk for increased costs in high risk areas due to climate legislation or taxes. We attempt to control such coststhrough fixed-price contracts with suppliers and various other programs, such as our global supply chain activities.
CommentThere are no costs associated with regulatory tracking or supply chain activities; these are part of normal business activities.
IdentifierRisk 2
Where in the value chain does the risk driver occur?Upstream
Risk type & Primary climate-related risk driver
Market Increased cost of raw materials
Primary potential financial impactOther, please specify (Increased production costs due to changing input prices (e.g., energy, water) and output requirements (e.g., waste treatment))
Climate risk type mapped to traditional financial services industry risk classification<Not Applicable>
Company-specific descriptionWe could lose customers or generate lower revenue, operating profits and cash flows if there are significant increases in the cost of raw materials (including energy) or if weare unable to obtain raw materials. We purchase raw materials, sub-assemblies and components for use in our manufacturing operations, which expose us to volatility inprices for certain commodities. Significant price increases for these commodities could adversely affect operating profits for certain of our businesses. For example, an
CDP Page of 417

increase of 1% in the cost of goods and services would result in a decrease in revenue of $4.43 million. While we generally attempt to mitigate the impact of increased rawmaterial prices by hedging or passing along the increased costs to customers, there may be a time delay between the increased raw material prices and the ability toincrease the prices of products, or we may be unable to increase the prices of products due to a competitor’s pricing pressure or other factors. In addition, while rawmaterials are generally available now, the inability to obtain necessary raw materials could affect our ability to meet customer commitments and satisfy market demand forcertain products. Consequently, a significant price increase in raw materials, or their unavailability, may result in a loss of customers and adversely impact our consolidatedresults of operations, financial condition and cash flows.
Time horizonMedium-term
LikelihoodAbout as likely as not
Magnitude of impactLow
Are you able to provide a potential financial impact figure?Yes, a single figure estimate
Potential financial impact figure (currency)4430000
Potential financial impact figure – minimum (currency)<Not Applicable>
Potential financial impact figure – maximum (currency)<Not Applicable>
Explanation of financial impact figureThe potential financial impact of supply chain interruption is provided as an order of magnitude estimate based on a percent of Dover's overall cost of goods and services. In2019, the cost of goods and services equated to more than 63% of our gross revenue or $4.5 billion. An increase of 1% in the cost of goods and services would result in adecrease in revenue of $4.43 million. The actual financial impact due to a supply chain interruption could be higher or lower.
Cost of response to risk0
Description of response and explanation of cost calculationWe use a wide variety of raw materials, primarily metals and semi-processed or finished components, which are generally available from a number of sources. As a result,shortages or the loss of any single supplier have not had, and are not likely to have, a material impact on operating profits. While the required raw materials are generallyavailable, commodity pricing can be volatile, particularly for various grades of steel, copper, and select other commodities. Although cost increases in commodities may berecovered through increased prices to customers, our operating results are exposed to such fluctuations. We attempt to control such costs through fixed-price contractswith suppliers and various other programs, such as our global supply chain activities.
CommentThere are no costs associated with supply chain activities; these are part of normal business activities.
IdentifierRisk 3
Where in the value chain does the risk driver occur?Direct operations
Risk type & Primary climate-related risk driver
Technology Unsuccessful investment in new technologies
Primary potential financial impactDecreased revenues due to reduced demand for products and services
Climate risk type mapped to traditional financial services industry risk classification<Not Applicable>
Company-specific descriptionOur operating results depend in part on the timely development and commercialization, and customer acceptance, of new and enhanced products and services based ontechnological innovation. The success of new and improved products, digital solutions and support services depends on their initial and continued acceptance by ourcustomers. Certain of our businesses sell in industries that are characterized by rapid technological changes, frequent new product introductions, changing industrystandards and corresponding shifts in customer demand, which may result in unpredictable product transitions, shortened life cycles and increased importance of being firstto market. For example, many of our operating companies are directly involved in industries that will likely be impacted by climate change policy and the associatedpotential for a transition to a low carbon economy, such as environmental and waste management, retail fueling, refrigeration and food equipment, packaging, and printing.Failure to correctly identify and predict customer needs and preferences, to deliver high quality, innovative and competitive products to the market, to adequately protect ourintellectual property rights or to acquire rights to third-party technologies and to stimulate customer demand for, and convince customers to adopt, new products andservices could adversely affect our consolidated results of operations, financial condition and cash flows. In addition, we may experience difficulties or delays in theresearch, development, production and/or marketing of new products, digital solutions and support services which may prevent us from recouping or realizing a return onthe investments required to continue to bring new products and services to market.
Time horizonMedium-term
LikelihoodAbout as likely as not
Magnitude of impactMedium-low
Are you able to provide a potential financial impact figure?Yes, a single figure estimate
CDP Page of 418
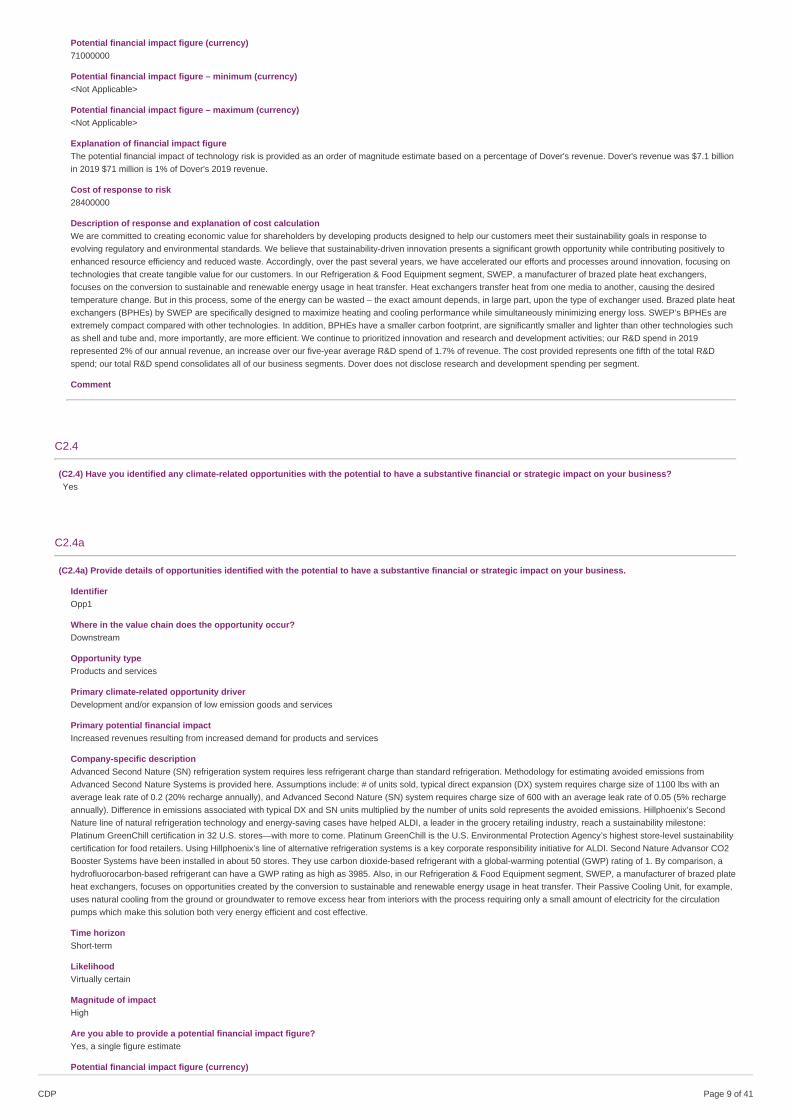
Potential financial impact figure (currency)71000000
Potential financial impact figure – minimum (currency)<Not Applicable>
Potential financial impact figure – maximum (currency)<Not Applicable>
Explanation of financial impact figureThe potential financial impact of technology risk is provided as an order of magnitude estimate based on a percentage of Dover's revenue. Dover's revenue was $7.1 billionin 2019 $71 million is 1% of Dover's 2019 revenue.
Cost of response to risk28400000
Description of response and explanation of cost calculationWe are committed to creating economic value for shareholders by developing products designed to help our customers meet their sustainability goals in response toevolving regulatory and environmental standards. We believe that sustainability-driven innovation presents a significant growth opportunity while contributing positively toenhanced resource efficiency and reduced waste. Accordingly, over the past several years, we have accelerated our efforts and processes around innovation, focusing ontechnologies that create tangible value for our customers. In our Refrigeration & Food Equipment segment, SWEP, a manufacturer of brazed plate heat exchangers,focuses on the conversion to sustainable and renewable energy usage in heat transfer. Heat exchangers transfer heat from one media to another, causing the desiredtemperature change. But in this process, some of the energy can be wasted – the exact amount depends, in large part, upon the type of exchanger used. Brazed plate heatexchangers (BPHEs) by SWEP are specifically designed to maximize heating and cooling performance while simultaneously minimizing energy loss. SWEP’s BPHEs areextremely compact compared with other technologies. In addition, BPHEs have a smaller carbon footprint, are significantly smaller and lighter than other technologies suchas shell and tube and, more importantly, are more efficient. We continue to prioritized innovation and research and development activities; our R&D spend in 2019represented 2% of our annual revenue, an increase over our five-year average R&D spend of 1.7% of revenue. The cost provided represents one fifth of the total R&Dspend; our total R&D spend consolidates all of our business segments. Dover does not disclose research and development spending per segment.
Comment
C2.4
(C2.4) Have you identified any climate-related opportunities with the potential to have a substantive financial or strategic impact on your business?Yes
C2.4a
(C2.4a) Provide details of opportunities identified with the potential to have a substantive financial or strategic impact on your business.
IdentifierOpp1
Where in the value chain does the opportunity occur?Downstream
Opportunity typeProducts and services
Primary climate-related opportunity driverDevelopment and/or expansion of low emission goods and services
Primary potential financial impactIncreased revenues resulting from increased demand for products and services
Company-specific descriptionAdvanced Second Nature (SN) refrigeration system requires less refrigerant charge than standard refrigeration. Methodology for estimating avoided emissions fromAdvanced Second Nature Systems is provided here. Assumptions include: # of units sold, typical direct expansion (DX) system requires charge size of 1100 lbs with anaverage leak rate of 0.2 (20% recharge annually), and Advanced Second Nature (SN) system requires charge size of 600 with an average leak rate of 0.05 (5% rechargeannually). Difference in emissions associated with typical DX and SN units multiplied by the number of units sold represents the avoided emissions. Hillphoenix’s SecondNature line of natural refrigeration technology and energy-saving cases have helped ALDI, a leader in the grocery retailing industry, reach a sustainability milestone:Platinum GreenChill certification in 32 U.S. stores—with more to come. Platinum GreenChill is the U.S. Environmental Protection Agency’s highest store-level sustainabilitycertification for food retailers. Using Hillphoenix’s line of alternative refrigeration systems is a key corporate responsibility initiative for ALDI. Second Nature Advansor CO2Booster Systems have been installed in about 50 stores. They use carbon dioxide-based refrigerant with a global-warming potential (GWP) rating of 1. By comparison, ahydrofluorocarbon-based refrigerant can have a GWP rating as high as 3985. Also, in our Refrigeration & Food Equipment segment, SWEP, a manufacturer of brazed plateheat exchangers, focuses on opportunities created by the conversion to sustainable and renewable energy usage in heat transfer. Their Passive Cooling Unit, for example,uses natural cooling from the ground or groundwater to remove excess hear from interiors with the process requiring only a small amount of electricity for the circulationpumps which make this solution both very energy efficient and cost effective.
Time horizonShort-term
LikelihoodVirtually certain
Magnitude of impactHigh
Are you able to provide a potential financial impact figure?Yes, a single figure estimate
Potential financial impact figure (currency)
CDP Page of 419

71000000
Potential financial impact figure – minimum (currency)<Not Applicable>
Potential financial impact figure – maximum (currency)<Not Applicable>
Explanation of financial impact figureThe potential financial impact of low-carbon product opportunities is provided as an order of magnitude estimate based on a percentage of Dover's revenue. Dover'srevenue was $7.1 billion in 2018. $71 million is 1% of Dover's 2019 revenue. The actual revenue could be higher or lower.
Cost to realize opportunity28400000
Strategy to realize opportunity and explanation of cost calculationDover is committed to creating economic value for shareholders by developing products designed to help customers meet their sustainability goals in response to evolvingregulatory and environmental standards. We believe that sustainability-driven innovation presents a significant growth opportunity while contributing positively to enhancedresource efficiency and reduced waste. Accordingly, over the past several years, we have accelerated our efforts and processes around innovation, focusing ontechnologies that create tangible value for our customers. In our Refrigeration & Food Equipment segment, SWEP, a manufacturer of brazed plate heat exchangers,focuses on opportunities created by the conversion to sustainable and renewable energy usage in heat transfer. Their Passive Cooling Unit, for example, uses naturalcooling from the ground or groundwater to remove excess heat from interiors with the process requiring only a small amount of electricity for the circulation pumps whichmake this solution both very energy efficient and cost effective. SWEP Brazed plate heat exchanges are extremely compact and have a smaller carbon footprint comparedwith other technologies such as shell and tube. We continue to prioritized innovation and research and development activities; our R&D spend in 2019 represented 2% ofour annual revenue, an increase over our five-year average R&D spend of 1.7% of revenue. The cost provided represents one fifth of the total R&D spend; our total R&Dspend consolidates all of our business segments. Dover does not disclose research and development spending per segment.
Comment
IdentifierOpp2
Where in the value chain does the opportunity occur?Downstream
Opportunity typeProducts and services
Primary climate-related opportunity driverDevelopment of new products or services through R&D and innovation
Primary potential financial impactIncreased revenues resulting from increased demand for products and services
Company-specific descriptionHydro Systems’ proportioning, dosing and dispensing solutions contribute to the long-term well-being of people and the environment. Its products are used to accuratelydilute and/or dispense concentrated cleaning chemicals so they can be safely and effectively used in commercial cleaning applications, such as: food service, health care,supermarket, institutional, school, building service contractor, and industrial markets. Hydro's products promote environmental-responsibility, cost control, worker safety,proper chemical performance - especially important in bacteria-control areas like retail-food and health care. The innovative EvoClean dispenser is the world’s first venturi-based (the reduction in fluid pressure that results when a fluid flows through a constricted section of a pipe), water-powered dispenser for on-premise laundry applications.Unlike other laundry dispensers, EvoClean does not require squeeze tubes driving dramatic reductions in service parts and maintenance costs. Its delivery performance isprecise, and it will not under-dose chemicals. This gives laundries, less downtime, less re-wash and more predictable, clean results with every wash. Hydro’s EvoClean is50% lighter than other traditional peristaltic pumps, leading to simplified installation and maintenance. The system is available in four, six and eight product configurationsfor two-flow rates. Users can even access reports that provide valuable data on product usage, costs per formula and more through the controller saving even more moneyand resources. Additional Sustainability Benefits include: Reduced Energy Consumption EvoClean uses 85% less energy than traditional laundry dispensers, because itdoes not use AC or DC motors. This equates to 38 kWh saved per year. Example Savings Calculation for Chemical Companies 9,000 locations x 2 dispensers average perlocation = 18,000 total EvoClean units 38 kWH x 18,000 units = 684,000 kWh /year.
Time horizonShort-term
LikelihoodVirtually certain
Magnitude of impactHigh
Are you able to provide a potential financial impact figure?Yes, a single figure estimate
Potential financial impact figure (currency)71000000
Potential financial impact figure – minimum (currency)<Not Applicable>
Potential financial impact figure – maximum (currency)<Not Applicable>
Explanation of financial impact figureThe potential financial impact of low-carbon product opportunities is provided as an order of magnitude estimate based on a percentage of Dover's revenue. Dover'srevenue was $7.1 billion in 2018. $71 million is 1% of Dover's 2019 revenue. The actual revenue could be higher or lower.
Cost to realize opportunity28400000
Strategy to realize opportunity and explanation of cost calculationDover is committed to creating economic value for shareholders by developing products designed to help customers meet their sustainability goals in response to evolving
CDP Page of 4110

regulatory and environmental standards. We believe that sustainability-driven innovation presents a significant growth opportunity while contributing positively to enhancedresource efficiency and reduced waste. Accordingly, over the past several years, we have accelerated our efforts and processes around innovation, focusing ontechnologies that create tangible value for our customers. We continue to prioritized innovation and research and development activities; our R&D spend in 2019represented 2% of our annual revenue, an increase over our five-year average R&D spend of 1.7% of revenue. SWEP Brazed plate heat exchanges are extremely compactand have a smaller carbon footprint compared with other technologies such as shell and tube. The cost provided represents one fifth of the total R&D spend; our total R&Dspend consolidates all of our business segments. Dover does not disclose research and development spending per segment.
Comment
IdentifierOpp3
Where in the value chain does the opportunity occur?Downstream
Opportunity typeProducts and services
Primary climate-related opportunity driverDevelopment and/or expansion of low emission goods and services
Primary potential financial impactIncreased revenues resulting from increased demand for products and services
Company-specific descriptionBelvac machinery and manufacturing technologies lead the world in the reduction of aluminum usage in beverage containers making more cans and bottles with less metalwhile maintaining strength and durability. In addition to the reduction in overall global aluminum usage, Belvac’s light weighting efforts in aluminum beverage containersmake them more affordable and, in turn, they displace more of the usage of glass containers which have a significantly less successful recycling processes. Aluminum is100% recyclable and has the highest recycling rates. A twelve-ounce aluminum can has approximately 45% lower associated emissions than a twelve-ounce glass bottleand 49% lower associated emissions than a twenty-ounce plastic bottle.
Time horizonShort-term
LikelihoodVirtually certain
Magnitude of impactHigh
Are you able to provide a potential financial impact figure?Yes, a single figure estimate
Potential financial impact figure (currency)71000000
Potential financial impact figure – minimum (currency)<Not Applicable>
Potential financial impact figure – maximum (currency)<Not Applicable>
Explanation of financial impact figureThe potential financial impact of low-carbon product opportunities is provided as an order of magnitude estimate based on a percentage of Dover's revenue. Dover'srevenue was $7.1 billion in 2018. $71 million is 1% of Dover's 2019 revenue. The actual revenue could be higher or lower.
Cost to realize opportunity28400000
Strategy to realize opportunity and explanation of cost calculationDover is committed to creating economic value for shareholders by developing products designed to help customers meet their sustainability goals in response to evolvingregulatory and environmental standards. We believe that sustainability-driven innovation presents a significant growth opportunity while contributing positively to enhancedresource efficiency and reduced waste. Accordingly, over the past several years, we have accelerated our efforts and processes around innovation, focusing ontechnologies that create tangible value for our customers. We continue to prioritized innovation and research and development activities; our R&D spend in 2019represented 2% of our annual revenue, an increase over our five-year average R&D spend of 1.7% of revenue. SWEP Brazed plate heat exchanges are extremely compactand have a smaller carbon footprint compared with other technologies such as shell and tube. The cost provided represents one fifth of the total R&D spend; our total R&Dspend consolidates all of our business segments. Dover does not disclose research and development spending per segment.
Comment
C3. Business Strategy
C3.1
(C3.1) Have climate-related risks and opportunities influenced your organization’s strategy and/or financial planning?Yes
C3.1a
CDP Page of 4111

(C3.1a) Does your organization use climate-related scenario analysis to inform its strategy?No, but we anticipate using qualitative and/or quantitative analysis in the next two years
C3.1c
(C3.1c) Why does your organization not use climate-related scenario analysis to inform its strategy?
We recognize the recommendations set forth by the Task Force on Climate-related Financial Disclosures (TCFD) are an important framework to consider climate risks andopportunities. During our recent sustainability materiality assessment, to refresh the climate change materiality analysis performed in 2010, we consulted with key membersof management to identify potential climate-related risks and opportunities for our company. Through this process, we identified several risks and opportunities, and mitigationand capitalization measures our businesses have in place and future analyses we plan on conducting.
We are considering conducting a gap analysis to evaluate our existing programs and processes relative to the TCFD recommendations in the future.
C3.1d
(C3.1d) Describe where and how climate-related risks and opportunities have influenced your strategy.
Have climate-related risksandopportunitiesinfluencedyour strategyin this area?
Description of influence
Productsandservices
Yes Many of our operating companies are directly involved in industries that will likely be impacted by climate change policy and the associated potential for a transition to a low carboneconomy, such as environmental and waste management, retail fueling, refrigeration and food equipment, packaging, and printing. A central part of our sustainability efforts is to enableour customers to reduce waste, energy, and to achieve their sustainability goals through our innovative and sustainable products. As demand is expected to grow for these productsand services in the future, we anticipate significant opportunities to provide the solutions our customers depend on. For example, ice rinks across North America look to Hillphoenix tohelp “future proof” their facilities by moving to industrial refrigeration solutions with natural refrigerants. Our Advansor Direct Transcritical CO2 system for ice rinks delivers superiorperformance - improved ice quality and pump power savings of up to 90% - compared to traditional systems. HCFC-22 is frequently used as a refrigerant in ice rinks. In January, 2020,U.S. production and import of HCFC-22 ended due to the phase out of ozone depleting substances under the Montreal Protocol. Ice rinks across North America will be looking foropportunities to “future proof” their facilities by moving to natural refrigerants. CO2 is an entirely nontoxic, environmentally friendly refrigerant with excellent heat-transfer capabilities thatmeets every international refrigerant requirement for today and tomorrow. Plus, it’s a fraction of the price of traditional refrigerants. Within retail refrigeration, we are focused on providingsolutions to our customers that deliver energy efficiency and technology to enable them to effectively merchandise fresh and prepared food to help drive revenue and reduce costs. Thisis a key differentiator, as food retailers continue to focus on managing operating costs while also creating ways to distinguish themselves in their markets to drive growth. Among trendswe see, many retailers are aggressively investing in closed-door refrigeration cases, energy-efficiency systems and specialized display cases. We hold a strong position in thesecategories and will continue to benefit as these trends continue.
Supplychainand/orvaluechain
No We use a wide variety of raw materials, primarily metals and semi-processed or finished components, which are generally available from a number of sources. As a result, shortages orthe loss of any single supplier have not had, and are not likely to have, a material impact on operating profits. While the required raw materials are generally available, commoditypricing can be volatile, particularly for various grades of steel, copper, aluminum and select other commodities. Although cost increases in commodities may be recovered throughincreased prices to customers, our operating results are exposed to such fluctuations. We attempt to control such costs through fixed-price contracts with suppliers and various otherprograms, such as our global supply chain activities.
Investmentin R&D
Yes Dover is committed to creating economic value for shareholders by developing products designed to help customers meet their sustainability goals in response to evolving regulatoryand environmental standards. We believe that sustainability-driven innovation presents a significant growth opportunity while contributing positively to enhanced resource efficiency andreduced waste. Accordingly, over the past several years, we have accelerated our efforts and processes around innovation, focusing on technologies that create tangible value for ourcustomers. In 2019, R&D spend, including qualifying engineering costs, represented 2% of our annual revenue, which was a 30 basis point increase over our previous five-year averageR&D spend of 1.7% of annual revenue. We increased our R&D spend partly in response to customer needs for more efficient, safer, and sustainable products. Ultimately, we view R&Das critical to maintaining the long-term growth and competitiveness of our offerings in the marketplace in a world with an ever-increasing demand for more sustainable solutions. Anexample of our sustainable products include, our Refrigeration & Food Equipment segment, SWEP, which manufactures brazed plate heat exchangers, focuses on opportunities createdby the conversion to sustainable and renewable energy usage in heat transfer. Their Passive Cooling Unit, for example, uses natural cooling from the ground or groundwater to removeexcess heat from interiors with the process requiring only a small amount of electricity for the circulation pumps which make this solution both very energy efficient and cost effective.
Operations No We are aware of a number of existing or upcoming regulatory initiatives intended to reduce emissions in geographies where our manufacturing and warehouse/distribution facilities arelocated and have evaluated the potential impact of these regulations on our businesses. We anticipate that direct impacts from regulatory actions will not be significant in the short- tomedium-term. We expect the regulatory impacts associated with climate change regulation would be primarily indirect and would result in "pass through" costs from energy suppliers,suppliers of raw materials and other services related to our operations. As an example of an indirect impact, the EU Emissions Trading System covers large emitters, many of whichprovide power or raw materials to Dover. As the cost for EU Allowances goes up for these large emitters, the pass through costs may rise.
C3.1e
CDP Page of 4112

(C3.1e) Describe where and how climate-related risks and opportunities have influenced your financial planning.
Financialplanningelementsthat havebeeninfluenced
Description of influence
Row1
RevenuesAcquisitionsanddivestments
Revenues: Dover’s five business segments are focused on building enduring competitive advantages and leadership positions in markets that we believe are positioned for sustained futuregrowth. We believe that our businesses are among the top suppliers in most markets and niches that we serve (as defined by customer applications, geographies or products), which positions uswell to capture future growth. We capitalize on our engineering, technology and design expertise and maintain an intense focus on meeting the needs of our customers and adding significant,and often new, value to their operations through superior product performance, safety and reliability and a commitment to aftermarket support. We cultivate and maintain an entrepreneurialculture and continuously innovate to address our customers’ needs to help them win in the markets they serve. In particular, our businesses are well-positioned to capitalize on growing industrialmanufacturing and trade volumes, adoption of digital technologies, increasing requirements for sustainability, safety, energy efficiency and consumer product safety, and growth of the middleclass and consumption in emerging economies. Many of our operating companies are directly involved in industries that will likely be impacted by climate change policy and associated potentialfor a transition to a low carbon economy, such as environmental and waste management, retail refueling, refrigeration and food equipment, and packaging and printing. A central part of oursustainability efforts is to enable our customers to reduce waste, energy, and to achieve their sustainability goals through our innovative and sustainable products. As demand is expected togrow for these products and services in the future, we anticipate significant opportunities to provide the solutions our customers depend on. For the year ended December 31, 2019, Doverrevenue from continuing operations was $7.1 billion, an increase of $0.1 billion compared with the prior year. This increase included organic growth of 3.8% and acquisition-related growth of 0.8%partially offset by a 2.5% impact from foreign currency translation of 2.0% and 0.5% impact dispositions. Our Engineered Products segment is capitalizing on secular growth in waste generationand increasing sophistication and automation of waste collection operations, increasing car parc, car age and miles driven, as well as increasing digitization and sensorization of modernvehicles. The Engineered Products segment revenue for the year ended December 31, 2019 was $1.7 billion, an increase of $64.4 million, or 3.9% compared to the prior year. EnvironmentalSolutions Group, within our Engineered Products Segment, includes Marathon Equipment. Marathon offers a complete line of revolutionary GreenBuilt trash compactors. Because GreenBuiltsolutions get their power from solar panels, expenses associated with power installation and electrical charges are essentially eliminated. The units also utilize biodegradable oil and hydraulicfluids to help protect the environment. Our Fueling Solutions segment benefits from worldwide growth in safety and compliance regulations, new infrastructure build-out in emerging economies,increased sophistication and digitization of convenience and fuel retailing, as well as a secular growth in automated vehicle wash systems (over manual and do-it-yourself washing). The revenuefor the year ended December 31, 2019 was $1.6 billion, an increase of $154.6 million, or 10.5%, compared to the prior year. The businesses in our Fueling Solutions segment (Dover FuelingSolutions and OPW) offer fueling solutions for low-carbon alternative fuels, such as compressed natural gas (CNG) and hydrogen fueling. We are also exploring liquid natural gas (LNG) fuelingapplications. Our Dover Fueling Solutions business provides charging stations for Electric Vehicles (EVs) via partnerships with ABB in Europe and with ChargePoint in North America. Providingcharging stations for EVs, as well as other alternative clean fueling solutions, creates an opportunity to reduce GHGs from transportation. Our Imaging & Identification segment leverages itsunique product offering containing equipment, consumables, software and services to address market needs and requirements including conversion to digital textile printing, increased demandfor product traceability and brand protection, and consumer product safety. Our Pumps & Process Solutions segment is focused on capturing growth in its installed base and growingsophistication of fluid transfer and rotating machinery components within the chemical, plastics and polymer, industrial, mid and downstream oil & gas, biopharma and hygienic markets as wellas globalizing brands across geographies while expanding sales channels and engineering support. Our Refrigeration & Food Equipment segment is responding to our customers’ demand forincreased energy efficiency and sustainability in food retail merchandising solutions, as well as increasing demand for sustainable heating and cooling solutions and growing global demand foraluminum beverage cans. Acquisitions and divestments: In 2019, we acquired the assets of Belanger, Inc. ("Belanger"), a leading full-line car wash equipment manufacturer for $175 million, netof cash acquired. The acquisition of Belanger strengthens our position in the vehicle wash business within the Fueling Solutions segment. Belanger's smart technology helps optimize water andchemical usage relative to manual washing. We are committed to creating value for our customers through the development of products that help our customers meet their sustainability goals.Our acquisition program has two key elements. As a first priority, we seek to acquire attractive add-on businesses with a strong fit that enhance our existing franchises either by increasing theirreach and customer access, by broadening their product mix or by enhancing technological capability and customer value-add. Second, in the right circumstances, we may strategically pursuelarger, stand-alone businesses that have the potential to either complement our existing businesses or allow us to pursue innovative technologies within our key growth spaces. With all ouracquisitions, we seek businesses that have an accretive margin and a strong organic growth profile, offer significant synergy opportunities and the potential to generate double-digit return oncapital 3-5 years after the acquisition is completed. Our future growth depends in large part on finding and acquiring successful businesses which expand the scope of our offering and make us amore important supplier to our customers. While we expect to generate annual organic growth of 3% to 5% over a long-term business cycle absent extraordinary economic conditions, oursuccess in consistently growing the portfolio is also dependent on the ability to acquire and integrate businesses successfully within our existing structure
C3.1f
CDP Page of 4113
(C3.1f) Provide any additional information on how climate-related risks and opportunities have influenced your strategy and financial planning (optional).
Dover is committed to driving shareholder returns through three key objectives. First, we are committed to achieving organic sales growth above that of gross domesticproduct (or 3% to 5% annually on average) over a long-term business cycle, absent prolonged adverse economic conditions, complemented by growth through strategicacquisitions. Second, we continue to focus on improving returns on capital and segment margins through effective cost management and productivity initiatives, includingsupply chain activities, targeted, thoughtful restructuring activities, strategic pricing and portfolio management. Third, we aim to generate free cash flow as a percentage ofsales of approximately 8-12% through strong earnings performance, productivity improvements and active working capital management. Dover’s value-creation strategy issupported by a financial policy that includes a prudent approach to financial leverage, and a disciplined approach to capital allocation that allows for a balance betweenreinvestment and return of capital to shareholders. We support achievement of these goals by (1) aligning management compensation with financial objectives, (2) executingon well-defined and actively managed merger and acquisition processes and (3) investing in talent development programs. Dover’s three business segments focus onbuilding enduring competitive advantages and leadership positions in end markets that are positioned for future growth. We believe that our businesses are among the topsuppliers in most markets and niches that we serve (as defined by customer applications, geographies or products), which positions us well to capture future growth in suchmarkets. We capitalize on our engineering, technology and design expertise and maintain an intense focus on meeting the needs of our customers and adding significantvalue to their operations through superior product performance, safety and reliability and a commitment to after sales and service support. We cultivate and maintain anentrepreneurial culture and continuously innovate to address our customers’ needs to help them win in the markets they serve. In particular, our businesses are well-positioned to capitalize on growing industrial manufacturing and trade volumes, continuous productivity improvement, adoption of digital technologies and the IndustrialInternet of Things (IIoT), sustainability and safety, energy efficiency, consumer product safety and growth of the middle class and consumption in emerging economies. OurEngineered Systems segment combines its engineering capabilities, unique product advantages and niche applications expertise to address market needs and requirementsincluding conversion to digital textile printing, productivity solutions, sustainability, consumer product safety and growth in emerging economies. For example, MarathonEquipment offers a complete line of revolutionary GreenBuilt trash compactors. Because GreenBuilt solutions get their power from solar panels, expenses associated withpower installation and electrical charges are essentially eliminated. The units also utilize biodegradable oil and hydraulic fluids to help protect the environment. Our Fluidssegment is focused on accelerating growth within the chemical/plastics, retail fueling, fluid transfer, industrial and hygienic markets as well as globalizing brands acrossgeographies while expanding sales channels and engineering support. Specifically, we focus on capturing growth in the retail fueling, hygienic and pharma andpolymers/plastics markets. Our Refrigeration & Food Equipment segment is responding to our customers’ demand for increased energy efficiency and sustainability andunique merchandising solutions with innovative new products. For example, SWEP, a manufacturer of brazed plate heat exchangers, focuses on opportunities created by theconversion to sustainable and renewable energy usage in heat transfer. Their Passive Cooling Unit, for example, uses natural cooling from the ground or groundwater toremove excess hear from interiors with the process requiring only a small amount of electricity for the circulation pumps which make this solution both very energy efficientand cost effective. We aim to grow by making organic investments in research and development, developing new products and technologies, expanding our geographiccoverage, as well as by pursuing disciplined strategic acquisitions that enhance our portfolio and position Dover for long-term growth. We continually evaluate how our assetsand capabilities can position Dover to grow in markets adjacent to our core businesses (for example, new applications, geographies, product segments or adjacenttechnologies) where Dover can be advantaged. ii. Our third goal related to productivity is directly tied to our energy and carbon reduction target. Individual operatingcompanies have productivity goals that include reduction in operating costs and energy efficiency is a primary focus. iii. Our most substantial business decisions made duringthe reporting year that have been influenced by the climate change driven aspects of the strategy include investment and research and development (R&D) related to low-carbon products. All of our operating companies assess the energy and carbon efficiencies related to their operations and the opportunities associated with the use of theirproducts and services by customers on a regular basis to remain competitive. These opportunities have influenced our business strategy related to organic growth. Ourbusinesses invest to develop innovative products as well as to upgrade and improve existing products to satisfy customer needs, expand revenue opportunities domesticallyand internationally, maintain or extend competitive advantages, improve product reliability and reduce production costs. In 2019, R&D spend, including qualifying engineeringcosts, represented 2% of our annual revenue, which was a 30 basis point increase over our previous five-year average R&D spend of 1.7% of annual revenue. We increasedour R&D spend partly in response to customer needs for more efficient, safer, and sustainable products. Ultimately, we view R&D as critical to maintaining the long-termgrowth and competitiveness of our offerings in the marketplace in a world with an ever-increasing demand for more sustainable solutions.
C4. Targets and performance
C4.1
(C4.1) Did you have an emissions target that was active in the reporting year?Intensity target
C4.1b
CDP Page of 4114

(C4.1b) Provide details of your emissions intensity target(s) and progress made against those target(s).
Target reference numberInt 1
Year target was set2010
Target coverageCompany-wide
Scope(s) (or Scope 3 category)Scope 1+2 (location-based)
Intensity metricMetric tons CO2e per unit revenue
Base year2010
Intensity figure in base year (metric tons CO2e per unit of activity)0.0051
% of total base year emissions in selected Scope(s) (or Scope 3 category) covered by this intensity figure100
Target year2020
Targeted reduction from base year (%)20
Intensity figure in target year (metric tons CO2e per unit of activity) [auto-calculated]0.00408
% change anticipated in absolute Scope 1+2 emissions10
% change anticipated in absolute Scope 3 emissions0
Intensity figure in reporting year (metric tons CO2e per unit of activity)0.0048
% of target achieved [auto-calculated]29.4117647058824
Target status in reporting yearUnderway
Is this a science-based target?No, but we anticipate setting one in the next 2 years
Please explain (including target coverage)Revenue and energy usage for acquisitions and divestitures from 2011- 2019 have been added to and removed from the baseline year, respectively.
C4.2
(C4.2) Did you have any other climate-related targets that were active in the reporting year?No other climate-related targets
C4.3
(C4.3) Did you have emissions reduction initiatives that were active within the reporting year? Note that this can include those in the planning and/orimplementation phases.Yes
C4.3a
(C4.3a) Identify the total number of initiatives at each stage of development, and for those in the implementation stages, the estimated CO2e savings.
Number of initiatives Total estimated annual CO2e savings in metric tonnes CO2e (only for rows marked *)
Under investigation 1 2
To be implemented* 1 297
Implementation commenced* 6 17.1
Implemented* 5 747
Not to be implemented 1
CDP Page of 4115

C4.3b
CDP Page of 4116

(C4.3b) Provide details on the initiatives implemented in the reporting year in the table below.
Initiative category & Initiative type
Energy efficiency in buildings Lighting
Estimated annual CO2e savings (metric tonnes CO2e)213
Scope(s)Scope 2 (location-based)
Voluntary/MandatoryVoluntary
Annual monetary savings (unit currency – as specified in C0.4)52900
Investment required (unit currency – as specified in C0.4)154000
Payback period4-10 years
Estimated lifetime of the initiative6-10 years
CommentInvestment amount reflects incentives of $26,788 at our DeStaco facility in Mt. Juliet, TN.
Initiative category & Initiative type
Energy efficiency in buildings Heating, Ventilation and Air Conditioning (HVAC)
Estimated annual CO2e savings (metric tonnes CO2e)466
Scope(s)Scope 2 (location-based)
Voluntary/MandatoryVoluntary
Annual monetary savings (unit currency – as specified in C0.4)98977
Investment required (unit currency – as specified in C0.4)200000
Payback period1-3 years
Estimated lifetime of the initiative11-15 years
Comment
Initiative category & Initiative type
Energy efficiency in buildings Other, please specify (compressed air)
Estimated annual CO2e savings (metric tonnes CO2e)68
Scope(s)Scope 2 (location-based)
Voluntary/MandatoryVoluntary
Annual monetary savings (unit currency – as specified in C0.4)29000
Investment required (unit currency – as specified in C0.4)59500
Payback period1-3 years
Estimated lifetime of the initiative11-15 years
CommentInvestment reflects incentive of $18,500 at our PSG facility in Grand Rapids, Michigan.
CDP Page of 4117

C4.3c
(C4.3c) What methods do you use to drive investment in emissions reduction activities?
Method Comment
Employee engagement Our employees are constantly motivated to identify energy savings initiatives. Since 2011, Dover has realized more than 900 Mwh in energy savings from low to no cost behavioralprograms.
Financial optimizationcalculations
Individual operating companies have pursued projects with favorable return on investment.
C4.5
(C4.5) Do you classify any of your existing goods and/or services as low-carbon products or do they enable a third party to avoid GHG emissions?Yes
C4.5a
(C4.5a) Provide details of your products and/or services that you classify as low-carbon products or that enable a third party to avoid GHG emissions.
Level of aggregationProduct
Description of product/Group of productsHillphoenix’s Advanced Second Nature (SN) refrigeration system requires less refrigerant charge than standard refrigeration systems due to a smaller charge and lowerleak rate. Methodology for estimating avoided emissions from Advanced Second Nature Systems is provided here. Assumptions include: # of units sold, typical directexpansion (DX) system requires charge size of 1100 lbs with an average leak rate of 0.2 (20% recharge annually), and Advanced Second Nature (SN) system requirescharge size of 600 with an average leak rate of 0.05 (5% recharge annually). Difference in emissions associated with typical DX and SN units multiplied by the number ofunits sold represents the avoided emissions. Hillphoenix’s Second Nature line of natural refrigeration technology and energy-saving cases have helped ALDI, a leader inthe grocery retailing industry, reach a sustainability milestone: Platinum GreenChill certification in 32 U.S. stores—with more to come. Platinum GreenChill is the U.S.Environmental Protection Agency’s highest store-level sustainability certification for food retailers. Using Hillphoenix’s line of alternative refrigeration systems is a keycorporate responsibility initiative for ALDI. Second Nature Advansor CO2 Booster Systems have been installed in about 50 stores. They use carbon dioxide-basedrefrigerant with a global-warming potential (GWP) rating of 1. By comparison, a hydrofluorocarbon-based refrigerant can have a GWP rating as high as 3985.
Are these low-carbon product(s) or do they enable avoided emissions?Avoided emissions
Taxonomy, project or methodology used to classify product(s) as low-carbon or to calculate avoided emissionsOther, please specify (Technology- specific calculations )
% revenue from low carbon product(s) in the reporting year9
% of total portfolio value<Not Applicable>
Asset classes/ product types<Not Applicable>
CommentMethodology for estimating avoided emissions from Advanced Second Nature Systems is provided here. Assumptions include: # of units sold, typical direct expansion (DX)system requires charge size of 1100 lbs with an average leak rate of 0.2 (20% recharge annually), and Advanced Second Nature (SN) system requires charge size of 600with an average leak rate of 0.05 (5% recharge annually). Difference in emissions associated with typical DX and SN units multiplied by the number of units sold representsthe avoided emissions. Hillphoenix’s Second Nature line of natural refrigeration technology and energy-saving cases have helped ALDI, a leader in the grocery retailingindustry, reach a sustainability milestone: Platinum GreenChill certification in 32 U.S. stores—with more to come. Platinum GreenChill is the U.S. Environmental ProtectionAgency’s highest store-level sustainability certification for food retailers. Using Hillphoenix’s line of alternative refrigeration systems is a key corporate responsibility initiativefor ALDI. Second Nature Advansor CO2 Booster Systems have been installed in about 50 stores. They use carbon dioxide-based refrigerant with a global-warmingpotential (GWP) rating of 1. By comparison, a hydrofluorocarbon-based refrigerant can have a GWP rating as high as 3985. Dover's Refrigeration and Equipment Segmentrepresented 20% of Dover's overall revenue in 2019, or $1.4 billion. While Dover does not disclose revenue by product, for the purposes of this disclosure, it is assumedthat half of the Refrigeration and Equipment Segment revenue is related to low-carbon products, or 8.5 or 9% of revenue. This percentage is presented as indicative of theorder of magnitude of low-carbon product revenue associated with the refrigeration business and is not the actual revenue. The actual revenue could be higher or lower.
C5. Emissions methodology
C5.1
CDP Page of 4118
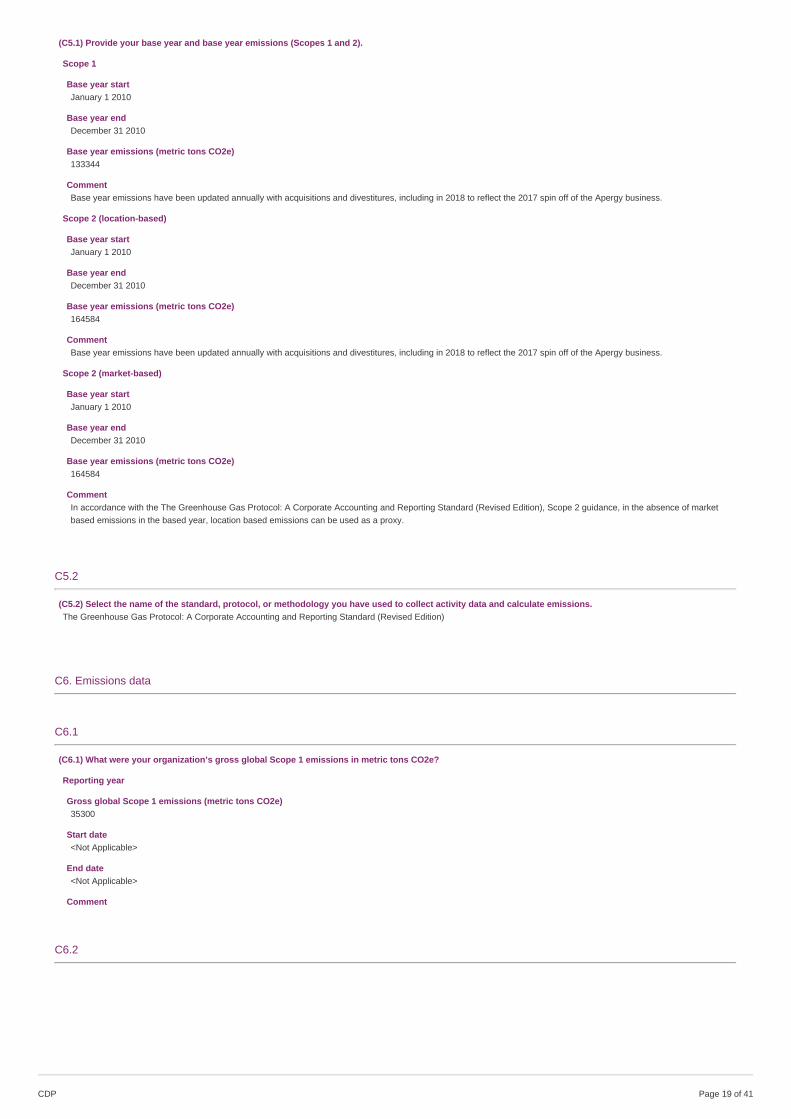
(C5.1) Provide your base year and base year emissions (Scopes 1 and 2).
Scope 1
Base year startJanuary 1 2010
Base year endDecember 31 2010
Base year emissions (metric tons CO2e)133344
CommentBase year emissions have been updated annually with acquisitions and divestitures, including in 2018 to reflect the 2017 spin off of the Apergy business.
Scope 2 (location-based)
Base year startJanuary 1 2010
Base year endDecember 31 2010
Base year emissions (metric tons CO2e)164584
CommentBase year emissions have been updated annually with acquisitions and divestitures, including in 2018 to reflect the 2017 spin off of the Apergy business.
Scope 2 (market-based)
Base year startJanuary 1 2010
Base year endDecember 31 2010
Base year emissions (metric tons CO2e)164584
CommentIn accordance with the The Greenhouse Gas Protocol: A Corporate Accounting and Reporting Standard (Revised Edition), Scope 2 guidance, in the absence of marketbased emissions in the based year, location based emissions can be used as a proxy.
C5.2
(C5.2) Select the name of the standard, protocol, or methodology you have used to collect activity data and calculate emissions.The Greenhouse Gas Protocol: A Corporate Accounting and Reporting Standard (Revised Edition)
C6. Emissions data
C6.1
(C6.1) What were your organization’s gross global Scope 1 emissions in metric tons CO2e?
Reporting year
Gross global Scope 1 emissions (metric tons CO2e)35300
Start date<Not Applicable>
End date<Not Applicable>
Comment
C6.2
CDP Page of 4119

(C6.2) Describe your organization’s approach to reporting Scope 2 emissions.
Row 1
Scope 2, location-based We are reporting a Scope 2, location-based figure
Scope 2, market-basedWe have operations where we are able to access electricity supplier emission factors or residual emissions factors, but are unable to report a Scope 2, market-based figure
Comment
C6.3
(C6.3) What were your organization’s gross global Scope 2 emissions in metric tons CO2e?
Reporting year
Scope 2, location-based100189
Scope 2, market-based (if applicable)<Not Applicable>
Start date<Not Applicable>
End date<Not Applicable>
Comment
C6.4
(C6.4) Are there any sources (e.g. facilities, specific GHGs, activities, geographies, etc.) of Scope 1 and Scope 2 emissions that are within your selected reportingboundary which are not included in your disclosure?No
C6.5
(C6.5) Account for your organization’s gross global Scope 3 emissions, disclosing and explaining any exclusions.
Purchased goods and services
Evaluation statusRelevant, calculated
Metric tonnes CO2e3427530
Emissions calculation methodologyQuantis Scope 3 calculator based on cost for goods and services.
Percentage of emissions calculated using data obtained from suppliers or value chain partners0
Please explain
Capital goods
Evaluation statusRelevant, calculated
Metric tonnes CO2e142259
Emissions calculation methodologyQuantis Scope 3 calculator based on capital expenses.
Percentage of emissions calculated using data obtained from suppliers or value chain partners0
Please explain
CDP Page of 4120

Fuel-and-energy-related activities (not included in Scope 1 or 2)
Evaluation statusRelevant, calculated
Metric tonnes CO2e49655
Emissions calculation methodologyQuantis Scope 3 Calculator using purchased energy data and facility square footage .
Percentage of emissions calculated using data obtained from suppliers or value chain partners0
Please explain
Upstream transportation and distribution
Evaluation statusNot relevant, explanation provided
Metric tonnes CO2e<Not Applicable>
Emissions calculation methodology<Not Applicable>
Percentage of emissions calculated using data obtained from suppliers or value chain partners<Not Applicable>
Please explainEmissions associated with upstream transportation and distribution are included in the estimate for Purchased Goods and Services above.
Waste generated in operations
Evaluation statusNot relevant, calculated
Metric tonnes CO2e8000
Emissions calculation methodologyDover estimated the waste generated in operations using annual operating costs and the Quantis Scope 3 calculator.
Percentage of emissions calculated using data obtained from suppliers or value chain partners0
Please explainDover estimated the waste generated in operations using the Quantis Scope 3 calculator. Emissions are less than 1% of Dover's overall Scope 3 emissions.
Business travel
Evaluation statusNot relevant, calculated
Metric tonnes CO2e23907
Emissions calculation methodologyThe Greenhouse Gas Protocol: A Corporate Accounting and Reporting Standard and/or The Climate Registry (TCR) were used to calculate emissions from employee airtravel and rental cars. Activity data was available and based on the fuel type, mileage, and type of vehicle (for rental cars). TCR emission factors were used, and foremployee air travel, depending on the distance travelled, the appropriate UK DEFRA emission factors were implemented. The IPCC Fifth Assessment Report’s 100 yearGWP’s were used for all business travel.
Percentage of emissions calculated using data obtained from suppliers or value chain partners100
Please explainEmployee commuting emissions are less than 1% of Dover's overall Scope 3 emissions.
Employee commuting
Evaluation statusNot relevant, calculated
Metric tonnes CO2e25898
Emissions calculation methodologyThe number of employees per country was provided by Dover. The emissions were estimated based on the average distances traveled and the average hours worked peryear across Organization for Economic Cooperation and Development (OECD) countries were taken from the OECD. The average transport split was determined using thesources including the US Census Bureau, Eurostat, Statistics Canada, Japanguide. com, Singapore Land Transport Authority, UK Government Statistics National travelSurvey. Transport emission factors are taken from DEFRA (UK Government emission factors) and the US Federal Highway Administration.
Percentage of emissions calculated using data obtained from suppliers or value chain partners0
Please explainEmployee commuting emissions are less than 1% of Dover's overall Scope 3 emissions.
CDP Page of 4121

Upstream leased assets
Evaluation statusNot relevant, explanation provided
Metric tonnes CO2e<Not Applicable>
Emissions calculation methodology<Not Applicable>
Percentage of emissions calculated using data obtained from suppliers or value chain partners<Not Applicable>
Please explainAll leased assets are included in the Scope 1 and 2 emissions estimates. There are not additional upstream leased assets.
Downstream transportation and distribution
Evaluation statusRelevant, calculated
Metric tonnes CO2e426041
Emissions calculation methodologyQuantis Scope 3 Calculator using an industry average of 5% revenue spent on freight.
Percentage of emissions calculated using data obtained from suppliers or value chain partners0
Please explain
Processing of sold products
Evaluation statusNot relevant, explanation provided
Metric tonnes CO2e<Not Applicable>
Emissions calculation methodology<Not Applicable>
Percentage of emissions calculated using data obtained from suppliers or value chain partners<Not Applicable>
Please explainDover does not sell intermediate products that require further processing, transformation, or inclusion in another product before use, and therefore result in emissions fromprocessing subsequent to sale by the reporting company and before use by the end consumer.
Use of sold products
Evaluation statusRelevant, not yet calculated
Metric tonnes CO2e<Not Applicable>
Emissions calculation methodology<Not Applicable>
Percentage of emissions calculated using data obtained from suppliers or value chain partners<Not Applicable>
Please explain
End of life treatment of sold products
Evaluation statusRelevant, not yet calculated
Metric tonnes CO2e<Not Applicable>
Emissions calculation methodology<Not Applicable>
Percentage of emissions calculated using data obtained from suppliers or value chain partners<Not Applicable>
Please explain
CDP Page of 4122

Downstream leased assets
Evaluation statusNot relevant, explanation provided
Metric tonnes CO2e<Not Applicable>
Emissions calculation methodology<Not Applicable>
Percentage of emissions calculated using data obtained from suppliers or value chain partners<Not Applicable>
Please explainAll leased assets are included in the Scope 1 and 2 emissions estimates. There are not additional upstream leased assets.
Franchises
Evaluation statusNot relevant, explanation provided
Metric tonnes CO2e<Not Applicable>
Emissions calculation methodology<Not Applicable>
Percentage of emissions calculated using data obtained from suppliers or value chain partners<Not Applicable>
Please explainDover does not have any franchises.
Investments
Evaluation statusNot relevant, explanation provided
Metric tonnes CO2e<Not Applicable>
Emissions calculation methodology<Not Applicable>
Percentage of emissions calculated using data obtained from suppliers or value chain partners<Not Applicable>
Please explainDover does not have enough relevant investments or detail on any financial instruments to be able to report out.
Other (upstream)
Evaluation status
Metric tonnes CO2e<Not Applicable>
Emissions calculation methodology<Not Applicable>
Percentage of emissions calculated using data obtained from suppliers or value chain partners<Not Applicable>
Please explain
Other (downstream)
Evaluation status
Metric tonnes CO2e<Not Applicable>
Emissions calculation methodology<Not Applicable>
Percentage of emissions calculated using data obtained from suppliers or value chain partners<Not Applicable>
Please explain
C-CG6.6
(C-CG6.6) Does your organization assess the life cycle emissions of any of its products or services?
Assessment of life cycle emissions Comment
Row 1 No, and we do not plan to start doing so within the next two years
CDP Page of 4123
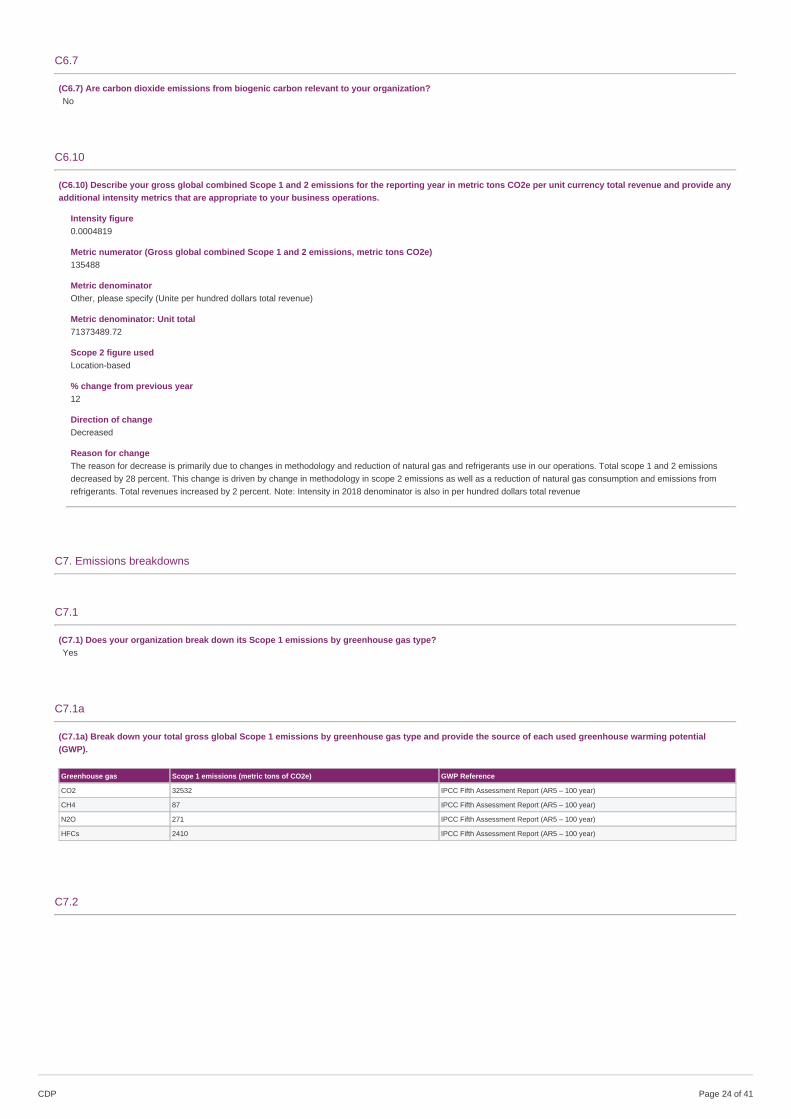
C6.7
(C6.7) Are carbon dioxide emissions from biogenic carbon relevant to your organization?No
C6.10
(C6.10) Describe your gross global combined Scope 1 and 2 emissions for the reporting year in metric tons CO2e per unit currency total revenue and provide anyadditional intensity metrics that are appropriate to your business operations.
Intensity figure0.0004819
Metric numerator (Gross global combined Scope 1 and 2 emissions, metric tons CO2e)135488
Metric denominatorOther, please specify (Unite per hundred dollars total revenue)
Metric denominator: Unit total71373489.72
Scope 2 figure usedLocation-based
% change from previous year12
Direction of changeDecreased
Reason for changeThe reason for decrease is primarily due to changes in methodology and reduction of natural gas and refrigerants use in our operations. Total scope 1 and 2 emissionsdecreased by 28 percent. This change is driven by change in methodology in scope 2 emissions as well as a reduction of natural gas consumption and emissions fromrefrigerants. Total revenues increased by 2 percent. Note: Intensity in 2018 denominator is also in per hundred dollars total revenue
C7. Emissions breakdowns
C7.1
(C7.1) Does your organization break down its Scope 1 emissions by greenhouse gas type?Yes
C7.1a
(C7.1a) Break down your total gross global Scope 1 emissions by greenhouse gas type and provide the source of each used greenhouse warming potential(GWP).
Greenhouse gas Scope 1 emissions (metric tons of CO2e) GWP Reference
CO2 32532 IPCC Fifth Assessment Report (AR5 – 100 year)
CH4 87 IPCC Fifth Assessment Report (AR5 – 100 year)
N2O 271 IPCC Fifth Assessment Report (AR5 – 100 year)
HFCs 2410 IPCC Fifth Assessment Report (AR5 – 100 year)
C7.2
CDP Page of 4124

(C7.2) Break down your total gross global Scope 1 emissions by country/region.
Country/Region Scope 1 emissions (metric tons CO2e)
Argentina 102.49
Belgium 17.83
Canada 457.52
China 881.64
Denmark 14.48
France 729.83
Germany 1060.18
India 613.47
Italy 629.56
Mexico 9.7
Netherlands 44.96
Brazil 31.15
Switzerland 67.43
United Kingdom of Great Britain and Northern Ireland 1590.84
United States of America 29029.41
Poland 9.63
Singapore 9.39
C7.3
(C7.3) Indicate which gross global Scope 1 emissions breakdowns you are able to provide.By business divisionBy activity
C7.3a
(C7.3a) Break down your total gross global Scope 1 emissions by business division.
Business division Scope 1 emissions (metric ton CO2e)
Corporate 0
Engineered Products 9886
Fueling Solutions 3975
Imaging & Identification 3413
Pumps & Process Solutions 4691
Refrigeration & Food Equipment 13335
C7.3c
(C7.3c) Break down your total gross global Scope 1 emissions by business activity.
Activity Scope 1 emissions (metric tons CO2e)
Stationary Combustion 29338
Mobile sources 3552
Refrigerants 2410
C-CE7.4/C-CH7.4/C-CO7.4/C-EU7.4/C-MM7.4/C-OG7.4/C-ST7.4/C-TO7.4/C-TS7.4
CDP Page of 4125
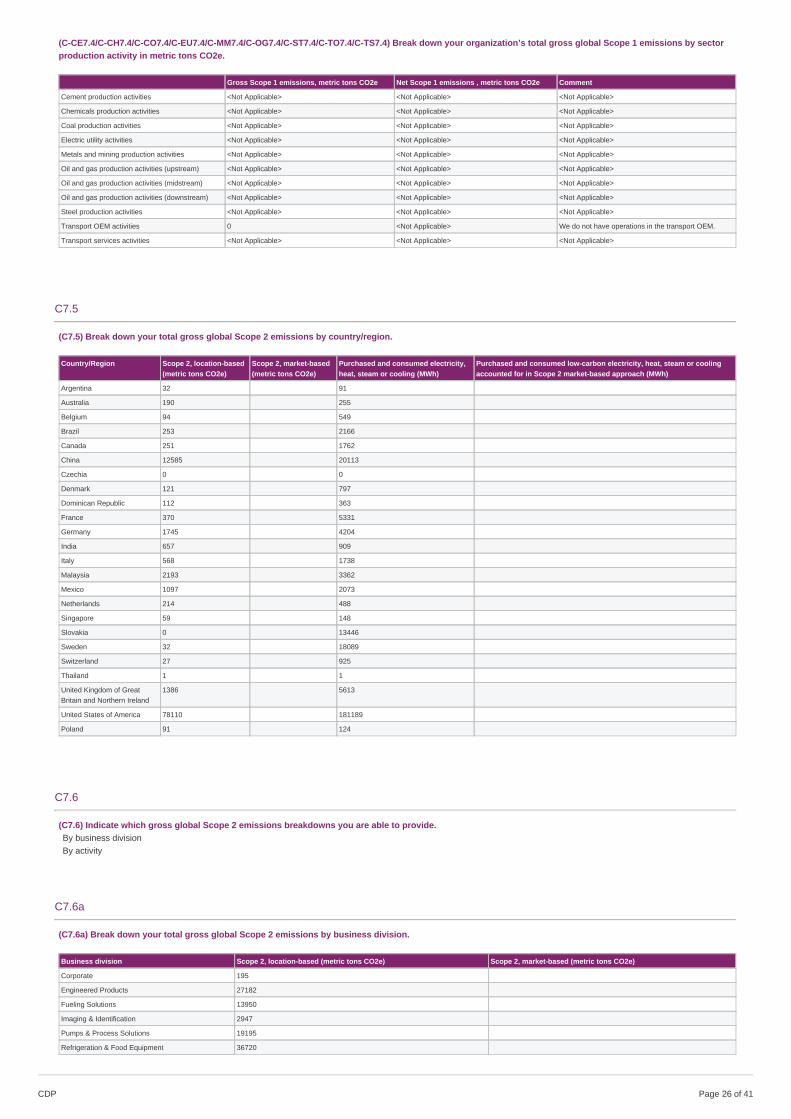
(C-CE7.4/C-CH7.4/C-CO7.4/C-EU7.4/C-MM7.4/C-OG7.4/C-ST7.4/C-TO7.4/C-TS7.4) Break down your organization’s total gross global Scope 1 emissions by sectorproduction activity in metric tons CO2e.
Gross Scope 1 emissions, metric tons CO2e Net Scope 1 emissions , metric tons CO2e Comment
Cement production activities <Not Applicable> <Not Applicable> <Not Applicable>
Chemicals production activities <Not Applicable> <Not Applicable> <Not Applicable>
Coal production activities <Not Applicable> <Not Applicable> <Not Applicable>
Electric utility activities <Not Applicable> <Not Applicable> <Not Applicable>
Metals and mining production activities <Not Applicable> <Not Applicable> <Not Applicable>
Oil and gas production activities (upstream) <Not Applicable> <Not Applicable> <Not Applicable>
Oil and gas production activities (midstream) <Not Applicable> <Not Applicable> <Not Applicable>
Oil and gas production activities (downstream) <Not Applicable> <Not Applicable> <Not Applicable>
Steel production activities <Not Applicable> <Not Applicable> <Not Applicable>
Transport OEM activities 0 <Not Applicable> We do not have operations in the transport OEM.
Transport services activities <Not Applicable> <Not Applicable> <Not Applicable>
C7.5
(C7.5) Break down your total gross global Scope 2 emissions by country/region.
Country/Region Scope 2, location-based(metric tons CO2e)
Scope 2, market-based(metric tons CO2e)
Purchased and consumed electricity,heat, steam or cooling (MWh)
Purchased and consumed low-carbon electricity, heat, steam or coolingaccounted for in Scope 2 market-based approach (MWh)
Argentina 32 91
Australia 190 255
Belgium 94 549
Brazil 253 2166
Canada 251 1762
China 12585 20113
Czechia 0 0
Denmark 121 797
Dominican Republic 112 363
France 370 5331
Germany 1745 4204
India 657 909
Italy 568 1738
Malaysia 2193 3362
Mexico 1097 2073
Netherlands 214 488
Singapore 59 148
Slovakia 0 13446
Sweden 32 18089
Switzerland 27 925
Thailand 1 1
United Kingdom of GreatBritain and Northern Ireland
1386 5613
United States of America 78110 181189
Poland 91 124
C7.6
(C7.6) Indicate which gross global Scope 2 emissions breakdowns you are able to provide.By business divisionBy activity
C7.6a
(C7.6a) Break down your total gross global Scope 2 emissions by business division.
Business division Scope 2, location-based (metric tons CO2e) Scope 2, market-based (metric tons CO2e)
Corporate 195
Engineered Products 27182
Fueling Solutions 13950
Imaging & Identification 2947
Pumps & Process Solutions 19195
Refrigeration & Food Equipment 36720
CDP Page of 4126

C7.6c
(C7.6c) Break down your total gross global Scope 2 emissions by business activity.
Activity Scope 2, location-based (metric tons CO2e) Scope 2, market-based (metric tons CO2e)
Purchased Energy 100189
C-CE7.7/C-CH7.7/C-CO7.7/C-MM7.7/C-OG7.7/C-ST7.7/C-TO7.7/C-TS7.7
(C-CE7.7/C-CH7.7/C-CO7.7/C-MM7.7/C-OG7.7/C-ST7.7/C-TO7.7/C-TS7.7) Break down your organization’s total gross global Scope 2 emissions by sector productionactivity in metric tons CO2e.
Scope 2, location-based, metric tonsCO2e
Scope 2, market-based (if applicable), metric tonsCO2e
Comment
Cement production activities <Not Applicable> <Not Applicable> <Not Applicable>
Chemicals production activities <Not Applicable> <Not Applicable> <Not Applicable>
Coal production activities <Not Applicable> <Not Applicable> <Not Applicable>
Metals and mining production activities <Not Applicable> <Not Applicable> <Not Applicable>
Oil and gas production activities (upstream) <Not Applicable> <Not Applicable> <Not Applicable>
Oil and gas production activities (midstream) <Not Applicable> <Not Applicable> <Not Applicable>
Oil and gas production activities(downstream)
<Not Applicable> <Not Applicable> <Not Applicable>
Steel production activities <Not Applicable> <Not Applicable> <Not Applicable>
Transport OEM activities 0 0 We do not have manufacturing operations in TransportOEM.
Transport services activities <Not Applicable> <Not Applicable> <Not Applicable>
C-TO7.8
(C-TO7.8) Provide primary intensity metrics that are appropriate to your indirect emissions in Scope 3 Category 11: Use of sold products from transport.
C7.9
(C7.9) How do your gross global emissions (Scope 1 and 2 combined) for the reporting year compare to those of the previous reporting year?Decreased
C7.9a
CDP Page of 4127

(C7.9a) Identify the reasons for any change in your gross global emissions (Scope 1 and 2 combined), and for each of them specify how your emissions compareto the previous year.
Change inemissions (metrictons CO2e)
Directionof change
Emissionsvalue(percentage)
Please explain calculation
Change inrenewable energyconsumption
<NotApplicable>
Other emissionsreduction activities
747 Decreased 0.4 Energy efficiency measures including lighting, HVAC described in C4.3c provided for 747 metric tons in CO2e savings. The percentagedifference was calculated as follows: 0.4% =(747/184366)x100
Divestment 0 Pleaseselect
0 Dover had no divestments in 2019.
Acquisitions 0 No change 0 Dover had no acquisitions in 2019.
Mergers 0 No change 0 Dover had no mergers in 2019
Change in output <NotApplicable>
Change inmethodology
31590 Decreased 20.7 Our estimations for scope 2 emissions were adjusted from 2018 to ensure GWPs were being accounted for appropriately. Percent Change iscalculated as (2019 Scope 2 emissions -2018 Scope 2 emissions –emissions changes from changes in energy consumption)/2018 Total scope1 and 2 emissions.
Change inboundary
0 No change 0 There were no changes in boundary in 2019
Change in physicaloperatingconditions
0 Pleaseselect
0 There were no changes in physical operating conditions
Unidentified <NotApplicable>
Other <NotApplicable>
C7.9b
(C7.9b) Are your emissions performance calculations in C7.9 and C7.9a based on a location-based Scope 2 emissions figure or a market-based Scope 2emissions figure?Location-based
C-CG7.10
(C-CG7.10) How do your total Scope 3 emissions for the reporting year compare to those of the previous reporting year?Decreased
C-CG7.10a
(C-CG7.10a) For each Scope 3 category calculated in C6.5, specify how your emissions compare to the previous year and identify the reason for any change.
Purchased goods and services
Direction of changeNo change
Primary reason for change<Not Applicable>
Change in emissions in this category (metric tons CO2e)<Not Applicable>
% change in emissions in this category<Not Applicable>
Please explainEmissions from this category remained the same.
CDP Page of 4128

Capital goods
Direction of changeNo change
Primary reason for change<Not Applicable>
Change in emissions in this category (metric tons CO2e)<Not Applicable>
% change in emissions in this category<Not Applicable>
Please explainEmissions from this category remained the same.
Fuel and energy-related activities (not included in Scopes 1 or 2)
Direction of changeNo change
Primary reason for change<Not Applicable>
Change in emissions in this category (metric tons CO2e)<Not Applicable>
% change in emissions in this category<Not Applicable>
Please explainEmissions from this category remained the same.
Waste generated in operations
Direction of changeNo change
Primary reason for change<Not Applicable>
Change in emissions in this category (metric tons CO2e)<Not Applicable>
% change in emissions in this category<Not Applicable>
Please explainEmissions from this category remained the same.
Business travel
Direction of changeIncreased
Primary reason for changeOther, please specify (Increased company fleet size.)
Change in emissions in this category (metric tons CO2e)4640
% change in emissions in this category24
Please explainEmissions from company fleet were larger in the reporting year than previous year.
Employee commuting
Direction of changeDecreased
Primary reason for changeUnidentified
Change in emissions in this category (metric tons CO2e)9334
% change in emissions in this category26
Please explainNumber of employees remained relatively the same.
CDP Page of 4129
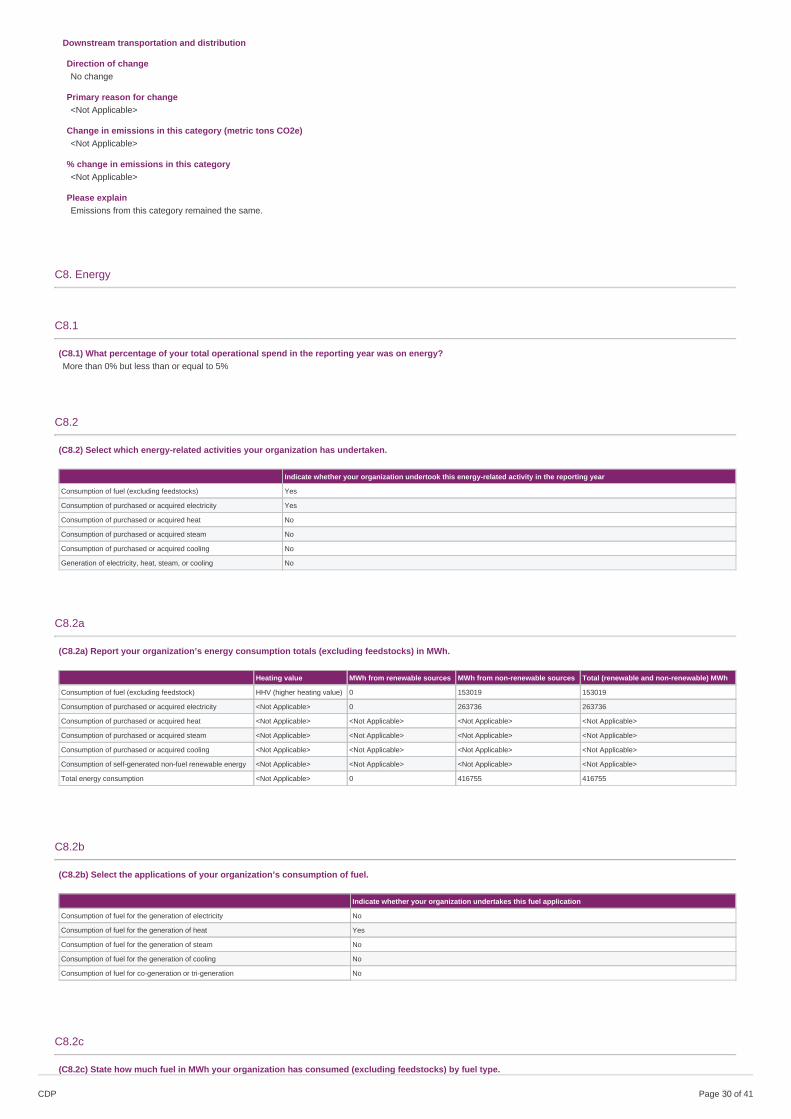
Downstream transportation and distribution
Direction of changeNo change
Primary reason for change<Not Applicable>
Change in emissions in this category (metric tons CO2e)<Not Applicable>
% change in emissions in this category<Not Applicable>
Please explainEmissions from this category remained the same.
C8. Energy
C8.1
(C8.1) What percentage of your total operational spend in the reporting year was on energy?More than 0% but less than or equal to 5%
C8.2
(C8.2) Select which energy-related activities your organization has undertaken.
Indicate whether your organization undertook this energy-related activity in the reporting year
Consumption of fuel (excluding feedstocks) Yes
Consumption of purchased or acquired electricity Yes
Consumption of purchased or acquired heat No
Consumption of purchased or acquired steam No
Consumption of purchased or acquired cooling No
Generation of electricity, heat, steam, or cooling No
C8.2a
(C8.2a) Report your organization’s energy consumption totals (excluding feedstocks) in MWh.
Heating value MWh from renewable sources MWh from non-renewable sources Total (renewable and non-renewable) MWh
Consumption of fuel (excluding feedstock) HHV (higher heating value) 0 153019 153019
Consumption of purchased or acquired electricity <Not Applicable> 0 263736 263736
Consumption of purchased or acquired heat <Not Applicable> <Not Applicable> <Not Applicable> <Not Applicable>
Consumption of purchased or acquired steam <Not Applicable> <Not Applicable> <Not Applicable> <Not Applicable>
Consumption of purchased or acquired cooling <Not Applicable> <Not Applicable> <Not Applicable> <Not Applicable>
Consumption of self-generated non-fuel renewable energy <Not Applicable> <Not Applicable> <Not Applicable> <Not Applicable>
Total energy consumption <Not Applicable> 0 416755 416755
C8.2b
(C8.2b) Select the applications of your organization’s consumption of fuel.
Indicate whether your organization undertakes this fuel application
Consumption of fuel for the generation of electricity No
Consumption of fuel for the generation of heat Yes
Consumption of fuel for the generation of steam No
Consumption of fuel for the generation of cooling No
Consumption of fuel for co-generation or tri-generation No
C8.2c
(C8.2c) State how much fuel in MWh your organization has consumed (excluding feedstocks) by fuel type.
CDP Page of 4130
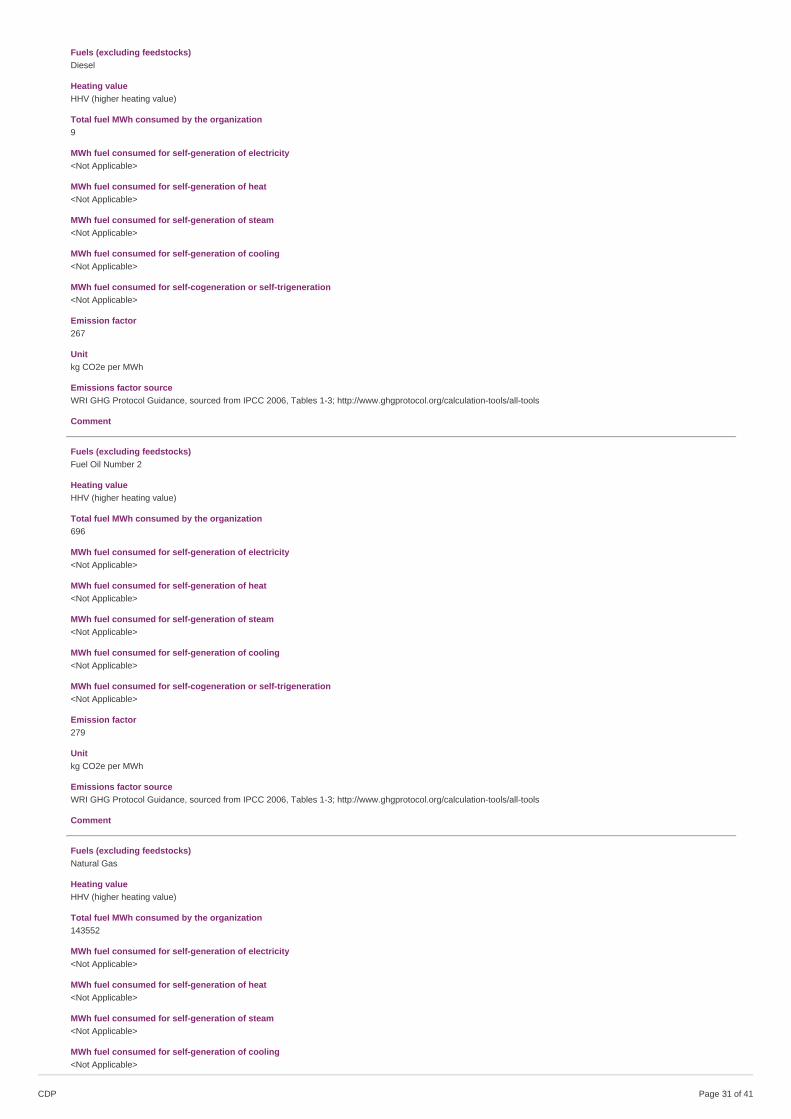
Fuels (excluding feedstocks)Diesel
Heating valueHHV (higher heating value)
Total fuel MWh consumed by the organization9
MWh fuel consumed for self-generation of electricity<Not Applicable>
MWh fuel consumed for self-generation of heat<Not Applicable>
MWh fuel consumed for self-generation of steam<Not Applicable>
MWh fuel consumed for self-generation of cooling<Not Applicable>
MWh fuel consumed for self-cogeneration or self-trigeneration<Not Applicable>
Emission factor267
Unitkg CO2e per MWh
Emissions factor sourceWRI GHG Protocol Guidance, sourced from IPCC 2006, Tables 1-3; http://www.ghgprotocol.org/calculation-tools/all-tools
Comment
Fuels (excluding feedstocks)Fuel Oil Number 2
Heating valueHHV (higher heating value)
Total fuel MWh consumed by the organization696
MWh fuel consumed for self-generation of electricity<Not Applicable>
MWh fuel consumed for self-generation of heat<Not Applicable>
MWh fuel consumed for self-generation of steam<Not Applicable>
MWh fuel consumed for self-generation of cooling<Not Applicable>
MWh fuel consumed for self-cogeneration or self-trigeneration<Not Applicable>
Emission factor279
Unitkg CO2e per MWh
Emissions factor sourceWRI GHG Protocol Guidance, sourced from IPCC 2006, Tables 1-3; http://www.ghgprotocol.org/calculation-tools/all-tools
Comment
Fuels (excluding feedstocks)Natural Gas
Heating valueHHV (higher heating value)
Total fuel MWh consumed by the organization143552
MWh fuel consumed for self-generation of electricity<Not Applicable>
MWh fuel consumed for self-generation of heat<Not Applicable>
MWh fuel consumed for self-generation of steam<Not Applicable>
MWh fuel consumed for self-generation of cooling<Not Applicable>
CDP Page of 4131

MWh fuel consumed for self-cogeneration or self-trigeneration<Not Applicable>
Emission factor202
Unitkg CO2e per MWh
Emissions factor sourceWRI GHG Protocol Guidance, sourced from IPCC 2006, Tables 1-3; http://www.ghgprotocol.org/calculation-tools/all-tools
Comment
Fuels (excluding feedstocks)Propane Gas
Heating valueHHV (higher heating value)
Total fuel MWh consumed by the organization8163
MWh fuel consumed for self-generation of electricity<Not Applicable>
MWh fuel consumed for self-generation of heat<Not Applicable>
MWh fuel consumed for self-generation of steam<Not Applicable>
MWh fuel consumed for self-generation of cooling<Not Applicable>
MWh fuel consumed for self-cogeneration or self-trigeneration<Not Applicable>
Emission factor227
Unitkg CO2e per MWh
Emissions factor sourceWRI GHG Protocol Guidance, sourced from IPCC 2006, Tables 1-3; http://www.ghgprotocol.org/calculation-tools/all-tools
Comment
Fuels (excluding feedstocks)Biodiesel
Heating valueHHV (higher heating value)
Total fuel MWh consumed by the organization65
MWh fuel consumed for self-generation of electricity<Not Applicable>
MWh fuel consumed for self-generation of heat<Not Applicable>
MWh fuel consumed for self-generation of steam<Not Applicable>
MWh fuel consumed for self-generation of cooling<Not Applicable>
MWh fuel consumed for self-cogeneration or self-trigeneration<Not Applicable>
Emission factor9.46
Unitkg CO2e per KWh
Emissions factor sourceEPA Climate Leaders Emission Factors 2014
Comment
Fuels (excluding feedstocks)Compressed Natural Gas (CNG)
Heating valueHHV (higher heating value)
CDP Page of 4132

Total fuel MWh consumed by the organization534
MWh fuel consumed for self-generation of electricity<Not Applicable>
MWh fuel consumed for self-generation of heat<Not Applicable>
MWh fuel consumed for self-generation of steam<Not Applicable>
MWh fuel consumed for self-generation of cooling<Not Applicable>
MWh fuel consumed for self-cogeneration or self-trigeneration<Not Applicable>
Emission factor0.222
Unitkg CO2e per KWh
Emissions factor sourceDEFRA Emission Factors
Comment
C-CG8.5
(C-CG8.5) Does your organization measure the efficiency of any of its products or services?
Measurement of product/service efficiency Comment
Row 1 No, and we do not plan to start doing so within the next two years
C-TO8.5
(C-TO8.5) Provide any efficiency metrics that are appropriate for your organization’s transport products and/or services.
C9. Additional metrics
C9.1
(C9.1) Provide any additional climate-related metrics relevant to your business.
C-TO9.3/C-TS9.3
(C-TO9.3/C-TS9.3) Provide tracking metrics for the implementation of low-carbon transport technology over the reporting year.
C-CE9.6/C-CG9.6/C-CH9.6/C-CN9.6/C-CO9.6/C-EU9.6/C-MM9.6/C-OG9.6/C-RE9.6/C-ST9.6/C-TO9.6/C-TS9.6
(C-CE9.6/C-CG9.6/C-CH9.6/C-CN9.6/C-CO9.6/C-EU9.6/C-MM9.6/C-OG9.6/C-RE9.6/C-ST9.6/C-TO9.6/C-TS9.6) Does your organization invest in research anddevelopment (R&D) of low-carbon products or services related to your sector activities?
Investment in low-carbon R&D Comment
Row 1 No
C10. Verification
C10.1
CDP Page of 4133

(C10.1) Indicate the verification/assurance status that applies to your reported emissions.
Verification/assurance status
Scope 1 Third-party verification or assurance process in place
Scope 2 (location-based or market-based) Third-party verification or assurance process in place
Scope 3 Third-party verification or assurance process in place
C10.1a
(C10.1a) Provide further details of the verification/assurance undertaken for your Scope 1 emissions, and attach the relevant statements.
Verification or assurance cycle in placeAnnual process
Status in the current reporting yearComplete
Type of verification or assuranceModerate assurance
Attach the statement2020_06_08_Assurance statement Dover_V0.2.pdf
Page/ section referencePg 1
Relevant standardAA1000AS
Proportion of reported emissions verified (%)70
C10.1b
(C10.1b) Provide further details of the verification/assurance undertaken for your Scope 2 emissions and attach the relevant statements.
Scope 2 approachScope 2 location-based
Verification or assurance cycle in placeAnnual process
Status in the current reporting yearComplete
Type of verification or assuranceModerate assurance
Attach the statement2020_06_08_Assurance statement Dover_V0.2.pdf
Page/ section referencePg 1
Relevant standardAA1000AS
Proportion of reported emissions verified (%)70
C10.1c
CDP Page of 4134
(C10.1c) Provide further details of the verification/assurance undertaken for your Scope 3 emissions and attach the relevant statements.
Scope 3 categoryScope 3: Business travel
Verification or assurance cycle in placeAnnual process
Status in the current reporting yearComplete
Type of verification or assuranceModerate assurance
Attach the statement2020_06_08_Assurance statement Dover_V0.2.pdf
Page/section referencePg 1
Relevant standardAA1000AS
Proportion of reported emissions verified (%)100
Scope 3 categoryScope 3: Employee commuting
Verification or assurance cycle in placeAnnual process
Status in the current reporting yearComplete
Type of verification or assuranceReasonable assurance
Attach the statement2020_06_08_Assurance statement Dover_V0.2.pdf
Page/section referencePg 1
Relevant standardAA1000AS
Proportion of reported emissions verified (%)100
C10.2
(C10.2) Do you verify any climate-related information reported in your CDP disclosure other than the emissions figures reported in C6.1, C6.3, and C6.5?Yes
C10.2a
(C10.2a) Which data points within your CDP disclosure have been verified, and which verification standards were used?
Disclosure module verification relates to Data verified Verification standard Please explain
C7. Emissions breakdown Year on year change in emissions (Scope 1 and 2) AA1000 The year on year change in CO2e emissions for Scopes 1 and 2 from 2019 were verified.
C11. Carbon pricing
C11.1
(C11.1) Are any of your operations or activities regulated by a carbon pricing system (i.e. ETS, Cap & Trade or Carbon Tax)?No, and we do not anticipate being regulated in the next three years
C11.2
CDP Page of 4135

(C11.2) Has your organization originated or purchased any project-based carbon credits within the reporting period?No
C11.3
(C11.3) Does your organization use an internal price on carbon?No, but we anticipate doing so in the next two years
C12. Engagement
C12.1
(C12.1) Do you engage with your value chain on climate-related issues?Yes, our suppliersYes, our customers
C12.1a
(C12.1a) Provide details of your climate-related supplier engagement strategy.
Type of engagementCompliance & onboarding
Details of engagementOther, please specify (Code of Conduct)
% of suppliers by number100
% total procurement spend (direct and indirect)100
% of supplier-related Scope 3 emissions as reported in C6.5100
Rationale for the coverage of your engagementDover's Supplier Code of Conduct requires all suppliers to comply with all applicable environmental laws, regulations, and standards and minimize any adverse impact onthe environment. In addition, Dover’s suppliers must also endeavor to conserve natural resources and energy and reduce or eliminate waste and the use of hazardoussubstances. “Suppliers” means any company, corporation, or other entity or person that sells, or seeks to sell, goods or services to Dover, including the supplier’semployees, other workers, representatives, agents, subcontractors, and other sub-tier sources. Dover requires its suppliers to read, understand, and follow the SupplierCode of Conduct to ensure compliance with the Code. Suppliers are required to cooperate with inspections, audits, and investigations by Dover or its authorized agents.Prior to engaging in business or during an existing business relationship, Dover may conduct diligence on its suppliers and their owners and key personnel to assesscompliance with the Supplier Code of Conduct and address Dover’s business needs.
Impact of engagement, including measures of successDover's due diligence activities confirm compliance with the Supplier Code of Conduct. This includes requirements to comply with all applicable environmental laws,regulations, and standards and minimize any adverse impact on the environment. Dover’s suppliers must also endeavor to conserve natural resources and energy andreduce or eliminate waste and the use of hazardous substances.
Comment
C12.1b
CDP Page of 4136

(C12.1b) Give details of your climate-related engagement strategy with your customers.
Type of engagementEducation/information sharing
Details of engagementShare information about your products and relevant certification schemes (i.e. Energy STAR)
% of customers by number20
% of customer - related Scope 3 emissions as reported in C6.520
Portfolio coverage (total or outstanding)<Not Applicable>
Please explain the rationale for selecting this group of customers and scope of engagementWhile many Dover products enhance our customers climate change performance and strategy, the products in our Refrigeration and Food Equipment Segment have someof the most significant energy and carbon efficiency properties. Dover's product and sales teams engage with customers in this segment regarding product features andrelevant certification schemes. The Refrigeration and Food Equipment Segment represents 20% of Dover's revenue in 2019, therefore we are estimating 20% of customersfor engagement and 20% of Scope 3 emissions. This estimate is likely low since it does not account for engagement strategies in Dover's other segments for energy andcarbon efficient products.
Impact of engagement, including measures of successDover measures success of customer engagement through sales of its products. The Refrigeration and Food Equipment Segment represents 20% of Dover's revenue in2019.
C12.3
(C12.3) Do you engage in activities that could either directly or indirectly influence public policy on climate-related issues through any of the following?Trade associations
C12.3b
(C12.3b) Are you on the board of any trade associations or do you provide funding beyond membership?No
C12.3f
(C12.3f) What processes do you have in place to ensure that all of your direct and indirect activities that influence policy are consistent with your overall climatechange strategy?
Dover's representative to the National Association of Manufacturers is a member of the Executive Management team. As such, the representative is aware of Dover's overallclimate change strategy and position.
C12.4
(C12.4) Have you published information about your organization’s response to climate change and GHG emissions performance for this reporting year in placesother than in your CDP response? If so, please attach the publication(s).
PublicationIn mainstream reports
StatusComplete
Attach the documentEnergy and Emissions _ Dover Corporation.pdf
Page/Section referenceAll pages
Content elementsGovernanceStrategyRisks & opportunitiesEmission targetsOther metrics
CommentDover's sustainability report is a web-based report found here: https://www.dovercorporation.com/sustainability/ The other metrics include energy reduction targets.
CDP Page of 4137

C15. Signoff
C-FI
(C-FI) Use this field to provide any additional information or context that you feel is relevant to your organization's response. Please note that this field is optionaland is not scored.
C15.1
(C15.1) Provide details for the person that has signed off (approved) your CDP climate change response.
Job title Corresponding job category
Row 1 Chief Executive Officer Chief Executive Officer (CEO)
SC. Supply chain module
SC0.0
(SC0.0) If you would like to do so, please provide a separate introduction to this module.
SC0.1
(SC0.1) What is your company’s annual revenue for the stated reporting period?
Annual Revenue
Row 1 7136397000
SC0.2
(SC0.2) Do you have an ISIN for your company that you would be willing to share with CDP?Yes
SC0.2a
(SC0.2a) Please use the table below to share your ISIN.
ISIN country code (2 letters) ISIN numeric identifier and single check digit (10 numbers overall)
Row 1 US 2600031080
SC1.1
(SC1.1) Allocate your emissions to your customers listed below according to the goods or services you have sold them in this reporting period.
Requesting memberL'Oréal
Scope of emissionsScope 1
Allocation levelBusiness unit (subsidiary company)
Allocation level detailThe emissions provided are based on an estimate of Markem-Imaje's 2019 revenue from L'Oreal, approximately $2 million. Markem-Imaje's revenue in 2019 wasapproximately $1 billion. 2019 revenue from L'Oreal represents approximately 0.2% of Markem- Imaje's 2019 revenue. 0.2% of Markem- Imaje's 2019 Scope 1 emissions is10 metric tonnes of CO2e.
Emissions in metric tonnes of CO2e11
CDP Page of 4138

Uncertainty (±%)10
Major sources of emissionsBoilers and motor vehicles.
VerifiedYes
Allocation methodAllocation based on the market value of products purchased
Please explain how you have identified the GHG source, including major limitations to this process and assumptions madeThe GHG sources have been identified using the method of operational control.
Requesting memberL'Oréal
Scope of emissionsScope 2
Allocation levelBusiness unit (subsidiary company)
Allocation level detailThe emissions provided are based on an estimate of Markem-Imaje's 2019 revenue from L'Oreal, approximately $2 million. Markem-Imaje's revenue in 2019 wasapproximately $1 billion. 2019 revenue from L'Oreal represents approximately 0.2% of Markem- Imaje's 2019 revenue. 0.2% of Markem- Imaje's 2019 Scope 2 emissions is30 metric tonnes of CO2e.
Emissions in metric tonnes of CO2e30
Uncertainty (±%)10
Major sources of emissionsPurchased Electricity
VerifiedYes
Allocation methodAllocation based on the market value of products purchased
Please explain how you have identified the GHG source, including major limitations to this process and assumptions madeThe GHG sources have been identified using the method of operational control.
Requesting memberSignify NV
Scope of emissionsScope 1
Allocation levelBusiness unit (subsidiary company)
Allocation level detailThe emissions provided are based on an estimate of Markem-Imaje's 2019 revenue from Signify NV, approximately $21,000. Markem-Imaje's revenue in 2019 wasapproximately $1 billion. 2019 revenue from Signify represents approximately 0.0003% of Markem- Imaje's 2019 revenue. 0.0003% of Markem- Imaje's 2019 Scope 1emissions is 0.1 metric tonnes of CO2e.
Emissions in metric tonnes of CO2e0.1
Uncertainty (±%)10
Major sources of emissionsStationary combustion
VerifiedYes
Allocation methodAllocation based on the market value of products purchased
Please explain how you have identified the GHG source, including major limitations to this process and assumptions madeThe GHG sources have been identified using the method of operational control.
Requesting memberSignify NV
Scope of emissionsScope 2
Allocation levelBusiness unit (subsidiary company)
Allocation level detail
CDP Page of 4139

The emissions provided are based on an estimate of Markem-Imaje's 2019 revenue from Signify NV, approximately $21,000 USD. Markem-Imaje's revenue in 2019 wasapproximately $1 billion. 2019 revenue from Signify represents approximately 0.0003% of Markem- Imaje's 2019 revenue. 0.0003% of Markem- Imaje's 2019 Scope 2emissions is 0.3 metric tonnes of CO2e.
Emissions in metric tonnes of CO2e0.3
Uncertainty (±%)10
Major sources of emissionsPurchased Electricity
VerifiedYes
Allocation methodAllocation based on the market value of products purchased
Please explain how you have identified the GHG source, including major limitations to this process and assumptions madeThe GHG sources have been identified using the method of operational control.
SC1.2
(SC1.2) Where published information has been used in completing SC1.1, please provide a reference(s).
SC1.3
(SC1.3) What are the challenges in allocating emissions to different customers, and what would help you to overcome these challenges?
Allocation challenges Please explain what would help you overcome these challenges
Diversity of product lines makes accurately accounting for eachproduct/product line cost ineffective
Markem-Imaje products and customers are diverse and manufacturing occurs in multiple, global locations. Overcoming challenges to allocationwould require dedicated manufacturing strategies or detailed life cycle analysis.
Customer base is too large and diverse to accurately trackemissions to the customer level
Markem-Imaje products and customers are diverse and manufacturing occurs in multiple, global locations. Overcoming challenges to allocationwould require dedicated manufacturing strategies or detailed life cycle analysis.
SC1.4
(SC1.4) Do you plan to develop your capabilities to allocate emissions to your customers in the future?No
SC1.4b
(SC1.4b) Explain why you do not plan to develop capabilities to allocate emissions to your customers.
Markem-Imaje products are diverse and are manufactured in multiple, global locations. Overcoming challenges to allocation would require dedicated manufacturingstrategies or detailed life cycle analysis. These activities are not cost effective for the business.
SC2.1
(SC2.1) Please propose any mutually beneficial climate-related projects you could collaborate on with specific CDP Supply Chain members.
SC2.2
(SC2.2) Have requests or initiatives by CDP Supply Chain members prompted your organization to take organizational-level emissions reduction initiatives?No
SC3.1
(SC3.1) Do you want to enroll in the 2020-2021 CDP Action Exchange initiative?No
CDP Page of 4140
SC3.2
(SC3.2) Is your company a participating supplier in CDP’s 2019-2020 Action Exchange initiative?No
SC4.1
(SC4.1) Are you providing product level data for your organization’s goods or services?No, I am not providing data
Submit your response
In which language are you submitting your response?English
Please confirm how your response should be handled by CDP
I am submitting to Public or Non-Public Submission Are you ready to submit the additional Supply Chain Questions?
I am submitting my response InvestorsCustomers
Public Yes, submit Supply Chain Questions now
Please confirm belowI have read and accept the applicable Terms
CDP Page of 4141