rcrl studies of thief zones in sacroc field
TRANSCRIPT
RCRL STUDIES OF THIEF ZONES IN SACROC FIELD
F. Jerry Lucia
Reservoir Characterization Research Laboratory Bureau of Economic Geology
Jackson School of Geoscience The University of Texas at Austin
2012
0 2 4 6 8
10 12 14 16 18 20
10 100 1000 10000 100000
Inje
ctio
n (%
)
KH (mdft)
Sacroc 37-11 Based on kh of injected intervals
Perfs with injection

1
RCRL STUDIES OF THIEF ZONES IN SACROC FIELD
F. Jerry Lucia Reservoir Characterization Research Laboratory
Bureau of Economic Geology Jackson School of Geoscience
The University of Texas at Austin
EXECUTIVE SUMMARY
Geologic models of the northern platform of Sacroc have been constructed over several years (2001–present) by the Reservoir Characterization Research Laboratory (RCRL). These models show a complex stratigraphy of deposition, exposure (diagenesis), and erosion. Canyon units were deposited as depositional cycles, and the latest Canyon cycles have been heavily eroded. The Cisco units are composed of debris flows, biohermal buildups, and grain-dominated units representing many significant sea-level changes, culminating in a major exposure event before being engulfed in carbonate muds of Wolfcamp age.
Geologic models have been converted to petrophysical models by RCRL using the rock-fabric method. Porosity-permeability transforms have been defined for each stratigraphic unit using core data and thin-section analyses. Geologic models have been converted to porosity and permeability models using these transforms.
Kinder Morgan has initiated a CO2 flood in the northern platform area. The company’s injection program has uncovered numerous intervals in which the rate of injection is significantly higher than expected from the petrophysical model. These intervals are referred to as void space conduits by Kinder Morgan and as thief zones in this report.
The problem facing Kinder Morgan is that the large volume of injected fluid taken by thief zones significantly decreases the volume of remaining-oil saturation contacted by injected fluids, resulting in poor recovery. This report summarizes efforts to explain the geological and petrophysical nature of these thief zones through an exhaustive study of core and log data from well 37-11.
Thief zones are defined as having significantly higher flow rates than expected from matrix properties. At Sacroc these zones are located by injection profiles, and the injection profile from 37-11 shows high variability in injection volume. Using core data, we calculated kh values for each perforated interval, as well for each injection and no-injection interval within each set of perforations. A positive relationship between kh and water injection is assumed. Unfortunately, in 37-11 only a polymer injection profile was available for this study. A positive relationship between kh and polymer injection is probably true as well.
Five thief zones are identified on the basis of a cross-plot of injection kh and injection volumes (given as percent of injected fluid). No polymer injection occurred in perforated intervals with less than 150 kh, except for one thief zone that apparently has significant nonmatrix flow. In addition, porosity-permeability cross-plots of injection intervals and

2
no-injection intervals restricted to perforated zones show injection intervals with higher permeability values than no-injection intervals. Injection intervals tend to have permeability values higher than 10 to 20 md, and no-injection intervals have lower values.
Given a postulated relationship between matrix kh and injection percent, thief zones are estimated to have Kh values of between 1 and 100 Dft and average permeability of 100 md to 7 D. This implies the presence of nonmatrix permeability in thief zones, as well as matrix permeability.
In this study, RCRL examined the following possible causes for a nonmatrix pore system in thief zones of Sacroc 37-1. Nonmatrix pore systems have been referred to as touching-vug systems, which are commonly described as a combination of fractures, breccias, and dissolution vugs. This study summarizes RCRL efforts to describe the touching-vug system in 37-11 based on core descriptions and core analysis:
1. Vertical and inclined fractures as seen in core. 2. Tension-gash fractures associated with stylolites as seen in core. 3. Ratio of Kmax:Kmin as an indication of touching vugs. 4. High-permeability matrix intervals not recorded in routine core analysis. 5. Cavernous porosity related to karsting. Kinder Morgan contracted John Lorenz to make a detailed fracture description of the
37-11 core. Detailed analysis of these data by RCRL and Kinder Morgan found no relationship between fracture distribution and injectivity. Two injection intervals in the Cisco have the highest fracture density; however, only one interval is a thief zone. Permeability in the thief zone at 6,323 to 6,333 ft may be enhanced by fracture permeability, as concluded by Kinder Morgan. The lower three thief zones show no relationship to fracture density, and intervals with no injection have fracture densities similar to those of intervals of matrix injection. Therefore, the distribution of vertical and inclined fractures described by Dr. Lorenz does not explain the occurrence of thief zones in well Sacroc 37-11.
Tension-gash fractures studied in this report are associated with stylolites. Whereas fractures in general contribute little to porosity, vertical and inclined fractures may have high permeability. Tension-gash fractures, however, typically have low permeability. A plot of tension-gash fractures per foot vs. whole-core permeability for whole-core samples with less than 5% porosity shows no relationship. Permeability ranges from 0.02 to 10 md, with an average permeability of 5.7 md. Tension-gash fractures probably could not contribute the hundreds of millidarcys or Darcy’s of permeability needed for thief-zone flow. Because the spatial relationship between injectivity and tension-gash fractures is highly variable, the distribution of tension-gash fractures described by Dr. Lorenz does not explain the occurrence of thief zones in well Sacroc 37-11.
The ratio of maximum and minimum whole-core permeability measurements is thought to indicate fractured intervals and, thus, to link with anomalously high permeability intervals. A depth plot of Kmax:Kmin ratios shows little relationship to injection percentage. Indeed, intervals with high Kmax:Kmin ratios are in muddy intervals that were not perforated. Of the

3
five thief zones, only two have high Kmax:Kmin ratios; therefore, the Kmax:Kmin ratio is not a good indicator of thief zones.
Minipermeameter data were obtained from four intervals—two with matrix flow and two with thief-zone flow. Results show that minipermeameter data in general cluster around whole-core data. A few high-permeability values were found in each interval, probably representing small, open fractures found in the core slabs. However, no beds of high matrix permeability were found that are not represented in core data.
Extensive analysis shows no robust correlation between injection percentage and (1) vertical and inclined fractures, (2) tension-gash fractures, (3) the ratio of Kmax:Kmin, or (4) detailed minipermeameter data. This lack of correlation implies the presence of a high-permeability, touching-vug pore system that is not obvious from well bore data. A cavernous pore system related to subareal karsting may be present in the large volume of space between wells. Core descriptions, however, indicate karsting in only three injection intervals, and only two of these intervals are thief zones. The other three thief zones have little to suggest significant karsting. Therefore, thief zones cannot be identified by describing karst fabrics in core slabs.
No “smoking gun” for identifying thief-zone intervals has been found in this study. However, the amount of nonmatrix permeability required for thief-zone flow appears to vary considerably. The difference between matrix and nonmatrix permeability in two thief zones is between 5 and 10 times matrix permeability, or an increase in average permeability from between 10 and 20 md to 100 md. The difference between matrix and nonmatrix is much larger for the other three thief zones, and thief-zone permeability is 80 to 600 times higher than matrix and requires darcy permeability. The geological/petrophysical model that accounts for this level of permeability has yet to be discovered but is thought to be some combination of fracturing and dissolution. RCRL will continue to look for opportunities to advance understanding of thief-zone permeability in Sacroc field as additional data become available.
An offshoot of this study is the conclusion that polymer injection requires permeability values greater than 10 to 20 md and kh values greater than 150 mdft. There is no indication that polymer is injected only into the nonmatrix pore system, but it appears to be injected into some of the higher matrix pores as well.

4
INTRODUCTION
Purpose and Scope of Project
Geologic models of the northern platform of Sacroc have been constructed in the past by RCRL. These models show a complex stratigraphy of deposition, exposure, and erosion. Canyon units were deposited as depositional cycles, and the latest Canyon cycles have been heavily eroded. The Cisco units are composed of debris flows, biohermal buildups, and grain-dominated units representing many significant sea-level changes, culminating in a major exposure event before being engulfed in carbonate muds of Wolfcamp age.
Geologic models have been converted to petrophysical models by RCRL using the rock-fabric method of Lucia (2007). Porosity-permeability transforms have been defined for each stratigraphic unit using core data and thin-section analysis. Geologic models have been converted to porosity and permeability models using these transforms.
Kinder Morgan has initiated a CO2 flood in the northern platform area. The company’s injection program has uncovered numerous intervals in which the rate of injection is significantly higher than expected from the petrophysical model. These intervals are referred to as void space conduits by Kinder Morgan and as thief zones in this report.
The problem facing Kinder Morgan is that the large volume of injected fluid taken by thief zones significantly decreases the volume of remaining oil saturation contacted by injected fluids, resulting in poor recovery. This report summarizes work to explain the geological and petrophysical nature of these thief zones through an exhaustive study of core and log data from well 37-11.
Data
Kinder Morgan provided core, core analysis, wireline logs, completion intervals, and polymer injection profile. The core extends through the complete reservoir from 6,126 to 7,023 ft. The core was described in detail by RCRL and reported to Kinder Morgan. In 2011 Kinder Morgan contracted J. C. Lorenz and S. P. Cooper to make a detailed assessment of fractures in the 37-11 core. This report was provided to RCRL for further study.

5
ANALYSIS OF DATA
Relationship of Permeability to Polymer Injection Profile
Thief zones are those intervals that have higher flow capacity than predicted from matrix
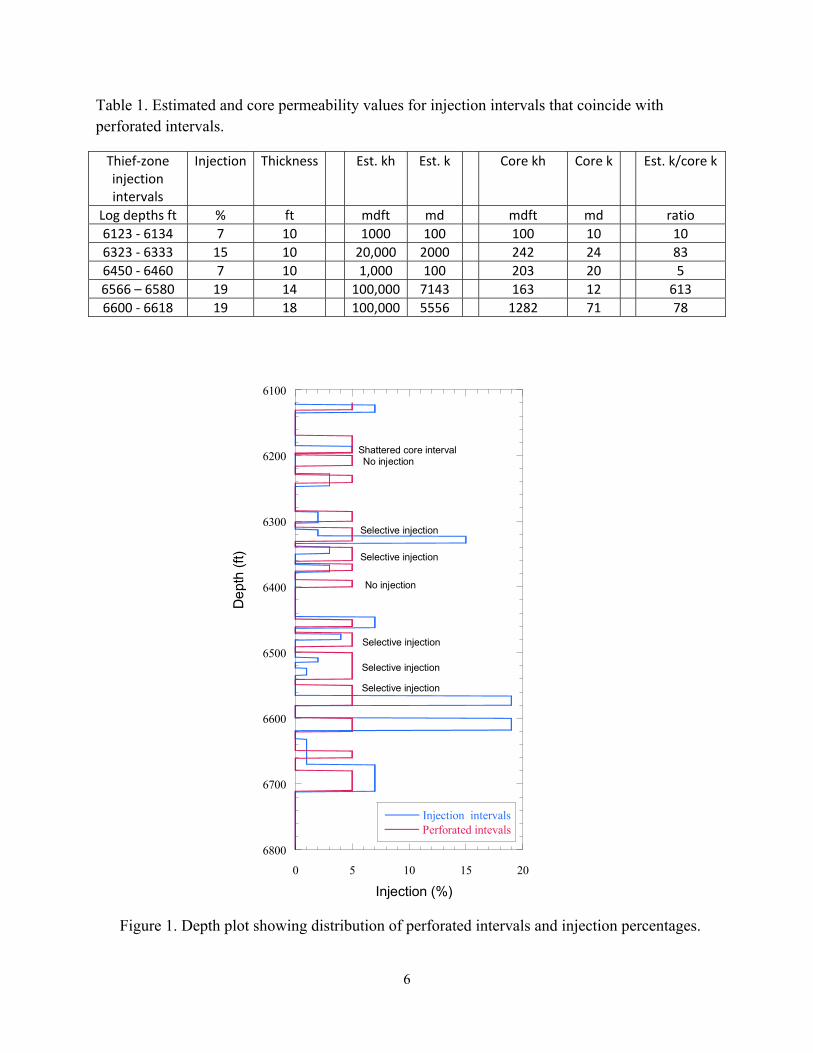
properties and in Sacroc are located by injection profiles. A polymer injection profile from well 37-11 shows high variability in injection volume (fig. 1). A few perforated intervals have no injection, 6,200 to 6,215 ft, and 6,390 to 6,400 ft, and injection into some perforated intervals is selective—often with injection into only part of the interval. The core from 6,185 to 6,209 ft is shattered, and permeability data are measured on core plugs or by miniprobe. This report relies on whole-core permeability measurements, and data from this interval are not included in the analysis.
We assume a positive relationship between kh and injected volume, and kh values were computed for each injection interval and each interval with no injection within perforated zones. kh values can be plotted against percent of injected fluid (fig. 2). The plot shows no relationship between injection percent and kh, implying the presence of nonmatrix porosity (touching vugs), as well as matrix porosity measured by core analysis.
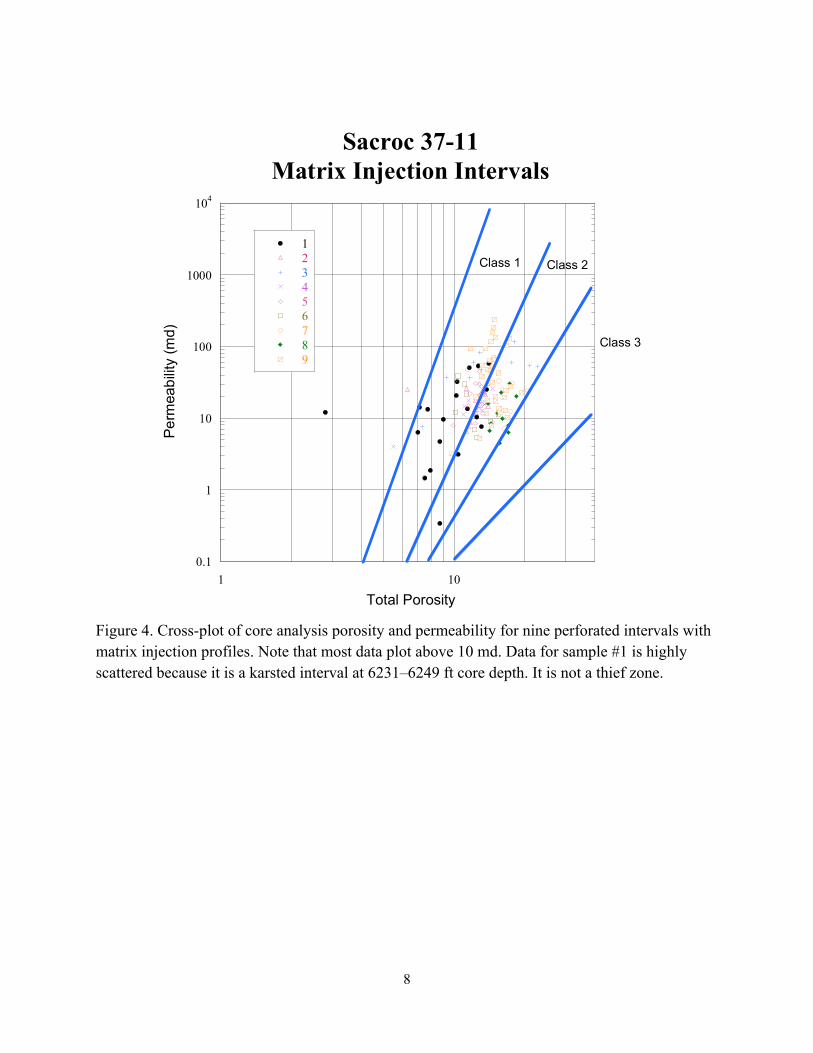
Intervals with no injection are concentrated below a kh of 150 mdft, suggesting a kh cutoff of about 150 mdft for matrix flow (fig. 2). In addition, a 10- or 20-md cutoff is suggested by comparing cross-plots of seven perforated intervals with no injection (fig. 3) with nine intervals with injection (fig. 4). Core permeability from no-injection intervals is mostly less than 20 md, whereas permeability from injection intervals is mostly more than 10 md.
A postulated relationship between matrix porosity and injection volume is constructed by assuming that the low injection values are injection into matrix pores (fig. 2). The range of kh values for 1- to2-% injection is wide, only one point with injection above 4% appears to be matrix flow, and the postulated relationship is guided by that value. Although this is not a robust relationship, it is considered sufficient to define five thief zones (fig. 4). Thief zones are estimated to have Kh values of between 1 and 100 D and an average permeability of 100 md to 7 D (table 1). Matrix Kh values range from 0.1 to 1.3 Dft, with an average permeability of 10 to 71 md. The three intervals with the highest injection percent have estimated permeabilities 83 to 613 times higher than core permeabilities. The two intervals with the lowest injection percentages have estimated permeabilities 5 to 10 time higher than matrix permeabilities.
6
Table 1. Estimated and core permeability values for injection intervals that coincide with perforated intervals.
Thief‐zone injection intervals
Injection Thickness Est. kh Est. k Core kh Core k Est. k/core k
Log depths ft % ft mdft md mdft md ratio
6123 ‐ 6134 7 10 1000 100 100 10 10
6323 ‐ 6333 15 10 20,000 2000 242 24 83
6450 ‐ 6460 7 10 1,000 100 203 20 5
6566 – 6580 19 14 100,000 7143 163 12 613
6600 ‐ 6618 19 18 100,000 5556 1282 71 78
0 5 10 15 20
Injection intervalsPerforated intevals
6100
6200
6300
6400
6500
6600
6700
6800
Injection (%)
Shattered core intervalNo injection
No injection
Selective injection
Selective injection
De
pth
(ft)
Selective injection
Selective injection
Selective injection
Figure 1. Depth plot showing distribution of perforated intervals and injection percentages.

7
Figure 2. Cross-plot of injection interval kh and injection percentage showing a postulated relationship between kh and injection volumes for this polymer injection.
0.1
1
10
100
1000
104
1 10
37-11No-injection intervals with whole core analysis
1
2
3
4
5
6
7
Pe
rme
abi
lity
(md
)
Total Porosity
Class 1 Class 2
Class 3
Figure 3. Cross-plot of core analysis porosity and permeability for seven perforated intervals with no injection. Note that most data plot below 20 md.
02468101214161820
10 100 1000 10000 100000
Injection (%)
KH (mdft)
Sacroc 37‐11Based on kh of injected intervals
Perfswithinjection
8
0.1
1
10
100
1000
104
1 10
Sacroc 37-11Matrix Injection Intervals
123456789
Pe
rmea
bili
ty (
md)
Total Porosity
Class 1 Class 2
Class 3
Figure 4. Cross-plot of core analysis porosity and permeability for nine perforated intervals with matrix injection profiles. Note that most data plot above 10 md. Data for sample #1 is highly scattered because it is a karsted interval at 6231–6249 ft core depth. It is not a thief zone.

9
0 5 10 15 20
Injection intervalsPerforated intevals
6100
6200
6300
6400
6500
6600
6700
6800
Injection (%)
De
pth
(ft)
Thief Zone
Thief Zone
Thief Zone
Thief Zone
Thief Zone
Figure 5. Depth plot showing which injection intervals are considered thief zones.
Relationship of Vertical and Inclined Extension Fractures to Thief Zones
Kinder Morgan contracted John Lorenz to make a detailed fracture assessment of the 37-11 core. The report includes descriptions of vertical, inclined, and tension-gash fractures that are based on core examination. Kinder Morgan concluded that
1. Fluid flow is more a function of porosity than fractures; however, there may be enhanced
permeability from fractures in certain low-porosity zones in the upper Cisco. 2. Possible fracture-enhanced permeability exists between markers B and C (6315–6340 ft,
which is a thief zone) 3. Injection into LLCN3 to ECi1 (Green Zone) looks to be a function of porosity
(not fractures).

10
The number of fractures per foot is plotted vs. depth and compared with injection intervals (fig. 5). Only the fractures that are mapped in the perforated intervals are plotted against depth and compared with injection intervals (fig. 6). The two uppermost injection intervals (not counting data from the shattered core at 6185–6199 ft) have the highest fracture density. However, only the upper interval is considered a thief zone. Permeability in the thief zone at 6,323 to 6,333 ft may be enhanced by fracture permeability, as concluded by Kinder Morgan. The lower three thief zones show no relationship to fracture density. Intervals with no injection or selected injection have fracture densities similar to those of intervals of matrix injection.
Therefore, extension fractures do not explain the occurrence of thief zones in the Sacroc 37-11 well.
6100
6200
6300
6400
6500
6600
6700
6800
0 5 10 15 20
0 5 10 15 20
InjectivityNo. fractures /ft
De
pth
log
(ft)
Fractures/Foot
Injection Percent
Figure 6. Depth plot of vertical and inclined fractures per foot compared with injection percentage.

11
Figure 7. Depth plot of vertical and inclined fractures per foot constrained by perforated intervals compared with injection percentages. Thief zones (T.S.) and perforated intervals with no injection are noted.
Relationship of Tension-Gash Fractures to Thief Zones
Tension-gash fractures studied in this report are associated with stylolites (fig. 8). Whereas fractures in general contribute little to porosity, vertical and inclined fractures may have high

12
permeability (fig. 9). Tension-gash fractures, however, typically have low permeability (fig. 10). Core samples with tension gashes that have less than 5% porosity were selected so as to analyze the contribution of tension-gash fractures to permeability. Carbonates with less than 5% porosity typically have less than 0.1 md permeability, and higher permeability in carbonates with less than 5% porosity is thought to be from nonmatrix pore space. By selecting samples with tension gashes, we hoped to evaluate the maximum permeability that tension-gash fractures, which are related to stylolites, can contribute to permeability.
A plot of tension-gash fractures per foot vs. whole-core permeability for whole-core samples with less than 5% porosity shows no relationship (fig. 10). Permeability ranges from 0.02 to 10 md, with an average permeability of 5.7 md. That tension-gash fractures could contribute the hundreds of millidarcy or Darcy permeability needed for thief-zone flow seems unlikely.
The relationship between injectivity and tension gashes is highly variable (fig. 11, 12); some no-injection intervals have tension gashes and some do not. Similarly, some matrix injection intervals and some thief zones have tension gashes and some do not. Most tension-gash fractures are located in the low-porosity intervals between perforated intervals (fig. 11).
Figure 8. Example of tension-gash fractures associated with stylolites; 6215 ft core depth.

13
Figure 9. Porosity and permeability of planar fractures compared with rock-fabric classes.
0
5
10
15
20
25
30
35
0.01 0.1 1 10 100 1000
Sacroc 36-11Porosity <5%
No
. Te
nsio
n G
ashe
s p
er fo
ot o
f cor
e
Permeability
Mean Permeability = 5.7md
Figure 10. Comparison of permeability and occurrence of tension-gash fractures in samples with less than 5% porosity. Most gash fractures show no correlation with permeability.

14
6100
6200
6300
6400
6500
6600
6700
68000 5 10 15 20
0 5 10 15 20
Tension GashesInjection %
Log
De
pth
No. Tension Gashes/ft
Injection %
Figure 11. Depth plot of injection percentage and tension-gash fractures per foot.

15
6100
6200
6300
6400
6500
6600
6700
68000 5 10 15 20
0 5 10 15 20
Gashes /ftInjection %Perforated Interval
Log
De
pth
No. Tension Gashes/ft
Injection %
Thief zone
Thief zone
Thief zone
Thief zone
Thief zone
No Injection
Bad Data
Figure 12. Depth plot of injection percentage and tension-gash fractures per foot, constrained by perforated interval.

16
Relationship of Maximum and Minimum Permeability to Thief Zones
The ratio of maximum and minimum whole-core permeability measurements is thought to indicate fractured intervals and, thus, to link to anomalously high permeability intervals. Core analysis provides two permeability measurements at 90°. The maximum permeability value was selected, and the ratio of Kmax:Kmin was calculated. Of the five thief zones, only two are associated with a high ratio—6,120 to 6,130 ft and 6,600 to 6,620 ft (fig. 13). The other three intervals have low ratios; two intervals with high ratios are low-porosity, muddy intervals and were not perforated. Therefore, the Kmax:Kmin ratio is not a good indicator of thief zones.
6100
6200
6300
6400
6500
6600
6700
68000 5 10 15 20 25 30 35 40
0 5 10 15 20
Sacroc 37-11
Kmax/KminInjection %Perforations
Log
De
pth
Kmax/Kmin
Injection %
Thief zone
Thief zone
Thief zone
Thief zone
Thief zone
No Injection
Bad Data
Figure 13. Depth plot of the ratio of Kmax:Kmin, injection percent, and perforated intervals.

17
High-Permeability Beds Not Captured by Core Analysis
Minipermeameter data were obtained from four intervals—two with matrix flow and two with thief-zone flow. Permeability of open fractures could not be reliably measured owing to the nature of the minipermeameter probe tip. Results show that minipermeameter data in general cluster? around whole-core data (fig. 14). The minipermeameter data have a few high-permeability values in each interval, probably representing small, open fractures found in the core slabs. No beds of high matrix permeability were found that are not represented in core data.
Figure 14. Depth plot illustrating distribution of permeability measured by minipermeameter and core analysis. Injection interval indicated. Note several high minipermeameter values indicating nonmatrix pore space.
6124
6126
6128
6130
6132
6134
6136
6138
0.01 0.1 1 10 100 100010000100000
Core Depth (ft)
Permeability (md)
Sacroc 37‐11 ‐ 6126‐6136
Miniperm
Kmax
Kmin

18
Cavernous Pore Space
Extensive analysis shows no robust correlation between thief-zone injection percentage and vertical and inclined fractures, tension-gash fractures, the ratio of Kmax:Kmin, or detailed minipermeameter data. This lack of correlation implies the presence of high-permeability pore space between the wells. One possibility is cavernous pore space related to karsting.
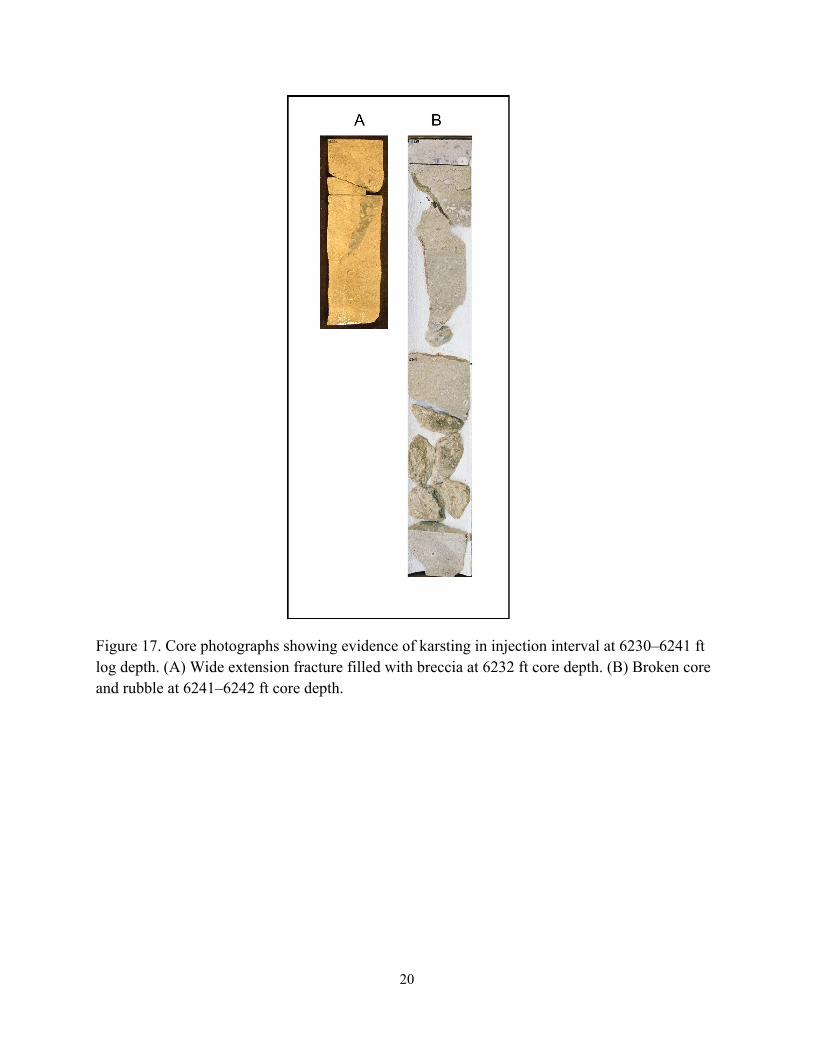
Core descriptions, however, indicate only three perforated intervals with reasonable evidence of karsting. The uppermost thief zone (6120–6130 ft log depth) has the best evidence of karsting, given the presence of large dissolution vugs, vertical stylolites, and a general overall altered appearance (fig. 15). The lowermost thief zone (6600–6620 ft log depth) also has good evidence of karsting, given what appears to be large breccia blocks that have welded together and the presence of one small dissolution vug (fig. 16). The third interval (6230–6241 ft log depth) is not a thief zone. Karsting is suggested by the presence of a wide extension fracture filled with breccia and a 1-ft interval of core breakage (fig. 17).
Figure 15. Core photographs illustrating evidence of karst in injection interval at 6120–6130 ft log depth. (A) Vuggy porosity from core depth 6127 ft (6121 ft log). (B) Core-slab photo from core depths 6126–6136 ft (6120–6130 ft log) showing vertical stylolite and an overall altered appearance.

19
Figure 16. Core photographs showing evidence of karsting in injection interval at 6600–6620 ft log depth. (A) Compacted large breccia at 6609–6611 ft core depth. (B) Small dissolution vug and fractures at 6611–12 ft core depth. (C) Compacted breccia at 6612–6613 ft log depth.
20
Figure 17. Core photographs showing evidence of karsting in injection interval at 6230–6241 ft log depth. (A) Wide extension fracture filled with breccia at 6232 ft core depth. (B) Broken core and rubble at 6241–6242 ft core depth.

21
CONCLUSIONS
No “smoking gun” for identifying thief-zone intervals has been found in this study. Concentrations of fractures are found in some thief zones and not in others, and analysis of core data and minipermeameter measurements is inconclusive. Two thief zones have evidence of karsting and three do not. Therefore, well-bore data are not helpful in characterizing the thief zones in Sacroc 37-11. The pore system responsible for thief-zone flow is distributed throughout the large volume of carbonate in the interwell volume but not sampled by the well bore of 37-11.
The geological/petrophysical model that accounts for thief zones in the Sacroc reservoir has yet to be discovered. However, the study has resulted in an estimation of nonmatrix permeability needed for thief-zone flow. The difference between matrix and nonmatrix permeability in two thief zones is 5 to 10 times that of matrix permeability, or an increase in average permeability from between 10 and 20 md to 100 md. The difference between matrix and nonmatrix permeability is much larger for the other three thief zones. Thief-zone permeability is 80 to 600 times higher than matrix permeability and requires Darcy permeability.
A combination of fracturing and karsting is thought to account for this level of permeability. A combination of fractures and vugs that adds hundreds of millidarcys to matrix permeability is not difficult to imagine. It is more difficult to conceive of a touching-vug system that would add Darcy’s of permeability to the matrix without creating an obvious footprint in the well bore. In either case, the increase in permeability would not require a large increase in porosity because known karsted and fractured high-permeability carbonate reservoirs commonly have low-porosity values.
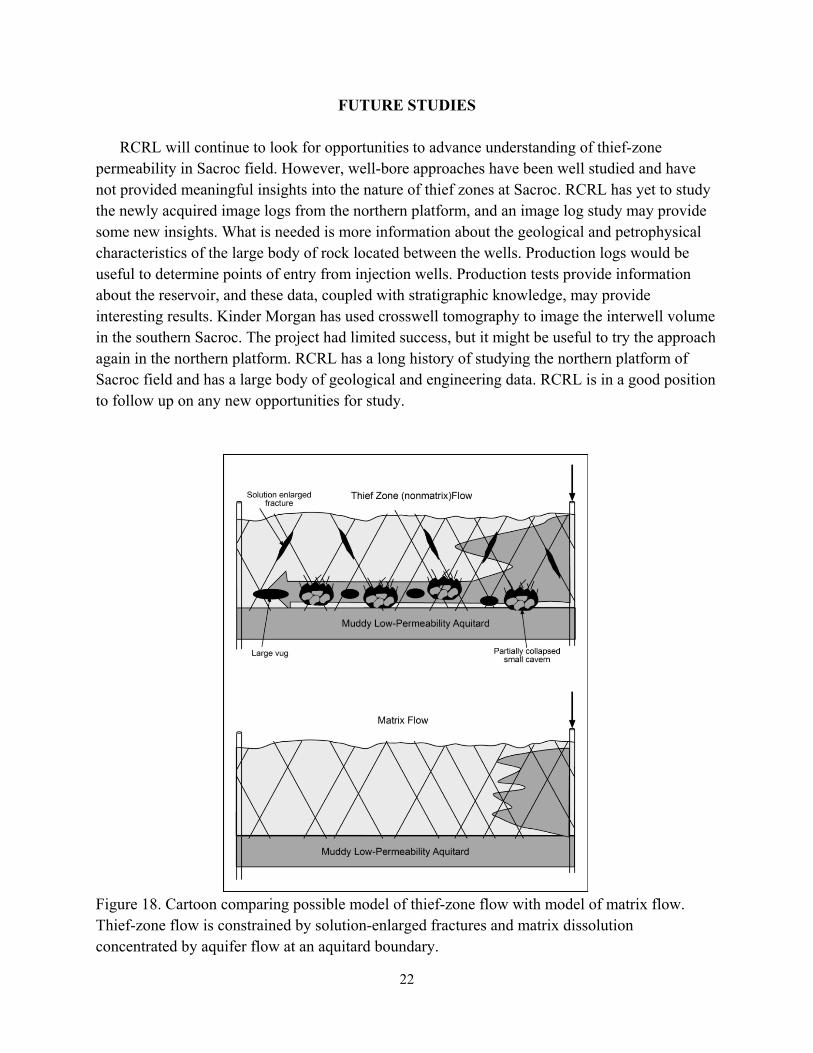
The lack of a robust correlation between well-bore kh and flow in thief zones suggests that the pore system responsible for thief-zone flow is not in direct connection with the well bore. Wells sample only a fraction of the reservoir. Fracture and karst pore space that has Darcy permeability may be scattered throughout the reservoir and may only be encountered by a few wells (fig. 18). Some of the possible processes for creating Darcy flow are (1) solution-enlarged fractures, (2) dissolution concentrated by aquitards, (3) dissolution concentrated at intersections of fractures, (4) dissolution concentrated at intersections of fractures and highly permeable beds, and (5) collapse brecciation of small caverns producing nontectonic fractures. Major controls on the distribution of highly permeable fabrics may include fracture distribution, aquitards, and beds of high matrix permeability.
An offshoot of this study is the conclusion that polymer used in this injection project enters intervals of matrix permeability only where permeability is greater than 10 to 20 md and kh values are greater than 150 mdft. There is no indication that polymer is injected only into the nonmatrix pore system; it appears to be injected into some of the larger matrix pores as well. David Addington of Kinder Morgan has reported a similar conclusion (Email correspondence). He states that current theory says that polymer only enters open void space, and that a relook is needed for us to understand what is really happening in these polymer-conformance injections.
22
FUTURE STUDIES
RCRL will continue to look for opportunities to advance understanding of thief-zone permeability in Sacroc field. However, well-bore approaches have been well studied and have not provided meaningful insights into the nature of thief zones at Sacroc. RCRL has yet to study the newly acquired image logs from the northern platform, and an image log study may provide some new insights. What is needed is more information about the geological and petrophysical characteristics of the large body of rock located between the wells. Production logs would be useful to determine points of entry from injection wells. Production tests provide information about the reservoir, and these data, coupled with stratigraphic knowledge, may provide interesting results. Kinder Morgan has used crosswell tomography to image the interwell volume in the southern Sacroc. The project had limited success, but it might be useful to try the approach again in the northern platform. RCRL has a long history of studying the northern platform of Sacroc field and has a large body of geological and engineering data. RCRL is in a good position to follow up on any new opportunities for study.
Figure 18. Cartoon comparing possible model of thief-zone flow with model of matrix flow. Thief-zone flow is constrained by solution-enlarged fractures and matrix dissolution concentrated by aquifer flow at an aquitard boundary.