re-engineering ammunition residue management … re-engineering ammunition residue management in...
TRANSCRIPT
1
Re-engineering Ammunition Residue Management in
IMCOM-SEPresented By:
CDT Shaun Gilbert
Written By:CDT Marc Eskew
CDT Shaun GilbertCDT Allen Sara
CDT Connor Wicklund
Advisor:LTC Roederer
Unclassified
Report Documentation Page Form ApprovedOMB No. 0704-0188
Public reporting burden for the collection of information is estimated to average 1 hour per response, including the time for reviewing instructions, searching existing data sources, gathering andmaintaining the data needed, and completing and reviewing the collection of information. Send comments regarding this burden estimate or any other aspect of this collection of information,including suggestions for reducing this burden, to Washington Headquarters Services, Directorate for Information Operations and Reports, 1215 Jefferson Davis Highway, Suite 1204, ArlingtonVA 22202-4302. Respondents should be aware that notwithstanding any other provision of law, no person shall be subject to a penalty for failing to comply with a collection of information if itdoes not display a currently valid OMB control number.
1. REPORT DATE 01 JUN 2008
2. REPORT TYPE N/A
3. DATES COVERED -
4. TITLE AND SUBTITLE Re-engineering Ammunition Residue Management in IMCOM-SE
5a. CONTRACT NUMBER
5b. GRANT NUMBER
5c. PROGRAM ELEMENT NUMBER
6. AUTHOR(S) 5d. PROJECT NUMBER
5e. TASK NUMBER
5f. WORK UNIT NUMBER
7. PERFORMING ORGANIZATION NAME(S) AND ADDRESS(ES) United States Military Academy West Point, NY 10996
8. PERFORMING ORGANIZATIONREPORT NUMBER
9. SPONSORING/MONITORING AGENCY NAME(S) AND ADDRESS(ES) 10. SPONSOR/MONITOR’S ACRONYM(S)
11. SPONSOR/MONITOR’S REPORT NUMBER(S)
12. DISTRIBUTION/AVAILABILITY STATEMENT Approved for public release, distribution unlimited
13. SUPPLEMENTARY NOTES See also ADM202527. Military Operations Research Society Symposium (76th) Held in New London,Connecticut on June 10-12, 2008, The original document contains color images.
14. ABSTRACT
15. SUBJECT TERMS
16. SECURITY CLASSIFICATION OF: 17. LIMITATION OF ABSTRACT
SAR
18. NUMBEROF PAGES
44
19a. NAME OFRESPONSIBLE PERSON
a. REPORT unclassified
b. ABSTRACT unclassified
c. THIS PAGE unclassified
Standard Form 298 (Rev. 8-98) Prescribed by ANSI Std Z39-18

2

3
Agenda
• Current System• Value Hierarchy• Alternative Generation• Feasible Alternatives• Collecting Data• Decision Matrix• Life Cycle Cost• Recommended Alternative
4
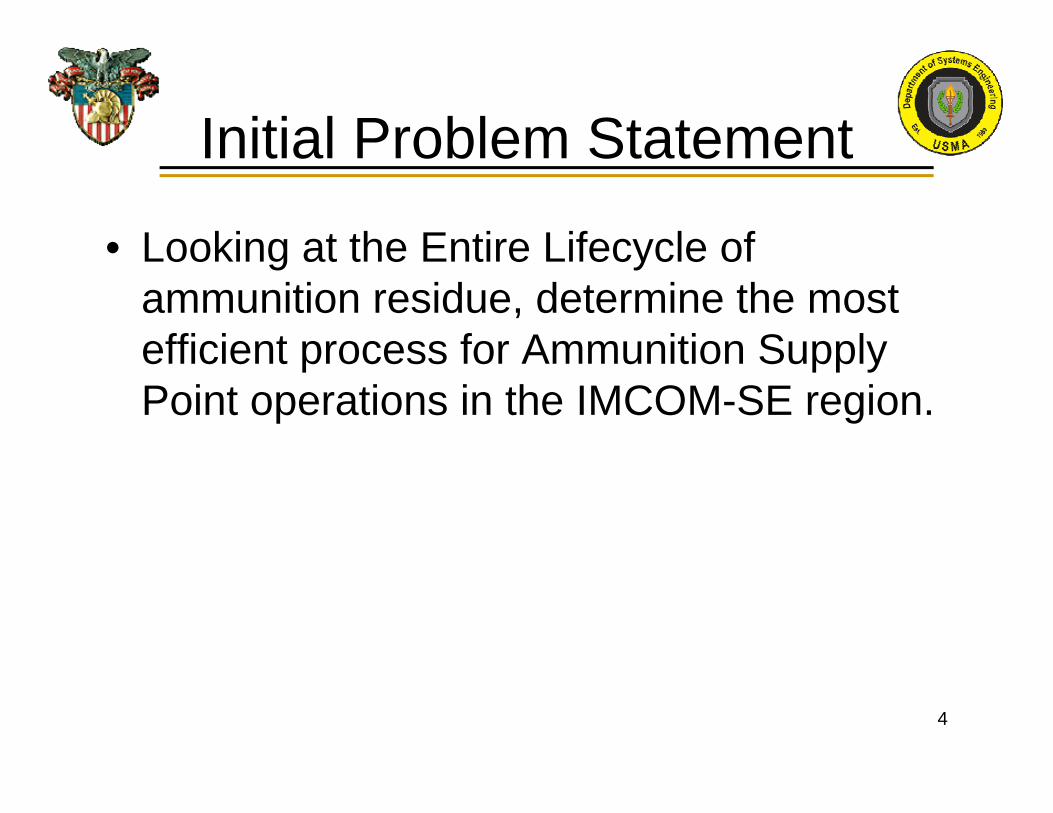
Initial Problem Statement
• Looking at the Entire Lifecycle of ammunition residue, determine the most efficient process for Ammunition Supply Point operations in the IMCOM-SE region.
5
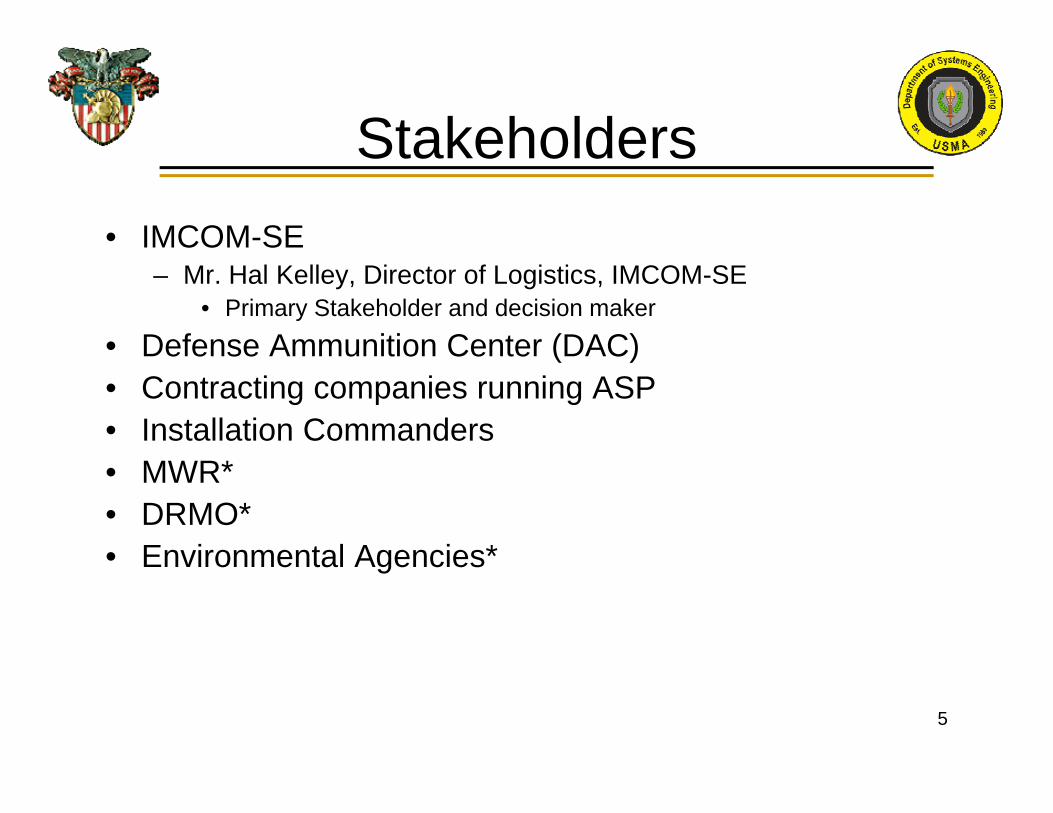
Stakeholders• IMCOM-SE
– Mr. Hal Kelley, Director of Logistics, IMCOM-SE• Primary Stakeholder and decision maker
• Defense Ammunition Center (DAC)• Contracting companies running ASP• Installation Commanders• MWR*• DRMO*• Environmental Agencies*

6
Current System
• IMCOM-SE controls 20 posts, 10 of which produce residue.
• Some ASPs managed and run by contractors, others run by DA Civilians
• No regional Standard• Ammunition residue options
– Qualified Recycling Program (QRP)– Defense Reutilization & Marketing Office
(DRMO)

7
Process Flow Chart
*Based on ASP operations observed at Ft. Benning, GA.

8
Value HierarchySafely and Efficiently Recycle Ammunition
Residue
Collect Residue 0.1321
Minimize Collection Manpower
Minimize Collection Time
Dispose of Residue 0.7171
Recycle Brass 0.4152
Demilitarize Brass 0.2328
Sell Brass 0.0629
Store Brass 0.0252
Transport Brass0.0943
Recycle Non-Automatic Return
Items0.2013
Turn-In Automatic Return Items
0.1006
Inspect Residue 0.1509
Minimize Inspection Manpower
Minimize Inspection Time
Maximize Accountability Maximize items
Maximize Profit
Minimize Demilitarization
Manpower
Minimize Environmental
Impact
Minimize time
Minimize time
Minimize Transport Manpower
Maximize revenueMinimize time
PersonnelLIB
People0.1195
CollectionLIB
Man Hours0.0126
PersonnelLIB
People0.113208
Inspection TimeLIB
Man Hours0.0377
Accountability Percentage
MIBPercent0.1006
Recyclable ItemsMIB
Items0.1258
ProfitMIB
Dollars0.0755
PersonnelLIB
People0.0818
ImpactLIB
Scalar0.0629
Demilitarization TimeLIB
Man Hours0.0881
Transport TimeLIB
Days0.0503
PersonnelLIB
People0.0440
Sales RevenueMIB
Dollars0.0629
Storage TimeLIB
Days0.0252
9
Revised Problem Statement
• Given the ammunition residue lifecycle, determine the most efficient process for Ammunition Supply Point residue management operations in the IMCOM-SE region.

10
Idea Generation
• Brainstorming• Benchmarking• Surveys• Zwicky’s Morphological Box

11
Literature Review• US Army Materiel Command (AMC)• Memo for combined services qualified recycling program• Public Works Technical Bulletin 420-49-18• Qualified Recycling Program (QRP) Development Guide • Disposal of Recyclable Materials-Proceeds Allocation-2577• SOP for Inventory Procedures• SOP 01-Duties and Functions of the Turn In Point at ASP• SOP 08-Residue Yard and Handling of Class 5 Packing Material Turn-in• SOP 14 (Hazcom Procedure)• SOP 15-2nd Count Processes at ASP• SOP 16-Operation and Maintenance of the APE 1408 Safety Certification
System• SOP 17-Small Arms Brass Deformer• DoD 4160.21-M-1 Demilitarization Requirements for Munitions List Items• DODI 4715.4 Pollution Prevention• DODI 5010.36 Productivity Enhancing Capital Investment (PECI)• Standard Concept of Operations for Ammunition Supply Points within CONUS• Army Regulation 420-49
12
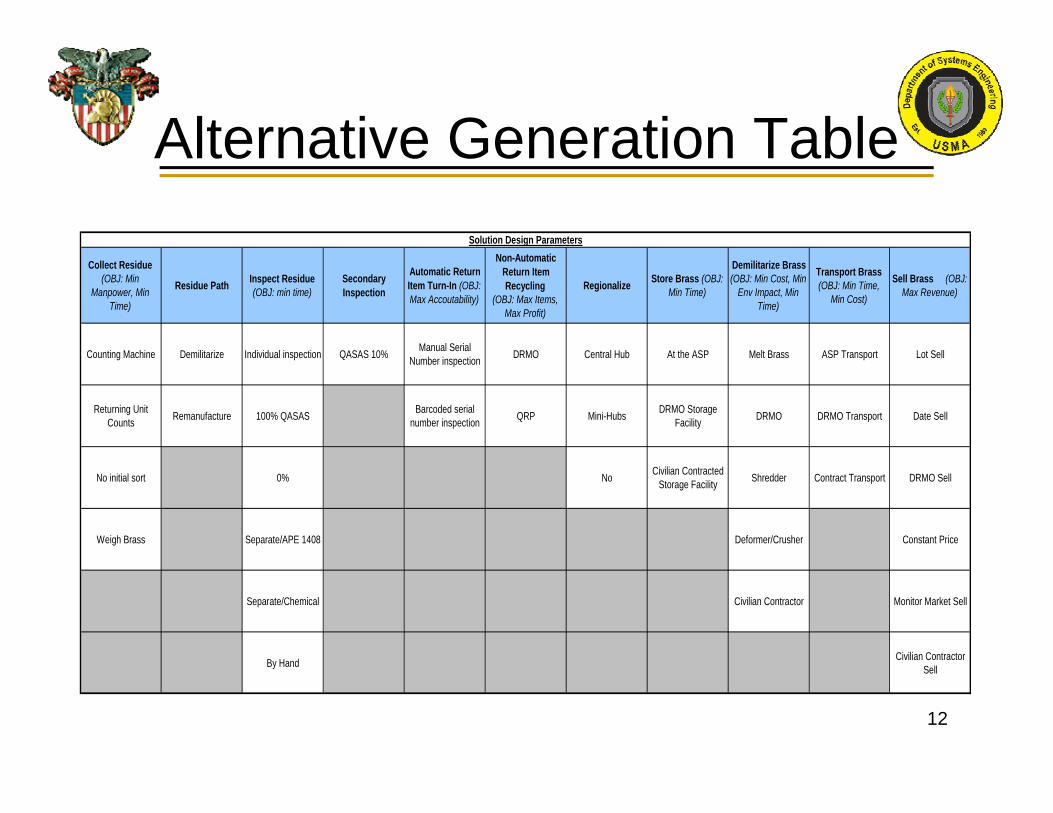
Alternative Generation Table
Collect Residue (OBJ: Min
Manpower, Min Time)
Residue Path Inspect Residue (OBJ: min time)
Secondary Inspection
Automatic Return Item Turn-In (OBJ: Max Accoutability)
Non-Automatic Return Item Recycling
(OBJ: Max Items, Max Profit)
Regionalize Store Brass (OBJ: Min Time)
Demilitarize Brass (OBJ: Min Cost, Min
Env Impact, Min Time)
Transport Brass (OBJ: Min Time,
Min Cost)
Sell Brass (OBJ: Max Revenue)
Counting Machine Demilitarize Individual inspection QASAS 10% Manual Serial Number inspection DRMO Central Hub At the ASP Melt Brass ASP Transport Lot Sell
Returning Unit Counts Remanufacture 100% QASAS Barcoded serial
number inspection QRP Mini-Hubs DRMO Storage Facility DRMO DRMO Transport Date Sell
No initial sort 0% No Civilian Contracted Storage Facility Shredder Contract Transport DRMO Sell
Weigh Brass Separate/APE 1408 Deformer/Crusher Constant Price
Separate/Chemical Civilian Contractor Monitor Market Sell
By Hand Civilian Contractor Sell
Solution Design Parameters
13
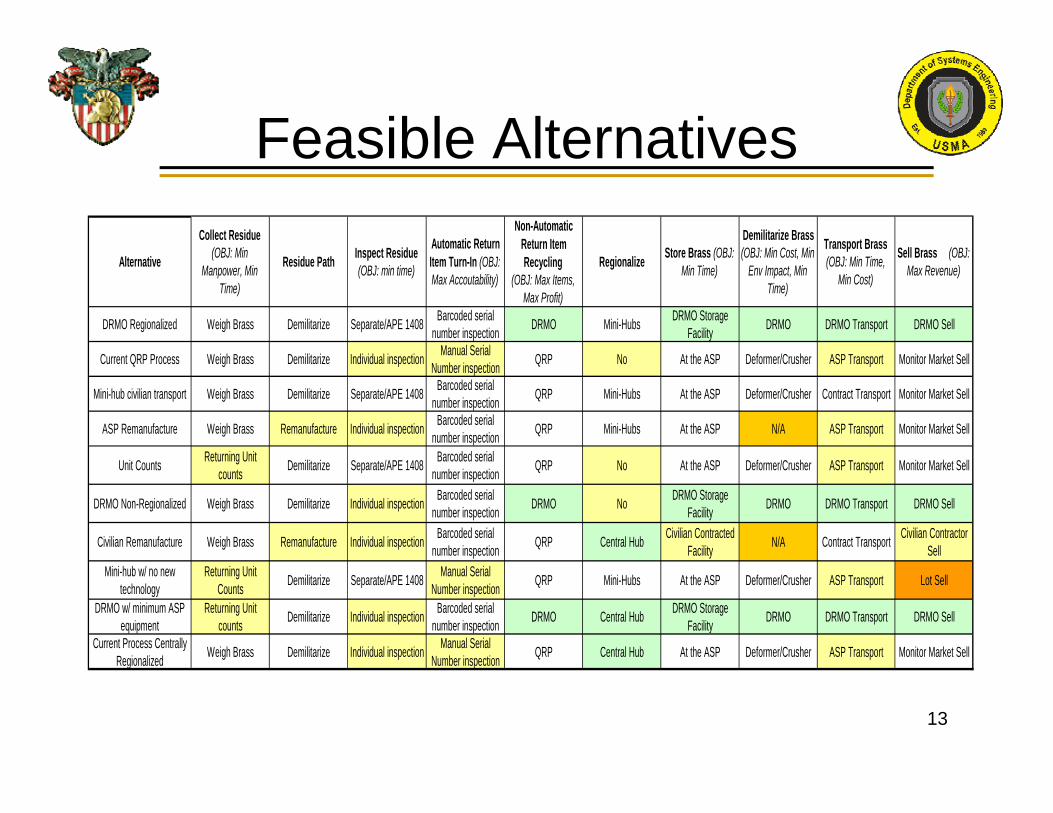
Feasible Alternatives
Alternative
Collect Residue (OBJ: Min
Manpower, Min Time)
Residue Path Inspect Residue (OBJ: min time)
Automatic Return Item Turn-In (OBJ: Max Accoutability)
Non-Automatic Return Item Recycling
(OBJ: Max Items, Max Profit)
Regionalize Store Brass (OBJ: Min Time)
Demilitarize Brass (OBJ: Min Cost, Min
Env Impact, Min Time)
Transport Brass (OBJ: Min Time,
Min Cost)
Sell Brass (OBJ: Max Revenue)
DRMO Regionalized Weigh Brass Demilitarize Separate/APE 1408 Barcoded serial number inspection DRMO Mini-Hubs DRMO Storage
Facility DRMO DRMO Transport DRMO Sell
Current QRP Process Weigh Brass Demilitarize Individual inspection Manual Serial Number inspection QRP No At the ASP Deformer/Crusher ASP Transport Monitor Market Sell
Mini-hub civilian transport Weigh Brass Demilitarize Separate/APE 1408 Barcoded serial number inspection QRP Mini-Hubs At the ASP Deformer/Crusher Contract Transport Monitor Market Sell
ASP Remanufacture Weigh Brass Remanufacture Individual inspection Barcoded serial number inspection QRP Mini-Hubs At the ASP N/A ASP Transport Monitor Market Sell
Unit Counts Returning Unit counts Demilitarize Separate/APE 1408 Barcoded serial
number inspection QRP No At the ASP Deformer/Crusher ASP Transport Monitor Market Sell
DRMO Non-Regionalized Weigh Brass Demilitarize Individual inspection Barcoded serial number inspection DRMO No DRMO Storage
Facility DRMO DRMO Transport DRMO Sell
Civilian Remanufacture Weigh Brass Remanufacture Individual inspection Barcoded serial number inspection QRP Central Hub Civilian Contracted
Facility N/A Contract Transport Civilian Contractor Sell
Mini-hub w/ no new technology
Returning Unit Counts Demilitarize Separate/APE 1408 Manual Serial
Number inspection QRP Mini-Hubs At the ASP Deformer/Crusher ASP Transport Lot Sell
DRMO w/ minimum ASP equipment
Returning Unit counts Demilitarize Individual inspection Barcoded serial
number inspection DRMO Central Hub DRMO Storage Facility DRMO DRMO Transport DRMO Sell
Current Process Centrally Regionalized Weigh Brass Demilitarize Individual inspection Manual Serial
Number inspection QRP Central Hub At the ASP Deformer/Crusher ASP Transport Monitor Market Sell

14
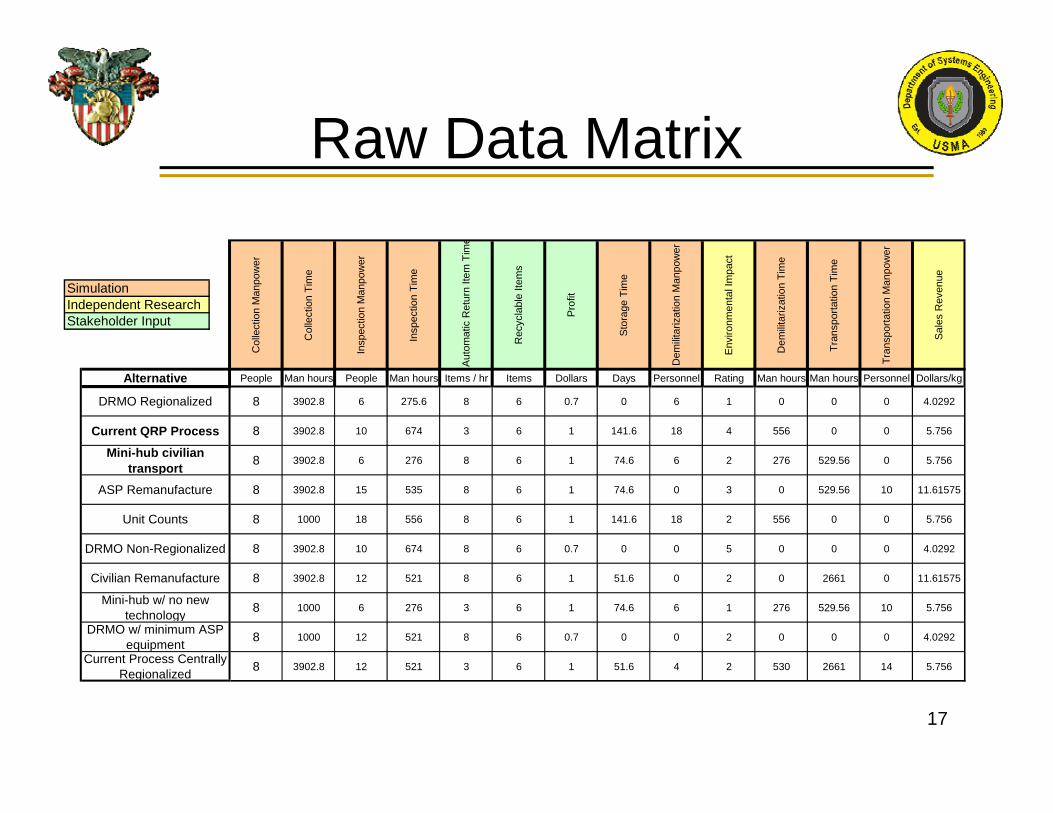
Raw Data Matrix
SimulationIndependent ResearchStakeholder Input
Col
lect
ion
Man
pow
er
Col
lect
ion
Tim
e
Insp
ectio
n M
anpo
wer
Insp
ectio
n Ti
me
Aut
omat
ic R
etur
n Ite
m T
ime
Rec
ycla
ble
Item
s
Prof
it
Stor
age
Tim
e
Dem
ilitar
izat
ion
Man
pow
er
Env
ironm
enta
l Im
pact
Dem
ilitar
izat
ion
Tim
e
Tran
spor
tatio
n Ti
me
Tran
spor
tatio
n M
anpo
wer
Sal
es R
even
ue
Alternative People Man hours People Man hours Items / hr Items Dollars Days Personnel Rating Man hours Man hours Personnel Dollars/kg
DRMO Regionalized 8 3902.8 6 275.6 8 6 0.7 0 6 1 0 0 0 4.0292
Current QRP Process 8 3902.8 10 674 3 6 1 141.6 18 4 556 0 0 5.756
Mini-hub civilian transport 8 3902.8 6 276 8 6 1 74.6 6 2 276 529.56 0 5.756
ASP Remanufacture 8 3902.8 15 535 8 6 1 74.6 0 3 0 529.56 10 11.61575
Unit Counts 8 1000 18 556 8 6 1 141.6 18 2 556 0 0 5.756
DRMO Non-Regionalized 8 3902.8 10 674 8 6 0.7 0 0 5 0 0 0 4.0292
Civilian Remanufacture 8 3902.8 12 521 8 6 1 51.6 0 2 0 2661 0 11.61575
Mini-hub w/ no new technology 8 1000 6 276 3 6 1 74.6 6 1 276 529.56 10 5.756
DRMO w/ minimum ASP equipment 8 1000 12 521 8 6 0.7 0 0 2 0 0 0 4.0292
Current Process Centrally Regionalized 8 3902.8 12 521 3 6 1 51.6 4 2 530 2661 14 5.756

15
Multi-Hub Load Distance
Hub 1 -87.62 36.59 1.00Hub 2 -80.83 34.04 4.00Hub 3 -84.83 32.40 9.00
Post Lat Lon Load l dx1 l dy1 distance km l dx2 l dy2 km l dx3 l dy3 km Min distFort Campbell 1 -87.62 36.59 26.30 0.00 0.00 0.00 0.00 178.52 67.05 190.70 73.48 110.38 132.60 0.00Fort Knox 2 -85.90 37.90 18.77 32.25 24.59 40.56 211.00 95.12 72.43 119.55 20.17 103.34 105.29 40.56Fort Gordon 3 -82.24 33.35 2.73 14.67 8.83 17.12 3.83 1.89 4.27 151.00 7.05 2.60 7.52 4.27Fort Jackson 4 -80.83 34.04 25.20 171.03 64.23 182.70 0.00 0.00 0.00 0.00 100.63 41.51 108.86 0.00Fort McPherson 5 -84.44 33.71 0.41 1.31 1.18 1.76 1.48 0.14 1.48 0.16 0.54 0.56 150.00 0.56Fort Stewart 6 -81.60 31.98 13.94 83.99 64.28 105.77 10.64 28.74 30.65 240.00 45.04 5.77 45.41 30.65Fort Rucker 7 -85.74 31.40 0.00 0.00 0.00 0.00 0.00 0.00 0.00 0.00 0.00 0.00 0.00Fort Bragg 8 -79.14 35.11 12.37 104.96 18.29 106.55 20.99 13.25 24.82 196.00 70.40 33.63 78.02 24.82Fort Benning 9 -84.83 32.40 41.16 114.99 172.73 207.51 164.37 67.81 177.81 0.00 0.00 0.00 0.00 0.00
140.88523.21 354.15 474.93 251.29 316.94 297.77 2218.30
Transportation Model, Three Hubs

16
ProModel Simulation
17
Raw Data Matrix
SimulationIndependent ResearchStakeholder Input
Col
lect
ion
Man
pow
er
Col
lect
ion
Tim
e
Insp
ectio
n M
anpo
wer
Insp
ectio
n Ti
me
Aut
omat
ic R
etur
n Ite
m T
ime
Rec
ycla
ble
Item
s
Prof
it
Stor
age
Tim
e
Dem
ilitar
izat
ion
Man
pow
er
Env
ironm
enta
l Im
pact
Dem
ilitar
izat
ion
Tim
e
Tran
spor
tatio
n Ti
me
Tran
spor
tatio
n M
anpo
wer
Sal
es R
even
ue
Alternative People Man hours People Man hours Items / hr Items Dollars Days Personnel Rating Man hours Man hours Personnel Dollars/kg
DRMO Regionalized 8 3902.8 6 275.6 8 6 0.7 0 6 1 0 0 0 4.0292
Current QRP Process 8 3902.8 10 674 3 6 1 141.6 18 4 556 0 0 5.756
Mini-hub civilian transport 8 3902.8 6 276 8 6 1 74.6 6 2 276 529.56 0 5.756
ASP Remanufacture 8 3902.8 15 535 8 6 1 74.6 0 3 0 529.56 10 11.61575
Unit Counts 8 1000 18 556 8 6 1 141.6 18 2 556 0 0 5.756
DRMO Non-Regionalized 8 3902.8 10 674 8 6 0.7 0 0 5 0 0 0 4.0292
Civilian Remanufacture 8 3902.8 12 521 8 6 1 51.6 0 2 0 2661 0 11.61575
Mini-hub w/ no new technology 8 1000 6 276 3 6 1 74.6 6 1 276 529.56 10 5.756
DRMO w/ minimum ASP equipment 8 1000 12 521 8 6 0.7 0 0 2 0 0 0 4.0292
Current Process Centrally Regionalized 8 3902.8 12 521 3 6 1 51.6 4 2 530 2661 14 5.756

18
Value Curve Example
• Example: If the number of personnel is 10, the curve is used to translate that number to a unitless value. In this case, 10 personnel translates to a value of 84.
Inspection Manpower
0
20
40
60
80
100
2 12 22 32 42
Personnel
Val
ue

19
Decision Matrix
SimulationIndependent ResearchStakeholder Input
Col
lect
ion
Man
pow
er
Col
lect
ion
Tim
e
Insp
ectio
n M
anpo
wer
Insp
ectio
n Ti
me
Auto
mat
ic R
etur
n Ite
m T
ime
Rec
ycla
ble
Item
s
Prof
it
Stor
age
Tim
e
Dem
ilitar
izat
ion
Man
pow
er
Envi
ronm
enta
l Im
pact
Dem
ilitar
izat
ion
Tim
e
Tran
spor
tatio
n Ti
me
Tran
spor
tatio
n M
anpo
wer
Sal
es R
even
ue
Tota
l Val
ue S
core
s
Alternative People Man hours People Man hours Items / hr Items % Days Personnel Rating Man hours Man hours Personnel Dollars/kgGlobal Weights 0.1195 0.0126 0.113208 0.0377 0.1006 0.1258 0.0755 0.0252 0.0818 0.0629 0.0881 0.0503 0.044 0.0629
DRMO Regionalized 98.00 27.43 92.00 84.31 80.00 60.00 70.00 100.00 90.40 20.00 100.00 100.00 100.00 26.8677.63
Current QRP Process 98.00 27.43 84.00 26.94 30.00 60.00 100.00 11.36 71.20 80.00 44.40 100.00 100.00 38.3767.60
Mini-hub civilian transport 98.00 27.43 92.00 84.26 80.00 60.00 100.00 50.27 90.40 40.00 72.40 80.74 100.00 38.37
77.23
ASP Remanufacture 98.00 27.43 74.00 46.96 80.00 60.00 100.00 50.27 100.00 60.00 100.00 80.74 80.00 77.4479.83
Unit Counts 98.00 100.00 68.00 43.94 80.00 60.00 100.00 11.36 71.20 40.00 44.40 100.00 100.00 38.3769.85
DRMO Non-Regionalized 98.00 27.43 84.00 26.94 80.00 60.00 70.00 100.00 100.00 100.00 100.00 100.00 100.00 26.86
80.38
Civilian Remanufacture 98.00 27.43 80.00 48.98 80.00 60.00 100.00 65.60 100.00 40.00 100.00 3.24 100.00 77.4476.70
Mini-hub w/ no new technology 98.00 100.00 92.00 84.26 30.00 60.00 100.00 50.27 90.40 20.00 72.40 80.74 80.00 38.37
70.97DRMO w/ minimum
ASP equipment 98.00 100.00 80.00 48.98 80.00 60.00 70.00 100.00 100.00 40.00 100.00 100.00 100.00 26.8677.90
Current Process Centrally Regionalized 98.00 27.43 80.00 48.98 30.00 60.00 100.00 65.60 93.60 40.00 47.00 3.24 72.00 38.37 62.79
20
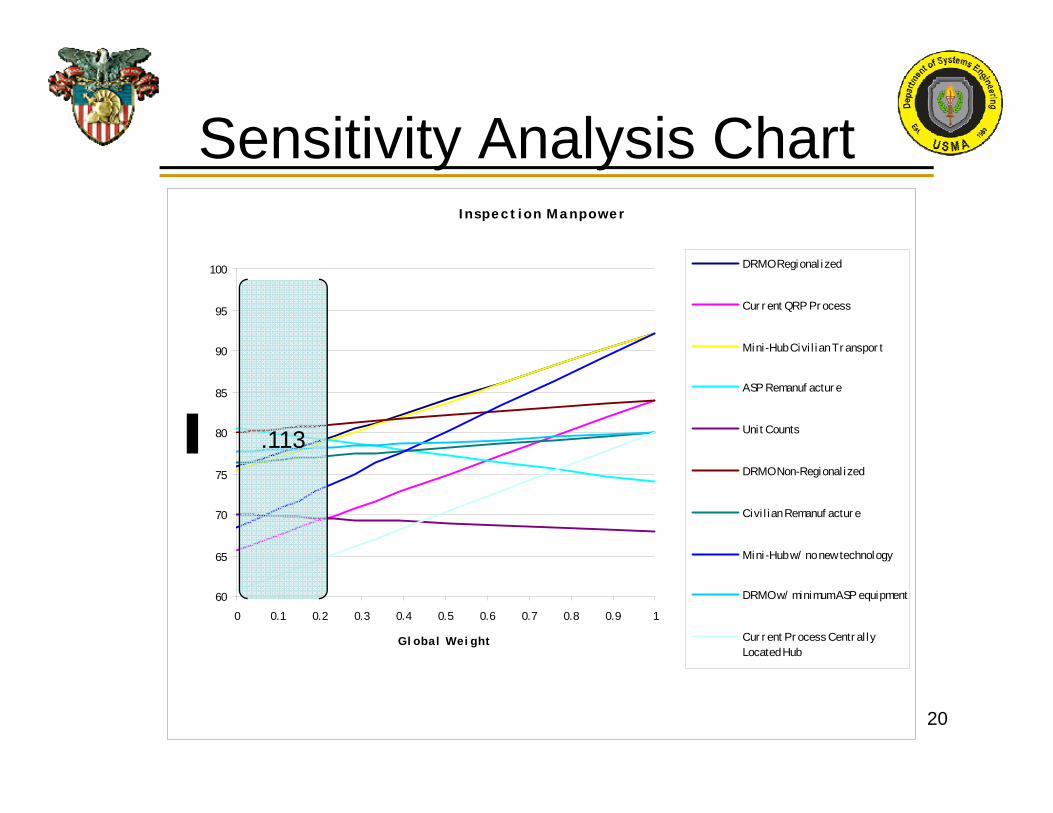
Sensitivity Analysis ChartI nspe c t i on M a npowe r
60
65
70
75
80
85
90
95
100
0 0.1 0.2 0.3 0.4 0.5 0.6 0.7 0.8 0.9 1
Gl obal Wei ght
DRMO Regional ized
Cur r ent QRP Pr ocess
Mini-Hub Civi l ian Tr anspor t
ASP Remanuf actur e
Uni t Counts
DRMO Non-Regional ized
Civi l ian Remanuf actur e
Mini-Hub w/ no new technology
DRMO w/ minimum ASP equipment
Cur r ent Pr ocess Centr al lyLocated Hub
.113
21
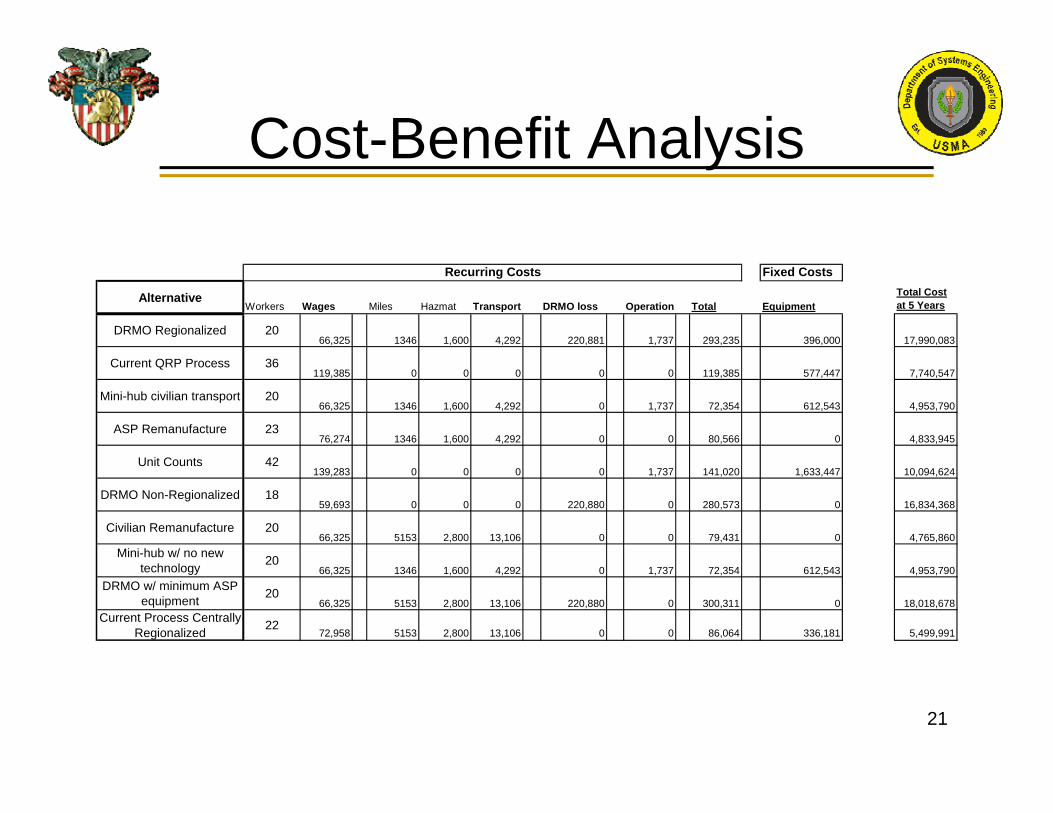
Cost-Benefit Analysis
Fixed Costs
AlternativeWorkers Wages Miles Hazmat Transport DRMO loss Operation Total Equipment
Total Costat 5 Years
DRMO Regionalized 2066,325 1346 1,600 4,292 220,881 1,737 293,235 396,000 17,990,083
Current QRP Process 36119,385 0 0 0 0 0 119,385 577,447 7,740,547
Mini-hub civilian transport 2066,325 1346 1,600 4,292 0 1,737 72,354 612,543 4,953,790
ASP Remanufacture 2376,274 1346 1,600 4,292 0 0 80,566 0 4,833,945
Unit Counts 42139,283 0 0 0 0 1,737 141,020 1,633,447 10,094,624
DRMO Non-Regionalized 1859,693 0 0 0 220,880 0 280,573 0 16,834,368
Civilian Remanufacture 2066,325 5153 2,800 13,106 0 0 79,431 0 4,765,860
Mini-hub w/ no new technology 20
66,325 1346 1,600 4,292 0 1,737 72,354 612,543 4,953,790DRMO w/ minimum ASP
equipment 2066,325 5153 2,800 13,106 220,880 0 300,311 0 18,018,678
Current Process Centrally Regionalized 22
72,958 5153 2,800 13,106 0 0 86,064 336,181 5,499,991
Recurring Costs

22
Total Value Score vs. Cost Chart
TVS vs. Cost at 5 Years
Mini-hub civilian transport
DRMO Regionalized
Current QRP Process
ASP Remanufacture
Unit Counts
DRMO Non-Regionalized
Civilian Remanufacture
Mini-hub w / no new technology
DRMO w / minimum ASP equipment
Current Process Centrally Regionalized
60.00
65.00
70.00
75.00
80.00
85.00
0 2,000,000 4,000,000 6,000,000 8,000,000 10,000,000 12,000,000 14,000,000 16,000,000 18,000,000
Cost
TVS
23
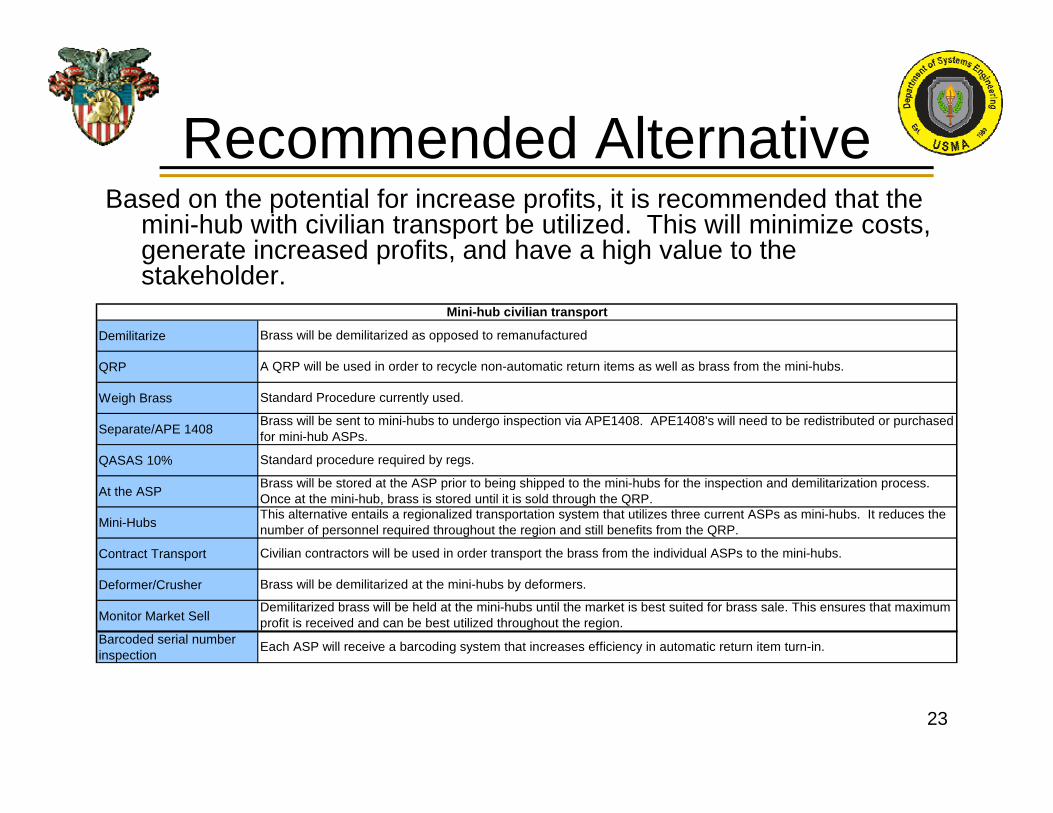
Recommended AlternativeBased on the potential for increase profits, it is recommended that the
mini-hub with civilian transport be utilized. This will minimize costs, generate increased profits, and have a high value to the stakeholder.
Demilitarize
QRP
Weigh Brass
Separate/APE 1408
QASAS 10%
At the ASP
Mini-Hubs
Contract Transport
Deformer/Crusher
Monitor Market Sell
Barcoded serial number inspection
Brass will be sent to mini-hubs to undergo inspection via APE1408. APE1408's will need to be redistributed or purchased for mini-hub ASPs.
Brass will be demilitarized as opposed to remanufactured
Standard Procedure currently used.
Mini-hub civilian transport
This alternative entails a regionalized transportation system that utilizes three current ASPs as mini-hubs. It reduces the number of personnel required throughout the region and still benefits from the QRP.
A QRP will be used in order to recycle non-automatic return items as well as brass from the mini-hubs.
Each ASP will receive a barcoding system that increases efficiency in automatic return item turn-in.
Standard procedure required by regs.
Demilitarized brass will be held at the mini-hubs until the market is best suited for brass sale. This ensures that maximum profit is received and can be best utilized throughout the region.
Civilian contractors will be used in order transport the brass from the individual ASPs to the mini-hubs.
Brass will be demilitarized at the mini-hubs by deformers.
Brass will be stored at the ASP prior to being shipped to the mini-hubs for the inspection and demilitarization process. Once at the mini-hub, brass is stored until it is sold through the QRP.

24
Questions?
25
Backup Slides

26
ProModel Simulation
27
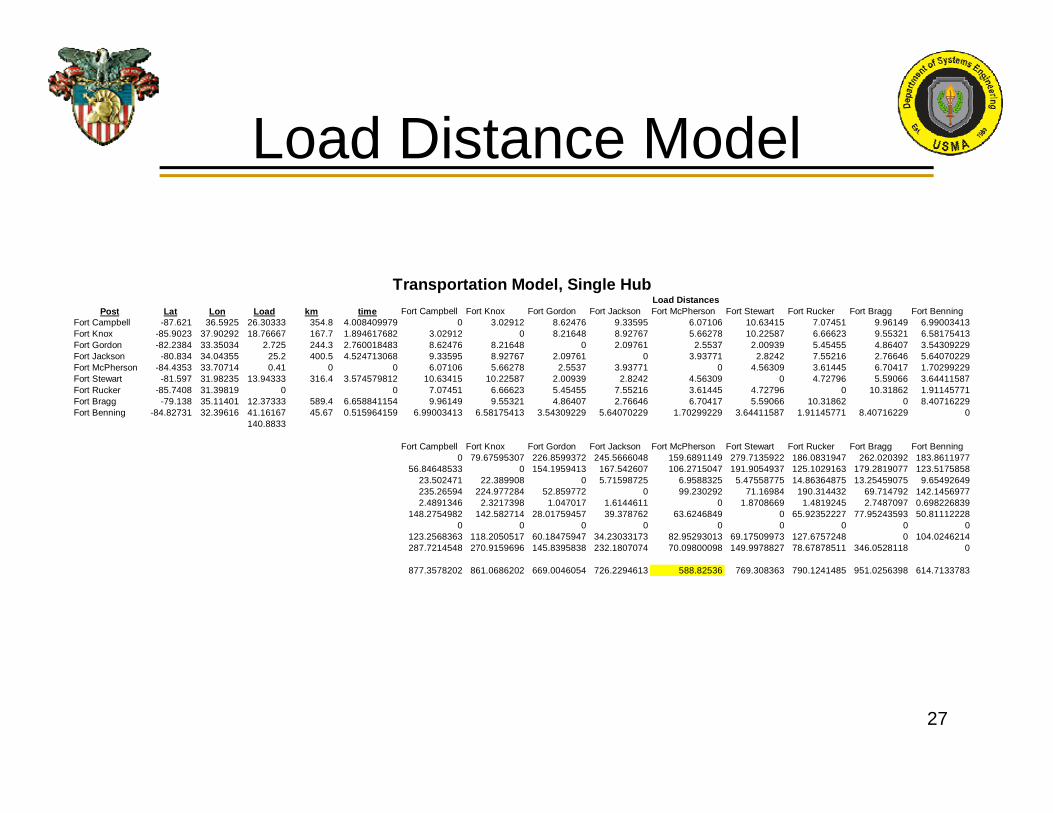
Load Distance Model
Post Lat Lon Load km time Fort Campbell Fort Knox Fort Gordon Fort Jackson Fort McPherson Fort Stewart Fort Rucker Fort Bragg Fort BenningFort Campbell -87.621 36.5925 26.30333 354.8 4.008409979 0 3.02912 8.62476 9.33595 6.07106 10.63415 7.07451 9.96149 6.99003413Fort Knox -85.9023 37.90292 18.76667 167.7 1.894617682 3.02912 0 8.21648 8.92767 5.66278 10.22587 6.66623 9.55321 6.58175413Fort Gordon -82.2384 33.35034 2.725 244.3 2.760018483 8.62476 8.21648 0 2.09761 2.5537 2.00939 5.45455 4.86407 3.54309229Fort Jackson -80.834 34.04355 25.2 400.5 4.524713068 9.33595 8.92767 2.09761 0 3.93771 2.8242 7.55216 2.76646 5.64070229Fort McPherson -84.4353 33.70714 0.41 0 0 6.07106 5.66278 2.5537 3.93771 0 4.56309 3.61445 6.70417 1.70299229Fort Stewart -81.597 31.98235 13.94333 316.4 3.574579812 10.63415 10.22587 2.00939 2.8242 4.56309 0 4.72796 5.59066 3.64411587Fort Rucker -85.7408 31.39819 0 0 7.07451 6.66623 5.45455 7.55216 3.61445 4.72796 0 10.31862 1.91145771Fort Bragg -79.138 35.11401 12.37333 589.4 6.658841154 9.96149 9.55321 4.86407 2.76646 6.70417 5.59066 10.31862 0 8.40716229Fort Benning -84.82731 32.39616 41.16167 45.67 0.515964159 6.99003413 6.58175413 3.54309229 5.64070229 1.70299229 3.64411587 1.91145771 8.40716229 0
140.8833
Fort Campbell Fort Knox Fort Gordon Fort Jackson Fort McPherson Fort Stewart Fort Rucker Fort Bragg Fort Benning0 79.67595307 226.8599372 245.5666048 159.6891149 279.7135922 186.0831947 262.020392 183.8611977
56.84648533 0 154.1959413 167.542607 106.2715047 191.9054937 125.1029163 179.2819077 123.517585823.502471 22.389908 0 5.71598725 6.9588325 5.47558775 14.86364875 13.25459075 9.65492649235.26594 224.977284 52.859772 0 99.230292 71.16984 190.314432 69.714792 142.14569772.4891346 2.3217398 1.047017 1.6144611 0 1.8708669 1.4819245 2.7487097 0.698226839
148.2754982 142.582714 28.01759457 39.378762 63.6246849 0 65.92352227 77.95243593 50.811122280 0 0 0 0 0 0 0 0
123.2568363 118.2050517 60.18475947 34.23033173 82.95293013 69.17509973 127.6757248 0 104.0246214287.7214548 270.9159696 145.8395838 232.1807074 70.09800098 149.9978827 78.67878511 346.0528118 0
877.3578202 861.0686202 669.0046054 726.2294613 588.82536 769.308363 790.1241485 951.0256398 614.7133783
Transportation Model, Single HubLoad Distances

28
Swing Weight MatrixImportance
High Medium Low
High
Recyclable Non-Accountable Items
100 Demil Time Transportation Time
Personnel - Collection 70 40
95 Demil Personnel Transportation personnel
Personnel - Inspect 65 35
Variability
90
Medium
Profit - Non-Accountable
Processing time - Accountable Items 60 Storage Time
80 Sales Revenue 20
50
Low Environmental Impact Inspection Time - Inspect Res Collection Time
50 30 10

29
Value CurvesInspection Manpower
0
20
40
60
80
100
2 12 22 32 42
Personnel
Valu
e
Inspection Time
0
20
40
60
80
100
50 100 150 200 250
Manhours
Valu
e
Automatic Turn-in Time
0
20
40
60
80
100
10 30 50 70 90
Manhour
Valu
e
Storage Time
0
20
40
60
80
100
10 30 50 70 90
Days
Valu
e

30
Value CurveDemilitarization Cost
2030405060708090
100
0 200000 400000 600000 800000 1000000
Dollars
Valu
e
Environmental Impact
0
20
40
60
80
100
Terrible Poor Fair Good Excellent
Impact
Valu
e
Collection Manpow er
0
20
40
60
80
100
120
0 10 20 30 40 50 60
Personnel
Valu
e
Collection Time
0
20
40
60
80
100
120
0 2 4 6 8 10 12
Man hours
Valu
e
31
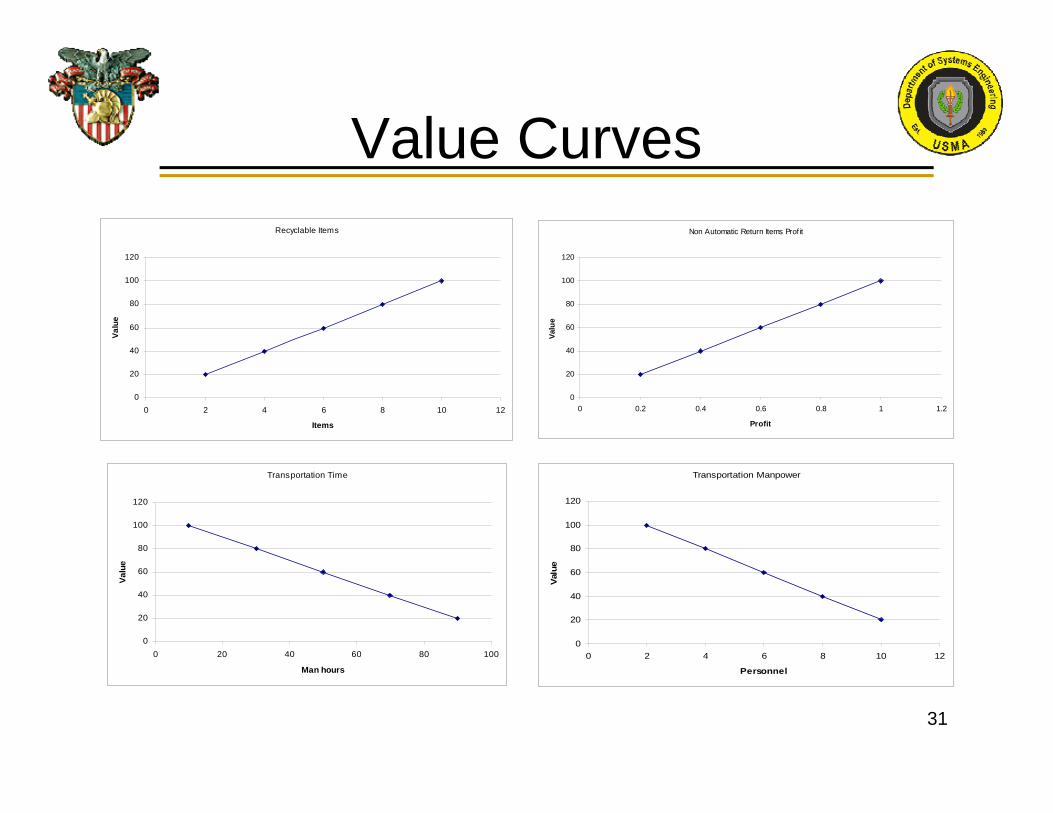
Value CurvesRecyclable Items
0
20
40
60
80
100
120
0 2 4 6 8 10 12
Items
Valu
e
Non Automatic Return Items Profit
0
20
40
60
80
100
120
0 0.2 0.4 0.6 0.8 1 1.2
Profit
Valu
e
Transportation Time
0
20
40
60
80
100
120
0 20 40 60 80 100
Man hours
Valu
e
Transportation Manpower
0
20
40
60
80
100
120
0 2 4 6 8 10 12
Personnel
Valu
e
32
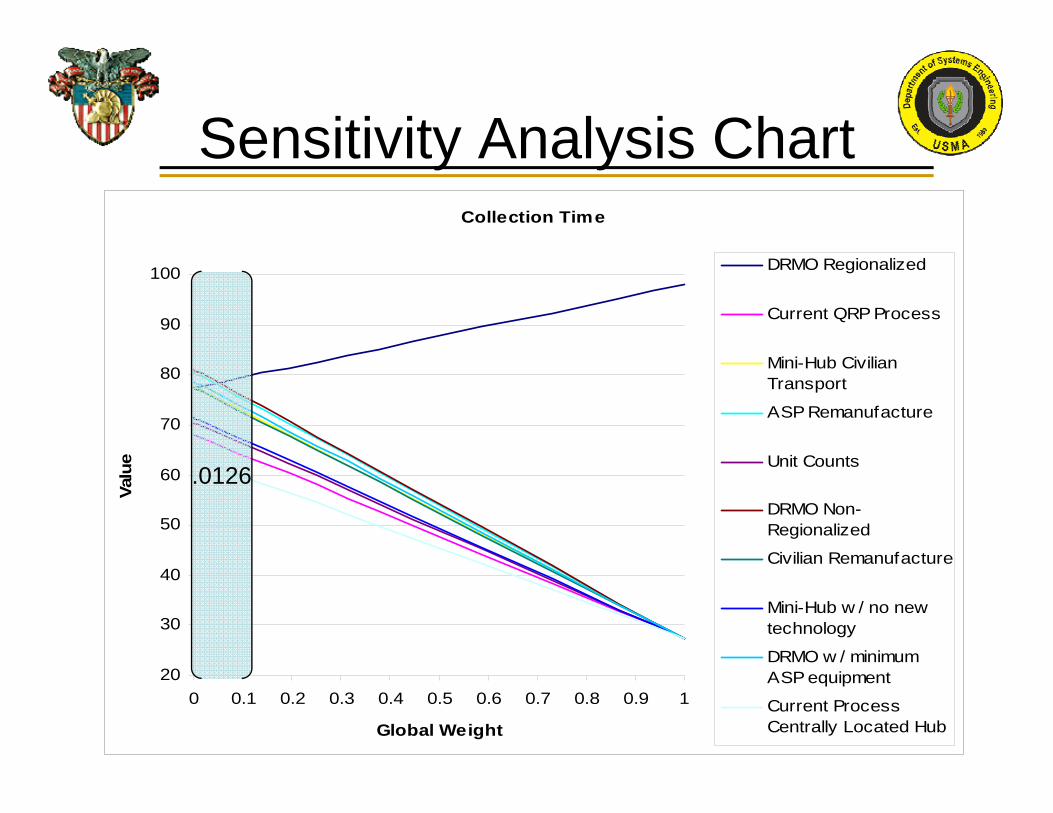
Sensitivity Analysis ChartCollection Time
20
30
40
50
60
70
80
90
100
0 0.1 0.2 0.3 0.4 0.5 0.6 0.7 0.8 0.9 1
Global Weight
Valu
e
DRMO Regionalized
Current QRP Process
Mini-Hub CivilianTransport
ASP Remanufacture
Unit Counts
DRMO Non-Regionalized
Civilian Remanufacture
Mini-Hub w / no newtechnology
DRMO w / minimumASP equipment
Current ProcessCentrally Located Hub
.0126

33
Sensitivity Analysis ChartsInspection Time
20
30
40
50
60
70
80
90
100
0 0.1 0.2 0.3 0.4 0.5 0.6 0.7 0.8 0.9 1
Gl oba l We i ght
DRMO Regionalized
Current QRP Process
Mini-Hub Civilian Transport
ASP Remanuf act ure
Unit Count s
DRMO Non-Regionalized
Civilian Remanuf act ure
Mini-Hub w/ no new t echnology
DRMO w/ minimum ASP equipment
Current Process Cent rally Locat edHub
.038

34
Sensitivity Analysis ChartsProfits
60
65
70
75
80
85
90
95
100
0 0.1 0.2 0.3 0.4 0.5 0.6 0.7 0.8 0.9 1
Glob al W eig ht
DRM O Regionalized
Current QRP Process
M ini-Hub Civilian Transport
ASP Remanufacture
Unit Counts
DRM O Non-Regionalized
Civilian Remanufacture
M ini-Hub w/ no new technology
DRM O w/ minimum ASP equipment
Current Process Centrally LocatedHub
.0755

35
Sensitivity Analysis ChartsEnvironmental Impact
0
10
20
30
40
50
60
70
80
90
100
0 0.1 0.2 0.3 0.4 0.5 0.6 0.7 0.8 0.9 1
Gl oba l We i ght
DRMO Regionalized
Current QRP Process
Mini-Hub Civilian Transport
ASP Remanuf act ure
Unit Count s
DRMO Non-Regionalized
Civilian Remanuf act ure
Mini-Hub w/ no new t echnology
DRMO w/ minimum ASP equipment
Current Process Cent rally Locat ed Hub
.0629
36
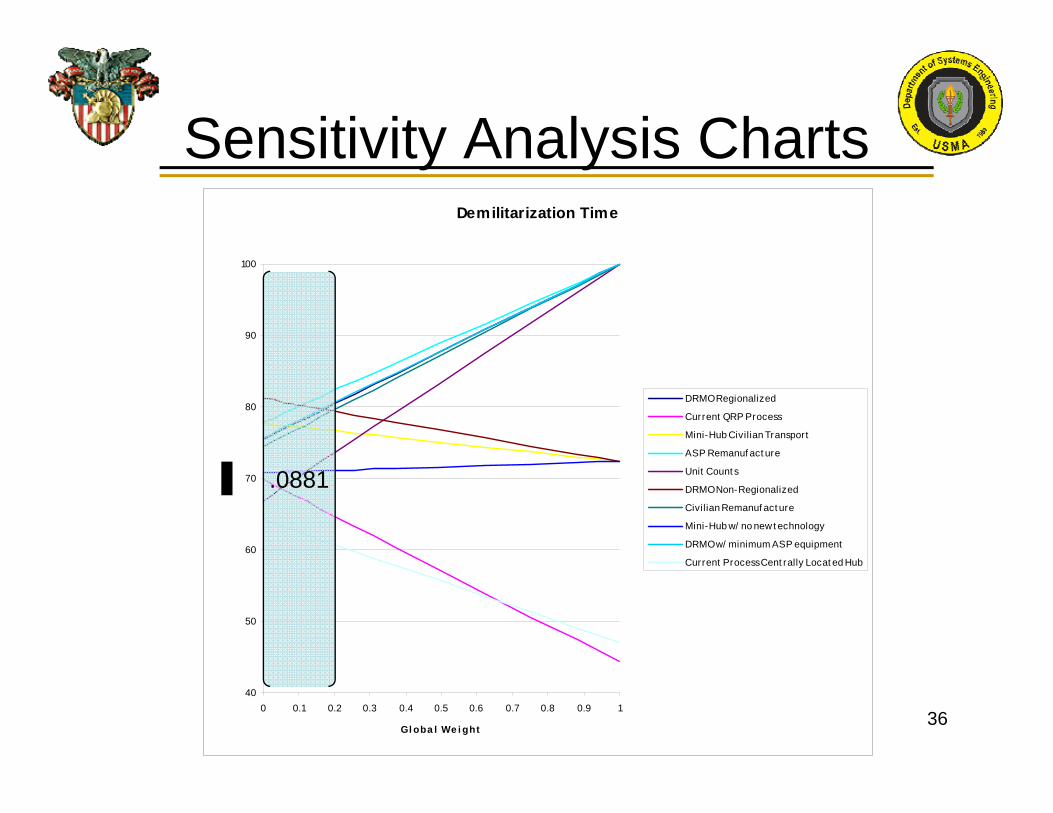
Sensitivity Analysis ChartsDemilitarization Time
40
50
60
70
80
90
100
0 0.1 0.2 0.3 0.4 0.5 0.6 0.7 0.8 0.9 1
Gl oba l We i ght
DRMO Regionalized
Current QRP Process
Mini-Hub Civilian Transport
ASP Remanuf act ure
Unit Count s
DRMO Non-Regionalized
Civilian Remanuf act ure
Mini-Hub w/ no new t echnology
DRMO w/ minimum ASP equipment
Current Process Cent rally Locat ed Hub
.0881
37
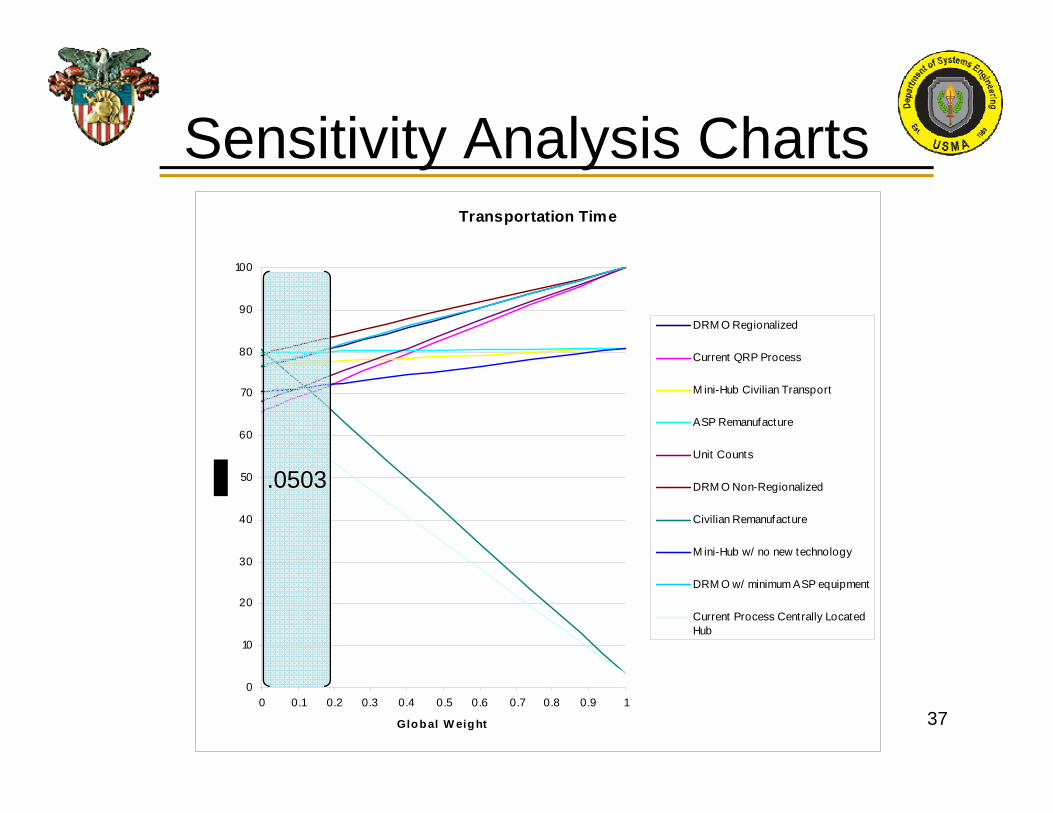
Sensitivity Analysis ChartsTransportation Time
0
10
20
30
40
50
60
70
80
90
100
0 0.1 0.2 0.3 0.4 0.5 0.6 0.7 0.8 0.9 1
Glo b al W eig ht
DRM O Regionalized
Current QRP Process
M ini-Hub Civilian Transport
ASP Remanufacture
Unit Counts
DRM O Non-Regionalized
Civilian Remanufacture
M ini-Hub w/ no new technology
DRM O w/ minimum ASP equipment
Current Process Centrally LocatedHub
.0503

38
Sensitivity Analysis ChartsTransportation Manpower
60
65
70
75
80
85
90
95
100
0 0.1 0.2 0.3 0.4 0.5 0.6 0.7 0.8 0.9 1
Gl oba l We i ght
DRMO Regionalized
Current QRP Process
Mini-Hub Civilian Transport
ASP Remanuf act ure
Unit Count s
DRMO Non-Regionalized
Civilian Remanuf act ure
Mini-Hub w/ no new t echnology
DRMO w/ minimum ASP equipment
Current Process Cent rally Locat edHub
.044

39
Sensitivity Analysis ChartsSales Revenue
20
30
40
50
60
70
80
90
100
0 0.1 0.2 0.3 0.4 0.5 0.6 0.7 0.8 0.9 1
Glo b al W eight
DRMO Regionalized
Current QRP Proc ess
Min i-Hub Civ ilian Transport
ASP Remanufac ture
Unit Counts
DRMO Non-Regionalized
Civ ilian Remanufac ture
Min i-Hub w/ no new
tec hnology
DRMO w/ min imum ASP
equipment
.0629

40
Sensitivity Analysis ChartsCol l ect i on M anpower
50
55
60
65
70
75
80
85
90
95
100
0 0.1 0.2 0.3 0.4 0.5 0.6 0.7 0.8 0.9 1
G l o b a l W e i g h t
DRM O Regi onal i zed
Cur r ent QRP Pr ocess
M i ni -Hub Ci vi l i an T r anspor t
ASP Remanuf actur e
Uni t Counts
DRM O Non-Regi onal i zed
Ci vi l i an Remanuf actur e
M i ni -Hub w/ no newtechnol ogy
DRM O w/ mi ni mum ASPequi pment
Cur r ent Pr ocess Cent r al l yLocated Hub
41
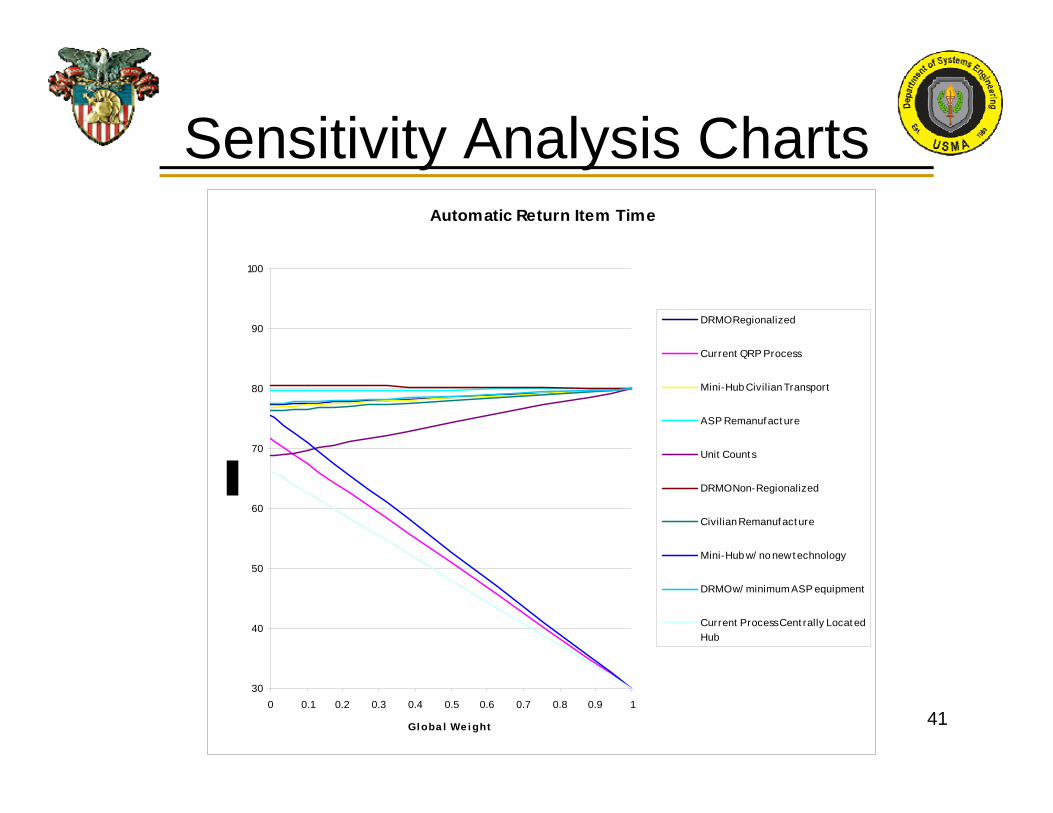
Sensitivity Analysis ChartsAutomatic Return Item Time
30
40
50
60
70
80
90
100
0 0.1 0.2 0.3 0.4 0.5 0.6 0.7 0.8 0.9 1
Gl oba l We i ght
DRMO Regionalized
Current QRP Process
Mini-Hub Civilian Transport
ASP Remanuf act ure
Unit Count s
DRMO Non-Regionalized
Civilian Remanuf act ure
Mini-Hub w/ no new t echnology
DRMO w/ minimum ASP equipment
Current Process Cent rally Locat edHub

42
Sensitivity Analysis ChartsRecyclable Items
60
65
70
75
80
85
90
95
100
0 0.1 0.2 0.3 0.4 0.5 0.6 0.7 0.8 0.9 1
Gl oba l We i ght
DRMO Regionalized
Current QRP Process
Mini-Hub Civilian Transport
ASP Remanuf act ure
Unit Count s
DRMO Non-Regionalized
Civilian Remanuf act ure
Mini-Hub w/ no new t echnology
DRMO w/ minimum ASP equipment
Current Process Cent rally Locat edHub

43
Sensitivity Analysis ChartsStorage Time
0
10
20
30
40
50
60
70
80
90
100
0 0.1 0.2 0.3 0.4 0.5 0.6 0.7 0.8 0.9 1
Gl oba l We i ght
DRMO Regionalized
Current QRP Process
Mini-Hub Civilian Transport
ASP Remanuf act ure
Unit Count s
DRMO Non-Regionalized
Civilian Remanuf act ure
Mini-Hub w/ no new t echnology
DRMO w/ minimum ASP equipment
Current Process Cent rally Locat edHub
44
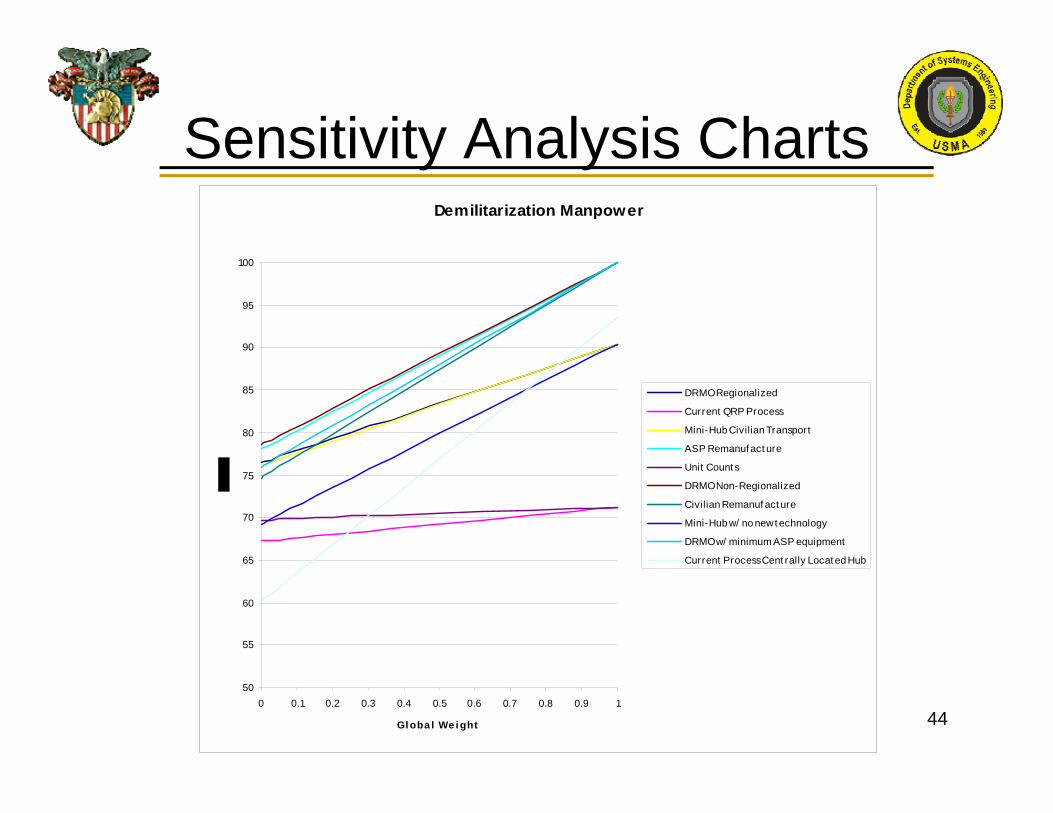
Sensitivity Analysis ChartsDemilitarization Manpower
50
55
60
65
70
75
80
85
90
95
100
0 0.1 0.2 0.3 0.4 0.5 0.6 0.7 0.8 0.9 1
Gl oba l We i ght
DRMO Regionalized
Current QRP Process
Mini-Hub Civilian Transport
ASP Remanufact ure
Unit Count s
DRMO Non-Regionalized
Civilian Remanuf act ure
Mini-Hub w/ no new t echnology
DRMO w/ minimum ASP equipment
Current Process Cent rally Locat ed Hub