reaction-driven casing expansion: potential for wellbore ... · pdf filereaction-driven casing...
TRANSCRIPT

RESEARCH PAPER
Reaction-driven casing expansion: potential for wellboreleakage mitigation
Timotheus K. T. Wolterbeek1 • Reinier van Noort1,2 • Christopher J. Spiers1
Received: 20 January 2017 / Accepted: 14 March 2017 / Published online: 1 April 2017
� The Author(s) 2017. This article is published with open access at Springerlink.com
Abstract It is generally challenging to predict the post-
abandonment behaviour and integrity of wellbores. Leak-
age is, moreover, difficult to mitigate, particularly between
the steel casing and outer cement sheath. Radially
expanding the casing with some form of internal plug,
thereby closing annular voids and fractures around it, offers
a possible solution to both issues. However, such expansion
requires development of substantial internal stresses.
Chemical reactions that involve a solid volume increase
and produce a force of crystallisation (FoC), such as CaO
hydration, offer obvious potential. However, while ther-
modynamically capable of producing stresses in the GPa
range, the maximum stress obtainable by CaO hydration
has not been validated or determined experimentally. Here,
we report uniaxial compaction/expansion experiments
performed in an oedometer-type apparatus on precom-
pacted CaO powder, at 65 �C and at atmospheric pore fluid
pressure. Using this set-up, the FoC generated during CaO
hydration could be measured directly. Our results show
FoC-induced stresses reaching up to 153 MPa, with reac-
tion stopping or slowing down before completion. Failure
to achieve the GPa stresses predicted by theory is attributed
to competition between FoC development and its inhibiting
effect on reaction progress. Microstructural observations
indicate that reaction-induced stresses shut down pathways
for water into the sample, hampering ongoing reaction and
limiting the magnitude of stress build-up to the values
observed. The results nonetheless point the way to under-
standing the behaviour of such systems and to finding
engineering solutions that may allow large controlled
stresses and strains to be achieved in wellbore sealing
operations in future.
Keywords CaO � Casing � Force of crystallisation �Hydration � Wellbore integrity
1 Introduction
As ageing hydrocarbon fields approach the end of their
productive and economic life [63, 81, 125], and as various
options for their potential reuse, such as geological storage
of CO2 [3, 50, 127] or of energy [8, 52, 99] emerge,
wellbore sealing issues are becoming ever more important
[5, 19]. In particular, effective plug and wellbore sealing
procedures, ensuring long-term zonal isolation, are essen-
tial (a) for complying with increasingly stringent environ-
mental regulations applying to well and reservoir
abandonment [109] and (b) for enabling reuse of reservoirs
in future applications [51].
In most existing wells, the borehole is lined with a string
of concentric steel tubes (called casings and liners). The
tubes are fixed in place and sealed against the wall rock
using Portland-based cement [91]. These cement seals are
susceptible to various forms of failure [42, 90]. For
example, during emplacement, poor removal of drilling
mud or filter cake may impair bonding between the cement,
the casing and the surrounding rock [1, 76]. Moreover,
cement shrinkage upon hardening, inherent to some of the
processes involved in hydration [117], produces radial
& Timotheus K. T. Wolterbeek
1 HPT Laboratory, Department of Earth Sciences, Utrecht
University, Budapestlaan 4, 3584 CD Utrecht, The
Netherlands
2 Present Address: Department of Environmental Technology,
Institute for Energy Technology, Instituttveien 18, 2007
Kjeller, Norway
123
Acta Geotechnica (2018) 13:341–366
https://doi.org/10.1007/s11440-017-0533-5

contraction that may result in tensile fracturing of the
cement or debonding at the casing-cement and cement-
formation interfaces [26, 33]. In addition, fluctuations in
temperature and stress state, endured by the wellbore
during field operations, may further contribute to the
accumulation of structural damage [77, 80, 83, 93, 102].
Regardless of their origin, such defects offer pathways
for fluid flow that may compromise well integrity [132].
Indeed, considerable numbers of wells are known to have
zonal isolation issues. Analysis of 315,000 oil, gas and
injection wells in Alberta showed that *4.6% of these
wells displayed surface casing vent flow or gas migration
[4]. For energy wells completed since 1971, this percentage
is higher, with *14% exhibiting surface casing vent flow
of [300 m3 day-1 [58]. Of 41,381 wells drilled in Penn-
sylvania between 2000 and 2012, *1.9% showed some
form of structural integrity failure [55]. Moreover, sus-
tained casing pressure (unintended development of pres-
sure at the surface, at the well, which rebuilds after
bleeding off) is reported in *43% of the producing and
abandoned wells located on the outer continental shelf of
the Gulf of Mexico [15]. If unwanted fluid migration
phenomena such as these progressively impair the well or
already exceed the maximum rate allowed by regulations,
remedial measures are required.
Squeeze cementing operations are common practice in
mitigating leakage occurring behind the casing, i.e. outside
of the steel pipe (annular leakage). Squeeze cementing
involves perforation of the casing over the defective
wellbore interval, followed by injection of cement to seal
annular voids and fractures [91]. However, this conven-
tional approach is often ineffective. A performance study
of squeeze cementing operations performed on wells in
west Texas found that first-attempt remediation was suc-
cessful in only 47 of 137 cases (34%), and that the success
rate for multiple attempts (up to five per well) was\60%
[25]. There is therefore substantial interest in alternative
approaches to leakage mitigation, such as the casing
expansion procedure recently proposed by Kupresan et al.
[74, 75]. This involves permanent radial expansion of the
casing pipe, thereby closing annuli, fractures and other
voids outside the casing, while placing the cement there
under compression. Kupresan et al. [74, 75] tested this
method in three laboratory experiments on composite
samples consisting of two concentric steel cylinders (length
60 cm, diameter inner pipe *6 cm, diameter outer pipe
*10.2 cm), where cement was injected in the annular
region between these two pipes. After curing, sealing was
poor due to the induction/presence of debonding defects at
the inner pipe wall, producing apparent sample perme-
abilities of 1.4 9 10-13–7.1 9 10-12 m2. Subsequent
expansion of the inner pipe, by 2–8% via internal pres-
surisation or swaging, caused significant reduction in
permeability, reducing this to *3 9 10-19 m2 in the ini-
tially most permeable sample and to values below detection
in the other two samples [74, 75]. These findings are
promising, especially since increased confinement may
help maintain the mechanical stability of the cement, i.e. by
promoting permanent cohesive compaction as opposed to
fracture [129].
A potential limitation to the method proposed by
Kupresan et al. [74, 75], is that the casing diameter must be
plastically expanded. In their experiments, this was
achieved using (ductile) expandable casing tube technol-
ogy [18, 88], swaged open with a pull-through mandrel and
internal expansion cones. While expandable steel casings
can be used in both new and existing wells, and have been
applied effectively in remedial operations targeting punc-
tured casings [6], it remains a relatively new technology
[32]. This means that both legacy and presently operating
wells, i.e. wells requiring abandonment in the coming
decades, are generally furnished with conventional casing
strings. This raises the question of whether or not the
casing expansion concept can be applied, perhaps in
modified form, to traditional casings. In such cases, the
maximum attainable expansion ratios would necessarily be
low (\2%), since generally less ductile types of steel have
been employed to date [56] than now appearing. However,
even this limited expansion could still be effective, par-
ticularly in remedying leakage of CO2-bearing fluids. For
CO2-rich fluids, it may be sufficient to reduce the aperture
of fractures and debonding defects only to the point where
reactive transport leads to self-sealing behaviour
[17, 20, 53, 130], rather than completely closing interfacial
flaws by purely mechanical means. Yet, it would not be
trivial to expand conventional casing strings by even 1–2%
using the pull-through mandrel methods that are now being
applied to expandable wellbore casing tubes. These
approaches require the pipe wall to be smooth and of
uniform thickness [18], while the wall thickness of con-
ventional casing is rather poorly controlled, with specifi-
cations allowing for 12.5% variability [56]. Alongside
mineral scaling, present in many existing wellbores
[34, 62], significant lubrication issues are therefore
expected [30], which in turn could cause swaging to induce
considerable damage to the casing tube [18]. Given these
difficulties, alternative approaches are needed for expand-
ing conventional wellbore casings to seal leakage pathways
outside of the casing in existing wellbores, e.g. during
wellbore abandonment procedures.
Chemical reactions that involve a solid volume increase
and produce a force of crystallisation (FoC) [38, 110, 126],
such as the hydration of CaO [21], offer obvious potential
as agents causing expansion, and already find use in con-
trolled, non-explosive demolition of building infrastructure
[48]. These reactions are thermodynamically capable of
342 Acta Geotechnica (2018) 13:341–366
123

producing very large mechanical stresses [67, 94, 119]. For
the case of CaO hydration, thermodynamic models
[67, 68], taking Gibbs energy of reaction and solid volume
change data representative for downhole temperatures
[82], predict FoC-induced stresses of up to *3.4 GPa. By
comparison, preliminary calculations using Barlow’s for-
mula for the expansion of a cylindrical metal tube [7, 124],
plus typical casing tube dimensions and plastic yield data
for conventional casing steels [56], suggest that expanding
conventional wellbore casing via internal pressurisation
would require effective internal stresses in the range of
100–300 MPa. Constraints from casing burst studies pro-
vide similar values [39, 64]. As such, the stresses that
could potentially be induced, if a wellbore would be
plugged with low-porosity CaO aggregate, are more than
sufficient to bring about casing expansion leading to
mechanical closure of annuli and fractures similar to that
seen in the experiments of Kupresan et al. [74, 75].
However, whether these theoretical FoC stresses can be
attained in practice depends on whether reaction can go to
completion, and hence on the reaction kinetics, the supply
of reactants, the reaction mechanism, and the effect of
stress on reaction. Moreover, at least some degree of
control on the strains that develop upon CaO hydration
would be required, to avoid excessive expansions that
otherwise may lead to casing rupture.
Successful application of CaO hydration-induced FoC
development in the expansion of wellbore casing would
require a thorough, quantitative understanding of (a) the
reaction mechanism controlling CaO hydration, (b) the
deformation and fluid transport processes controlling stress
and strain evolution and (c) whether the hydration process
can be sufficiently regulated. In this study, we take a first
step in this regard, by directly measuring the force of
crystallisation generated during CaO hydration. Our results
show FoC-induced stresses of up to 153 MPa. We discuss
the reasons for the shortfall compared with thermodynamic
theory and provide some suggestions for finding engi-
neering solutions that may allow larger hydration-induced
stresses and strains to be achieved in wellbore sealing
operations in future.
2 Background information
Before presenting and analysing our experiments, we first
introduce the basic concept of force of crystallisation, and
briefly summarise previous experimental measurements
and thermodynamic models addressing the phenomenon.
We go on to derive our own thermodynamic model,
establishing a framework in which to consider CaO
hydration in our experiments.
2.1 Force of crystallisation: examples and previous
measurements
Consider a fluid-mediated chemical reaction that involves
dissolution of the reacting solid phases and precipitation of
solid products from a supersaturated solution. When such a
reaction involves an increase in solid volume and proceeds
in a confined space, this can lead to development of a so-
called force of crystallisation (FoC) [9, 22, 38, 105,
114, 126]. In other words, reaction can result in stress being
exerted on the confining boundaries of the system. In
principle, any thermodynamic driving force that can pro-
duce a supersaturation with respect to the solid product
phase can generate a FoC, as long as precipitation can
occur under confined conditions, e.g. within load-bearing
grain contacts [10, 103]. Well-known examples of such
reactions include salt damage [24, 106], where supersatu-
ration is achieved via evaporation and surface curvature
effects [108, 110, 111], and a wide range of mineral
reactions where the solid products comprise a larger vol-
ume than the solid reactants. Frost heave [24, 49, 115],
where crystallisation is driven by a temperature-related
phase change (cf. [114]), is a similar process. Examples of
mineral reactions that have been shown or are believed to
produce a FoC include (a) uptake of crystallisation water
by thenardite to produce mirabilite [35, 118], (b) delayed
ettringite formation in concrete [37, 54, 116], (c) serpen-
tinisation and possibly carbonation of peridotite
[60, 67, 68, 97, 104], (d) replacement of leucite by anal-
cime in low-silica rocks [61], (e) conversion of anhydrite
into gypsum [70] and (f) the hydration of metal oxides such
as quicklime (CaO) and periclase (MgO) [43, 94]. In a
geological context, development of a force of crystallisa-
tion is widely considered to play an important role in
pseudomorphic replacement [40, 89], as well as vein for-
mation [40, 47, 87, 114] and reaction-driven fracturing
[61, 97, 100, 104].
Despite this previous work on FoC-related processes,
relatively few studies have been conducted where the
magnitude of the FoC is determined directly. Becker and
Day [9] attempted FoC measurement via the placement of
dead weights on crystals growing from supersaturated
solutions, created by gradual evaporation or cooling. They
found that centimetre-sized crystals of alum, growing
between glass plates, continued to grow and could raise a
weight of 1 kg through distances of several hundreds of
micrometres, and reported similar findings for copper sul-
phate, lead nitrate and potassium ferrocyanide. On the
lower surface of the crystals, precipitation of new material
was restricted to the periphery, producing a hopper-like
morphology (see also [103]), preventing accurate deter-
mination of load-supporting area and hence stress corre-
sponding to the FoC. The presence of unloaded crystals in
Acta Geotechnica (2018) 13:341–366 343
123
the same solution was found to inhibit growth of the loaded
crystal surfaces [10, 16, 114]. Performing similar experi-
ments with improved resolution in displacement, Correns
and Steinborn [23] and Correns [22] collected extensive
data and demonstrated that the ability of alum crystals to
lift a dead weight depended not only on the supersatura-
tion, but also on which crystallographic plane was the
loaded surface (see [38] for a recent commentary on these
experiments). Khaimov-Mal’kov [71] repeated many of the
earlier experiments on alum and reported crystal growth
against a stress of 20 kg cm-2 (*1.96 MPa) at 20%
supersaturation. Also using a dead weight approach, Keu-
len et al. [70] reported hydration of anhydrite to form
gypsum, causing expansion against stresses of up to
*11 MPa. However, by far the largest stresses measured
to date, at least to our knowledge, have been observed
during CaO and MgO hydration. In experiments reported
by Ostapenko [94], MgO samples were tightly confined in
steel cylinders and subsequently hydrated, causing the
sample to expand. This resulted in bulging or rupturing of
the cylinders. The FoC that developed was estimated on the
basis of the strength of the steel, by performing tests using
cylinders of different wall thickness. The FoC-related
stress estimates obtained ranged from 20 to 200 MPa.
Similarly, using high-pressure expansion cells, Ghofrani
and Plack [43] found that swelling cements based on CaO
and MgO additives expand effectively against hydrostatic
pressures up to 120 MPa.
2.2 Thermodynamic models
2.2.1 Previous work
The first steps towards a thermodynamic treatment of the
force of crystallisation were made by Correns and Stein-
born [23]. Based on chemical potential and energy balance
arguments, they derived an expression for maximum stress
generated as a function of supersaturation of the solution
phase (S), represented by S = c/cs, with c and cs solute
concentrations in the supersaturated and a saturated solu-
tion, respectively. The result obtained was:
reff ¼RT
Vm
ln Sð Þ ð1Þ
where reff = rn – P is the maximum effective stress gen-
erated due to crystallisation, P is the fluid pressure, rn is
the normal stress on the loaded surface of the growing
crystal, R is the gas constant, T is the absolute temperature,
and Vm is the molar volume of the precipitating solid phase.
Correns and Steinborn [23] further stated that, for a stres-
sed crystal to continue to grow, there must exist a solution
phase that separates the loaded crystal face from its
constraint, as otherwise deposition of matter and growth in
the load-bearing interface would be impossible (cf.
[22, 105].
Several thermodynamic treatments and models have
subsequently been published [36, 72, 105, 106, 126]. The
models differ mainly in how the supersaturation (S) is
defined, e.g. in terms of solute activities, ion activity
products, or in terms of the surface curvature of neigh-
bouring crystals. Steiger [110, 111] reviewed these ther-
modynamic models and provided a comprehensive
analysis, deriving an equation for the FoC based on
chemical potentials of stressed and unstressed crystal faces,
demonstrating the equivalence of the previous expressions,
and considering effects of non-ideal behaviour of the
solution phase.
The thermodynamic models discussed above consider
direct precipitation from a (typically stoichiometrically)
supersaturated solution, as investigated in the bulk of
quantitative experimental studies to date (Sect. 2.1).
Though without explicitly stating the steps involved, a
number of studies [67, 68, 94] have generalised these
models to include more complex chemical reactions,
obtaining the result
reff ¼ �DGr
DVs
ð2Þ
where DGr is the Gibbs energy change of reaction and DVs
denotes the solid volume change associated with the
reaction per mole (cf. Eqn. E5 of Kelemen and Hirth [67]).
To our knowledge, these models have not been experi-
mentally verified.
2.2.2 Model for FoC development and application to CaO
hydration
We will now explicitly derive a similar expression to Eq. 2
and subsequently apply the result to CaO hydration, which
is the target of our experiments. Throughout, we adopt the
convention that compressive stresses and volume expan-
sions are represented positive. In deriving the model, it is
assumed that reaction will not be inhibited by clogging of
transport pathways, by sealing of grain boundaries, or by
stress-driven expulsion of the solution phase from grain
boundaries. In other words, it is assumed that a solution
phase remains present in the loaded interfaces (cf.
[22, 105]). This may, for instance, be in the form of thin
films or microscale channels, observed to occur during
stress-driven dissolution or pressure solution
[28, 29, 120, 121]. The initial solid (CaO powder in our
experiments) will be considered to consist of a single, pure
phase. Reaction will be treated as a replacement process,
i.e. with solid products and reactants in contact across
fluid-filled grain boundaries and therefore experiencing the
344 Acta Geotechnica (2018) 13:341–366
123
same stress. The aqueous solution phase present in the open
pores is assumed to be well mixed and to exist at a refer-
ence pressure (P) and temperature (T). Prior to any reac-
tion, the initial solid phase is assumed to be in mechanical
and thermal equilibrium with this solution phase, i.e. also
characterised by a hydrostatic stress state of magnitude
P and temperature T. In addition, we assume that reaction
occurs under isothermal conditions and that no other dis-
sipative processes operate in the system.
Under hydrostatic reference conditions (P, T), the Gibbs
free energy change of reaction (i.e. the thermodynamic
driving force) for any given reaction involving I solid phases
and J components in the solution phase can be written as
DrGPT ¼
XI
i¼1
milPTi þ
XJ
j¼1
mjlPTj ð3Þ
Here, m are stoichiometric coefficients for the I solid phases
and J components in the solution phase participating in
reaction, while lPT are the chemical potentials of these
components in the hydrostatic reference state (P, T). Of
course, m is positive for reaction products and negative for
reactants.
If the growth of the solid products is restricted by a zero
or limited displacement boundary condition, then reaction
will lead to the build-up of a normal stress (r) at the
interfaces of the product and reactant grains. Assuming
drained conditions, i.e. that the fluid phase remains at the
initial pressure P, ongoing reaction in the stressed state will
be associated with the free energy change (cf. Eq. 3)
DrGrT ¼
XI
i¼1
milrTi þ
XJ
j¼1
mjlðrÞPTj ð4Þ
Here, lirT are chemical potentials of the solid phases at
stress r and temperature T, while lj(r)PT are the chemical
potentials of the components present in the solution phase,
which in general will be different compared with the initial
(P, T) conditions, due to changes in their concentration in
the stressed state.
As constricted reaction proceeds, the stress experienced
by the solid phases will continue to increase, until the
stressed solids are in equilibrium with the components
present in the solution phase, i.e. until DrGrT = 0. Putting
this into Eq. 4 and making use of Eq. 3, the change in total
free energy of the solid phases in the stressed state (r, T)
compared with the reference state (P, T) can be written as
XI
i¼1
mi lrTi � lPTi
� �¼ �DrG
PT �XJ
j¼1
mj lðrÞPTj � lPTj
� �
ð5Þ
For solid phases, the chemical potential is a surface
property [44], which from thermodynamic treatments of
stressed solids [27, 44, 65, 66, 78, 79, 86, 95] can be
related to the normal stress (r) acting on the crystal
surface via:
lrTi � f rTi þ rVrTm;i ð6Þ
Here, firT and Vm,i
rT denote the molar Helmholtz free energy
and molar volume of solid i in the stressed state (e.g. [78]).
For the hydrostatic reference conditions (P, T), we have
liPT = fi
PT ? PVm,iPT . Considering elastic strain of the solids
and assuming the normal stress on the solids (r) to be
isotropic, the molar volume of the solid in the stressed state
(r, T) can be written in terms of the molar volume of the
solid under hydrostatic conditions (P, T), yielding
VrTm;i ¼ VPT
m;i þ DVm;i with DVm;i ¼ �VPT
m;i
Bi
r� Pð Þ ð7Þ
where DVm,i is the difference in molar volume between the
stressed and unstressed solid, and Bi is the bulk modulus of
the solid. The energy associated with elastic strain of the
stressed solid contributes to its molar Helmholtz free
energy, for which we may correspondingly write
f rTi ¼ f PTi þ Dfi with Dfi ¼ �rVP
m;ieV
2¼ � rDVm;i
2
ð8Þ
where Dfi is the difference in molar Helmholtz free energy
between the stressed and unstressed solid, and eV is the
volumetric strain associated with application of isotropic
stress r. Equations 5, 6, 7 and 8 can be combined to obtain
r� Pð ÞXI
i¼1
mi 1 � r2Bi
� �VPT
m;i ¼ �DrGPT
�XJ
j¼1
mj lðrÞPTj � lPTj
� �ð9Þ
For FoC-induced stresses of up to a few GPa, the terms r/
(2Bi) will be small (given typical bulk moduli in the range
of 10–100s of GPa). As such, it is easily shown that small
differences in elastic strain between the stressed and
unstressed solids may be neglected. Taking firT & fi
PT and
Vm,irT & Vm,i
PT , Eq. 9 simplifies to
reff ¼ r� P
¼ � 1PmiVPT
m;i
DrGPT þ
Xmj lðrÞPTj � lPTj
� �h ið10Þ
This gives the maximum effective normal stress that can
develop due to precipitation of a confined solid product
phase, i.e. the stress attained at equilibrium or the stress
required to remove the driving force for further reaction.
Note that Eq. 10 corresponds to Eq. 2 only if reaction-
induced changes in the chemical potentials of the compo-
nents present in the solution phase can be neglected, which
Acta Geotechnica (2018) 13:341–366 345
123

in general is by no means clear, for example, when con-
sidering complex chemical reactions.
Let us now apply Eq. 10 to the specific case of CaO
hydration. When CaO is exposed to water, this will lead to
the formation of Ca(OH)2 (portlandite). Two different
reaction mechanisms have been reported for this hydration,
namely (a) ‘‘vapour phase hydration’’, which occurs via a
pseudomorphic, topotactic, solid-state transformation
involving an intermediate, disordered Ca(OH)2 phase
[11, 45, 73], and (b) so-called ‘‘through-solution’’ or ‘‘wet
hydration’’. For this second mechanism, it is at present
unclear whether (a) the CaO first dissolves in the solution
phase (water) and subsequently precipitates as Ca(OH)2
[12, 84, 101, 128], or (b) direct conversion of CaO into
Ca(OH)2 occurs, as in vapour phase hydration, followed by
(partial) dissolution (and re-precipitation) of the Ca(OH)2
formed [12, 113].
In the confined experiments reported here, ‘‘wet hydra-
tion’’ is considered the most likely mechanism, at least
initially, as reaction was initiated by vacuum-flushing liq-
uid water into the sample chamber. Assuming a stoichio-
metrically balanced chemical reaction (as expressed in
Eqs. 3 and 10), we now have to consider the two possible
reaction pathways for the wet hydration process discussed
above. If this process involves a true dissolution–precipi-
tation mechanism (e.g. [101]), and we allow for complete
reaction being prevented by stress build-up, then we must
have
CaOðsÞ þH2OðlÞ ) Ca2þðaqÞ þ 2OH�
ðaqÞ and
aCa2þðaqÞ þ2aOH�
ðaqÞ , aCa(OH)2 ðsÞ; which on adding yield
CaOðsÞ þH2OðlÞ ) aCa(OH)2 ðsÞ þ 1� að ÞCa2þðaqÞ
þ 2 1� að ÞOH�ðaqÞ ð11aÞ
where per mole of CaO that dissolves a moles of Ca(OH)2
precipitate, with a B 1. Alternatively, if wet hydration
would involve direct transformation of CaO into Ca(OH)2
(e.g. [113]), then we must have
CaOðsÞ þ H2OðlÞ ) Ca(OH)2 ðsÞ and
1 � að ÞCa(OH)2 ðsÞ , 1 � að ÞCa2þðaqÞ þ 1 � að ÞOH�
ðaqÞ;
which on adding yield
CaOðsÞ þ H2OðlÞ ) aCa(OH)2 ðsÞ þ 1 � að ÞCa2þðaqÞ
þ 2 1 � að ÞOH�ðaqÞ ð11bÞ
where per mole of CaO that converts (1 - a) moles of the
Ca(OH)2 formed subsequently dissolves again with a B 1.
Note that Eqs. 11a and 11b yield the same net reaction,
regardless of the specific pathway. The value of a will
depend on various system properties, such as the fluid
composition and the effective fluid-to-solid ratio.
Considering the overall transfer of mass that is involved
in attaining equilibrium, i.e. in going from the initial,
hydrostatic reference state (P, T) to the stressed
equilibrium state (r, T), the final equilibrium state must
be such that the Ca2? and OH- concentrations in the fluid
(or, rather, their chemical activities) are in equilibrium with
the solids, so that at least some dissolved material remains
in solution, with a\ 1. However, given the low solubility
of Ca(OH)2 [31], combined with low fluid-to-rock ratios
characterising the experiments reported here, we expect
that taking a & 1 will not introduce significant error. In
other words, the mass of calcium hydroxide stored in the
solution phase will be negligible compared with that
precipitated. Making the assumption a & 1, Eq. 11
simplifies to
CaOðsÞ þ H2OðlÞ ) Ca(OH)2 ðsÞ ð12Þ
and, in turn, means that Eq. 10 can be simplified and
rewritten as
reff ¼DfG
PTCaO þ DfG
PTH2O � DfG
PTCaðOHÞ2
VPTm;CaðOHÞ2
� VPTm;CaO
ð13Þ
where DrGPT is now expressed in terms of the Gibbs
energies of formation (DfGPT) of the subscripted chemical
species at the reference P, T conditions. This result is
essentially equivalent to Eq. 2 (cf. Eqn. E5 of Kelemen and
Hirth [67]). However, note that it rests on the assumption
that a = 1, i.e. it neglects compositional change in the
solution phase, as well as neglecting stress-induced chan-
ges in fi and Vm,i.
The standard molar thermodynamic properties of the
chemical species involved (i.e. in Eq. 12) can be found for
P = 0.1 MPa (1 bar) and T = 298.15 K (25 �C) in the
papers by Matschei et al. [85] and Lothenbach et al. [82], and
are listed in Table 1. Following Lothenbach et al. [82], the
corresponding values at 65 �C were calculated using [2]
DfGT ¼ DfG
�T0� S
�T0
T � T0ð Þ � b0 T lnT
T0
� T þ T0
� �
� b1
T � T0ð Þ2
2� b2
T � T0ð Þ2
2TT20
� b3
2ffiffiffiffiT
p�
ffiffiffiffiffiT0
p� �2
ffiffiffiffiffiT0
p
ð14Þ
where T0 is the reference (standard) temperature
(298.15 K) and bx (x = 0, 1, 2, 3) are the empirical coef-
ficients of a heat capacity equation of the form
CP(T) = b0 ? b1T ? b2T-2 ? b3T
-0.5.
Using Eq. 13 with the thermodynamic data in Table 1, it
is straightforward to calculate the maximum stress that can
develop at the surface of a confined crystal of portlandite
[Ca(OH)2] growing as a result of CaO hydration under
initial conditions (P, T). Doing so for reaction at 65 �C and
atmospheric fluid pressure yields a value of *3.4 GPa.
346 Acta Geotechnica (2018) 13:341–366
123

3 Experimental methods
To measure the force of crystallisation that is generated
during CaO hydration, we performed compaction/expan-
sion experiments on CaO powder at a temperature of
65 �C, representative for shallow crustal reservoirs, using a
uniaxial deformation (oedometer-type) set-up located in an
Instron loading frame. After dry precompaction, the sample
assembly containing the CaO aggregate was flooded with
water, initiating the hydration reaction. Three types of
experiments were performed, namely (a) position-control
experiments, in which the Instron position was fixed so as
to restrict sample expansion as much as possible, thus
allowing a force of crystallisation to develop, (b) load-limit
experiments, in which the Instron was programmed to
initially maintain a fixed position, but switch to load-con-
trol mode once the FoC-induced axial stress attained a
preset threshold value and (c) constant-load experiments,
where the Instron load was fixed, allowing measurement of
CaO hydration-induced expansion against a constant axial
force (and hence stress). A complete list of the experiments
performed, together with key experimental data, is given in
Table 2.
3.1 Sample material and assembly
The CaO powder used in this study was prepared from
Carrara marble (high-purity CaCO3), which for this pur-
pose was crushed and sieved to a grain size of
90–150 lm. Prior to each experiment, a batch of marble
powder was calcined at 1100 �C for *16 h. The calcined
powder was retrieved after allowing the furnace to cool to
*350 �C. After thorough mixing and disaggregation of
the CaO powder obtained, some 120–360 mg was located
in the sample assembly, depending on desired sample
thickness. This assembly consisted of a small compaction
die furnished with upper and lower loading pistons (outer
diameter 19.8 mm, bore diameter 9.8 mm—Fig. 1a), all
constructed from Monel K-500, a corrosion resistant
nickel-copper alloy. The top piston of the assembly con-
tained a central bore and was tipped with a stainless steel
Table 2 Summary of the experiments performed
Test no. m0 (mg) L0 (mm) /0 (%) r0 (MPa) rTH (MPa) r5h (MPa) DL5h (mm) rmax (MPa) DLmax (mm)
A01PC 355.8 2.19 35.4 *1.3 250 128.0 0.242 133.8 0.247
A02PC 355.1 2.18 35.3 *1.3 250 132.9 0.245 138.2 0.248
A03PC 176.9 1.11 36.8 *1.3 250 94.1 0.205 95.5 0.206
A04PC 177.3 1.11 36.8 *1.3 250 97.1 0.212 98.2 0.213
A05PC 124.8 0.70 29.0 *1.3 250 92.9 0.196 96.4 0.198
A06PC 124.9 0.68 27.4 60 250 141.6 0.096 151.4 0.104
A07PC 121.2 0.69 30.4 120 250 146.0 0.035 152.5 0.039
A08PC 353.4 2.34 40.0 90 250 131.3 0.057 135.6 0.060
A09TH 347.5 2.14 35.6 *1.3 30 TH-30 0.609 TH-30 0.611
A10TH 351.7 2.09 33.1 *1.3 60 TH-60 0.288 TH-60 0.435
A11CL 123.8 0.65 24.9 60 CL-60 CL-60 0.111 CL-60 0.156
A12CL 123.1 0.66 25.7 120 CL-120 CL-120 0.023 CL-120 0.030
A13CL 120.8 0.71 32.1 225 CL-225 CL-225 -0.043 – –
A14CL 352.7 2.10 33.3 225 CL-225 CL-225 -0.042 – –
PC, Instron position-controlled experiment; TH, transfer-and-hold experiment: transfer-load attained and Instron operation switched to constant-
load mode at r = rTH; CL, constant-load mode experiment: Instron at r = r0 throughout test. Symbols: m0 = initial sample mass, L0 = initial
sample length, /0 = initial sample porosity, r0 = initial axial stress applied to the sample, rTH = stress limit where Instron loading frame will
transfer from fixed-position mode to constant-load mode, r5h = axial stress after 5 h, DL5h = axial displacement after 5 h, rmax = maximum
axial stress, DLmax = maximum axial displacement
Table 1 Standard molar thermodynamic properties of water, CaO
and Ca(OH)2 at 298.15 K and 0.1 MPa. Data from Matschei et al.
[85]
Property CaO Ca(OH)2 H2O
DfG�T0
(kJ mol-1) -604.0 -897.0 -237.2
DfH�T0
(kJ mol-1) -635 -985 -286
S�T0
(J K-1 mol-1) 39 83 70
Vm0 (cm3 mol-1) 17 33 18
b0 (J K-1 mol-1) 49 187 75
b1 (J K-2 mol-1) 0.004 -0.022 0
b2 (J K mol-1) -6.53 9 105 0 0
b3 (J K-0.5 mol-1) 0 -1600 0
Acta Geotechnica (2018) 13:341–366 347
123

porous plate (Fig. 1a) to provide pore fluid access to the
sample during the experiments. The bottom piston was
solid. Note that before loading the sample into the sample
assembly, the assembly was oven-dried overnight at
50 �C.
3.2 Experimental set-up
The CaO hydration experiments were performed by plac-
ing the sample assembly/die into an externally heated,
uniaxial compaction apparatus (Fig. 1b), applying load by
means of an Instron 8862 servo-controlled testing machine
(Fig. 1c)—see Schutjens [107] and Pluymakers et al. [98].
The compaction apparatus consists of a pressure vessel
with a fixed bottom piston and movable top piston, con-
structed from Monel K-500. The diameter of the vessel
bore and loading pistons are nominally 20 mm, with the
sample assembly described above fitting closely inside
(Fig. 1a). Sealing of the loading piston in the main com-
paction vessel was achieved using Viton O-rings. Pore fluid
was supplied to the sample assembly via a central bore in
the top piston. The force applied to the sample assembly
via the top piston was measured externally, using the
Instron load cell (100 kN range, resolution ±0.05 kN),
while that supported by the bottom piston was measured
using an internal load cell located in the bottom piston of
the main compaction vessel (100 kN range, resolution
±0.05 kN). Displacement of the main vessel piston relative
to the main vessel was measured externally using a linear
variable differential transformer (LVDT; range ±1 mm,
resolution, ±1 lm), mounted between the top piston and
the top of the pressure vessel (Fig. 1b). Experiment tem-
perature was regulated to within ±0.5 �C using a K-type
chromel–alumel thermocouple, located between the fur-
nace windings, connected to a proportional-integral-
derivative controller. Sample temperature was measured
using a second K-type thermocouple, embedded in the
vessel wall close to the sample position.
3.3 Testing procedure
In each experiment, the CaO-loaded sample assembly
(Fig. 1a) was first precompacted outside the main com-
paction vessel for 1 h at 250 MPa axial stress, under lab-
oratory dry conditions. This was done by directly loading
the sample assembly/die using only the Instron loading
frame and produced disc-shaped CaO aggregates. The top
piston of the sample assembly was then extracted to
remove powder adhering to the piston and sample vessel
bore. After returning the top piston, the sample assembly
was weighed to determine the mass of CaO powder (m0—
Table 2) present in the sample assembly. The assembly
was then carefully lowered into the main deformation
apparatus, and the corresponding top piston was inserted
until close to touch (Fig. 1b). This was done on the bench.
Note this main top piston was dried overnight (at 50 �C)
prior to each experiment. The main vessel was then
installed in the Instron loading frame (Fig. 1c), and the
Instron loading ram advanced to apply and maintain a
small, constant load of 0.1 kN, corresponding to
*1.3 MPa axial stress. The apparatus was then heated to
65 �C over the course of *3 h, in load-control mode. After
reaching a stable target temperature, the Instron ram was
retracted in position-control mode, creating a *1-mm gap
between the loading frame and the top piston, to establish
the zero-value of the external force signal. The original
small load was then reapplied in load-control mode. The
dry samples were then subjected to a second precom-
paction stage. This involved (a) loading the sample to an
effective axial stress of 250 MPa, by increasing the applied
force linearly over 5 min, (b) maintaining this stress for
*5 min, and then (c) unloading to the initial load
(*1.3 MPa), again over 5 min.
10 cm
top piston
furnace
pressure vessel
internal load cell
bottom piston
LVDTcooling
O-ring
O-ring
cooling
thermocouplesspherical seatspacer block
external load cell
Instron loading frame
CaO sample
porous plate
O-ring
bottom piston
1 cm
a
top piston
sample assembly b deformation apparatus c
b
loading ram
Fig. 1 Schematic of the sample assembly and uniaxial deformation apparatus, a sample assembly with CaO powder sample, b main uniaxial
deformation vessel and c Instron loading frame. LVDT linear variable differential transformer
348 Acta Geotechnica (2018) 13:341–366
123

Following this second precompaction stage, the samples
were placed under the desired initial effective stress (ra,0),
using a 5-min duration, linear load ramp, in experiments
where ra,0[ 1.3 MPa, establishing a corresponding initial,
zero-displacement piston position at the chosen stress (note
that in experiments A02PC, A03PC, A04PC and A09TH,
this reference position was established without first per-
forming the second precompaction stage). The thicknesses
(L0) and porosities (/0) of the samples at this point are
listed in Table 2.
From this point in the experiments, the testing procedure
employed differed slightly between the three types of test.
For the position-control (A01PC–A08PC) and load-limit
experiments (A09TH, A10TH), operation of the Instron
loading frame was transferred to position-control mode
prior to the start of the experiment. However, the Instron
loading frame was programmed such that the operation
mode would switch from position-control back to load-
control once a specified load was attained. While merely a
safety measure in the position-control experiments, this
transfer in operation mode was actively employed in the
load-limit experiments, by applying lower load limits,
corresponding to an axial stress rTH (Table 2). In the case
of the load-control experiments (A11CL–A14CL), the
Instron was operated in load-control mode from the start,
maintaining the initial effective stress (ra,0) throughout the
hydration experiment.
In all three types of experiments, measurement was
initiated by vacuum-flushing water into the upper piston
plus sample assembly at t = 0. To ensure the sample was
saturated with water, the pore fluid system was briefly
pressurised to *10 MPa, using a hand pump. This pres-
surised state lasted for a few tens of seconds before the
pressure was released, maintaining an open connection to
atmospheric (laboratory air) pressure throughout the
remainder of the experiment. Upon experiment termina-
tion, the sample was unloaded fully. This was done by
retracting the Instron loading ram to create a *1-mm gap
between it and the top piston of the deformation apparatus.
Subsequently, the furnace was switched off and the
deformation apparatus was allowed to cool for 1–2 h
before retrieving the sample assembly.
3.4 Data acquisition and processing
During each experiment, the external and internal load,
Instron position, local position (displacement between the
upper piston and main vessel) and temperature were logged
every second, using a 16-bit National Instruments data
acquisition system and VI Logger software. Data process-
ing yielded effective axial stress (ra) and axial strain (ea).
The effective axial stress was measured directly using the
external load cell signal, as the fluid pressure was
atmospheric. The displacement and strain data were cor-
rected for distortion of the deformation apparatus and
Instron loading frame using predetermined stiffness cali-
brations, obtained at experimental temperature. Note that
the axial strain was defined in terms of the engineering
strain ea = DL/L0, where L0 denotes the reference (initial)
thickness of the sample (Table 2), and DL represents the
finite axial displacement associated with the expansion or
compaction of the sample at a given moment, i.e. the
thickness change of the sample, corrected for machine
effects. The initial sample porosity (/0), i.e. that of the dry
CaO aggregate, was estimated using /0 ¼ 1 � m0=
ðqCaOL0AÞ, where m0 denotes sample mass,qCaO is the
density of pure CaO (3340 kg m-3), and A is the cross-
sectional area of the sample assembly bore
(7.543 9 10-5 m2—Fig. 1a). Sample porosity evolution
after the addition of water (/) could not be determined, as
the experimental design did not allow for pore volume
changes to be distinguished from hydration-induced chan-
ges in solid volume.
3.5 Microstructural analysis
After retrieving the sample assembly from the deforma-
tion apparatus, the top piston of the assembly was
removed and the sample plus bottom piston were carefully
pushed out to minimise sample disturbance. The samples
were then dried in a furnace at 50 �C for *12 h, and
subsequently stored in individual containers. Selected
samples were studied optically and using scanning elec-
tron microscopy (SEM). To obtain cross sections through
the disc-shaped samples, these were broken axially using
a razor blade and subsequently mounted on a SEM stub
using carbon paint. In addition, samples of our CaO
starting material (i.e. the calcination product of Carrara
marble) were characterised by means of SEM, thermo-
gravimetric analysis (TGA) and laser diffraction particle
size distribution analysis.
4 Results and analysis
4.1 Mechanical data
In the following, compressive axial stresses and dilatant
axial strains (ea), i.e. sample expansion, are taken as pos-
itive. The maximum force of crystallisation was defined as
the maximum axial stress (rmax) measured while the
sample showed a positive axial displacement (DL), i.e. net
expansion, with DLmax denoting the greatest axial expan-
sion observed. In addition, the displacement and effective
axial stress supported by the hydrating CaO samples at
t = 5 h were also employed as measures for the force of
Acta Geotechnica (2018) 13:341–366 349
123

crystallisation. The key mechanical data obtained in the
experiments are summarised in Table 2.
4.1.1 Constant-position experiments
Figure 2a, and 2b shows effective axial stress and axial
strain versus time data obtained from hydration experi-
ments A01PC, A02PC, A03PC, A04PC and A05PC
(Table 2). These tests were performed with the Instron
loading frame in position-control mode, imposing an initial
(effective) axial stress (ra,0) of *1.3 MPa and using an
axial stress limit (rTH) of 250 MPa. Note that A01PC,
A02PC, A03PC and A04PC were characterised by initial
porosities ranging from 35.4 to 36.8%, whereas A05PC
was precompacted slightly further, with /0 = 29.0%.
However, the main variable in this subset of experiments
was initial sample thickness (L0), which varied from
2.18 mm in A01PC and A02PC, to 1.11 mm in A03PC and
A04PC, and 0.7 mm in A05PC (Table 2). In all five
experiments, vacuum-flushing of water into the CaO sam-
ple resulted in the rapid development of an axial stress,
attaining values[75 MPa within 30 min (Fig. 2a). At 5 h
of reaction, axial stresses ranged from *95 MPa for
samples of L0\ 1.2 mm (A03PC, A04PC and A05PC) to
135 MPa in experiments with L0 = 2.18 mm (A01PC and
A02PC). The rmax values also increased with increasing L0
(Fig. 2a; Table 2). Conversely, the swelling strains (ea)
decreased with increasing initial sample thickness
(Fig. 2b). Figure 2c shows axial stress versus axial
expansion (DL) of the samples generated by hydration.
Note that the data obtained in experiments A01PC, A02PC,
A03PC, A04PC and A05PC all plot on the same trend,
regardless of initial sample thickness or porosity. This is
because, rather than sample behaviour, the stress–strain
relationship reflects the finite stiffness of the deformation
apparatus and Instron loading frame. Due to elastic dis-
tortion with increasing axial stress, it was impossible to
confine the samples perfectly (i.e. impose fixed-position
boundary conditions on the sample directly). This implies
that the stiffness of the machine determined how much the
sample had to expand before the axial stress could increase
further, resulting in the stress-displacement shown in
Fig. 2c. Figure 2d shows axial swelling strain measured
after 5 h of hydration versus the reciprocal of the initial
sample thickness. The data produced a linear trend,
described by DL5h = 0.174 ? 0.031L0.
Since machine distortion was a factor in our measure-
ments (Fig. 2c), we performed a number of position-
0.0
0.1
0.2
0.4
0.3
axia
l str
ain
(ea)
[-]
02510time [h]
0.0 1.5 2.0inverse of L0 [mm-1]
0.0
0.1
0.2
0.4
0.3
axia
l str
ain
( ea)
@ t
= 5
h [-]
A05PC
A03PCA04PC
A02PCA01PC
A01PCA02PC
A03PC
A04PCA05PC
0
40
80
160
120
axia
l str
ess
(σa)
[MPa
]
02510 5 105 10time [h]
0 0.24 0.32 0.5 1.00.08 0.16axial displacement (ΔL) [mm]
0
40
80
160
120
axia
l str
ess
(σa)
[MPa
]
A01PCA02PC
A03PCA04PC A05PC
A02PC
A01PC
A05PC A04PC
A03PC
ba
dc
σa,0
φ0
L0
= 1.3 MPa= 0.35-0.37 (A01PC-A04PC); 0.29 (A05PC)= 2.18 mm (A01PC, A02PC); 1.11 mm (A03PC, A04PC); 0.7 mm (A05PC)
Fig. 2 Mechanical data obtained from CaO hydration experiments performed in position-control mode, with an initial effective axial stress (r0)
of *1.3 MPa (A01PC, A02PC, A03PC, A04PC and A05PC—Table 2). a Axial stress versus time, b axial strain developed in the samples versus
time, c axial stress versus axial displacement (expansion) of the sample and d axial strain in the samples after 5 h versus one over the initial
sample length
350 Acta Geotechnica (2018) 13:341–366
123
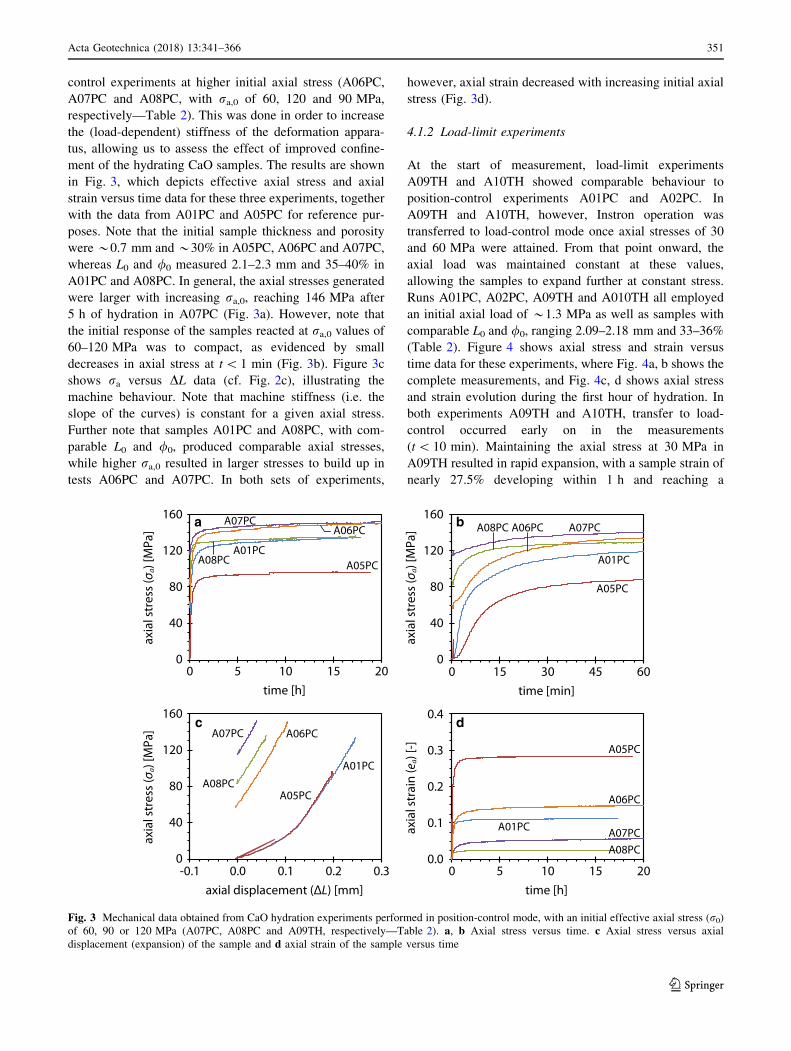
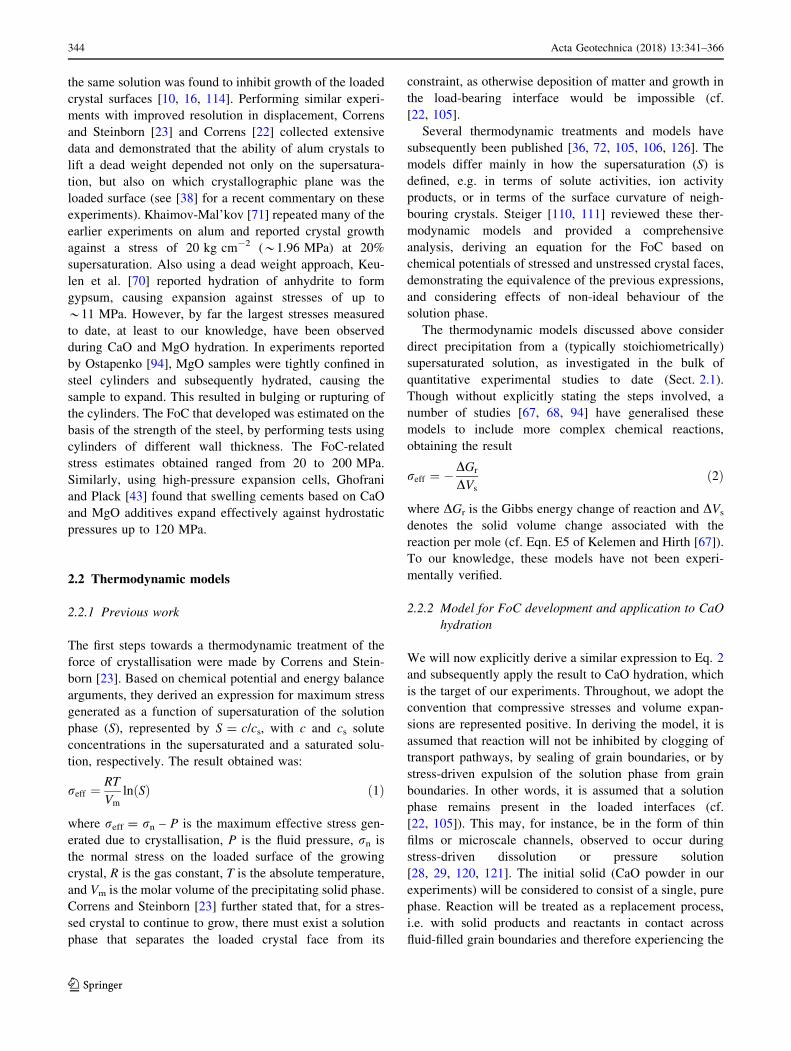
control experiments at higher initial axial stress (A06PC,
A07PC and A08PC, with ra,0 of 60, 120 and 90 MPa,
respectively—Table 2). This was done in order to increase
the (load-dependent) stiffness of the deformation appara-
tus, allowing us to assess the effect of improved confine-
ment of the hydrating CaO samples. The results are shown
in Fig. 3, which depicts effective axial stress and axial
strain versus time data for these three experiments, together
with the data from A01PC and A05PC for reference pur-
poses. Note that the initial sample thickness and porosity
were *0.7 mm and *30% in A05PC, A06PC and A07PC,
whereas L0 and /0 measured 2.1–2.3 mm and 35–40% in
A01PC and A08PC. In general, the axial stresses generated
were larger with increasing ra,0, reaching 146 MPa after
5 h of hydration in A07PC (Fig. 3a). However, note that
the initial response of the samples reacted at ra,0 values of
60–120 MPa was to compact, as evidenced by small
decreases in axial stress at t\ 1 min (Fig. 3b). Figure 3c
shows ra versus DL data (cf. Fig. 2c), illustrating the
machine behaviour. Note that machine stiffness (i.e. the
slope of the curves) is constant for a given axial stress.
Further note that samples A01PC and A08PC, with com-
parable L0 and /0, produced comparable axial stresses,
while higher ra,0 resulted in larger stresses to build up in
tests A06PC and A07PC. In both sets of experiments,
however, axial strain decreased with increasing initial axial
stress (Fig. 3d).
4.1.2 Load-limit experiments
At the start of measurement, load-limit experiments
A09TH and A10TH showed comparable behaviour to
position-control experiments A01PC and A02PC. In
A09TH and A10TH, however, Instron operation was
transferred to load-control mode once axial stresses of 30
and 60 MPa were attained. From that point onward, the
axial load was maintained constant at these values,
allowing the samples to expand further at constant stress.
Runs A01PC, A02PC, A09TH and A010TH all employed
an initial axial load of *1.3 MPa as well as samples with
comparable L0 and /0, ranging 2.09–2.18 mm and 33–36%
(Table 2). Figure 4 shows axial stress and strain versus
time data for these experiments, where Fig. 4a, b shows the
complete measurements, and Fig. 4c, d shows axial stress
and strain evolution during the first hour of hydration. In
both experiments A09TH and A10TH, transfer to load-
control occurred early on in the measurements
(t\ 10 min). Maintaining the axial stress at 30 MPa in
A09TH resulted in rapid expansion, with a sample strain of
nearly 27.5% developing within 1 h and reaching a
A07PC
0
40
80
160
120
axia
l str
ess
(σa)
[MPa
]
02510time [h]
0.0 0.1axial displacement (ΔL) [mm]
0
40
80
160
120
axia
l str
ess
(σa)
[MPa
]
A05PCA01PC
A08PC
0.0
0.1
0.2
0.4
0.3
axia
l str
ain
(ea)
[-]
02510-0.1 0.2 0.3 5 10time [h]
A05PC
A07PCA08PC
A06PC
A01PC
A06PC
A08PC
A07PC
A01PC
A05PC
A06PC
065405 10 15 30time [min]
0
40
80
160
120
axia
l str
ess
(σa)
[MPa
]
A01PC
A05PC
A06PCA08PC A07PCba
dc
Fig. 3 Mechanical data obtained from CaO hydration experiments performed in position-control mode, with an initial effective axial stress (r0)
of 60, 90 or 120 MPa (A07PC, A08PC and A09TH, respectively—Table 2). a, b Axial stress versus time. c Axial stress versus axial
displacement (expansion) of the sample and d axial strain of the sample versus time
Acta Geotechnica (2018) 13:341–366 351
123

maximum value of 28.5% after 173 min. Note that the
sample subsequently compacted, with axial strain slowly
decreasing to 28.3% at test termination after *17 h of
measurement. Compared to A09TH, maintaining the axial
stress at 60 MPa in A10TH resulted in reduced axial strain,
attaining *11% after 1 h. However, slow expansion of the
sample against the constant stress limit continued for the
duration of the test, reaching 20.9% upon termination at
t & 65 h.
4.1.3 Constant-load experiments
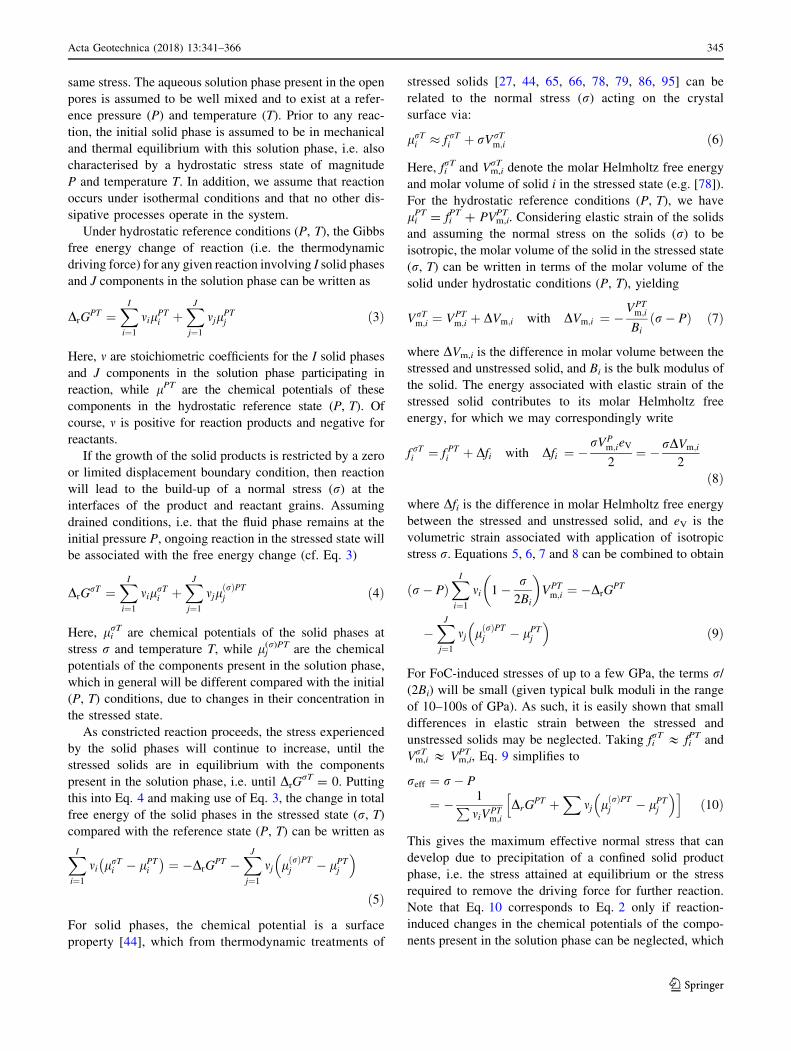
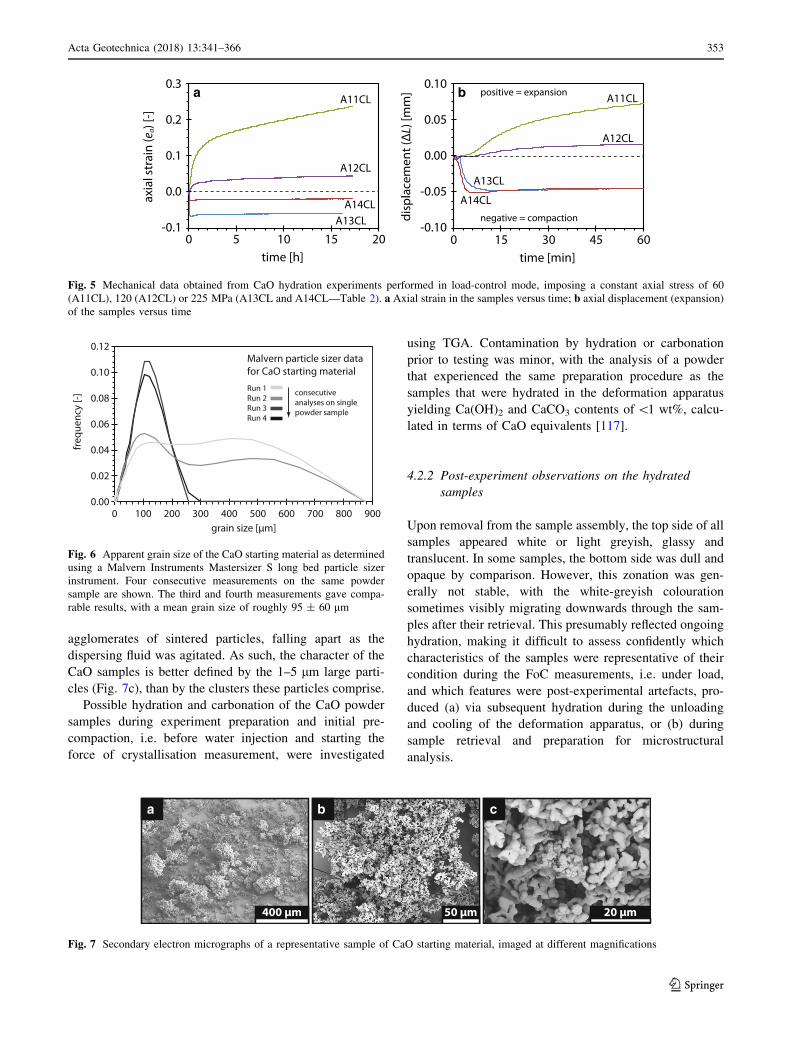
Figure 5a shows the axial strain versus time data obtained
for experiments A11CL, A12CL, A13CL and A14CL, in
which the CaO samples were exposed to water with the
Instron in load-control mode from the onset (Table 2).
Experiments A11CL, A12CL and A13CL were performed
on CaO samples with L0 of about 0.7 mm, and employed
operating loads corresponding to axial stresses of 60, 120
and 225 MPa, respectively. Conversely, sample A14CL
had an initial thickness of *2.1 mm and was tested under
an axial stress of 225 MPa. The samples exposed to water
under a constant axial stress of 60 or 120 MPa (A11CL and
A12CL), i.e. stresses lower than the force of crystallisation
that was generated in the constant-position experiments
(Sect. 4.1.1), showed sample expansion with time
(Fig. 5a). Conversely, the CaO samples hydrated under
225 MPa axial stress (A13CL and A14CL) showed com-
paction, whereby compactive displacement appeared to be
independent of L0, showing the same amount of displace-
ment for the 0.7 and 2.1 mm-thick samples (Fig. 5b).
4.2 Microstructural and chemical data
4.2.1 Characterisation of the starting CaO material
Representative samples of the calcined powder used in the
FoC experiments were analysed using a laser diffraction
particle sizer technique, SEM and TGA, to characterise the
CaO starting material. The apparent grain size was deter-
mined using a Malvern Instruments Mastersizer S long bed
instrument, using hexane as the dispersing fluid to min-
imise hydration during analysis. In four consecutive mea-
surements on the same powder sample, the mean grain size
decreased from 144 to 93 lm while the grain size distri-
bution narrowed (Fig. 6). The third and fourth Malvern
measurements gave comparable results, with a grain size
distribution of roughly 95 ± 60 lm. SEM observations
showed that these ‘‘grains’’ consisted of sintered clusters of
about 1–5 lm large particles (Fig. 7a, b). Accordingly, the
grain size evolution as seen in the Malvern particle sizer
data (Fig. 6) likely reflected disintegration of these
0.0
0.1
0.2
0.4
0.3
axia
l str
ain
(ea)
[-]
070 35time [h]
06540time [min]
0.0
0.1
0.2
0.4
0.3
axia
l str
ain
( ea)
[-]
0
40
80
160
120
axia
l str
ess
(σa)
[MPa
]
070 35time [h]
06540 15 3015 30time [min]
0
40
80
160
120
axia
l str
ess
(σa)
[MPa
]
A01PCba
dc
A02PC
A10TH
A09TH
A09TH
A10TH
A01PCA02PC
A01PC
A02PC
A09TH
A10TH
A01PCA02PC
A09TH
A10TH
Fig. 4 Mechanical data obtained from load-limit experiments; a, c axial stress versus time; b, d axial strain of the samples versus time
352 Acta Geotechnica (2018) 13:341–366
123
agglomerates of sintered particles, falling apart as the
dispersing fluid was agitated. As such, the character of the
CaO samples is better defined by the 1–5 lm large parti-
cles (Fig. 7c), than by the clusters these particles comprise.
Possible hydration and carbonation of the CaO powder
samples during experiment preparation and initial pre-
compaction, i.e. before water injection and starting the
force of crystallisation measurement, were investigated
using TGA. Contamination by hydration or carbonation
prior to testing was minor, with the analysis of a powder
that experienced the same preparation procedure as the
samples that were hydrated in the deformation apparatus
yielding Ca(OH)2 and CaCO3 contents of\1 wt%, calcu-
lated in terms of CaO equivalents [117].
4.2.2 Post-experiment observations on the hydrated
samples
Upon removal from the sample assembly, the top side of all
samples appeared white or light greyish, glassy and
translucent. In some samples, the bottom side was dull and
opaque by comparison. However, this zonation was gen-
erally not stable, with the white-greyish colouration
sometimes visibly migrating downwards through the sam-
ples after their retrieval. This presumably reflected ongoing
hydration, making it difficult to assess confidently which
characteristics of the samples were representative of their
condition during the FoC measurements, i.e. under load,
and which features were post-experimental artefacts, pro-
duced (a) via subsequent hydration during the unloading
and cooling of the deformation apparatus, or (b) during
sample retrieval and preparation for microstructural
analysis.
-0.1
0.0
0.1
0.3
0.2
axia
l str
ain
(ea)
[-]
02510time [h]
A11CL
A14CLA13CL
A12CL
065405 10 15 30time [min]
-0.10
-0.05
0.00
0.10
0.05
disp
lace
men
t (Δ
L) [m
m] ba
A13CL
A14CL
A12CL
A11CLpositive = expansion
negative = compaction
Fig. 5 Mechanical data obtained from CaO hydration experiments performed in load-control mode, imposing a constant axial stress of 60
(A11CL), 120 (A12CL) or 225 MPa (A13CL and A14CL—Table 2). a Axial strain in the samples versus time; b axial displacement (expansion)
of the samples versus time
0.04
0.06
0.08
0.12
0.10
freq
uenc
y [-]
0.00
0.02
0090 100 200 300 400 500 600 700 800grain size [μm]
Malvern particle sizer datafor CaO starting material
Run 1Run 2Run 3Run 4
consecutive analyses on singlepowder sample
Fig. 6 Apparent grain size of the CaO starting material as determined
using a Malvern Instruments Mastersizer S long bed particle sizer
instrument. Four consecutive measurements on the same powder
sample are shown. The third and fourth measurements gave compa-
rable results, with a mean grain size of roughly 95 ± 60 lm
a b c
400 μm 50 μm 20 μm
Fig. 7 Secondary electron micrographs of a representative sample of CaO starting material, imaged at different magnifications
Acta Geotechnica (2018) 13:341–366 353
123

Samples A03PC, A04PC, A05PC and A09TH formed
cohesive pellets (e.g. Fig. 8a), which could easily be
retrieved intact. When broken using a razor blade, these
samples often displayed a sub-optical, crystalline texture
(Fig. 8b), in some cases featuring (remnants of) axially
oriented, reaction front-like structures (Fig. 8c). Note that
all four these samples experienced axial stresses of
\100 MPa (cf. rmax in Table 2). Samples A01PC, A02PC,
A06PC, A07PC, A011CL, A012CL, A013CL and A014CL
were more friable. While some of these samples could be
obtained relatively intact, most disintegrated into disc-
fractured fragments and powder, either upon sample
retrieval or (more often) sometime after (Fig. 8d). It is
notable that the white, opaque material at the bottom side
of the samples was generally less consolidated and disin-
tegrated into a powder, whereas the white-greyish,
translucent material on the top side formed thin (typically
100–500 lm thick) discs that were more cohesive and
remained largely intact (Fig. 8e). Sample A10TH was lost
and could not be studied microstructurally.
Samples A01PC and A09TH were studied using SEM.
Focussing on sample A01PC, the most prominent feature
was a 150–200-lm-wide zone of dense material, present
along the top side of the sample, which was most directly
exposed to water during testing. This low-porosity zone
was broken up into regular segments (Fig. 9a) and
e
a b
1 mm5 mm
c
d
5 mm 5 mm
1 mm
Fig. 8 Optical microscopy images of the hydrated samples. a Sample A04PC, as an example of samples that could be retrieved as wholly
cohesive pellets. b Broken surface of sample A03PC, showing cryptocrystalline texture. c Broken surface of sample A09TH, showing
cryptocrystalline, dense structure with faint horizontal zonation. d Photograph of sample A01PC on SEM stub, exemplifying post-experiment
spalling and disintegration of the samples. e Photograph of sample A07PC, as an example of samples that fell apart upon retrieval, showing a
more cohesive top part and a completely disintegrated bottom half
354 Acta Geotechnica (2018) 13:341–366
123
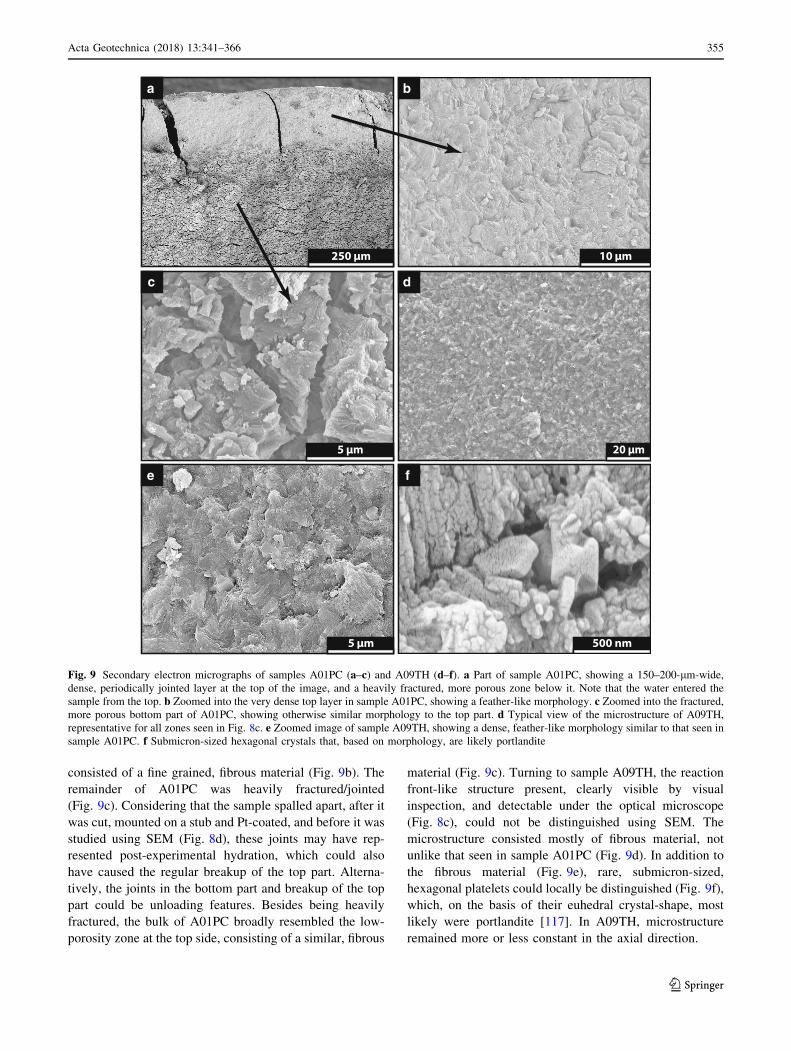
consisted of a fine grained, fibrous material (Fig. 9b). The
remainder of A01PC was heavily fractured/jointed
(Fig. 9c). Considering that the sample spalled apart, after it
was cut, mounted on a stub and Pt-coated, and before it was
studied using SEM (Fig. 8d), these joints may have rep-
resented post-experimental hydration, which could also
have caused the regular breakup of the top part. Alterna-
tively, the joints in the bottom part and breakup of the top
part could be unloading features. Besides being heavily
fractured, the bulk of A01PC broadly resembled the low-
porosity zone at the top side, consisting of a similar, fibrous
material (Fig. 9c). Turning to sample A09TH, the reaction
front-like structure present, clearly visible by visual
inspection, and detectable under the optical microscope
(Fig. 8c), could not be distinguished using SEM. The
microstructure consisted mostly of fibrous material, not
unlike that seen in sample A01PC (Fig. 9d). In addition to
the fibrous material (Fig. 9e), rare, submicron-sized,
hexagonal platelets could locally be distinguished (Fig. 9f),
which, on the basis of their euhedral crystal-shape, most
likely were portlandite [117]. In A09TH, microstructure
remained more or less constant in the axial direction.
a b
10 μm250 μm
c d
20 μm5 μm
e f
500 nm5 μm
Fig. 9 Secondary electron micrographs of samples A01PC (a–c) and A09TH (d–f). a Part of sample A01PC, showing a 150–200-lm-wide,
dense, periodically jointed layer at the top of the image, and a heavily fractured, more porous zone below it. Note that the water entered the
sample from the top. b Zoomed into the very dense top layer in sample A01PC, showing a feather-like morphology. c Zoomed into the fractured,
more porous bottom part of A01PC, showing otherwise similar morphology to the top part. d Typical view of the microstructure of A09TH,
representative for all zones seen in Fig. 8c. e Zoomed image of sample A09TH, showing a dense, feather-like morphology similar to that seen in
sample A01PC. f Submicron-sized hexagonal crystals that, based on morphology, are likely portlandite
Acta Geotechnica (2018) 13:341–366 355
123

5 Discussion
The present experiments have successfully recorded the
development of axial stress driven by a force of crys-
tallisation during confined hydration of porous CaO
powder samples, at 65 �C and at atmospheric fluid pres-
sure. Confinement was achieved using an Instron testing
machine to limit axial expansion of the sample within the
rigid cylindrical die containing the sample. With the
Instron ram held in fixed position (position control),
sample expansion was accordingly limited to concomitant
elastic machine distortion, thus allowing the observed
force of crystallisation to develop. We measured hydra-
tion-induced axial stresses of up to nearly 153 MPa
(Figs. 2, 3, 4, 5; Table 2), which is well in excess of the
tensile strength of most rock materials [59] and of in situ
lithostatic stress at depths up to 6 km. However, the
measured stresses constitute only *5% of the maximum
value predicted by the thermodynamic theory for FoC
(Sect. 2.2.2). Alongside this, the position-controlled
experiments showed a decrease in swelling strain with
increasing sample thickness (Fig. 2b). Increased initial
confining stress, accomplished by increasing the initial
axial stress, increased the FoC stresses that developed, but
decreased the swelling strains attained (Fig. 3). In
experiments where samples were hydrated under constant
axial stress, samples subjected to 60 or 120 MPa showed
expansion, while those subjected to 225 MPa compacted
(Fig. 5). Microstructural observations showed that the
samples that supported axial stresses [100 MPa often
contained a dense, cohesive layer, consisting of white or
greyish, slightly translucent material and about
100–500 lm thick, at the top of the samples, i.e. adjacent
to the fluid inlet (Figs. 8e, 9a). By contrast, the remainder
of these samples was generally friable and disintegrated
over time (Figs. 8d, e, 9a, c).
In the following, we will analyse our experimental data
and attempt to explain the observed behaviour and why the
GPa stresses predicted by thermodynamic theory were not
achieved in the experiments. We go on to discuss the
implications with respect to the applicability of FoC pro-
cesses in achieving wellbore casing expansion and sealing,
and consider ways in which the FoC achievable by CaO
hydration can be increased.
5.1 Factors affecting FoC development: sample
expansion versus machine stiffness
So far, we have considered the effective stress pertaining
at thermodynamic equilibrium (Eqs. 10, 13) to be the
maximum FoC-induced stress that can develop due to
precipitation of a confined solid product phase. However,
strictly speaking, this equilibrium was calculated as the
force that the surroundings must exert on a growing
crystal to prevent precipitation from occurring. Whether a
growing crystal can actually exert this maximum stress on
its environment will depend on the degree of confinement
and attainable expansion. In our experiments, confinement
is imposed by the Instron loading frame and the stress
generated by a given sample expansion is controlled by
the apparatus stiffness. This is clearly demonstrated in
Fig. 2c, where the data plotted show an identical axial
stress-axial displacement behaviour to that obtained in
independent machine stiffness calibrations. Accordingly,
in the present constant-position experiments, the hydra-
tion-induced stresses that develop cannot exceed the
stress generated by machine distortion equal to the max-
imum swelling strain of the sample. This means that the
FoC we measured is determined by the combined effects
of sample swelling plus apparatus stiffness, with finite
sample swelling being essential for producing a FoC.
Measured sample swelling (DVm, DLm) is in turn deter-
mined by the increase in solid volume (DVs) caused by
converting CaO to Ca(OH)2, i.e. by the extent of reaction
(n), plus the change in pore volume of the sample (DVp),
plus elastic changes in solid grain density (and hence
sample volume, DVel) due to increasing mean stress in the
sample during FoC development. Changes in pore volume
in such a reacting system will in general include a com-
ponent of pore volume increase DVp?([0), due to entrap-
ment and expansion of pores as a direct consequence of
reaction, plus a component of pore volume decrease
DVp-(\0) related to stress-driven mechanical compaction
involving grain rearrangement/deformation and hence
solid redistribution.
On this basis, we can accordingly write
DVm ¼ DVsðnÞ þ DVpðn; rÞ þ DVelðn; r;VpÞ where
DVp = DVp? ? DVp
-, which on dividing by the initial
sample volume (and assuming no radial strain) gives
measured sample strain at any instant as
em ¼ DVm
V0
¼ DLm
L0
¼ esðnÞ þ epðn; rÞ þ eelðn; r;/Þ ð15Þ
where each term can be viewed as volumetric strain
contributions due to solid conversion (es), permanent pore
volume change (ep), and elastic deformation of the sample
(eel). However, as reasoned above, in fixed-position
experiments, sample swelling strain and associated axial
displacement (DLm) are accommodated by apparatus
distortion, so that DLm = r/C where C is the apparatus
stiffness (itself a function of stress in our set-up) measured
in Pa m-1. Equivalently, em = r/(CL0). Now, at a given
value of reaction extent (n) and sample porosity (/),
eel = r/EC where EC is the instantaneous constrained
356 Acta Geotechnica (2018) 13:341–366
123

elastic stiffness of the sample. This means we can rewrite
Eq. 15 as
em � eel ¼r
CL0
� rEC
¼ esðnÞ þ epðn; rÞ ð16Þ
In general, however, EC � CL0 (elastic stiffness of the
sample is much greater than of the much larger machine),
so that eel � em and eel can be neglected, yielding
em & es(n) ? ep(n, r) or DVm & DVs(n) ? DVp(n, r). In
addition, the FoC-driven stress that develops during reac-
tion of a given sample tested in fixed-position mode can be
written as r & CL0(es(n) ? ep(n, r)). This is important to
analysing and interpreting our experimental results.
5.2 Analysis of sample volume changes
and implications for mechanism controlling FoC
Having established that the build-up of a FoC requires
sample volume expansion, let us now consider in detail the
different volumetric strain contributions that have occurred
in our experiments. Given the molar volumes of CaO,
Ca(OH)2 and water (Table 1), complete reaction of CaO,
with a given (excess) volume of water, to form Ca(OH)2,
involves an increase in the solid volume of *1.6 9 10-5
m3 mol-1, i.e. almost a doubling if reaction proceeds as
given in Eq. 12. By contrast, the total solid-plus-fluid
volume decreases by *2 9 10-6 m3 mol-1. In our
experiments, the hydration reaction contributes to the strain
es (solid volume change DVs) according to the extent of
reaction (n).
5.2.1 Endmember strain development scenarios
To progress further, it is useful to analyse the sample
volume changes (DVm, em) that can occur in a set of end-
member scenarios that are relevant for our experiments.
Figure 10 shows that maximum attainable volumetric
strain as a function of initial porosity for four such sce-
narios. The first two scenarios (Fig. 10, dashed curves
denoted S1a and S1b) represent closed-system endmember
behaviour. Here, the initial sample porosity is water-filled
(e.g. established by vacuum-flushing at the start of exper-
iment), but no further water can enter the samples, i.e. the
system is closed with respect to pore fluid transport. For
realistic initial porosities of /0\ 52%, the maximum
extent of reaction is then determined by the availability of
water, and conversion of quicklime to portlandite will be
incomplete. Scenarios S1a and S1b differ in how sample
porosity evolves. In S1a (Fig. 10), the initial pore volume
is maintained, i.e. solid product phases do not occupy the
initial pore space. This should be considered an upper limit
for expansion, unlikely to be attained in practice. Scenario
S1b represents the cases where porosity goes to zero during
hydration, thus representing the minimum swelling asso-
ciated with complete initial pore water consumption. The
other two scenarios addressed in Fig. 10 (dotted curves
denoted S2a and S2b) consider open systems, where water
can freely enter or leave the samples (e.g. through the bore
of the top piston in our experiments), thus allowing CaO
hydration to go to completion regardless of initial porosity.
Scenarios S2a and S2b again differ in how the sample
S0 - no reaction constant pore volume (S0a) porosity to zero (S0b)
S1 - closed system reaction constant pore volume (S1a) porosity to zero (S1b)
S2 - open system reaction constant pore volume (S2a) porosity to zero (S2b)
experiment names PC (position-controlled) CL (constant load) TH (transfer-and-hold)
0.0
0.2
0.4
1.0
0.8
max
imum
sam
ple
stra
in [-
]
-0.2
0.6
0 10 20 30 40 50 60
initial sample porosity [%]
Legend
A01A02
A03A04
A05
A06
A07
A08
A09
A10A11
A12
A13A14
minimum strain at complete hydration
S2b S2a
S1b
S1a
S0a
S0b
Fig. 10 Maximum attainable sample strain versus starting porosity for different reaction scenarios, together with final sample strain versus initial
porosity data for our CaO samples
Acta Geotechnica (2018) 13:341–366 357
123

porosity evolves with reaction, with S2a being charac-
terised by a constant pore volume, similar to S1a. In sce-
nario S2b, similar to S1b, sample porosity is assumed to go
to zero, so that the plotted strains represent minimum
values for complete (open system) CaO hydration. While
the evolution of porosity (/) is undetermined in our
experiments, assuming that the porosity of highly hydrated
material approaches zero is likely reasonable, given the
dense, translucent nature of the hydrated portions of our
hydrated samples (Figs. 8b, c, 9b, d). Initial sample
porosity (/0) is known from /0 ¼ 1 � m0=ðqCaOL0AÞ.Also plotted in Fig. 10 are our experimental data,
specifically the final axial strains attained in our experi-
ments versus the initial sample porosity. Error bars repre-
sent uncertainty in our data related to initial sample length
and sample porosity determinations.
5.2.2 Role of reaction extent in determining stress
development
The first thing to note in Fig. 10 is that all samples but
A03PC, A04CP and A09TH plot below the dark grey,
dotted curve corresponding to the scenario S2b of complete
hydration (open-system reaction) plus complete porosity
reduction. This implies that, within uncertainty of the strain
measurements, stress development in position-controlled
experiments A03PC and A04PC could possibly have been
limited by hydration going to completion, i.e. the system
reaching chemical equilibrium by eliminating all CaO,
before higher axial stresses developed. Experiment A09TH
was conducted in load-limit mode, with rTH = 30 MPa,
allowing reaction to proceed without the build-up of stress
beyond this value, potentially attaining complete hydration.
However, in all other samples tested (A01PC, A02PC,
A05PC, A06PC, A07PC, A08PC, A10TH, A11CL,
A12CL, A13CL and A14CL), the measured sample strains
are less than the minimum value expected for complete
hydration (S2b). In general, it is likely that sample porosity
did not go to zero, but instead attained some small residual
value, which would have contributed to the final volumetric
expansion. These measured strains must therefore imply
that CaO hydration was incomplete at the time of experi-
ment termination in the majority of the samples. Accord-
ingly, the limited stresses in most experiments, particularly
in position-controlled experiments A01PC, A02PC,
A05PC, A06PC, A07PC and A08PC, cannot be explained
by the system running out of CaO to hydrate. This further
implies that larger swelling strains should have been pos-
sible in experiments A01PC, A02PC, A05PC, A06PC,
A07PC and A08PC, were reaction to proceed. It follows
that the axial stresses developed here were not limited by
insufficient machine stiffness but by incomplete reaction
progress and net expansion.
5.2.3 The role of transport processes and water access
Given the zoned nature (Figs. 8c, 9a) and brittle/friable
post-experiment character of our samples, with many of
them spalling (Fig. 8d) or partially crumbling into a pow-
der (Fig. 8e), our microstructural data strongly support the
notion that the hydration reaction was incomplete in many
of the experiments. Indeed, with CaO remaining in the
samples after completion of the experiments (i.e. following
unloading), any ongoing hydration via the air could sub-
sequently have caused internal expansions, explaining the
observed disintegration of the samples (cf. [113]). On the
other hand, some of the samples, which either were very
thin (A03PC, A04PC, A05PC), or experienced low load
(A09TH), did form dense cohesive pellets (Sect. 4.2.2),
suggesting that a larger extent of reaction occurred in these
experiments. Indeed, spalling may be a consequence of
differential expansion during unloading. We therefore need
to consider what processes and effects may have con-
tributed to this variability in extent of reaction occurring
during our experiments. A clear candidate is the question
of water access into the reacting sample from the external
fluid system, i.e. the issue of the evolving permeability of
the (reacted part of the) sample during the reaction
progress.
Lacking post-experiment sample mass measurements,
there is no direct means of determining the extent of
reaction in our experiments, as the volume of water con-
sumed and hence total system volume with time, are
unknown. However, as discussed above, some constraints
can be obtained by comparing measured sample strain,
which represents the combined effect of hydration-induced
changes in solid volume (i.e. extent of reaction) and
porosity change, with the endmember scenarios repre-
sented in Fig. 10. Returning to Fig. 10, all samples except
A13CL and A14CL plot well above the line corresponding
to scenario S1b, representing complete porosity reduction
plus closed-system reaction. This means that the measured
strain is more than can be explained by closed-system
behaviour, assuming strong porosity reduction, suggesting
that at least some water entered our samples during the
hydration process in addition to that initially injected.
Transport of water into the sample porosity certainly
occurred in samples A05PC and A11CL, as the data for
these experiments plot above the constraint corresponding
to closed-system reaction at constant pore volume (sce-
nario S1a). Further, we note that experiments A13CL and
A14CL, which plot below the scenario S1b line, were
conducted in load-control mode, at a constant and high
axial stress of 225 MPa. These samples showed com-
paction rather than expansion (Fig. 5). For A13CL and
A14CL, we therefore infer that hydration (i.e. solid volume
increase), combined with compaction of the reacting
358 Acta Geotechnica (2018) 13:341–366
123
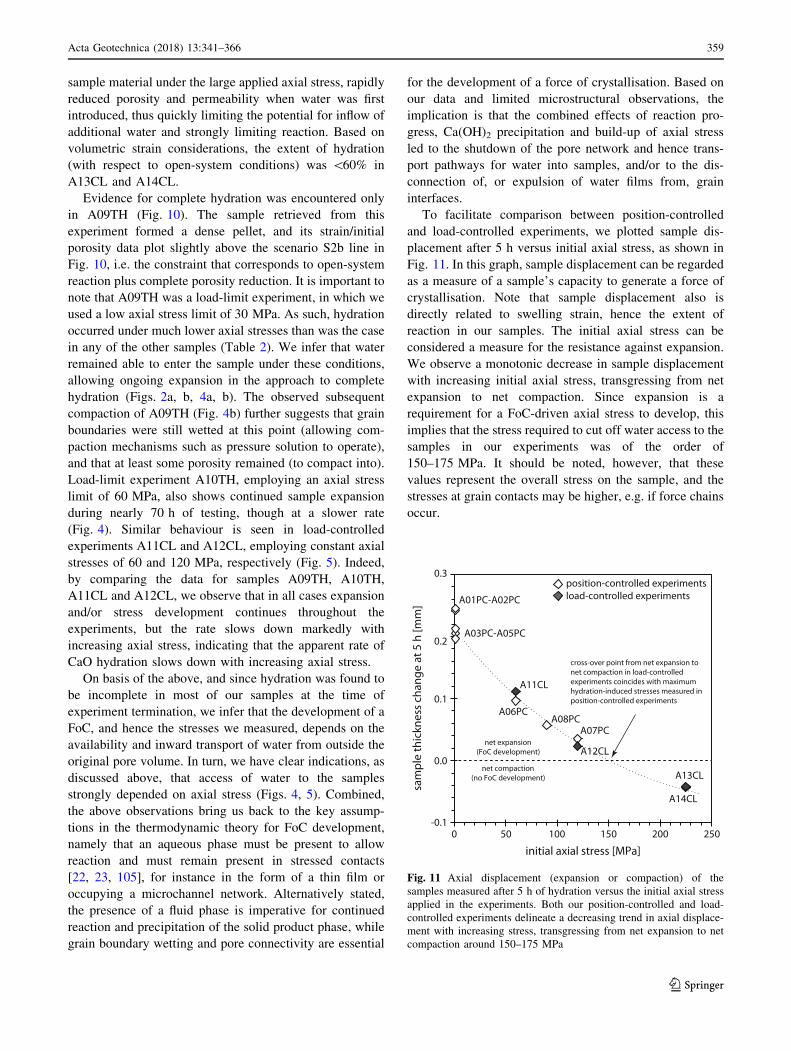
sample material under the large applied axial stress, rapidly
reduced porosity and permeability when water was first
introduced, thus quickly limiting the potential for inflow of
additional water and strongly limiting reaction. Based on
volumetric strain considerations, the extent of hydration
(with respect to open-system conditions) was \60% in
A13CL and A14CL.
Evidence for complete hydration was encountered only
in A09TH (Fig. 10). The sample retrieved from this
experiment formed a dense pellet, and its strain/initial
porosity data plot slightly above the scenario S2b line in
Fig. 10, i.e. the constraint that corresponds to open-system
reaction plus complete porosity reduction. It is important to
note that A09TH was a load-limit experiment, in which we
used a low axial stress limit of 30 MPa. As such, hydration
occurred under much lower axial stresses than was the case
in any of the other samples (Table 2). We infer that water
remained able to enter the sample under these conditions,
allowing ongoing expansion in the approach to complete
hydration (Figs. 2a, b, 4a, b). The observed subsequent
compaction of A09TH (Fig. 4b) further suggests that grain
boundaries were still wetted at this point (allowing com-
paction mechanisms such as pressure solution to operate),
and that at least some porosity remained (to compact into).
Load-limit experiment A10TH, employing an axial stress
limit of 60 MPa, also shows continued sample expansion
during nearly 70 h of testing, though at a slower rate
(Fig. 4). Similar behaviour is seen in load-controlled
experiments A11CL and A12CL, employing constant axial
stresses of 60 and 120 MPa, respectively (Fig. 5). Indeed,
by comparing the data for samples A09TH, A10TH,
A11CL and A12CL, we observe that in all cases expansion
and/or stress development continues throughout the
experiments, but the rate slows down markedly with
increasing axial stress, indicating that the apparent rate of
CaO hydration slows down with increasing axial stress.
On basis of the above, and since hydration was found to
be incomplete in most of our samples at the time of
experiment termination, we infer that the development of a
FoC, and hence the stresses we measured, depends on the
availability and inward transport of water from outside the
original pore volume. In turn, we have clear indications, as
discussed above, that access of water to the samples
strongly depended on axial stress (Figs. 4, 5). Combined,
the above observations bring us back to the key assump-
tions in the thermodynamic theory for FoC development,
namely that an aqueous phase must be present to allow
reaction and must remain present in stressed contacts
[22, 23, 105], for instance in the form of a thin film or
occupying a microchannel network. Alternatively stated,
the presence of a fluid phase is imperative for continued
reaction and precipitation of the solid product phase, while
grain boundary wetting and pore connectivity are essential
for the development of a force of crystallisation. Based on
our data and limited microstructural observations, the
implication is that the combined effects of reaction pro-
gress, Ca(OH)2 precipitation and build-up of axial stress
led to the shutdown of the pore network and hence trans-
port pathways for water into samples, and/or to the dis-
connection of, or expulsion of water films from, grain
interfaces.
To facilitate comparison between position-controlled
and load-controlled experiments, we plotted sample dis-
placement after 5 h versus initial axial stress, as shown in
Fig. 11. In this graph, sample displacement can be regarded
as a measure of a sample’s capacity to generate a force of
crystallisation. Note that sample displacement also is
directly related to swelling strain, hence the extent of
reaction in our samples. The initial axial stress can be
considered a measure for the resistance against expansion.
We observe a monotonic decrease in sample displacement
with increasing initial axial stress, transgressing from net
expansion to net compaction. Since expansion is a
requirement for a FoC-driven axial stress to develop, this
implies that the stress required to cut off water access to the
samples in our experiments was of the order of
150–175 MPa. It should be noted, however, that these
values represent the overall stress on the sample, and the
stresses at grain contacts may be higher, e.g. if force chains
occur.
0 50 100 150 200 250
initial axial stress [MPa]
0.0
0.2
0.3
0.1
sam
ple
thic
knes
s ch
ange
at 5
h [m
m]
-0.1
net expansion(FoC development)
net compaction(no FoC development) A13CL
A14CL
A12CL
A11CL
A07PCA08PC
A06PC
A01PC-A02PC
A03PC-A05PC
position-controlled experimentsload-controlled experiments
cross-over point from net expansion tonet compaction in load-controlled experiments coincides with maximumhydration-induced stresses measured inposition-controlled experiments
Fig. 11 Axial displacement (expansion or compaction) of the
samples measured after 5 h of hydration versus the initial axial stress
applied in the experiments. Both our position-controlled and load-
controlled experiments delineate a decreasing trend in axial displace-
ment with increasing stress, transgressing from net expansion to net
compaction around 150–175 MPa
Acta Geotechnica (2018) 13:341–366 359
123
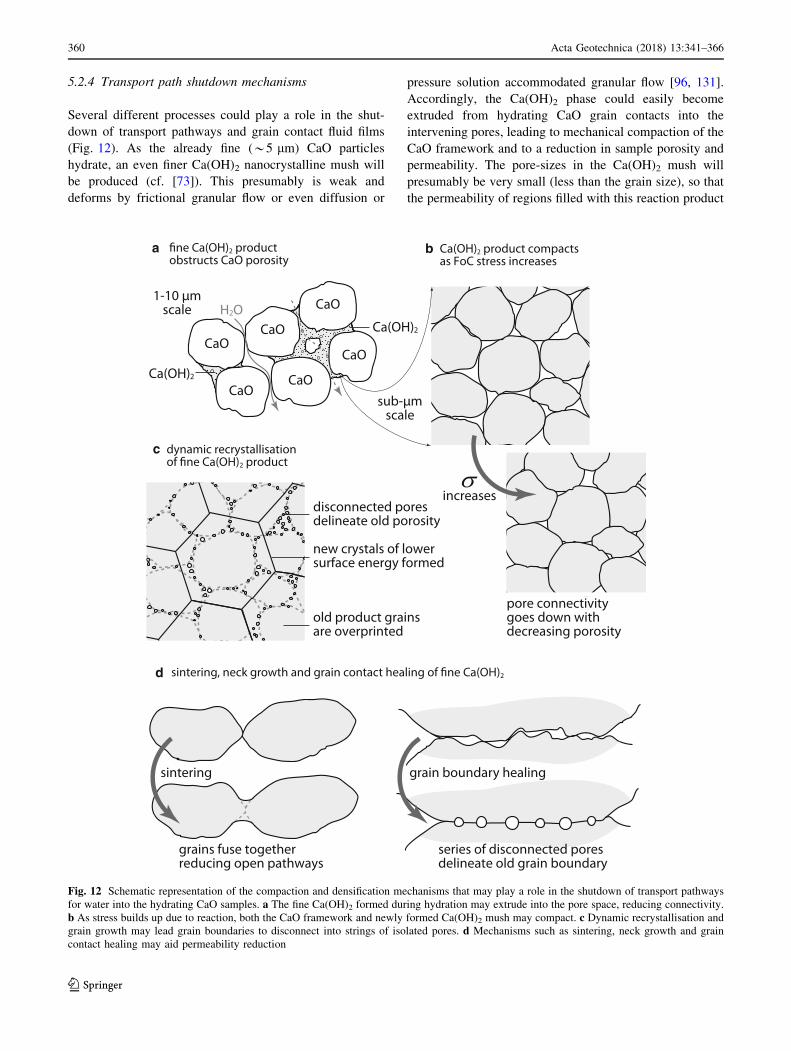
5.2.4 Transport path shutdown mechanisms
Several different processes could play a role in the shut-
down of transport pathways and grain contact fluid films
(Fig. 12). As the already fine (*5 lm) CaO particles
hydrate, an even finer Ca(OH)2 nanocrystalline mush will
be produced (cf. [73]). This presumably is weak and
deforms by frictional granular flow or even diffusion or
pressure solution accommodated granular flow [96, 131].
Accordingly, the Ca(OH)2 phase could easily become
extruded from hydrating CaO grain contacts into the
intervening pores, leading to mechanical compaction of the
CaO framework and to a reduction in sample porosity and
permeability. The pore-sizes in the Ca(OH)2 mush will
presumably be very small (less than the grain size), so that
the permeability of regions filled with this reaction product
2 productobstructs CaO porosity
CaOH2O
CaO
CaOCaO
CaO
CaOCa(OH)2
Ca(OH)2
dynamic recrystallisation 2 product
old product grains are overprinted
new crystals of lower surface energy formed
disconnected poresdelineate old porosity
c
a
2
pore connectivitygoes down withdecreasing porosity
d
Ca(OH)2 product compactsas FoC stress increases
b
increases
sub-μmscale
1-10 μmscale
gnilaehyradnuobniarggniretnis
series of disconnected poresdelineate old grain boundary
grains fuse togetherreducing open pathways
Fig. 12 Schematic representation of the compaction and densification mechanisms that may play a role in the shutdown of transport pathways
for water into the hydrating CaO samples. a The fine Ca(OH)2 formed during hydration may extrude into the pore space, reducing connectivity.
b As stress builds up due to reaction, both the CaO framework and newly formed Ca(OH)2 mush may compact. c Dynamic recrystallisation and
grain growth may lead grain boundaries to disconnect into strings of isolated pores. d Mechanisms such as sintering, neck growth and grain
contact healing may aid permeability reduction
360 Acta Geotechnica (2018) 13:341–366
123

will be low, even if the porosity remains connected. More
likely, though, the material will cement up by reaction-
driven precipitation or by grain growth and sintering pro-
cesses, promoting permeability reduction. Moreover, at
free, unloaded surfaces such as larger pore walls between
hydrating CaO grains or Ca(OH)2 grain clusters, the solu-
tion phase will be supersaturated with respect to Ca(OH)2,
leading to precipitation in pore throats, rapidly reducing
permeability and restricting water access, preventing fur-
ther reaction.
As load generated by expansion is progressively trans-
ferred to the product mush, due to elimination of the ini-
tially load-supporting CaO framework, the nanocrystalline
Ca(OH)2 product phase may further compact via pressure
solution plus intergranular sliding. This will further reduce
the porosity and permeability of the Ca(OH)2 produce and
whole sample until healing of the grain contacts occurs by
internal or contact margin precipitation, i.e. via contact
asperity or neck growth phenomena [122, 123]. As indi-
cated above, grain growth involving grain boundary
migration, driven by surface energy reduction in the fine
product phase, could also disconnect pores and reduce
permeability simply by overgrowing and isolating pores
[69]. This grain growth could potentially occur during
filling of larger pores with fine Ca(OH)2 reaction product,
blocking the pores very quickly and trapping fluid. Another
explanation would be that fluid infiltration and hence
reaction progress is facilitated by reaction-induced frac-
turing [92], with build-up of higher normal stresses ham-
pering the opening of such microfractures.
Alternatively to the above clogging mechanisms limit-
ing reaction progress and hence FoC development, the
stresses measured in our experiments may correspond to
attaining or exceeding the effective normal stress required
to displace a fluid film from a flat grain-to-grain contact,
i.e. the so-called disjoining pressure [57, 105, 106].
Exceeding this pressure could lead to ‘‘drying-out’’ of the
stressed grain contacts, impeding further reaction/hydration
and dissolution/precipitation at these locations. When
precipitation takes place on pore walls, this will lead to
porosity reduction, which may cut off permeability. How-
ever, this will also result in more grain–grain contacts, i.e. a
larger load-bearing surface area, thus bringing the maxi-
mum possible stress on a sample scale closer to the max-
imum possible stress from thermodynamic calculations.
Unfortunately, to our knowledge, there have been no
studies published in which the disjoining pressure between
calcium hydroxide and calcium oxide surfaces, and various
combinations thereof, was measured or calculated. We
therefore have no basis upon which to evaluate this
hypothesis further. Moreover, the exact surface area of the
loaded contacts within our CaO samples is unknown, pre-
cluding direct comparison even if such data would be
available. Nevertheless, it is interesting to note that our
experimental data show a transition from net expansion to
net compaction at an axial stress of 150–175 MPa
(Fig. 11). This transition could perhaps represent complete
cessation of FoC development, e.g. due to healing of grain
boundaries, but could also reflect a regime shift in the
(relative) kinetics of compaction and expansion, e.g. due to
water transport limitations or local depletion of CaO. Such
a competition between hydration-induced expansion and
stress-induced compaction may explain the late-stage
compaction observed in A09TH (Fig. 4b).
Last, it should be noted that, given the relatively short
duration of our laboratory experiments, we cannot rule out
the possibility that CaO hydration did not stop in our
experiments but merely slowed down, due to increasingly
constricted inflow of water, to the point where the build-up
of further stress became negligible on the timescale of our
experiments (up to *65 h). In Portland-based cement,
residual (i.e. unhydrated) clinker phases can remain present
for years [117], demonstrating that restricted water avail-
ability can slow down reaction, even in the absence of high
stress.
5.3 Applicability to casing expansion
and suggestions for future work
In Introduction, we raised the question of whether the force
of crystallisation generated during confined hydration of
CaO [43] can be used to expand the casing of leaking
wellbores, thus achieving sealing, e.g. via the construction
of some form of internal plug using a CaO-based material.
We argued that if sufficiently high internal stresses can be
attained, then hydration of the plug may bring about a
permanent radial expansion of the casing pipe, thereby
closing the annular voids and fractures that constitute
leakage pathways outside of the casing [74, 75]. However,
any such application of CaO hydration-induced stresses
would require the stresses and strains that develop during
CaO hydration to be predictable and controllable.
Our experiments on precompacted CaO powder samples
have shown the development of CaO hydration-induced
stresses of up to 153 MPa (Fig. 11). Preliminary calcula-
tions, made using Barlow’s formula for plastic yielding of a
cylindrical metal pipe [7, 124], show that stresses in the
range of 100–300 MPa are required to initiate expansion of
a typical wellbore casing constructed from conventional
steel [56]. Therefore, while noting that the true stress
requirements will be wellbore specific and require analysis
of the geomechanical state of the wellbore, our preliminary
laboratory results are quite encouraging. On the other hand,
the hydration-induced stresses measured in our experi-
ments constitute only a small fraction of the GPa stresses
predicted by thermodynamic theory, so there remains scope
Acta Geotechnica (2018) 13:341–366 361
123

for further study and attempts to increase achievable
reaction-driven stress. The main goal of such work should
be to elucidate the mechanism underlying the shutdown of
water transport, which seems to have arrested FoC devel-
opment in our experiments. A possible first step in this
direction would be to conduct CaO hydration experiments
similar to ours, but using a controlled fluid pressure, and a
deformation apparatus with flow-through capability, to
monitor sample permeability. This type of set-up would
further allow for the investigation of certain additives, such
as mineral phases with grossly different surface energies,
porous ceramics particles, or glass fibre, which could
potentially help maintain the transport pathways for water
open for longer.
In addition, the following two aspects of FoC develop-
ment by CaO hydration require further study, from both a
scientific and an application perspective. First, our exper-
iments involved CaO powder samples that were precom-
pacted at 250 MPa to reduce initial porosity. Conducting a
similar procedure on an industrial scale would be costly. It
would therefore be interesting to study in more detail the
effect of initial porosity on the development and maximum
magnitude of the force of crystallisation, e.g. to determine
allowable porosity ranges for the method to be workable.
Second, in the present study we prepared our CaO by
calcining Carrara marble at 1100 �C for 16 h. There exists
a substantial body of literature dealing with the effects of
calcination temperature, starting carbonate material and
grain size, and various other processes (e.g. sintering) on
the nature of the final CaO product [13, 14, 41, 46, 112].
For example, the rate of hydration is slower for dead-burnt
lime (calcined at[1600 �C) than for ‘‘normal’’ CaO, pre-
pared at\1200 �C [43]. Larger FoC-induced stresses could
potentially be generated by optimising properties of the
CaO material used.
6 Conclusions
This study was motivated by noting that leakage of CO2 or
other fluids occurring behind the steel casing in a wellbore
could potentially be mitigated by producing a small radial
expansion of the casing by means of hydration of CaO, thus
mechanically closing annular voids, debonding defects
and/or fractures outside the casing. For the hydration of
CaO, thermodynamic models predict reaction are capable
of producing very large stresses, or forces of crystallisation
(FoC), in the range of 3.4 GPa. However, the stresses
produced by CaO hydration have never been directly
measured in the laboratory. To assess what FoC-induced
stresses can be attained in practice, we studied their
development in uniaxial expansion experiments on pre-
compacted (at 250 MPa axial stress) powder aggregates of
CaO (precompacted discs with initial porosities of
24.9–40% and initial thicknesses of 0.68–2.34 mm), which
were one-sidedly exposed to water a temperature of 65 �C.
Our main findings can be summarised as follows:
1. In experiments where CaO powder aggregates were
hydrated under confined conditions, i.e. where axial
(volumetric) expansion of the samples was limited to
that allowed due to the finite stiffness of the deforma-
tion apparatus, we observed that samples continued to
expand until effective axial stresses of up to 153 MPa
were generated. While these stresses are substantial,
they constitute only about 5% of the thermodynami-
cally predicted maximum. Volumetric considerations,
accounting for both reaction-induced changes in solid
volume and the possible range of porosity reduction,
suggest that in at least some of these experiments
hydration cannot have been complete. Note that
hydration was also incomplete in the test where
153 MPa axial stress was achieved.
2. In experiments where the hydration of CaO powder
aggregates proceeded under a constant axial stress, we
observed a decrease in the swelling strain with
increasing axial stress, from 60 to 120 MPa, while
samples that were hydrated under 225 MPa showed
compaction rather than expansion. Volumetric consid-
erations show that the extent of reaction was\60% in
the experiments performed at 225 MPa. In terms of the
observed axial displacement, about 50 lm of com-
paction occurred, regardless of sample thickness,
suggesting the responsible process occurred in a
limited region. Plotting the measured sample expan-
sion versus initial axial stress showed a transition from
net expansion to net compaction around
150–175 MPa.
3. The samples that experienced axial stresses of
\100 MPa formed dense, cohesive pellets, displaying
a cryptocrystalline texture. Conversely, in samples
subjected to [100 MPa, microstructural analysis
revealed very dense, about 100–300 lm thick rims,
present at the top of the samples (which was directly
exposed to water). The remainder of these samples was
comparatively porous, and rather friable, with these
parts of the samples often disintegrating into a powder.
We infer this represents ongoing, post-experiment
hydration of these parts of the samples.
4. Given our stress measurements, there must be a
process that stops or significantly slows down the rate
of hydration, well before the thermodynamic maxi-
mum stress is attained. In only a few of the experi-
ments could this be attributed to hydration reaching
completion. This notion of partial hydration is sub-
stantiated by our microstructural observations, with
362 Acta Geotechnica (2018) 13:341–366
123

samples for which volumetric considerations suggest
incomplete hydration showing thin, dense zones
developed at the top side, where water entered the
samples. We infer that the development of such dense
zones by the combined effects of sample cementation
and stress-driven compaction led to shutdown of
transport pathways for water into the sample pore
structure and into grain contacts. Moreover, a key
assumption in the thermodynamic model, namely that
a solution phase, for instance in the form of thin films
or microchannels, remains present may not hold at
high grain boundary contact stresses, corresponding to
our measured sample-scale stresses of about
150–175 MPa, e.g. due to a disjoining pressure effect.
5. With regard to possible application to leakage remedi-
ation in wellbores, the present laboratory experiments
documented hydration-induced stresses of a magnitude
equivalent to that of the internal pressures required for
casing expansion. However, the development of these
stresses is strongly dependent on the influx of water,
which may yield practical limitations. Nevertheless, the
present results point the way to finding engineering
solutions that may in future allow controllable, reaction-
induced stresses and strains to be achieved and applied
in wellbore sealing operations. For example, usage of
certain additives may help maintain transport pathways
for water open longer, which could potentially allow
larger stresses to develop.
Acknowledgements Data used in this paper were acquired in
experiments performed at the High Pressure and Temperature Labo-
ratory, Utrecht University, the Netherlands. Data can be made
available by the authors upon request. We thank Eimert de Graaff,
Gert Kastelein, Peter van Krieken and Thony van der Gon Netscher
for valuable technical support provided in the laboratory and Bart
Verberne for help with using the Scanning Electron Microscope. The
manuscript benefitted from the detailed feedback of two anonymous
reviewers, for which we are thankful. This research was conducted
within the context of CATO-2 (www.co2-cato.org), the Dutch
national research program on Carbon Capture and Storage (CCS). The
program is financially supported by the Dutch government (Ministry
of Economic Affairs) and the CATO-2 consortium parties.
Open Access This article is distributed under the terms of the
Creative Commons Attribution 4.0 International License (http://
creativecommons.org/licenses/by/4.0/), which permits unrestricted
use, distribution, and reproduction in any medium, provided you give
appropriate credit to the original author(s) and the source, provide a
link to the Creative Commons license, and indicate if changes were
made.
References
1. Agbasimalo N, Radonjic M (2014) Experimental study of the
impact of drilling fluid contamination on the integrity of
cement–formation interface. J Energy Resour Technol
136:42908
2. Anderson GM, Crerar DA (1993) Thermodynamics in geo-
chemistry: the equilibrium model. Oxford University Press,
Oxford
3. Bachu S (2003) Screening and ranking of sedimentary basins for
sequestration of CO2 in geological media in response to climate
change. Environ Geol 44:277–289. doi:10.1007/s00254-003-
0762-9
4. Bachu S, Watson T (2006) Possible indicators for CO2 leakage
along wells. In: 8th International conference on greenhouse gas
control technologies, pp 19–22
5. Barclay I, Pellenbarg J, Tettero F, Pfeiffer J (2001) The begin-
ning of the end: a review of abandonment and decommissioning
practices. Oilf Rev 13(4):28–41
6. Bargawi RA, Zhou S, Al-Umran MI, Aghnim WA (2005)
Expandable tubular successfully scab off severe casing leaks. In:
SPE/IADC middle east drilling technology conference and
exhibition, 12–14 September, Dubai, United Arab Emirates.
Society of Petroleum Engineers. doi:10.2118/97357-MS
7. Barlow P (1836) On the force excited by hydraulic pressure in a
Bramah press; the resisting power of the cylinder, and rules for
computing the thickness of metal for presses of various powers
and dimensions. Trans Inst Civ Eng 1:133–139. doi:10.1680/
itrcs.1836.24488
8. Bauer S, Beyer C, Dethlefsen F, Dietrich P, Duttmann R, Ebert
M, Feeser V, Gorke U, Kober R, Kolditz O, Rabbel W, Schanz
T, Schafer D, Wurdemann H, Dahmke A (2013) Impacts of the
use of the geological subsurface for energy storage: an investi-
gation concept. Environ Earth Sci 70:3935–3943. doi:10.1007/
s12665-013-2883-0
9. Becker GF, Day AL (1905) The linear force of growing crystals.
Proc Wash Acad Sci 8:238–288
10. Becker GF, Day AL (1916) Note on the linear force of growing
crystals. J Geol 24:313–333
11. Beruto D, Barco L, Belleri G, Searcy AW (1981) Vapor phase
hydration of submicrometer CaO particles. J Am Ceram Soc
64:74–80
12. Birss FW, Thorvaldson T (1955) The mechanism of the
hydration of calcium oxide. Can J Chem 33:881–886
13. Borgwardt RH (1989) Sintering of nascent calcium oxide. Chem
Eng Sci 44:53–60
14. Bruce KR, Gullett BK, Beach LO (1989) Comparative SO2
reactivity of CaO derived from CaCO3 and Ca(OH)2. AIChE J
35:37–41
15. Brufatto C, Cochran J, Conn L, Power D, El-Zeghaty SZAA,
Fraboulet B, Griffin T, James S, Munk T, Justus F (2003) From
mud to cement—building gas wells. Oilfield Rev. 15:62–76
16. Bruhns W, Mecklenburg W (1913) Uber die sogennante
Kristallisationskraft. Jahresbericht des Niedersachsischen Geol.
Vereins zu Hann. VI
17. Brunet J-PL, Li L, Karpyn ZT, Huerta NJ (2016) Fracture
opening or self-sealing: critical residence time as a unifying
parameter for cement–CO2–brine interactions. Int J Greenh Gas
Control 47:25–37
18. Byrom TG (2014) Casing and liners for drilling and completion:
design and application. Elsevier, Amsterdam
19. Campbell K, Smith R (2013) Permanent Well Abandonment.
Way Ahead 9:25–27
20. Cao P, Karpyn ZT, Li L (2015) Self-healing of cement fractures
under dynamic flow of CO2-rich brine. Water Resour Res.
doi:10.1002/2014WR016162
21. Chatterji S (1995) Mechanism of expansion of concrete due to
the presence of dead-burnt CaO and MgO. Cem Concr Res
25:51–56
Acta Geotechnica (2018) 13:341–366 363
123
22. Correns CW (1949) Growth and dissolution of crystals under
linear pressure. Discuss Faraday Soc 5:267–271
23. Correns CW, Steinborn W (1939) Experimente zur Messung und
Erklarung der sogenannten Kristallisationskraft. Z Krist Mater
101:117–133
24. Coussy O (2005) Poromechanics of freezing materials. J Mech
Phys Solids 53:1689–1718. doi:10.1016/j.jmps.2005.04.001
25. Cowan M (2007) Field study results improve squeeze cementing
success. In: Production and operations symposium, 31 March–3
April, Oklahoma City, Oklahoma, USA. Society of Petroleum
Engineers. doi:10.2118/106765-MS
26. Daccord G, Craster B, Ladva H, Jones T, Manescu G (2006)
Cement–formation interactions. In: Nelson EB, Guillot D (eds)
Well cementing. Schlumberger, Sugar Land, p 773
27. de Boer RB (1977) On the thermodynamics of pressure solu-
tion—interaction between chemical and mechanical forces.
Geochim Cosmochim Acta 41:249–256
28. de Meer S, Spiers CJ, Nakashima S (2005) Structure and dif-
fusive properties of fluid-filled grain boundaries: an in situ study
using infrared (micro) spectroscopy. Earth Planet Sci Lett
232:403–414
29. de Meer S, Spiers CJ, Peach CJ, Watanabe T (2002) Diffusive
properties of fluid-filled grain boundaries measured electrically
during active pressure solution. Earth Planet Sci Lett
200:147–157
30. Di Crescenzo D, Shuster M, Petlyuk A, Ernens D, Zijsling D,
Pasaribu H (2015) Lubricants and accelerated test methods for
expandable tubular application. In: SPE/IADC drilling confer-
ence and exhibition, 17–19 March, London, England, UK.
Society of Petroleum Engineers. doi:10.2118/173111-MS
31. Duchesne J, Reardon EJ (1995) Measurement and prediction of
portlandite solubility in alkali solutions. Cem Concr Res
25:1043–1053
32. Dupal KK, Campo DB, Lofton JE, Weisinger D, Cook RL,
Bullock MD, Grant TP, York PL (2001) Solid expandable
tubular technology—a year of case histories in the drilling
environment. In: SPE/IADC drilling conference, 27 February–1
March, Amsterdam, Netherlands. Society of Petroleum Engi-
neers. doi:10.2118/67770-MS
33. Dusseault MB, Gray MN, Nawrocki PA (2000) Why oilwells
leak: cement behavior and long-term consequences. In: SPE
international oil and gas conference and exhibition, SPE 64733.
p 8. doi:10.2118/64733-MS
34. Dyer S, Graham G (2002) The effect of temperature and pres-
sure on oilfield scale formation. J Pet Sci Eng 35:95–107.
doi:10.1016/S0920-4105(02)00217-6
35. Espinosa Marzal RM, Scherer GW (2008) Crystallization of
sodium sulfate salts in limestone. Environ Geol 56:605–621.
doi:10.1007/s00254-008-1441-7
36. Everett DH (1961) The thermodynamics of frost damage to
porous solids. Trans Faraday Soc 57:1541–1551
37. Flatt RJ, Scherer GW (2008) Thermodynamics of crystallization
stresses in DEF. Cem Concr Res 38:325–336. doi:10.1016/j.
cemconres.2007.10.002
38. Flatt RJ, Steiger M, Scherer GW (2006) A commented transla-
tion of the paper by C.W. Correns and W. Steinborn on crys-
tallization pressure. Environ Geol 52:187–203. doi:10.1007/
s00254-006-0509-5
39. Fleckenstein WW, Eustes AW, Miller MG (2000) Burst induced
stresses in cemented wellbores. In: SPE/AAPG western regional
meeting. Society of Petroleum Engineers
40. Fletcher RC, Merino E (2001) Mineral growth in rocks: kinetic-
rheological models of replacement, vein formation, and syn-
tectonic crystallization. Geochim Cosmochim Acta
65:3733–3748. doi:10.1016/S0016-7037(01)00726-8
41. Fuertes AB, Alvarez D, Rubiera F, Pis JJ, Marban G, Palacos JM
(1991) Surface area and pore size changes during sintering of
calcium oxide particles. Chem Eng Commun 109:73–88
42. Gasda SE, Bachu S, Celia MA (2004) Spatial characterization of
the location of potentially leaky wells penetrating a deep saline
aquifer in a mature sedimentary basin. Environ Geol
46:707–720. doi:10.1007/s00254-004-1073-5
43. Ghofrani R, Plack H (1993) CaO- and/or MgO-swelling
cements: a key for providing a better annular sealing? In: SPE/
IADC drilling conference. Society of Petroleum Engineers.
doi:10.2118/25697-MS
44. Gibbs JW (1928) The collected works of J. Willard Gibbs,
volume I: thermodynamics. Yale University Press, New Haven
45. Glasson DR (1958) Reactivity of lime and related oxides. II.
Sorption of water vapour on calcium oxide. J Appl Chem
8:798–803
46. Glasson DR (1958) Reactivity of lime and related oxides.
I. Production of calcium oxide. J Appl Chem 8:793–797
47. Gratier J-P, Frery E, Deschamps P, Røyne A, Renard F, Dysthe
D, Ellouz-Zimmerman N, Hamelin B (2012) How travertine
veins grow from top to bottom and lift the rocks above them: the
effect of crystallization force. Geology 40:1015–1018
48. Harada T, Idemitsu T, Watanabe A, Takayama S (1989) The
design method for the demolition of concrete with expansive
demolition agents. In: Shah SP, Swartz SE (eds) Fracture of
concrete and rock: SEM-RILEM international conference June
17–19, 1987, Houston, Texas, USA. Springer, New York,
pp 47–57. doi:10.1007/978-1-4612-3578-1_5
49. Henry KS (2000) A review of the thermodynamics of frost
heave. ERDC/CRREL-TR-00-16. Cold Regions Research and
Engineering Laboratory, US Army Corps of Engineers, Wash-
ington DC
50. Hepple RP, Benson SM (2005) Geologic storage of carbon
dioxide as a climate change mitigation strategy: performance
requirements and the implications of surface seepage. Environ
Geol 47:576–585. doi:10.1007/s00254-004-1181-2
51. Hofstee C, Seeberger F, Orlic B, Mulders F, Van Bergen F,
Bisschop R (2008) The feasibility of effective and safe carbon
dioxide storage in the De Lier gas field. First Break 26:53–57
52. Hou MZ, Bauer S, Kolditz O, Xie H, Li X, Yang C, Yuan Y
(2013) Use of the geological subsurface for production, storage
and conversion of clean energy. In: ISRM SINOROCK 2013,
18–20 June, Shanghai, China. International Society for Rock
Mechanics
53. Huerta NJ, Hesse MA, Bryant SL, Strazisar BR, Lopano C
(2016) Reactive transport of CO2-saturated water in a cement
fracture: application to wellbore leakage during geologic CO2
storage. Int J Greenh Gas Control 44:276–289. doi:10.1016/j.
ijggc.2015.02.006
54. Idiart AE, Lopez CM, Carol I (2011) Chemo-mechanical anal-
ysis of concrete cracking and degradation due to external sulfate
attack: a meso-scale model. Cem Concr Compos 33:411–423.
doi:10.1016/j.cemconcomp.2010.12.001
55. Ingraffea AR, Wells MT, Santoro RL, Shonkoff SBC (2014)
Assessment and risk analysis of casing and cement impairment
in oil and gas wells in Pennsylvania, 2000–2012. Proc Natl Acad
Sci 111:10955–10960. doi:10.1073/pnas.1323422111
56. ISO 11960 (2004) Petroleum and natural gas industries—steel
pipes for use as casing or tubing for wells. Int. Organ. Stand. Geneva
57. Israelachvili JN (2011) Intermolecular and surface forces:
revised third edition. Academic Press, New York
58. Jackson RE, Dusseault MB (2014) Gas release mechanisms
from energy wellbores. ARMA 14-7753
59. Jaeger J, Cook NG, Zimmerman RW (2007) Fundamentals of
rock mechanics, 4th edn. Wiley, New York
364 Acta Geotechnica (2018) 13:341–366
123
60. Jamtveit B, Malthe-Sørenssen A, Kostenko O (2008) Reaction
enhanced permeability during retrogressive metamorphism.
Earth Planet Sci Lett 267:620–627. doi:10.1016/j.epsl.2007.12.
016
61. Jamtveit B, Putnis CV, Malthe-Sørenssen A (2008) Reaction
induced fracturing during replacement processes. Contrib Min-
eral Petrol 157:127–133. doi:10.1007/s00410-008-0324-y
62. Jordan MM, Kemp S, Sorhaug E, Sjursaether K, Freer B (2003)
Effective management of scaling from and within carbonate oil
reservoirs, North Sea Basin. Chem Eng Res Des 81:359–372.
doi:10.1205/02638760360596919
63. Kaiser MJ (2015) Decommissioning forecast in the deepwater
Gulf of Mexico, 2013–2033. Mar Struct 41:96–126. doi:10.
1016/j.marstruc.2014.12.006
64. Kalil IA, McSpadden AR (2012) Casing burst stresses in par-
ticulate-filled annuli: where is the cement? SPE Drill Complet
27:473–485
65. Kamb WB (1959) Theory of preferred crystal orientation
developed by crystallization under stress. J Geol 67(2):153–170
66. Kamb WB (1961) The thermodynamic theory of nonhydrostat-
ically stressed solids. J Geophys Res 66:259–271
67. Kelemen PB, Hirth G (2012) Reaction-driven cracking during
retrograde metamorphism: olivine hydration and carbonation.
Earth Planet Sci Lett 345:81–89
68. Kelemen PB, Matter J, Streit EE, Rudge JF, Curry WB,
Blusztajn J (2011) Rates and mechanisms of mineral carbona-
tion in peridotite: natural processes and recipes for enhanced,
in situ CO2 capture and storage. Annu Rev Earth Planet Sci
39:545–576. doi:10.1146/annurev-earth-092010-152509
69. Kennedy LA, White JC (2001) Low-temperature recrystalliza-
tion in calcite: mechanisms and consequences. Geology
29:1027–1030
70. Keulen NT, Den Brok SWJ, Spiers CJ (2001) Force of crys-
tallisation of gypsum during hydration of synthetic anhydrite
rock. In: 13th DRT conference: deformation mechanisms, rhe-
ology, and tectonics
71. Khaimov-Mal’kov VYa, (1959) Experimental measurement of
crystallization pressure. In: Shubnikov AV, Sheftal’ NN (eds)
Growth of crystals, vol 2. Springer, US, pp 14–19
72. Khaimov-Mal’kov VY (1959) The thermodynamics of crystal-
lization pressure. In: Shubnikov AV, Sheftal’ NN (eds) Growth
of crystals, vol 2. Springer, US, pp 3–13
73. Kudłacz K, Rodriguez-Navarro C (2014) The mechanism of
vapor phase hydration of calcium oxide: implications for CO2
capture. Environ Sci Technol 48:12411–12418. doi:10.1021/
es5034662
74. Kupresan D, Heathman J, Radonjic M (2013) Application of a
new physical model of expandable casing technology in miti-
gation of wellbore leaks. J Can Energy Technol Innov 1(5):1–4
75. Kupresan D, Heathman J, Radonjic M (2014) Experimental
assessment of casing expansion as a solution to microannular
gas migration. In: IADC/SPE drilling conference and exhibition,
4–6 March, Fort Worth, Texas, USA. Society of Petroleum
Engineers. doi:10.2118/168056-MS
76. Ladva HKJ, Craster B, Jones TGJ, Goldsmith G, Scott D (2005)
The cement-to-formation interface in zonal isolation. SPE Drill
Complet. doi:10.2118/88016-PA
77. Lecampion B, Bunger A, Kear J, Quesada D (2013) Interface
debonding driven by fluid injection in a cased and cemented
wellbore: modeling and experiments. Int J Greenh Gas Control
18:208–223. doi:10.1016/j.ijggc.2013.07.012
78. Lehner FK (1990) Thermodynamics of rock deformation by
pressure solution. In: Barber DJ, Meredith PG (eds) Deforma-
tion processes in minerals, ceramics and rocks. Springer,
pp 296–333
79. Lehner FK (1995) A model for intergranular pressure solution in
open systems. Tectonophysics 245:153–170
80. Lewis K, Zyvoloski GA, Kelkar S, Carey JW (2012) Coupled
stress and flow along interfaces in the wellbore environment in
relation to CO2 sequestration. In: 46th US rock mechanics/ge-
omechanics symposium. American Rock Mechanics Association
81. Liversidge D, Taoutaou S, Agarwal S (2006) Permanent plug
and abandonment solution for the North Sea. In: SPE Asia
Pacific oil and gas conference and exhibition, 11–13 September,
Adelaide, Australia. Society of Petroleum Engineers. doi:10.
2118/100771-MS
82. Lothenbach B, Matschei T, Moschner G, Glasser FP (2008)
Thermodynamic modelling of the effect of temperature on the
hydration and porosity of Portland cement. Cem Concr Res
38:1–18
83. Mainguy M, Longuemare P, Audibert A, Lecolier E (2007)
Analyzing the risk of well plug failure after abandonment. Oil
Gas Sci Technol Rev 62:311–324. doi:10.2516/ogst
84. Marbun B (2006) Kinetik der Hydratation von CaO und MgO.
Technischen Universitat Clausthal, Clausthal-Zellerfeld
85. Matschei T, Lothenbach B, Glasser FP (2007) Thermodynamic
properties of Portland cement hydrates in the system CaO–
Al2O3–SiO2–CaSO4–CaCO3–H2O. Cem Concr Res
37:1379–1410
86. McLellan AG (1968) The chemical potential in thermodynamic
systems under non-hydrostatic stresses. In: Proceedings of the
Royal Society of London A: mathematical, physical and engi-
neering sciences. The Royal Society, pp 1–13
87. Means WD, Li T (2001) A laboratory simulation of fibrous
veins: some first observations. J Struct Geol 23:857–863
88. Meng Q, Xie Z, Feng L (2003) An introduction to the expand-
ible casing technology. Drill Prod Technol 4:23
89. Merino E, Dewers T (1998) Implications of replacement for
reaction–transport modeling. J Hydrol 209:137–146. doi:10.
1016/S0022-1694(98)00150-4
90. Montgomery CT (2006) Implications of cementing for well
production and performance. In: Nelson EB, Guillot D (eds)
Well cementing. Schlumberger, Sugar Land, p 773
91. Nelson EB, Guillot D (eds) (2006) Well cementing, 2nd edn.
Schlumberger, Sugar Land
92. Noiriel C, Renard F, Doan M-L, Gratier J-P (2010) Intense
fracturing and fracture sealing induced by mineral growth in
porous rocks. Chem Geol 269:197–209
93. Orlic B (2009) Some geomechanical aspects of geological CO2
sequestration. KSCE J Civ Eng 13:225–232. doi:10.1007/
s12205-009-0225-2
94. Ostapenko GT (1976) Excess pressure on the solid phases
generated by hydration (according to experimental data on the
hydration of periclase). Traslated Geokhimikiya 6:824–844
95. Paterson MS (1973) Nonhydrostatic thermodynamics and its
geologic applications. Rev Geophys 11:355–389
96. Paterson MS (1995) A theory for granular flow accommodated
by material transfer via an intergranular fluid. Tectonophysics
245:135–151
97. Plumper O, Royne A, Magraso A, Jamtveit B (2012) The
interface-scale mechanism of reaction-induced fracturing during
serpentinization. Geology 40:1103–1106. doi:10.1130/G33390.1
98. Pluymakers AMH, Peach CJ, Spiers CJ (2014) Diagenetic
compaction experiments on simulated anhydrite fault gouge
under static conditions. J Geophys Res Solid Earth
119:4123–4148
99. Procesi M, Cantucci B, Buttinelli M, Armezzani G, Quattrocchi
F, Boschi E (2013) Strategic use of the underground in an
energy mix plan: synergies among CO2, CH4 geological storage
and geothermal energy. Latium Region case study (Central
Acta Geotechnica (2018) 13:341–366 365
123

Italy). Appl Energy 110:104–131. doi:10.1016/j.apenergy.2013.
03.071
100. Putnis A, Janssen A, Jamtveit B, Putnis CV (2009) Reaction-
induced fracturing during replacement reactions. Geochim
Cosmochim Acta Suppl 73:1061
101. Ramachandran VS, Sereda PJ, Feldman RF (1964) Mechanism
of hydration of calcium oxide. Nature 201:288–289
102. Ravi K, Bosma M, Gastebled O (2002) Safe and economic gas
wells through cement design for life of the well. SPE 75700
103. Røyne A, Dysthe DK (2012) Rim formation on crystal faces
growing in confinement. J Cryst Growth 346:89–100. doi:10.
1016/j.jcrysgro.2012.03.019
104. Rudge JF, Kelemen PB, Spiegelman M (2010) A simple model
of reaction-induced cracking applied to serpentinization and
carbonation of peridotite. Earth Planet Sci Lett 291:215–227.
doi:10.1016/j.epsl.2010.01.016
105. Scherer GW (1999) Crystallization in pores. Cem Concr Res
29:1347–1358. doi:10.1016/S0008-8846(99)00002-2
106. Scherer GW (2004) Stress from crystallization of salt. Cem
Concr Res 34:1613–1624. doi:10.1016/j.cemconres.2003.12.034
107. Schutjens PMTM (1991) Experimental compaction of quartz
sand at low effective stress and temperature conditions. J Geol
Soc Lond 148:527–539
108. Shahidzadeh-Bonn N, Rafaı S, Bonn D, Wegdam G (2008) Salt
crystallization during evaporation: impact of interfacial proper-
ties. Langmuir 24:8599–8605. doi:10.1021/la8005629
109. Smith I, Olstad E, Segura R (2011) Heightened regulations create
demand for well abandonment services. Offshore 71(10):70–73
110. Steiger M (2005) Crystal growth in porous materials—I: the
crystallization pressure of large crystals. J Cryst Growth
282:455–469. doi:10.1016/j.jcrysgro.2005.05.007
111. Steiger M (2005) Crystal growth in porous materials—II:
influence of crystal size on the crystallization pressure. J Cryst
Growth 282:470–481. doi:10.1016/j.jcrysgro.2005.05.008
112. Sun P, Grace JR, Lim CJ, Anthony EJ (2007) The effect of CaO
sintering on cyclic CO2 capture in energy systems. AIChE J
53:2432–2442
113. Sun Z, Chi H, Fan L-S (2012) Physical and chemical mechanism
for increased surface area and pore volume of CaO in water
hydration. Ind Eng Chem Res 51:10793–10799
114. Taber S (1916) The growth of crystals under external pressure.
Am J Sci 246:532–556
115. Taber S (1930) The mechanics of frost heaving. J Geol
38(4):303–317
116. Taylor HF, Famy C, Scrivener K (2001) Delayed ettringite
formation. Cem Concr Res 31:683–693. doi:10.1016/S0008-
8846(01)00466-5
117. Taylor HFW (1992) Cement chemistry. Academic Press, London
118. Tsui N, Flatt RJ, Scherer GW (2003) Crystallization damage by
sodium sulfate. J Cult Herit 4:109–115. doi:10.1016/S1296-
2074(03)00022-0
119. van Noort R, Spiers C, Kandianis M, Drury MR, Ten Grotenhuis
SM (2010) Coupled geomechanical-geochemical aspects of
CO2-sequestration in peridotites. In: AGU fall meeting abstracts,
p 7
120. van Noort R, Spiers CJ, Peach CJ (2007) Effects of orientation
on the diffusive properties of fluid-filled grain boundaries during
pressure solution. Phys Chem Miner 34:95–112
121. van Noort R, Spiers CJ, Pennock GM (2008) Compaction of
granular quartz under hydrothermal conditions: controlling
mechanisms and grain boundary processes. J Geophys Res Solid
Earth 113(B12206):1–23
122. van Noort R, Visser HJM, Spiers CJ (2008) Influence of grain
boundary structure on dissolution controlled pressure solution
and retarding effects of grain boundary healing. J Geophys Res
Solid Earth 113(B03201):1–15
123. Visser HJM, Spiers CJ, Hangx SJT (2012) Effects of interfacial
energy on compaction creep by intergranular pressure solution:
theory versus experiments on a rock analog (NaNO3). J Geophys
Res. Solid Earth 117(B11211):1–15
124. Voorhees HR, Sliepcevich CM, Freeman JW (1956) Thick-
walled pressure vessels. Ind Eng Chem 48:872–881. doi:10.
1021/ie50557a026
125. Warne P (2004) Decommissioning—North Sea. OGEL 2. http://
www.ogel.org/article.asp?key=1254. Accessed 21 Mar 2017
126. Weyl PK (1959) Pressure solution and the force of crystalliza-
tion: a phenomenological theory. J Geophys Res 64:2001–2025
127. Whittaker S, Rostron B, Hawkes C, Gardner C, White D,
Johnson J, Chalaturnyk R, Seeburger D (2011) A decade of CO2
injection into depleting oil fields: monitoring and research
activities of the IEA GHG Weyburn-Midale CO2 Monitoring
and Storage Project. Energy Procedia 4:6069–6076. doi:10.
1016/j.egypro.2011.02.612
128. Wolter A, Luger S, Schaefer G (2004) Zur Kinetik der
Hydratation von Branntkalk. ZKG Int 57:60–68
129. Wolterbeek TKT, Hangx SJT, Spiers CJ (2016) Effect of CO2-
induced reactions on the mechanical behaviour of fractured
wellbore cement. Geomech Energy Environ 7:26–46. doi:10.
1016/j.gete.2016.02.002
130. Wolterbeek TKT, Peach CJ, Raoof A, Spiers CJ (2016) Reactive
transport of CO2-rich fluids in simulated wellbore interfaces:
flow-through experiments on the 1–6 m length scale. Int J
Greenh Gas Control 54:96–116. doi:10.1016/j.ijggc.2016.08.034
131. Yasuhara H, Elsworth D, Polak A (2003) A mechanistic model
for compaction of granular aggregates moderated by pressure
solution. J Geophys Res Solid Earth 108(B11):1–13
132. Zhang M, Bachu S (2011) Review of integrity of existing wells
in relation to CO2 geological storage: What do we know? Int J
Greenh Gas Control 5:826–840. doi:10.1016/j.ijggc.2010.11.006
366 Acta Geotechnica (2018) 13:341–366
123