read the nao report, discharging older patients from hospital · discharging older patients from...
TRANSCRIPT

Reportby the Comptroller and Auditor General
Department of Health
Discharging older patients from hospital
HC 18 SESSION 2016-17 26 MAY 2016

Our vision is to help the nation spend wisely.
Our public audit perspective helps Parliament hold government to account and improve public services.
The National Audit Office scrutinises public spending for Parliament and is independent of government. The Comptroller and Auditor General (C&AG), Sir Amyas Morse KCB, is an Officer of the House of Commons and leads the NAO, which employs some 810 people. The C&AG certifies the accounts of all government departments and many other public sector bodies. He has statutory authority to examine and report to Parliament on whether departments and the bodies they fund have used their resources efficiently, effectively, and with economy. Our studies evaluate the value for money of public spending, nationally and locally. Our recommendations and reports on good practice help government improve public services, and our work led to audited savings of £1.15 billion in 2014.

Report by the Comptroller and Auditor General
Ordered by the House of Commons to be printed on 24 May 2016
This report has been prepared under Section 6 of the National Audit Act 1983 for presentation to the House of Commons in accordance with Section 9 of the Act
Sir Amyas Morse KCB Comptroller and Auditor General National Audit Office
20 May 2016
HC 18 | £10.00
Department of Health
Discharging older patients from hospital

This report examines how effectively the health and social care system is managing the discharge of older patients from hospital.
© National Audit Office 2016
The material featured in this document is subject to National Audit Office (NAO) copyright. The material may be copied or reproduced for non-commercial purposes only, namely reproduction for research, private study or for limited internal circulation within an organisation for the purpose of review.
Copying for non-commercial purposes is subject to the material being accompanied by a sufficient acknowledgement, reproduced accurately, and not being used in a misleading context. To reproduce NAO copyright material for any other use, you must contact [email protected]. Please tell us who you are, the organisation you represent (if any) and how and why you wish to use our material. Please include your full contact details: name, address, telephone number and email.
Please note that the material featured in this document may not be reproduced for commercial gain without the NAO’s express and direct permission and that the NAO reserves its right to pursue copyright infringement proceedings against individuals or companies who reproduce material for commercial gain without our permission.
Links to external websites were valid at the time of publication of this report. The National Audit Office is not responsible for the future validity of the links.
11104 05/16 NAO

The National Audit Office study team consisted of: James Beveridge, Natalie Low, David Medina, Josh Smith and Dan Varey, under the direction of Ashley McDougall.
This report can be found on the National Audit Office website at www.nao.org.uk
For further information about the National Audit Office please contact:
National Audit Office Press Office 157–197 Buckingham Palace Road Victoria London SW1W 9SP
Tel: 020 7798 7400
Enquiries: www.nao.org.uk/contact-us
Website: www.nao.org.uk
Twitter: @NAOorguk
Contents
Key facts 4
Summary 5
Part OneDelays in discharging older patients from hospital 13
Part TwoManaging discharges for older patients 21
Part ThreeThe effectiveness of local health and social care systems 31
Appendix OneOur audit approach 48
Appendix TwoOur evidence base 50

4 Key facts Discharging older patients from hospital
Key facts
62%of hospital bed days occupied by older patients (those aged 65 or over) in 2014-15
18% increase in emergency admissions of older people between 2010-11 and 2014-15 (12% increase for whole population)
£820mour estimate of the gross cost to the NHS of older patients in hospital beds who are no longer in need of acute treatment
1.15 million bed days lost to reported delayed transfers of care in acute hospitals during 2015 (up 31% since 2013)
2.7 million our estimate of hospital bed days occupied by older patients no longer in need of acute treatment
11.9 days average length of inpatient stay for older patients in 2014-15 (based on emergency admissions only)
5% percentage of muscle strength that older people can lose per day of treatment in a hospital bed
54% hospitals in our survey who told us that discharge planning is not started soon enough to minimise delays for most older patients
Discharging older patients from hospital Summary 5
Summary
1 Unnecessary delay in discharging older patients (those aged 65 and over) from hospital is a known and long-standing issue.1 For older people in particular, longer stays in hospital can lead to worse health outcomes and can increase their long-term care needs. Older people can quickly lose mobility and the ability to do everyday tasks such as bathing and dressing. Keeping older people in hospital longer than necessary is also an additional and avoidable pressure on the financial sustainability of the National Health Service (NHS) and local government.
2 Older people are cared for in hospital by the NHS, but once discharged some may need short- or long-term support from their local authority or community health services. This may involve living at home with some support or living in a care home. NHS community healthcare and short-term care to increase people’s independence provided by local authorities are free. Local authorities have to apply a financial means test and an eligibility test based on levels of need for other types of care.
3 The number of older people in England is increasing rapidly, by 20% between 2004 and 2014, and with a projected increase of 20% over the decade to 2024. Hospitals have also experienced increases in the number of emergency admissions of older patients, by 18% between 2010-11 and 2014-15. Older patients now account for 62% of total bed days spent in hospital.
4 With the increase in numbers of older patients, it is critical for health and social care providers to work together to minimise the length of time that such patients spend in hospital. This will be through a combination of admitting only those older people who really need treatment in hospital, and minimising delays for those who are admitted. It is important that, in line with the aims of NHS guidance, patients are not discharged from hospital before they are clinically ready.
5 The only official data relating to delays in discharging patients from hospital are NHS England’s ‘delayed transfers of care’ data. We estimate that 85% of patients captured by this measure of delay are aged 65 and over. According to official figures, the number of bed days in acute hospitals recorded as delayed in 2015 has risen by 270,000 days (31%) in the past two years to 1.15 million bed days in 2015 (around 3% of total bed days).
1 Throughout this report, by ‘hospital‘, we mean acute hospitals which focus on the treatment of a patient’s immediate medical care needs as opposed to community hospitals, which are more focused on rehabilitation.

6 Summary Discharging older patients from hospital
Scope of our report
6 Our report examines how effectively the health and social care system is managing the discharge of older patients from hospital, in particular:
• the scale of delays that older patients experience in hospital (Part One);
• the extent to which health and social care providers are adopting good practice in discharging older patients (Part Two): and
• barriers to local health and social care systems working effectively (Part Three).
7 Older patients account for most delayed transfers of care, so this report focuses on patients aged 65 and over with an emergency admission, from the point when they are admitted to hospital through to when they are discharged. It complements our 2013 report on emergency admissions – which examined how well health and social care systems managed the demand for emergency services, thus it does not cover out-of-hospital services designed to avoid hospital admission.2 It also does not cover mental health services in depth, including dedicated dementia care.
Key findings
8 Rising demand for services, combined with restricted or reduced funding, is putting pressure on the capacity of local health and social care systems. As set out in paragraph 3, the number of people aged 65 and over in England is increasing rapidly. The relative growth in numbers of older people is important. The number of older people with an emergency admission to hospital increased by 18% between 2010-11 and 2014-15 (compared with a 12% increase overall). In 2014-15, the percentage of older people admitted to hospital after attending accident and emergency (A&E) was 50% compared with 16% for those aged under 65. Although overall length of stay for older patients following an emergency admission has decreased from 12.9 to 11.9 days between 2010-11 and 2014-15 – suggesting improved efficiency – the overall number of bed days resulting from an emergency admission has still increased by 9% from 17.8 million to 19.4 million days. Put simply, without major change, these recent trends indicate that the more older people there are, the more pressure there will be on hospitals. While NHS spending has grown by 5% in real terms between 2010-11 and 2014-15, local authority spending on adult social care has reduced by 10% in real terms since 2009-10 (paragraphs 1.1, 2.5 and 3.3).
2 Comptroller and Auditor General, Emergency Admissions to Hospital: managing the demand, Session 2013-14, HC 739, National Audit Office, October 2013.
Discharging older patients from hospital Summary 7
The scale of delays to older patients
9 The number of recorded delayed transfers of care has increased substantially over the past two years. As set out in paragraph 5, the official data show a 31% increase in bed days taken up by patients with a delayed transfer in acute hospitals between 2013 and 2015. The main drivers for this increase are the number of days spent waiting for a package of home care (which more than doubled between 2013 and 2015, from 89,000 to 182,000) and waiting for a nursing home placement or availability (which increased by 63%) (paragraph 1.9).
10 The delayed transfers of care data substantially underestimate the range of delays that patients experience. By definition, the official data only count delays that occur after clinicians and other professionals deem a patient to be ready for discharge. It does not count all patients who are no longer benefiting from acute care, or all the delays patients experience during their treatment. Based on our survey results, we estimate that the number of older patients in hospital who are no longer benefiting from acute care to be approximately 2.7 times the figure for reported delayed transfers of care. This amounts to around 2.7 million bed days a year. We also found inconsistencies in how hospitals count delayed transfers of care. Around one-third (37%) of local authorities in our survey said they never or only sometimes agreed the data with hospitals before it was reported. NHS England refreshed their existing guidance to clarify the rules and definitions for counting delayed transfers of care in October 2015 (paragraphs 1.7 to 1.11, 3.27 and 3.28).
11 The NHS spends around £820 million a year treating older patients who no longer need to be there. We used the limited data available together with our survey results to estimate the gross annual cost to the NHS of treating older patients in hospital who no longer need to receive acute clinical care to be in the region of £820 million. This would assume that patients are moved out of hospital as soon as it is clinically safe to do so, consistent with the aims of NHS guidance. Shortcomings in the available data mean that it is not possible to estimate the scope for efficiency savings precisely. If these patients were treated in more appropriate settings at this stage in their care, hospitals could make more efficient use of beds, or relieve pressure on high bed occupancy rates. However, it may not be easy for hospitals to realise these costs as actual savings in the short term, as this would depend on their ability and appetite to close wards and reduce staffing. It may also reduce the need for new capacity in the future, allowing hospitals to avoid costs. This report highlights a range of short- and long-term issues that currently restrict the extent to which delays can be completely removed. Given demographic trends, the current inefficiency will only increase in scale and cost without a radical change in current trends in hospital admissions and discharge practice (paragraph 3.10).

8 Summary Discharging older patients from hospital
12 Caring for older people who no longer need to be in hospital in other settings could result in additional annual costs of around £180 million for other parts of the health and social care system. Available data, particularly around what care this group of patients might need outside hospital, are very limited and do not support a precise estimation of transferred capacity and costs. Under a scenario of higher care needs, our best estimate is a public cost in the region of £180 million for providing care either at home or in a more appropriate care setting. This assumes that some additional costs would fall on individuals arranging and funding their own care with related capacity requirements; these costs are not quantified in the estimates. Due to data limitations, this estimate also does not include the impact of any potential increase or decrease in care needs, and therefore the duration of care, as a result of being discharged more quickly from hospital. Our cost estimates are sensitive to a number of assumptions, which are set out in Part Three and Appendix Two (paragraph 3.10).
Managing the discharge of older patients
13 Health and social care providers have made limited progress in adopting recommended good practice. Good-practice principles are that: hospitals should identify patients’ needs as quickly as possible to determine whether hospital is the best place to meet them; health and social care staff should work together to maintain the momentum of treatment and discharge planning; and staff should assess and rehabilitate patients in their home wherever possible (paragraphs 2.2 to 2.5). We found:
• Early identification of needs
More hospitals had frailty units (specialist units that assess and treat older people’s needs at an early stage): 55% of hospitals that we surveyed compared with 29% in an audit published in April 2015. However, capacity in these units was often limited. Only a minority of hospitals (42%) were undertaking early geriatric assessments. The proportion of older patients admitted from A&E varied from 37% to 61%, suggesting there is scope to improve how hospitals manage admissions (paragraphs 2.7 to 2.8).
• Maintaining momentum
Most hospitals had elements of good practice in place (for example, 95% had reviews of patients’ progress by senior clinicians at least every day). However, they had made limited progress in other areas (for example, only 39% set expected discharge dates linked to criteria for discharge for all or most older patients). Some 54% of hospitals in our survey told us that discharge planning did not start soon enough to minimise delays for most older patients. We identified difficulties with hospital staff maintaining knowledge of out-of-hospital services and a lack of shared understanding of what skills are needed for good discharge planning (paragraphs 2.9 to 2.12).

Discharging older patients from hospital Summary 9
• Assessment and rehabilitation at home
Our survey showed 52% of hospitals had ‘discharge to assess’ schemes (now seen as the default model in NHS guidance, whereby assessments and care planning are done in the home rather than hospital). However, only 39% of schemes could be offered to all or most patients and around half of hospitals had arrangements in place to share patient assessments with other bodies. We identified particular issues with the management of the assessment for Continuing Healthcare (a package of on-going care that is arranged and funded solely by the NHS where the individual has been found to have a primary health need) (paragraphs 2.13 to 2.14).
The effectiveness of local health and social care systems
14 Workforce capacity issues in health and social care organisations are making it difficult to discharge older patients from hospital effectively. Across health and social care, providers and commissioners said that staff recruitment and retention were a significant cause of delays. Vacancy rates for nursing and home care staff were up to 16% in some regions, based on data for 2014 and 2015. In our survey, fewer than half of hospitals felt they had sufficient staff trained in the care of older patients (paragraphs 3.4 to 3.8).
15 System resilience groups are not yet effective. NHS England has established system resilience groups as the main local forums for planning and coordination of health and social care services. Although most system resilience group chairs felt they had the core elements in place to work effectively, there were mixed views about their effectiveness: only 53% of hospitals in our survey felt they were effective. Delayed transfers of care continue to rise across the country. We found health and social care organisations commissioning services jointly to tackle delays in discharging older patients. However, commissioners were not always making full use of levers to minimise delays: for example, more than half of local authorities in our survey said contracts with care home providers did not specify agreed response times for admitting or assessing patients (paragraphs 3.11 to 3.19).
16 Health and social care organisations are not sharing patient information effectively. Health and social care organisations now have a statutory duty to share patient information, but our survey findings showed that information is still not routinely shared. For example, only up to a quarter of hospitals said that they had sufficient access to primary, community and social care information for most older patients. We heard examples where lack of access to information could result in A&E clinicians being less able to undertake a full assessment and more likely to admit an older patient (paragraphs 3.20 to 3.22).

10 Summary Discharging older patients from hospital
17 Financial incentives do not adequately incentivise early discharge of patients. Hospitals have financial incentives to minimise the length of stay for emergency attendances and keep space free for elective procedures for patients. However, community health providers and local authorities are not incentivised financially to speed up receiving patients discharged from hospital. For example, we found the use of block contracts with no activity-based payment did not offer incentives for providers to increase their activity. In our case studies, we heard from a broad range of stakeholders that the main driver of day-to-day decisions on when to discharge patients from hospital remains patient care and safety, rather than financial considerations. There was general recognition across local systems that reducing the length of stay of older patients in hospital would reduce care needs, and ultimately costs, in the long term (paragraphs 3.23 to 3.25).
National assurance and support
18 There has been a lack of coordination in central government work aimed at improving discharge practice. When discharge delays started to rise, the Department of Health (the Department) and Cabinet Office undertook work to understand the causes. During our fieldwork, we found a number of examples of joint working across national health and local government organisations. However, the landscape was complex with a range of teams, initiatives and good-practice guidance either directly or indirectly related to improving practice in discharging patients. In response to this complexity, the Department only started to coordinate activities formally in December 2015, when it established the Discharge Programme. The programme aims to coordinate action to address delays in discharging patients and develop a coherent, cross-system vision of ‘what good patient flow and discharge looks like’. There is not yet a strong evidence base across all the elements of good practice recommended by national NHS bodies (paragraphs 2.3 and 3.29 to 3.31).
Conclusion on value for money
19 Making sure older patients stay in hospital no longer than necessary is a complex issue that requires a coordinated response across health and social care organisations. Unnecessary stays in hospital result in worse health outcomes for patients and waste already strained NHS hospital resources as well as increasing the long-term care needs, and costs, for social care and community healthcare. NHS data show the number of delayed transfers are increasing at an alarming rate but do not capture the full extent of older people who should not be in hospital. While there is a clear awareness of the need to discharge older people from hospital sooner, both at national and local level, there are currently far too many older people in hospitals who do not need to be there, at an estimated cost to the NHS of around £820 million. Without radical action to improve local practice and remove national barriers, this problem will get worse and add further strain to the financial sustainability of the NHS. Given the increase in delays and limited progress in reducing barriers to further improvements, performance does not represent value for money.

Discharging older patients from hospital Summary 11
Recommendations
20 The Department, NHS England and NHS Improvement have work under way to better coordinate the central assurance and support for patient flow and discharge. We encourage the continuation of these initiatives. However, we do not consider incremental operational improvements alone will address the problem effectively. We recommend:
a The Department, NHS England and NHS Improvement, in conjunction with local government partners, should set out how they will break the trend of rising delays against the demographic challenge of growing numbers of older people, with a particular focus on minimising avoidable admissions and inappropriate lengths of stay, drawing on existing initiatives as much as possible.
b Working with the Discharge Programme Board, NHS England should develop measures that fully capture the number of older people who are no longer benefiting from acute care. This may involve changing the current definition of the delayed transfers of care metric together with the use of a range of other metrics relating to patient flow in hospital.
c Building on the initial work set out in this report, the Discharge Programme Board should coordinate work to fully understand the cost to hospitals of delayed patient discharge and the costs, where these fall on the public purse, of caring for these people in the community.
d Health and social care commissioners should incentivise known good practice (including the recently published NICE guideline) in patient flow and discharge planning and reduce, by targeted amounts, the number of older patients unnecessarily delayed in hospital. This should include use of the recently published Commissioning for Quality and Innovation (CQUIN) relating to discharged patients returning to their usual place of residence within seven days of admission.
e NHS England and NHS Improvement should seek to understand which contracting and payment mechanisms offer the best incentives for community health providers to increase activity when required.
f NHS England should evaluate the effectiveness of system resilience groups and consider how they can be strengthened to support whole-system strategic planning and ownership of the discharge process and fit clearly with other local networks and programmes.
12 Summary Discharging older patients from hospital
g NHS England, working with local government, should set out how health and social care staff can better share information on the existing health and social care circumstances of older people in their care so they can take this fully into account when making decisions about admission, treatment, care and discharge.
h The Department and Health Education England, working with local government partners, should set out how they will support initiatives that improve the supply of care workers and hospital and community health staff, bearing in mind the local variability in staffing issues.
Discharging older patients from hospital Part One 13
Part One
Delays in discharging older patients from hospital
Health and care needs of older people
1.1 Treating a growing number of older people with more complex needs is placing greater demands on the health and social care system.3 The number of older people (aged 65 and over) in England rose by 20% between 2004 and 2014 (compared with 8% for all age groups) and is projected to increase by a further 20% between 2014 and 2024.4 NHS England’s longer-term ambition for care of older people is to treat more in the community and avoid hospital admissions.5 In the meantime, the number of older people admitted to hospital is rising: between 2010-11 and 2014-15 the number of patients aged 65 and over with an emergency admission to hospital increased by 18% (compared with a 12% increase overall). In 2014-15 the proportion of people attending accident and emergency (A&E) who were admitted was 50% for older people, compared with 16% for those aged under 65.6 Older patients accounted for 62% of total bed days, and those with longer stays (of seven days or more) accounted for 52% (Figure 1 overleaf).
3 Age UK, Briefing: the health and care of older people in England 2015, October 2014.4 Office for National Statistics, Annual Mid-year Population Estimates: 2014 Statistical Bulletin, June 2015.
Office for National Statistics, National Population Projections: 2014-based Statistical Bulletin, October 2015.5 National Health Service, Five Year Forward View, October 2014.6 Episodes with a length of stay of less than two days are excluded from the trends of numbers of emergency
admissions; they are included in the proportion of A&E attendances which are admitted.

14 Part One Discharging older patients from hospital
1.2 Reducing how long older patients stay in hospital can have benefits for both patients and hospitals, and for demand for social care in the community. Evidence shows that longer hospital stays for older patients can lead to worse health outcomes and an increase in their care needs on discharge. For example:
• older people can lose mobility very quickly if they do not keep active. Monitor’s recent review highlighted a study which showed that, for healthy older adults, 10 days of bed rest led to a 14% reduction in leg and hip muscle strength and a 12% reduction in aerobic capacity: the equivalent of 10 years of life.7 Other studies have found a faster reduction in muscle strength of as much as 5% per day;8
• older people’s ability to perform everyday activities can reduce while in hospital. One study found that 12% of patients aged 70 and over saw a decline in their ability to undertake key daily activities (bathing, dressing, eating, moving around and toileting) between admission and discharge from hospital, and the extent of decline increased with age;9 and
• older people are more likely to acquire hospital infections. Between 2008 and 2012, the Methicillin-resistant Staphylococcus aureus (MRSA) infection rate for men aged 85 years and over was 574 times greater than the rate for those aged under 45 years (301.4 compared with 0.5 per million population).10 A similar pattern was observed for women.
7 Monitor, Moving healthcare closer to home: Literature review of clinical impacts, September 2015.8 For example, N de Morton, J L Keating, K Jeffs, Exercise for acutely hospitalised older medical patients, Cochrane
Database of Systematic Reviews, January 2007.9 K E Covinsky et al, ‘Loss of independence in activities of daily living in older adults hospitalised with medical illnesses’,
Journal of the American Geriatric Society, 51 (4), April 2003.10 Office for National Statistics, Deaths involving MRSA: 2008 to 2012, Statistical Bulletin, August 2013.
Figure 1Proportion of inpatient episodes and bed days accounted forby age group, 2014-15
Older patients accounted for 62% of total bed days, while those with longer stays of seven days or more accounted for 52% of total bed days
Note
1 Includes patients discharged in 2014-15, excluding episodes with length of stay under two days.
Source: Health and Social Care Information Centre, Hospital episode statistics, 2014-15
Percentage
Those aged 65 and over with episodes of 7 days or more
All aged 0–64
Those aged 65 and over with episodes of less than 7 days
0 10 20 30 40 50 60 70 80 90 100
Bed days 521038
Episodes 232354

Discharging older patients from hospital Part One 15
1.3 It is important to achieve the correct balance between minimising delays and not discharging a patient from hospital before they are clinically ready. As set out by the British Medical Association, premature discharge is an important contributor to unplanned readmissions to hospital. The likelihood of a patient being readmitted to hospital is influenced both by the support they receive while in hospital and also when they are discharged.11
1.4 NHS England guidance highlights the importance of patients being involved in decisions about their care and discharge planning.12 However, Healthwatch England reported that patients they spoke to felt they were not involved in decisions about their care. In particular, they heard from older people about being sent home from hospital despite raising concerns about their ability to cope.13 In one survey of older patients, 26% of those who had been re-admitted to hospital within three months felt they had been discharged before they were well enough.14 The Parliamentary and Health Service Ombudsman reported that in 2014-15 it investigated 221 complaints relating to unsafe discharge from hospital, an increase of more than one-third from the previous year. It upheld, or partly upheld, more than half of these.15
1.5 Minimising delays to older patients is important to the smooth running of a hospital. The decline in performance of hospitals against A&E standards has been linked to the need to improve patient flow and minimise delays throughout a patient’s stay in hospital.16 On our visits to hospitals, we heard how high occupancy levels made it more difficult to place new patients on the most appropriate ward to start with or admit patients for elective medical procedures. Hospitals also have financial incentives to free up bed space for elective care, to achieve waiting time standards and to ensure they use existing facilities efficiently.
1.6 Older people are cared for in hospital by the National Health Service (NHS). Once discharged, some may need short- or long-term support from their local authority or community health services. This may involve either living at home with some support or living in a care home. Figure 2 overleaf sets out the local health and social care bodies involved in planning, commissioning and providing services for such patients. NHS community healthcare and short-term re-ablement care (which aims to maximise people’s independence) provided by local authorities are free. Local authorities have to apply a financial means test and an eligibility test based on levels of need for other types of care.
11 British Medical Association, Hospital discharge: the patient, carer and doctor perspective, January 2014.12 NHS England, Transforming urgent and emergency care services in England – Safer, Faster, Better: good practice in
delivering urgent and emergency care. A guide for local health and social care communities, August 2015.13 Healthwatch England, Safely home: What happens when people leave hospital and care settings?, July 2015.14 Royal Voluntary Service, Help them home, December 2015.15 Parliamentary and Health Service Ombudsman, A report of investigations into unsafe discharge from hospital, May 2016.16 Monitor, A&E delays: Why did patients wait longer last winter?, IRRES 06/15, September 2015.

16 Part One Discharging older patients from hospital
Fig
ure
2D
isch
arge
des
tinat
ions
for
olde
r pa
tient
s an
d co
mm
issi
onin
g ar
rang
emen
ts
Acu
te t
reat
men
t
Pat
ient
dis
char
ge
Hea
lth a
nd w
ellb
eing
bo
ard
s
Pro
vide
lead
ersh
ip fo
r he
alth
and
ca
re s
yste
ms
and
are
resp
onsi
ble
for
prod
ucin
g jo
int s
trat
egic
nee
ds
asse
ssm
ents
(JS
NA
s) a
nd jo
int h
ealth
an
d w
ellb
eing
str
ateg
ies
(JH
WS
s)
Sys
tem
res
ilien
ce g
roup
s
Res
pons
ible
for
oper
atio
nal p
lann
ing
of u
rgen
t and
em
erge
ncy
care
se
rvic
es a
nd e
lect
ive
serv
ices
Loca
l aut
hori
ty
Pla
nnin
g an
d co
mm
issi
onin
g so
cial
car
e se
rvic
es
Ind
ivid
uals
Som
e ol
der
peop
le w
ill fu
nd a
llor
par
t of t
heir
own
care
Ho
me
with
no
sup
po
rtH
om
e w
ith s
upp
ort
(eg
hom
e ad
apta
tion/
com
mun
ity n
ursi
ng/
dom
icili
ary
care
)
Co
mm
unity
hea
lth
care
bed
(eg
com
mun
ity h
ospi
tal)
Car
e ho
me
(eg
resi
dent
ial/
nurs
ing
hom
e)
Pal
liativ
e ca
re
(eg
hosp
ice)
Sou
rce:
Nat
iona
l Aud
it O
ffi ce
Co
mm
issi
oni
ng
Loca
l sys
tem
pla
nnin
g
Old
er p
erso
n ad
mitt
ed t
o ac
ute
hosp
ital
Clin
ical
co
mm
issi
oni
ng g
roup
s
Ass
essi
ng n
eeds
, pla
nnin
g an
d co
mm
issi
onin
g al
l hea
lth c
are,
in
clud
ing
Con
tinui
ng H
ealth
care

Discharging older patients from hospital Part One 17
The scale of delays to older patients
1.7 Unnecessary delays in discharging older patients from hospital are a known and long-standing issue.17 Our 2003 report on the subject highlighted issues about the reliability of national information, delays in assessments, mixed progress in joint health and social care working and a lack of capacity in care home beds.18
1.8 The monthly ‘delayed transfers of care’ statistics are the only official national data on discharge delays. They give the number of patients and bed days counted as delayed. The definition of a delayed transfer only counts the days after all clinicians and other professionals involved in a patient’s care decide the patient is ready for discharge. The reason for the delay, and the responsible organisation, are also published. Hospitals should agree the data with local authority directors of adult social services. The Department of Health (the Department) and NHS England have identified issues with the accuracy of recording delayed transfers of care (see paragraph 3.27).
1.9 Delayed transfers of care have increased substantially over the past two years (Figure 3 overleaf). The official data show an increase of 270,000 (31%) bed days taken up by patients in acute hospitals with a delayed transfer of care, from 0.87 million days in 2013 to 1.15 million days in 2015. Two reasons account for most of this increase: the number of days spent waiting for a package of home care more than doubled between 2013 and 2015, from 89,000 to 182,000. Waiting for a nursing home placement or availability increased by 63% from 86,000 to 140,000. (Figure 4 on page 19).
1.10 The official data do not break down delays by age of patient or level of frailty, but our survey of hospitals indicated that 85% of individuals recorded as a delayed transfer of care were aged 65 or over. The number of days recorded as delayed transfers of care in acute hospitals makes up a small proportion of overall bed days: 3% in 2014-15, with associated costs of around £350 million.
17 See for example: Department of Health/NHS England, Report on the work of the Helping People Home team in supporting a reduction in the number of Delayed Transfers of Care (DTOC) (unpublished), May 2015. The Helping People Home team was supported by the Department of Health and Department for Communities and Local Government; NHS Confederation, Growing Old Together: sharing new ways to support older people, January 2016.
18 Comptroller and Auditor General, Ensuring the effective discharge of older patients, Session 2002-03, HC 392, National Audit Office, February 2003.

18 Part One Discharging older patients from hospital
1
2
3
4
5
6
7
0
0
20
40
60
80
100
120
140
160
180
Figure 3Trends in delayed transfers of care statistics: number of patients and bed days delayed
Number of people delayed − last Thursday in each month (000)
Source: National Audit Office analysis of delayed transfers of care statistics published by NHS England
Delays in acute hospitals have increased by 31% between 2013 and 2015
Total: number of people delayed
Total: 12-month moving average
Acute only: number of people delayed
Acute only: 12-month moving average
Delayed days (000)
Aug Nov Feb May Aug Nov Feb May Aug Nov Feb May Aug Nov Feb May Aug Nov Feb May Aug Nov Feb
Aug Nov Feb May Aug Nov Feb May Aug Nov Feb May Aug Nov Feb May Aug Nov Feb May Aug Nov Feb
2010 2011 2012 2013 2014 2015 2016
Total: number of people delayed
Total: 12-month moving average
Acute only: number of people delayed
Acute only: 12-month moving average
Total: number of people delayed
Total: 12-month moving average
Acute only: number of delayed days
Acute only: 12-month moving average
2010 2011 2012 2013 2014 2015 2016

Discharging older patients from hospital Part One 19
Figure 4Trends in delayed transfers of care statistics: reasons for delay
Delayed days (000)
Source: National Audit Office analysis of delayed transfers of care statistics published by NHS England
The main reported reason for the rise in delays is an increase in the number of patients waiting for a care packagein their own home
0
5
10
15
20
25
30
35
Awaiting further non-acute NHS care
Awaiting completion of assessment
Awaiting care package in own home
Awaiting nursing home placement or availability
Patient or family choice
Awaiting residential home placement or availability
Aug Nov Feb May Aug Nov Feb May Aug Nov Feb May Aug Nov Feb May Aug Nov Feb May Aug Nov Feb
2010 2011 2012 2013 2014 2015 2016

20 Part One Discharging older patients from hospital
1.11 The official data do not capture all the delays that a patient might experience. The definition of delayed transfers of care excludes any delays that occur before clinicians and other health professionals consider a patient to be ready for discharge. For older patients, we found:
• based on 27 responses to our survey of hospitals, the estimated number of older patients who were delayed was approximately 2.7 times the figure in the official data. This amounts to around 2.7 million bed days a year. The higher figure included additional patients who were recorded as no longer benefiting from acute care, but who were not classified by the hospital as being an official delayed transfer of care;
• our review of long-stay patient records indicated that those whose hospital stays were not counted in the official data as a delay still waited 7.1 days on average between being assessed as ‘medically fit for discharge’ and being discharged;19 and
• our analysis does not include all the delays incurred by patients before their acute treatment has ended. In-depth bed audits, which identify whether patients in hospital could be treated in alternative settings, indicate that up to 50% of bed days in wards could take place in other settings.20
19 The definition of ‘medically fit for discharge’ varies between hospitals.20 See footnote 7.

Discharging older patients from hospital Part Two 21
Part Two
Managing discharges for older patients
2.1 This part looks at the process within hospitals for discharging older patients. It includes processes that are largely within the remit of hospitals and others that will involve coordination with other organisations. It covers:
• the key principles and guidance that health and social services should follow;
• the sector’s performance on indicators on how patients move through hospitals (‘patient flow’) and are discharged; and
• the extent to which health and social care services are implementing activities in line with guidance.
Key principles and guidance
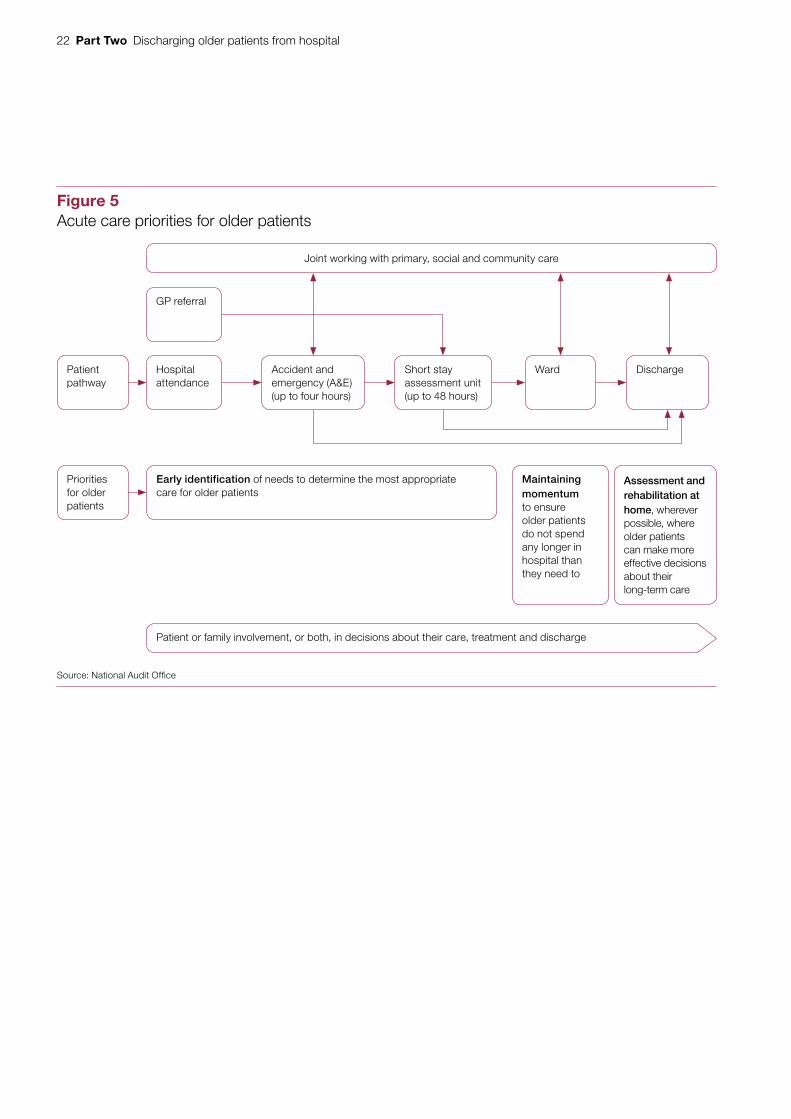
2.2 Over the past 15 years, the Department of Health (the Department), the National Health Service (NHS) and professional bodies such as the British Geriatrics Society have issued more than 20 pieces of guidance on how patients should be managed in hospital to minimise delays to their treatment.21,22 The current guidance and much of the preceding work draw on a common set of broad principles for caring for older patients (Figure 5 overleaf):
• hospitals should identify the needs of older patients as quickly as possible to decide whether they are best met in hospital;
• where an older patient needs to be admitted, health and social care staff should work together to maintain the momentum of treatment and discharge planning; and
• health and social care staff should start the assessment and rehabilitation of patients as soon after admission as possible and in the home wherever possible.
21 British Geriatric Society and others, Quality Care for Older People with Urgent and Emergency Care Needs ‘Silver Book’, June 2012.
22 For example, NHS England, Transforming urgent and emergency care services in England – Safer, Faster, Better: good practice in delivering urgent and emergency care. A guide for local health and social care communities, August 2015.
22 Part Two Discharging older patients from hospital
Figure 5Acute care priorities for older patients
Joint working with primary, social and community care
Source: National Audit Offi ce
Hospital attendance
GP referral
Early identification of needs to determine the most appropriate care for older patients
Patient or family involvement, or both, in decisions about their care, treatment and discharge
Maintaining momentum to ensure older patients do not spend any longer in hospital than they need to
Assessment and rehabilitation at home, wherever possible, where older patients can make more effective decisions about their long-term care
DischargePatient pathway
Priorities for older patients
WardShort stay assessment unit (up to 48 hours)
Accident and emergency (A&E)(up to four hours)

Discharging older patients from hospital Part Two 23
2.3 However, we found that the evidence base for all the interventions recommended in this guidance was not always clear. In drawing up its recent guidance on the transition between hospital and community or care home settings, the National Institute for Health and Care Excellence (NICE) identified a number of areas for further research, including: comprehensive geriatric assessment and care on specialist older people units; and approaches to carry out assessments in patients’ homes rather than hospital.23
Indicators of patient flow
2.4 Under the broad principles outlined above, hospitals should look to admit only those patients whose medical needs require it, and reduce length of stay and the proportion of long-stay patients wherever it is clinically safe and appropriate to do so.
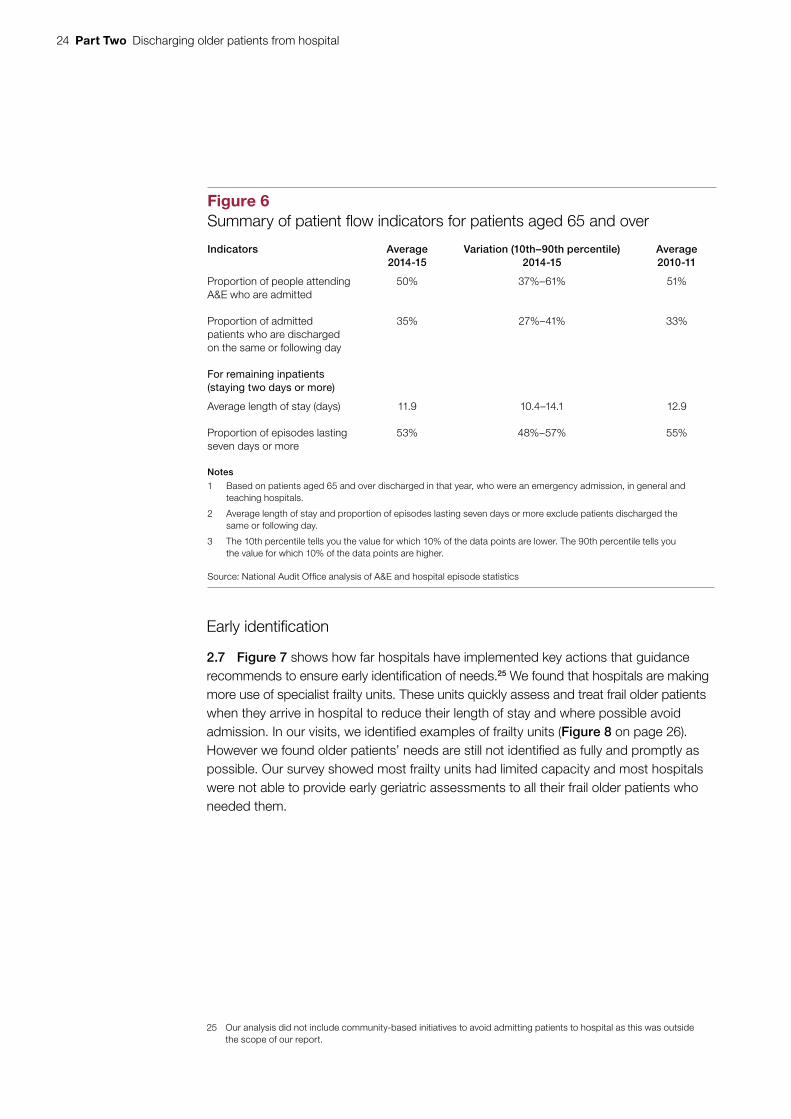
2.5 In 2014-15, on average, hospitals admitted 50% of older patients attending A&E departments, and were able to discharge 35% of these patients on the same or the following day (Figure 6 overleaf). For the remaining inpatients, the average length of stay was 11.9 days, with 53% of episodes lasting seven days or more. Between 2010-11 and 2014-15, length of stay has decreased from 12.9 to 11.9 days. This suggests some improved efficiency, although still not enough to reduce the overall number of bed days (which have increased by 9% from 17.8 million to 19.4 million days) resulting from the increasing number of emergency admissions. Other indicators of patient flow have not changed much in the past five years. Our fieldwork found potential scope to improve performance overall:
• The variations in the proportion of hospitals admitting older patients from A&E (from 37%–61%) and those discharging them by the next day (27%–41%) suggest there may be potential for some hospitals to manage admissions more effectively. This analysis does not take account of a range of external factors that may impact on hospital performance, such as the age profile of their local population.
• In our survey of hospitals, 42% had specific targets for reducing length of stay for older patients. The average target reduction was 2.3 days (based on 21 hospitals).
Implementation of good practice
2.6 To understand what scope there might be to speed up the discharge of older patients, we examined the extent to which local heath and care services have adopted the key actions recommended by current government guidance.24
23 National Institute for Health and Care Excellence, Transition between inpatient hospital settings and community or care home settings for adults with social care needs, NICE guideline NG27, December 2015.
24 Data for measures such as length of stay for winter 2015-16 are not available until 2017 so it is not possible to link current practice in hospitals with outcomes.
24 Part Two Discharging older patients from hospital
Early identification
2.7 Figure 7 shows how far hospitals have implemented key actions that guidance recommends to ensure early identification of needs.25 We found that hospitals are making more use of specialist frailty units. These units quickly assess and treat frail older patients when they arrive in hospital to reduce their length of stay and where possible avoid admission. In our visits, we identified examples of frailty units (Figure 8 on page 26). However we found older patients’ needs are still not identified as fully and promptly as possible. Our survey showed most frailty units had limited capacity and most hospitals were not able to provide early geriatric assessments to all their frail older patients who needed them.
25 Our analysis did not include community-based initiatives to avoid admitting patients to hospital as this was outside the scope of our report.
Figure 6Summary of patient fl ow indicators for patients aged 65 and over
Indicators Average2014-15
Variation (10th–90th percentile)2014-15
Average2010-11
Proportion of people attending A&E who are admitted
50% 37%–61% 51%
Proportion of admitted patients who are discharged on the same or following day
35% 27%–41% 33%
For remaining inpatients(staying two days or more)
Average length of stay (days) 11.9 10.4–14.1 12.9
Proportion of episodes lasting seven days or more
53% 48%–57% 55%
Notes
1 Based on patients aged 65 and over discharged in that year, who were an emergency admission, in general and teaching hospitals.
2 Average length of stay and proportion of episodes lasting seven days or more exclude patients discharged the same or following day.
3 The 10th percentile tells you the value for which 10% of the data points are lower. The 90th percentile tells you the value for which 10% of the data points are higher.
Source: National Audit Offi ce analysis of A&E and hospital episode statistics

Discharging older patients from hospital Part Two 25
Figure 7Early identifi cation of needs: implementation of key actionsrecommended in guidance
of hospitals had frailty units, an increase compared with 29% of hospital and local health bodies who report having this facility in the NHS Benchmarking Network’s Older people in acute settings benchmarking report of April 2015. Of those hospitals with frailty units, 68% said their facilities did not have enough capacity.
55%
of hospitals could provide a geriatric assessment within 14 hours to most older patients with complex needs. Our review of long-stay patient records found on average 27% were seen by a geriatrician within 14 hours. 42%
Notes
1 Bold text denotes key actions recommended in guidance.
2 Frailty units are dedicated teams of specialist doctors, nurses, therapists or social workers operating in A&E and short stay units to carry out early assessment of older patients’ needs.
3 Geriatric assessments cover the wider physical and psychological needs of older patients.
4 Percentages are based on National Audit Offi ce (NAO) surveys, unless otherwise stated. See Appendix Two for sample sizes.
Source: National Audit Offi ce surveys, National Audit Offi ce patient record review

26 Part Two Discharging older patients from hospital
2.8 In our case study visits and some stakeholder interviews, we heard how there could be pressure to admit an older patient to avoid breaching A&E targets (of a maximum wait of four hours before discharge or admission), even though it was not necessarily in their best interest. As we have reported previously, there was a rise in short-stay admissions following the introduction of the four-hour target in 2003-04.26
Maintaining momentum
2.9 Figure 9 shows the key actions that current government guidance recommends to maintain the momentum of treatment and discharge planning for older patients in hospital. Overall, most hospitals had dedicated geriatric wards and were reviewing older patients’ progress regularly, but there was less progress for other elements. For example, discharge planning was not always starting soon enough and only 39% of hospitals set expected discharge dates linked to criteria for discharge for all or most older patients.
26 Comptroller and Auditor General, Emergency admissions to hospital: managing the demand, Session 2013-14, HC 739, National Audit Office, October 2013.
Figure 8Acute Older Persons Unit (AOPU): Guy’s and St Thomas’ NHS Foundation Trust
The Acute Older Persons Unit (Frailty Unit) is an eight-bed unit, open 8am – 6pm five days a week. The unit was initially located on the Emergency Floor but has since been temporarily relocated to the Emergency Medical Unit to accommodate capital development works. Results from the first quarter of 2015 indicated:
• the proportion of older patients being admitted to wards beyond the AOPU fell by 8% from 38% to 31%;
• of patients admitted to the AOPU, 81.6% were discharged within 24 hours, with 79% of those being ischarged on the same calendar day;
• this reduction in admissions for people aged 75 and over helped to facilitate the closure of 12 acute geriatric beds;
• readmissions from the AOPU were the same as those from the acute geriatric wards, indicating that the more rapid decision-making and discharge did not pose a higher readmission risk;
• both patients and relatives were satisfied with their stay on the unit rating it as “much better” when comparing it to previous experience of emergency and hospital admissions; and
• cost savings of around £140,000.
Source: A Hyman et al, Acute Frailty Unit within the Emergency Department reduces inpatient admissions for frail older adults, Guy’s and St Thomas’ NHS Foundation Trust, available at: www.acutemedicine.org.uk/wp-content/uploads/2015/10/SOD-3-Acute-Frailty-Unit-within-ED-reduces-inpatient-admissions-for-frail-older-adults.pdf

Discharging older patients from hospital Part Two 27
Figure 9Maintaining momentum: implementation of key actions recommended in guidance
of hospitals reported having dedicated geriatric wards (which provide specialist geriatrician-led care to older patients with complex needs); of these, 61% said they did not have enough capacity
of hospitals said they maintain lists of patients no longer benefiting from acute care, with 72% holding daily progress-chasing meetings
of older patients felt fully involved in decisions about their discharge from hospital (according to the 2014 National Inpatient Survey)
of inpatients aged over 65 had stayed in more than one ward during their hospital stay, compared with 33% for younger age groups (according to the 2014 National Inpatient Survey). Guidance recommends that hospitals should minimise the number of ward moves for older patients. Our review of long-stay patient records suggested that on average older patients took 6.2 days to reach the ward from which they were eventually discharged
of hospitals said multi-disciplinary teams reviewed their older patients at least daily. However, in all our case study visits we found that this did not normally happen on weekends
of hospitals set expected discharge dates linked to criteria for discharge for all or most of their older patients. For the 55 hospitals that could provide an estimate, 2% said they set dates and criteria for discharge within 14 hours for all older patients, and 33% for three-quarters or more of their older patients
Notes
1 Bold text denotes key actions recommended in guidance.
2 Multi-disciplinary teams comprise doctors, nurses, therapists and social workers.
3 Guidance states discharge planning should start as soon as possible after admission.
4 Percentages are based on NAO surveys unless otherwise stated. See Appendix Two for sample sizes.
Source: National Audit Offi ce surveys, National Audit Offi ce patient record review, National Inpatient Survey
95%
83%
43%
39%
of hospitals said their multi-disciplinary teams started their planning and assessments on or soon after admission, although only 21% of local authorities and 13% of community providers said they were involved at this point. Most hospitals and community health providers (54%) said discharge planning did not start soon enough to minimise delays in most cases, compared with 19% of local authorities who said this
89%
54%
41%

28 Part Two Discharging older patients from hospital
2.10 NHS guidance suggests that hospitals should discharge at least 35% of patients by midday on each weekday. However, our survey of hospitals found much lower levels: 20% on average. NHS England also indicates that hospitals aim for weekend discharge levels that are 80% of weekday levels. In 2014-15, this measure was 43% for older patients nationally (compared with 57% for all patients). Our case study findings emphasise the need for coordinated action to continue discharges throughout the week: hospitals had to keep making referrals and discharging patients, in tandem with community and social care staff and services being available.
2.11 In our case studies we found that a lack of knowledge and understanding about out-of-hospital services could delay discharge. For example, the range of services available from different areas or community providers, and inconsistency in descriptions and referral criteria made it difficult for hospital staff to keep up to date.
2.12 We also observed how clinical staff had to spend much time negotiating with local authorities and patients’ families to manage discharge, without necessarily being trained to do this. There was no shared or formal understanding of what skills were needed to manage discharge well.
Assessment and rehabilitation at home
2.13 Figure 10 shows the key actions recommended by guidance on assessment and rehabilitation at home. NHS guidance now recommends that local health and social care providers should work together to implement ‘discharge to assess’ schemes, such as the one in South Warwickshire (Figure 11 on page 30). We heard during our case studies and from other stakeholders that assessments done in hospital can over-estimate the care needs of older patients compared to ones done in the familiar surroundings of their own home. However, we found such schemes are still in the early stages, with most having limited capacity (Figure 10). Around half of hospitals have trusted or joint assessor arrangements in place with community health providers and local authorities.
2.14 We found particular difficulties with the assessment for Continuing Healthcare. ‘NHS Continuing Healthcare’ means a package of ongoing care that is arranged and funded solely by the NHS where the individual has been found to have a primary health need. In our survey, 45% of hospitals said they were not able to complete assessments in the patient’s normal place of residence and around 70% indicated that the assessment caused major or moderate delays for older patients. Although one-third of hospitals in our survey said that assessments were completed in five days or fewer, 15% took at least 20 days. On our case study visits we heard about a range of difficulties, including:
• ensuring there were enough and sufficiently trained staff to do the assessments;
• ensuring the assessment was completed correctly, which could result in delays if it was sent back;
• managing patients’ and carers’ involvement in and expectations of the process; and
• increased scrutiny of applications, partly due to cost pressures, which meant applications were taking longer.

Discharging older patients from hospital Part Two 29
of hospitals had ‘discharge to assess’ schemes for older patients. However, only 39% of system resilience group chairs said they could offer their schemes to all or most of their patients. For those with schemes in place, and who were able to provide estimates, six out of 17 community health providers and 11 out of 15 local authorities said they could provide basic care for most older patients within two hours of them arriving home.
of hospitals had trusted or joint assessor arrangements in place with their local authority, compared with 55% with their community health provider, 21% with independent or voluntary providers.
Figure 10Assessment and rehabilitation in the community: implementation of key actions recommended in guidance
52%
49%
Notes
1 Bold text denotes key actions recommended by guidance.
2 Under ‘discharge to assess’ schemes, planning, assessment and arranging ongoing care takes place in the patient’s home rather than hospital, as soon as their acute treatment is complete.
3 Under trusted assessor arrangements, health and social care professionals complete a single assessment of patients’ needs, which can be shared, reducing duplication.
4 Percentages are based on NAO surveys unless otherwise stated. See Appendix Two for sample sizes.
Source: National Audit Offi ce surveys

30 Part Two Discharging older patients from hospital
Figure 11Discharge to assess: South Warwickshire NHS Foundation Trust
Main characteristics
• Coverage of all patients, with three pathways for different levels of need with on average around 68 discharges per week (Pathway One is based on home support. Pathways Two and Three are bed-based).
• Assessment for care and therapy needs at home facilitated by Community Emergency Response Team available seven days a week, 8.30am to 10pm (Pathway One).
• All patients assessed within six weeks, at which point ongoing care needs are established and funding decisions are made.
• In-house social care re-ablement and rehabilitation service allowing direct referral without hospital social work team involvement.
• Electronic common assessment tool jointly developed between health and social care services to allow trusted assessment.
Impact between 2011 to 2014
• Length of stay in acute hospital fell from 7.7 to 6.6 days and in community hospital from 35 to 18 days.
• Closure of 27% or 36% of community hospital beds.
• Average cost to commissioner of patients with extended lengths of stay in hospital fell from £3.2 million to £2.7 million (a 16% fall) by December 2014.
• Percentage of patients requiring more than three ward moves fell from 14% to 3% and the average number of patients placed in outlying wards fell from 12 to four.
Source: NHS Interim Management and Support. Available at: www.nhsimas.nhs.uk/fi leadmin/Files/IST/Emergency_care_conference_2014/Workshop_10_and_14_Discharge_to_Assess_presentation.pdf

Discharging older patients from hospital Part Three 31
Part Three
The effectiveness of local health and social care systems
3.1 Our previous reports, and those of the Committee of Public Accounts, have highlighted several issues that can affect the ability of local health and social care systems to work together and coordinate services.27 These are:
• local system capacity;
• local governance arrangements;
• integrated commissioning;
• sharing patient information; and
• financial incentives.
3.2 In this part we examine the impact of these issues on how local health and social care services work together to discharge older patients from hospital. We also look at national assurance and support to improve how local systems work together.
Local system capacity
3.3 Both National Health Services (NHS) and adult social care sectors are under pressure. Rising demand for services, combined with restricted or reduced funding, is placing pressure on the capacity of local health and social care systems to treat and care for people.28 Nationally, while NHS spending has grown by 5% in real terms between 2010-11 and 2014-15, local authority spending on adult social care has fallen by 10% in real terms between 2009-10 (£16.3 billion) and 2014-15 (£14.6 billion) (Figure 12 overleaf).29 The number of adults receiving local authority-funded care has also fallen.
27 See for example: Comptroller and Auditor General, Improving Dementia Services in England – an Interim Report, Session 2009-10, HC 82, National Audit Office, January 2010; Comptroller and Auditor General, The management of adult diabetes services in the NHS: progress review, Session 2015-16, HC 489, National Audit Office, October 2015; Comptroller and Auditor General, Supporting people with autism through adulthood, Session 2008-09, HC 556, National Audit Office, June 2009.
28 Care Quality Commission, The state of health care and adult social care in England 2014-15, HC 483, October 2015.29 Department of Health, Annual report and accounts 2014-15. The growth rate refers to total departmental expenditure
limit spending. GDP deflators at 2 April 2015 were used to calculate real-terms growth.

32 Part Three Discharging older patients from hospital
Figure 12Index of adult social care spending (2014-15 prices)
Index (2007-08 = 100)
Index 100 103 105 103 103 99 98 94
Notes
1 Graph shows total net expenditure (total gross expenditure minus income).
2 Index is based on expenditure data in 2014-15 prices. GDP deflators at 23 December 2015 were used to calculatereal-terms growth.
Source: Health and Social Care Information Centre, Personal Social Services: Expenditure and Unit Costs,England, November 2015
Between 2010-11 and 2014-15, local authority spending on adult social care has fallen by10% in real terms
2007-08 2008-09 2009-10 2010-11 2011-12 2012-13 2013-14 2014-15
88
90
92
94
96
98
100
102
104
106
108
Discharging older patients from hospital Part Three 33
3.4 In all our surveys, local stakeholders consistently cited community workforce and bed capacity as significant causes of delays in discharging older patients. The National Audit of Intermediate Care 2015 estimated that investment in intermediate care, which includes services to support hospital discharge, was at about half the level required to meet demand, with investment per capita showing a slight fall since 2013. The report also shows an increase in waiting times for intermediate care between 2013 and 2015.30
3.5 Commissioners of adult social care are under pressure to keep fees as low as possible, which is in turn putting pressure on providers.31 We heard concerns about the impact of the introduction of the National Living Wage in April 2016. In a 2015 survey by the Association of Directors of Adult Social Services, 56% of directors thought service providers were facing financial difficulty.32 Our case studies highlighted concerns over bed capacity in residential and nursing homes, and specifically specialist elderly mentally infirm beds for the care of patients with dementia. Care Quality Commission data for England over the period September 2010 to March 2016 show:
• a 9% increase in the total number of nursing home beds. The rate of growth slows over this period, with a slight fall in beds (of 0.3%) from March 2015. There is much regional variation in growth rates;
• a 7% fall in the number of residential home beds. While all regions show a fall, there is again much regional variation; and
• a 47% increase in the number of domiciliary (home care) providers. The Commission’s view is that this may indicate a market shift away from residential care homes to home-based packages of care.
30 NHS Benchmarking Network, National Audit of Intermediate Care Summary Report 2015, 2015.31 Care Quality Commission, The state of health care and adult social care in England 2014-15, October 2015.32 Association of Directors of Adult Social Services, ADASS Budget Survey 2015 Report, June 2015.
34 Part Three Discharging older patients from hospital
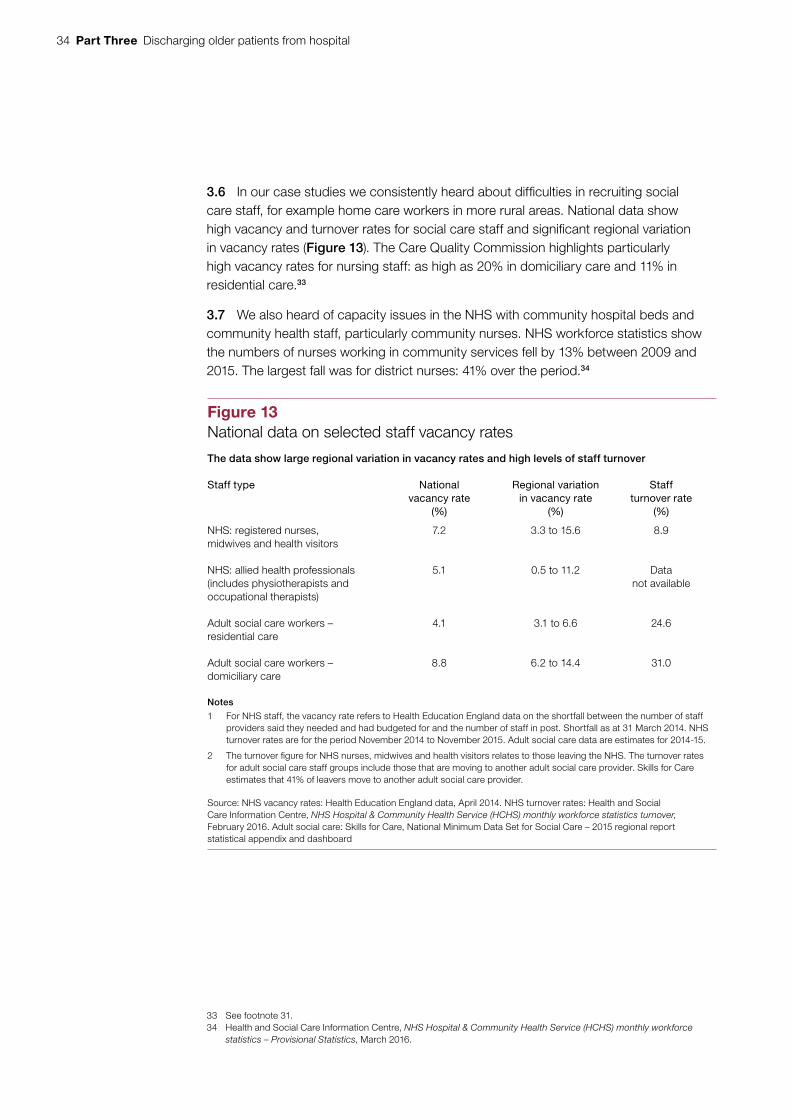
3.6 In our case studies we consistently heard about difficulties in recruiting social care staff, for example home care workers in more rural areas. National data show high vacancy and turnover rates for social care staff and significant regional variation in vacancy rates (Figure 13). The Care Quality Commission highlights particularly high vacancy rates for nursing staff: as high as 20% in domiciliary care and 11% in residential care.33
3.7 We also heard of capacity issues in the NHS with community hospital beds and community health staff, particularly community nurses. NHS workforce statistics show the numbers of nurses working in community services fell by 13% between 2009 and 2015. The largest fall was for district nurses: 41% over the period.34
33 See footnote 31.34 Health and Social Care Information Centre, NHS Hospital & Community Health Service (HCHS) monthly workforce
statistics – Provisional Statistics, March 2016.
Figure 13National data on selected staff vacancy rates
The data show large regional variation in vacancy rates and high levels of staff turnover
Staff type Nationalvacancy rate
(%)
Regional variation in vacancy rate
(%)
Staff turnover rate
(%)
NHS: registered nurses, midwives and health visitors
7.2 3.3 to 15.6 8.9
NHS: allied health professionals (includes physiotherapists and occupational therapists)
5.1 0.5 to 11.2 Data not available
Adult social care workers – residential care
4.1 3.1 to 6.6 24.6
Adult social care workers – domiciliary care
8.8 6.2 to 14.4 31.0
Notes
1 For NHS staff, the vacancy rate refers to Health Education England data on the shortfall between the number of staff providers said they needed and had budgeted for and the number of staff in post. Shortfall as at 31 March 2014. NHS turnover rates are for the period November 2014 to November 2015. Adult social care data are estimates for 2014-15.
2 The turnover fi gure for NHS nurses, midwives and health visitors relates to those leaving the NHS. The turnover rates for adult social care staff groups include those that are moving to another adult social care provider. Skills for Care estimates that 41% of leavers move to another adult social care provider.
Source: NHS vacancy rates: Health Education England data, April 2014. NHS turnover rates: Health and Social Care Information Centre, NHS Hospital & Community Health Service (HCHS) monthly workforce statistics turnover, February 2016. Adult social care: Skills for Care, National Minimum Data Set for Social Care – 2015 regional reportstatistical appendix and dashboard

Discharging older patients from hospital Part Three 35
3.8 Hospitals also reported issues with recruiting and retaining staff. In our survey, fewer than half of hospitals thought they had enough staff trained in the care of older patients (Figure 14). National data show vacancy rates of around 7% for nursing, midwifery and health visiting staff, and 5% for allied health professionals (which includes physiotherapists and occupational therapists) (Figure 13). In our case studies we heard how high vacancy rates (particularly for nursing and therapist staff) and reliance on agency staff made it harder to maintain knowledge of what local services were available in the community.
3.9 Our report on workforce planning highlighted that hospitals’ plans may not always forecast staffing requirements reliably, as they do not always take into account possible changes to services, such as a shift to providing more services in the community.35
35 Comptroller and Auditor General, Managing the supply of NHS clinical staff in England, Session 2015-16, HC 736, National Audit Office, February 2016.
Figure 14National Audit Office (NAO) survey results on whether hospitals think theyhave enough staff trained in the care of older patients
Fewer than half of hospitals think they have enough staff trained in the care of older patients
Notes
1 Based on responses from 76 hospital trusts.
2 Survey question: Do you think your trust has sufficient staff trained in the care of older patients?
Source: National Audit Office survey
0 10 20 30 40 50
Percentage stating they had enough staff
Therapist (eg physiotherapists)
Geriatricians
Nursing staff
34
36
42

36 Part Three Discharging older patients from hospital
3.10 Lord Carter’s review highlighted potential savings of £900 million for hospitals if they were able to tackle delayed transfers of care and discharge patients from hospital who no longer needed acute care.36 Shortcomings in the available data mean that it is not possible to estimate the scope for efficiency savings precisely. However, to provide an indicative estimate, we used the limited data available together with our survey results to first calculate the gross annual cost to the NHS of treating older patients in hospital who no longer need to receive acute clinical care. Secondly, we calculated the cost of caring for these patients either at home or in a more appropriate care setting. (Figure 15 on page 38). We estimate that:
• The gross costs to the NHS of delayed discharge for older people are in the region of £820 million. This estimate is based on a combination of our survey estimates (also see paragraph 1.11 for our estimate of the number of people delayed) and the Department of Health (the Department) reference costs. This is an indicative estimate and does not include the costs of delays incurred in completing patients’ acute treatment. This would assume that patients are moved out of hospital as soon as it is clinically safe to do so, consistent with the aims of NHS guidance. It includes the delays to patients admitted as an emergency and also those admitted for elective treatment, for example planned operations. The estimate is particularly sensitive to the assumed number of patients no longer benefiting from acute care (see Appendix Two). In practice, it may not be easy for hospitals to realise these costs as actual savings in the short term. This would depend on their ability and appetite to close wards and reduce staffing and to manage a range of other issues as set out in this report.37 However, reducing delays does free up more bed space for planned elective care or could relieve pressure on hospitals with high bed occupancy rates. It may also reduce the need for new capacity in the future, allowing hospitals to avoid costs.
36 Lord Carter, Operational productivity and performance in English hospitals: unwarranted variations, Department of Health, February 2016. This estimate covers all age groups (not just 65 and over) and uses a slightly different methodology. It drew on estimates from 96 providers of the “number of beds occupied by patients who could be more appropriately cared for in an alternative setting”.
37 Monitor, Moving healthcare closer to home: summary, September 2015.

Discharging older patients from hospital Part Three 37
• There are additional annual costs for other parts of the health and social care system of approximately £180 million, principally for NHS community health care and nursing care. Unit costs of care in these settings are considerably lower than in hospital. This is based on the number of bed days as estimated for the previous calculation, and best available national data on the type of care required after discharge and unit costs of care. The estimate depends on several assumptions, and varies in particular on what assumptions you make about the level, type and costs of care that older people might need (see Appendix Two). The £180 million is based on a scenario of higher out-of-hospital care requirements, based on delayed transfers of care data. An alternative scenario, based more directly on social care activity data, estimates additional costs of £120 million. The latter also estimates just under one-quarter of delayed bed days not resulting in any public costs for care if moved out of hospital either because people are funding their own care or their level of need is below the threshold for local authority support. Due to limitations of the data, we cannot include the impact of any potential increase or decrease in care needs, and therefore the duration of care, as a result of being discharged more quickly from hospital. Both estimates assume that some additional costs would fall on individuals arranging and funding their own care with related capacity requirements; these costs are not quantified in the estimates. Social care costs are gross costs, which do not take into account contributions from people receiving services. The estimates do not take account of any additional investment required to increase capacity locally beyond the unit cost of care and do not include any additional costs to primary care services.
Local governance arrangements
3.11 NHS England has established system resilience groups as the key local forum for “all the partners across the health and social care system [to] come together to undertake the regular planning of service delivery”.38 Their remit includes planning capacity and overseeing the coordination and integration of services, which includes discharge for older patients.
3.12 Across our case studies and surveys, most system resilience group chairs, hospitals, community health providers and local authorities thought that local organisations were working well together. In our survey of system resilience group chairs, more than 80% of group chairs thought they had the core elements in place, including sufficient information to hold members to account and sufficient senior-level involvement for their group to function effectively (Figure 16 on page 39). In our case studies we found various examples of coordinated working. These included community health and local authority staff based in hospitals and joint teams to speed up discharge.
38 NHS England, the NHS Trust Development Authority, Monitor, and the Association of Directors of Adult Social Services, Operational resilience and capacity planning for 2014-15, June 2014.

38 Part Three Discharging older patients from hospital
Figure 15Potential cost and resource implications for NHS and local government of reducing delays for older people in hospital
Delayed days for patients aged 65 and over in hospital
Delayed days for patients aged 65 and over in hospital
2,690,000 bed days
Gross cost to NHS: £820 million
Cost of care per day = £303
2,690,000 bed days
Gross cost to NHS: £820 million
Cost of care per day = £303
2,250,000 bed days result in additional care days to health and social care system
Total additional cost: £180 million
If delayed days moved out of hospital
NHS community healthcare, 1,420,000 days
Additional costs: £130 million
Cost of care per day = £89
Local authority provided short-term services to maximise independence, 310,000 days.
Additional cost: £20 million
Cost of care per day = £63
Home-based packages of social care, 120,000 days.
Additional cost: £5 million
Cost of care per day = £41
Residential care (non-NHS), 170,000 days
Additional costs: £10 million
Cost of care per day = £77
Nursing care (non-NHS), 230,000 days
Additional cost: £20 million
Cost of care per day = £94
440,000 bed days result in no additional public care costs, because we assume some people arrange and pay for their own care
1,700,000 bed days result in additional care days to health and social care system
Total additional cost: £120 million
If delayed days moved out of hospital
NHS community healthcare, 890,000 days
Additional costs: £80 million
Cost of care per day = £89
Local authority provided short-term services to maximise independence, 510,000 days
Additional cost: £30 million
Cost of care per day = £63
Home-based packages of social care, 200,000 days.
Additional cost: £5 million
Cost of care per day = £41
Residential care (non-NHS), 50,000 days
Additional cost: £2 million
Cost of care per day = £77
Nursing care (non-NHS), 50,000 days
Additional cost: £5 million
Cost of care per day = £94
990,000 bed days do not result in state-funded care of the types listed, of which:
• 630,000 are because no service is provided or people arrange and fund their own care; and
• 360,000 are for lower-level support, which are likely to be lower cost and for which unit cost data are unavailable.
Notes
1 See Appendix Two for details of assumptions, sources and calculations. The unit costs of social care in scenario B apply to new referrals; a marginal rate was used for people with existing care.
2 Numbers of bed days and annual costs may not sum due to rounding.
Source: National Audit Offi ce analysis of hospital episode statistics and Short- and Long-Term Support (SALT) data, Health and Social Care Information Centre, Delayed transfers of care data published by NHS England
Scenario A: higher care needs, based on delayed transfers of care data
Scenario B: lower care needs, based on social care activity data

Discharging older patients from hospital Part Three 39
Figure 16National Audit Office survey results on whether system resilience group chairs thinktheir group has core elements in place to work effectively
More than 80% of group chairs either totally or partly agreed that their group has the core elements in place to help ensure the efficient discharge of older patients from hospital
Notes
1 Based on responses from 55 system resilience group chairs.
2 Survey question: How much do you agree or disagree that your system resilience group has the following in place to help ensure the efficient discharge of older patients from acute hospitals?
Source: National Audit Office survey
0 20 40 60 80 100 120
Percentage of system resilience group chairs totally or partially agreeing
Clearly defined work streams with clear reporting lines relating to the discharge of older patients
Sufficient involvement and support from NHS and local authority adult social services chief executives
Sufficient administrative support
Clearly defined roles and responsibilities
Sufficient representation and commitment from NHS directors and local authority heads of service
Sufficient information to hold members to account
In relation to discharging older patients, there are shared objectives, risk and benefits across the
system resilience group members
96
93
91
91
86
85
84

40 Part Three Discharging older patients from hospital
3.13 Other evidence indicated that groups are not yet working consistently as an effective forum to plan and coordinate discharge. In our survey, system resilience group chairs commonly identified a ‘lack of coordination across teams or organisations’ as a reason for delays across the patient pathway. We identified some scope to improve local coordination. For example, 41% of hospitals and 35% of local authorities in our survey did not have an integrated discharge team.
3.14 Local stakeholders held mixed views about the effectiveness of system resilience groups. In our surveys, more than 80% of group chairs, local authorities and community health providers thought their group was very or quite effective as a forum for planning and coordinating services, compared with 53% of hospitals (Figure 17). Inclusion of patient or public representatives and independent or voluntary sector representatives was relatively poor (in our survey, 42% of chairs said that such bodies were not members or not involved in system resilience groups’ work).
3.15 Our survey and case studies highlighted a number of barriers to effective system resilience group working including:
• Unclear accountability within local systems for discharging older patients. One-third of group chairs in our survey said no individual person or organisation was accountable for ensuring delays to patients were minimised. The Helping People Home report also highlighted issues with no-one “holding the ring” for ensuring systems were working effectively.39
• Focusing too much on day-to-day operational performance at the expense of strategic planning and problem-solving and on hospitals rather than the system as a whole. In our case studies we found planning was not always coordinated in practice. Organisations were sometimes not aware of other organisations’ initiatives even where these affected their own services.
• How groups align with other networks. Health and wellbeing boards potentially have a part to play in improving patient flow and discharge, given their role in promoting integration and partnership. But in our survey only 53% of group chairs said they were working closely with boards on these areas. The Department told us that, in some areas, health and wellbeing boards are working effectively to provide challenge and support to local health and social care systems. We heard one case study example where the group’s role was unclear as other performance improvement regimes (for example, the Emergency Care Improvement Programme and the Success Regime) were operating in the area.
39 Department of Health and NHS England, Report on the work of the Helping People Home team in supporting a reduction in the number of Delayed Transfers of Care (DTOC) (unpublished), May 2015.

Discharging older patients from hospital Part Three 41
Integrated commissioning
3.16 NHS England guidance, published in August 2015, highlights the importance of more integrated commissioning to reduce the lengths of stay in hospital for older patients.40 It states that system resilience groups should develop a commissioning strategy for urgent and emergency care across health and social care organisations, which includes plans for seven-day working and for managing people who are frail.
3.17 We found that areas were not making full use of contractual levers to minimise delays in discharge. For example, more than half of local authorities in our survey had no agreed response times with care home providers for assessing or admitting older people, or requirements for providers to assess and admit patients at the weekend. In our survey of group chairs, 56% of system resilience groups had a commissioning strategy in place, but around half of these did not fully cover how frail older people’s needs would be managed to minimise stays in hospital. There were also some gaps in joint commissioning. For example, 28% of groups did not have ‘fund without prejudice’ agreements. These cover a patient’s needs while responsibility for funding care is established (as recommended in NHS guidance).41
40 NHS England, Transforming urgent and emergency care services in England – Safer, Faster, Better: good practice in delivering urgent and emergency care. A guide for local health and social care communities, August 2015.
41 See footnote 40.
88
87
84
53
0 10 20 30 40 50 60 70 80 90 100
Community health providers
Local authority − directors of adultsocial services
System resilience group chairs
Acute hospitals
Percentage stating very or quite effective
Figure 17National Audit Office survey results on organisations’ views on theeffectiveness of system resilience groups
Far fewer hospitals think groups are effective as a forum for planning and coordinating services compared with group chairs, community health providers and local authorities
Notes
1 Based on responses from: 55 system resilience group chairs; 73 acute hospitals; 24 community health providers;60 local authority directors of adult social services.
2 Survey question: Overall, could you please tell us how effective you think your system resilience group is as a forum for coordinating and planning services to ensure the effective discharge of older patients from acute care?
Source: National Audit Office survey

42 Part Three Discharging older patients from hospital
3.18 The Better Care Fund promotes the integration of services for older and disabled people through a pooled budget for health and social care services. In our survey, 95% of local authorities had Better Care Fund schemes in place to help reduce delays in discharging older patients. Examples included home-based re-ablement services, which help people regain the ability to look after themselves.
3.19 In their Better Care Fund plans for 2015-16, local areas stated they would reduce delayed transfers of care by 85,000 days (over a two-year period), with associated savings of £25 million.42 Initial performance (for the first three quarterly performance periods up to the second quarter of 2015-16) indicates that Better Care Fund activities are not significantly reducing delays: 60% or more of local authorities did not reduce delayed transfers of care as much as planned. In the first three quarters for which data for performance against target are available, there were 258,000 more delayed transfers of care days than planned.
Sharing patient information
3.20 The failure to share patient information is a long-standing barrier to the smooth transition of patients into and out of hospital. This includes information provided to hospitals when people are admitted and also that provided to ongoing care services (community health and adult social care) following discharge from hospital. We highlighted this in our 2003 report and it is recognised by the Department and NHS England.43,44 As of October 2015, it is now the statutory duty of health and social care organisations to share patient information unless there is a reason not to.45
3.21 Our survey findings show that patient information was still not consistently shared across health and social care providers (Figure 18). This applied particularly to information provided to hospitals, and from primary and community healthcare providers to local authorities. System resilience group chairs said the main barriers to sharing patient information were incompatible IT systems (85% said this was a barrier); necessary information governance arrangements not in place (42%); and concerns about patient confidentiality (38%).
42 These differ slightly to figures quoted in the 2014 NAO report Planning for the Better Care Fund, as Better Care Fund plans had not been finalised at the time of publication of that report.
43 Comptroller and Auditor General, Ensuring the effective discharge of older patients, Session 2002-03, HC 392, National Audit Office, February 2003.
44 NHS England, Quick guide: sharing patient information, Gateway Reference 04254.45 The Health and Social (Safety and Quality) Act 2015, which came into effect on 1 October 2015, sets a duty for
information to be shared where it facilitates care for an individual and it is legal to do so.

Discharging older patients from hospital Part Three 43
3.22 Across our case studies we heard examples of how lack of access to patient information affected patient flow. This applied particularly in accident and emergency (A&E): we heard examples where if clinicians did not have information on patients’ health and circumstances (for example, care packages) they were less able to undertake a full assessment and more likely to err on the side of caution and admit patients. Lack of information also meant clinicians spent significant amounts of time trying to build up a picture of a patient’s condition and outside circumstances. Our survey results indicated that access to patient information worsened at weekends and during bank holidays. In our case studies we also found hospital staff were collecting the same information from patients multiple times as they moved around the hospital. The importance of shared patient information was highlighted in Lord Carter’s recent report on operational productivity, and the National Information Board (November 2014) outlined its vision for better information sharing across the health and social care system.46,47 Following the announcement in the 2015 Spending Review of a £4.2 billion NHS information technology programme for the next five years, this work is being taken forward by the Department, NHS England and the Health and Social Care Information Centre, with the wider engagement of the National Information Board.
46 See footnote 36.47 National Information Board, Personalised Health and Care 2020 – Using Data and Technology to Transform Outcomes
for Patients and Citizens, November 2014.
Figure 18National Audit Offi ce survey results on the extent to which organisations think they receive suffi cient patient information
Up to a quarter of hospitals think they get enough information from other care providers on older patients when admitted to hospital
Percentage of organisations statingsufficient information for all or most patients
Type of information Hospitals
(%)
Local authority
(%)
Community health provider
(%)
Primary care information (eg GP records) 25 23 54
Hospital information (eg regarding patients’ stay in hospital)
n/a 63 58
Community care providers’ information (eg community matron information)
22 31 n/a
Local authority social care information (eg information on care packages or patients’ functional condition)
17 n/a n/a
Independent and voluntary sector information 9 48 21
Notes
1 Results based on responses from: 76 hospitals; 62 local authority directors of adult social services; 24 community health providers.
2 Survey question: Does your organisation have suffi cient information from the sources identifi ed below on the baseline condition or existing care requirements of older patients [fi nal wording varied across different surveys].
Source: National Audit Offi ce survey

44 Part Three Discharging older patients from hospital
Financial incentives
3.23 Financial incentives to discharge older patients as soon as possible from hospital are not aligned across health and social care systems:
• Hospitals have clear financial incentives to reduce the length of stay of older patients and discharge them quickly. The main financial incentive is to free up bed space for elective admissions. As also highlighted in our report on financial sustainability, the payment by results tariff does not cover the full cost of treating emergency admissions (which is the admission route for most older patients).48 Where emergency admissions rise above a baseline established in 2008-09, hospitals receive a marginal rather than full tariff rate for these admissions.
• For community health providers and local authorities there are less clear-cut short-term financial incentives to accept patients as quickly as possible. For example, most of the community health providers we spoke to were on a block contract without any activity-based payments. These provided no financial incentive to take on the cost and risk of additional patients.
3.24 Across our case studies, however, we heard from a broad range of stakeholders that the main driver of day-to-day decisions on when to discharge patients from hospital remains patient care and safety, rather than financial considerations. There was general recognition across local systems that reducing the length of stay of older patients in hospital would reduce care needs, and ultimately costs, in the long term.
3.25 The Care Act 2014 now makes it discretionary for acute hospitals to fine local authorities for delayed transfers of care for which they are responsible. The related statutory guidance states that fining should not be used by NHS bodies as the first approach to address any local difficulties around delayed transfers of care.49 Most hospitals do not exercise this option. Nationally, only 23% of local authorities were fined in 2014-15: a total of £2 million.50
National assurance and support
3.26 Figure 19 sets out the main accountability and funding arrangements for local health and social care systems. Clinical commissioning groups are responsible for commissioning most health services and hold providers to account through their contracts. NHS providers are accountable to NHS Improvement (Monitor and the NHS Trust Development Authority before April 2016), as the sector regulator for health services in England. Clinical commissioning groups are held to account by NHS England through an annual assurance process. There are also other local and regional planning and assurance mechanisms (such as Urgent and Emergency Care Networks, not shown in the diagram). NHS England is held to account by the Department through an annual mandate and the NHS outcomes framework. As the steward of the system, the Department is accountable to Parliament for the overall value for money of health and adult social care services (Figure 19).
48 Comptroller and Auditor General, Sustainability and financial performance of acute trusts report, Session 2015-16, HC 611, National Audit Office, December 2015.
49 Department of Health, Care and Support Statutory Guidance – issued under the Care Act 2014, June 2014.50 Association of Directors of Adult Social Services, ADASS Budget Survey 2015, June 2015.

Discharging older patients from hospital Part Three 45
Fig
ure
19
Acc
ount
abilit
y an
d fu
ndin
g st
ruct
ure
Par
liam
ent
No
tes
1 H
ealth
and
soc
ial c
are
serv
ices
can
be
pro
vid
ed b
y a
rang
e of
pro
vid
ers
incl
udin
g p
rivat
e se
ctor
org
anis
atio
ns.
2 S
ome
loca
l are
as m
ay h
ave
arra
ngem
ents
for
poo
led
bud
gets
and
join
t com
mis
sion
ing
bet
wee
n cl
inic
al c
omm
issi
onin
g gr
oups
and
loca
l aut
horit
ies.
Sou
rce:
Nat
iona
l Aud
it O
ffi ce
Dep
artm
ent
of
Hea
lth
Ove
rall
fund
ing/
acco
unta
ble
to P
arlia
men
t for
hea
lth
and
adul
t soc
ial c
are
NH
S Im
pro
vem
ent
Reg
ulat
es N
HS
hea
lth
care
pro
vide
rs
Co
mm
un
ity
hea
lth
serv
ices
(eg
com
mun
ity n
ursi
ng,
phys
ioth
erap
y)
Old
er p
eop
le w
ith
hea
lth
and
/or
soci
al c
are
nee
ds
Ho
spit
al s
ervi
ces
(eg
inpa
tient
, out
patie
nt,
A&
E s
ervi
ces)
So
cial
car
e se
rvic
es
(eg
dom
icili
ary
care
, re
side
ntia
l car
e)
Lo
cal a
uth
ori
ties
Ass
essi
ng n
eeds
and
com
mis
sion
ing
soci
al
care
/dire
ct p
rovi
sion
of s
ome
serv
ices
Lo
cal e
lect
ora
te
Dep
artm
ent
for
Co
mm
un
itie
s an
d L
oca
l Go
vern
men
t
Fund
ing
for
loca
l gov
ernm
ent,
incl
udin
g so
cial
car
e/ac
coun
tabl
e to
Par
liam
ent f
or o
vera
ll fu
ndin
g to
loca
l aut
horit
ies
Sys
tem
res
ilien
ce g
rou
ps
Res
pons
ible
for
oper
atio
nal p
lann
ing
of
urge
nt a
nd e
mer
genc
y ca
re s
ervi
ces
and
elec
tive
serv
ices
Hea
lth
and
wel
lbei
ng
bo
ard
s
Pro
vide
lead
ersh
ip fo
r he
alth
and
ca
re s
yste
ms
and
are
resp
onsi
ble
for
prod
ucin
g jo
int s
trat
egic
nee
ds
asse
ssm
ents
(JS
NA
s) a
nd jo
int h
ealth
an
d w
ellb
eing
str
ateg
ies
(JH
WS
s)
Car
e Q
ual
ity
Co
mm
issi
on
Mon
itors
, ins
pect
s, a
nd
regu
late
s he
alth
and
soc
ial
care
ser
vice
s
Acc
ount
abili
tyFu
ndin
gA
ccou
ntab
le fo
r co
ntra
ctua
l per
form
ance
Ser
vice
del
iver
y
Ind
ivid
ual
s p
ayin
g f
or
all
or
par
t o
f th
eir
care
Pri
mar
y ca
re s
ervi
ces
(eg
GP
ser
vice
s)
Clin
ical
co
mm
issi
on
ing
gro
up
s
Res
pons
ible
for
asse
ssin
g ne
eds,
pla
nnin
g an
d co
mm
issi
onin
g al
l hea
lth c
are/
held
to
acco
unt b
y N
HS
Eng
land
NH
S E
ng
lan
d
Fund
ing
of h
ealth
care
/com
mis
sion
ing
of
spec
ialis
ed h
ealth
ser
vice
s/ac
coun
tabl
e to
the
Dep
artm
ent o
f Hea
lth
N
atio
nal o
rgan
isat
ions
Lo
cal o
rgan
isat
ions

46 Part Three Discharging older patients from hospital
3.27 The delayed transfers of care national collection is the only NHS indicator directly related to patient discharge delays. As described in Part One, the indicator does not capture all the delays that a patient may experience during their hospital stay. The Department and NHS England have identified issues with the accuracy of recording delayed transfers of care, but there is no national validation of the data returns. We found continuing issues with the accuracy of the delayed transfers of care indicator. We found variation in the amount of time case study hospitals allowed for packages of care to be put in place before they started counting it as a delayed transfer. There were also examples where hospitals’ systems for collecting data on delayed transfers of care were not covering their entire patient population. Our survey showed that 37% of local authorities never or only sometimes agreed the delayed transfers of care data before hospitals reported it to NHS England, as required in the Care Act 2014. However, around 70% or more of hospitals and local authorities in our surveys thought the data were very or quite accurate before the new guidance was introduced in October 2015.
3.28 NHS England refreshed its existing guidance to clarify the rules and definitions for counting delayed transfers of care in October 2015.51 The online data collection system used to collect delayed transfers of care data now includes a prompt to check that there has been local authority sign-off.
3.29 As the official delayed transfers of care data increased from 2013, the Cabinet Office and the Department undertook work to understand the reasons for delays. During 2014, the Cabinet Office Implementation Unit undertook a review of the causes of delayed transfers of care. In January 2015, the Department established the Helping People Home team to support the Cabinet Office sub-committee on health and social care winter performance. The team aimed to: understand the reasons for the increase in delayed transfers of care; identify ways to reduce delays; and identify system issues that needed to be addressed.52
3.30 During our fieldwork we found a number of examples of joint working across national health and local government organisations. However, the landscape was complex with a range of teams, initiatives and good-practice guidance either directly or indirectly related to improving practice in discharging patients. In addition to broader national initiatives (see Figure 20), recent work in this area includes:
• Emergency Care Intensive Support Team (ECIST) and Emergency Care Improvement Programme (ECIP)
As part of NHS Interim Management and Support, ECIST provides NHS organisations with short- or medium-term support for their urgent and emergency care services, focusing on patient flow. During winter 2015-16, the ECIP programme has been providing intensive support to the 28 most under-pressure urgent and emergency care systems. It is a clinically led programme supported by the Department, NHS England and NHS Improvement.
51 NHS England, Monthly Delayed Transfers of Care Situation Reports – Definitions and Guidance, October 2015.52 Cabinet Office Implementation Group, Delayed transfers of care – Implementation unit review (unpublished),
November 2014. Department of Health and NHS England, (unpublished) Report on the work of the Helping People Home team in supporting a reduction in the number of Delayed Transfers of Care (DTOC), May 2015.
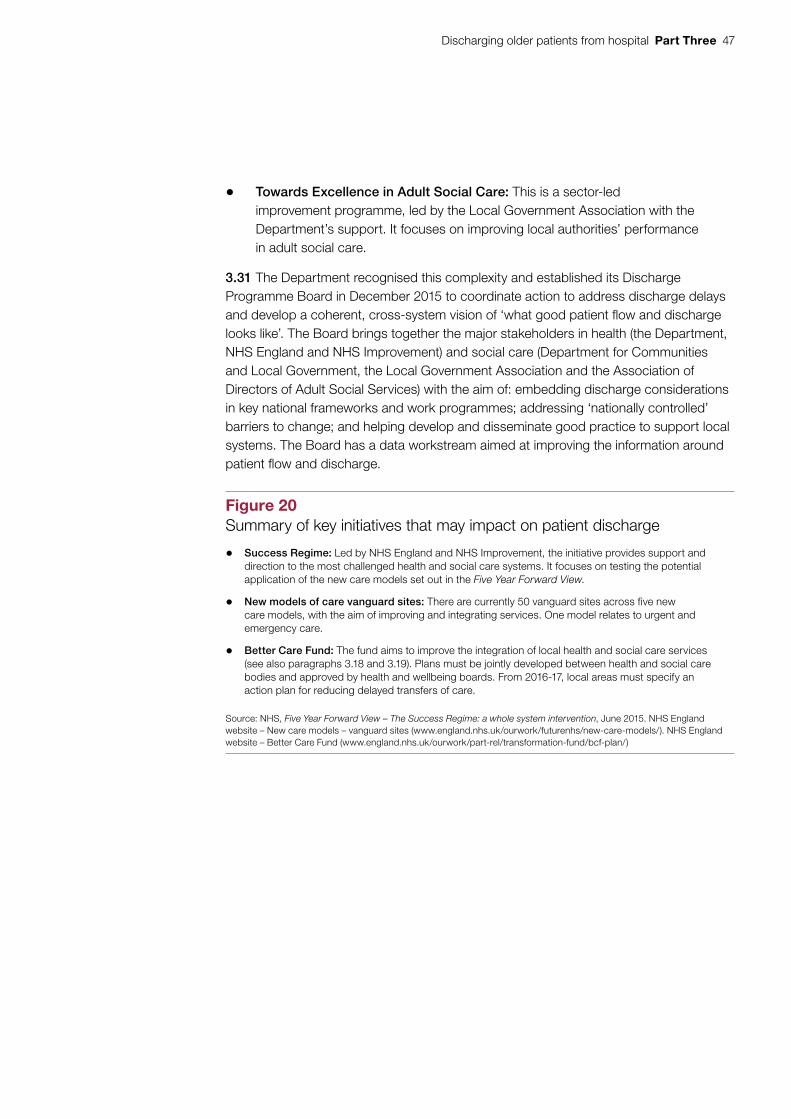
Discharging older patients from hospital Part Three 47
• Towards Excellence in Adult Social Care: This is a sector-led improvement programme, led by the Local Government Association with the Department’s support. It focuses on improving local authorities’ performance in adult social care.
3.31 The Department recognised this complexity and established its Discharge Programme Board in December 2015 to coordinate action to address discharge delays and develop a coherent, cross-system vision of ‘what good patient flow and discharge looks like’. The Board brings together the major stakeholders in health (the Department, NHS England and NHS Improvement) and social care (Department for Communities and Local Government, the Local Government Association and the Association of Directors of Adult Social Services) with the aim of: embedding discharge considerations in key national frameworks and work programmes; addressing ‘nationally controlled’ barriers to change; and helping develop and disseminate good practice to support local systems. The Board has a data workstream aimed at improving the information around patient flow and discharge.
Figure 20Summary of key initiatives that may impact on patient discharge
• Success Regime: Led by NHS England and NHS Improvement, the initiative provides support and direction to the most challenged health and social care systems. It focuses on testing the potential application of the new care models set out in the Five Year Forward View.
• New models of care vanguard sites: There are currently 50 vanguard sites across five new care models, with the aim of improving and integrating services. One model relates to urgent and emergency care.
• Better Care Fund: The fund aims to improve the integration of local health and social care services (see also paragraphs 3.18 and 3.19). Plans must be jointly developed between health and social care bodies and approved by health and wellbeing boards. From 2016-17, local areas must specify an action plan for reducing delayed transfers of care.
Source: NHS, Five Year Forward View – The Success Regime: a whole system intervention, June 2015. NHS England website – New care models – vanguard sites (www.england.nhs.uk/ourwork/futurenhs/new-care-models/). NHS England website – Better Care Fund (www.england.nhs.uk/ourwork/part-rel/transformation-fund/bcf-plan/)

48 Appendix One Discharging older patients from hospital
Appendix One
Our audit approach
1 This report examines how effectively the health and social care sectors are managing the discharge of older patients from hospital. It covers:
• the extent to which health and social care providers are adopting good practice to minimise delays to older patients;
• whether health and social care systems are working effectively to minimise delays to older patients; and
• the national assurance and support for local systems.
2 Older patients account for the majority of bed days in hospital. They are also more likely to have complex ongoing care needs and make up most of the cases reported in the official delayed transfers of care data. This report focuses on patients aged 65 and over who are admitted via emergency (as opposed to elective) admission, from the point when they are admitted to hospital through to when they are discharged.
3 This report complements our 2013 report on emergency admissions – which examined how well hospitals managed the demand for emergency services – in covering discharge planning after admission to hospital. Thus it does not cover out-of-hospital services designed to avoid hospital admission. It also does not cover mental health services in depth, including dedicated dementia care.
4 Our audit approach is summarised in Figure 21. Our evidence base is described in Appendix Two.

Discharging older patients from hospital Appendix One 49
Figure 21Our audit approach
The Department of Health and NHS England’s objectives
How this will be achieved
Our study
Our evaluative criteria
Our evidence
(see Appendix Two for details)
Our conclusions
Our evaluation was based on evidence gathered through the following methods:
• reviewing documents relating to policy and good practice on discharging patients;
• carrying out interviews with the Department of Health, NHS England and other stakeholders;
• undertaking case study visits to six local health and social care systems;
• carrying out surveys of: acute hospitals; local authority directors of adult social services; community health providers; and system resilience group chairs; and
• analysing data on hospital and social care activity, service costs and delayed transfers.
Are health and social care providers adopting operational good practice to minimise delays to older patients while in an acute hospital setting?
Are national organisations coordinating their assurance and support to help improve the discharging of older patients?
Are local health and social care systems working effectively to minimise delays in discharging older patients?
To ensure that older patients’ stay in hospital no longer than necessary. This requires a coordinated response across health and social care organisations.
The Department is ultimately responsible for securing value for money for health services. It is also responsible for adult social care policy. It holds NHS England accountable by setting objectives through an annual mandate. Clinical commissioning groups (CCGs) are responsible for commissioning most health services and hold providers to account through their contracts. CCGs are held to account by NHS England. NHS providers are accountable to NHS Improvement as the sector regulator for health services in England. Local authorities commission adult social services and are accountable to their local electorate.
There is a range of good practice relating to patient flow and discharge.
Examines how effectively the health and social care sectors are managing the discharge of older patients from acute hospitals.
Making sure older patients stay in hospital no longer than necessary is a complex issue that requires a coordinated response across health and social care organisations. Unnecessary stays in hospital result in worse health outcomes for patients and waste already strained NHS hospital resources as well as increasing the long-term care needs, and costs, for social care and community healthcare. NHS data show the number of delayed transfers are increasing at an alarming rate but do not capture the full extent of older people who should not be in hospital. While there is a clear awareness of the need to discharge older people from hospital sooner, both at national and local level, there are currently far too many older people in hospitals who do not need to be there, at an estimated cost to the NHS of around £820 million. Without radical action to improve local practice and remove national barriers this problem will get worse and add further strain to the financial sustainability of the NHS. Given the increase in delays and limited progress in reducing barriers to further improvements, performance does not represent value for money.

50 Appendix Two Discharging older patients from hospital
Appendix Two
Our evidence base
1 We reached our independent conclusions on the value-for-money risks of discharging older patients from hospital between September 2015 and May 2016. Our audit approach is outlined in Appendix One.
2 We reviewed documents relating to policy and good practice on the care and discharge practice for older patients in hospital. This included guidance from NHS England, the National Institute for Health and Care Excellence, the British Geriatric Society and the Department of Health. We also reviewed NHS England policy documents about the discharge of older patients and a range of reports and reviews including ones from Monitor, NHS Providers, the Department of Health’s Helping People Home team, Age UK, the King’s Fund and Healthwatch.
3 We interviewed central government representatives from the Department, NHS England, NHS Improvement, the National Institute for Health and Care Excellence and the Department of Communities and Local Government.
4 We interviewed sector experts from the Local Government Association; the Association of Directors of Adult Social Services; Age UK, the College of Occupational Therapists, the Royal College of Nursing, the UK Homecare Association, the Registered Nursing Home Association, the British Geriatrics Society and the University Hospital of the North Midlands NHS Trust. As part of our scoping we also visited South Warwickshire NHS Foundation Trust.
5 We completed six case study visits to local health systems, ensuring a range of different types of hospital and area (for example, urban vs rural), and levels of delayed transfers of care. Our visits to local health and social care systems focused on the following acute hospitals: Aintree University Hospital NHS Foundation Trust (Liverpool and Sefton local authorities); Guy’s and St Thomas’s NHS Foundation Trust (Lambeth and Southwark local authorities); Royal Devon and Exeter NHS Foundation Trust; The Princess Alexandra Hospital NHS Trust; Royal Brompton and Harefield NHS Foundation Trust; and North Cumbria University Hospitals NHS Trust. The case study methodology comprised:
• interviews with staff in the hospital, clinical commissioning group, local authority, community healthcare provider and regional NHS England staff;

Discharging older patients from hospital Appendix Two 51
• a review of a sample of records for patients with stays of 14 days or more. In total, five hospitals participated with a combined sample of 149 patient records. The review checked information on a number of dates and milestones in the patient’s stay such as when they were assessed as medically fit by a consultant or recorded as a delayed transfers of care (where applicable); and
• we conducted an in-depth review of patient flow at two hospitals, observing how staff assessed, treated and discharged older patients. We assessed maturity of the process using the NAO’s operations and process management analytic.
6 The surveys and case studies both collected information about local discharge arrangements and implementation of best practice; local governance arrangements; financial incentives around discharge; local system capacity; and national assurance and support arrangements.
7 We carried out surveys of local stakeholders involved in discharging older patients. The groups covered (and response rates) were:
• acute hospital trusts: 78 responses covering 76 hospital trusts (47%);
• system resilience groups chairs: 55 responses (40%);
• local authority directors of adult social services: 62 responses (41%); and
• community health providers: 24 responses (18%).
8 The local authority and community health provider surveys were distributed via system resilience group chairs, who were asked to forward the survey to their main local authority and community health provider. We surveyed acute trusts separately. For acute trusts that also provided community health services, we included some relevant questions on their community health services. For local authorities, we received assistance in publicising the survey from the Local Government Association and the Association of Directors of Adult Social Services. This improved the response rate.
9 For two estimates, there were concerns that hospitals with poorer performance might respond differently to the relevant survey questions. We therefore checked whether the performance profile of hospitals providing responses was in line with all hospitals in England, for indicators of delayed transfers of care data, A&E waiting times, and bed occupancy rates:
• for the 27 trusts that provided information on the number of older patients no longer benefiting from acute care (paragraph 1.11), we found no significant difference in performance for these respondents apart from significantly better performance on meeting the A&E four-hour standard (93% of these respondents compared with 91% of other trusts); and
• for the 41 trusts that provided information on the number of patients with delayed transfers of care who were aged 65 and over, we found no significant difference in performance for these respondents apart from significantly higher bed occupancy levels (89% compared with 87% for other hospitals). Inquiries by NHS Improvement with a limited number of trusts gave a consistent estimate for the proportion of patients with a delayed transfer of care who were aged 65 and over: in the range 88%–95%, compared with our estimate of 85%.

52 Appendix Two Discharging older patients from hospital
10 We analysed hospital episode statistics to understand the variation and trends in a range of indicators including hospital length of stay, admission and readmission rates. We also analysed NHS England’s official delayed transfers of care data to examine the level and type of delays occurring. We estimated the gross cost to the NHS of treating older patients who no longer needed to be in acute care, and the potential shift in costs to other parts of the health and social care system if this care was moved out of hospital (see paragraph 3.10) using the steps and data sources detailed below.
11 We estimated gross costs to the NHS as follows:
Calculation method Assumptions
a The number of days recorded as delayed transfers of care in acute patients MULTIPLIED BY
Based on delayed transfers for care data for the period March 2015 to February 2016 – 1,158, 619 days.53
b The proportion of days accounted for by patients aged 65 and over MULTIPLIED BY
Estimated using returns from 41 trusts in our survey – 85%.
c An adjustment factor to account for patients no longer benefiting from acute care, excluded from the definition of delayed transfers of care MULTIPLIED BY
Estimated using returns from 27 trusts in our survey who provided details of patients aged 65 and over who were no longer benefiting from acute care and could be discharged with appropriate care and support – 2.732.
d The cost of an acute bed per day Based on the Department of Health’s excess bed day cost of £303 per day.54
12 We used two different scenarios to estimate the potential costs moved to non-acute NHS and social care providers as detailed below. This recognises that there were particularly limited data on the level and type of care that older people who are delayed may require after hospital. The first scenario uses a combination of social care activity and delayed transfers of care data to estimate the profile of destinations; the second relies solely on delayed transfers of care data. Social care activity data are based on all people aged 65 and over discharged from hospital who have a social care assessment. The level of care required is lower than that implied by the delayed transfers of care data, which are based on a portion of older patients who will require a transfer of care following hospital.
53 NHS England, Delayed Transfers of Care Data 2015-16, March 2016.54 Department of Health, Reference costs 2014-15, November 2015.

Discharging older patients from hospital Appendix Two 53
13 The first scenario used a combination of social care activity and delayed transfers of care data to estimate the profile of destinations.
• We estimated the potential costs shifted to non-acute NHS providers as follows:
• To estimate the potential costs shifted to local authority-funded care we first calculated the number of bed days accounted for by older patients who could be eligible for state-funded local authority care.
Calculation method Assumptions
h The total number of bed days accounted for by patients aged 65 and over who did not need to be in acute care MULTIPLIED BY
Estimated by multiplying a x b x c above.
i Proportion of patients not requiring further non-acute NHS care after discharge MULTIPLIED BY
As implied from the calculation of f above.
j An adjustment factor to account for people not contacting the local authority to have their needs assessed
Set at 95%, in the absence of available data.
55 See footnote 53.56 NHS Benchmarking Network, National Audit of Intermediate Care Summary Report 2015, NAIC 2015, November 2015.
Calculation method Assumptions
e The total number of bed days accounted for by patients aged 65 and over who did not need to be in acute care MULTIPLIED BY
Estimated by multiplying a x b x c above.
f Proportion of patients requiring further NHS care after discharge MULTIPLIED BY
Based on the proportion of delayed transfers of care bed days for acute patients between March 2015 and February 2016 recorded as due to (a) ‘awaiting further non-acute NHS care’ or (b) ‘awaiting care package in own home’ – all days recorded as caused by NHS, and half of those recorded as ‘both’ (c) ‘awaiting community equipment or adaptation’ – all days recorded as caused by NHS and half of those recorded as ‘both’. Estimated as 33%.55
g Estimated cost per day of non-acute NHS care Based on National Audit of Intermediate Care 2015 data. Cost per day derived from average cost per service user and average length of stay for bed-based, home-based, re-ablement, and crisis response services, weighted by referrals per 100,000 – estimated as £89.56
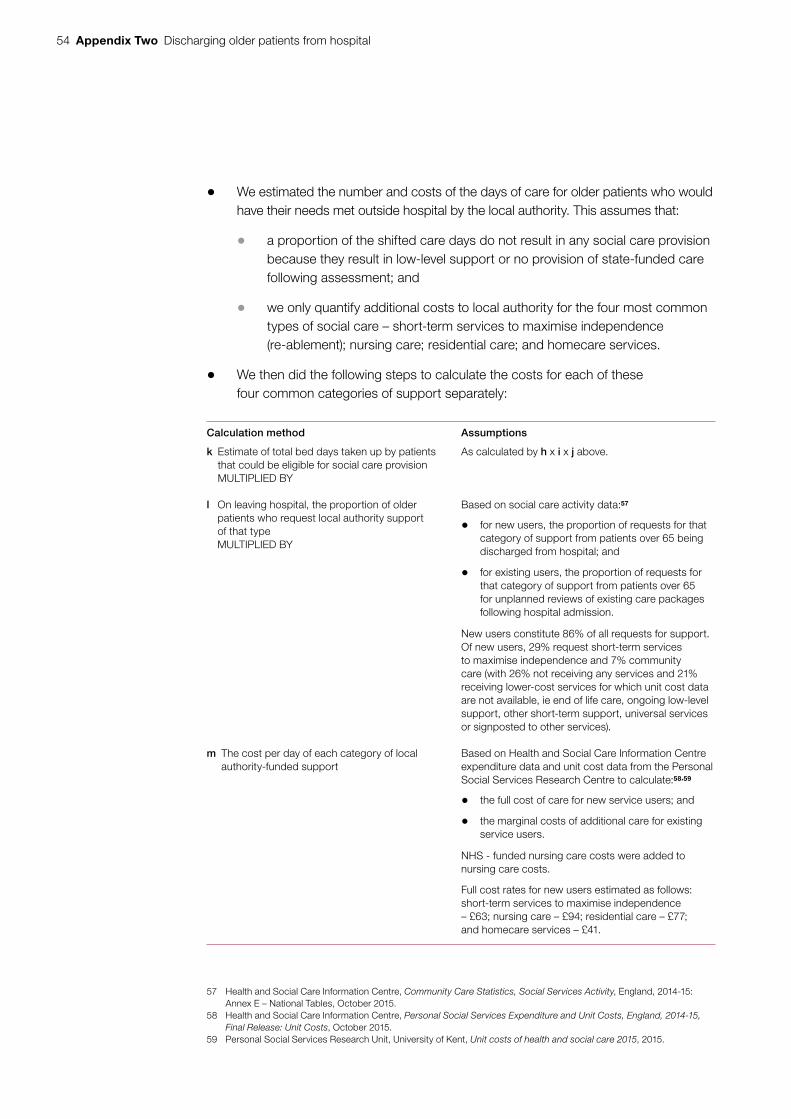
54 Appendix Two Discharging older patients from hospital
• We estimated the number and costs of the days of care for older patients who would have their needs met outside hospital by the local authority. This assumes that:
• a proportion of the shifted care days do not result in any social care provision because they result in low-level support or no provision of state-funded care following assessment; and
• we only quantify additional costs to local authority for the four most common types of social care – short-term services to maximise independence (re-ablement); nursing care; residential care; and homecare services.
• We then did the following steps to calculate the costs for each of these four common categories of support separately:
Calculation method Assumptions
k Estimate of total bed days taken up by patients that could be eligible for social care provision MULTIPLIED BY
As calculated by h x i x j above.
l On leaving hospital, the proportion of older patients who request local authority support of that type MULTIPLIED BY
Based on social care activity data:57
• for new users, the proportion of requests for that category of support from patients over 65 being discharged from hospital; and
• for existing users, the proportion of requests for that category of support from patients over 65 for unplanned reviews of existing care packages following hospital admission.
New users constitute 86% of all requests for support. Of new users, 29% request short-term services to maximise independence and 7% community care (with 26% not receiving any services and 21% receiving lower-cost services for which unit cost data are not available, ie end of life care, ongoing low-level support, other short-term support, universal services or signposted to other services).
m The cost per day of each category of local authority-funded support
Based on Health and Social Care Information Centre expenditure data and unit cost data from the Personal Social Services Research Centre to calculate:58,59
• the full cost of care for new service users; and
• the marginal costs of additional care for existing service users.
NHS - funded nursing care costs were added to nursing care costs.
Full cost rates for new users estimated as follows: short-term services to maximise independence – £63; nursing care – £94; residential care – £77; and homecare services – £41.
57 Health and Social Care Information Centre, Community Care Statistics, Social Services Activity, England, 2014-15: Annex E – National Tables, October 2015.
58 Health and Social Care Information Centre, Personal Social Services Expenditure and Unit Costs, England, 2014-15, Final Release: Unit Costs, October 2015.
59 Personal Social Services Research Unit, University of Kent, Unit costs of health and social care 2015, 2015.

Discharging older patients from hospital Appendix Two 55
14 The second scenario used delayed transfers of care data for March 2015 to February 2016 to estimate the profile of destinations.
• We first ‘allocated’ the delayed bed days to potential care destinations, based on the causes of delay as recorded in the official delayed transfers care data. The official data records 10 causes of delay, of which five could be categorised as indicating a care destination, as detailed below. These account for 63% of the total days. The remaining five reasons, which do not clearly identify a care destination (for example, waiting for an assessment or patient choice), were assumed to have the same profile of destinations. We mapped the assumed destinations onto the recorded reasons for delay as follows:
• We estimated the potential costs shifted to non-acute NHS providers as follows:
Calculation method Assumptions
o The total number of bed days accounted for by patients aged 65 and over who did not need to be in acute care MULTIPLIED BY
As for e in the first scenario, estimated by multiplying a x b x c above.
p Proportion of patients requiring further non-acute NHS care after discharge MULTIPLIED BY
As indicated by n above, 53%. Note this differs from the estimate used at f, as in the second scenario the proportion is based only on the five reasons for delay which identified a care destination, rather than on all delayed days.
q Estimated cost per day of non-acute NHS care As for g, in the first scenario.
Calculation method Assumptions
n Proportion of total bed days going to further non-acute NHS care, residential care, nursing care and local authority care (re-ablement and homecare).
Non-acute NHS care – based on the proportion of delayed transfers of care bed days recorded as due to (a) ‘awaiting further non-acute NHS care’ or (b) ‘awaiting care package in own home’– all days recorded as caused by NHS, and half of those recorded as ‘both’ (c) ‘awaiting community equipment or adaptation’ – all days recorded as caused by NHS and half of those recorded as ‘both’.
Residential care – based on the proportion recorded as ‘awaiting residential home placement or availability’.
Nursing care – based on the proportion recorded as ‘awaiting nursing home placement or availability’.
Local authority care (re-ablement or homecare) – based on the proportion recorded as due to (a) ‘awaiting care package in own home’– all days recorded as caused by local authority, and half of those recorded as ‘both’ (c) ‘awaiting community equipment or adaptation’ – all days recorded as caused by local authority and half of those recorded as ‘both’.

56 Appendix Two Discharging older patients from hospital
• We estimated the potential costs shifted to residential and nursing care separately as follows:
Calculation method Assumptions
r The total number of bed days accounted for by patients aged 65 and over who did not need to be in acute care MULTIPLIED BY
As for e in the first scenario, estimated by multiplying a x b x c above.
s Proportion of patients requiring either residential or nursing care after dischargeMULTIPLIED BY
As indicated by n above, 10% and 20% respectively.
t Proportion of patients in residential or nursing care estimated to be self-funders (arranging and paying for their own care) MULTIPLIED BY
Estimated from the delayed transfers of care data, by using the proportion of delays for residential or nursing placement or availability that were recorded as caused by NHS, 39% and 58% respectively. These estimates were very close to those implied by the Laing Buisson Care of Older People Market Report (40% and 55% respectively).60
u Estimated cost per day of residential or nursing care Using full cost rates for new users, as detailed in m above.
• We estimated the potential costs shifted to local authority-provided short-term services to maximise independence and home-based care separately as follows:
Calculation method Assumptions
v The total number of bed days accounted for by patients aged 65 and over who did not need to be in acute care MULTIPLIED BY
As for e in the first scenario, estimated by multiplying a x b x c above.
w Proportion of patients requiring either local authority re-ablement or home-based care after discharge MULTIPLIED BY
As indicated by n above, in conjunction with the relative frequency of each type of support in social care activity data, estimated as 12% and 5%.
x An adjustment factor to account for people not contacting the local authority to have their needs assessedMULTIPLIED BY
Set at 95%, in the absence of available data.
y Estimated cost per day of local authority re-ablement or home-based care
Using full cost rates for new users, as detailed in m above.
60 Laing and Buisson, Care of Older People Market Report, Twenty Seventh Report, 2016.

Discharging older patients from hospital Appendix Two 57
15 We carried out some sensitivity analysis on our estimate of the gross costs to the NHS of delayed patients, to see how much change there was in the overall estimate, if underlying components varied. We calculated the interquartile range of each component, which provided high and low bounds, and examined the resulting variation in the overall estimate (see paragraph 3.10). We looked at the impact of varying two components:
• The proportion of delayed patients who were aged 65 (b in the tables above): varying this component could reduce the estimate by up to £280 million (34%) or increase it by up to £360 million (45%).
• The adjustment factor used to estimate the number of patients no longer benefiting from acute care (c in the tables above): varying this component could decrease the estimate by up to £100 million (12%) or increase it by up to £140 million (18%).

This report has been printed on Evolution Digital Satin and contains material sourced from responsibly managed and sustainable forests certified in accordance with the FSC (Forest Stewardship Council).
The wood pulp is totally recyclable and acid-free. Our printers also have full ISO 14001 environmental accreditation, which ensures that they have effective procedures in place to manage waste and practices that may affect the environment.

£10.00
9 781786 040527
ISBN 978-1-78604-052-7
Design and Production by NAO External Relations DP Ref: 11104-001