theoretical evaluation of r22 and r502 alternatives · theoretical evaluation of r22 and r502...
TRANSCRIPT

DOE/CE/23810-7
THEORETICAL EVALUATION OF R22 AND R502 ALTERNATIVES
Final Report
Piotr A. Domanski and David A. Didion
Building Environment DivisionNational Institute of Standards and Technology
U.S. Department of CommerceGaithersburg, Maryland 20899
January 1993
Prepared forThe Air-Conditioning and Refrigeration Technology Institute
UnderARTI MCLR Project Number 650-50900
This research project is supported in whole or in part, by U.S. Department of Energy grant number DE-FG02-91CE23810: MaterialsCompatibility and Lubricants Research (MCLR) on CFC-Refrigerant Substitutes. Federal funding supporting this project constitutes 93.67% ofallowable costs. Funding from non-government sources supporting this project consists of direct cost sharing of 6.33% of allowable costs; andin-kind contributions from the air-conditioning and refrigeration industry.

DISCLAIMER
The U.S. Department of Energy's and the air-conditioning industry's support for theMaterials Compatibility and Lubricants Research (MCLR) program does not constitute anendorsement by the U.S. Department of Energy, nor by the air-conditioning andrefrigeration industry, of the views expressed herein.
NOTICE
This report was prepared on account of work sponsored by the United States Government.Neither the United States Government, nor the Department of Energy, nor theAir-Conditioning and Refrigeration Technology Institute, nor any of their employees, norof any of their contractors, subcontractors, or their employees, makes any warranty,expressed or implied, or assumes any legal liability or responsibility for the accuracy,completeness, or usefulness of any information, apparatus, product or process disclosedor represents that its use would not infringe privately-owned rights.
COPYRIGHT NOTICE(for journal publication submissions)
By acceptance of this article, the publisher and/or recipient acknowledges the right of theU.S. Government and the Air-Conditioning and Refrigeration Technology Institutes, Inc.(ARTI) to retain a nonexclusive, royalty-free license in and to any copyrights coveringthis paper.
ARTI MCLR Project Number 650-50900
THEORETICAL EVALUATION OF R22 AND R502 ALTERNATIVES
Piotr A. Domanski and David A. Didion
ABSTRACT
The report presents the performance evaluation of nine R22 alternatives and three
R502 alternatives. The study was conducted using a semi-theoretical model, CYCLE-11,
with a pure cross-flow representation of heat transfer in the evaporator and condenser.
The Carnahan-Starling-DeSantis equation of state was used for calculating thermodynamic
properties. Transport properties were not involved in the simulations.
Simulations were conducted for “drop-in” performance, for performance in a
modified system to assess the fluids' potentials, and for performance in a modified
system equipped with a liquid-line/suction-line heat exchanger. The results - presented
on a relative basis to R22 and R502 performance - include the volumetric capacity,
coefficient of performance, pressure increase across the compressor, and compressor
discharge pressure and temperature.
SCOPE
The evaluation of nine R22 alternative fluids was performed at two cooling and
two heating operating conditions that represent 35.0°C (95°F), 27.8°C (82°F), 8.3°C
(47°F), and -8.3 (17°F) temperature rating points for a residential heat pump [1]. The
R22 alternatives considered in this study are: R32/125 (60/40), R32/125/134a/290
(20/55/20/5), R32/125/134a (10/70/20) and (30/10/60), R290, R32/227ea (35/65), R32/134a
(25/75) and (30/70), and R134a.
Three R502 alternatives were evaluated at one operating condition typical for
commercial refrigeration installations. The heat-transfer-fluid temperature entering
the evaporator and condenser was -23.3°C (-10°F) and 35°C (95°F), respectively. The
evaluated R502 alternatives are: R32/125/143a (10/45/45), R125/143a (45/55), and
R125/143a/134a (44/52/4).
This study is restricted to the thermodynamic merits only and does not concern
itself with other attributes like transport properties, toxicity, and flammability. The
pure cross-flow representation of the evaporator and condenser used in these
simulations makes the results of this study most applicable to systems equipped with
cross-flow heat exchangers.
This is the only and final report covering the study performed.
1

Figure 1. Impact of critical temperature on cycle performance.
2
SIGNIFICANT RESULTS
INTRODUCTION
Due to an implication in the destruction of the stratospheric ozone layer,
chlorine-containing refrigerants are scheduled for phase-out by the Montreal Protocol
and subsequent regional regulations. Chlorofluorocarbons (CFCs), which are
characterized by a high ozone depletion potential (ODP), are slated for complete
production phase-out in the United States by the end of 1995. For
hydrochlorofluorocarbons (HCFCs), the 1992 revision of the Montreal Protocol stipulates
the first production ceiling for the year 1996 and the final elimination in 2030.
In response to the phase-out regulations, the Air-Conditioning and Refrigeration
Institute (ARI) established the Alternative Refrigerants Evaluation Program (AREP) to
pool together efforts of ARI member companies in search of alternative fluids for R22
(HCFC-22) and azeotropic mixture R502 (48.8% HCFC-22 and 52.2% CFC-115). The objective
of this report is to provide a computer evaluation of alternative refrigerants and
refrigerant mixtures. This evaluation is restricted to thermodynamic merits only and
does not concern itself with other attributes like transport properties, toxicity, or
flammability.
Impact of Fluid Properties on System Performance - General Remarks
To better understand the results presented in this report, let's briefly recite why
different fluids exhibit different performance in a given application. The reason lies
in their different thermodynamic and transport properties. Although all properties are
important, some are more important than others.
In the thermodynamic properties category, the most important parameters are the normal
boiling point temperature - or related to it critical temperature (Tcr) - and heat
capacity. Figure 1 depicts the impact of the critical temperature by

Figure 2. Impact of heat capacity on refrigeration cycle
showing a reversed Rankine cycle realized by two different fluids. The more volatile
fluid (lower Tcr) starts evaporation at a higher vapor quality and has a larger
superheated vapor horn - both attributes contribute to a lower coefficient of
performance (COP). However, this refrigerant will have a higher volumetric capacity
(Qvo1) since a lower critical temperature results in a higher pressure at the compressor
inlet. Thus, the trade-off between the COP and volumetric capacity is unavoidable; a
fluid that exceeds another fluid in volumetric capacity will most likely have a lower
COP. It may be noted that differences in volumetric capacity are much sharper than
differences in the COP.
Heat capacity affects performance profoundly through its impact on the outline of the
two-phase dome. A refrigerant with a high heat capacity has its two-phase
Figure 3. Impact of liquid thermal Figure 4. Impact of liquid viscosity
conductivity on performance of air-to- on performance of air-to-air heat pump
air heat pump3

dome skewed to the right, which may result in significant flashing losses and
undesirable “wet compression”, as showed in Figure 2. A cycle with a liquid-
line/suction-line heat exchanger (llsl-hx) - shown by a thin line on the diagram for
high-heat-capacity fluid - is relieved from these undesirable conditions and may have a
better COP than a basic reverse Rankine cycle [2].
The impact of transport properties will vary with the heat exchanger effectiveness,
heat transfer surfaces, and with a heat transfer resistance on the side of heat
transfer fluids (HTFs). For an air-to-air heat pump charged with R22 and employing a
smooth-tube evaporator and condenser, liquid thermal conductivity and viscosity were
found to be most influential, as showed in Figures 3 and 4 taken from reference [3].
These figures are provided only to allow estimation of the influence of liquid thermal
conductivity and viscosity; transport properties are not involved in the following
performance evaluations.
Performance Comparison Methods: “Drop-In” vs. Equal Heat Exchanger Loading
We have to distinguish between two basic methods for performance comparison of
different fluids:
1. “drop-in” evaluation, and
2. evaluation at a constant heat exchanger loading.
In the “drop-in” method, a new refrigerant is evaluated in a machine designed for the
original refrigerant (the expansion device may be modified to assure the same
subcooling at the condenser outlet). This is a typical first-cut test performed in a
laboratory. “Drop-in” testing, although telling us the performance we may expect in a
given machine, does not give us a fair comparison between the fluids. This lack of
objectivity results from the changed system capacity when the same system is charged
with refrigerants having different volumetric capacities. Different system capacities
cause different heat fluxes through the evaporator and condenser resulting in different
temperatures in the condenser and the evaporator for transfer of heat to/from the heat
transfer fluids, if the heat exchangers remain the same, as is assumed.
The second, more objective comparison methodology (McLinden and Radermacher [4])
requires a constant ratio of capacity to the total heat transfer area (evaporator plus
condenser) for all the fluids analyzed. This requirement - difficult to implement in
laboratory testing but easy to impose in computer simulations - assures the same heat
exchanger area loading despite differences in volumetric capacity between refrigerants
studied.
The second approach is more objective; however, “drop-in” applications are also of
interest. Since both approaches have their merits, this study includes both “drop-in”
simulations and simulations in modified equipment at the same heat flux through the
evaporator and condenser.
4

Modeling Tools
Three semi-theoretical cycle models, derived from CYCLE-11 (5) and described in
Appendix B, were used to perform simulations. The models do not include transport
properties; they carry the implicit assumption that transport properties (and the
overall heat transfer coefficients) are the same for the fluids studied. With the
understanding of the assumptions involved, our confidence in the CYCLE-11 programs was
established through various joint laboratory/simulation projects, e.g. the study of
R22, R32/134a, and R32/152a [6].
Thermodynamic properties are represented in the cycle models through the Carnahan-
Starling-DeSantis (CSD) equation of state, as implemented in the REFPROP package [7].
Not all pure fluids considered in this study and their interaction coefficients are
included in REFPROP. The needed data for fluids not covered by REFPROP were obtained
from G. Morrison [8].
It has to be noted that the CSD equation of state does not accurately represent highly
polar fluids like R32, which is included in this report. The CSD equation of state was
the only option available to us. A new REFPROP version based on the Carnahan-
Starling-DeSantis-Morrison (CSDM) equation of state [9] - a CSD successor that can
handle polar refrigerants - did not cover all the needed fluids at the time of this
study.
EVALUATION OF R22 ALTERNATIVES
R22 alternatives were evaluated at conditions approximating two cooling and
heating rating points for residential heat pumps [1]. These conditions, represented by
temperatures of the heat transfer fluids (air), are shown in Table 1. R22 alternative
fluids considered in this study are shown in Table 2. The thermodynamic data included
in Table 2 were obtained from REFPROP. Refrigerant 22 - specified as fluid number 0 -
was used for reference purposes in presenting the simulation results.
“Drop-In” Evaluation
(Unchanged System, Constant Heat Exchangers)
“Drop-in” simulations were performed using CYCLE-11.UA, which requires selecting
(pre-coding) a system to be simulated, similar to “drop-in” tests in a laboratory where
a certain heat pump has to be selected for testing. In the case of CYCLE-11.UA, a
compressor, condenser and evaporator must be designated.
A physical description of the compressor is needed, which, at the minimum, requires the
compressor swept volume and RPM as input. From two options available for the compressor
simulation, a more detailed representation of a hermetic compressor was selected for
“drop-in” runs, which required specification of the electric motor efficiency,
polytropic efficiency, and pressure drop and heat transfer parameters for the processes
taking place between four key locations within a hermetic compressor [Appendix B]. The
values for these parameters were selected to obtain pressure drop and temperature
change typical
5
R22 R502
Cooling Heating Refrigerating
°C(°F)
°C(°F)
°C(°F)
°C(°F)
°C(°F)
Condenser Inlet35.0(95)
27.8(82)
21.1(70)
21.1(70)
35(95)
Condenser Outlet43.2(110)
37.4(99.3)
32.5(90.5)
28.1(82.6)
40.6(105)
Evaporator Inlet26.7(80)
26.7(80)
8.3(47)
-8.3(17)
-23.3(-10)
Evaporator Outlet14.4(58)
13.8(56.8)
2.7(36.9)
-11.3(11.7)
-27.2(-17)
Table 1. Inlet and Outlet Temperatures of Heat Transfer Fluid (Air) used forEvaluating R22 and R502 Alternatives
for R22 at a 35°C (95°F) temperature test. The value of 0.9 was selected for both the
electric motor efficiency and polytropic efficiency. The chosen values for the two
efficiencies and pressure and heat loss parameters resulted in an overall “black-box”
polytropic efficiency of approximately 0.7.
The evaporator and condenser were simulated as pure cross-flow heat exchangers, and
were represented by their respective overall conductances, UAe and UAc. The values for
UAe and UAc were selected such that 7.8°C (46°F) and 46.1°C (115°F) refrigerant
saturation temperatures at the evaporator and condenser outlet, respectively, were
obtained at R22 simulations at the 35°C (95°F) test condition. Additionally, the
following parameters were imposed as constants in all simulation runs:
• zero degree of vapor superheat at the evaporator outlet,
• zero degree of liquid subcooling at the condenser outlet,
• 34.5 kPa (5 psi) pressure drop in the evaporator,
• 34.5 kPa (5 psi) pressure drop in the condenser.
Once a heat pump was defined, simulations were performed at four operating conditions
listed in Table 1. Note that the assumption of the constant temperature profile of air
in "drop-in" simulations implies different mass flow of air, depending on the capacity
of the system charged with a particular refrigerant. The impact of a resulting changes
in the air-side heat transfer coefficient and fan powers are not considered by the
simulation model.
Five indicators of performance were selected for presenting the simulation results:
capacity, COP, pressure increase across the compressor, compressor discharge pressure,
and compressor discharge temperature. All results are presented on a relative scale
with respect to performance of R22.
6
Table 2. R22 Alternative Fluids Considered in the Study
Tdew point(1) Tglide
(2) Tcr(3)
RefrigerantWeight
Composition%
°C °F °C °F °C °F
Molecularweightkg/kmol
0 R22 100 -40.9 -41.6 0 0 96.2 205.1 86.47
1 R32/125 60/40 -53.1 -63.5 0 0 84.0 183.1 67.27
2 R32/125/134a/290 20/55/20/5 -45.2 -49.4 8.5 15.4 80.3 176.5 86.80
3 R32/125/134a 10/70/20 -42.4 -45.1 5.4 9.7 83.5 182.2 102.94
4 R290 100 -40.0 -40.0 0 0 96.7 206.0 44.10
5 R32/125/134a 30/10/60 -36.0 -32.8 7.6 13.7 97.4 207.3 80.13
6 R32/227ea 35/65 -35.3 -31.5 20.6 37.2 75.3 167.5 94.78
7 R32/134a 30/70 -34.4 -30.0 7.3 13.1 100.0 212.1 79.19
8 R32/134a 25/75 -33.1 -27.6 7.0 12.6 101.4 214.6 82.26
9 R134a 100 -26.2 -15.1 0 0 101.2 214.1 102.03
(1)atmospheric pressure(2)Tglide = Tdew point - Tbubble point(3)REFPROP estimates
7

Figure 5. Volumetric capacity for "drop-in" simulations
Figure 5 shows a difference in capacity between candidate fluids and R22 divided by the
capacity of R22. The four bars shown for each fluid represent results at four operating
conditions denoted on the figure by the temperature of air entering what would be the
outdoor coil - a customary designation of operating conditions for residential heat
pumps.
The results are consistent with basic expectations relating volumetric capacity to
refrigerant pressure. The highest pressure fluid, R32/R125 mixture (#1), has the
highest capacity, while the lowest pressure fluid, R134a (#9) , has the lowest
capacity. The range of capacity difference for the screened fluids with respect to R22
is almost ±50 percent.
Figure 6 shows a difference in COPs on a relative basis. If we imposed this figure over
Figure 5, we could notice that refrigerants having a lower capacity display a higher
COP than R22. We may notice that the difference in COP is not as large as the
difference in capacity; in the extreme cases the COP difference does not exceed ±20percent.
Figure 7 presents the difference in pressure increase across the compressor between the
candidate fluids and R22 divided by the value for R22. The results presented in this
figure are indicative of the forces carried by the compressor bearings. A general trend
in Figure 7 is consistent with the trend displayed in Figure 5: higher capacity fluids
exhibit a higher pressure increase across the compressor because they operate at higher
reduced temperatures, at which dP/dT gradient at saturation is greater. We can observe
the same pattern in Figure 8, which shows the difference in discharge pressures.
Significant differences for high pressure fluids with respect to R22 [for example, over
1200 kPa (174 psi) for fluid #1] indicate possible safety problems if those fluids are
tested in unmodified R22 equipment.
8

Figure 6. Coefficient of Performance for “drop-in” simulations
Figure 9 displays a difference between compressor discharge temperature for candidate
fluids and R22. This information is useful in the consideration of lubricant and
refrigerant stability. Except for fluid #1, all remaining refrigerants had a lower
discharge temperature than R22.
In addition to the above simulation results, it is of interest to examine the average
temperature in the evaporator since this temperature is a measure of the
dehumidification capability of the fluid considered. As shown in Figure 10,
Figure 7. Pressure increase across compressor for “drop-in” simulations
9

Figure 8. Compressor discharge pressure for “drop-in” simulations
temperatures different from R22 were observed - from a high pressure R32/R125 mixture
having the lowest average temperature to a pure R134a having the highest average
temperature, exceeding 10°C (50°F).
“Drop-in”, constant-heat-exchanger-area simulations provide us with information
concerning “drop-in” performance; however, these simulations do not facilitate an
objective comparison. For example, a lower-pressure, lower-capacity fluid (like R134a)
will work at a smaller temperature difference between the condenser
Figure 9. Compressor discharge temperature for “drop-in” simulations
10
Figure 10. Average refrigerant temperature in the evaporator for “drop-in”
simulations
and evaporator than R22 (because less heat has to be transferred). This results in a
yet lower capacity and higher COP; i.e., a constant-heat-exchanger evaluation
amplifies the fundamental trade-off between capacity and COP discussed at the
beginning of this paper. The opposite COP vs. capacity trend can be noted for higher
pressure fluids - with an important distinction that higher evaporator temperatures
for lower pressure fluids may result in loss of latent capacity.
Evaluation at Constant Heat Exchangers Loading
(Modified Systems)
The objective of a second round of simulations was to provide a fair performance
comparison between the alternative fluids. In contrast to the “drop-in” simulations
where performance of all candidates was simulated using one heat pump, in these
simulations a different heat pump was selected (coded) for each refrigerant to
simultaneously satisfy the following two constraints at the cooling 35°C (95°F)
condition:
The first constraint assures the same loading of the heat transfer area for each
refrigerant. This constraint alone can be satisfied by an infinite number of possible
distributions of the heat transfer area between the evaporator and condenser. The
second constraint removes this degree of freedom by requiring a specific size of
evaporator (represented by UAe.) so a predefined value of the average temperature in
the evaporator, Te,ave, is achieved.
11

Figure 11. Volumetric capacity for modified systems
12
Simulations were performed first for R22 at all four operating conditions using the
CYCLE-11.UA model. The same thermodynamic cycle assumptions were used as for “drop-in”
simulations with a difference in representation of the compressor. The pressure drop
and heat loses where lumped together in a lower value of polytropic efficiency ηp=O.75,
while the efficiency of electric motor was left unchanged at ηe=0.9.
Once UAe+UAc, Qe, and Te,ave were obtained for R22 from simulation at the 35°C (95°F)
condition, a modified system for each candidate fluid was devised that satisfied the
outlined criteria. This could have been done using CYCLE-11.UA through iterative
selection of UAe and UAc at a given, unchanged size of the compressor. In practice, UAeand UAc were selected using another model from the CYCLE-11 family, CYCLE-11.UADT
(explained Appendix B), which explicitly provided the information required. Once UA
values were established at the 35°C (95°F) condition for each candidate refrigerant
(corresponds to selection of modified systems), simulations at the remaining three test
conditions were performed using CYCLE-11.UA.
The simulation results for modified systems are presented in Figures 11 through 15. The
results for volumetric capacity shown in Figure 11 are representative of the change in
compressor displacement required to attain the capacity of R22. Compared to the results
obtained for “drop-in” simulations, capacity differences are larger for modified
systems (Figure 11) than for the “drop-in” evaluation (Figure 5). For example, high
capacity refrigerant #1, which exceeded R22 in the “drop-in” evaluation on average by
40%, exceeded R22 in a modified system by over 50%. Also, a larger difference - in the
opposite direction - is observed for low capacity R134a (#5). This is understood
because the first constraint requires more heat transfer area for a higher capacity
fluid, and a larger heat transfer area causes a lower temperature lift. This leads to
an even higher capacity for

Figure 12. Coefficient of Performance for modified systems
a high capacity refrigerant, such as the R32/R125 mixture (#1). The opposite is true
for lower capacity refrigerants.
The constant-heat-exchangers-loading criterium also affects the COP. Higher capacity
refrigerants attained improved COPS, while lower capacity refrigerants attained lower
COPs than found in the “drop-in” simulations. Consequently, the COPs obtained are less
different between fluids, as is shown in Figure 12.
Figure 13. Pressure increase across compressor for modified systems
13
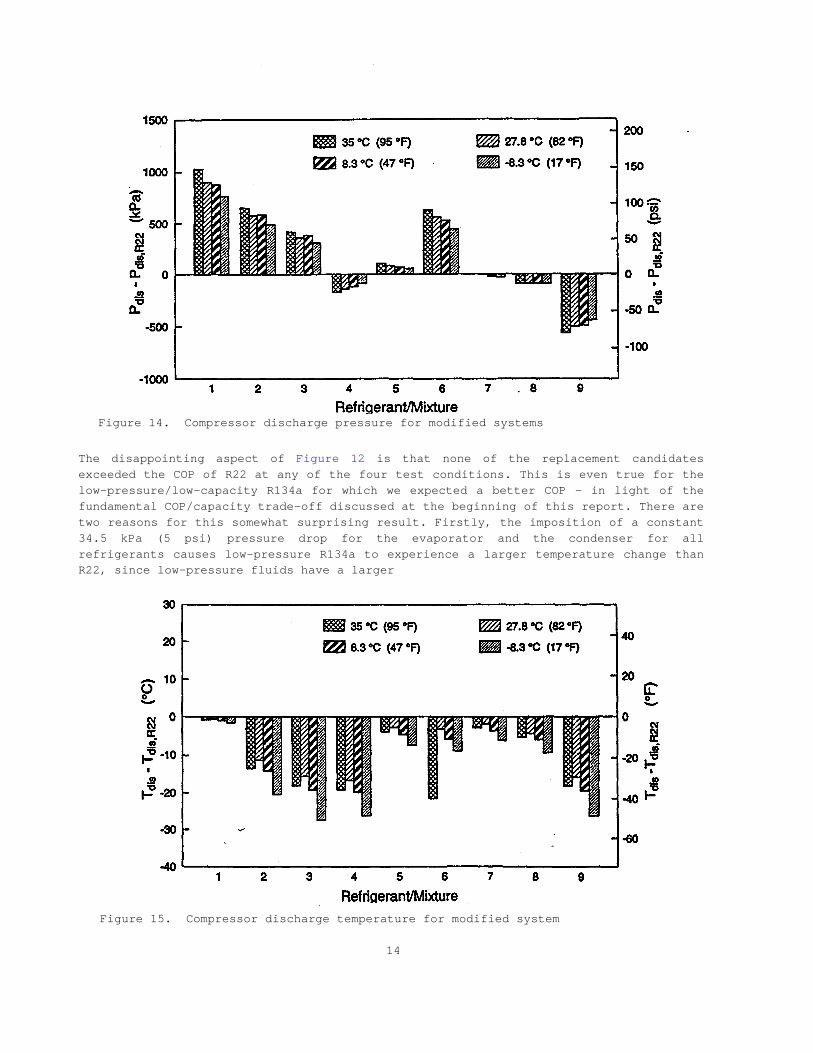
Figure 15. Compressor discharge temperature for modified system
14
Figure 14. Compressor discharge pressure for modified systems
The disappointing aspect of Figure 12 is that none of the replacement candidates
exceeded the COP of R22 at any of the four test conditions. This is even true for the
low-pressure/low-capacity R134a for which we expected a better COP - in light of the
fundamental COP/capacity trade-off discussed at the beginning of this report. There are
two reasons for this somewhat surprising result. Firstly, the imposition of a constant
34.5 kPa (5 psi) pressure drop for the evaporator and the condenser for all
refrigerants causes low-pressure R134a to experience a larger temperature change than
R22, since low-pressure fluids have a larger
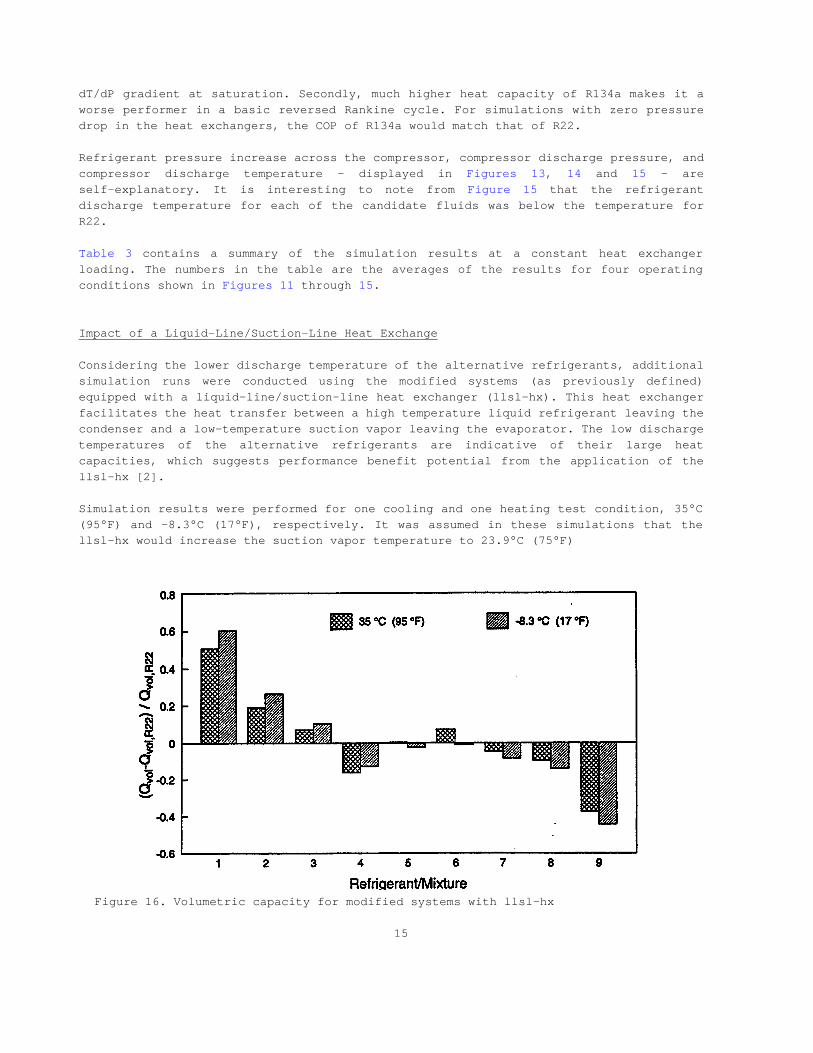
Figure 16. Volumetric capacity for modified systems with llsl-hx
15
dT/dP gradient at saturation. Secondly, much higher heat capacity of R134a makes it a
worse performer in a basic reversed Rankine cycle. For simulations with zero pressure
drop in the heat exchangers, the COP of R134a would match that of R22.
Refrigerant pressure increase across the compressor, compressor discharge pressure, and
compressor discharge temperature - displayed in Figures 13, 14 and 15 - are
self-explanatory. It is interesting to note from Figure 15 that the refrigerant
discharge temperature for each of the candidate fluids was below the temperature for
R22.
Table 3 contains a summary of the simulation results at a constant heat exchanger
loading. The numbers in the table are the averages of the results for four operating
conditions shown in Figures 11 through 15.
Impact of a Liquid-Line/Suction-Line Heat Exchange
Considering the lower discharge temperature of the alternative refrigerants, additional
simulation runs were conducted using the modified systems (as previously defined)
equipped with a liquid-line/suction-line heat exchanger (llsl-hx). This heat exchanger
facilitates the heat transfer between a high temperature liquid refrigerant leaving the
condenser and a low-temperature suction vapor leaving the evaporator. The low discharge
temperatures of the alternative refrigerants are indicative of their large heat
capacities, which suggests performance benefit potential from the application of the
llsl-hx [2].
Simulation results were performed for one cooling and one heating test condition, 35°C
(95°F) and -8.3°C (17°F), respectively. It was assumed in these simulations that the
llsl-hx would increase the suction vapor temperature to 23.9°C (75°F)

Pdis - Pdis,R22 Tdis - Tdis,R22Refrigerant
WeightComposition
%
COPCOPR22
QvolQvol,R22
∆P∆PR22 kPa psi °C °F
1 R32/125 60/40 0.97 1.55 1.55 845 130 -1 -2
2 R32/125/134a/290 20/55/20/5 0.93 1.18 1.37 572 83 -15 -27
3 R32/125/134a 10/70/20 0.93 1.04 1.25 364 53 -20 -36
4 R290 100 0.94 0.83 0.90 -134 -19 -21 -37
5 R32/125/134a 30/10/60 0.98 0.98 1.09 77 11 -5 -8
6 R32/227ea 35/65 0.84 1.03 1.44 568 82 -6 -10
7 R32/134a 30/70 0.99 0.93 1.03 -15 -2 -4 -6
8 R32/134a 25/75 0.99 0.88 0.98 -92 -13 -6 -10
9 R134a 100 0.98 0.59 0.72 -498 -72 -20 -36
Table 3. Summary(1) of Simulation Results for R22 Alternatives at Constant Heat
(1)the averages of the results for the four operating conditions presented in Figures 11 through 15
16
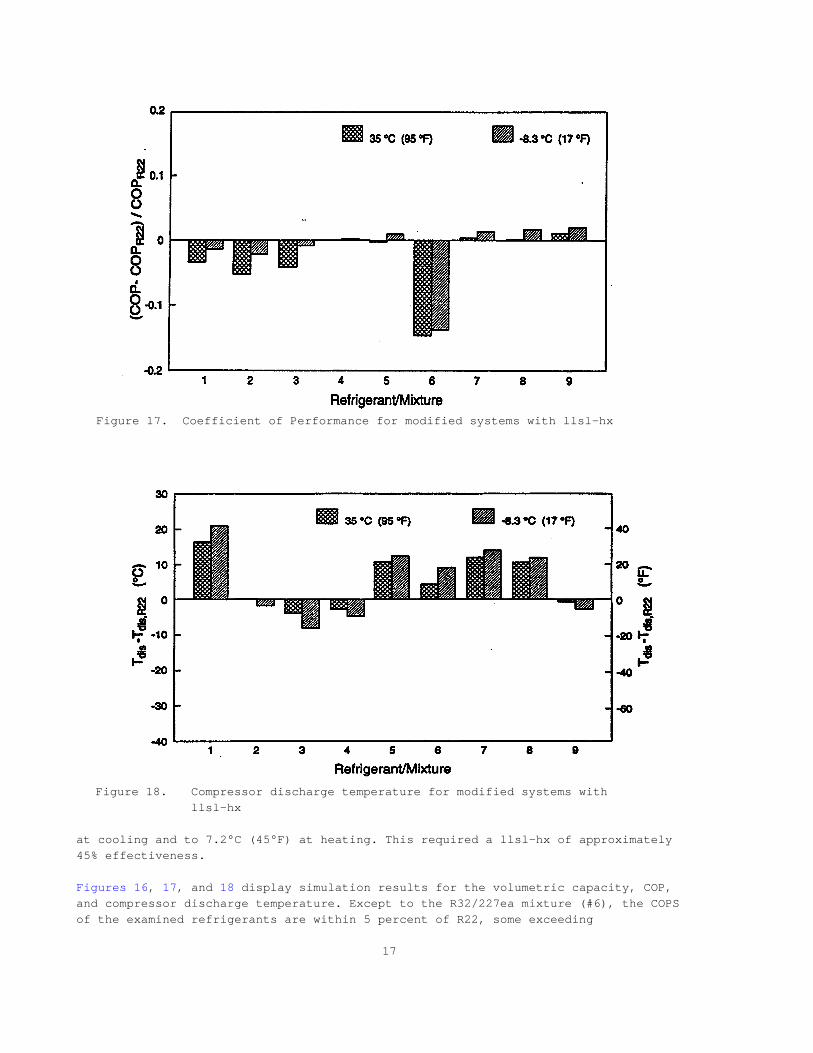
Figure 17. Coefficient of Performance for modified systems with llsl-hx
Figure 18. Compressor discharge temperature for modified systems with
llsl-hx
at cooling and to 7.2°C (45°F) at heating. This required a llsl-hx of approximately
45% effectiveness.
Figures 16, 17, and 18 display simulation results for the volumetric capacity, COP,
and compressor discharge temperature. Except to the R32/227ea mixture (#6), the COPS
of the examined refrigerants are within 5 percent of R22, some exceeding
17

Figure 19. Relative performance of R502 alternative mixtures
18
the COP of R22 (R22 did not benefit from the llsl-hx application). It is interesting to
note that the discharge temperatures (Figure 18) are not excessive. This suggests that
utilization of the llsl-hx may be warranted for some of the alternative refrigerants.
EVALUATION OF R502 ALTERNATIVES
A popular application for R502 [R22/115 (48.8/51.2)] is in commercial
refrigeration. Three refrigerant mixtures, specified in Table 4, were evaluated as
alternatives for R502 at conditions shown in Table 1.
Evaluation of R502 alternatives consisted of the same three types of simulations
as performed for R22 alternatives:
(1) “drop-in” simulations in a R502 unchanged system,
(2) simulations in modified systems to assure the same loading of the
heat exchanger area, and
(3) simulations in modified systems at the same heat exchanger loading
and with a liquid-line/suction-line heat exchanger.
All simulations were performed with a pure cross-flow evaporator and condenser imposing
34.5 kPa (5 psi) pressure drop for each fluid. Zero degree of subcooling and superheat
at the condenser outlet and evaporator inlet, respectively, were assumed. Simulations
utilizing the llsl-hx were performed with 70°C (158°F) vapor entering the compressor.
Figure 19 presents simulation results for the three simulation series for a
relative volumetric capacity, (Qvol-Qvol,R502)/Qvol,R502, a relative Coefficient of
Performance, (COP-COPR502)/COP502, and relative difference between the compressor

discharge and suction pressures, (∆P-∆PR502)/∆PR502, where ∆P is the difference betweenthe compressor discharge and suction pressures for a given fluid. The figure shows that
the volumetric capacity of mixture (1) exceeds that of R502, while capacity of mixture
(2) and (3) is lower if llsl-hx is not employed. Each of the candidate mixtures have a
lower COP by a few percents, and have a larger than R502 pressure increase across the
compressor by approximately 18% for mixture (1), 12% for mixture (2), and 9% for
mixture (3). Also, compressor discharge pressures are higher for the studied
alternatives, but compressor discharge temperatures are lower than that for R502. A low
discharge temperature of the alternative fluids is very important since R502 has been
used in applications in which R22 would have too high temperature in the compressor.
The summary of the simulation results at a constant heat exchanger loading is presented
in Table 5.
CONCLUDING REMARKS
The presented simulation results describe performance of candidate fluids based on the
thermodynamic properties. Two basic evaluation approaches were used. The first approach
used was the “drop-in” evaluation. The simulation results obtained from this evaluation
predict the performance of the candidate refrigerants in a system designed for the
original refrigerant - with a possible modification of the expansion device (the same
subcooling (zero) at the condenser outlet was assumed at simulations).
The second approach, the constant-heat-exchanger-loading evaluation, provides more
objective information on the performance potential of the fluids screened. The
simulation results obtained with this approach correspond to a test in a system
modified specifically for each refrigerant to obtain the same heat flux through the
evaporator and condenser at the design rating point. This simulation constraint assures
that the condenser and evaporator pressures are not affected by the different
volumetric capacities of the refrigerants studied. In general, higher pressure fluids
demonstrated a higher volumetric capacity and a lower COP. A strong exception was the
high-glide R32/227ea mixture, of which the performance was penalized by use of pure
cross-flow heat exchangers.
Supplementary simulations were performed for the constant-heat-exchanger-loading
constraint applying the liquid-line/suction-line heat exchanger. This simulations show
that using the llsl-hx may be warranted for some of the candidate fluids.
Several assumption were used in these simulations, and it is important to have them in
mind when analyzing the results. The simulations did not involve transport properties
and carry the implicit assumption of the same overall heat transfer coefficient.
Algorithms for transport properties for most of the fluids were not available in a form
suitable for simulation at the time of the study. Only at the time of finishing up this
report, we could compile the values for liquid thermal conductivity and viscosity (the
most influential transport properties), and these are given in Appendix C. These
values, in conjunction with Figures 3 and 4, may be used to estimate if a given
candidate fluid offers more promise than is indicated by the simulation results.
19

(1)at atmospheric pressure(2)Tglide = Tdew point - Tbubble point(3)REFPROP estimates
Table 5. Summary of Simulation Results for R502 Alternatives at Constant Heat Exchanger Loading
Table 4. R502 Alternative Fluids Considered in the Study
Tdew point(1) Tglide
(2) Tcr(3)
RefrigerantWeight comp
%°C °F °C °F °C °F
Molecularweightkg/kmol
0 R502 [R22/115] 48.8/51.2 -45.4 -49.7 0 0 82.2 179.9 111.63
1 R32/125/143a 10/45/45 -48.8 -55.8 0.5 0.9 82.8 181.0 90.70
2 R125/143a 45/55 -48.1 -54.6 0 0 78.7 173.7 100.24
3 R125/143a/134a 44/52/4 -46.7 -52.0 0.9 1.6 79.9 175.8 97.61
Pdis - Pdis,R502 Tdis - Tdis,R502Refrigerant
Weight comp%
COPCOPR502
QvolQvol,R502
∆P∆PR502 kPa psi °C °F
1 R32/125/143a 10/45/45 0.97 1.13 1.18 323 47 -4 -7
2 R125/143a 45/55 0.93 0.94 1.12 206 30 -12 -22
3 R125/143a/134a 44/52/4 0.93 0.92 1.09 164 24 -11 -20
20
Transport properties may also be used to explain the difference between the simulated
COP of propane (lower than that for R22) and the experimental COP reported by
Treadwell [10] (higher than the COP for R22). Propane's thermal conductivity of liquid
and vapor is somewhat better than that of R22; however, it can be estimated that a
significantly better, almost 50 lower, liquid viscosity of propane is responsible for
approximately 4.5 percent of difference in the coefficient of performance.
Among other assumptions imposed during simulations, it is important to remember that
the evaporator and condenser were represented as pure cross-flow heat exchangers. This
implies that the simulations were conservative for zeotropic mixtures if application
of counter-flow evaporator and condenser is anticipated; on the other hand, the
simulation results are too optimistic for a system using flooded shell-and-tube heat
exchangers.
COMPLIANCE WITH AGREEMENT
This report complies fully with the contract agreement.
PRINCIPAL INVESTIGATORS EFFORT
This study was carried out by the principal investigators with 80 percent of the effort
contributed by P.A. Domanski and 20 percent by D.A. Didion.
REFERENCES
1. CFR, Code of Federal Regulations, Title 10, Part 430, Washington, DC, 1992.
2. Domanski, P.A., Didion, D.A., and Doyle, J.P., “Evaluation of Suction Line -
Liquid Line Heat Exchange in the Refrigeration Cycle”, Proceedings of 1992 Int.
Refrig. Conf. - Energy Efficiency and New Refrigerants, Purdue Univ., West
Lafayette, IN, July 14-17, 1992.
3. Domanski, P.A., and Didion, D.A., “Impact of Refrigerant Property Uncertainties on
Prediction of Vapor Compression Cycle Performance”, NBSIR 86-3373, National
Institute of Standards and Technology, Gaithersburg, MD, December 1987.
4. McLinden, M.O. and Radermacher, R., “Methods for comparing the performance of pure
and mixed refrigerants in the vapour compression cycle”, Int. J. Refrig., Vol. 10,
p. 318, November 1987.
5. Domanski, P.A. and McLinden, M.O., “A simplified cycle simulation model for the
performance rating of refrigerants and refrigerant mixtures”, Int. J. Refrig.,
Vol. 15, No. 2, 1992.
6. Pannock, J., Didion, D.A., and Radermacher, R., “Performance Evaluation of
Chlorine Free Zeotropic Mixtures in Heat Pumps - Computer Study and Tests”,
Proceeding of 1992 Int. Refrig. Conf. - Energy Efficiency and New Refrigerants,
Purdue Univ., West Lafayette, IN, July 14-17, 1992.
7. Gallager, J., McLinden, M.O., Morrison, G., Huber, M., and Ely, J., NIST
Thermodynamic Properties of Refrigerants and Refrigerant Mixtures Database
(REFPROP, Version 3.0), NIST Standard Data Base 23, National Institute of
Standards and Technology, Gaithersburg, MD, 1992.
21

22
8. Morrison, G., private communications, National Institute of Standards and
Technology, Gaithersburg, MD, 1992.
9. Moldover, M., “An Improved CSD-type Equation of State for Polar Fluids”,
Presentation at the 1992 Int. Refrig. Conf. - Energy Efficiency and New
Refrigerants, Purdue Univ., West Lafayette, IN, July 14-17, 1992.
10. Treadwell, D., “Application of Propane (R290) to a Single Packaged Unitary
Air-Conditioning Product”, Proceedings of the CFC and Halon Alternatives
Conference, p. 348, December 3-5, Baltimore, MD, 1991.

APPENDIX A
NOMENCLATURE
COP - coefficient of performance
Cp - heat capacity at constant pressure
P - pressure
∆P = Pdis - PsucQ - capacity
Qvol = Q/v1 volumetric capacity
T - temperature
V1 - specific volume at compressor inlet (see Figure B1)
Subscripts:
ave - average
c - condenser
cr - critical (for pure fluids) or pseudocritical (for mixtures)
dis - at compressor discharge
e - evaporator
suc - at compressor suction
A-1

Figure B1. Schematic of a heat pump
with a llsl-hx
Figure B2. Temperature-entropy diagram
for a heat pump with llsl-hx
working with zeotropic blend
B-1
APPENDIX B
DESCRIPTION OF CYCLE-11 SIMULATION MODELS
The original CYCLE-11 model (later referred to as CYCLE-11.DT) is described in [5]. It
identifies from 5 up to 11 key locations in a refrigeration system; the eleven-point
cycle is applicable if a four-point representation of the compressor and a
liquid-line/suction-line heat exchanger are used, as shown in Figures A1 and A2. In the
four-point simulation of the compressor, heat transfer and pressure drop at the suction
and discharge valves (locations 1-2 and 3-4) can be accounted for by assigning heat
loss and pressure drop parameters, as opposed to a “black box” approach where these
losses can be lumped together within an overall compressor efficiency.
CYCLE-11 models perform simulations at specified inlet and outlet temperatures of the
heat transfer fluids (HTFs) at the evaporator and condenser. In CYCLE-11.DT, the
evaporator and condenser are represented by temperature differences between refrigerant
and HTF, ∆Te and ∆Tc which are input data. Thus, ∆Te and ∆Tc have to be known, and thisis not always the case if simulations are to be performed at different operating
conditions (∆Te and ∆Tc change since capacity changes with operating conditions).
CYCLE-11.UA relieves us from the need of knowing ∆Te and ∆Tc at all conditions. Theevaporator and condenser are represented by the product of their overall heat transfer
coefficient and area, UAe and UAc, which are the input instead of ∆Te and ∆Tc.
Regardless of different input requirements, CYCLE-11.UA is amenable to the same
convergence logic as CYCLE-11.DT. It is possible because, if we assume that the overall
heat transfer coefficient does not change with operating conditions, then UAe and UAcstay constant, and since

and capacity (Q) can be calculated from the refrigerant mass flow rate and enthalpy
change in the heat exchanger, ∆T can be calculated and the program will converge in thesame manner as in CYCLE-11.DT.
Still another version, CYCLE-11.UADT, was used in this study to explicitly obtain the
system performance at the 35°C (95°F) condition satisfying the following constraints:
The second constraint is synonymous with specifying the same ∆Te since each fluid
worked with the same temperature profile of the HTFs in the evaporator.
Considering that Q=UA·∆T, we may rearrange the first constraint as follows:
where Qc/Qe equals the ratio of refrigerant enthalpy change in the condenser and
evaporator. The Qc/Qe ratio varies between fluids because of their different outlines
of the two-phase dome, but can be calculated during simulation. Knowing Qc/Qe, ∆Te, andthe left side of the equation, the first constraint uniquely defines ∆Tc, which with∆Te as input allows converging to the solution in a similar way as the DT version ofCYCLE-11.
B-2
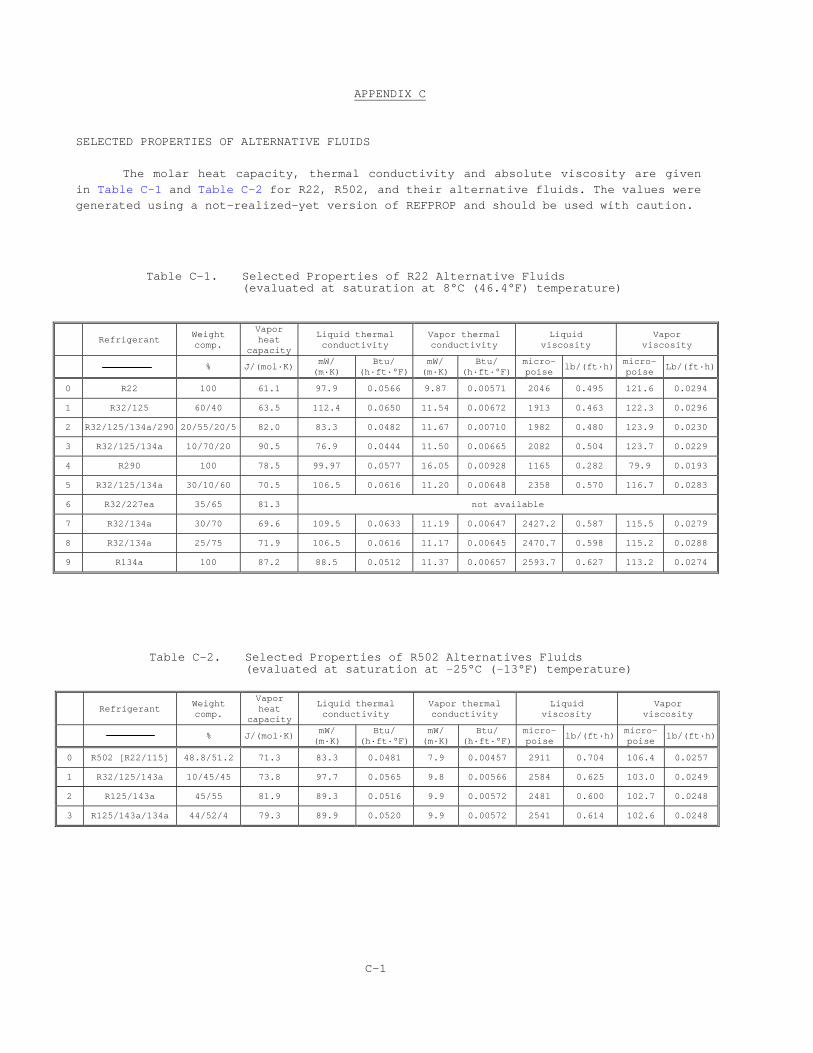
C-1
Table C-2. Selected Properties of R502 Alternatives Fluids(evaluated at saturation at -25°C (-13°F) temperature)
Table C-1. Selected Properties of R22 Alternative Fluids(evaluated at saturation at 8°C (46.4°F) temperature)
APPENDIX C
SELECTED PROPERTIES OF ALTERNATIVE FLUIDS
The molar heat capacity, thermal conductivity and absolute viscosity are given
in Table C-1 and Table C-2 for R22, R502, and their alternative fluids. The values were
generated using a not-realized-yet version of REFPROP and should be used with caution.
RefrigerantWeightcomp.
Vaporheat
capacity
Liquid thermalconductivity
Vapor thermalconductivity
Liquidviscosity
Vaporviscosity
% J/(mol·K)mW/
(m·K)Btu/
(h·ft·°F)mW/
(m·K)Btu/
(h·ft·°F)micro-poise
lb/(ft·h)micro-poise
Lb/(ft·h)
0 R22 100 61.1 97.9 0.0566 9.87 0.00571 2046 0.495 121.6 0.0294
1 R32/125 60/40 63.5 112.4 0.0650 11.54 0.00672 1913 0.463 122.3 0.0296
2 R32/125/134a/290 20/55/20/5 82.0 83.3 0.0482 11.67 0.00710 1982 0.480 123.9 0.0230
3 R32/125/134a 10/70/20 90.5 76.9 0.0444 11.50 0.00665 2082 0.504 123.7 0.0229
4 R290 100 78.5 99.97 0.0577 16.05 0.00928 1165 0.282 79.9 0.0193
5 R32/125/134a 30/10/60 70.5 106.5 0.0616 11.20 0.00648 2358 0.570 116.7 0.0283
6 R32/227ea 35/65 81.3 not available
7 R32/134a 30/70 69.6 109.5 0.0633 11.19 0.00647 2427.2 0.587 115.5 0.0279
8 R32/134a 25/75 71.9 106.5 0.0616 11.17 0.00645 2470.7 0.598 115.2 0.0288
9 R134a 100 87.2 88.5 0.0512 11.37 0.00657 2593.7 0.627 113.2 0.0274
RefrigerantWeightcomp.
Vaporheat
capacity
Liquid thermalconductivity
Vapor thermalconductivity
Liquidviscosity
Vaporviscosity
% J/(mol·K)mW/
(m·K)Btu/
(h·ft·°F)mW/
(m·K)Btu/
(h·ft·°F)micro-poise
lb/(ft·h)micro-poise
lb/(ft·h)
0 R502 [R22/115] 48.8/51.2 71.3 83.3 0.0481 7.9 0.00457 2911 0.704 106.4 0.0257
1 R32/125/143a 10/45/45 73.8 97.7 0.0565 9.8 0.00566 2584 0.625 103.0 0.0249
2 R125/143a 45/55 81.9 89.3 0.0516 9.9 0.00572 2481 0.600 102.7 0.0248
3 R125/143a/134a 44/52/4 79.3 89.9 0.0520 9.9 0.00572 2541 0.614 102.6 0.0248