real-time protein kinase assay
TRANSCRIPT
Real-Time Protein Kinase Assay
Hongye Sun, Karen E. Low, Sam Woo, Richard L. Noble, Ronald J. Graham, Sonia S. Connaughton,Melissa A. Gee, and Linda G. Lee*
Applied Biosystems, 850 Lincoln Centre Drive, Foster City, California 94404
We report a novel, real-time fluorogenic kinase assay. Thepeptide substrates are synthesized with a fluorescent dyeand a hydrocarbon tail. The substrate self-assembles intomicelles, increasing the local concentration of the dye andquenching its fluorescence. Upon phosphorylation, thefluorescence intensity increases 4-6-fold due to micellereorganization. Both dynamic light scattering data andcryoelectron microscope images show that the size andthe shape of the phosphopeptide micelles are significantlydifferent from micelles of substrate peptide. The systemprovides a robust fluorescence increase in a real-timeprotein kinase assay. Unlike other fluorogenic systems,the fluorophore may be distant from the serine, threonine,or tyrosine that is phosphorylated. Assays for severalkinases, including PKA, PKC, p38, MAPKAP K2, akt,Erk1, and src-family kinases, have been developed. IC50
values of inhibitors for PKC âII determined with thistechnology are consistent with published values. Theutility of this assay to high-throughput screening wasdemonstrated with Sigma’s LOPAC library, a collectionof 640 compounds with known biological activities, andsatisfactory results were obtained.
Protein kinases play a key role in regulating protein functionand are the second largest potential group of therapeutic targets.1-4
A total of 518 kinase genes have been identified, which corre-sponds to 1.7% of all human genes.5 To study and differentiatethese enzymes, a simple, robust, real-time kinase assay for drugscreening and mechanism studies is needed. Current kinaseassays can be divided into three classes by the readout signals:radioactive detection of phosphorylated product; fluorescent orluminescent detection of product; or indirect measurement of ATPconsumption, usually by luminescent detection.
The scintillation proximity assay (SPA) developed by Amer-sham Bioscience is one example of a radioactive kinase assay.Kinase activity is measured by the incorporation of 33P-labeledATP into a kinase substrate.6 The safety and cost of SPA are a
concern to customers, and alternative nonradioactive methods aredesired.
Fluorescent or luminescent kinase assays have been designedusing phosphopeptide binding reagents, such as antibodies;7-10
phosphate chelators, such as metal ion complexes;11 metal ioncoated particles;12 or fluorescent polymers13 as fluorescent donorsor quenchers. The readout may be fluorescence, luminescence,or polarization. Antibody-based fluorescence kinase assays areespecially useful for tyrosine kinases for which high-affinityantibodies are available. However, antibodies that bind phospho-serine and phosphothreonine are generally less available, whichinhibits the development of antibody-based methods for themajority of known kinases. Assays that rely on chelation of aphosphate have the disadvantage that anionic compounds, suchas ATP, phospholipid, and other carboxylate groups, compete withthe phosphopeptide in binding the metal ions, limiting the assayto low ATP concentration and reducing the signal to background.
A kinase assay based on indirect measurement of ATPconsumption was recently reported.14 The ATP remaining in thereaction was detected by generation of light in a luciferasereaction. The limitations of this method include the narrow ATPdynamic range (<15 µM) outside of the useful range of manykinases and possible inhibition of luciferase with the compoundsscreened.
Assays mentioned above are all endpoint assays, except thefluorescent polymer assay,13 which demonstrated a real-timekinase assay with a 3-fold enhancement of fluorescence after 100%substrate conversion. Several examples of continuous fluorescenceassays have been reported. These assays can be separated intoin vivo and in vitro assays. In vivo assays15-21 may have sufficient
* E-mail: [email protected].(1) Hunter, T. Cell 2000, 100, 1, 13-127.(2) Fletcher, L. Nat. Biotechnol. 2001, 19, 599-600.(3) Cohen, P. Nat. Rev. Drug Discovery 2002, 1, 309-315.(4) Noble, M. E. M.; Endicott, J. A.; Johnson, L. N. Science 2004, 303, 1800-
1805.(5) Manning, G.; Whyte, D. B.; Martinez, R.; Hunter, T.; Sudarsanam, S. Science
2002, 298, 1912-1934.(6) Beveridge, M.; Park, Y. W.; Hermes, J.; Marenghi, A.; Brophy, G.; Santos,
A. J. Biomol. Screening 2000, 5, 205-212.
(7) Ohmi N.; Wingfield, J. M.; Yazawa, H.; Inagaki, O. J. Biomol. Screening 2000,5, 463-470.
(8) Rodems, S. M.; Hamman, B. D.; Lin, C.; Zhao, J.; Shah, S.; Heidary, D.;Makings, L.; Stack, J. H.; Pollak, B. A. Assay Drug Dev. Technol. 2002, 1,9-19.
(9) Glickman, J. F.; Wu, X.; Mercuri, R.; Illy, C.; Bowen, B. R.; He, Y.; Sills, M.J. Biomol. Screening 2002, 7, 3-10.
(10) Sadler, T. M.; Achilleos, M.; Ragunathan, S.; Pitkin, A.; LaRocque, J.; Morin,J.; Annable, R.; Greenberger, L. M.; Frost, P.; Zhang, Y. Anal. Biochem.2004, 326, 106-113.
(11) Morgan, A. G.; McCauley, T. J.; Stanaitis, M. L.; Mathrubutham, M.; Millis,S. Z. Assay Drug Dev. Technol. 2004, 2, 171-181.
(12) Gaudet, E. A.; Huang, K. S.; Zhang, Y.; Huang, W.; Mark, D.; Sportsman, J.R. J. Biomol. Screening 2003, 8, 164-175.
(13) Rininsland, F.; Xia, W.; Wittenburg, S.; Shi, X.; Stankewicz, C.; Achyuthan,K.; McBranch, D.; Whitten, D. Proc. Natl. Acad. Sci. U.S.A. 2004, 101,15295-15300.
(14) Koresawa, M.; Okabe, T. Assay Drug Dev. Technol. 2004, 2, 153-160.(15) Nagai, Y.; Miyazaki, M.; Aoki, R.; Zama, T.; Inouye, S.; Hirose, K.; Iino, M.;
Hagiwara, M. Nat. Biotechnol. 2000, 18, 313-316.
Anal. Chem. 2005, 77, 2043-2049
10.1021/ac048280e CCC: $30.25 © 2005 American Chemical Society Analytical Chemistry, Vol. 77, No. 7, April 1, 2005 2043Published on Web 02/15/2005
signal-to-noise to provide results that reflect real time cellularsignaling. However, the signal-to-background of these methodsis not adequate for high-throughput screening (HTS). A recentlydescribed in vitro assay22 displayed good signal-to-background bututilized UV-excitable fluorophores that are not practical for drugscreening due to compound autofluorescence in the UV spectrum.
Here, we report a novel real-time kinase assay that couplesphosphorylation to a micellular rearrangement to monitor kinaseactivity in real-time. The assay has been developed for over 30kinases.
EXPERIMENTAL SECTIONMaterials. Resins and reagents for peptide synthesis, Fmoc-
protected amino acids, 0.45 M HOBT/HBTU in DMF, 2 M N,N-diisopropylethylamine (DIPEA) in 1-methyl-2-pyrrolidinone (NMP),Expedite PNA Linker, Tet dye NHS ester, and 5-carboxy-2′,7′-dipyridylsulfofluorescein (dye2) were obtained from AppliedBiosystems (Foster City, CA). Fmoc-K(ivDde) was obtained fromNovabiochem (San Diego, CA). Protein Kinase C isoforms wereobtained from Calbiochem (San Diego, CA). The protein kinaseA catalytic subunit was purchased from Promega (Madison, WI).All other kinases were purchased from Upstate (Charlottesville,VA). All inhibitors were obtained from Calbiochem (San Diego,CA). The 640-compound LOPAC library and other chemicals werefrom Sigma-Aldrich (St. Louis, MO). Assays were performed inblack, low volume, 384-well, nonbinding surface assay plates thatwere purchased from Corning (Corning, New York).
Synthesis and Purification of Kinase Substrates. Peptidesynthesis was performed on an Applied Biosystems model 433APeptide Synthesizer. Here, the PKC substrate was used as anexample to illustrate the design and synthesis of the peptidesubstrates. The substrate was constructed as (N-heptadecanoyl)-K(N-Tet dye)-linker-RQGSFRA-amide, where the linker is threeunits of Expedite PNA linker (abbreviated as O). The peptideFmoc-OOOK(ivDde)RQGSFRA was constructed via solid-phasepeptide synthesis using standard FastMoc chemistry on 625 mgof Fmoc-PAL-PEG-PS resin at 0.16 mmol/g, a solid support whichresults in a carboxamide peptide. The dye and hydrocarbon wereadded manually in the following steps. All washes used at least 3× 1 mL of the given solvents. A portion of the final protectedpeptide-resin (20 mg, 2 µmol peptide) was transferred to a 1.5-mL microcentrifuge tube and treated with 20% piperidine (500 µL)in dimethylformamide (DMF) for 20 min to remove the Fmocprotecting group. The resin was washed with DMF, followed bydichloromethane (DCM). Heptadecanoic acid (20 mg, 78 µmol),0.45 M HOBT/HBTU in DMF (100 µL, 45 µmol), and 2 MDIPEA/NMP (40 µL, 80 µmol) were added to the resin andagitated gently for 2 h, followed by DMF washes. The ivDdeprotecting group was removed by treating the resin with 10%
hydrazine (500 µL) in DMF for 20 min. The resin was washedwith DMF, followed by DCM. Tet dye NHS ester (5 mg, 9 µmol),2 M DIPEA in NMP (20 µL, 40 µmol), and DMF (100 µL) wereadded to the resin, and the mixture was agitated gently for 3 h.The resin was washed with DMF, followed by DCM. The resinwas then washed with 20% piperidine (500 µL) in DMF, followedby DCM to remove dye-related impurities. The peptide wascleaved from the resin with 1 mL of cleavage solution (950 µLTFA, 50 µL of water). After 2 h, the mixture was filtered, and thefiltrate was concentrated to dryness on a rotary evaporator. Aportion was purified by reversed-phase HPLC (Agilent column:150 × 4.6 mm, 300 Extend, 5 µm) using a 25-70% gradient over25 min of 0.1% TFA in acetonitrile vs 0.1% TFA in water.
Characterization and Quantification of the Substrate. TheHPLC-purified PKC substrate was analyzed on a PE Sciex API150EX mass spectrometer using electrospray ionization. Theexpected molecular weight of 2132 Da was obtained. Theconcentration of the substrate was quantitated in a solutioncontaining DMF and NaOH (25 mM) on a Cary 3E UV-visspectrophotometer using a molar extinction coefficient of 80 000cm-1 mol-1 at 542 nm. The peptide was diluted to 100 µM in water.
Fluorescent Microplate Assay for PKC âII. All assays wereconducted in Corning black, low-volume, 384-well, nonbindingsurface assay plates (Corning, NY) with a final assay volume of10 µL/well. The final enzyme reaction solution contained Tris-HCl, (20 mM, pH 7.6), MgCl2 (5 mM), DTT (5 mM), lipid activator(10%), PKC âII (0.05 ng/µL), and peptide substrate (6 µM). Thereaction was initiated by adding ATP to the reaction buffer. Thereaction was monitored using a Gemini Fluorescence Plate Readeror an Analyst GT, both from Molecular Devices (Sunnyvale, CA).The excitation and emission wavelengths were at 500 and 550 nm,respectively. Sampling intervals were every minute for a total of1 h.
Analysis of the Substrate Phosphorylation Using MALDI-TOF Mass Spectrometry. The phosphorylation of the substratesby PKC and other kinases was monitored by fluorescence increasein the Gemini Fluorescence Plate Reader and in parallel on aVoyager MALDI-TOF mass spectrometer (Applied Biosystems,Foster City, CA) using R-cyano-4-hydroxycinnamic acid (CHCA)as the matrix. The reaction mixture (54 µL) containing PKCsubstrate (6 µM), Tris-HCl (20 mM, pH 7.6), MgCl2 (5 mM),lipid activator (10%), DTT (5 mM), and PKC âII (1.5 nM) wasdispensed into two wells on two 384-well, nonbinding surface assayplates, and 6 µL of ATP (100 µM) was added to start the reaction.Aliquots (1 µL) of the reaction solution were removed from thereaction solution at 0 and 60 min and mixed with 10 µL of CHCAmatrix (10 µL) without purification. A portion of the mixture (1µL) was spotted onto the MALDI plate and analyzed.
Determination of the Critical Micelle Concentration (CMC)of the PKC Substrate Peptide and Phosphopeptide Product.The fluorescence intensities of the PKC peptide substrate andchemically synthesized phosphopeptide in kinase reaction buffer(20 mM Tris-HCl, pH 7.6, 5 mM MgCl2) in the absence and inthe presence of 0.2% Triton X-100 were measured at increasingconcentrations in a Jobin Yvon-SPEX Fluorolog fluorescencespectrophotometer (Edison, NJ). To avoid the inner filter effect,the excitation and emission wavelengths were set at 425 nm(instead of 500 nm) and 550 nm, respectively. A plot of the
(16) Sato, M.; Ozawa, T.; Inukai, K.; Asano, T.; Umezawa, Y. Nat. Biotechnol.2002, 20, 287-294.
(17) Ting, A. Y.; Kain, K. H.; Klemke, R. L.; Tsien, R. Y. Proc. Natl. Acad. Sci.U.S.A. 2001, 98, 15003-15008.
(18) Chen, C.-A.; Yeh, R.-H.; Lawrence, D. S. J. Am. Chem. Soc. 2002, 124, 3840-3841.
(19) Srinivasan, J.; Cload, S. T.; Hamaguchi, N.; Kurz, J.; Keene, S.; Kurz, M.;Boomer, R. M.; Blanchard, J.; Epstein, D.; Wilson, C.; Diener, J. L. Chem.Biol. 2004, 11, 499-508.
(20) Sasaki, K.; Sata, M.; Umezawa, Y. J. Biol. Chem. 2003, 278, 30945-30951.(21) Sato, M.; Umezawa, Y. Methods 2004, 32, 451-455.(22) Shults, M. D.; Imperiali, B. J. Am. Chem. Soc. 2003, 125, 14248-14249.
2044 Analytical Chemistry, Vol. 77, No. 7, April 1, 2005

fluorescence vs the concentration of peptides revealed the CMCvalues of the peptides at the concentration where the fluorescenceintensity reached a maximum.
Dynamic Laser Light-Scattering Experiment (DLS). PKCpeptide substrate (3 mL, 6 µΜ) and the chemically synthesizedphosphopeptide (3 mL, 6 µΜ) were each dissolved in a filteredbuffer (20 mM Tris-HCl, pH 7.6, 5 mM MgCl2, and 5 mM DTT).A 90Plus Brookhaven Instrument particle size analyzer equippedwith a 633-nm He-Ne laser (Holtsville, New York) was used tomeasure the size and size distribution of the micelles. The datawere collected at 90° scattering angle for three minutes to obtainthe log-normal distributions of the particle size.
Cryoelectron Microscopy. For freeze-fracture electron mi-croscopy, PKC substrate peptide (6 µΜ) and phosphopeptide (6µΜ) were each dissolved in the enzyme reaction buffer (20 mMTris-HCl, pH 7.6, 5 mM Mg2+, and 5 mM DTT). The sampleswere frozen in liquid nitrogen-cooled propane. The cooling rateof 10 000 K/s was achieved to avoid ice crystal formation andartifacts possibly caused by the cryofixation processing. Thecryofixed samples were stored in liquid nitrogen for <2 h beforeprocessing. The fracturing process was carried out in a JEOL JED-9000 freeze-etching equipment, and the exposed fracture planeswere shadowed with Pt for 30 s at an angle of 25-35° and withcarbon for 35 s (2 kV/60-70 mA, 1 × 10⁻⁵ Torr). The replicasproduced were cleaned with concentrated, fuming HNO3 for 24h, followed by repeating agitation with fresh chloroform/methanol(1:1 by volume) at least five times. The cleaned replicas wereexamined with a JEOL 100 CX or Philips CM 10 electronmicroscope.
Apparent KmATP Determination. The real-time kinase assay
was used to determine the apparent KmATP for PKA, PKC isoforms
from rat brain, recombinant PKCâII, and Src. Enzyme concentra-tions were 3, 1.5, 2, and 6 nM, respectively. Reaction buffercontained 20 mM Tris-HCl, pH 7.6, 5 mM MgCl2, and 5 mMDTT. The PKC buffer additionally contained 10% PKC lipidactivator. The fluorescence intensity was recorded every minutein the Analyst GT. Aliquots (9 µL) of the reaction buffer containingkinase were dispensed into wells on the 384-well Corningnonbinding surface plate. The kinase reaction was initiated withaliquots (1 µL) of ATP at varying concentrations. The final ATPconcentration was varied from 0 to 500 µM, and the initial velocityof the reaction was obtained by fitting the early data to a linearequation. The initial velocity was plotted against different ATPconcentrations. The data were fitted to the Michaelis-Mentoneq 1 with the nonlinear fitting program Origin 6.1 (OriginLab,Northampton, MA),
where V is the initial velocity of the reaction at different ATPconcentrations; Vmax is the maximum velocity of the reaction at afixed peptide substrate concentration; [ATP] is the ATP concen-tration used; and Km
ATP is the apparent Km for ATP at a fixedpeptide concentration.
PKC Inhibitor Assay. The inhibitors were initially dissolvedin DMSO and were further dissolved in water at varyingconcentrations as stock solutions. The stock solutions of inhibitors
were 10-fold the final concentration. The assay solutions containedTris-HCl (20 mM, pH 7.6), MgCl2 (5 mM), DTT (5 mM), lipidactivator (10%), and PKC âII (0.05 ng/µL) at a final volume of 10µL. The reactions were initiated with the addition of ATP (finalconcentration of 10 µM). The IC50 values were obtained by fittingthe data with eq 2.
LOPAC Library Screening. Compounds were tested induplicate on the same assay plate. Each compound was tested ata final assay concentration of 10 µM in a total reaction volume of20 µL with a final DMSO concentration of 1% and a final ATPconcentration of 10 µM. Aliquots (10 µL) of a 2× master mixcontaining 2× the final assay concentrations of PKC âΙΙ (0.05 µg/mL, 1 ng/well), PKC substrate (6 µM), MgCl2 (5 mM), lipidactivator (10%), and DTT (5 mM) in 1× Tris buffer (20 mM, pH7.4) were added to Corning black, 384-well, nonbinding surfaceassay plates using the PlateMate automated pipettor (CyBio,Woburn, MA). Stock solutions of the inhibitor compounds weremade at 40 µΜ in 1× Tris-HCl (pH 7.4) buffer with 4% DMSO.Aliquots (5 µL) of the inhibitor stock solutions were added to themaster mix using the PlateMate. The kinase reaction was initiatedby the addition of 5 µL ATP (40 µM in 1× Tris-HCl, pH 7.4) tothe reaction buffer (final ATP concentration was 10 µM) on thePlateMate. The plate was then read using the BMG Fluostar 403reader (BMG Labtechnologies, Durham, NC) in kinetic mode withexcitation at 485 nm, band-pass 35 nm and emission at 555 nm,band-pass 35 nm. The data were collected for 30 cycles at 3-minincrements.
Library Screening Data Analysis. The initial velocities of thereaction were calculated in the linear region of the kinetic profilebetween 9 and 33 min. Percent inhibition using the slope valueswas calculated as follows,
where negative and positive control reactions were carried out inthe absence and presence of ATP, respectively, and data-wellreactions were carried out in the presence of test compound andATP. Hits were defined as any compound producing >45%inhibition of PKC âII activity. The quality of the assay wasevaluated with the Z′ factor, which is defined as
where σc+ and σc- are the standard deviation of the positive andnegative control signals, respectively, and µc+ and µc- are theaverages of the positive and negative control signals, respectively.
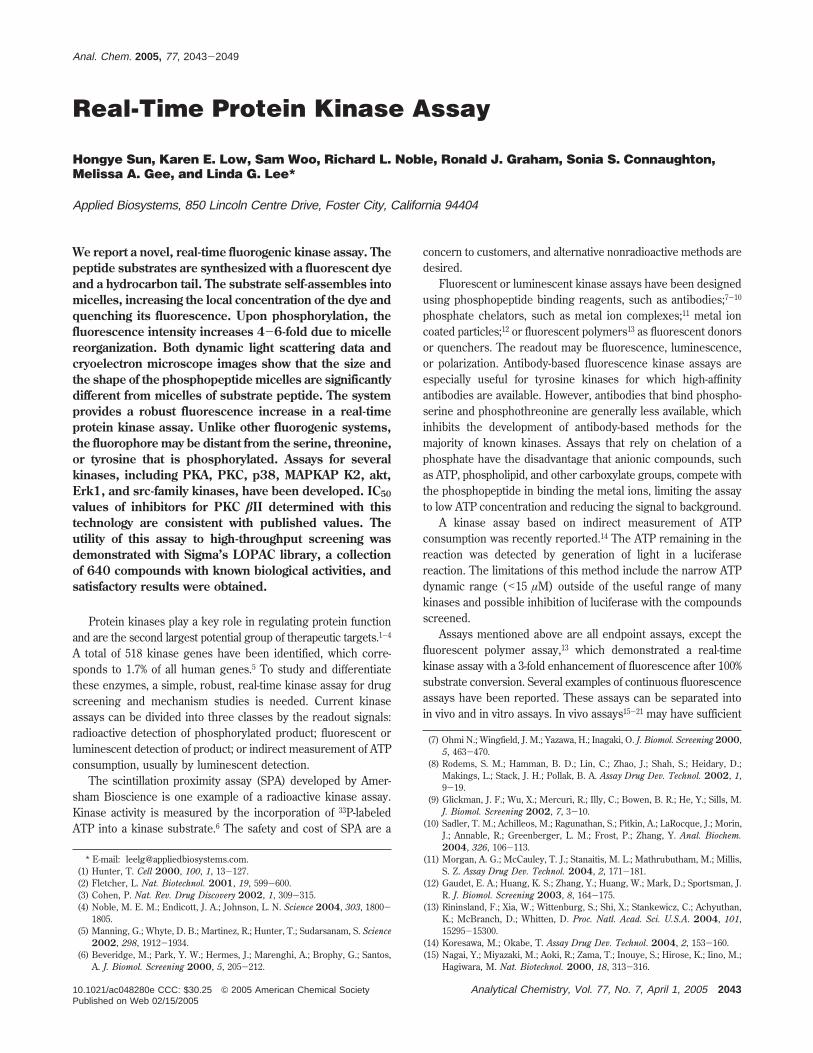
RESULTS AND DISCUSSIONThe fluorogenic kinase substrate was constructed in modules,
as shown in Scheme 1. The hydrophobic portion is derived froman aliphatic carboxylic acid with a carbon length between C15
V )Vmax [ATP]
KmATP + [ATP]
(1)
v )vmax IC50
IC50 + [I](2)
1 - [data well - av (negative control)][av (positive control) - av (negative control)]
(3)
Z′ ) 1 -(3σc+ + 3σc-)|µc+ - µc-| (4)
Analytical Chemistry, Vol. 77, No. 7, April 1, 2005 2045
and C17. The linker is an ethylene glycol derivative that increaseswater solubility, and the fluorophore is a fluorescein analogue.All peptide substrate sequences were obtained from the literaturewith minor modifications.23,24
The hydrocarbon coupled to an ionic peptide creates anamphiphile, or detergent-like molecule, that self-assembles intomicelles.25 The substrate is designed with a net charge of 0 tomaximize the difference in fluorescence between substrate andproduct.26-28 Assembly of the substrate into micelles increasesthe local fluorophore concentration and results in significantproximity quenching of the fluorophore.26-27 Upon phosphoryla-tion, the addition of a net charge to the neutral peptide disruptsthe micelle structure, relieves the proximity quenching of thefluorophores, and results in an increase in fluorescence, as shownin Scheme 2.
The simple concept of a quenched substrate aggregated intomicelles is well-suited to a real-time kinase assay because theenzymatic addition of a phosphate group to a peptide substrateadds approximately two negative charges at neutral pH. The assaydoes not require antibody or phosphate binding particles andprovides a real-time enzyme activity profile. Here, we use a PKCsubstrate and PKC âII as an example to illustrate the principleand the performance of the real-time kinase assay.
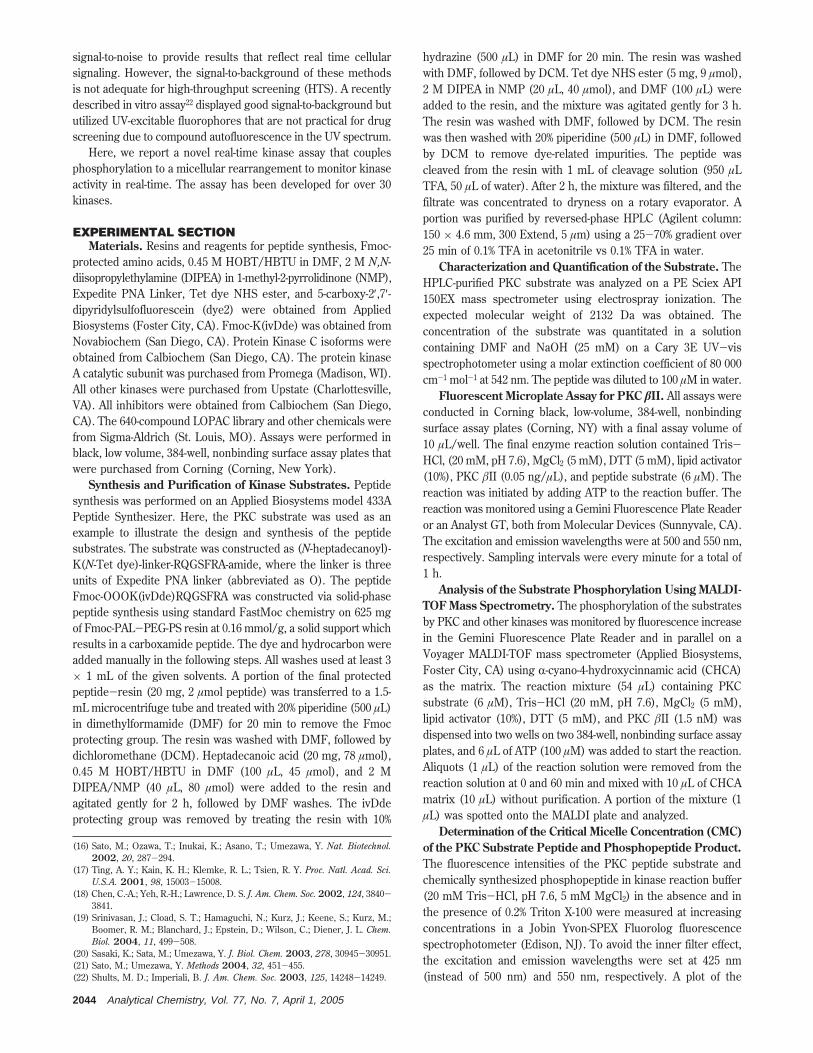
To confirm that the increase in fluorescence observed was dueto phosphorylation of the substrate, the progress of the phospho-rylation of the PKC substrate with PKC âII was monitored withfluorescence (Figure 1A), and the phosphorylation was confirmedby mass spectrometry (Figure 1C and D). The mass spectra ofboth the substrate and the product show multiple peaks with a
mass difference of 23 Da, equivalent to the mass of one sodiumion. The substrate in deionized water shows only the molecularion peak, indicating the adduct peaks are due to the presence ofsodium in the kinase reaction buffer (data not shown). Thesubstrate and product peaks have an 80-Da mass difference thatis attributed to the phosphate group. The phosphopeptide wasalso synthesized chemically to verify the mass spectral data(Figure 1E).
To demonstrate that the fluorescence intensity was propor-tional to the degree of phosphorylation of the peptide substrate,the chemically synthesized phosphopeptide was mixed with itscorresponding peptide substrate at different molar ratios at a fixedtotal concentration (6 µM). The fluorescence intensity was plottedagainst different molar ratios (Figure 1B). The result shows thatthe fluorescence intensity is linearly correlated with the concentra-tion of phosphopeptide in the mixture, allowing the assay to beused to monitor substrate phosphorylation quantitatively in realtime. The fluorescence increase from 0 to 100% phosphopeptide
(23) Obata, T.; Yaffe, M. B.; Leparc, G. G.; Piro, E. T.; Maegawa, H.; Kashiwagi,A.; Kikkawa, R.; Cantley, L. C. J. Biol. Chem. 2000, 275, 36108-36115.
(24) Nishikawa, K.; Toker, A.; Johannes, F.; Zhou, S.; Cantley, L. C. J. Biol. Chem.1997, 272, 952-960.
(25) Rosen, M. J. Surfactants and Interfacial Phenomena, 2nd ed.; John Wiley &Sons: New York, 1989.
(26) Hartgerink, J. D.; Beniash, E.; Stupp, S. I. Science 2001, 294, 1684-1688.(27) Hartgerink, J. D.; Beniash, E.; Stupp, S. I. Proc. Natl. Acad. Sci. U.S.A. 2002,
99, 5133-5138.(28) Niece, K. L.; Hartgerink, J. D.; Donners, J. J. J. M.; Stupp, S. I. J. Am. Chem
Soc. 2003, 125, 7146-7147.
Scheme 1. Structure of Peptide Substrate
Scheme 2. Structure of Peptide Substrate inMicelles
Figure 1. Kinetic profile and mass spectrometry data of thephosphorylation of PKC substrate with PKC âII. A: The kinetic profileof the phosphorylation of the PKC substrate with PKC âII. B: Linearcorrelation between the fluorescence intensity and the amount ofphosphopeptide; line is a linear fit, and the circles are experimentaldata. C and D: Mass spectral data before and after phosphorylationwas completed (at t ) 60 min). The substrate and product peaks arelabeled. E: Mass spectrum of the chemically synthesized phospho-peptide in kinase reaction buffer.
2046 Analytical Chemistry, Vol. 77, No. 7, April 1, 2005

is approximately 6-fold, which matched the fluorescence increaseobserved in the enzymatic phosphorylation.
We used three methods to provide evidence for a micellemodel: fluorescence titration of peptides in detergent and buffer,dynamic light scattering, and freeze-fracture electron microscopy.Many examples of hydrocarbon-peptide amphiphiles have beenpreviously described and characterized by similar methods.26-28
These compounds form large, cylindrical micelles, unlike thesmall, spherical micelles formed by detergents, such as SDS.Detergents are typically characterized by two parameters: theircritical micelle concentrations (CMC), defined as the concentra-tion above which micelles are formed, and the aggregationnumber, defined as the average number of monomers per micelle.We used the fluorescence titration to estimate the CMC and thelatter two methods to estimate the difference in micelle size forthe substrate peptide and the phosphopeptide.
The fluorescence titration of the substrate peptide and thechemically synthesized phosphopeptide is shown in Figure 2. Inthe presence of Triton X-100, a nonionic detergent, no aggregatedspecies are expected to be present, and indeed, the fluorescenceof the substrate peptide and the phosphopeptide are indistinguish-able; both show a linear correlation with concentration. In theabsence of Triton X-100, titration of the two peptides in bufferresults in biphasic behavior, typical of surfactants.25 The concen-trations at which the fluorescence reached a maximum were 3µM for the substrate peptide and 8 µM for the phosphopeptide.
We estimate these values to represent their respective CMCvalues. The net neutral substrate peptide has a lower CMC thanthe net negatively charged phosphopeptide, a result that isconsistent with the observation that the CMCs of zwitterionicdetergents are lower than the corresponding ionic detergents withthe same hydrocarbon tail.25 The 6-fold difference in fluorescenceat 6 µM between the two peptides is the basis for the assay.
Further evidence of micelle structures and size was providedby the method of dynamic light scattering (DLS). The resultsrevealed that the average size of the micelles of the substratepeptide (360 nm) was significantly larger than that of thephosphopeptides (280 nm). The size distribution of the substratepeptide (half-width of 110 nm) is wider than that of the phospho-peptide (half width of 60 nm), indicating the phosphopeptideaggregate is more homogeneous than that of the substrate peptide(Figure 3). The result is consistent with the model that both thesubstrate peptide and the phosphopeptide form aggregates, butof different sizes. The average size of the substrate peptidecompared to the phosphopeptide is also consistent with thefluorescence titration, since increasing aggregation numberstypically correlate with decreasing CMC values.25
Direct, visual evidence of the structure of the micelles wasobtained by freeze-fracture electron microscopy (see SupportingInformation). The substrate peptide showed cylindrical micelles,clusters of spheres (5-20 micelle), and individual spheres. Thelength of the cylindrical micelle was in the range of 200-1000
Figure 2. Fluorescence of PKC substrate and phosphopeptide withand without 0.2% Triton X-100. The substrate peptide (]) and thephosphopeptide (4) were titrated in kinase reaction buffer (seeExperimental Section) with the addition of 0.2% Triton X-100 and thefluorescence measured. The substrate peptide (O) and the phospho-peptide (0) were also titrated in the kinase reaction buffer without0.2% Triton X-100.
Table 1. Substrate Concentration and Signal-to-Background Ratio
kinase substratesubstrate
concn (µM) S/Ba
PKA C16-OOOK(tet)LRRASLG-amide 16 4Akt 1,2,3 C15-OOOK(dye2)RPRTSSF-amide 8 4PKC family C17-OOOK(tet)RQGSFRA-amide 6 6MAPKAP K2 C16-OOOK(dye2)RLNRTLSV-amide 8 5Erk1 C17-OOOK(dye2)PRTPGGR-amide 16 5Lck, Fyn, Src, Lyn, Yes, BTK C16-OOOK(dye2)EEIYGEFRRRRR-amide 8 5
a S/B is defined here as the fluorescence ratio of the product to substrate after complete phosphorylation.
Figure 3. Particle size distribution measured by dynamic laser lightscattering. The solid circles and lines represent the phosphopeptideand open circles and lines represent the substrate peptide. Theaverage size of the aggregates is indicated by arrows and numbers.The experimental conditions are described in the ExperimentalSection.
Analytical Chemistry, Vol. 77, No. 7, April 1, 2005 2047

nm, and the diameter was in the range of 20-60 nm. We postulatethat the clusters and the spheres are the intermediate stagebetween small micelles and the tubular structure. In contrast, thephosphopeptide showed only small spheres and smaller clusters(up to 5 micelles), and no cylindrical structures were observed.These results show that the substrate peptides form largeraggregates with many monomers, and the phosphopeptides formsmaller aggregates with few monomers, consistent with the DLSresults.
The CMC values of substrates for different kinases varydepending on the peptide sequence and hydrocarbon chain length.The fluorescence increase upon complete phosphorylation (signal-to-background) observed with substrates for different kinasestested at substrate concentrations ranging from 6 to 16 µM arelisted in Table 1. Signal-to-background values ranging from 6-foldto 10-fold were observed.
The assay was used to determine the apparent Km of ATP forseveral kinases: PKA, PKC isoforms from rat brain, recombinantPKC âII, and Src. The results were comparable to literature values.The fluorogenic substrates simplify the determination of kineticparameters, since only one reaction is used to obtain many timepoints. The Km
ATP is a useful value to find the optimal ATPconcentration in a screen of ATP-competitive inhibitors. Thenormalized initial velocities determined from the kinetic profileat varying ATP concentrations were plotted against the ATPconcentrations, and the apparent Km
ATP was obtained by fittingthe data with the Michaelis-Menten equation (PKC: Figure 4;PKA and Src, see Supporting Information). The observed andliterature values for the Kms of ATP are as follows (literature valuein parentheses): PKA, observed, 8 µM (12 µM);29 PKC isoformsfrom tissue, observed, 15 µM (15 µM);30 recombinant PKC âII,70 µM (not found); and Src, observed, 24 µM (10-30 µM)31. Theapparent Km
ATP for the recombinant PKC âII was found to besubstantially higher than that of PKC isoforms from tissue,suggesting that the PKC isoforms from rat brain have higheraffinity to ATP than recombinant PKC âII.
The technology described here is useful for both primary andsecondary inhibitor screening. Several steps were necessary to
optimize the assay for PKC âII. First, we adjusted the enzymeconcentration while fixing the substrate (6 µM) and ATP (10 µM)concentrations to allow for a wide time window for the linear phaseof the reaction. This window of ∼30 min for the uninhibitedreaction allowed reproducible determinations of the initial velocityof substrate phosphorylation. Several commercially availableinhibitors for PKC were tested. The titration results of activity vsinhibitor concentrations for two inhibitors (Figure 5) and IC50
values of the remaining inhibitors (Table 2) are shown. The IC50
values determined using the assay were comparable with literaturevalues.
To further validate the fluorogenic kinase assay technology,we performed a high-throughput screen (HTS) for kinase inhibi-tors with PKC âII in the presence of ATP (10 µM) against theSigma LOPAC compound library, which includes 640 knownpharmacologically active compounds. By defining compounds that
(29) Cauthron, R. D.; Carter, K. B.; Liauw, S.; Steinberg, R. A. Mol. Cell. Biol.1998, 18, 1416-1423.
(30) Stewart, J. R.; Ward, N. E.; Ioannides, C. G.; O’Brian, C. A. Biochemistry1999, 38, 13244-13251.
(31) Matten, W. T.; Maness, P. F. Biochem. J. 1987, 248, 691-696.
Figure 4. Apparent KmATP determination with the fluorogenic kinase assay. Kinetic profile of the PKC substrate with PKC isoforms from rat
brain (A) and recombinant PKC âII (B) at increasing ATP concentrations (O, 0; b, 5; 0, 10; 9, 20; ),50; (, 100; 4, 200; 2, 500 µM). The solidlines represent a linear fit to obtain the initial velocity. C: Initial velocities for PKC isoforms (b) and PKC âII (O) are plotted. The solid linerepresents the best fit to the experimental data using eq 1.
Figure 5. Representative IC50 data for PKC âII using PKC substrate.The experiments were performed in duplicate and the average datais plotted; the error bars indicate the error for each concentration ofinhibitor. The data for the inhibitor H7 (O) and bisindolymaleimide III(b) are shown. The solid lines represent the best fits to theexperimental data using eq 2.
Table 2. IC50 Comparison
inhibitors IC50, found IC50, reporteda
Staurosporine 16 ( 2 nM <10 nMbisindolylmaleimide III 25 ( 4 nM 26 nMbisindolylmaleimide IV 0.6 ( 0.2 nM 0.1 nMH7 2 ( 0.2 µM 6 µMChelerythrine 6.4 ( 0.9 µM 0.7 µMHA100 1.4 ( 0.1 µM 6.5 µM
a Calbiochem catalog, 2003.
2048 Analytical Chemistry, Vol. 77, No. 7, April 1, 2005
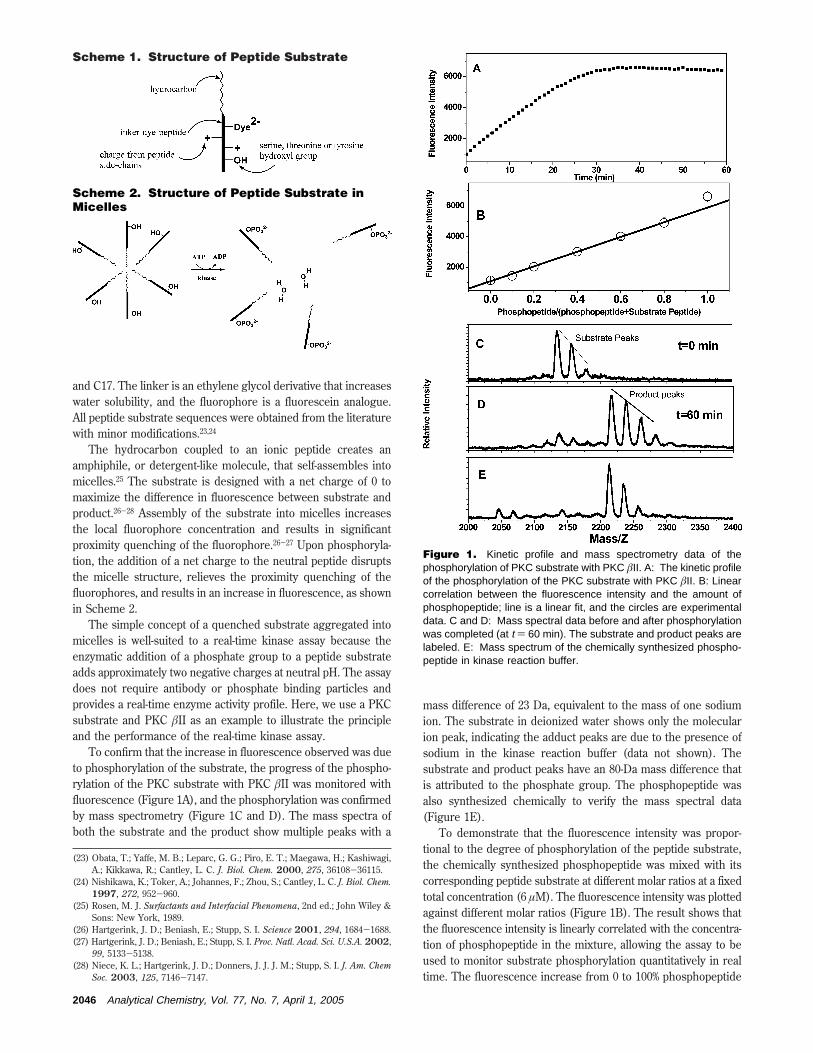
inhibited enzyme activity by 45% as a hit, our screen identifiedeight hit compounds, listed in Table 3. Five of the six expectedPKC-related inhibitors were identified in this screen. Two of thehits were unrelated to PKC activity. A compound missed in thescreen was tamoxifen citrate, an anti-estrogen that should alsoinhibit PKC activity. Acceptance of assay plates was based onperformance of coefficient of variation (% CV), Z′ factor, and signal-to-background ratio (S/B). The average S/B was 4.8 for the run,and % CV was <6%, within the same batch of enzyme. The Z′ value,which is an indicator of the robustness of the assay,32 was >0.60for all assay plates, indicating the utility of this assay for HTS.
In conclusion, we have demonstrated a kinase assay based onmicelle formation and quenching of the fluorescence of theamphiphilic substrate. The two negative charges added to thesubstrate by phosphorylation changes the nature of the micelle,resulting in a 4- to 6-fold increase in fluorescence. The real-time
kinase assay described here is a simple, one-step, mix-and-readassay. It does not require any binding reagents or secondenzymes. The utility of the assay was demonstrated by primary(HTS) and secondary screening (IC50) using the protein kinase,PKC âII.
ACKNOWLEDGMENTWe thank Nam-joon Cho and Professor Curtis W. Frank at
Stanford University for performing the DLS experiment and Dr.Brigitte Papahadjopoulos-Sternberg for freeze-fracture electronmicroscopy at Nano Analytical Lab.
SUPPORTING INFORMATION AVAILABLESupporting information as stated in the text. This material is
available free of charge via the Internet at http://pubs.acs.org.
Received for review November 19, 2004. AcceptedJanuary 10, 2005.
AC048280E(32) Zhang, J.; Chung T. D.; Oldenburg, K. R. J. Biomol. Screening 1999, 4,
67-73.
Table 3. Hit Compounds Identified
compd activity inhibition (%) selectivity expected hit
HA-1004 dihydrochloride 45 potent inhibitor of PKC and PKA yesH-7 dihydrochloride 66 potent inhibitor of PKC and PKA yesH-9 dihydrochloride 67 potent inhibitor of PKC and PKA yesSphingosine 50 inhibitor of PKC yesNPC-15437 68 selective PKC inhibitor yescalmidazolium chloride 93 ATPase inhibitor yesmethoctramine tetrahydrochloride 50 M2 Muscarinic antagonistA-77636 hydrochloride 56 dopamine D1R agonist
Analytical Chemistry, Vol. 77, No. 7, April 1, 2005 2049