realising full potential insurance industry analysis - … · 2015-08-12 · realising full...
TRANSCRIPT

Realising full potentialInsurance industry analysis
Analysis of major South African insurers’ results for the year ending 31 December 2011
March 2012
www.pwc.co.za/insurance

We are pleased to present the first edition of PwC’s analysis of major insurers’ results. This publication comments on the financial results of South Africa’s major insurers for the 31 December 2011 reporting period. The results are a positive reflection of the financial health of the industry and show that insurers have weathered the recent economic uncertainty well.
The results of the following long-term insurance groups were considered in this publication, with a focus on their South African insurance operations:
•Discovery Holdings Ltd (Discovery)
•Liberty Holdings Ltd (Liberty)
•MMI Holdings Ltd (MMI)
•Old Mutual plc (Old Mutual)
•Sanlam Ltd (Sanlam)
The results of the following short-term insurance companies were considered:
•Mutual & Federal Ltd (Mutual & Federal or M&F)
•Outsurance Holdings Ltd (Outsurance)
•Santam Ltd (Santam)
•Zurich Insurance Company South Africa Ltd (Zurich)
Due to different reporting periods, comparable information is not always available. The information presented about the insurers included in this publication is explained in Section 8.
About this publication

PwC | 3
1. Overview of insurance industry results 4
2. Long-term insurance 9
3. Short-term insurance 16
4. Investment performance 20
5. Capital and solvency 25
6. The insurance financial reporting landscape 29
7. Key industry statistics 37
8. Basis of information provided 42
9. Contacts 45
Contents

4 | Realising full potential – Insurance industry analysis
1. Overview of insurance industry results

PwC | 5
1.1 Long-term insurance
Key indicatorsGroup IFRS earnings up 23%
Group return on average equity of 19%
Group embedded value profits up 16%
Value of new business written up 23%
Margin on new business improves slightly to 2.6%
2011 was again a year characterised by uncertainty and economic turmoil, this time driven by the Eurozone debt crisis. Although South Africa has displayed resilience in these difficult times, the country is not insulated against the fallout from Europe, being one of the country’s main trade partners.
Although this was a period in which investment markets were volatile, the performance posted for 2011 was disappointing with the JSE All Share Index closing at the same levels as at the end of 2010. Notwithstanding the lack of performance on equity markets, long-term insurers put in a noteworthy performance. They benefited from a higher average asset base in 2011, compared to 2010, which assisted in generating higher asset-based fee income.
The long-term insurers included in this publication were able to increase group IFRS earnings by 23%. This is a good performance considering the correlation of large life offices’ performance relative to investment markets.
Common views from chief executives about the impact of factors in the external environment on their businesses included:
• Continued high volatility in equity markets;
• The lack of performance in equity markets for the 2011 calendar year;
• Stable but low interest rates;
• Lower levels of (still high) household debt;
• Low levels of savings;
• Moderate disposable income growth;
• A reduction in the official unemployment rate particularly from the second half of 2011; and
• A myriad of regulatory changes affecting long-term insurance businesses in many dimensions.
The above characterises a mixed operating environment in 2011 with some positive developments.
The long-term insurers increased the value of South African new business written by 23% to R3.9bn. It is encouraging that the growth was primarily driven by increased volumes of new business as the margin on the new business only increased from 2.3% to 2.6% in 2011.
The level and quality of new business is a good result in a year where the focus of many intermediaries was on passing the regulatory examinations to comply with the FAIS Fit and Proper requirements. The deadline for these examinations is30 June2012.

6 | Realising full potential – Insurance industry analysis
Lower levels of household debt are starting to have a positive impact on the affordability of insurance products. The companies included in this publication had mixed results with regards to their lapses/persistency experience relative to the assumptions set in 2010. Most companies reported gains from positive mortality and morbidity experience. Inflationary pressure in the economy, fuelled by high oil and food prices, are reflected in the increase of expense assumptions by some of the companies in the publication.
The market’s reaction to the results posted by most of the long-term insurers was neutral, with no significant share price adjustments following the announcement. From the gradual increase in their share price relative to the JSE All Share Index, it would seem that the market received Liberty’s and Discovery’s results well. The MMI share price fell, but the JSE All Share Index also lost significant ground. For the first time in a number of years, the insurance index outperformed the JSE All Share Index in 2011.
Although most of the insurers in this publication have ventured into Africa, for many these are still greenfields businesses in the process of being established in local markets. Most insurers still see business in the rest of Africa as having significant potential for growth over the medium term.
1.2 Short-term insurance
Key indicatorsGross written premiums up 5%
Claims ratios improve to 62%
Underwriting margin of 9.1%
Investment returns down 31%
International solvency margin in excess of 45%
There was a strong increase in global premium rates driven by the level of global catastrophes and the higher cost of reinsurance during 2011. Insurers and reinsurers adjusted pricing to reflect the significant catastrophe claims incurred over the past two years. The record level of natural catastrophes in 2011 impacted on most reinsurers and major reinsurers have reported substantial underwriting losses. These industry players will most likely take positive action with more rational competition and pricing. Reinsurance capacity in the international market has therefore been reduced.
Contrary to the global trend, South Africa is currently in a soft premium cycle due to a very competitive environment, especially for personal lines of business. With new direct writer market entrants such as MiWay and iWyze, competition is fierce. Insurers are also looking towards alternative distribution channels as well as niche businesses to grow their businesses and remain competitive.
The current economic environment is reflected in the results with only 5% gross premiums written growth achieved in 2011. This is the same as the consumer price index (CPI) for the year.
PwC | 7
Excluding Outsurance for which comparative information is not available from the 2011 results, the insurers considered have achieved a similar underwriting margin of 6.3% in 2011 compared to the 6.4% in 2010. When including Outsurance in 2011, the underwriting margin achieved amounts to 9.1%. The similar margin for 2011 (compared to 2010) should be seen against the backdrop of the soft premium cycle offset by the absence of large weather-related events in the last six months of the year. So far this year, there have been some major weather-related events such as the flooding in Limpopo, but the country was spared any significant losses from tropical cyclone Irina.
Judging by the short-term insurers included in this publication (excluding Outsurance), it is apparent that the industry’s overall claims ratio has stabilised at around 65%, marginally better when compared to 2010. If one includes Outsurance, for which detailed information is only available from this year, the average claims ratio is 62%. Although there has been some decline in crime-related claims and some respite from the stronger rand over the past two years, which positively impacted vehicle repair costs, insurers are still facing an uphill battle to keep the claims ratio on their motor books at an acceptable level.
To help address this, the South African Insurance Association (SAIA) has been focusing on drivers, vehicles and vehicle crime in order to reduce the loss ratio on this, the largest business class in the South African short-term insurance market.
There has been a gradual decline in the acquisition cost ratio over the past three years with a corresponding increase in the administrative expense ratio. The change in ratios indicates a migration of short-term insurance business from intermediated to direct marketing channels (without considering the impact that Outsurance, a direct writer, has on the combined 2011 numbers).
The combined acquisition and administrative cost ratio has slightly increased from 27.6% in 2009 to around 29% of net earned premiums in 2011, which may be indicative of costs of over R500m that have been incurred in getting the Miway business off the ground.
The industry was negatively impacted by subdued investment performance during 2011 with investment income down by almost a third compared to 2010. This was primarily due to the JSE All Share Index closing at the same levels as in 2010 compared to a 16% increase during 2010. The lower interest rates in 2011 also played a part with average short-term rates down almost 1% compared to 2010.
As a result of weaker investment performance, most short-term insurers also posted a lower return on equity in 2011. However, some industry players still boasted impressive weighted average returns on equity for 2011. Santam posted 25% and Outsurance 34% return on average equity.
The industry confirmed its solid capital adequacy position with the international solvency margin being in excess of 45% for all companies included in this publication.

8 | Realising full potential – Insurance industry analysis
By now regulatory change seems to have become ‘business as usual’ for most insurers. However, one cannot overlook the regulatory changes faced by insurers, particularly Solvency Assessment and Management (SAM). There are also a number of macro developments such as the introduction of National Health Insurance and a National Savings Fund. This will be coupled with significant accounting changes, which are envisaged to take effect in 2015.
Premium growth in 2012 will be under pressure due to the inflationary pressure in the economy, the regulatory examinations impacting intermediaries, the current soft short-term insurance cycle in the country as well as continued weak economic activity.
Consumers have been making a concerted effort to reduce their levels of household debt since the financial crisis in 2008. However, inflationary pressures such as the increased fuel price, urban toll roads and other unavoidable tariff increases, adversely impacts on consumer spending power.
Meanwhile, the Government’s recent announcement of planned investment in infrastructure will have a positive impact on unemployment and should bode well for potential future growth for the lower end of the market. This could also lead to alternative investment structures, such as long-dated debt securities, becoming available to insurers.
South Africa has a very competitive insurance market with a number of direct writers having entered the market in recent years. These companies will ensure continued intensifying competition, reduce the stickiness of clients and could ultimately result in an underwriting margin squeeze.
A potential growth area to keep an eye on is telematics. Telematics refers to the use of technology for sending, receiving or storing information via a telecommunications device and this can be used to evaluate risk, for example gathering information on vehicle location to make risk management more effective.
A number of insurers are pursuing affinity partners as an alternative distribution channel in order to tap into new markets and defend their existing market share. Given the saturation of the local insurance market, insurance groups are pursuing growth opportunities in Africa, India and China. However, given the global skills shortage in the insurance industry as well as competition from other significant global insurance players, it is unlikely that these ventures will become significant contributors to profits in the short-term.
1.3 Looking forward

PwC | 9
2. Long-term insurance

10 | Realising full potential – Insurance industry analysis
2.1 Group IFRS earnings
The long-term insurers recorded group IFRS earnings of R19.1bn, up 23% on 2010. This is a strong performance in a period where the JSE All Share Index closed 0.4% lower than at the start of the year, the bond market yielded around 8% and the repo rate remained unchanged at 5.5%.
Although this was a seemingly benign year, financial markets were once again very volatile and insurers managed to come through relatively unscathed with a combined group return on average equity recorded at 19%. This is reflective of a strong operating result in 2011, which benefited from a slightly more positive economic environment for consumers and a cautious approach followed in investing shareholders’ capital.
Old Mutual posted a 29% return on average equity followed by Discovery at 27%, Liberty at 22%, Sanlam at 17% and MMI at 6%. The long-term insurers seem to have shrugged off the woes of 2009, when the return on average equity was significantly depressed.
IFRS earnings
Combined results2011
Rm
2010
Rm
Change
%
Total comprehensive income 19 136 15 531 23
Return on average equity 19% 17%
2.2 Group embedded value
Embedded value
Combined results2011
Rm
2010
Rm
Change
%
Embedded value 191 165 172 641 11
Embedded value earnings1 25 389 21 881 16
Return on embedded value1 14.7% 17.5%
1 Excludes MMI in 2010 as this information is not available for the newly formed group.
Similar to their IFRS earnings, long-term insurers recorded strong consolidated group embedded value earnings in 2011 especially when one considers the lack of meaningful contribution to earnings from investment markets. This result is reflective of strong operating performances by their South African businesses in 2011. This is highlighted in the overview of insurance industry results as well as in the new business information, which is analysed in more detail in the following pages.
PwC | 11
Value of new business
Combined results2011
Rm
2010
Rm
Change
%
Present value of new business premiums (PVNBP) 141 630 129 322 10
Embedded value of new business (VNB) 3 681 2 983 23
Value of new business margin 2.6% 2.3% 13
Average payback period 6.4 years 6.3 years
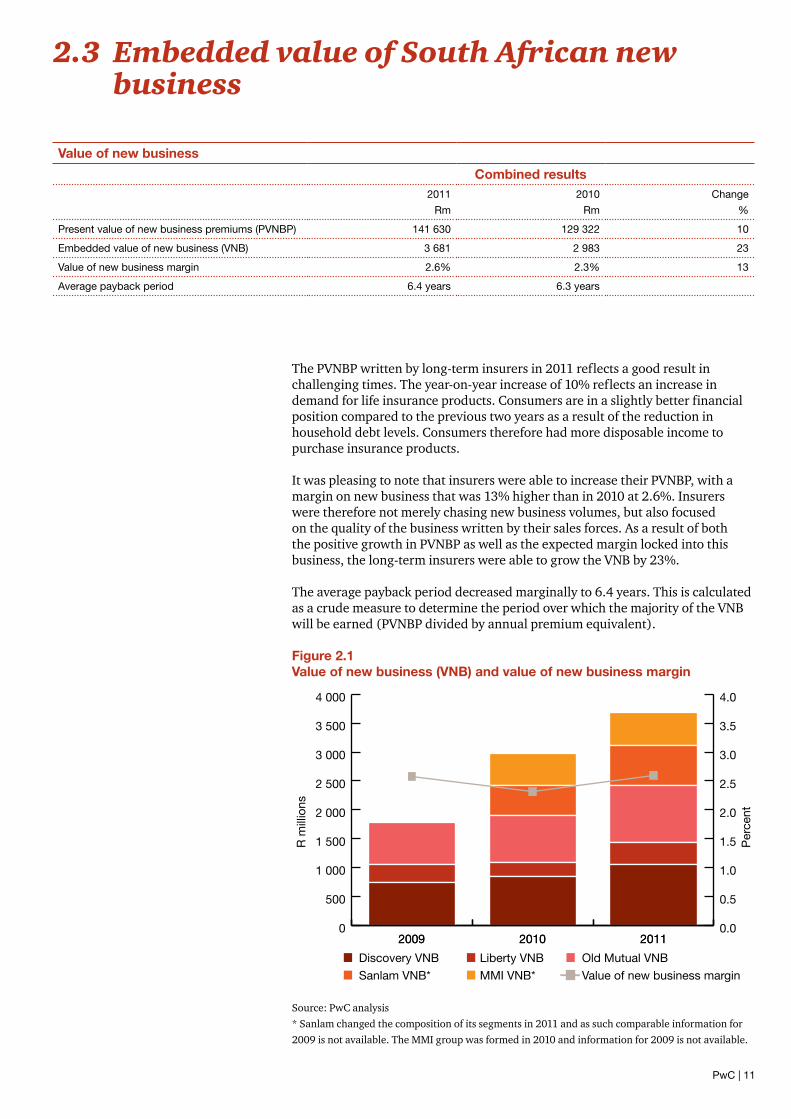
The PVNBP written by long-term insurers in 2011 reflects a good result in challenging times. The year-on-year increase of 10% reflects an increase in demand for life insurance products. Consumers are in a slightly better financial position compared to the previous two years as a result of the reduction in household debt levels. Consumers therefore had more disposable income to purchase insurance products.
It was pleasing to note that insurers were able to increase their PVNBP, with a margin on new business that was 13% higher than in 2010 at 2.6%. Insurers were therefore not merely chasing new business volumes, but also focused on the quality of the business written by their sales forces. As a result of both the positive growth in PVNBP as well as the expected margin locked into this business, the long-term insurers were able to grow the VNB by 23%.
The average payback period decreased marginally to 6.4 years. This is calculated as a crude measure to determine the period over which the majority of the VNB will be earned (PVNBP divided by annual premium equivalent).
Figure 2.1 Value of new business (VNB) and value of new business margin
Source: PwC analysis * Sanlam changed the composition of its segments in 2011 and as such comparable information for 2009 is not available. The MMI group was formed in 2010 and information for 2009 is not available.
2.3 Embedded value of South African new business
0
500
1 000
1 500
2 000
2 500
3 000
3 500
4 000
2011201020090.0
0.5
1.0
1.5
2.0
2.5
3.0
3.5
4.0
201120102009
Discovery VNB
Sanlam VNB*
Liberty VNB
MMI VNB*
Old Mutual VNB
Value of new business margin
R m
illio
ns
Per
cent
12 | Realising full potential – Insurance industry analysis
Discovery achieved PVNBP of R14.4bn in 2011, which was at similar levels to those in 2010. However, the company was able to increase the value of new business margin from 5.9% to 7.3%. As a result of the improved margin, the value of new business increased by 25% to R1.0bn.
Discovery noted a significant increase in the engagement of its policyholders with Vitality, which favourably impacts on the company’s persistency levels. The group indicated that 26% of new business in 2011 was written by tied agents compared to 17% in 2009. The better quality business written by agents is reflected in the improvement in the value of new business margin achieved in 2011.
Liberty’s VNB of R389m increased 54% in 2011 and benefited from improvement in persistency levels and the successful implementation of financial advisor value propositions. The company wrote PVNBP amounting to R28.3bn, an increase of 26% in 2011. This represents 19% of the total PVNBP for the insurers in this publication and has an expected payback period is 5.6 years, which is better than the average of the other long-term insurers considered in this publication.
MMI’s value of new business reduced by 1% to R563m. Although the company was able to increase the PVNBP by 4% to R41.8bn, the value of new business margin reduced from 1.4% to 1.3% in 2011. However, the group was able to improve the margin to 1.5% for the six months to 31 December 2011. The new business results were impacted by the performance of the Momentum retail division which only achieved a value of new business margin of 0.7% in the six months ending 31 December 2011. The employee benefits division doubled its margin in the same period to 1.2%.
Old Mutual’s insurance business increased its PVNBP in 2011 by 5% to R33.7bn. The company increased its value of new business margin from 2.5% to 2.9%. The result of both an increase in the PVNBP and the expected margin achieved on this business is that the VNB increased by 21% to R981m in 2011. Old Mutual’s payback period also improved marginally to 6.4 years in 2011.
Sanlam increased its PVNBP by 15% to R23.4bn in 2011. The company also increased its value of new business margin from 2.5% to 3% in 2011, which resulted in an increase in its VNB by 38% to R701m. Sanlam’s payback period increased from 4.6 years to 5 years in 2011. However, Sanlam’s payback period is the shortest of the long-term insurers.

PwC | 13
Acquisition costs incurred by the South African businesses of the long-term insurers increased by 7.8% to R11.8bn in 2011. This is lower than the increase in APE growth of 8.1% in the same period. Acquisition costs have therefore not increased to the same extent as new business premiums. This could be indicative of a changing product mix sold by the long-term insurers, with more investment products being sold, which attract relatively lower commissions than risk products.
Figure 2.2 reflects both the monetary value of acquisition costs paid by the long-term insurers for the years 2009 to 2011 and the ratio of acquisition costs incurred relative to the annual premium equivalent of new business written for the respective years:
Figure 2.2 Acquisition cost and ratio to annual premium equivalent (APE)
Source: PwC analysis
2.4 Cost management
Costs
Combined results2011
Rm
2010
Rm
Change
%
Acquisition costs 11 785 10 929 8
General marketing and administration costs 24 950 22 411 11
Annual premium equivalent (APE) 22 285 20 616 8
0
500
1 000
1 500
2 000
2 500
3 000
3 500
SanlamOld MutualMMILibertyDiscovery
Acquisition cost
R m
illio
ns
Per
cent
Acquisition cost to APE ratio
2009 2010 2011 2009 2010 2011 2010 2011 2010 20112009 2010 2011 0
20
40
60
80
100
120

14 | Realising full potential – Insurance industry analysis
As can be seen from the trend in acquisition costs to APE ratio, acquisition costs as a percentage of new business APE have been reducing over the last three years for most companies. One of the reasons for this trend is the change in commission regulations that came into effect in 2009 whereby long-term insurers were no longer allowed to remunerate intermediaries for certain types of investment/savings contracts through upfront commissions as well as amendment to commissions for replacement annuities. The commission structure on these products was changed to align the interest of the policyholder and intermediary and deter intermediaries from unnecessarily churning policies between different insurers.
It is clear from Figure 2.2 that Discovery’s product mix is still heavily weighted towards pure risk products, which attract significantly higher commissions and, as such, acquisition costs is a significant proportion of first-year premium income.
Figure 2.3 Premiums vs expenses
Source: Statistics published by the Association for Savings and Investment SA (ASISA). All offices statistics for 2011 include unit-linked insurers for the first time.
The level of expenses for ‘large’ offices and ‘all’ offices are closely correlated for all periods presented. However, from 2010 the large offices seem to have lost market share to smaller, but faster-growing players in the market. The large offices’ premium levels for 2010 and 2011 were depressed compared to levels seen 2007 to 2009, in nominal terms.
Although premium levels have reduced over the past five years, expenses have continued to increase and were more than 50% up in 2011 compared to 2007 levels.
60
110
160
210
Dec 2011
Jun2011
Dec 2010
Jun 2010
Dec 2009
Jun 2009
Dec 2008
Jun 2008
Dec 2007
Jun 2007
ASISA Large offices: Admin and marketing expenses
ASISA All offices: Admin and marketing expenses
ASISA Large offices: Total group premium
ASISA All offices: Total group premium
Per
cent

PwC | 15
Figure 2.4 Expenses vs CPI
Source: Large offices expenses obtained from statistics published by the Association for Savings and Investment SA (ASISA) and CPI from Statistics SA.
For the period 2007 through to June 2010 the expenses incurred by large insurance offices closely tracked the CPI index. However, over the past 18 months the expenses incurred by long-term insurers grew significantly more than CPI. This is not surprising considering the changes to the regulatory environment within which insurers operate.
In preparation for SAM, insurers have skilled up on actuarial resources, invested in information technology and introduced more stringent risk management procedures in line with the requirements of SAM pillar 2 and the corporate governance recommendations of King III. In light of the costs incurred by European insurers and how far they are in terms of implementation of Solvency II, it can be expected that significant future costs will be incurred to implement SAM in South Africa.
Liberty indicated that it would continue to focus on delivering operational efficiencies and the expense basis in the actuarial valuation was strengthened to provide for a portion of the non-recurring expenses that are now considered to be recurring.
MMI incurred significant restructuring costs as part of planning and implementing the integration of the Momentum and Metropolitan businesses. The merger resulted in the group having in excess of 300 unutilised staff members (who may not be retrenched for two years), of which 100 have since been redeployed in the business. The group is targeting an annual cost saving amounting to R500m to be achieved over the next two to three years.
MMI has said that certain savings have already been achieved, but these were offset by the merger integration costs incurred. If the one-off merger costs were eliminated, core headline earnings would have grown by double digits in the six months ended 31 December 2011.
As one of its priorities for 2012, Sanlam noted the need to improve operational efficiency and to manage costs while still allowing for investment in growth opportunities.
60
110
160
210
Per
cent
Dec 2011
Jun 2011
Dec 2010
Jun 2010
Dec 2009
Jun 2009
Dec 2008
Jun 2008
Dec 2007
Jun 2007
Large offices: % adminand marketing expenses
% CPI

16 | Realising full potential – Insurance industry analysis
3. Short-term insurance

PwC | 17
3.1 Gross written premiums
Adjusted gross written premiums (GWP) increased by 5% during 2011 and, including Outsurance, amounts to R36.6bn for the year. This increase compares with a CPI index of 5% for 2011.
The growth in GWP can be attributed to Santam, which posted a 12% increase in GWP and dominates the market with 22% market share. If this growth is sustained, the company may regain its previous local market share of 25%. Santam grew the GWP on its motor book by 14%. It improved the underwriting margin on this class of business where insurers have struggled in recent years.
Outsurance posted double-digit GWP growth in the six months to December 2011. This strong growth was achieved while maintaining an underwriting margin in excess of 20%. This result includes Youi, Outsurance’s Australian start-up business, which posted GWP in this period of R0.5bn. This is comparable to the GWP achieved for the full year ended 30 June 2011.
Mutual & Federal posted annual growth of 3% p.a. over the past two years and the company indicated that it has increased its focus on achieving premium growth through alternative distribution channels, including direct through iWyze, underwriting management agencies and niche businesses.
Although Zurich’s business volumes declined by 16% to below R4bn, the company has been able to reduce its underwriting loss over the past two years and almost achieved a positive margin for 2011. The group said that its ongoing management actions to improve the quality of business and reduce costs are continuing to increase profitability.
Gross written premiums
Combined results2011
Rm
Adjusted 20111
Rm
2010
Rm
2009
Rm
Gross written premiums 36 646 30 167 28 721 28 490
Net earned premiums 30 694 24 489 23 914 23 680
1 The adjusted 2011 numbers exclude Outsurance. Detailed comparative information for 2010 and 2009 is not publicly available.

18 | Realising full potential – Insurance industry analysis
Figure 3.1 Gross written premuims (GWP) vs underwriting margin
Source: PwC analysis
0
5 000
10 000
15 000
20 000
25 000
30 000
35 000
40 000
201120102009
Santam GWP
Outsurance GWP
M&F GWP
Combined underwriting margin
Zurich GWP
Combined underwriting margin excluding Outsurance
-2
1
4
7
10
R m
illio
ns
Per
cent
Key ratios
Combined results2011 Adjusted 20111 2010 2009
Claims ratio 61.9% 64.6% 65.0% 72.8%
Acquisition cost ratio 11.3% 13.6% 14.9% 15.6%
Expense ratio 17.8% 15.5% 13.7% 12.0%
Combined ratio 90.9% 93.7% 93.6% 100.4%
Underwriting margin 9.1% 6.3% 6.4% -0.4%
Total 100.0% 100.0% 100.0% 100.0%
1 The adjusted 2011 numbers exclude Outsurance. Detailed comparative information for 2010 and 2009 is not publicly available.
Most companies achieved similar claims ratios in 2011 as compared to 2010, with Zurich’s claims ratio improving from 69.4% to 65.9% in 2011. With the inclusion of Outsurance from 2011, the overall claims ratio reduces by 2.7 percentage points, which is reflective of the company’s 20% underwriting margin, albeit off a lower but fast-growing base. Despite the major weather-related losses in the first quarter of the year, the absence of large weather-related events in the second half of 2011 assisted companies to maintain their claims ratios.
The acquisition cost ratio indicates an interesting trend with the ratio steadily declining from 2009 through 2011 to 13.6%. When including Outsurance, a direct marketing insurer, this ratio reduces further to 11.3%. The move to direct marketing distribution channels is reflected in the administrative expense ratio, which has increased from 12% in 2009 to 15.5% in 2011 (17.8% when including Outsurance).

PwC | 19
The reduction in acquisition costs and corresponding increase in administrative expenses is a result of the launch of Miway by Santam and iWyze by Mutual & Federal – not surprising when one considers the underwriting margin achieved by Outsurance. It could be challenging for other direct players to operate at this level. When one considers the combined acquisition and expense ratios (excluding Outsurance), this has increased from 27.6% in 2009 to 29.1% in 2011. The challenge for fast-growing businesses is to manage adverse selection and to achieve economies of scale coupled with tight cost control.
When considering the underwriting margin, different themes emerge. Within Santam, the costs incurred in getting the MiWay business off the ground are reflected in the results, but without the corresponding goodwill that has been created. With expenses of over R500m (and staff of approximately 980) since its launch in February 2008, it is not surprising that the underwriting margin has reduced from 8.4% in 2010 to 7.7% in 2011. However, the net loss ratio of Miway has been stabilised below 70%.
Zurich has made progress in stemming its underwriting losses from 15.1% in 2009 to 0.5% in 2011. This improvement is attributable to the discontinuance of non-profit-making business or repricing to appropriate levels and this is evidenced by the reduction in gross written premiums.
Mutual & Federal posted slightly lower underwriting margins, which was attributed to a more normalised year in 2011 compared to the favourable trading conditions experienced in 2010.
Outsurance experienced a very good second half in 2011 driven by low claims ratios and posted an underwriting margin of 20%.
Most short-term insurance business written in South Africa relates to policies that can be repriced on an annual basis. The business is also typically short-tail in nature, i.e. the period between the date at which a claim is incurred and it being reported to the insurance company is fairly short. As a result, there is not a significant amount of uncertainty inherent in the measurement of liabilities of short-term insurers in South Africa.

20 | Realising full potential – Insurance industry analysis
4. Investment performance

PwC | 21
When reviewing an insurer’s investment performance, it is important to understand the underlying factors that drive performance. To put the insurers’ 2011 performance into perspective, a closer look at the JSE All Share Index and bond market is required.
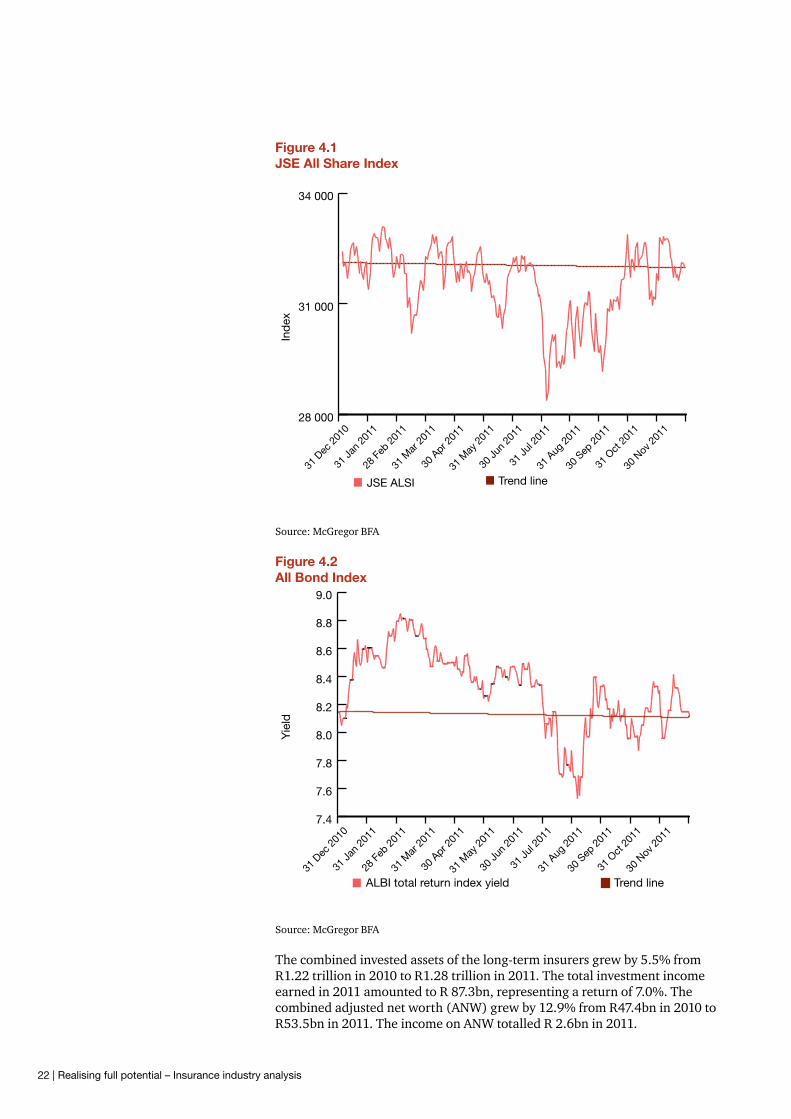
In 2011, the JSE All Share Index delivered a lower than ordinary performance closing 0.4% lower than at the start of the year. When taking a more in-depth look at Figure 4.1, high volatility was experienced in the second half of 2011 with a significant dip in August and a noteworthy rise in October. The main reason for this performance was the European sovereign debt crisis, which increased uncertainty in the market.
Although the JSE All Share Index closed marginally lower than in 2010, insurers still benefited from a higher average asset base in 2011. The 12% increase in average asset base assisted insurers in generating higher asset-based fee income.
The yield on the All Bond Index is no different as the closing yield of 8.12% is close to the opening yield of 8.15%, but with a fair amount of volatility experienced during the year.
Long-term insurers
Combined results2011
Rm
2010
Rm
Change
%
Total invested assets1 1 288 020 1 220 588 6%
Income on invested assets 87 267 137 610 -37%
Return on average invested assets3 7.0%
Adjusted net worth per embedded value report2 53 483 47 388 13%
Income on adjusted net worth2 2 550 3 868 -34%
Return on average adjusted net worth2 5.1% 8.4%
Source: PwC analysis
Short-term insurers
Combined results2011
Rm
2010
Rm
Change
%
Total invested assets1 28 630 27 709 3%
Income on invested assets3 1 741
Return on average invested assets3 6.2%
Source: PwC analysis ¹ Invested assets comprise the group financial assets as well as the cash and cash equivalents of the insurers (for Old Mutual the emerging market segment information has been used). This includes all policyholder and shareholder assets. 2 This information has been taken from the group embedded value reports of the long-term insurers, but excludes MMI as insufficient information was available to calculate the return on average adjusted net worth for the newly formed group. 3 The combined return on average invested assets for 2010 could not be calculated as there is insufficient information available for MMI and Outsurance.
22 | Realising full potential – Insurance industry analysis
Figure 4.1 JSE All Share Index
Source: McGregor BFA
Figure 4.2 All Bond Index
Source: McGregor BFA
The combined invested assets of the long-term insurers grew by 5.5% from R1.22 trillion in 2010 to R1.28 trillion in 2011. The total investment income earned in 2011 amounted to R 87.3bn, representing a return of 7.0%. The combined adjusted net worth (ANW) grew by 12.9% from R47.4bn in 2010 to R53.5bn in 2011. The income on ANW totalled R 2.6bn in 2011.
28 000
31 000
34 000
JSE ALSI Trend line31
Dec
201
0
31 Ja
n 20
11
28 F
eb 2
011
31 M
ar 2
011
30 A
pr 201
1
31 M
ay 2
011
30 Ju
n 20
11
31 Ju
l 201
1
31 A
ug 2
011
30 S
ep 2
011
31 O
ct 2
011
30 N
ov 2
011
Ind
ex
7.4
7.6
7.8
8.0
8.2
8.4
8.6
8.8
9.0
ALBI total return index yield Trend line31
Dec
201
0
31 Ja
n 20
11
28 F
eb 2
011
31 M
ar 2
011
30 A
pr 201
1
31 M
ay 2
011
30 Ju
n 20
11
31 Ju
l 201
1
31 A
ug 2
011
30 S
ep 2
011
31 O
ct 2
011
30 N
ov 2
011
Yie
ld
PwC | 23
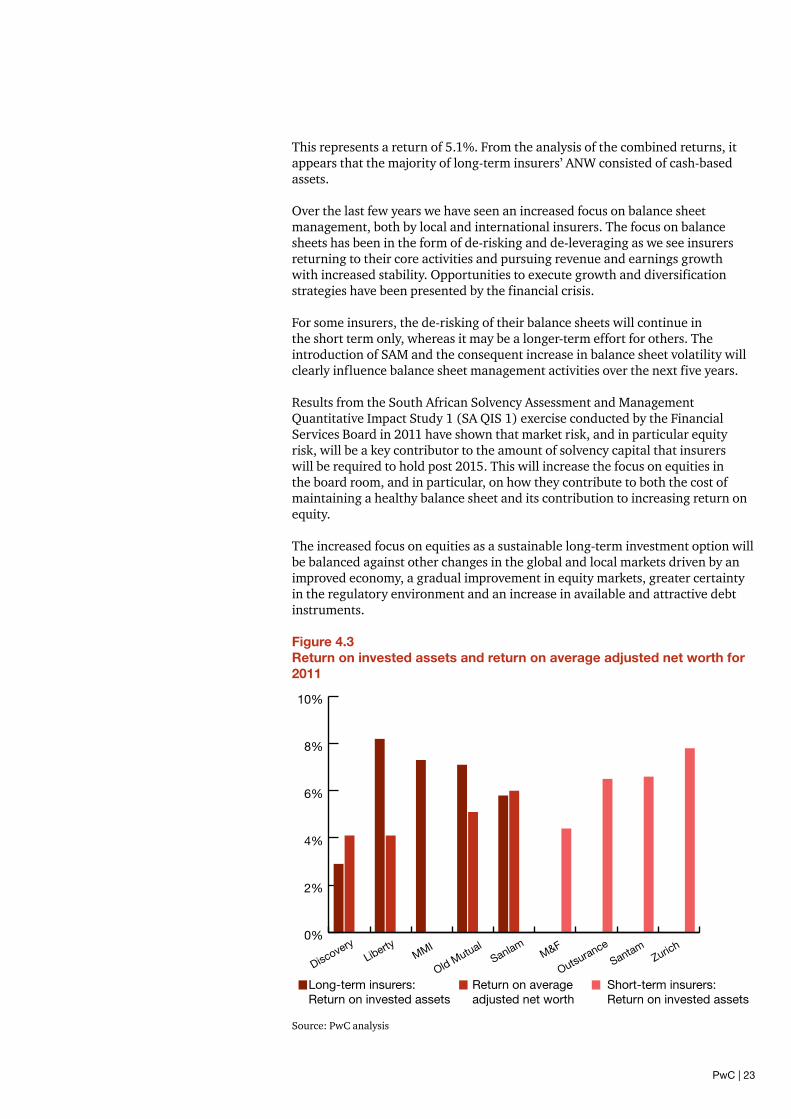
This represents a return of 5.1%. From the analysis of the combined returns, it appears that the majority of long-term insurers’ ANW consisted of cash-based assets.
Over the last few years we have seen an increased focus on balance sheet management, both by local and international insurers. The focus on balance sheets has been in the form of de-risking and de-leveraging as we see insurers returning to their core activities and pursuing revenue and earnings growth with increased stability. Opportunities to execute growth and diversification strategies have been presented by the financial crisis.
For some insurers, the de-risking of their balance sheets will continue in the short term only, whereas it may be a longer-term effort for others. The introduction of SAM and the consequent increase in balance sheet volatility will clearly influence balance sheet management activities over the next five years.
Results from the South African Solvency Assessment and Management Quantitative Impact Study 1 (SA QIS 1) exercise conducted by the Financial Services Board in 2011 have shown that market risk, and in particular equity risk, will be a key contributor to the amount of solvency capital that insurers will be required to hold post 2015. This will increase the focus on equities in the board room, and in particular, on how they contribute to both the cost of maintaining a healthy balance sheet and its contribution to increasing return on equity.
The increased focus on equities as a sustainable long-term investment option will be balanced against other changes in the global and local markets driven by an improved economy, a gradual improvement in equity markets, greater certainty in the regulatory environment and an increase in available and attractive debt instruments.
Figure 4.3 Return on invested assets and return on average adjusted net worth for 2011
Source: PwC analysis
0%
2%
4%
6%
8%
10%
ZurichSantam
OutsuranceM&F
Sanlam
Old MutualMMI
Liberty
Discovery
Long-term insurers: Return on invested assets
Short-term insurers: Return on invested assets
Return on average adjusted net worth

24 | Realising full potential – Insurance industry analysis
Discovery grew its invested assets by 44.8% from R13.4bn in 2010 to R19.4bn in 2011. The increase in investments is mainly attributable to growth in Discovery’s invest segment, which was introduced in October 2007. The increase experienced is further indicative of the strong growth phase Discovery is currently enjoying.
Discovery’s ANW grew by 32.6% from R2.3bn in 2010 to R3.1bn in 2011.
Liberty’s investments grew by 6.8% from R 228.2bn in 2010 to R 243.6bn in 2011. The past year saw Liberty’s institutional and asset management segments focus on improving their investment performance and investing in new capabilities.
Liberty manages a low-risk, balanced shareholder investment portfolio through LibFin Investment. The mix in the shareholder investment portfolio changed from 2010 to 2011 because of market volatility. The main changes to the shareholder investment portfolio are the investment in local equities, which decreased from 23% to 15% and an increase in the local cash investment of 20% to 27%, which reflects a preference for low-risk investments.
When analysing Liberty, the ANW grew by 9.3% from R12.5bn in 2010 to R13.6bn in 2011.
MMI grew its invested assets by 2.9% from R263.7bn in 2010 to R271.3bn in 2011. Based on the performance of MMI’s Momentum investments segment, the company indicated they will focus on improving the performance of its balanced portfolio and client retention.
MMI revised its investment mandate with regards to shareholder capital in 2011. The new mandate is now less risky mainly due to an 8% decrease in the investment in equities and an increase of 10% in interest-bearing and cash investments. The change was primarily driven to align the mandate for both Momentum and Metropolitan with the MMI strategy.
Old Mutual’s invested assets grew by 4.4% from R393.1bn in 2010 to R410.3bn in 2011. Old Mutual’s ANW grew by 19.7% from R18.5bn in 2010 to R22.2bn in 2011.
Sanlam’s invested assets grew by 6.6% from R 322.3bn in 2010 to R343.5bn in 2011. Sanlam’s ANW grew by 3.7% from R14.0bn in 2010 to R14.6bn in 2011.
Looking ahead to 2012, the big question is whether decisions in Europe on the debt crisis will reduce market volatility. Insurers are cautiously optimistic about the recovery of investor confidence in the market in 2012, providing the Eurozone delivers, which in turn will drive improved returns.

PwC | 25
5. Capital and solvency

26 | Realising full potential – Insurance industry analysis
5.1 Long-term insurance
Capital adequacy requirement cover
2011 2010 Change %
Discovery Life Ltd 4.4 3.9 13
Liberty Group Ltd 2.9 2.7 8
MMI 2.3 2.5 -8
Old Mutual Life Assurance Co (SA) Ltd 4.0 3.9 3
Sanlam Life Insurance Ltd 3.7 3.4 9
Discovery is in a growth phase and the company has indicated it will continue to invest profits made on the long-term insurance business back into the business. The group is also investing approximately 5-7% of operating profits towards the development of new businesses and aims to achieve a return on capital of the risk-free rate plus 10%. Given the group’s growth and its reinvestment policy, it is unlikely that Discovery will pay significant dividends in the near future.
Liberty declared a dividend of 77 cents per share in order to fully pass available STC credits to shareholders. It is the intention of the board to pay a full-year dividend in accordance with the group’s dividend policy on or after 1 April 2012. Liberty indicated that the current level of the capital adequacy requirement (CAR) cover is above its target range. Liberty indicated that its results under SAM QIS1 are in line with the average of industry participants.
MMI is in the process of changing its mandate for shareholders’ assets/capital for Metropolitan to a more conservative strategy of holding cash and cash equivalents. This has the result of reducing the level of required capital (and an increased cost of capital for embedded value purposes). The group confirmed that it remains financially sound under SAM QIS1 and that under its economic capital model, it had a capital buffer of R4bn which provides flexibility for growth. The group has commenced the process to amalgamate and rationalise its number of life licences.
The Old Mutual plc group is in the process of rationalising its different debt issues in order to simplify the overall group capital structure. Old Mutual South Africa remained well capitalised with a CAR cover of 4.0 at 31 December 2011.
Sanlam held R1.9bn of discretionary capital at the end of 2011 after having made allowance for the capital committed to emerging market acquisitions as well as share buy-backs of R979m during 2011. Sanlam’s discretionary capital is substantially earmarked for corporate activity and expansion of the group’s footprint in Africa and India.

PwC | 27
5.2 Short-term insurance
International solvency margin
20111 2010 2009Combined solvency margin 50% 48% 43%
Individual companies Mutual & Federal Outsurance Santam Zurich
2011 54% 50% 48% 68%
2010 63% - 45% 52%
1 Includes Outsurance whose solvency margin is also 50%.
As part of the ongoing management programme in the Old Mutual group, Mutual & Federal restructured its capital base and paid almost R1bn in dividends during 2011. Mutual & Federal indicated that it continue to make good progress in preparation for SAM.
Outsurance estimates that neither the interim nor final SAM measures will result in a material increase in the capital requirements of its regulated entities.
Santam’s solvency margin, which has been calculated including its subordinated debt amounting to R964m, has marginally increased to 48%. The company’s target solvency range remains between 35% and 45% and it declared a special dividend of R8.50 per share after year end.
Santam has observed that its statutory solvency requirements could increase to approximately 35% depending on the final SAM outcomes. However, it said that the economic capital requirement is currently below 25%.
The increase in Zurich’s solvency margin is primarily the result of the reduced levels of premiums written in 2011.
28 | Realising full potential – Insurance industry analysis
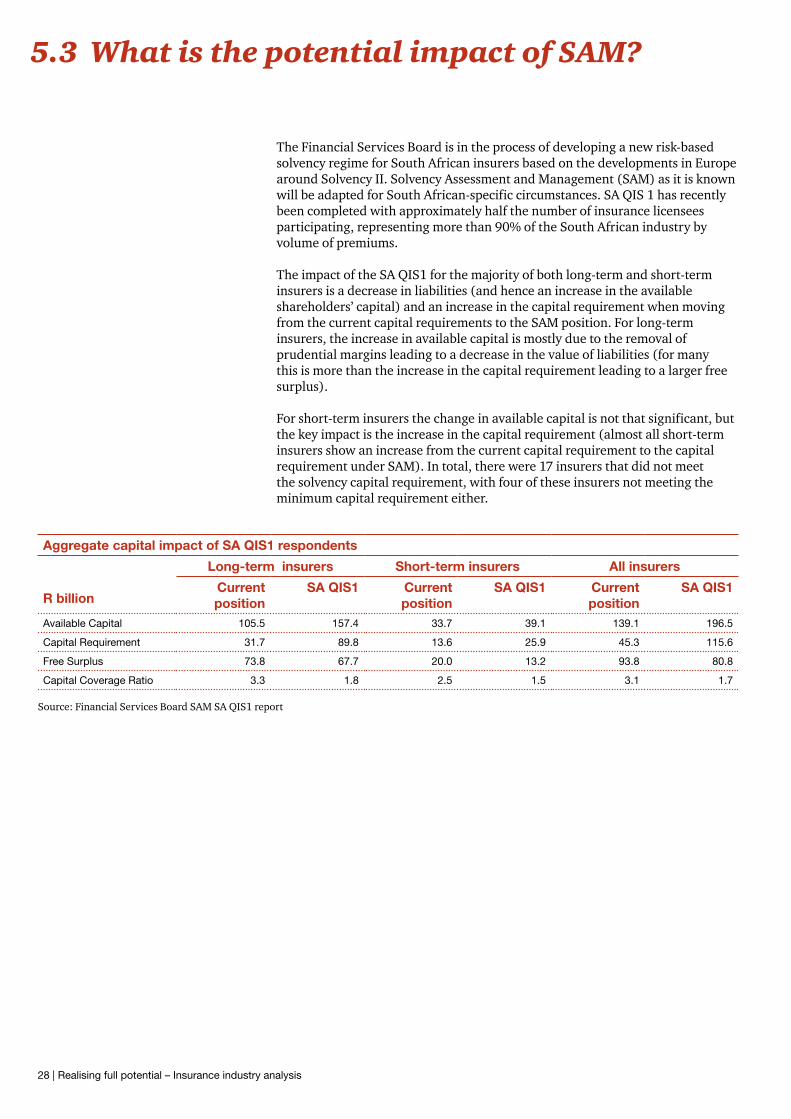
The Financial Services Board is in the process of developing a new risk-based solvency regime for South African insurers based on the developments in Europe around Solvency II. Solvency Assessment and Management (SAM) as it is known will be adapted for South African-specific circumstances. SA QIS 1 has recently been completed with approximately half the number of insurance licensees participating, representing more than 90% of the South African industry by volume of premiums.
The impact of the SA QIS1 for the majority of both long-term and short-term insurers is a decrease in liabilities (and hence an increase in the available shareholders’ capital) and an increase in the capital requirement when moving from the current capital requirements to the SAM position. For long-term insurers, the increase in available capital is mostly due to the removal of prudential margins leading to a decrease in the value of liabilities (for many this is more than the increase in the capital requirement leading to a larger free surplus).
For short-term insurers the change in available capital is not that significant, but the key impact is the increase in the capital requirement (almost all short-term insurers show an increase from the current capital requirement to the capital requirement under SAM). In total, there were 17 insurers that did not meet the solvency capital requirement, with four of these insurers not meeting the minimum capital requirement either.
5.3 What is the potential impact of SAM?
Aggregate capital impact of SA QIS1 respondents
R billion
Long-term insurers Short-term insurers All insurers
Current position
SA QIS1 Current position
SA QIS1 Current position
SA QIS1
Available Capital 105.5 157.4 33.7 39.1 139.1 196.5
Capital Requirement 31.7 89.8 13.6 25.9 45.3 115.6
Free Surplus 73.8 67.7 20.0 13.2 93.8 80.8
Capital Coverage Ratio 3.3 1.8 2.5 1.5 3.1 1.7
Source: Financial Services Board SAM SA QIS1 report

PwC | 29
6. The insurance financial reporting landscape

30 | Realising full potential – Insurance industry analysis
6.1 Introduction
The last number of years has been tough for investors in the South African insurance sector. While this is principally a reflection of economic uncertainty and market volatility, financial reporting has also played a part. Here, confusing and disjointed reporting can make it difficult to judge a company’s strategy and discern the true value being created in the business.
Investors’ underlying concern is that seemingly unconnected disclosures and different reporting bases may be symptomatic of poor information and a lack of strategic coherence. Combine this with a challenging market and economic environment and it’s not hard to see why the share prices of many insurers have lagged behind general market performance. The lack of investor confidence in insurance business models has exacerbated the extent to which share prices are driven by short-term market movements.
This is not a new problem and internationally the search for a solution has been going on for many years. Yet, there is a growing realisation that the hunt for a ‘magic metric’ for reporting will probably not be forthcoming. The International Accounting Standards Board has been discussing various reporting alternatives extensively over a number of years with input from preparers, users, regulators and auditors without reaching common ground about what measure tells a succinct story.
The complex nature of the insurance business probably demands a ‘dashboard’ of multiple measures, consistently applied throughout the business, with improved understanding of the links between new business, management of the existing book of business, risk and capital. Nonetheless, not all South African insurers have embarked on an exercise to improve their financial reporting in an ever-changing landscape.
Fixing financial reporting won’t in itself overcome any problems in the business model, but it will make sure that the objectives of the business and performance against them are clear to people within the organisation as well as to analysts and investors. Achieving strategic clarity will make it easier to differentiate the business, cut through to the real drivers of value and to focus on sustainable value creation.
Drawing on an analysis of current reporting and how it could be improved, we explore how insurers can bridge the information gap to generate sustainable value by enhancing reporting and strengthening investor confidence.
Are you confident that the market understands your strategy and what makes your business successful and is this being conveyed effectively?
6.2 Realising full potential
Most of the blame for disappointing share price performance clearly lies with the continuing economic, market and regulatory uncertainty. However, disjointed and inconsistent financial reporting has also been a contributory factor, making it difficult to judge the strategy and true strength and potential of the business.
Over the years, numerous global PwC surveys have highlighted equity analysts’ frustration over how a myriad of measures serves to undermine investor understanding and confidence. This is also true in South Africa where most life companies have different key performance indicators. Users are provided with pages of numbers containing different measurement matrices that they believe fail to tell them what is actually happening within the company and might not reflect how management runs the business.

PwC | 31
Problems with reporting are, of course, not new. On the life side in particular, there has been a long search for a credible, relevant and consistent metric that can be used for internal steering and external reporting. Yet, this ‘holy grail’ of reporting remains undiscovered. A concern for the capital markets is that embedded value may overvalue some product types, while undervaluing others.
The difficulties many insurers face in presenting clear, coherent and compelling messages to analysts and investors are highlighted in our analysis of 10 leading insurers in nine key areas (our approach and a summary of the results are set out in Figure 6.1 later in this section).
The key points that emerge are as follows:
• Long-term insurers still focus on embedded value with IFRS earnings still being a secondary measure to many. However, many are aware of the need to focus on an alternative performance measure such as MMI’s core headline earnings, Old Mutual’s adjusted operating profit and Liberty’s underlying core operating earnings. What is unfortunate is the fact that none of these alternative measures are fully comparable in the industry.
• South African insurers have not followed suit with their European counterparts where measures such as free capital generation and analysis of IFRS life margins are becoming more common. Many South African insurers have not taken their annual financial reporting forward since the initial adoption of IFRS necessitated a relook at their financial reporting. Even among those that have, the metrics need to be more reflective of the way the business is managed, and linked together in a far more coherent way.
• While short-term insurance reporting doesn’t suffer from anything like the same problems, we still see room for improvement. For example, the exposure to insurance risk and data in liability triangles needs to be put into context and more effectively explained. There are limited disclosures explaining the inherent risks in these liabilities and the extent that management’s estimates and judgements applied to these liabilities could turn out differently from that expected.
• For most insurers, capital and solvency disclosures come across as arbitrary and not linked to the way the business is run. In turn, risk disclosures tend to be boilerplate in nature, with very little analysis of the ‘real-world’ impact of different stresses and scenarios.
• Segmental analysis of IFRS balance sheets, if presented, often fails to reflect a meaningful view of the capital in the business. Segmental results seldom follow broad product classifications such as pure risk products, pure savings (including investment contracts with discretionary participation features) and spread business. Segments are often aligned according to the customer (i.e. retail or corporate), distribution channels or along geographical markets. As a result, divisional results often fail to give a clear view of underlying operating performance and returns. This significantly hinders any useful attempt at the projection of future expected performance. In summary, segmental reporting is not always reflective of the way one could expect an insurance company to be managed.
• Limited information is provided on expenses to acquire new business versus expenses to manage existing business as well as once-off non-recurring project costs. As a result, it is difficult to project future costs with any reasonable level of certainty.
Are key components of what makes your business successful missing from external reporting?

32 | Realising full potential – Insurance industry analysis
• Information provided on the investment guarantees written generally follows the prescribed minimum disclosures in PGN 110 (the Actuarial Society’s guidance on reserving for investment guarantees), but with very limited information as to the true exposure of the insurance entity with reference to the level of guarantees provided and current market returns achieved on backing assets with a linkage to how this impacts on the liability held for these guarantees.
The majority of South African long-term insurance companies still place significant reliance on embedded value reporting. Embedded value is criticised for, among other things, its focus on new business as well as the aggressive discount rate often applied to future profit yet to be realised by the insurer (over more than 20 years).
IFRS earnings do not place the same weight and are not impacted in the same way by the level of new business written as embedded value reporting. However, insurers do very little to break down IFRS results in their annual reports. The embedded value performance is also not reconciled to performance on an IFRS basis. IFRS earnings could be analysed along insurance/investment margins, expense management and other assumptions as part of liability management as follows:
• Insurance business spread/risk margin and investment fee-based margins as they relate to new business’ contribution and expected fees/return on existing business;
• Expenses as they relate to acquisition and maintenance activities. Acquisition costs could be differentiated between costs for new business written and those ongoing costs relating to existing business. Maintenance expenses could be analysed with variances in the current period between actual and expected cash flows as well as changes in the prospective cash flow assumptions (cost per policy) explained;
• Liability management would relate to explanation of the management of other key assumptions (excluding expenses) that significantly influence the liabilities of insurers such as mortality and persistency assumptions. Again distinction could be made between variances between expected and actual experience as well as the prospective changes in assumption for these key areas.
Using such an analysis of IFRS earnings across the broad categories of typical products written by insurers, namely risk products, fee-based business and spread-based business, would be beneficial to users. This should be done in a simple manner that depicts the key aspects of a successful insurance model, namely, growing assets, earning a margin on those assets, managing key performance indicators of insurers’ liabilities such as mortality, persistency as well as expenses and doing this effectively.
Key elements of insurers’ business model
Does external reporting reflect the way the business is run?
Increase assets
Maximise revenue
Manage liabilities
Lower costs
Driving IFRS profits
PwC | 33
An overriding problem is the inability to ‘join the dots’ between different reporting metrics to analyse the performance of the business in an integrated way and to cut through the escalating complexity of disclosure. The length of reports increases each year with a tendency to bolt on more data rather than hone in on what is important.
As a result, most annual reports lack clear links between strategy, performance and shareholder value. It is questionable whether insurers are doing enough to articulate the direction of their businesses and their specific investment strategies.
Investor concerns over a lack of clear direction and the information to support it go beyond external disclosure to the heart of the business itself. Analysts are asking, ‘If we’re finding it so difficult to fathom the strategy of the business and how it’s performing against this, are management any clearer than us?’ It’s certainly reasonable to ask boards, ‘What metrics do you manage the business to, are you reporting these and if not, why not?’ Similarly, if there are measures that analysts view as important, which are not being reported internally, could these be used to help manage performance?
6.3 Rating insurance reporting
Our insurance industry team carried out an assessment of reporting by 10 leadingSouthAfricaninsurersintheirDecember2010/June2011annualreports. Our focus was principally on quantitative disclosures rather than on qualitative factors.
Each company was rated on a scale of 0-3 for each of the nine areas evaluated. Our analysis was determined by the following considerations: 0 – No information provided, 1 – ‘Bare bones’ data only, 2 – Covering the basics, and 3 – Goodquantitativeanalysis.

34 | Realising full potential – Insurance industry analysis
Figure 6.1 Rating insurance reporting
The results of this analysis show that the lowest scores relate to IFRS margin disclosures, IFRS segment balance sheet data and data on solvency movements in stressed scenarios. These are, for the most part, more difficult for life insurers to address.
Rating each category
% of companies
Low High
0 1 2 3
IFRS segment balance sheet data Diverse reportable segments across industry with
limited balance sheet data and information on capital
allocated to segments.
Solvency data Companies are still developing their economic capital
models and only a limited number of companies are
currently using economic capital models.
Information on solvency movements
in stress scenarios
Very limited solvency sensitivity information provided.
IFRS long-term insurance margin 1 Very little information provided with no link to profit
drivers.
New business metrics 1 Some provide additional information along major
product lines and some regional analysis.
Embedded value reporting 1 Minimum levels of EV reporting are being met with
some good examples of product/regional analysis
and commentary.
Information on investment
guarantees 1
Minimum PGN 110 disclosures provided and very
limited information on exposure to guarantees
provided.
Dashboard of multiple performance
measurers 1
Increasing use of alternative performance measures,
but not integrated into reporting.
Short-term insurance run-off
triangles 2
Annual run off triangles provided. Limited explanation
provided about development patterns over time.
Source: PwC analysis
1 Surveyed long-term insurers only 2 Surveyed short-term insurers only

PwC | 35
Although there have been efforts to improve some aspects of reporting, especially risk management disclosures and the inclusion of an integrated report, there is still room for improvement. Given our analysis of insurance reporting in South Africa, we think all insurers have the ability to significantly improve the quality of their disclosure.
There are a number of reasons why progress has been patchy. Most insurers have been holding out for the new IFRS insurance contract standard (Phase II) as the solution or are waiting for economic conditions to improve and hoping that share prices will follow suit.
More recently, with the new Solvency Assessment and Management (SAM) regulatory developments, many insurers needed to prioritise systems and operational challenges to implement the new solvency regime. It goes without saying that the legacy systems, which are prominent at many larger and well-established insurers, hinder the ease with which information can be generated for reporting.
In the United Kingdom, the Financial Reporting Council (FRC) has increased efforts to improve the quality of companies’ reporting and to reduce clutter in annual reports as part of that broader objective.
The FRC’s discussion paper notes the following:
• Scope for segregating standing data, either to a separate section of the annual report or to the company’s web site (subject to the latter being permissible in law);
• Elimination of immaterial disclosures that are unhelpful and should not be provided;
• Barriers to reducing clutter are mainly behavioural; and
• Requirement for continued debate about what materiality means from a disclosure perspective.
Old Mutual has announced that its 2011 annual report will be reduced by 100 pages and has specifically asked for feedback from users as to whether the accounts are more user-friendly now since they have reduced the duplication previously included in the accounts.
Following its launch in 2010, King III introduced integrated reporting, which builds on established elements of reporting, such as the business review and financial performance. While this places South Africa ahead of its global counterparts, insurers have not yet fully implemented and achieved the potential benefits that an integrated report will deliver by bringing together material information about an organisation’s strategy, governance, performance and prospects in a way that reflects the commercial, political, social and environmental context within which it operates.
Before any change to reporting can be made, it is imperative that analysts and investors expectations are met. Do they want embedded value, SAM, cash or IFRS?
6.4 Taking the initiative
Do your risk, finance and actuarial teams collaborate sufficiently?

36 | Realising full potential – Insurance industry analysis
Have you decided on your SAM external disclosure strategy?
While these concerns are all understandable, we think that insurers should use the challenging business and market conditions as a catalyst for improvement:
• In a volatile environment, analysts’ doubts about prevailing disclosure standards can only heighten economic uncertainty, making it even more important to convince investors that the business is in better shape than it is given credit for.
• Assessing what reporting metrics are important should be a key objective irrespectiveofthetimingofIFRS 4Phase IIsincethisisindependentoffuturechanges in the measurement of insurance contracts.
• With the design and build phase for SAM well on its way, insurers should be starting to ask themselves what they are going to use this data for, how to embed the information within the running of the business and what to disclose externally.
• The financial crisis has shown companies the need for a reporting framework capable of explaining both current developments as well as a forward-looking perspective in an integrated way.
These issues are worth addressing even if the focus is only on how to improve the external reporting part of the equation. However, the real value for insurers and ultimately shareholders will come from reassessing what is important within the business itself. In particular, it would help to make sure that management information is sufficiently coherent, consistent and ultimately more useful in informing key business decisions.
6.5 On the front foot
Improved reporting can’t overcome the impact of the fragile economic and market outlook. However, it can put insurers firmly on the front foot by helping them to crystallise and convey the strengths and key value drivers within their businesses. It can reinforce performance management and provide strategic clarity on the future landscape, as well as making it easier to articulate and communicate where a company wants to be and how it intends to get there. In turn, the company can convey a more coherent statement of its strategic intent to analysts and investors and provide them with the telling information they need to track and rate progress.
Our analysis highlights information gaps facing insurers and the hard work ahead if they are to create a distinctive message and move the market beyond ‘macro play’ concerns (especially for the more mature businesses). However, it also shows that forward-looking insurers are beginning to address these issues and should be in a much stronger position to bring investors with them as they continue along this course.

PwC | 37
7. Key industry statistics
Lon
g-te
rm in
sure
rs
R m
illio
nsD
isco
very
Lib
erty
MM
IO
ld M
utua
l S
anla
mC
om
bin
ed
2011
2010
2009
Cha
nge %
2011
2010
2009
Cha
nge %
2011
2010
Cha
nge %
2011
2010
2009
Cha
nge %
2011
2010
2009
Cha
nge %
2011
2010
Cha
nge %
Gro
up c
ons
olid
ated
IFR
S e
arni
ngs
Tota
l co
mp
rehe
nsiv
e in
com
e at
trib
utab
le t
o eq
uity
hol
der
s2
675
1 74
41
709
53%
2 73
62
302
3719
%1
454
1 94
8-2
5%6
670
4 42
21
501
51%
5 60
15
115
4 07
9 10
%19
136
15 5
3123
%
Eq
uity
at
trib
utab
le t
o eq
uity
hol
der
s of
par
ent
10 8
449
168
7 80
818
%13
211
11 7
1610
515
13%
22 3
1122
572
-1%
26 9
2918
987
18 3
5742
%33
822
31 7
7829
644
6%
Ret
urn
on
equi
ty27
%21
%24
%22
%21
%0%
6%9%
29%
24%
7%17
%17
%14
%19
%17
%12
%
Gro
up c
ons
olid
ated
em
bed
ded
val
ue
Gro
up
emb
edd
ed
valu
e28
416
24 0
7420
887
18.0
%28
639
26 0
3024
118
10.0
%30
811
31 1
18
-1.0
%39
778
34 0
5829
359
16.8
%63
521
57 3
6151
024
10
.7%
191
165
172
641
11%
Gro
up
emb
edd
ed
valu
e p
rofit
/
(loss
es)
4 82
73
557
805
35.7
%3
981
3 22
3-1
777
23.5
%1
659
n/a
5 51
75
779
3 00
3-4
.5%
9 40
59
322
7 44
90.
9%25
389
21 8
8116
%
Ret
urn
on g
roup
em
bed
ded
va
lue
20.1
%17
.0%
3.9%
15.3
%13
.4%
-6.5
%5.
3%n/
a11
.9%
13.2
%9.
8%16
.4%
18.3
%16
.5%
14.7
%17
.5%
Em
bed
ded
val
ue o
f S
out
h A
fric
an n
ew b
usin
ess
Pre
sent
va
lue
of n
ew
bus
ines
s p
rem
ium
s (P
VN
BP
)14
440
14 3
1811
236
1%28
329
22 4
9823
082
26%
41 7
6940
054
4%33
739
32 1
6535
011
5%23
353
20 2
8715
%14
1 63
012
9 32
2 10
%
Em
bed
ded
va
lue
of n
ew
bus
ines
s (V
NB
)1
047
840
746
25%
389
252
301
54%
563
570
-1%
981
814
739
21%
701
507
38%
3 68
12
983
23%
Valu
e of
new
b
usin
ess
mar
gin
7.3%
5.9%
6.6%
24%
1.4%
1.1%
1.3%
27%
1.3%
1.4%
-5%
2.9%
2.5%
2.1%
16%
3.0%
2.5%
20%
2.60
%2.
31%
13%
Ave
rage
p
ayb
ack
per
iod
(y
ears
)8.
28.
48.
0-3
%5.
65.
3 5.
36%
7.6
7.5
1%6.
46.
67.
3-3
%5.
04.
68%
6.4
6.3
Co
st m
anag
emen
t
Acq
uisi
tion
cost
s1
547
1 55
51
402
-1%
2 89
0 2
652
2 89
59%
2 78
42
421
15%
2 59
62
477
2 42
35%
1 96
81
824
n/a
8%11
785
10 9
298%
Gen
eral
m
arke
ting
and
ad
min
istr
atio
n ex
pen
ses
1 30
61
224
1 10
67%
4 36
44
141
3 87
15%
3 58
03
462
3%12
525
10 6
4310
115
18%
3 17
52
941
n/a
8%24
950
22 4
1111
%
Ann
ualis
ed
Pre
miu
m
Eq
uiva
lent
(A
PE
)1
767
1 70
01
396
4%5
041
4 25
94
380
18%
5 52
85
371
3%5
254
4 86
24
821
8%4
695
4 42
4n/
a6%
22 2
8520
616
8%

PwC | 39R m
illio
nsD
isco
very
Lib
erty
MM
IO
ld M
utua
l S
anla
mC
om
bin
ed
2011
2010
2009
Cha
nge %
2011
2010
2009
Cha
nge %
2011
2010
Cha
nge %
2011
2010
2009
Cha
nge %
2011
2010
2009
Cha
nge %
2011
2010
Cha
nge %
Inve
stm
ent
per
form
ance
Inve
sted
ass
ets
19 3
7713
378
8 99
245
%24
3 58
022
8 16
920
9 83
67%
271
251
263
665
3%41
0 28
539
3 09
735
7 32
64%
343
527
322
279
300
258
7%1
288
020
1 22
0 58
86%
Inve
stm
ents
16 7
9911
482
6 75
246
%23
6 91
622
2 31
119
9 19
97%
254
724
244
890
4%40
6 02
738
1 36
735
5 07
36%
329
150
310
091
288
278
6%1
243
616
1 17
0 14
16%
Cas
h an
d c
ash
equi
vale
nts
2 57
81
896
2 24
036
%6
664
5 85
810
637
14%
16 5
2718
775
-12%
4 25
811
729
2 25
3-6
4%14
377
12 1
8811
980
18%
44 4
0450
446
-12%
Inco
me
on
inve
sted
ass
ets
469
918
919
-49%
19 2
2726
200
19 3
80-2
7%19
526
27 3
65-2
9%28
599
45 9
5332
780
-38%
19 4
4637
175
33 3
77-4
8%87
267
137
610
-37%
Ret
urn
on
aver
age
inve
sted
ass
ets
2.9%
8.2%
-65%
8.2%
12.0
%-3
2%7.
30%
n/a
7.1%
12.2
%5.
8%11
.9%
7.0%
Ad
just
ed n
et
wor
th p
er
emb
edd
ed
valu
e re
por
t3
088
2 32
93
410
33%
13 6
3612
481
11 5
719%
12 9
81n/
a22
206
18 5
4515
556
20%
14 5
5314
033
14 2
474%
53 4
8347
388
13%
Inco
me
on
adju
sted
net
w
orth
111
117
n/a
-5%
536
594
n/a
-10%
n/a
n/a
1 04
81
742
n/a
-40%
855
1 41
51
950
-40%
2 55
03
868
Ret
urn
on
aver
age
adju
sted
net
w
orth
4.1%
4.1%
n/a
4.1%
4.9%
n/a
n/a
n/a
5.1%
10.2
%n/
a6.
0%10
.0%
5.1%
8.4%
Cap
ital
and
so
lven
cy
Cap
ital
adeq
uacy
re
qui
rem
ent
cove
r4.
43.
98.
613
%2.
92.
72.
88%
2.3
2.5
-8%
4.0
3.9
4.1
3%3.
73.
43.
19%

Sho
rt-t
erm
insu
rers
R m
illio
nsM
utua
l & F
eder
alO
utsu
ranc
eS
anta
mZ
uric
hC
om
bin
ed
2011
2010
2009
2011
2010
2011
2010
2009
2011
2010
2009
2011
2010
2009
Rev
enue
Gro
ss w
ritte
n p
rem
ium
s8
570
8 23
48
060
6 47
9n/
a17
707
15 8
5515
026
3 89
04
632
5 40
436
646
28 7
2128
490
Mov
emen
t in
une
arne
d
pre
miu
m li
abili
ty-1
90n/
a-2
4165
108
8074
-37
-352
139
71
Out
war
d r
eins
uran
ce-1
735
-1 5
83-1
541
-84
n/a
-3 0
33-2
336
-2 1
32-9
12-9
79-1
140
-5 7
64-4
898
-4 8
13
Mov
emen
t in
rei
nsur
ance
un
earn
ed p
rem
ium
s-
n/a
219
-34
-106
-56
-13
3716
3-4
7-6
9
Net
ear
ned
pre
miu
ms
6 83
56
650
6 51
96
205
n/a
14 6
5213
550
12 8
963
002
3 71
44
265
30 6
9423
914
23 6
80
Fee
and
com
mis
sion
in
com
e39
631
729
0-
n/a
321
236
209
163
169
137
880
721
636
Exp
ense
s
Cla
ims
and
ben
efits
4 91
44
931
5 42
63
261
n/a
10 7
889
531
10 2
412
152
3 50
64
176
21 1
1417
968
19 8
43
Rei
nsur
ance
rec
over
ies
-477
-656
-948
-70
n/a
-1 3
84-8
48-1
141
-174
-929
-506
-2 1
05-2
433
-2 5
95
Acq
uisi
tion
cost
s1
269
1 23
31
396
119
n/a
2 32
42
311
2 12
762
474
881
04
336
4 29
14
333
Op
erat
ing
and
ad
min
istr
ativ
e ex
pen
ses
1 10
693
984
31
650
n/a
2 11
41
648
1 42
557
969
256
55
449
3 27
92
833
Key
rat
ios
Cla
ims
ratio
64.9
%64
.3%
68.7
%51
.4%
n/a
64.2
%64
.1%
70.6
%65
.9%
69.4
%86
.0%
61.9
%65
.0%
72.8
%
Acq
uisi
tion
cost
rat
io12
.8%
13.8
%17
.0%
1.9%
n/a
13.7
%15
.3%
14.9
%15
.3%
15.6
%15
.8%
11.3
%14
.9%
15.6
%
Exp
ense
rat
io16
.2%
14.1
%12
.9%
26.6
%n/
a14
.4%
12.2
%11
.0%
19.3
%18
.6%
13.2
%17
.8%
13.7
%12
.0%
Com
bin
ed r
atio
93.9
%92
.2%
98.6
%79
.9%
n/a
92.3
%91
.6%
96.5
%10
0.5%
103.
6%11
5.1%
90.9
%93
.6%
100.
4%
Und
erw
ritin
g m
argi
n6.
1%7.
8%1.
4%20
.1%
n/a
7.7%
8.4%
3.5%
-0.5
%-3
.6%
-15.
1%9.
1%6.
4%-0
.4%
Inve
stm
ent
per
form
ance
Inve
sted
ass
ets
6 64
77
032
6 00
85
470
4 62
813
390
12 9
0612
270
3 12
33
144
2 94
428
630
27 7
0921
222
Inve
stm
ents
5 22
75
685
5 06
64
053
3 11
011
792
11 7
6310
891
2 14
22
071
1 91
223
213
22 6
2917
869
Cas
h an
d c
ash
equi
vale
nts
1 42
01
347
942
1 41
81
518
1 59
81
143
1 37
998
21
072
1 03
35
417
5 08
03
353
Inco
me
on in
vest
ed
asse
ts30
355
432
7 8
651
170
246
335
376
1 74
120
59
Ret
urn
on a
vera
ge
inve
sted
ass
ets
4.4%
8.5%
6.5%
6.6%
9.3%
7.8%
11.0
%6.
2%

PwC | 41R m
illio
nsM
utua
l & F
eder
alO
utsu
ranc
eS
anta
mZ
uric
hC
om
bin
ed
2011
2010
2009
2011
2010
2011
2010
2009
2011
2010
2009
2011
2010
2009
Eq
uity
and
Inte
rnat
iona
l so
lven
cy m
arg
in
Eq
uity
att
ribut
able
to
equi
ty h
old
ers
of p
aren
t3
694
4 20
53
159
3 18
52
689
6 03
65
126
4 52
82
015
1 88
41
659
14 9
3013
904
9 34
6
Tota
l com
pre
hens
ive
inco
me
attr
ibut
able
to
equi
ty h
old
ers
408
701
514
1 10
61
484
1 69
01
002
143
225
-177
3 14
12
616
1 33
9
Ret
urn
on a
vera
ge e
qui
ty10
%19
%21
%38
%27
%35
%24
%7%
13%
-10%
22%
25%
Inte
rnat
iona
l sol
venc
y m
argi
n54
%63
%48
%50
%48
%45
%42
%68
%52
%39
%50
%48
%43
%

42 | Realising full potential – Insurance industry analysis
8. Basis of information provided

PwC | 43
The primary focus of this publication is to consider the results of the South African insurance business of the companies listed on page 2 for the calendar year ended 31 December 2011. Where companies have 30 June year ends, the financial information has been reconstituted to reflect the calendar year ended 31 December.
• Although we endeavour to provide at least three years’ information, information for 2009 was not available as a result of the following: MMI Holdings was formed in December 2010 with the merger of Momentum Group Limited and Metropolitan Holdings Limited and consolidated group information is not available for the combined group prior to 30 June 2010. We have assumed for the purpose of comparative 2010 information that annual results for the year ended 30 June 2010 was earned on a straight-line basis throughout the financial year. As such, we have included half of this annual result to derive comparative information for the year ended 2010.
• Sanlam changed its segments in the current year. Operations in emerging markets outside South Africa have been combined into Sanlam Emerging Markets. The South African operations of the former Sanlam Developing Markets cluster have been combined with those of Sanlam Personal Finance. As a result, the 2009 segmental information is not comparable to that presented for 2011 and 2010 and has not been included in this publication. The employee benefit business is now included in the Sanlam Investment segment and has not been included in this publication. The results in this publication consider the Sanlam Personal Finance segment unless otherwise stated.
• The current reporting period is the first reporting period for which detailed financial information is available for Outsurance as it is now a subsidiary of RMI Holdings Ltd. Previously only limited information was available and as a result, comparative information has not been presented.
Other pertinent matters to note on the information presented:
• Information for Old Mutual relates to the Emerging Market segment, which primarily includes Old Mutual South Africa, but also developing markets in Asia and Latin America (for which separate information is not available). The embedded value new business information included in this publication relates to South African business only.
• Old Mutual is the only company in this publication that follows the Market Consistent Embedded Value (MCEV) principles as published by the European CFO Forum. The other companies apply the principles set out in PGN 107 ‘Embedded value reporting’ as published by the Actuarial Society of South Africa.
• The embedded value information for Discovery represents the Discovery Life and Invest segments and excludes the Health, Vitality, PruHealth and PruProtect segments, which do not represent South African life insurance operations.
• Return on average equity has been calculated as total comprehensive income attributable to the equity holders of the parent divided by the average shareholders’ equity (opening equity plus closing equity divide by two).
• The return on average invested assets has been calculated from the information provided by the insurers as follows: income on invested assets divided by the average total invested assets.

44 | Realising full potential – Insurance industry analysis
• The return on average adjusted net worth has been calculated from the embedded value information provided by the insurers as follows: income on adjusted net worth divided by the average adjusted net worth.
• The following companies are included in ASISA’s ‘large offices’ category: Liberty Group Ltd (including Capital Alliance Life Ltd), Metropolitan Life Ltd, Momentum Group Ltd, Old Mutual Life Assurance Co (SA) Ltd (OMSA) and Sanlam Life Insurance Ltd.
• Where companies have classified some of their financial assets as ‘available for sale financial assets’, the fair value gains and losses recognised in ‘Other comprehensive income’ have been reclassified in the income statement for companies to be comparable with their peers.
• The international solvency margin has been calculated from the information provided by the short-term insurers as follows: shareholders equity divided by gross written premium net of reinsurance. The only exception is Santam where long-term debt is included as part of share capital for the purposes of this calculation.

PwC | 45
9. Contacts

46 | Realising full potential – Insurance industry analysis
Victor Muguto
Long-term Insurance Leader +27 11 797 5372 [email protected]
Ilse French
Short-term Insurance and Investment Management Leader +27 11 797 4094 [email protected]
Dewald van den Berg
Insurance Technical Associate Director +27 11 797 5828 [email protected]
Tom Winterboer
Financial Services Leader, Southern Africa and Africa +27 11 797 5407 [email protected]
Other contributors
Yolindi Punt
Insurance Technical Manager
Susan de Klerk
Insurance Knowledge Manager


©2012. PricewaterhouseCoopers (“PwC”), the South African firm. All rights reserved. In this document, “PwC” refers to PricewaterhouseCoopers in South Africa, which is a member firm of PricewaterhouseCoopers International Limited (PwCIL), each member firm of which is a separate legal entity and does not act as an agent of PwCIL. (12-10767)