realistic disaster scenarios - lloyd's of london/media/files/the-market/tools-and...realistic...
TRANSCRIPT

Realistic disaster scenarios
Scenario specification January 2011

2
Key Contacts
Director OF Performance MANAGEMENT Tom Bolt 020 7327 6700 [email protected]
Exposure Management
Paul Nunn 020 7327 6402 [email protected]
David Singh 020 7327 6496 [email protected]
Chris Wallings 020 7327 5048 [email protected]
Phil Holt 020 7327 5983 [email protected]

3
Contents
EXECUTIVE SUMMARY 4
Compulsory scenarios
1 TWO EVENTS 6
2 Florida Windstorm 12
3 Gulf of Mexico Windstorm 17
4 European Windstorm 22
5 Japanese Windstorm 24
6 California Earthquake 27
7 New Madrid Earthquake 32
8 japanese Earthquake 36
9 UK Flood 40
10 Terrorism 42
scenarios subject to de-minimis reporting
11 Marine 46
12 Loss of Major Complex 48
13 Aviation Collision 48
14 Satellite Risks 49
15 Liability Risks 51
16 Political Risks 53
17 Alternative RDS A & B 53
4
Executive summary In consultation with the LMA’s RDS Steering Group and various sub groups, the 2011 RDS framework has been subject to a number of changes as follows:
New Madrid extreme stress scenario Lloyd's will no longer collect the New Madrid Extreme Stress Scenario (ESS). This scenario was not subject to the Franchise Performance Guidelines regarding RDS loss estimates.
Industry loss labels In order to preserve the adequacy of the estimated European and Japanese RDS industry loss labels, the European and Japanese event loss estimates are now quoted in Euros and Japanese Yen currencies respectively. Moving away from the US Dollar loss label will allow these loss estimates to remain adequate as they will not be subject to currency exchange rate fluctuations.
Gulf of Mexico scenario The Gulf of Mexico event remains unchanged however, after consultation with Energy underwriters, the offshore industry insured loss has been adjusted upwards from USD4.0bn to USD4.5bn, reflecting the increased aggregate wind cover sold in 2010.
To assist Lloyd’s in the understanding of managing agent’s aggregate exposure and accumulations, managing agents should include exposure to Certificate of Financial Responsibility (COFR) to the limits specified under the Oil Pollution Act of 1990.
Lloyd’s Performance Management Directorate consulted with the LMA/Market on risks which required further granularity. The aim is to ensure that the codes remain as relevant as possible to the business being written. The review process has resulted in the breakdown of Energy risk codes ET, EW and CA. All changes will be effective from 1st January 2011. Therefore all policies which incept on or after this date should be coded using the revised set of risk codes, together with any returns submitted to Lloyd’s. Please refer to Market Bulletin number Y4399 for further information.
Aviation Supplementing the collision scenario, we will be collecting Schedule A, B, C questionnaire information to better understand market wide exposure to major aviation risks.
War Due to an increase in the amount of war coverage written in the market, Lloyd’s aims to examine potential accumulations of war exposure as part of the 2011 RDS framework. Lloyd’s is therefore collecting supplementary data on war and nuclear exposure as part of the 2011 RDS submission. The goal of this exercise is to ensure that present exposure and the way in which the business is being written do not present an undue prudential risk to the market.
Terrorism In 2010, Lloyd’s carried out analyses on supplementary global terrorism exposure data collected as part of the RDS submission. The analyses demonstrated that the existing RDS Manhattan scenarios for terrorism remain appropriate for examining potential concentration of risk within the market. As this exercise is now complete, there is no further requirement for syndicates to submit supplementary information.

5
Compulsory Scenarios

6
1 TWO EVENTS Managing agents should model on an ‘as if’ basis the occurrence of a South Carolina hurricane in the immediate aftermath of a North-East US hurricane.
Managing agents should assume that these events fall in the same reinsurance year and that there has not been sufficient time between events to purchase additional reinsurance protection. The physical characteristics for the North-East and South Carolinas scenarios remain unchanged from the 2010 RDS framework.
Managing agents should return losses to both events separately for each syndicate via the Lloyd’s Core Market Returns system.
TWO EVENTS – Event One
North-East Windstorm Event A USD78bn Industry Property Loss including consideration of demand surge and storm surge from a North-East hurricane making landfall in New York State. The hurricane also generates significant loss in the States of New Jersey, Connecticut, Massachusetts, Rhode Island and Pennsylvania.
Distribution of North-East Property Values The map below illustrates Lloyd’s assumptions for the distribution of property values within the affected states, which are also detailed in the Event Damage Factor Tables found on the Core Market Returns system.

7
Major Ports
The table below lists the main ports that would be affected by the windstorm that managing agents should consider in assessing their potential exposures. They should also give regard to exposures in smaller ports that fall within the footprint of the event.
Port County State
Camden Camden New Jersey
New York/New Jersey
Philadelphia Delaware Pennsylvania
Major Airports The table below lists the main international airports in the affected areas, which managing agents should consider in assessing their potential exposures. Managing agents should also have regard to exposures in smaller airports that fall within the footprint of the event.
Airport County State
Atlantic City International Airport (ACY) Atlantic New Jersey
Bradley International Airport (BDL) Hartford Connecticut
Edward Lawrence Logan International Airport (BOS) Suffolk Massachusetts
John F. Kennedy International Airport (JFK) Queens New York
La Guardia Airport (LGA) Queens New York
Lehigh Valley International Airport (ABE) Lehigh Connecticut
Newark International Airport (EWR) Essex New Jersey
Philadelphia International Airport (PHL) Delaware Pennsylvania
Providence - T.F. Green Airport (PVD) Kent Rhode Island
Tetarboro Airport (TEB) Bergen New Jersey
Wilkes-Barre/Scranton International Airport (AVP) Luzerne Pennsylvania

8
Event Footprint The map below illustrates the footprint and damage levels for the North-East Windstorm Event, which are also detailed in the Event Damage Factor Tables available from the Core Market Returns system.
Industry Loss Levels Managing agents should assume the following components of the loss.
Residential Property $47.50bn
Commercial Property $30.50bn
Auto $1.75bn
Marine $0.75bn
Managing agents should consider all other lines of business that would be affected by the event. Particular consideration should be given to losses arising from:
Specie/Fine Art Personal Accident Aviation
Liability Cancellation
Exclusion of Contingent Business Interruption Losses Lloyd’s recognises the difficulties involved in modelling losses from Contingent Business Interruption (CBI) covers. Managing agents should therefore exclude CBI losses from this event.

9
TWO EVENTS – Event TWO
Carolinas Windstorm Event A USD36bn Industry Property Loss from a hurricane making landfall in South Carolina, including consideration of demand surge and storm surge.
Distribution of South Carolina Property Values The map below illustrates Lloyd’s assumptions for the distribution of property values within South Carolina, which are also detailed in the Event Damage Factor Tables found on the Core Market Returns system.

10
Major Ports The table below lists the main ports in South Carolina that would be affected by the windstorm that managing agents should consider in assessing their potential exposures. They should also have regard to exposures in smaller ports that fall within the footprint of the event.
Port County
Charleston Charleston
Georgetown Georgetown
Port Royal Beaufort
Major Airports The table below lists the main international airports in the affected areas, which managing agents should consider in assessing their potential exposures. They should also have regard to exposures in smaller airports that fall within the footprint of the event.
Airport County
Charleston International Airport (CHS) Charleston
Greenville - Spartanburg International Airport (GSP) Greenville
Event Footprint The map below illustrates the footprint and damage levels for the South Carolina Windstorm Event, which are also detailed in the Event Damage Factor Tables.

11
Industry Loss Levels
Managing agents should assume the following components of the loss.
Residential Property $24.00bn
Commercial Property $12.00bn
Auto $0.53bn
Marine $0.27bn
Managing agents should consider all other lines of business that would be affected by the event. Particular consideration should be given to losses arising from:
Specie/Fine Art Personal Accident Aviation
Liability Cancellation
Exclusion of Contingent Business Interruption Losses Lloyd’s recognises the difficulties involved in modelling losses from Contingent Business Interruption (CBI) covers. Managing agents should therefore exclude CBI losses from this event.
12
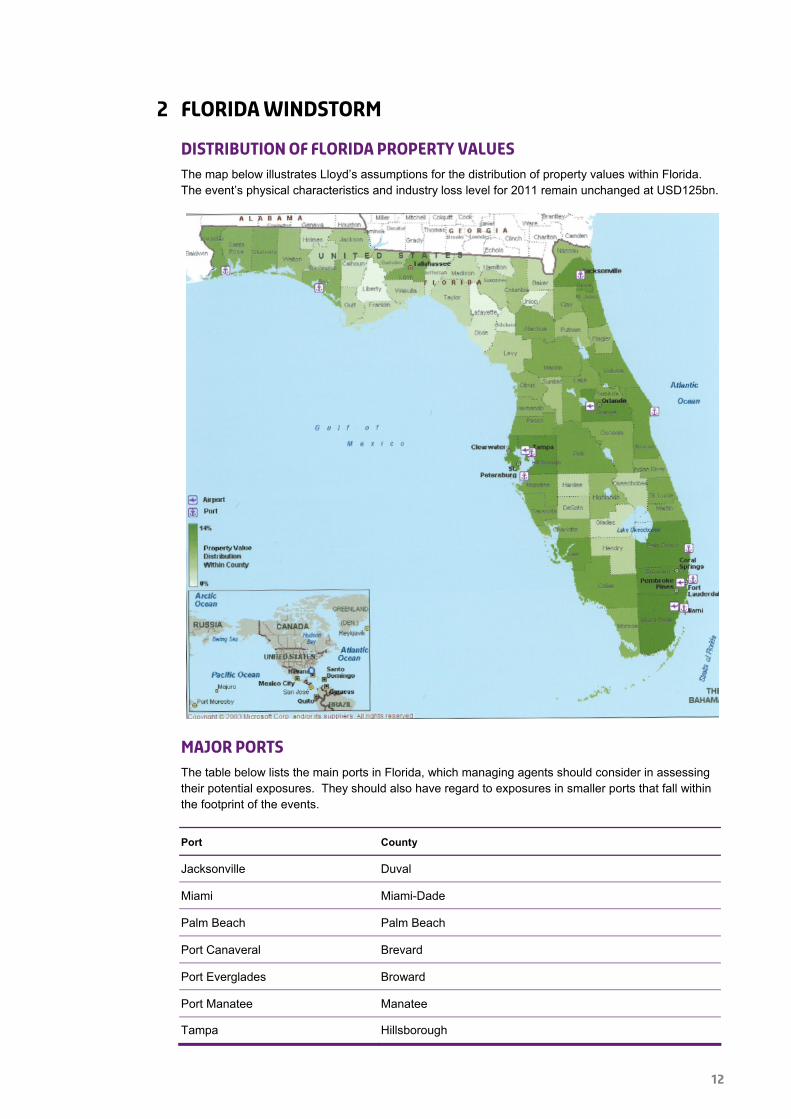
2 Florida Windstorm
Distribution of Florida Property Values The map below illustrates Lloyd’s assumptions for the distribution of property values within Florida. The event’s physical characteristics and industry loss level for 2011 remain unchanged at USD125bn.
Major Ports The table below lists the main ports in Florida, which managing agents should consider in assessing their potential exposures. They should also have regard to exposures in smaller ports that fall within the footprint of the events.
Port County
Jacksonville Duval
Miami Miami-Dade
Palm Beach Palm Beach
Port Canaveral Brevard
Port Everglades Broward
Port Manatee Manatee
Tampa Hillsborough

13
Major Airports
The table below lists the main international airports in Florida, which managing agents should consider in assessing their potential exposures.
They should also have regard to exposures in smaller airports that fall within the footprint of the events.
Airport County
Fort Lauderdale/Hollywood Broward
Miami Miami-Dade
Orlando Orange
Tampa Hillsborough

14
Florida Windstorm – Event One
Miami-Dade Windstorm Event A USD125bn Industry Property Loss, including consideration of demand surge and storm surge, from a Florida Windstorm landing in Miami-Dade County.
Event Footprint The map below illustrates the footprint and damage levels for the Miami-Dade Windstorm Event, which are also detailed in the Event Damage Factor Tables found on the Core Market Returns system.
Industry Loss Levels Managing agents should assume the following components of the loss.
Residential Property $63.00bn
Commercial Property $62.00bn
Auto $2.25bn
Marine $1.00bn
Managing agents should consider all other lines of business that would be affected by the event. Particular consideration should be given to losses arising from:
Specie/Fine Art Personal Accident Aviation
Liability Cancellation

15
Exclusion of Contingent Business Interruption Losses
Lloyd’s recognises the difficulties involved in modelling losses from Contingent Business Interruption (CBI) covers. Managing agents should therefore exclude CBI losses from this event.
Florida Windstorm – Event Two
2.1 Pinellas Windstorm Event A USD125bn Industry Property Loss, including consideration of demand surge and storm surge, from a Florida Windstorm landing in Pinellas County.
2.2 Event Footprint The map below illustrates the footprint and damage levels for the Pinellas Windstorm Event, which are also detailed in the Event Damage Factor Tables found on the Core Market Returns system.
Industry Loss Levels Managing agents should assume the following components of the loss.
Residential Property $88.00bn
Commercial Property $37.00bn
Auto $2.00bn
Marine $1.00bn

16
Managing agents should consider all other lines of business that would be affected by the event. Particular consideration should be given to losses arising from:
Specie/Fine Art Personal Accident Aviation
Liability Cancellation
Exclusion of Contingent Business Interruption Losses Lloyd’s recognises the difficulties involved in modelling losses from Contingent Business Interruption (CBI) covers. Managing agents should therefore exclude CBI losses from this event.

17
3 Gulf of Mexico Windstorm
Gulf of Mexico Windstorm Event A Gulf of Mexico hurricane resulting in USD111.5bn Industry Loss comprised of mainland insured property losses of USD107bn including the consideration of demand surge and storm surge, and offshore energy insured loss of USD4.5bn (estimated USD11bn insurable loss).
Distribution of Property Values in the affected mainland areas and of Platforms in the Gulf of Mexico
The map below illustrates Lloyd’s assumptions for the distribution of property values within the affected mainland areas, which are also detailed in the Event Damage Factor Tables available on the Core Market Returns system. Inset an indicative distribution of offshore energy platforms in the Gulf of Mexico is shown.

18
Offshore Event Damage Track The map below illustrates the damage track of the windstorm in the Gulf of Mexico prior to making landfall.
■ Less than 10 miles from the centre of the damage track
■ 10 to 25 miles from the centre of the damage track
■ 25 to 50 miles from the centre of the damage track
Position of centre of damage track
Start Latitude 25° 50’ 30.8401" North Longitude 86° 00’ 50.0400" West
End Latitude 30° 52’ 53.7600" North Longitude 98° 43’ 16.3200" West
Supplementary Information In addition to the requirement to return the components contributing to losses from the offshore scenario, managing agents are required to provide the following information for their managed syndicates:
Using CMR form 990, managing agents are required to provide total Gulf of Mexico wind exposed aggregate, for fixed and mobile assets, as at 1st January, 2011.
‘As-if’ Katrina Gross and Final Net losses. To be reported via CMR form 990, using the RDS PML assumptions – based upon the Hurricane Katrina track.
‘As-if’ Ike Gross and Final Net losses. To be reported via CMR form 990, using the RDS track assumptions – based upon the Hurricane Ike track.

19
Managing agents should include exposure to Certificate of Financial Responsibility (COFR) to the limits specified under the Oil Pollution Act of 1990.
Onshore Event Footprint The map below highlights the footprint and damage levels for the onshore component of the affected counties. These damage levels are also detailed in the Event Damage Factor Tables found on the Core Market Returns system.
Industry Loss Levels No change to the Onshore loss element of the Gulf of Mexico event, however, the Offshore industry insured loss component is revised upwards from USD4.0bn in 2010 to USD4.5bn in 2011, reflecting an increase in the wind limits sold.
Managing agents should assume the following components for the loss.
Residential Property $65.00bn
Commercial Property $42.00bn
Offshore Energy (Insured) $4.50bn
Auto $1.00bn
Marine $1.00bn
Managing agents should consider all other lines of business that would be affected by the event. Particular consideration should be given to losses arising from:
Specie/Fine Art Personal Accident Aviation
Liability Cancellation
20
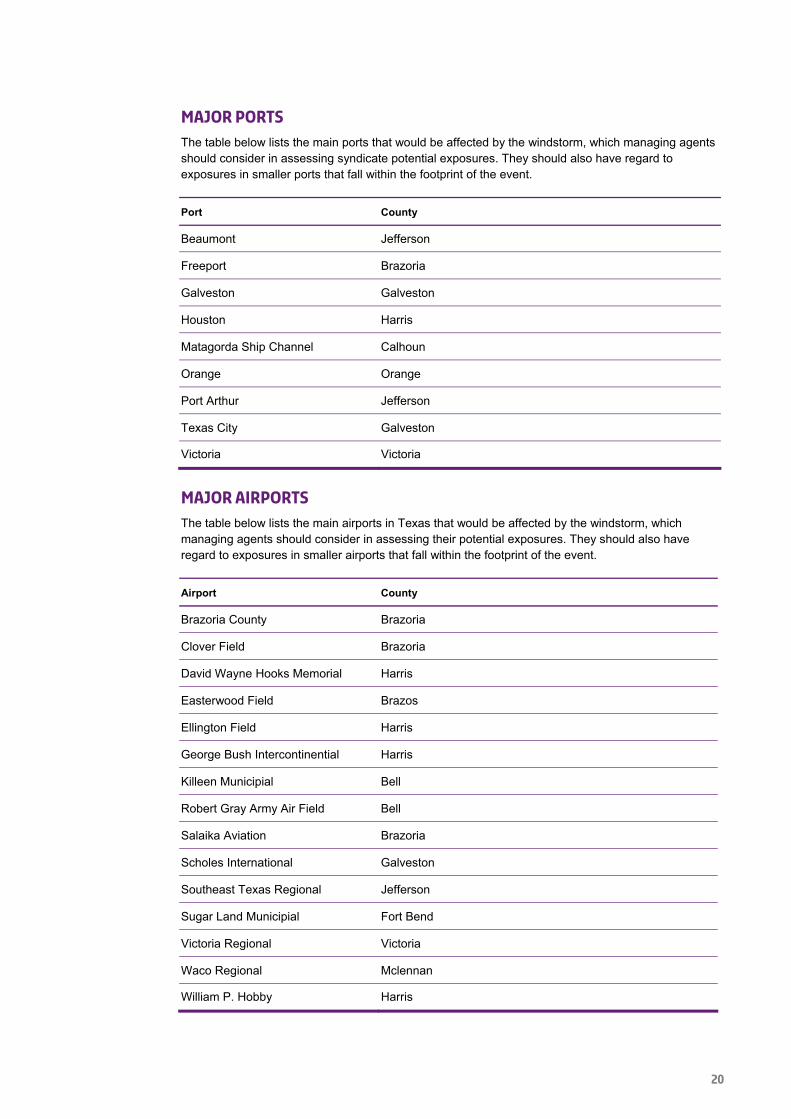
Major Ports The table below lists the main ports that would be affected by the windstorm, which managing agents should consider in assessing syndicate potential exposures. They should also have regard to exposures in smaller ports that fall within the footprint of the event.
Port County
Beaumont Jefferson
Freeport Brazoria
Galveston Galveston
Houston Harris
Matagorda Ship Channel Calhoun
Orange Orange
Port Arthur Jefferson
Texas City Galveston
Victoria Victoria
Major Airports The table below lists the main airports in Texas that would be affected by the windstorm, which managing agents should consider in assessing their potential exposures. They should also have regard to exposures in smaller airports that fall within the footprint of the event.
Airport County
Brazoria County Brazoria
Clover Field Brazoria
David Wayne Hooks Memorial Harris
Easterwood Field Brazos
Ellington Field Harris
George Bush Intercontinential Harris
Killeen Municipial Bell
Robert Gray Army Air Field Bell
Salaika Aviation Brazoria
Scholes International Galveston
Southeast Texas Regional Jefferson
Sugar Land Municipial Fort Bend
Victoria Regional Victoria
Waco Regional Mclennan
William P. Hobby Harris

21
Exclusion of Contingent Business Interruption Losses
Lloyd’s recognises the difficulties involved in modelling losses from Contingent Business Interruption (CBI) covers. Managing agents should therefore exclude CBI losses (except offshore energy CBI) from this event.

22
4 European Windstorm
European Windstorm Central Track This event is based upon a low pressure track originating in the North Atlantic basin resulting in an intense windstorm with maximum/peak gust wind speeds in excess of 20 metres per second (45 mph or 39 knots). The strongest winds occur to the south of the storm track, resulting in a broad swath of damage across southern England, northern France, Belgium, Netherlands, Germany and Denmark.
This event results in an estimated Industry Property Loss of €23bn. The map below illustrates the windstorm track and affected regions.
Image courtesy of AIR Worldwide
Industry Loss Levels Managing agents should assume the following components of the loss.
Residential Property €15.50bn
Commercial Property €6.00bn
Agricultural €1.50bn
Auto €0.75bn
Marine €0.40bn

23
Managing agents should consider all other lines of business that would be affected by the event. Particular consideration should be given to losses arising from:
Specie/Fine Art Personal Accident Aviation
Liability
Property Value Distributions and Damage Factors
Tables outlining Lloyd’s assumptions for the distribution of property values and the damage factors for this event are listed in the Event Damage Factor Tables available from the Core Market Returns system.

24
5 Japanese Windstorm
Japanese Windstorm Event This event is based on the Isewan (‘Vera’) typhoon event of 1959. As a guide, the estimated Industry Property Loss from this event would be ¥1.5trn.
Property Value Distribution Map The map below illustrates Lloyd’s assumptions for the distribution of property values at prefecture level, which are also detailed in the Event Damage Factor Tables available from the Core Market Returns system.
Major Ports The table below lists the main Japanese ports in the Typhoon Isewan (Vera) footprint, which managing agents should consider in assessing syndicate potential exposures. They should also have regard to exposures in smaller ports that fall within the footprint of the event.
Port
Chiba Port
Nagoya Port
Yokamaha Port
Kawasaki Port
Mitzushima Port

25
Kitakyushu Port
Tokyo Port
Osaka Port
Tomakomai Port
Kobe Port
Major Airports The table below lists the main international and domestic airports potentially impacted by the Typhoon, which managing agents should consider in assessing syndicate potential exposures.
Airport
Narita International Airport
Central Japan International Airport
Kansai International Airport
Tokyo International Airport
Osaka International Airport

26
5.1 Typhoon Isewan Event Footprint The map below illustrates the footprint and damage levels for Japan, which are also detailed in the Event Damage Factor Tables.
Managing agents should assume the following components of the loss.
Residential Property ¥650bn
Commercial Property ¥850bn Marine ¥50bn
Managing agents should consider all other lines of business that would be affected by the event. Particular consideration should be given to losses arising from:
Specie/Fine Art Personal Accident Aviation
Liability Marine

27
6 California Earthquake The map below illustrates Lloyd’s assumptions for the distribution of property values within California, which are also detailed in the Event Damage Factor Tables.
Major Ports The table below lists the main ports in California, which managing agents should consider in assessing their potential exposures. They should also give regard to exposures in smaller ports that fall within the footprint of the events.
Port County
Long Beach Orange
Los Angeles Los Angeles
Oakland Alameda
Port Hueneme Ventura
Richmond Contra Costa
San Diego San Diego
San Francisco San Francisco Stockton San Joaquin

28
Major Airports
The table below lists the main international airports in California, which managing agents should consider in assessing their potential exposures. They should also have regards to exposures in smaller airports that fall within the footprint of the events.
Airport County
Los Angeles (LAX) Los Angeles
San Diego-Linderbergh (SAN) San Diego
San Francisco (SFO) San Francisco San Jose (SJC) San Jose
California Earthquake – Event One
Los Angeles Earthquake Event A USD78bn Industry Property (shake and fire following) Loss, gross of take-up rates and including consideration of demand surge.
Event Footprint The map below illustrates the footprint and damage levels for the Los Angeles Earthquake Event which are also detailed in the Event Damage Factor Tables.

29
Industry Loss Levels Managing agents should assume the following components of the loss.
Residential Property $36.00bn
Commercial Property $42.00bn
Workers Compensation $5.50bn
Marine $2.25bn
Personal Accident $1.00bn
Auto $1.00bn
Managing agents should consider all other lines of business that would be affected by the event. Particular consideration should be given to losses arising from:
Specie/Fine Art Liability Cancellation
PA and WCA losses It should be assumed that there will be 2,000 deaths and 20,000 injuries as a result of the earthquake. Managing agents should assume that 50% of those injured will have PA cover.
Exclusion of Contingent Business Interruption Losses Lloyd’s recognises the difficulties involved in modelling losses from Contingent Business Interruption (CBI) covers. Managing agents should therefore exclude CBI losses from this event.
Estimation of Aviation Hull Losses Lloyd’s has commissioned research that indicates that minimal Aviation Hull losses would be expected to arise from an earthquake. Managing agents should take account of these findings in calculating syndicate loss estimates.
30
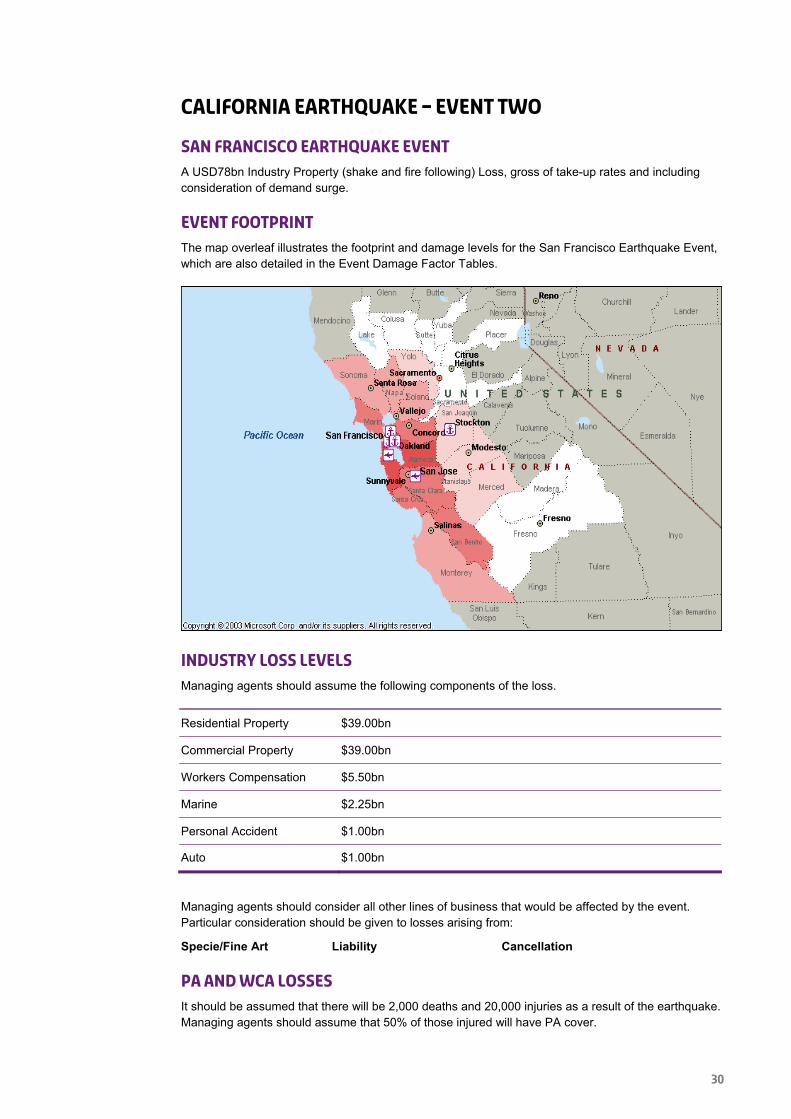
California Earthquake – Event Two
San Francisco Earthquake Event A USD78bn Industry Property (shake and fire following) Loss, gross of take-up rates and including consideration of demand surge.
Event Footprint The map overleaf illustrates the footprint and damage levels for the San Francisco Earthquake Event, which are also detailed in the Event Damage Factor Tables.
Industry Loss Levels Managing agents should assume the following components of the loss.
Residential Property $39.00bn
Commercial Property $39.00bn
Workers Compensation $5.50bn
Marine $2.25bn
Personal Accident $1.00bn
Auto $1.00bn
Managing agents should consider all other lines of business that would be affected by the event. Particular consideration should be given to losses arising from:
Specie/Fine Art Liability Cancellation
PA and WCA losses It should be assumed that there will be 2,000 deaths and 20,000 injuries as a result of the earthquake. Managing agents should assume that 50% of those injured will have PA cover.

31
Exclusion of Contingent Business Interruption Losses
Lloyd’s recognises the difficulties involved in modelling losses from Contingent Business Interruption (CBI) covers. Managing agents should therefore exclude CBI losses from this event.
Estimation of Aviation Hull Losses Lloyd’s has commissioned research that indicates that minimal Aviation Hull losses would be expected to arise from an earthquake. Managing agents should take account of these findings in calculating syndicate loss estimates.

32
7 New Madrid Earthquake The map below illustrates Lloyd’s assumptions for the distribution of property values within the New Madrid Seismic Zone (‘NMSZ’) which are also detailed in the Event Damage Factor Tables.
Distribution of Property Values in the New Madrid Seismic Zone
Major Ports The table below lists the main ports in the NMSZ, which managing agents should consider in assessing syndicate potential exposures. They should also have regard to exposures in smaller ports that fall within the footprint of the events.
Port County State
Pascagoula Jackson Mississippi
Gulfport Harrison Mississippi
South Louisiana St John the Baptist Mississippi
Baton Rouge West Baton Rouge Louisiana
Mobile Mobile Alabama
Memphis Shelby Tennessee
St. Louis St Louis Missouri

33
Major Airports
The table below lists the main domestic and international airports in the NMSZ, which managing agents should consider in assessing syndicate potential exposures. They should also have regard to exposures in smaller ports that fall within the footprint of the events.
Airport County State
Jonesboro Municipal Craighead Arkansas
Cape Girardeau Regional Scott Missouri
Barkley Regional McCracken Kentucky
McKellar-Sipes Regional Madison Tennessee
Memphis International Shelby Tennessee
Lambert-St Louis International Saint Louis Missouri

34
New Madrid Earthquake Event A USD47bn Industry Property (shake and fire following) Loss, gross of take up rates including consideration of demand surge.
Event Footprint The map below illustrates the footprint and county/parish damage levels for this event, which are also detailed in the Event Damage Factor Tables.
Industry Loss Levels Managing agents should assume the following components of the loss.
Residential Property $32.50bn
Commercial Property $14.50bn
Workers Compensation $2.50bn
Marine $1.50bn
Personal Accident $0.50bn Auto $0.50bn
Managing agents should consider all other lines of business that would be affected by the event. Particular consideration should be given to losses arising from:
Specie/Fine Art Liability Cancellation
PA and WCA It should be assumed that there will be 1,000 deaths and 10,000 injuries as a result of this earthquake. Managing agents should assume that 50% of those injured will have PA cover.

35
Aviation
Lloyd’s has commissioned research that indicates that minimal Aviation Hull losses would be expected to arise from an earthquake. Managing agents should take account of these findings in calculating syndicate loss estimates.
Business Interruption Overland transport systems are severely damaged and businesses impacted, leading to significant business interruption exposure for a period of 30 days. This is restricted to the inner zone of maximum earthquake intensities (highlighted on the event footprint).

36
8 Japanese Earthquake
Japanese Earthquake Event This event is based on the Great Kanto earthquake of 1923, with an estimated Insured Industry Property Loss from this event of ¥5trn.
Distribution of Property Values in Japan The map below illustrates Lloyd’s assumptions for the distribution of property values within Japan, which are also detailed in the Event Damage Factor Tables.

37
Major Ports
The table below lists the main ports in the Great Kanto footprint, which managing agents should consider in assessing syndicate potential exposures. They should also have regard to exposures in smaller ports that fall within the footprint of the event.
Port
Chiba Port
Nagoya Port
Yokohama Port
Kawasaki Port
Mizushima Port
Kitakyushu Port
Tokyo Port
Osaka Port
Tomakomai Port
Kobe Port
Major Airports The table below lists the main international and domestic airports potentially impacted by the Great Kanto earthquake event, which managing agents should consider in assessing syndicate potential exposures. They should also have regard to exposures in smaller airports that fall within the footprint of the event.
Airport
Narita International Airport
Central Japan International Airport
Kansai International Airport
Tokyo International Airport Osaka International Airport

38
Great Kanto Event Footprint The map below illustrates the footprint and damage levels for Japan, which are also detailed in the Event Damage Factor Tables.
Industry Loss Levels Managing agents should assume the following components of the loss.
Residential Property ¥1.5trn
Commercial Property ¥3.5trn
Marine ¥150bn Personal Accident ¥50bn
Managing agents should consider all other lines of business that would be affected by the event. Particular consideration should be given to losses arising from:
Personal Accident It should be assumed that 2,000 deaths and 20,000 injuries will arise as a result of this major earthquake. Assume that 50% of those injured will have PA cover.
Liability Business Liability exposures should also be considered.

39
Aviation
Following research undertaken by Lloyd’s, managing agents should assume that minimal Aviation Hull losses will arise from an earthquake of this magnitude.
Business Interruption Overland transport systems are severely damaged and businesses impacted, leading to significant business interruption exposure for a period of 60 days. This is restricted to the inner zone of maximum earthquake intensities (highlighted on Event footprint).

40
9 UK Flood
UK Flood – RDS Event This scenario is based on a heavy rainfall event moving from west to east across south-east England resulting in extensive flooding of the River Thames from Oxford to Teddington with secondary flooding on the River Colne from Ruislip south and surface flooding on the western and southern edges of Heathrow. The total flood extent covers 194 km2 and would cause significant impact on the towns of Oxford, Reading, Slough, and Henley areas of western London as shown in the figure below.
This event results in an estimated Industry Insured Loss of £6.2bn. The map below illustrates the flood footprint.
Industry Loss Levels Managing agents should assume the following components of the loss.
Residential £4.50bn
Commercial/Industrial £1.60bn
Agriculture £0.05bn Motor £0.05bn
Managing agents should also consider all other lines of business that may be affected by the event. Particular consideration should be given to the potential for losses arising from:
Cargo Specie/Fine Art Cancellation (Event \ Travel)
41
Treatment of Pollution Managing agents are advised that pollution may follow the flood event. Although no specific details are provided here, managing agents should consider the impact and operation of Seepage and Pollution exclusions, and consider the impact of pollution as an aggravating factor in residential losses. Managing agents may wish to refer to historical analogues, including the Carlisle floods of 2005. The impact of pollutants should also be considered for indirect losses at London Heathrow airport. Liability associated with potential pollution episodes will be difficult to calculate and as such should not be included in managing agents’ assumptions.
Event Duration Managing agents should assume that the flood event will not exceed 168 hours.
Major Roads The table below lists the major roads within the flood footprint which managing agents should consider in assessing business interruption.
Major Roads
M25
M3
M4
A40
A34
A404
A437 A4180
Major Rail Rail disruption will occur between London (Waterloo) and western services towards Oxford, Bristol, and Cardiff. There will be little disruption to the London Underground system except for flooding of Pinner station on the Metropolitan line.
Heathrow Airport Surface flooding will cause disruption to Heathrow Airport with flooding from the west encroaching into Terminal 5 and the end of both runways. Further flooding from the south will affect cargo transit and handling facilities.
Contingent Business Interruption Losses Wherever possible, managing agents should consider the potential for additional losses from Named Customer/Supplier extensions in respect of policies identified as sustaining direct losses.
For the purpose of the RDS, the potential for CBI losses from policies not directly affected by the flood event can be discounted.

42
10 Terrorism Similar to previous years, managing agents are required to complete the following hypothetical terrorist attack scenarios:
Rockefeller Center Event
The Midtown Manhattan area, New York, at 11:00am on 1 January 2011 suffers a 2-tonne bomb blast attack causing:
Zone Impact Description Damage Zones Property Damage Fire Loss
1 Collapse and fire following Inner zone, radius 200m 100% 10%
2 Massive debris damage to surrounding properties
400m radius 25% 2.5%
3 Light debris damage to surrounding properties
500m radius 10% 1%
Radii measurements are taken from the Rockefeller Center as a reference point.

43
Exchange Place Event
The lower Manhattan area, New York, at 11:00am on 1 January 2011 suffers a 2-tonne bomb blast attack causing:
Zone Impact Description Damage Zones Property Damage Fire Loss
1 Collapse and fire following Inner zone, radius 200m 100% 10%
2 Massive debris damage to surrounding properties 400m radius 25% 2.50%
3 Light debris damage to surrounding properties 500m radius 10% 1%
Radii measurements are taken from 20 Exchange Place as a reference point.
Prescribed assumptions for both events
Number of Deaths and Injuries 1,000 blue/white-collar worker deaths in total and 2,500 injuries in total. Managing agents to determine a worst case split across lines of business (WCA, PA, Group PA, etc.) and document assumptions using the commentary facility in CMR form 990. The following percentage split should be used for non-fatal injuries:
> 14% life threatening
> 35% moderate
> 51% minor

44
Business Interruption
Overland/underground transport systems are partially damaged, leading to significant business interruption exposure for a period of three months.
Affected Classes of Business All possible affected business classes should be included in the calculations, such as Contingent Business Interruption and Specie/Fine Art.
Granularity of Treaty Exposures Syndicates with low resolution treaty exposure data should use a damage factor based upon claims experience from the World Trade Center attacks of 2001.
Fire Following Taking ‘Fire Following’ into consideration, managing agents should assume the same damage zones with the appropriate Fire Loss percentage applied. Managing agents should assume that all property policies are impacted, given the New York state ruling that property policies cannot exclude fire. Any assumptions concerning Fire-Following Terrorism are to be documented using CMR form 990.
‘CBRN’ Status It should be assumed that there are no Chemical, Biological, Radiological or Nuclear hazard exposures arising from these events.

45
Scenarios Subject to De-Minimis Reporting

46
11 Marine
Scenarios (report both events) Managing agents should return a marine loss scenario for both of the following two incidents. In both scenarios, excess layers of liability, hull and cargo should be included, based on maximum Aggregate exposures.
Marine Collision in Prince William Sound A fully laden tanker calling at Prince William Sound is involved in a collision with a cruise vessel carrying 500 passengers and 200 staff and crew. The incident involves the tanker spilling its cargo and loss of lives aboard both vessels.
Assume 70% tanker owner/30% cruise vessel apportionment of negligence and that the collision occurs in US waters.
Assume that the cost to the tanker and cruise vessel owners of the oil pollution is USD2bn. This would lead to oil pollution recoveries on the International Group of P&I Associations’ General Excess of Loss Reinsurance Programme (IG Reinsurance Programme) of USD1bn from the tanker owner and USD0.55bn from the cruise owner.
Assume 125 fatalities, 125 persons with serious injuries and 250 persons with minor injuries: with average compensation of USD1.5m for each fatality, USD2.5m for each person with serious injuries and USD0.5m for each person with minor injuries.
The following diagram illustrates the structure of losses to the tanker and cruise vessel owners on the IG Reinsurance Programme as per 2010.
47
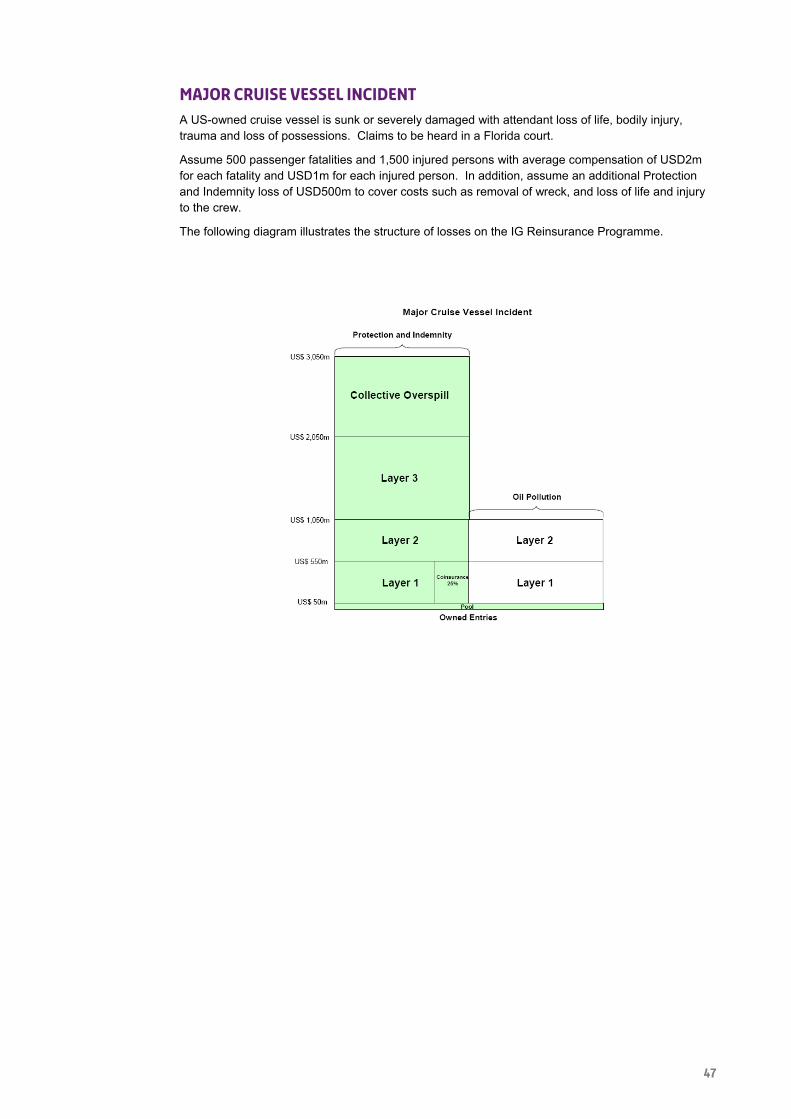
Major Cruise Vessel Incident A US-owned cruise vessel is sunk or severely damaged with attendant loss of life, bodily injury, trauma and loss of possessions. Claims to be heard in a Florida court.
Assume 500 passenger fatalities and 1,500 injured persons with average compensation of USD2m for each fatality and USD1m for each injured person. In addition, assume an additional Protection and Indemnity loss of USD500m to cover costs such as removal of wreck, and loss of life and injury to the crew.
The following diagram illustrates the structure of losses on the IG Reinsurance Programme.

48
12 Loss of Major Complex Assume a total loss to all platforms and bridge links of a major complex.
Include property damage, removal of wreckage, liabilities, loss of production income and capping of well.
Managing agents should use the commentary facility in form 990 (supplementary scenario information) to name the complex and to provide details of modelling assumptions. Should a mobile drilling rig present potential material exposure to a syndicate, managing agents may wish to report this under the Alternative A or B scenario.
13 Aviation Collision Assume a collision between two aircraft over a major city, anywhere in the world, using the syndicate’s two highest airline exposures. Assume a total liability loss of up to USD4bn: comprising up to USD2bn per airline and any balance up to USD1bn from a major product manufacturer’s product liability policy(ies) and/or an air traffic control liability policy(ies), where applicable.
Consideration should be given to other exposures on the ground.
Assumptions should be stated clearly using the event commentary facility in form 990.
Managing agents should include the following information in their return;
► the city over which the collision occurs;
► the airlines involved in the collision;
► the airline policy limits and syndicate’s line and exposure per policy;
► maximum hull value per aircraft involved;
► maximum liability per aircraft involved;
► name of each product manufacturer and the applicable policy limits; and
► name of the air traffic control authority and the applicable policy limit

49
14 Satellite Risks
Scenarios (report both events) Managing agents should return satellite loss information relating to both of the following events if either one of these events produces a loss in excess of the ‘de-minimis’ reporting level.
Proton Flare A proton flare is a vast outpouring of protons, which can result in permanent damage to semiconductor devices, particularly solar array cells. A large proton flare could result in a significant number of satellites losing some of their power-generating capability.
Satellite orientation, age and make will also determine how a proton flare will affect a satellite. However, a single large proton flare (or a number of smaller flares in close succession) has the potential to affect all synchronous satellites and could result in a loss of power by all satellites.
For the purposes of this RDS, it should be assumed that either a single anomalous large proton flare or a number of flares in quick succession results in a loss to all satellites in synchronous orbit. All live exposures in this orbit will be affected by the proton flare. Managing agents should assume a 5% insurance loss to all affected policies.
The loss under this RDS will therefore be:
(Insured Satellites Value) x (Loss to Policy)
Therefore, if a syndicate’s share of an insured satellite is USD10m, the loss to the syndicate would be calculated as:
USD10,000,000 x 5% = USD500,000
Managing agents should note that under this RDS, “Total Loss Only” policies, component-specific policies and policies not covering power losses will not be triggered.
Generic Defect An undetected generic defect in a number of operational satellites has the potential to cause significant losses to the space insurance market.
During the time it takes for a generic defect to emerge, many more satellites of the same model/variant may have been launched. For the 2011 RDS return, managing agents should report against those satellites that are in the following model/variant groups:
► A2100 all variants, including A2100, A2100A, A2100AX, A2100AX2
► Boeing-376 all variants, including BS-376HP, BS-376W
► Boeing-601 all variants, including BS-601, BS-601HP
► Boeing-702 all variants, including BS-702-M, BS-GEM
► Eurostar-2000 all variants, including E2000, E2000+
► Eurostar-3000 all variants, including E3000
► Express all variants, including Express-A, Express-AM
► Insat all variants, including Insat-2, Insat-3, Insat-4
► LS-1300 all variants, including LS-1300, LS-1300 extended, LS-1300-GOES
► Spacebus-3000 all variants, including Spacebus-3000B2, Spacebus-3000B3
► Spacebus-4000 all variants, including Spacebus-4000, Spacebus-4100
► Starbus all variants, including Star-1, Star-2

50
For the purpose of this RDS, managing agents should assume the following damage levels when calculating their gross and net exposures for each model/variant group for launches that have occurred in the last five years:
Period Remaining on Policy Percentage of Satellites that Suffer a Total Loss
Greater than 24 Months 100%
18 Months - 24 Months 80%
12 Months - 18 Months 60%
6 Months - 12 Months 40%
Less than 6 Months 20%
The results should be calculated by taking the sum of the model/variant group exposures within each time period and multiplying them by the respective percentage (e.g. 20% of the total exposure for the Eurostar-2000 model/variant group that have less than 6 months left on their policy).
Managing agents should report full details of their largest potential Net Loss due to a generic defect in a single model/variant, as listed above. Managing agents should also prepare details of the Aggregate Exposure, Gross Loss, Net Loss and the number of satellites for all three model/variant groups that have the highest exposure in order that Lloyd’s can review these within the syndicate, as required.
Managing agents should assume that all satellites affected are considered to suffer a constructive total loss.

51
15 Liability Risks
Scenarios Managing Agents should report two internally modelled liability loss scenarios for each syndicate, subject to the usual de minimis criteria. Where exposed to both professional and non-professional lines liability scenarios, one of each type should be reported.
Professional Lines The following example scenarios are provided to help guide managing agents in considering the type, scale and impact of their internally modelled scenarios.
Mis-selling of a financial product
Any systemic loss arising from the mis-selling of a financial product including the distribution of said financial product through the appropriate channels. This could comprise two distinct sources of liability attributable to: 1) product and 2) distribution channel. Regulatory investigation might be a trigger to this type of systemic loss but would not of itself be the systemic loss.
Failure/Collapse of a Major Corporation
The failure or collapse of a major corporation listed on one or more Global Stock Exchanges.
Failure of a Merger
The failure or collapse of a merger involving one or major corporations listed on any Global Stock Exchange.
Failure of a Construction Project
The failure of a construction project involving all of the syndicate’s casualty risk codes (for example, non-marine liability, architects, surveyors and engineers, etc.).
The 2012 Olympics represents a major exposure in terms of potential failure of a large construction project. Major problems affected the Greek Olympics and it is not unreasonable to assume that a similar scenario could arise for the London construction project.
Recession-related Losses
A managing agent may identify that its syndicate is exposed to a dramatic fall in the housing market, associated with high negative equity, mortgage shortfalls and defaults. It could model syndicate exposures by utilising casualty risk codes, including: Independent Financial Advisors (IFAs), Solicitors, Surveyors, Lenders, Accountants.
Modelled exposures should also consider a rising unemployment rate thus potentially increasing the exposures to Employment Practices Liability underwritten as a stand-alone product or as part of Directors & Officers Liability policies.

52
Non-Professional Lines scenarios The following example scenarios are provided to help guide managing agents in considering the type, scale and impact of their internally modelled scenarios:
Industrial/Transport Incident
A managing agent may identify that it has a high potential syndicate exposure to an extreme loss arising from a release of chlorine at an industrial site or from a train travelling through a major city.
The managing agent would develop a physical model of the incident, with assumptions for the area and populations affected, and the effects of the chlorine gas itself. The model should identify the various organisations that would be held liable, including joint ventures and professional advisors that the syndicate covers.
Multiple Public/Products Losses
An agent managing a syndicate with multiple peak exposures may determine that it would be severely impacted by catastrophe losses affecting a multiple number of contracts. Such a scenario would capture the cumulative effect of a number of vertical spikes and the impact on the syndicate’s reinsurance programme.
An example of a loss scenario involving multiple products losses arising out of a common cause would be defective hip replacements which could generate a high frequency of relatively large individual payments via a series of class actions.
Treatment of Back Year Deterioration The above scenarios focus on losses arising from events occurring in 2011, and therefore do not attempt to quantify potential exposures from back year deterioration. The issue of reserving adequacy is subject to monitoring and review with colleagues within the Lloyd’s Corporation.

53
16 Political Risks
Scenarios (report up to five events) Managing agents should return up to five Political Risks loss scenarios for each syndicate based on the following events:
► Losses triggered by an economic downturn in South East Asia;
► Losses triggered by an economic crisis in South America;
► Losses triggered by a political crisis in the Middle East.
► Losses triggered by an economic downturn in Turkey.
► Losses triggered by an economic downturn in the Russian Federation.
Managing agents should return those scenarios that generate losses above the ‘de-minimis’ reporting level.
Supplementary country aggregate must be reported for 20 countries as agreed with the LMA Political Risks Panel.
Detailed guidance notes and the reporting template are available from CMR or the Lloyd’s Exposure Management team.
17 Alternative RDS A & B
Managing agents should report two further realistic events not listed above that represent a potential material impact to the syndicate.
Examples include:
► Earthquakes outside of California, New Madrid, and Japan;
► A major flood incident e.g. the Seine, 1953 type North Sea coastal flood;
► Caribbean /US hurricane clash;
► Pandemic risk;
► Terrorism accumulations (ex-Manhattan);
► A ‘Selby-type’ liability loss;
► An accumulation of sports team members
Two alternative scenarios must be reported via the RDS return. Alternative scenarios are not subject to Franchise Guidelines.

54