recall execution effectiveness: collaborative approaches
TRANSCRIPT

Recall Execution Effectiveness:Collaborative Approaches toImproving Consumer Safety and Confidence

About FMI
Food Marketing Institute (FMI) conducts programs in public affairs, food safety, research, education and industry relations onbehalf of its 1,500 member companies—food retailers and wholesalers—in the United States and around the world. FMI'sU.S. members operate approximately 26,000 retail food stores and 14,000 pharmacies. Their combined annual sales vol-ume of $680 billion represents three-quarters of all retail food store sales in the United States. FMI's retail membership iscomposed of large multi-store chains, regional firms and independent supermarkets. Its international membership includes200 companies from more than 50 countries. FMI's associate members include the supplier partners of its retail and whole-sale members.
About GMA
The Grocery Manufacturers Association (GMA) represents the world’s leading food, beverage and consumer products compa-nies. The association promotes sound public policy, champions initiatives that increase productivity and growth and helps toprotect the safety and security of the food supply through scientific excellence. The GMA board of directors is comprised ofchief executive officers from the association’s member companies. The $2.1 trillion food, beverage and consumer packagedgoods industry employs 14 million workers, and contributes over $1 trillion in added value to the nation’s economy. For moreinformation, visit the GMA Web site at www.gmaonline.org.
About GS1 U.S.
GS1 US is a not-for-profit organization dedicated to the adoption and implementation of standards-based, global supply-chain solutions. More than 200,000 businesses in 25 industries rely on GS1 US for trading-partner collaboration and formaximizing the cost effectiveness, speed, visibility, and traceability of their goods moving around the world. They achievethese benefits through GS1 US solutions based on GS1 global unique numbering and identification systems, bar codes,Electronic Product Code-based RFID, data synchronization, and electronic information exchange. GS1 US also manages the United Nations Standard Products and Services Code® (UNSPSC®). www.GS1US.org.
About Deloitte
Deloitte refers to one or more of Deloitte Touche Tohmatsu, a Swiss Verein, and its network of member firms, each of which is a legally separate and independent entity. Please see www.deloitte.com/about for a detailed description of the legalstructure of Deloitte Touche Tohmatsu and its member firms. Please see www.deloitte.com/us/about for a detailed description of the legal structure of Deloitte LLP and its subsidiaries.
Copyright © 2010 Grocery Manufacturers Association. All rights reserved.
Copyright © 2010 Deloitte Development LLC. All rights reserved. Member of Deloitte Touche Tohmatsu.
This publication contains general information only and is based on the experiences and research of Deloitte practitioners.Deloitte is not, by means of this publication, rendering business, financial, investment, or other professional advice or servic-es. This publication is not a substitute for such professional advice or services, nor should it be used as a basis for any deci-sion or action that may affect your business. Before making any decision or taking any action that may affect your business,you should consult a qualified professional advisor. Deloitte, its affiliates, and related entities shall not be responsible for anyloss sustained by any person who relies on this publication.

May, 2010
Dear Industry Stakeholders:
Consumer safety is the number one priority for GMA, FMI and GS1 US members—without it, nothing we do is possible.We take our responsibility for the products we manufacture and sell seriously and want consumers and policy makers toknow that we are vigilant when it comes to safety and consumer protection.
As part of our culture of continuous improvement, GMA, FMI and GS1 US have undertaken a thorough evaluation of the systems used to identify and remove recalled products from the supply chain. To date, this effort has resulted in twosignificant initiatives.
First, our industry launched the Rapid Recall Exchange last September. It is an innovative service designed to acceleratethe recall notification and product removal process between trading partners. It currently serves more than 85 percent of supermarket sales volume and we continue to promote adoption of this valuable tool in other channels of retail tradesuch as food service, mass, drug and convenience store formats.
Recall Execution Effectiveness: Collaborative Approaches to Improving Consumer Safety and Confidence, publishedin partnership with Deloitte Consulting LLP, represents the second phase of our proactive effort to improve the recall
process and provide recommendations for enhanced manufacturer-retailer recall execution. Specifically, the report focuses on current practices and opportunities in five key areas of the recall process: issue identification, recall notifi -cation, product removal/destruction, product replacement and feedback loop.
The efficiencies and insights gained from this report are important tools in the industry-wide quest to improve productsafety and recall programs. Initiatives such as this one, combined with the industry’s commitment to working with theAdministration, Congress, Food and Drug Administration, U.S. Department of Agriculture, Centers for Disease Controland other stakeholders to strengthen our product safety net, are critical to bolstering consumer confidence in the brandsand products they rely on everyday.
Sincerely,
Pamela G. Bailey Leslie G. Sarasin Bob CarpenterPresident and CEO President and CEO President and CEOGrocery Manufacturers Association Food Marketing Institute GS1 US
Collaborative Approaches to Improving Consumer Safety and Confidence 1

2 Recall Execution Effectiveness:

Introduction 5
Acknowledgments 8
Call to Action — Why Focus on Recall Execution Now? 9
The State of Recall Execution: Current and Leading Practices 11
– Identification 11
– Notification 17
– Removal and Destruction 25
– Replacement 30
– Feedback Loop 32
Recommendations 36
Appendix 1, Survey Results 39
Appendix 2, Recall Standards 51
Appendix 3, Disposal Guidelines 52
Appendix 4, Guide to Conducting Mock Recalls 53
Appendix 5, Recall Resources 54
End Notes 56
Contents
Collaborative Approaches to Improving Consumer Safety and Confidence 3

4 Recall Execution Effectiveness:

IntroductionObjectives and Scope
This study examines the food and consumer packaged goods recall practices of both U.S. manufacturers and retailers andidentifies opportunities to improve recall execution.
The scope of our research focuses on the response step of the “Prevention — Intervention — Response” framework usedby the Food and Drug Administration (FDA) in its Food Protection Plan of November 2007, and specifically addressesClass I recall practices.
Practices discussed in this report that trading partners can consider in their efforts to work more effectively in the event ofa recall are defined within the following key steps:
• Issue identification: Identification and investigation of affected products by manufacturers.
• Recall notification: Notification to all stakeholders (customers, regulators, consumers) about a recall, its status andnecessary actions.
• Product removal and destruction: Removal of a recalled product from the supply chain and complete and properdisposal of the recalled product.
• Product replacement: Shelf replenishment to ensure consumer satisfaction.
• Feedback loop: Collaborative practices and knowledge sharing internally within organizations and externally withsuppliers, retail partners and third parties.
In this report, we discuss current and leading practices for both manufacturers and retailers at each step of the recall execution process (Figure 1), and make both short- and long-term recommendations for improvement. Specific attentionis paid to the identification and notification steps of the process, because — according to a recent Deloitte poll1 and thisstudy — companies view these as the most challenging steps and the biggest opportunities for improvement.
The geographical scope of this study is the United States only.
Approach and Methodology
The findings in this study are based on the analysis of:
• Survey responses from 54 companies, representing approximately $152 billion in manufacturer sales and $329 billion inretailer 2008 annual sales. Retailer survey respondents represent 47 percent of Super 50 all-commodity volume (ACV)2 .
• 29 industry interviews (15 manufacturers, 10 retailers and four service providers).
• Interviews with Deloitte subject-matter specialists (technology, retailer supply chain, manufacturer supply chain, regula-tory and risk, food and product safety).
Collaborative Approaches to Improving Consumer Safety and Confidence 5
Issue Identification
Recall Notification
Product Removal and Destruction
Product Replacement
Feedback Loop
Step Description Process of identifying issues, escalating and triggering product recalls
Process of notifying consumers, employees, suppliers, and regulatory bodies of product recalls
Process of removing from the shelf and disposing of the recalled products
Process of replacing the recalled products on the shelf with a new product, brand, or SKU
Process of incorporating ‘lessons learned’ into future preventive / reactive recall practices
Step Objective Minimize time required for issue detection, investigation and decision making to protect consumers
Provide all constituents with the required recall information as quickly as possible
Remove and destroy products as thoroughly and rapidly as possible to protect consumers
Replace the product on shelf, with minimal consumer harm and manufacturers / retailers negative impact (financial and brand related)
Continuously improve organization, processes, metrics and overall ability to execute recalls effectively
Figure 1. Product recall execution – Key steps
(As used in this document, “Deloitte” means Deloitte Consulting LLP, a subsidiary of Deloitte LLP. Please seewww.deloitte.com/us/about for a detailed description of the legal structure of Deloitte LLP and its subsidiaries.)
The surveys and interviews were conducted from September through November 2009. The findings qualified to beincluded in this study if they were mentioned by three or more respondents as a part of the survey or interviews.
In addition, this study draws upon publicly reported company data, results from a recently conducted Deloitte poll3 andother published materials.
The current and leading practices outlined in this report are examples of practices cited by survey respondents or inter-view participants. These practices are options that companies should consider as they develop their own recall executionprocedures. Ultimately, each company must determine what practices are most compatible with its products, manufac-turing processes, distribution systems and available resources. The leading practices outlined in this report usually repre-sent innovative or differentiated recall execution approaches. For that reason, they may be especially helpful as compa-nies seek to improve recall efficiency and effectiveness. However, other approaches may be deemed equivalently or moreeffective in certain circumstances.
Because the study focuses on Class I recalls, those companies that have never had a Class I recall shared their plans,processes and procedures for Class I recalls. Thirty-five percent of the manufacturers interviewed have had a Class I recallin the past.4
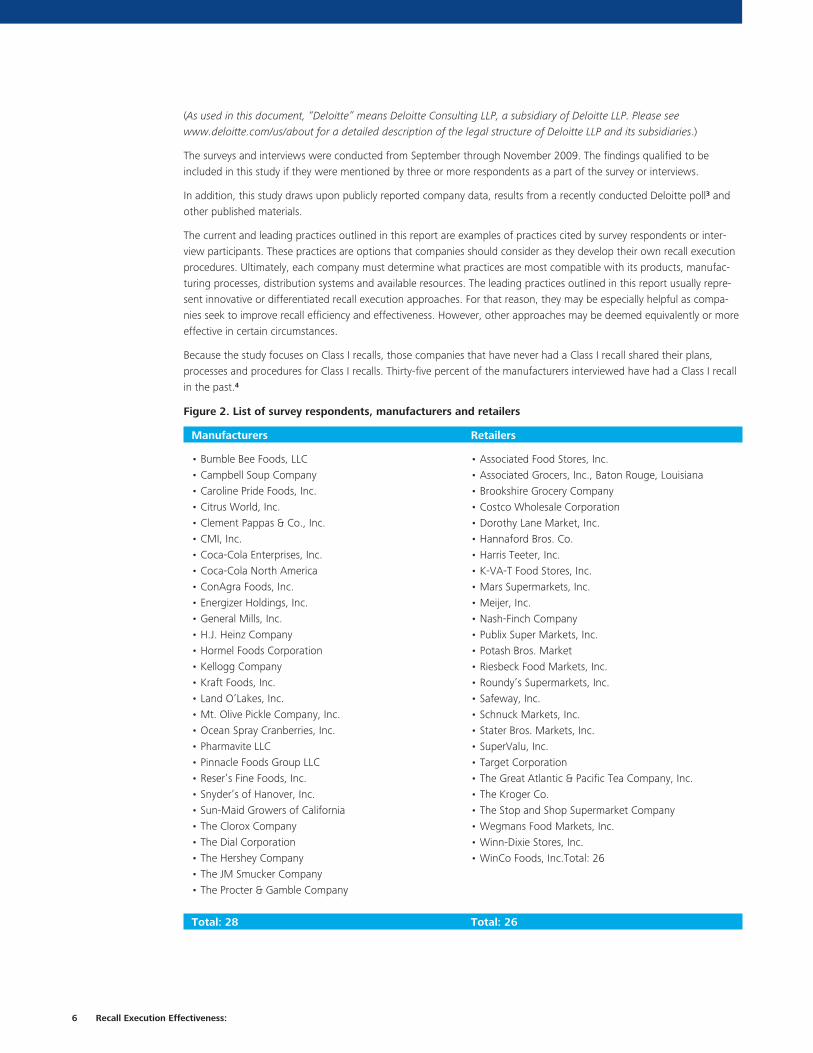
Figure 2. List of survey respondents, manufacturers and retailers
Manufacturers Retailers
Total: 28 Total: 26
6 Recall Execution Effectiveness:
• Bumble Bee Foods, LLC • Campbell Soup Company • Caroline Pride Foods, Inc.• Citrus World, Inc.• Clement Pappas & Co., Inc.• CMI, Inc.• Coca-Cola Enterprises, Inc.• Coca-Cola North America• ConAgra Foods, Inc.• Energizer Holdings, Inc.• General Mills, Inc.• H.J. Heinz Company• Hormel Foods Corporation• Kellogg Company• Kraft Foods, Inc.• Land O’Lakes, Inc.• Mt. Olive Pickle Company, Inc.• Ocean Spray Cranberries, Inc.• Pharmavite LLC• Pinnacle Foods Group LLC• Reser’s Fine Foods, Inc.• Snyder’s of Hanover, Inc.• Sun-Maid Growers of California• The Clorox Company• The Dial Corporation• The Hershey Company• The JM Smucker Company• The Procter & Gamble Company
• Associated Food Stores, Inc.• Associated Grocers, Inc., Baton Rouge, Louisiana• Brookshire Grocery Company • Costco Wholesale Corporation • Dorothy Lane Market, Inc. • Hannaford Bros. Co.• Harris Teeter, Inc.• K-VA-T Food Stores, Inc.• Mars Supermarkets, Inc.• Meijer, Inc.• Nash-Finch Company• Publix Super Markets, Inc.• Potash Bros. Market• Riesbeck Food Markets, Inc.• Roundy’s Supermarkets, Inc.• Safeway, Inc.• Schnuck Markets, Inc.• Stater Bros. Markets, Inc.• SuperValu, Inc.• Target Corporation• The Great Atlantic & Pacific Tea Company, Inc.• The Kroger Co.• The Stop and Shop Supermarket Company• Wegmans Food Markets, Inc. • Winn-Dixie Stores, Inc.• WinCo Foods, Inc.Total: 26

Report Organization
The study is organized into the following sections:
Section 1: Call to Action — Current food and product safety complexities and the increased need for companies tofocus on improved recall execution.
Section 2: The State of Recall Execution: Current and Leading Practices — Successful practices today in keyareas of recall execution.
Section 2.1: Identification Process — Steps companies follow to minimize time required for issue detection, investi-gation and decision-making to protect consumers.
Section 2.2: Notification Process — Steps companies follow to minimize time required to notify consumers, customers, stores and regulatory authorities.
Section 2.3: Removal and Destruction Process — Ways companies make the removal and destruction processesmore effective.
Section 2.4: Replacement — Actions companies take to replace the product on shelf, with minimal consumer harmand financial and brand impact.
Section 2.5: Feedback Loop — Ways companies improve organization, processes, metrics and their ability to executerecalls with speed and efficiency.
Section 3: Recommendations — Opportunities to improve recall management practices across three dimensions: a) communication and collaboration, b) processes, organization and metrics, and c) technology.
Appendix — Detailed data that supports the statistics presented throughout the study, plus additional reference materials.
Background: What Are Recalls?
Product recalls are defined differently by companies, industry bodies and regulatory agencies. Below are two commonlyaccepted definitions:
The FDA definition: Recalls are actions taken by a firm to remove a product from the marketplace. Recalls may be con-ducted on a firm’s own initiative, by FDA request, or by FDA order under statutory authority.5
The Food Safety and Inspection Service (FSIS) definition: A recall is a firm’s action to remove product from com-merce (e.g., by manufacturers, distributors or importers) to protect the public from consuming adulterated or misbrandedproducts.6
Per the FDA’s definition, recalls include those product violations that would result in government legal action. (For exam-ple, because of potential risk to consumers.) Under the FSIS definition, any regulatory violation due to product adulter-ation or misbranding would result in a recall.7 Companies need to work closely with the FDA and FSIS on a case-by-casebasis to determine whether an issue with a product warrants a recall. Once an agreement is reached that a productneeds to be recalled, the next step is to classify it based on potential health hazard.
• Class I recall: A situation in which there is a reasonable probability that the use of or exposure to a violative productwill cause serious adverse health consequences or death. For example, salmonella in peanuts.
• Class II recall: A situation in which use of or exposure to a violative product may cause temporary or medicallyreversible adverse health consequences or where the probability of serious adverse health consequences is remote. Forexample, allergic reactions due to undeclared ingredients.
• Class III recall: A situation in which use of or exposure to a violative product is not likely to cause adverse health con-sequences. For example, minor labeling violations.8
A recall may be triggered by manufacturers, distributors or retailers, depending on who is responsible for the violation.For example, a manufacturer may not have processed the product correctly, while a distributor or retailer may not havestored the product under appropriate sanitation conditions. Ultimately, a successful recall entails strong collaborationbetween all players in the value chain, as well as with regulatory agencies.
Collaborative Approaches to Improving Consumer Safety and Confidence 7

Deloitte would like to express its appreciation to Grocery Manufacturers Association, Food Marketing Institute and GS1US for the opportunity to assist in developing this study on such an important topic to the U.S. food and consumer pack-aged goods industry. Special thanks go the GMA, FMI, GS1 US leadership team and the Joint Industry Shelf-ForwardRecall Working Group for their commitment, time and contribution to this effort.
Joint Industry Shelf–Forward Working Group members:
Chris Baldwin, (former) President, Snacks, Kraft North America (Chair) Michael Beer, Director, Efficient Replenishment Strategy, General Mills, Inc.Philippe Caradec, Vice President, Regulatory and Corporate Affairs, The Dannon CompanyJoe Crafton, President, CROSSMARKBrooke Fan, Director, Supply Chain Strategies, Safeway Inc.Daniel Field, Quality Systems Development Manager, The Coca-Cola CompanyJames Flannery, Director, Customer Development, The Procter & Gamble CompanySarah Geisert, Senior Director, Product Safety and Regulatory Affairs, General Mills, Inc.Beverly Grant, Chief Customer Officer, US Grocery, Customer Business Development, The Procter & Gamble CompanyAllen Hamer, Corporate Manager of PRC, Safeway, Inc.David Haubert, Director, Manufacturer Collaboration, Safeway, Inc.Jill Hollingsworth, Group Vice President, Food Safety Programs, Food Marketing Institute Jeanne Iglesias, Senior Director, Supply Chain and Technology, Grocery Manufacturers Association Dave Jones, Vice President, Business Development and Sales Operations, Kellogg CompanyTamara Kenney, Vice President, Solutions, GS1 US John Kolenski, Director, Food Safety and Regulatory Compliance, The Kroger CompanyCathy LeRoux, Associate Director, Product Risk and Crisis Management, Kellogg CompanyKevin Little, Vice President, Retail Effectiveness, ConAgra Foods Brian Lynch, Director, Sales & Sales Promotion, Grocery Manufacturers AssociationSherry Marcouiller, Chief Counsel, Food Law, Kraft Foods, Inc.Craig McPhee, Executive Director, Distribution, Associated Food StoresJerry Noland, Group Vice President, Quality Assurance & Consumer Protection, Safeway Inc.Linda Pell, Sr. Director, Consumer & Quality Services, Kellogg CompanyGina Reo, QEHS Director, Cadbury Adams USA LLCJoseph Scaccia, Director, Strategy and Sales Operations, Kraft Foods Inc.Eugene Schachte, Senior Manager, Reverse Logistics, H.J. Heinz CompanyStephen Sibert, Senior Vice President, Industry Affairs, Grocery Manufacturers AssociationBrad Smith, Senior Vice President, Retail Operations, Acosta Sales and Marketing CompanyPatrick Walsh, Vice President, Industry Collaboration, Education and Research, Food Marketing Institute Mark Wilhite, Vice President, Industry Initiatives, Military, SUPERVALU and National Retail, General Mills, Inc. Shawna Wills, US Crisis Team, Campbell Soup Company Peter Wyman, Vice President, Sales, Ocean Spray Cranberries, Inc. Joe Zenobio, Senior Vice President, Chief Product & Solutions Officer, GS1 US
Deloitte, GMA and FMI would like to recognize the many individuals from consumer product manufacturers and retailerswho supported the research by completing the survey and/or participating in interviews. In addition, we would like tothank the service provider companies that contributed to this study by providing data and participating in the interviews:RQA Inc., Carolina Logistics Services (Inmar), and GENCO Damage Research.
8 Recall Execution Effectiveness:
Acknowledgments
Rising Number and Complexity of Product Recalls
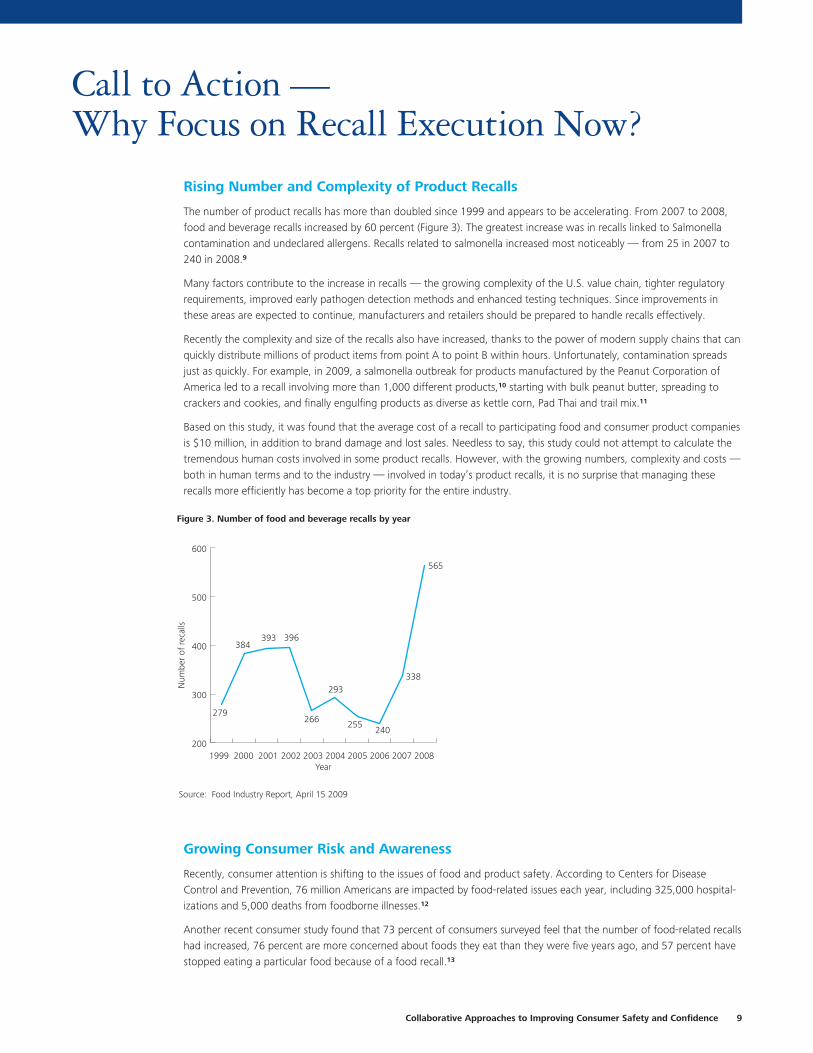
The number of product recalls has more than doubled since 1999 and appears to be accelerating. From 2007 to 2008,food and beverage recalls increased by 60 percent (Figure 3). The greatest increase was in recalls linked to Salmonellacontamination and undeclared allergens. Recalls related to salmonella increased most noticeably — from 25 in 2007 to240 in 2008.9
Many factors contribute to the increase in recalls — the growing complexity of the U.S. value chain, tighter regulatoryrequirements, improved early pathogen detection methods and enhanced testing techniques. Since improvements inthese areas are expected to continue, manufacturers and retailers should be prepared to handle recalls effectively.
Recently the complexity and size of the recalls also have increased, thanks to the power of modern supply chains that canquickly distribute millions of product items from point A to point B within hours. Unfortunately, contamination spreadsjust as quickly. For example, in 2009, a salmonella outbreak for products manufactured by the Peanut Corporation ofAmerica led to a recall involving more than 1,000 different products,10 starting with bulk peanut butter, spreading tocrackers and cookies, and finally engulfing products as diverse as kettle corn, Pad Thai and trail mix.11
Based on this study, it was found that the average cost of a recall to participating food and consumer product companiesis $10 million, in addition to brand damage and lost sales. Needless to say, this study could not attempt to calculate thetremendous human costs involved in some product recalls. However, with the growing numbers, complexity and costs —both in human terms and to the industry — involved in today’s product recalls, it is no surprise that managing theserecalls more efficiently has become a top priority for the entire industry.
Growing Consumer Risk and Awareness
Recently, consumer attention is shifting to the issues of food and product safety. According to Centers for DiseaseControl and Prevention, 76 million Americans are impacted by food-related issues each year, including 325,000 hospital-izations and 5,000 deaths from foodborne illnesses.12
Another recent consumer study found that 73 percent of consumers surveyed feel that the number of food-related recallshad increased, 76 percent are more concerned about foods they eat than they were five years ago, and 57 percent havestopped eating a particular food because of a food recall.13
Call to Action — Why Focus on Recall Execution Now?
Collaborative Approaches to Improving Consumer Safety and Confidence 9
Figure 3. Number of food and beverage recalls by year
200
300
400
500
600
1999 2000 2001 2002 2003 2004 2005 2006 2007 2008Year
279
384393 396
266
293
255240
338
565
Source: Food Industry Report, April 15 2009
Num
ber
of re
calls

Shifting demographics and changing consumption patterns reinforce the need for the industry to pay attention to thisissue. Consider the following statistics:
• Consumption of raw products is increasing very rapidly. For example, fresh spinach consumption grew 180 percentbetween 1992 and 2005.14
• The U.S. population is becoming more susceptible to foodborne illness — 20 to 25 percent of the population is com-prised of the elderly, children and pregnant women — the highest risk categories.15
• By 2015, it is estimated that one in five Americans will be over the age of 60 and, therefore, more susceptible to certaintypes of infections. As more Americans live longer with chronic illnesses, including cancer and diabetes, vulnerability willonly increase.16
Furthermore, society at large is exhibiting a strong interest in both the drivers of product recalls and in the steps compa-nies should take to minimize the number of consumer health-related incidents. This has been demonstrated by a series ofdocumentaries and articles developed over the past few years, as well as an increase of focus from consumer advocacygroups dedicated to communicating the risk associated with product recalls. For example, the Consumer Federation ofAmerica, consisting of 300 consumer groups and representing more than 50 million Americans17, is very active in foodand product safety.
Significant Impact on Share Price and Market Value
Wall Street keeps consumer packaged goods (CPG) companies on their toes. This study found that the day after a recallannouncement, the stock price of the affected company underperforms the sector index by an average of 2.3 percent.18
In fact, a company with poor recall execution processes could see declines of up to 22 percent within two weeks afterthe recall announcement.19
In addition, the study found that the way a company manages product recalls and how it communicates to the publichave a direct impact on its stock price. Therefore, it behooves companies to be prepared to execute recalls quickly andwith great efficiency.
Increasing Pressure From Trading Partners
As the industry focuses more attention on product recall management, individual companies face increasing pressurefrom trading partners to improve recall execution processes. The pressure varies from timely notification to effectiveremoval and destruction of recalled product. The complexity of the modern supply chain (e.g., high number of SKUs,globalization of sourcing) also puts an additional burden on manufacturers to capture data and track ingredients, not justwithin their own four walls, but also up and down an expanded supply chain.
Given the number of recalls, retailers are also playing a more proactive role in the quality assurance of national branditems. Some retailers have started conducting tests on suppliers’ products to detect food safety issues, especially on prod-ucts that are deemed to be risky. For example, Wegmans Food Markets, Inc. conducts internal testing to detect mercurylevels in swordfish and tuna.20 Some other retailers add a clause on testing of incoming products in their transactionagreements or buyer specifications with suppliers.
10 Recall Execution Effectiveness:

IdentificationIn a recent poll, 42 percent of company representatives surveyed agreed that identification is the most important step inincreasing effectiveness of recall execution.21 In fact, early identification and timely escalation of an issue are critical inpreventing delays throughout the entire recall process.
Currently, manufacturers typically take from 0.5 to 72 hours22 to complete the identification process, measured from themoment an issue is detected to the moment a recall decision is made. Interestingly, there is a correlation between manu-facturer size and the time required to run the identification process. Smaller organizations with few facilities (those withless than $700MM in revenue and fewer than 15 facilities) complete the identification process in between 0.5 and 17hours. Larger organizations take 32 hours23 on average, because they need more time to make cross-functional decisionsand trace more products through more facilities and numerous different distribution channels.
In some cases, including some recent high profile recalls involving fresh produce and seasonings, identification of a spe-cific product that needs to be recalled occurs only after a protracted epidemiological investigation by CDC, FDA/FSIS andthe states links human illnesses to a particular food or ingredient. At that point the decision to recall is generally preor-dained and little investigation is required by the food company other than to rapidly identify the lots of product thatneed to be recalled.
Companies need to deploy processes and systems that allow for structured and swift identification and escalation ofrecall issues across the following areas of identification:
1. Prevention: Inhibits food safety issues through quality assurance processes; while not formally part of the identifica-tion process, prevention is important because gaps can lead to food safety problems.
2. Issue Detection: Starts from the time a potential food safety issue is reported based on pre-defined triggers until aninvestigation is launched.
3. Investigation: Determines the severity and scope through laboratory tests. Technology is used to locate the product..
4. Recall Decision: Completes the identification process by reaching an internal decision that a recall should take place.The decision is typically made by a senior level executive.
5. Governance: Helps ensure that crisis teams are involved from issue detection to investigation.
These areas of Identification, and activities within each, are graphically depicted below in Figure 4.
The State of Recall Execution:Current and Leading Practices
Collaborative Approaches to Improving Consumer Safety and Confidence 11
Figure 4. Key identification areas and activities
0. Prevention
1.Issue
detection
2. Investigation
3. Decision 4
. G
ove
rnan
ce –
Cri
sis
team
Vendor QA
HACCP
Consumer input
Understand problem scope (through technology)
Understand severity of issue
Customer input
Manufacturer QA
Third
-par
ty p
rovi
der
assi
stan
ce
Product recall decision
Escalation mechanisms
Triggers
Manufacturer

Prevention and Issue Detection — A Stitch in Time Saves Nine
Companies implement quality assurance (QA) processes toprevent food safety issues altogether, or, if an issue exists, toidentify it as early as possible. Prevention can limit the numberof recalls, as well as their severity. In this study, 81 percent ofmanufacturers represented in the survey already have a stan-dard quality assurance (QA) procedure in place,24 which helpsprevent food safety issues and recalls. However, due to imper-fections or failures of the QA process, recalls still happen. Seethe callout box on the right for select recall reasons.
The survey data shows that 42 percent of recalls stem from supplier-related raw material issues, and 56 percent stemfrom internal process issues, including manufacturer error, labeling error and product content error (Figure 5). These sta-tistics indicate that companies may want to consider evaluating their need to improve QA processes within their organiza-tions and at their supplier base.
Within their own quality assurance processes, companies mayhave clearly defined triggers for the detection of productissues early in the manufacturing process. Companies employa multi-pronged testing approach to discover any raw orsource material, any manufacturing process that mightadversely affect public health in any way. Raw material orproduct found to have contamination levels exceeding definedlimits are rejected prior to reaching the finished productphase, thus reducing the number of recall incidents.
Today, one of the standard ways of integrating triggers intothe manufacturing process is a preventive program called HACCP (Hazard Analysis Critical Control Point), already imple-mented by many manufacturers. Based on our survey results, 88 percent of manufacturers represented have integratedHACCP with their supply chain processes across all their facilities.25
12 Recall Execution Effectiveness:
Selected Recall Reasons:
• Microbial contamination• Misbranding (e.g., undeclared allergens)• Foreign material contamination• HACCP plan failure• Chemical contamination• Illegal pesticide or drug residues• Packaging defects• Worker illness or disease• Intentional contamination
Source: GMA Product Recall Manual, 2010
Figure 5. Root causes of product recalls, manufacturers
42%
17%
10%
10%
19%
2%
Raw material / ingredient issueManufacturing error (17%)Contractor manufacturing error
Product content errorLabeling errorOther (e.g., foreign material)
Q. What caused the product recalls?N = 14
Common Recall Triggers
• Detection of a pathogen• pH value change on retained samples• Micro testing of in-line product• Micro testing of finished goods• Misinformation and labeling• Positive Listeria monocytogenes• Harmful substance levels, e.g., pesticide, melamine• Product tampering or sabotage

However, purely integrating HACCP with supply chainprocesses is not the same as having a comprehensive HACCPprogram that allows for immediate detection of an issue. Acomprehensive HACCP program employed by leading compa-nies includes these characteristics:
• Uses integrated technology systems rather than paper-basedor spreadsheet systems.
• Communicates potential issues on a near real-time basis. Forexample, if the temperature of a product goes above a cer-tain limit, the sensor would detect the temperature change,set off an alarm / alert and shut off the production line auto-matically.
• Extends beyond the company’s facilities and goes all theway back to the raw material source (including farmers foragricultural products).
To help ensure quality outside their four walls, most manufac-turers have supplier audit programs in place that require sup-pliers to provide a Certificate of Analysis indicating the com-pletion of testing in compliance with quality standards. Mostmanufacturers also use third-party auditors to validate supplierquality.
However, simple intermittent audits may not be comprehen-sive enough. Without providing visibility into all the day-to-dayoperations of a supplier, these audits can easily miss an issue.Companies that are more advanced in managing quality:
• Work with third parties to tailor quality audits for differenttypes of processing, materials and equipment.
• Define global quality standards for common processes andequipment.
• Run mock recall exercises at suppliers’ facilities and reflectresults in their audit scores
Issue Detection — Consumer Complaints Matter
Manufacturers typically receive consumer complaints through direct channels (such as the consumer hotline, email andweb form email) or indirectly from retailers. Collecting consumer feedback helps companies quickly detect potential prod-uct issues.
Most companies in our study — 77 percent of manufacturersand 74 percent of retailers26 — have a standard metric forconsumer complaints, such as the number of complaints perweek. Furthermore, these companies evaluate metrics, such asseverity of issue, frequency of consumer complaints and con-sumer complaint hierarchy. These metrics, which differ fromcompany to company, are typically defined based on a com-pany’s recall experience.
While no single metric is optimal for the whole industry, for-ward-thinking companies have started leveraging predictivetechniques that use an understanding of the data patterns inprior recalls to help identify potential recall issues early in the
Collaborative Approaches to Improving Consumer Safety and Confidence 13
HACCP (Hazard Analysis Critical Control Point)is a management system in which food safety isaddressed through the analysis and control of biolog-ical, chemical, and physical hazards from raw materialproduction, procurement and handling, to manufac-turing, distribution and consumption of the finishedproduct.
Source: FDA
Leading Practice: Technology-EnabledPrevention
A manufacturer implemented an integration and con-trol system with scanning technology which matchesthe bar code on labels with container codes. If anissue is found during the matching process, theassembly line is halted. This system has reducedalleged labeling related complaints by 97 percent.
Source: Food Safety Magazine, ”Building a World-class AllergenControl Program, Part 2,” January 2009. <www.foodsafety-magazine.com>
Leading practice: Supplier audits
A large company conducts regular facility audits of all of its suppliers. As part of the scored quality audit,the company performs mock-recall exercises to deter-mine the supplier’s ability to identify a specific, theo-retically contaminated, batch of raw material. Thetime taken to identify the batch and fax the applica-ble Certificate of Analysis impacts the supplier’s auditscore. The company uses the audit scores to annuallyevaluate its suppliers and award future business.
Leading practice: Investigating consumer complaints
Manufacturers can thoroughly investigate consumercomplaints by either setting up a hotline internally orby using a third-party provider. Regardless of themethod used, upon receipt of consumer complaints,the internal team or third-party provider reviews thedata and issue to determine if the manufacturercould have a potential product recall issue. Theresults of this initial detection are promptly submittedto the dedicated recall team.

14 Recall Execution Effectiveness:
process. Predictive analytics are already prevalent in other parts of the consumer products industry. For example, com -panies use consumer demographics to identify which consumer segments will buy a new product.
Investigation — Four Walls Ecosystem Is not as Simple as it Seems
Once an issue has been detected, manufacturers must be able to identify both 1) the location of the product and otherproducts that may have been affected within the four walls of the company and 2) the location of the product one stepforward and one step backward in the supply chain.
Most companies surveyed say that tracking products outside their four walls is the key challenge for their organization, as well as for the industry. However, companies need to focus on their internal systems and processes as well so they canbe more effective in pinpointing the affected lot and ingredient, in identifying location, and in fixing the manufacturingprocesses that led to the product contamination.
Information technology can play a critical role in this process. Using a cake product as an example, if the issue is with araw material ingredient (e.g., flour), then the manufacturer should be able to determine which supplier provided the con-taminated flour. Without automation and integration of data capture from raw materials to finished goods, companiesare not able to easily locate the products within a reasonable timeframe.
Currently, 31 percent of manufacturers represented in our study can locate necessary information about affected lotswithin two hours.27 Seventy eight percent of manufacturers can locate lot information within eight hours. Those com -panies that take longer than eight hours may want to take steps to improve their technology capabilities.
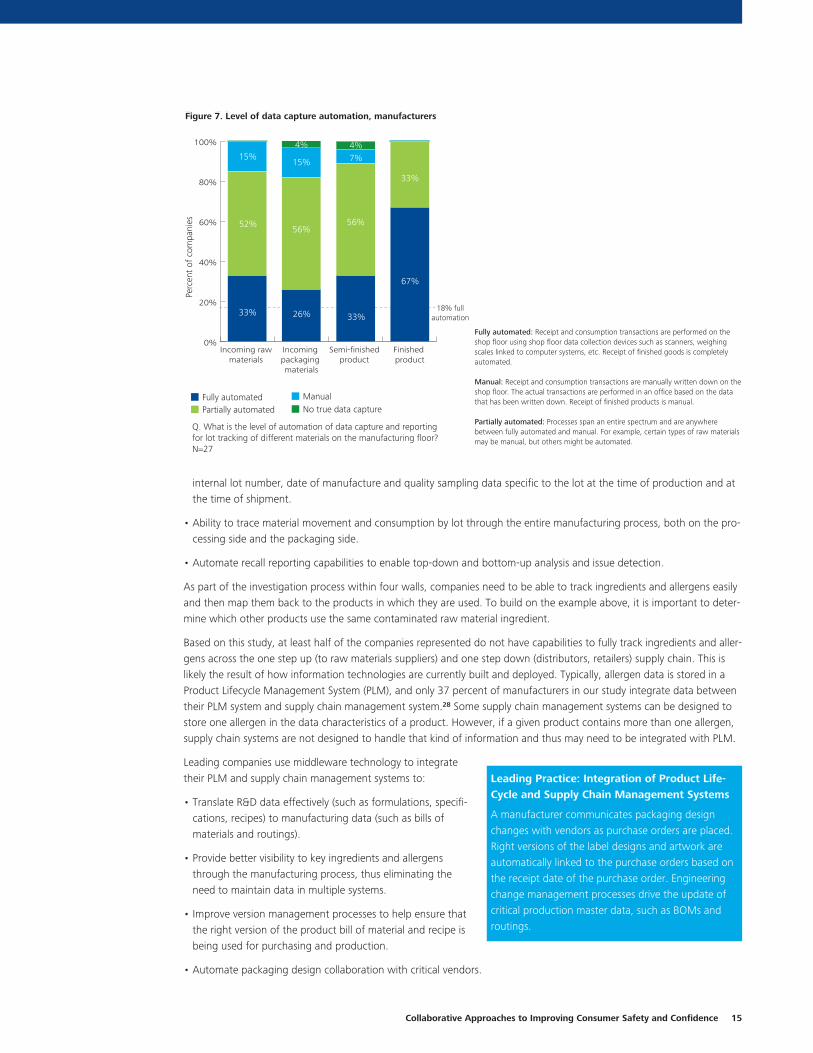
Even though most companies have at least partially automat-ed their data capture capabilities, only 18 percent fully auto-mate data capture throughout the entire production chainfrom raw materials to finished goods (Figure 7). This inhibits a company’s ability to identify the lot number of the affectedproducts quickly.
To run effective and timely investigation processes, manufac-turing companies may consider:
• Automated data collection systems and process disciplinefor the real-time capture of lot numbers and associated lotcharacteristics for all materials / products on the shop floor.For incoming raw materials, required data includes the lotnumber, the vendor lot number, the date of manufactureand any associated quality characteristics specific to the lot.
• For products produced in-house, data required includes the
Figure 6. Manufacturing company technology system architecture
PLM(Recipes,
ingredient info)
Raw material
Finance (ERP)
Semi-finished goods
Sales (ERP)
Finished goods
Manufacturing company – within four walls
Shop floorSupplier Customer
outside four walls outside four walls
Leading Practice: Internal Audits Test AbilityTo Identify Lots
A manufacturer runs scenarios to test its technologycapabilities every quarter. Examples of scenarios tested include:• Bottom-up tracking of poor quality packaging
material through the supply chain based on thevendor lot number.
• Top-down tracking based on metal detected in afinished product at the customer.
• Related bottom-up tracking based on root cause ofthe metal.
• Bottom-up tracking of all products that contain a certain allergen and all customers that havereceived these shipments.
internal lot number, date of manufacture and quality sampling data specific to the lot at the time of production and atthe time of shipment.
• Ability to trace material movement and consumption by lot through the entire manufacturing process, both on the pro-cessing side and the packaging side.
• Automate recall reporting capabilities to enable top-down and bottom-up analysis and issue detection.
As part of the investigation process within four walls, companies need to be able to track ingredients and allergens easilyand then map them back to the products in which they are used. To build on the example above, it is important to deter-mine which other products use the same contaminated raw material ingredient.
Based on this study, at least half of the companies represented do not have capabilities to fully track ingredients and aller-gens across the one step up (to raw materials suppliers) and one step down (distributors, retailers) supply chain. This islikely the result of how information technologies are currently built and deployed. Typically, allergen data is stored in aProduct Lifecycle Management System (PLM), and only 37 percent of manufacturers in our study integrate data betweentheir PLM system and supply chain management system.28 Some supply chain management systems can be designed tostore one allergen in the data characteristics of a product. However, if a given product contains more than one allergen,supply chain systems are not designed to handle that kind of information and thus may need to be integrated with PLM.
Leading companies use middleware technology to integratetheir PLM and supply chain management systems to:
• Translate R&D data effectively (such as formulations, specifi-cations, recipes) to manufacturing data (such as bills ofmaterials and routings).
• Provide better visibility to key ingredients and allergensthrough the manufacturing process, thus eliminating theneed to maintain data in multiple systems.
• Improve version management processes to help ensure thatthe right version of the product bill of material and recipe isbeing used for purchasing and production.
• Automate packaging design collaboration with critical vendors.
Collaborative Approaches to Improving Consumer Safety and Confidence 15
Fully automated: Receipt and consumption transactions are performed on the shop floor using shop floor data collection devices such as scanners, weighing scales linked to computer systems, etc. Receipt of finished goods is completely automated.
Manual: Receipt and consumption transactions are manually written down on the shop floor. The actual transactions are performed in an office based on the data that has been written down. Receipt of finished products is manual.
Partially automated: Processes span an entire spectrum and are anywhere between fully automated and manual. For example, certain types of raw materials may be manual, but others might be automated.
Leading Practice: Integration of Product Life-Cycle and Supply Chain Management Systems
A manufacturer communicates packaging designchanges with vendors as purchase orders are placed.Right versions of the label designs and artwork areautomatically linked to the purchase orders based onthe receipt date of the purchase order. Engineeringchange management processes drive the update ofcritical production master data, such as BOMs androutings.
Figure 7. Level of data capture automation, manufacturers
0%
20%
40%
60%
80%
100%
Finished product
Semi-finished product
Incoming packaging materials
Incoming raw materials
Fully automatedPartially automated
ManualNo true data capture
33%
52%
15%
26%
56%
15% 7%
56%
33%
67%
33%
4% 4%
18% fullautomation
Q. What is the level of automation of data capture and reporting for lot tracking of different materials on the manufacturing floor?N=27
Perc
ent
of c
ompa
nies
Issue Detection to Decision — Collaboration Is Key
During the identification phase, cross-functional crisis teams can play a critical role. They can lay out the investigationplan, collect information, provide liaison among multiple departments in the organization to collect the necessary dataand make escalation recommendations.
Currently 85 percent of the companies surveyed have dedicated recall teams.29 However, not every recall team is equallyeffective. The following may be considered by companies in their efforts to run more structured and effective investiga-tion processes:
• Involve the team from the moment the government notifies the company of a problem or an issue is detected throughthe investigation and decision-making processes.
• Structure the team so that it is cross-functional in nature (including supply chain, quality assurance, legal, etc.) to enableeffective communication across the organization, as well as escalation of high severity recalls. (See Exhibit 12, Appendix1 for information on cross-functional teams at surveyed manufacturers.)
• Clearly define the roles and responsibilities of the recall team before a recall to help ensure accountability and to helpmitigate the complexities of coordinating with a large team spanning different departments.
• Have the crisis team collaborate with vendors during high-profile recalls; today 74 percent of surveyed manufacturersinclude vendors in their recall processes.30
Some leading companies:
• Conduct thorough consumer complaint investigations internally or outsource certain areas of investigation, such as product identification and testing, to third parties. Both options meet the objective of rapid issue detection andinvestigation.
• Use outside experts to act as an independent checkpoint for decision making process.
16 Recall Execution Effectiveness:

Collaborative Approaches to Improving Consumer Safety and Confidence 17
NotificationIn a recent poll31, notification was rated as the second most important step (after identification) in increasing effective-ness of recall execution. A poorly executed notification can delay the timely removal and destruction of products, jeop-ardize public health and negatively affect the company’s market value and reputation.
According to our study, on average, manufacturers take one to five days to notify all constituents of a product recall fromthe moment an internal decision about a recall is made. Once retailers have been notified by manufacturers, the retailerscomplete the notification process, sending notification to their stores and receiving confirmation that the stores havebeen notified. The retailer notification process on average is accomplished within several hours or up to several days (seeFigure 8). When a value chain includes additional constituents between the manufacturer and the retailer, such as a dis-tributor or wholesaler, the information can be further delayed.32
According to this study, industry companies are working hard to improve notification procedures and policies. Some 54percent of manufacturers and 65 percent of retailers surveyed say they have made significant improvements in notifica-tion procedures and policies over three years ago.33 And, asked if the focus on improvement should be continued, 46percent of manufacturers and 43 percent of retailers surveyed say they expect significant change in the notification pro-cedures and policies over the next three years.34
This survey found that participating companies with more mature recall execution processes and shorter notificationcycles tend to engage in more notification activities, such as setting up a hotline for consumer questions or publishinginformation about a recall on the company website.35 This finding suggests companies may consider engaging in a com-prehensive set of activities to help ensure that all the constituents are properly informed across notification channels, asgraphically represented in Figure 9.
Figure 8. Notification time, days: manufacturers and retailers
Notification to Day 1 Day 2 Day 3 Day 4 Day 5
Ret
aile
r H
QM
anufa
cture
r
Regulatory agencies
Consumer
Customer
Stores (send notification)
Stores (receive
confirmation)

Manufacturer Notifies Regulatory Bodies — Collaborate to Protect Consumers
Our study found that most companies surveyed are quite effective in working with regulatory agencies — 72 percent of manufacturers surveyed notify the FDA and/or USDA of a recall in eight hours or less (Figure 10). Those companies that notify the FDA in more than eight hours may need to be aware of the FDAAA (Food and Drug AdministrationAmendment Act of 2007) regulatory requirement, which requires notification of any reportable situations (Class I recall)to the FDA within 24 hours.
In September 2009, the FDA significantly simplified the information submission process. Today, any manufacturer cansubmit the information to the FDA through the FDA Reportable Food Registry — an electronic portal that is intended tofoster swift communication between companies and the FDA.
18 Recall Execution Effectiveness:
Figure 9. Notification channels
Man
ufa
cture
r
Retailer/Wholesaler HQ
Regulatory bodies
Store 1
Store 2
Store 3
2
3
5
1
4
Co
nsu
mer
s
2 steps down
1 step down
1. Manufacturer notifies regulatory bodies2. Manufacturer notifies consumer 3. Manufacturer notifies customer HQ4. Customer HQ notifies stores5. Manufacturer notifies stores
Figure 10. Manufacturer notification timelines: FDA, USDA and state authorities
0%
20%
40%
60%
80%
100%
State / local authorities
USDAFDA
0-2 hours2-5 hours5-8 hours
8-48 hours>48 hours
4% 4%
29%
33%
10%
29%
9%
18%
36%
36%
17%
33%
8%
42%
Perc
ent
of c
ompa
nies
Q. From the point of recall decision within your company, how quickly are the following stakeholders notified?
N=21 N=12 N=11

The 2008 Farm Bill contains a provision that would requireFSIS-inspected establishments to notify FSIS if adulterated ormisbranded products have entered the marketplace. Todate, FSIS has not implemented regulations to carry out thisprovision. However, meat, poultry and egg product manu-facturing companies should still notify and work with FSIS toensure they are taking all the necessary measures to protectconsumers.36 Based on our study, 72 percent of meat, poul-try and egg product manufacturers notify FSIS within eighthours or less from the time the issue was detected.
Like FSIS and FDA, most state authorities do not havemandatory recall authorities. However, most states expectrecalling companies to have recall information readily avail-able and inform the state promptly once a recall decisionhas been made. Leading manufacturers already proactivelyinform state authorities. Based on our study, 39 percent ofmanufacturers responded to the question about notifyingstate authorities, and 58 percent of them said they do sowithin eight hours or less (Figure 10).
Appendix 5 contains links to useful FDA and FSIS resourcesthat can assist recall team members understand the FDA and FSIS requirements.
Manufacturer Notifies Consumer — A Reassured Consumer Can Be Your Best Ally
Some companies may not be adequately prepared to notify consumers during a recall. In this case, timelines tend toextend and the risk to consumer safety increases. Furthermore, shareholder value and public confidence can take a hit.For example, based on our analysis, in 2002, the absence of adequate communication with the consumer resulted in a 2percent stock price decline (index adjusted) for a large manufacturer of multiple products one day after a Class I recall ofone of its product. Five years later, the company had another Class I recall event, but experienced no negative impact onits stock price because the company effectively harnessed multiple communication channels to inform the public.
Collaborative Approaches to Improving Consumer Safety and Confidence 19
Information Submitted to FDA ThroughReportable Food Registry
• The registration numbers of the responsible partyunder section 41 5(a)(3) [21 USC § 350d(a)(3).
• The date on which an article of food was deter-mined to be a reportable food.
• A description of the article of food, including thequantity or amount.
• The extent and nature of the adulteration.• If the adulteration of the article of food may have
originated with the responsible party, the results ofthe investigation required under by FFDCA Sec. 417(d) (1)(B) or (7)(B), as applicable and when known.
• The disposition of the article of food, when known.• Product information typically found on packaging,
including product codes, use-by dates and namesof manufacturers, packers or distributors sufficientto identify the article of food.
Source: “GMA Product Recall Manual,” January 2010
Dimension Recall A Recall B
Total cost of recall $10 MM $28 MM
Press Release None immediately,
some notification to public later
Yes, very detailed, issued immediately
(included next steps for consumers, hotline
number, problem with product)
Use of other public notification channels No Yes
Tone of public notification (according to
press)
Emotionless and unfeeling Reassuring and constructive
Overall press coverage Negative Positive
Recall management Poor
(in a month recall is extended to more
volume)
Excellent
(identified all units involved immediately, shut
down plants)
Results 2% drop in stock price No impact on stock price
Figure 11. Comparision of two different communication approaches

When a recall decision is made, a company should be quick to deliver the appropriate message to the public, based on itspre-developed crisis communication strategy — a strategy that may include:
• Generic message to the public by recall class that can be customized to a specific recall.
• Level of information to be shared based on severity of recall / by recall class.
• Designated spokesperson.
• Priority communication vehicles (e.g., press release, hotline).
• Alternative ways of communication (e.g., retailer loyalty database) by recall class.
• Execution guidelines for communication vehicles.
• Role of legal department.
• Third-party and public relations agency involvement.
Important communication vehicles include press releases and consumer hotlines. In the event of a Class I recall, all com-panies included in our study published a press release. However, it takes 0.5 to one day37 to issue a press release, whichmeans companies may miss the next morning media cycle. Manufacturers can compress this timeline by tapping intotheir crisis communication strategy and leveraging pre-defined press release templates published on the FDA Web site.These templates, together with key guidelines in the crisis communication strategy, can also help minimize the coordina-tion time to get a press-release approved by the FDA.
The press release message matters. As a general rule, to minimize negative public reaction companies should be openwith consumers, keeping consumers informed on what is happening and the steps that the company is taking to correctthe situation. Additionally, companies may consider the guidelines presented in Figure 12 in their efforts to become moreeffective in communicating with consumers and in avoiding common pitfalls.
Source: The Food Institute, “Food Products Recall Manual,” 2009; Survey and interview participants.
Among our survey participants, 89 percent of manufacturers use hotlines to support consumers through the Class I recallprocess and to answer the consumers’ questions.39 However, many of these hotlines may lack sufficient capacity or well-trained agents. Consumers can become even more frustrated if an agent does not have comprehensive informationabout the recall or about next steps. Long wait times can also aggravate consumers. Leading companies have made a targeted effort to maximize the quality of the hotline experience and provide comprehensive advice to consumers in thecase of a recall.
20 Recall Execution Effectiveness:
Example: Proper Consumer Communication Reassures the Public
A company had two incidents of Class I recalls. For the first recall the company was caught off guard and did not ade-quately notify its consumers. The company saw an immediate share drop of 2 percent versus a sector index. For thesecond recall a few years later, the same company provided detailed reassuring communication using multiple channels.The share price did not change after the second recall. The details are provided in the table above: (Figure 11)
Do… Don’t…
• Create public trust by stressing what your company is doing to monitor, manage and reduce risk
• Respond to issues as rapidly as possible• Communicate compassion and concern for potentially affected
consumers• Provide detailed information through multiple channels such as
website, 800 number, etc.• Use third party experts and other credible sources to support the
message• Make sure your audience perceives that they have an opportunity to
make an informed choice• Provide the full UPC barcode number in communication to
consumers
• Expect scientific facts or statistics alone to reduce public anxiety• Forget to communicate to internal employees• Let inaccurate or misleading claims go unchallenged• Cover up the problem and fail to acknowledge it
Figure 12. Do’s and Don’ts to consider in communicating to consumers

As an additional communication channel, retailers’ loyaltycards are a useful way to notify consumers. Our study foundthat it takes retailers from two to 48 hours to notify 80 per-cent of their loyalty card consumers.39 The short timeframeand targeted nature of this vehicle makes it a valuable addi-tional source of communication. Currently less than 50 per-cent of retailers have loyalty card programs and issues of consumer privacy and accuracy of the contact information still limit this option.40
Examples of ways leading retailers have used their loyalty cardprograms:
• Inform consumers at the point of sale (e.g., indicate on theirreceipts that a product purchased in the past is beingrecalled and how the consumer can return it).
• Proactively reach out to consumers who have bought therecalled product by phone, mail or e-mail. For example, oneretailer made more than 1.5 million automated phone callsand mailed letters to consumers in the peanut butter recallcase.41 Retailers inform consumers about the affectedU.P.C./lot numbers and explain how to return/destroy the product.
Manufacturer Notifies Customer HQ — The Seemingly Simple Can Be Complex, Yet Critical
This study indicates that surveyed manufacturers at times can take from one to five days42 to notify direct customers.Some smaller retailers reported during our interviews that in some instances they do not receive notification from manu-facturers at all, especially since manufacturers have no visibility to many of these stores and depend on wholesalers anddistributors to notify smaller customers in their supply chain.
These delays in customer notification can occur due to multi-ple reasons, including:
• Lack of clarity on the exact information that needs to be provided.
• Inability to reach customers due to lack of contact informa-tion. Forty five percent of manufacturers participating in thestudy either do not store customer recall team contact lists,or they update the lists only once a year or less frequently.43
• Limited means to control execution. Although those manufacturers that have had a Class I recall in the past require thatthe account manager / sales team confirm that a customer has been notified, 23 percent of all manufacturers surveyedstill do not require their manager/teams to do so.44 Also, 23 percent do not require any confirmation from their cus-tomers that they have actually received and read the notification. Having a process in place that provides a confirma-tion could reduce the probability that information will reach a wrong person and/or go unnoticed.45
• Minimal 24/7 operations. Some manufacturers still do not have the ability to notify stores during after-hours (evenings,weekends, holidays).
Manufacturers may improve timeliness of their customer notification by, first and foremost, developing a checklist ofexactly what information is needed to execute the recall. A sample checklist is provided in Appendix 2.
Manufacturers also should ensure that they maintain accurate customer contact lists. Since information on these listschanges often, they should be updated frequently.
Manufacturers using brokers should coordinate who is responsible for retailer notification — an agreement that shouldbe arranged well in advance of any possible recall incident.
Collaborative Approaches to Improving Consumer Safety and Confidence 21
Leading Practice: Comprehensive HotlineApproach
One large company provides a hotline number toconsumers via press release. The hotline has the following capabilities:
• High call-handling capacity (that uses Cloud tech-nology) for the cases of elevated concern duringthe recall.
• Multi-language capability to cater to differentdemographics. Also customize message to differentmarkets or countries, if applicable.
• Trained agents who can effectively address variousconcerns and provide necessary information to con-sumers without jeopardizing company’s brand.Agents are able to address related issues. Hotlinehandles not only company-specific recall concerns,but also other related issues (e.g., Avian Flu).
The company is willing to absorb the high cost of thehotline to ensure that their consumers are fullyinformed and aware of next steps.
Leading Practice: Sales Force Accountability
A large company involves their sales force early in therecall process and holds them responsible for pushingout notifications to their respective customers. Thesales team has to join sales calls to discuss any issuestheir customers are experiencing. The recall crisisteam advises on how to handle each specific request.During the call the sales people share leading prac-tices or concerns.
Sales teams should be held accountable for communicationwith retailers; they should be involved early in the process.Daily conference calls with the sales force can be used to helpthem respond to their customers’ questions. Each accountteam should define recall working plans to ensure 24/7 coverage.
It is important for manufacturers to ensure that they receivefrom their customers a receipt of recall notification and a con-firmation of the execution of the recall.
Often retailers participating in the study claim that manufac-turers do not provide all the information they need to takeaction. One retailer commented during our interviews,“Providing me with a U.P.C. number and telling me that it wasshipped between May 1 and May 15 to one of our distribu-tion centers is not enough and is unacceptable.”
It is suggested that manufacturers provide specific informationon which U.P.C. / lot number is affected, exactly when it wasshipped, and to which distribution center. Some participatingretailers indicate that a picture of the product helps theirstores find a product faster. Currently, only 56 percent of thesurveyed manufacturers provide photographs of the recalledproduct to their customers.47 Moreover, some manufacturerssurveyed (22 percent) do not provide instructions on the prod-uct’s removal and/or destruction instructions to retailers.48
Some participating retailers say that instructions are providedto them too late, after the product has been removed andplaced in storage.
Rapid Recall Exchange
The Rapid Recall Exchange was created launched in September 2009 by industry leadership organizations FMI, GMA andGS1 US to ensure prompt, accurate and secure product recall and withdrawal notification for all sizes and types of retail-ers, wholesalers, distributors and manufacturers in the U.S. food and consumer products industry. It was designed toaddress the challenges suppliers, whether they be manufacturers, wholesalers or distributors, have in notifying their cus-tomers and the challenges retailers, wholesalers and distributors have in receiving effective notification. At press time,over 160 companies had subscribed, including 90 retailers that together process 85 percent of all supermarket purchasesin the United States today (measured in revenue). Suppliers using Rapid Recall Exchange with their customers know whatinformation is needed for effective recall execution, need not maintain contact lists for these customers and receive verifi-cation of receipt along with the ability to receive feedback from their customers on recall execution progress. Of thosesurveyed in this study, 40 percent of retailers and 30 percent of manufacturers were using Rapid Recall Exchange.46
The above recommended leading practices were incorporated into the design of the Rapid Recall Exchange. For example,manufacturers can insert UPC codes, pictures and other identifiers; the Rapid Recall Exchange provides manufacturerswith confirmation of notification; and, the system includes the capability for retailers to communicate the progress ofrecall execution back to the manufacturers.
Although still in its early stages, all interviewed retailers and manufacturers say that the Exchange will become a moreviable solution for the industry once reasonable levels of participation are achieved. Broad adoption of Rapid RecallExchange is expected to improve in the months and years ahead, although there will always be some industry companiesthat do not subscribe. For this reason, many of the processes involved in a product recall that would be eliminated forcompanies using Rapid Recall Exchange are detailed in this study in their entirety. (It is also interesting to note that theExchange can be used not only for recalls but also for removal of any product from the supply chain.)
Manufacturers can help ensure retailers are enabled to remove the products by sending them a customer letter with all
22 Recall Execution Effectiveness:
Rapid Recall Exchange
An industry portal that applies industry expertise andsuccessful practices to standardize product recall andwithdrawal notifications between retailers/whole-salers and manufacturers.
It provides the following benefits to the participants:
• Prompt, targeted and accurate informationexchange during a recall.
• Time savings on information aggregation• Consistent, reliable communications.
Features include:
• Up-to-date customer contact information.• Two-way messaging.• Email alerts about new information.• Comprehensive, prioritized information with U.P.C.
bar codes and product images for easy identifica-tion, as well as the ability to add other specificproduct codes.
• Confirmation of customer notification.• Universal notification of Class 1 recalls.• Standardized form, process and instructions apply
industry leading practices including productremoval and reimbursement instructions.
• Ability to conduct mock recall scenarios.
• Customer service support including 24/7 technicalassistance.

the information needed for retailers to execute the recall.Again, using Rapid Recall Exchange, retailers can documentany of their own specific recall data requirements and postthese guidelines with the Exchange for manufacturers toaccess. And while the Exchange gives standard information onthe product being recalled, including removal and destructioninstructions and reimbursement instructions, any specific,detailed special retailer requirements also are noted. However,for those companies not using the Exchange, these customerletters can be pre-developed before the recall and customizedto each distributor’s specific requirements. The letter couldinclude:
• Comprehensive information about a recall and productaffected. A sample checklist of information to be providedto retailers is presented in Appendix 2. While the details differ from recall to recall, this sample could serve as a guide to manufacturers.
• Removal and destruction instructions. Refer to Appendix 3 for sample destruction guidelines.
• Reimbursement instructions at the time of notification. These should specifically state how customers will be reimbursed (specific lots, U.P.C.), as well as the evidence and documentation the retailers need to provide.
• Sample “next in the chain” customer letter that can be passed to other constituents in the supply chain. This canhelp the customer take quick and easy action.
Customer HQ Notifies Stores — Quick Coordination Is Key to Jumpstarting Removal
Retailers surveyed often find out about a recall from a source other than the manufacturer, such as the media, privatenotification services, FDA/USDA Web sites, or other companies.
When participating retailers receive information from sources other than the manufacturer, they struggle to execute therest of the notification process. They know about a recall but have little information to provide to their stores. They mustcontact the manufacturer, and this may cause unwanted delays. Broad adoption of Rapid Recall Exchange is expected toimprove the notification process and enhance two-way communications during recall execution.
According to our study, after actionable recall information is received, the retailer can take up to 24 hours to send thenotification to the stores.50 Depending on the method used, it can take a long time for information to reach the individ-ual store itself. Some smaller retailers or distributors use “snail mail” or fax, wich adds to the lag in communication. Also,retailers generally need to contact all stores because they may not have the visibility to know which store has an affectedlot number. Independent stores buying products from wholesalers or non-industry channels also need to be notified.
Another potential cause for delays in store notification is the lack of a closed-loop process between retailer HQ and thestore level. Specifically, 23 percent of surveyed retailers do not require confirmation that their stores have received therecall notice.51 In interviews, many retailers said they do not have a designated person at store level responsible for recallexecution, that notification is sent to the general attention of the store. This may leave notifications unnoticed and delayactual product removal.
Leading retailers use the following approaches to facilitate timeliness of store notification:
• Build on-going relationships with the crisis teams of key, high-volume vendors; exchange crisis team contact informa-tion and share recall requirements during annual or semi-annual planning sessions.
• Identify a single point of contact to support recalls at stores.
• Provide recall execution training to a single point of contact.
• Use automated systems for transmission of information to stores.
Collaborative Approaches to Improving Consumer Safety and Confidence 23
Leading Practice: Customer Letter
A large manufacturer sends a five-page letter to eachcustomer. The letter is tailored to customer needsbased on recall specifics and customer informationrequirements. In general the letter contains informa-tion on potential impact to consumer, key character-istics of the recalled product (e.g., U.P.C., lot, date,distribution center where the product was shipped),and reason for recall. The letter also provides detailedinstructions on how to handle the recalled product(e.g., where to ship) and reimbursement instructions.It also provides a 24/7 contact information for thecustomer recall team to use in the case of questions.

24 Recall Execution Effectiveness:
• Run 24/7 recall operations or have plans on how to handle arecall during the weekend. Identify a back up recall managerto ensure coverage at all times.
• Notify stores independently of whether the stores have theaffected product.
• Require stores to send a confirmation of receipt:– Require confirmation in any format, at a minimum. In thiscase, reconciliation of information takes a long time and sig-nificantly delays action to be taken.– Send out surveys to stores requiring the stores to provideconfirmation of receipt as well as status of removal. In thiscase, reconciliation is a much simpler process but stillrequires HQ labor. – Have an automated system requiring store managers toinput some type of personal identification as verification ofreceipt. This automated system aggregates all the data intodashboards and communicates in compliance metrics bystore to customer HQ.
Manufacturer Notifies Stores — Smaller Stores: Stronger Support
Typically manufacturers pass the notification information to their customers and rely on them to pass it down the valuechain. Our study confirmed that manufacturers surveyed do not have full visibility to the store level. Only 39 percent ofsuppliers have some type of store-level information, which may or may not be complete and, therefore, usable for recallnotification.52
This “pass one step down” approach can work with larger retailers and distributors with good communication with theirstores. However, smaller stores, such as convenience and independent stores, are usually the last ones to get the infor-mation, because there are simply too many touch points between them and the manufacturer. As a result, the productcan be left on the shelf longer than in other channels. Although these smaller stores typically account for only 6 percentof a manufacturer’s business,53 leaving even a small amount of recalled products on the shelf can be extremely risky forconsumers and for the company’s reputation.
Manufacturers may consider leveraging existing distributionchannels to streamline the communication to smaller storesby:
• Providing incentives to trading partners for timely notifica-tion of their stores in the form of additional trade promotiondiscounts or other incentives.
• Enabling distributors to communicate with their stores byproviding them with timely and comprehensive information,such as a letter to forward on to their customers.
• Considering the adoption of incentive mechanisms, such asthose used in the health care and life sciences industry,where manufacturers provide incentives to retailers to bemore rigorous with notification, data tracking and reportingback to manufacturers.
Suppliers using direct store delivery (DSD) to c-stores could usetheir sales force teams to distribute information.
Some leading manufacturers attempt to help facilitate the notification process by employing third parties to notify stores,using their own or outsourced telemarketing teams, or having their sales force run effectiveness checks. Here again, theRapid Recall Exchange can be a solution. If small operators subscribe to this service, they will receive direct notification ofrecalls at the same time large retailers are notified.
Leading Practice: Automated Notification That Helps Ensure Accountability
One of the leading retailers in the recall executionspace implemented a unique system that:
• Helps ensure timely delivery. Allows HQ to put outa broadcast report (notification) to all distributioncenters (DCs), which in turn sends it to all the storesthrough the system. The system is fully automated,and there are pre-determined distribution lists forthese notifications.
• Helps ensure accountability. As a follow-up tech-nique, the automated system can then detectwhich stores are missing removal confirmation /responses. If a store has not responded, a messagegoes out to the store manager’s superior. In orderto help ensure verification of action and promoteaccountability, DC and store managers mustrespond with their name and Social Security num-bers keyed into the system.
Leading Practice: Prompt Notification to Smaller Stores
Leading manufacturers provide immediate notifica-tion to stores by using internal and external telemar-keting teams. The telemarketing teams have contactlists of retailers and stores that usually carry the com-pany’s product. (This list can be obtained throughservices such as TDLinx.) Then they use these lists tonotify small stores of a recall. If store managers/con-tacts are not available, the telemarketing teams fol-low up before reporting unresponsiveness back tothe recall team.
In some cases, telemarketing teams update contactinformation on their lists on a continuing basis.Telemarketing teams can also follow up with therecall teams in case of customer questions.
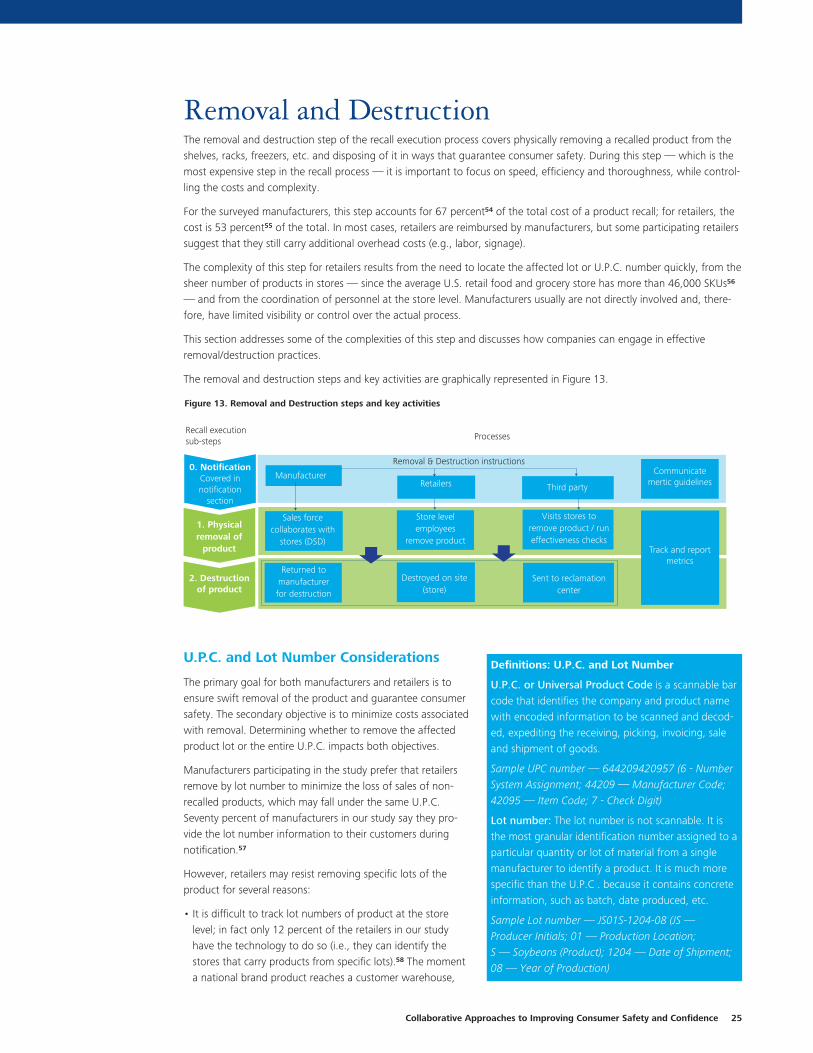
Removal and DestructionThe removal and destruction step of the recall execution process covers physically removing a recalled product from theshelves, racks, freezers, etc. and disposing of it in ways that guarantee consumer safety. During this step — which is themost expensive step in the recall process — it is important to focus on speed, efficiency and thoroughness, while control-ling the costs and complexity.
For the surveyed manufacturers, this step accounts for 67 percent54 of the total cost of a product recall; for retailers, thecost is 53 percent55 of the total. In most cases, retailers are reimbursed by manufacturers, but some participating retailerssuggest that they still carry additional overhead costs (e.g., labor, signage).
The complexity of this step for retailers results from the need to locate the affected lot or U.P.C. number quickly, from thesheer number of products in stores — since the average U.S. retail food and grocery store has more than 46,000 SKUs56
— and from the coordination of personnel at the store level. Manufacturers usually are not directly involved and, there-fore, have limited visibility or control over the actual process.
This section addresses some of the complexities of this step and discusses how companies can engage in effectiveremoval/destruction practices.
The removal and destruction steps and key activities are graphically represented in Figure 13.
U.P.C. and Lot Number Considerations
The primary goal for both manufacturers and retailers is toensure swift removal of the product and guarantee consumersafety. The secondary objective is to minimize costs associatedwith removal. Determining whether to remove the affectedproduct lot or the entire U.P.C. impacts both objectives.
Manufacturers participating in the study prefer that retailersremove by lot number to minimize the loss of sales of non-recalled products, which may fall under the same U.P.C.Seventy percent of manufacturers in our study say they pro-vide the lot number information to their customers duringnotification.57
However, retailers may resist removing specific lots of theproduct for several reasons:
• It is difficult to track lot numbers of product at the storelevel; in fact only 12 percent of the retailers in our studyhave the technology to do so (i.e., they can identify thestores that carry products from specific lots).58 The momenta national brand product reaches a customer warehouse,
Collaborative Approaches to Improving Consumer Safety and Confidence 25
Figure 13. Removal and Destruction steps and key activities
0. NotificationCovered in notification
section
1. Physical removal of
product
2. Destruction of product
Manufacturer
Sales force collaborates with
stores (DSD)
Returned to manufacturer for destruction
Destroyed on site (store)
Store level employees
remove product
Visits stores to remove product / run effectiveness checks
Sent to reclamation center
Retailers Third party
Recall execution sub-steps Processes
Communicate mertic guidelines
Track and report metrics
Removal & Destruction instructions
Definitions: U.P.C. and Lot Number
U.P.C. or Universal Product Code is a scannable barcode that identifies the company and product namewith encoded information to be scanned and decod-ed, expediting the receiving, picking, invoicing, saleand shipment of goods.
Sample UPC number — 644209420957 (6 - NumberSystem Assignment; 44209 — Manufacturer Code;42095 — Item Code; 7 - Check Digit)
Lot number: The lot number is not scannable. It isthe most granular identification number assigned to aparticular quantity or lot of material from a singlemanufacturer to identify a product. It is much morespecific than the U.P.C . because it contains concreteinformation, such as batch, date produced, etc.
Sample Lot number — JS01S-1204-08 (JS —Producer Initials; 01 — Production Location; S — Soybeans (Product); 1204 — Date of Shipment;08 — Year of Production)

26 Recall Execution Effectiveness:
manufacturer lot information is often lost and not cross-referenced with the retailer’s/wholesaler’s internal codes. Incontrast, 85 percent of the surveyed retailers have the technology to track U.P.C. numbers of products at store level.59
• The lack of the technology to automatically scan the lot number on the product makes it difficult for retailers. Typically,to locate an affected lot number on the shelf, store employees must manually check every item, which can bothincrease the odds of making an error and reduce the speed of product removal. The surveyed retailers report that ittakes up to eight hours to find 71 percent of products with a specified lot number. However, within 2 to 8 hours, they are able to locate all products with the specified U.P.C. (Figure 14).
• Retailers find that leaving product on the shelf that is identical in appearance to the recalled product, but from a differ-ent lot, confuses consumers who often think that the store is continuing to sell recalled product. Even if it is a differentlot, consumers will avoid purchasing this product.
• Too often a recall is expanded to include different lots. For retailers, this increases work load and chance of error sincethe same product must be checked again for lot number identification.
• Consumers do not always pay attention to lot number details and will return product and expect a refund or replace-ment.
• State inspectors do not always have all of the lot number details and will cite retailers for failing to execute the recall.The burden to prove the lot numbers is placed on the retailers who often choose to simply remove the product thangive the appearance of disagreeing with the regulators.
Despite these facts, some participating retailers still remove products manually by lot. It is no surprise that many retailersopt for removing products by U.P.C. And because most manufacturers are also interested in removing the contaminatedproduct from the shelves as fast as possible, they — under specific circumstances — agree to make exceptions to theirrecall guidelines and reimburse retailers for the entire U.P.C. However, many participating manufacturers contend thatthey lose non-affected products.
According to our study, smaller retailers and convenience stores prefer to remove product by lot number because theyhave smaller inventory to sort through and also want to minimize lost sales.
There is no standard practice on whether a company should use U.P.C. or lot number. The primary objective is to removethe product quickly; minimizing costs is secondary. However, certain methods are used by leading companies today thatallow for timely removal by lot number even in the absence of advanced technology:
Figure 14. Time taken to locate lot number and UPC, retailers
Lot UPC
40%
60%
80%
100%
8+ hours2-8 hours 0-2 hours
91%
58%
71%
78%
100% 100%
Perc
ent
of c
ompa
nies
Hours
Q. On average, how long does it take your company to locate the lot # and UPC that needs to be recalled?N=24

• Using dolphin scanners allows for a partially automated wayto identify lot number and reduce errors. (See leading prac-tice sidebar.)
• Hiring third-party recall facilitators to remove recalled prod-ucts.
Also, manufacturers can motivate retailers to remove by lot bynegotiating trade promotions.
In the DSD channel, manufacturers can consider coordinatingthe removal process with retailers to avoid mistakes, misun-derstandings or duplicate effort. During our interviews, someretailers indicated that the DSD removal process could be bet-ter coordinated; sometimes the manufacturer sales forcewould remove the product from the retailer’s shelf withoutprior agreement. In fact, 23 percent of the surveyed retailerssaid that collaboration with manufacturer’s direct-store-delivery personnel required improvement.60
There are also a number of potential long-term technologysolutions that can be adopted by retailers and manufacturersto mitigate challenges associated with lot removal:
• 2D bar-code systems — Allow for storage of more informa-tion (across the width and height of the bar code) than the1 D barcode systems. Therefore, companies using 2D bar-code systems can store additional information, such as lotnumbers, expiration dates, etc. Although a 2D scanning sys-tem is known to be more expensive than a U.P.C. scanningsystem, industry research indicates that the price of 2D bar-code scanners has dropped dramatically, costing only 25percent more than linear barcode scanners.61
• Electronic Product Code (EPC) — Initially developed by MIT Auto-ID Center and currently managed by EPCglobal, Inc., a subsidiary of GS1, the EPC is the next standard for tracking products through the supply chain. Each manufacturercan use it to store a variety of information that the current bar code is not able to carry, thus enabling effective trackingof the product through the supply chain.62 While cost is a major hurdle for this radio frequency code, several largecompanies are making a significant push for the adoption of this technology. As it becomes more widespread andmore research is conducted, the costs of EPC technology is expected to fall.
Extensive Training, Education Help Forge Ahead
Given the number of products at stores and the difficulties inlocating affected products, store employees can find it chal-lenging to remove recalled products efficiently. Some retailersstated that high employee turnover and language barriers fur-ther exacerbate the situation. As a result, removal instructionsand processes may not be followed with 100 percent accura-cy at all times. This is often more significant in smaller stores,convenience and independent stores. It is not surprising that43 percent of manufacturers in our study say that they need additional support in dealing with indirect customers.63
Collaborative Approaches to Improving Consumer Safety and Confidence 27
Leading Practice: Use of Dolphin Scanners toFacilitate Lot Identification
A leading retailer implemented a system where allrecall instructions and information (U. P.C. / lot / reason for recall / date of manufacturing, etc.) areloaded in a database. Each employee working onproduct removal is then given a handheld Dolphinscanner that is connected to this database. Theemployee uses the device to scan the U.P.C. of theproduct that needs to be removed. All instructions/information that are associated with the particular lotnumber that needs to be removed are pulled fromthe database and presented on the handheld device.
Learning From the Pharmaceutical Industry:Technology to Facilitate Removal by Lot
In the pharmaceutical industry, bar code readers suchas the Ariel Expiration Date and Lot Number TrackingSystem are able to scan the lot number and expira-tion dates. This system is highly automated and laborefficient. It uses lightweight portable bar-code read-ers to capture lot and expiration dates as they arestocked or removed. One can also view lot numberson any item that has been received into the systemand see whether it is in circulation at the facility.
Source: http://www.onariel. com/Expiration_%20Date-Lot_Number_ Tracking.htm
Leading Practice: Training Store Employees
A leading retailer saw a lack of training and educa-tion at the store-employee level. To fill this gap, themanufacturer created an easy-to-understand trainingmanual that includes the required removal steps, thedo’s and don’ts, and the potential removal errors toavoid. The training manual is easily available for allstore personnel.

28 Recall Execution Effectiveness:
To mitigate these issues, some retailers and distributors in thisstudy:
• Provide standard operating procedures training to the liableperson at the store and issue a certificate of course comple-tion. Leading retailers and distributors in our study say theyprovide the training materials in multiple languages.
• Ensure product return policies include specific direction toconsumers for recalled products and integrate the recalledproduct return process into the retailers recall standardoperating procedure
• Dedicate resources at the store level to remove the products from the shelves for all recalls.
• Include product removal accuracy as a performance metric for store personnel.
• Use internal systems and technology to track completion of removal.
• Organize events to educate stores on FPS (food and product safety) procedures and specifically on recalls.
• Hire third parties to give extensive training to key staff on product removal of the right product SKU. Then the trainedstaff can cost-effectively train the other employees in the store
To address the small store challenges, manufacturers could provide informational / educational materials on the impor-tance of product removal, preferably in multiple languages. These materials could be distributed to smaller stores via dis-tributors / wholesalers, directly during effectiveness checks, or via targeted campaigns.
Metrics — The Need for Transparency
Measuring the amount of removed and destroyed product is extremely important for both retailers and manufacturers, as their ultimate and shared goal is to protect consumers. Retailers also use these metrics to develop claims for reimburse-ment. Manufacturers want to see the metrics to identify and address gaps in the removal process and to meet regulatoryrequirements and FDA and FSIS follow-up confirming that the products have been removed from the marketplace.
Manufacturers today have limited visibility into the status of product removal/destruction at stores. According to the sur-veyed retailers, it takes anywhere between one and 36 hours to remove 80 percent of a recalled product from the shelf.
Leading Practice: Ensure Removal Accountability
To introduce accountability at the store level, a re -tailer sends a survey to each store manager to keeptrack of the product removal process. Specifically,store managers are required to indicate the amountof product removed at their store. If this informationis not received, or if the information indicates delaysin the removal process, immediate action is taken.
Figure 15. Information tracked in product destruction, manufacturers and retailers
37%
96%
89%
81%
70%
81%
73%
58%
54%
46%
38%
38%
Time and duration of destruction
Amount of product destroyed
Lot #
Name and contact details of destruction
contact
Destruction facility
Total destruction costs
Retailer, %, N=26 Manufacturer, %, N=27
Q. What information do you track on product destruction?

Collaborative Approaches to Improving Consumer Safety and Confidence 29
Yet, surveyed manufacturers report that it takes between twoand 150 days.64 This discrepancy could result from the factthat manufacturers do not have direct visibility into theremoval process and rely on retailers to provide this informa-tion to them. Also, manufacturers that report longer removaltimeframes sometimes have to wait until the retailer sends thereimbursement claim to obtain the number of the productsremoved / destroyed. To avoid long wait times, some surveyedmanufacturers use their sales force, broker network or third-party service providers to run checks and collect the informa-tion.
Manufacturers and retailers rarely align on metrics that theycollect. Figure 15 demonstrates the types of metrics thatretailers and manufacturers track on product destruction. Inthis study, only 58 percent of retailers track the amount ofproduct destroyed compared to 96 percent of manufacturers.In fact, the survey indicates that retailers often do not pay asmuch attention to the destruction metrics as do manufactur-ers; retailers often destroy product at stores and do not recordor keep track of what has been destroyed. In contrast, partici-pating manufacturers carefully track metrics for the productsdestroyed at their own facilities or at outsourced reclamationcenters.
Some leading manufacturers participating in the study areable to improve their visibility to the removal and destructionstep of the recall process by:
• Discussing and determining the removal and destructionmetrics that need to be tracked in the annual planning dis-cussions with key retailers.
• Working closely with their retailers throughout the removaland destruction process, especially communicating statusand actions taken for DSD products.
• Using sales force / broker networks / third-party providers torun effectiveness checks and tracks metrics at stores
When deciding whether to employ third-party providers, asales force or both, companies may consider the advantagesand disadvantages of each method, as represented in Figure16:
Leading Practice: Sales Force Plays a Key Rolein Removal at Smaller Independent and C-Stores
Recognizing the importance of the smaller retailers inthe removal of product recalls, a manufacturer takesa proactive approach. Following the communicationof removal instructions, the manufacturer sends thesales force out to take a random sample of smallerformat stores to provide follow up on the requiredprocedures and steps.
The company then conducts a weekly conference callwith the entire sales force to address issues faced bytheir respective stores and answer any questionsposed by smaller retailers.
Leading Practice: Following Up with Smaller Stores
Leading manufacturers follow up on removal anddestruction with smaller format retailers by eithersubscribing to a database similar to the AC NielsenTD Linx or outsourcing this service to a third party.TDLinx database has a list of all registered stores inthe United States based on distribution pattern data,enablling manufacturers to identify stores that couldhave the affected product.
Leading Practice: Tracking Metrics ThroughSales Force or Third-Party Providers
One manufacturer tracks the progress of removal anddestruction through its sales force. Specifically, eachsales team includes a member from the logistics divi-sion who tracks metrics associated with the removalprocess such as time taken or amount of productremoved.
To follow-up, the sales team or a third-party providerthen conducts effectiveness checks, ensures accuracyof metrics and closes any gaps.
Sales Force Third-party recall facilitators
Pros • No extra costs
• Strong understanding of product
• Existing relationship with store employees
• Extensive experience with recalls
• Systems and tools to automate data capture and reporting
• Extensive capacity: large network of resources located all
over the country
Cons • Lack of automated tools to track and report status and metrics
• Limited capacity
• Potential misalignment of incentives (incentivized to sell, not to
remove products)
• Difficulty in reconciling data at the HQ level
• Cost – particularly for smaller companies
• Resistance from certain retailers
• Limited control over process when outsourced
Figure 16. Pros and cons of using sales force vs. third-party recall facilitators to track metrics

30 Recall Execution Effectiveness:
ReplacementThe objective of the replacement step is to put a substitute product safe for consumption on the shelf as quickly as possi-ble and resume business as usual. (The replacement process is graphically represented in Figure 17 — see note below).Delays in replacement can result in lost sales for the manufacturer and the retailer — 12 percent and 27 percent respec-tively, according to our study.65
For retailers surveyed, the replacement process takes anywhere from one to 30 days depending on whether they haveunaffected product available at their stores or distribution centers.66
To minimize lost sales, 42 percent of the retailers participating in our study fill shelf space with alternative products in thecategory.67 This practice can be detrimental to manufacturers, who could lose share to competitor products. To help miti-gate this, manufacturers may consider building replacement options into their response plans.
This section addresses some of the complexities of the replacement step in the product recall process, and describes howtrading partners can collaborate to improve its timeliness.
Prompt Coordination Puts Products Back on the Shelves
After a recalled product has been removed from the shelf, retailers place an order for a replacement product — ideallyautomatically — through regular replenishment steps. Depending on their supply chain flexibility and inventory strategies,manufacturers may or may not be able to fulfill these orders in a timely fashion. Currently 69 percent of manufacturersparticipating in this study build an emergency production plan and develop a timeline of when the product will bereturned to the shelf.68
Manufacturers can help improve the timeliness of product replacement by working with supply chain partners to developcontingency plans. It is also important to ensure that all customers have received the substitute product and to trackwhether all customers have submitted a replacement order. Currently, 62 percent of surveyed manufacturers can monitorcustomer warehouse levels and the percentage of recalled products that have been removed.69
In an effort to be better prepared, leading manufacturers have implemented flexible supply chain initiatives, such as:
• Qualify a set of plan B supply or execution vendors to usewhen/if current production is not possible; this could includealternate raw-material suppliers, backup manufacturingcapacity, alternate distribution channels.
• Conduct scenario planning with these vendors to determinereplacement activities in the event of a recall.
• Manage capacity levels across their entire production net-work to enable a quick response to unforeseen demand.
Figure 17. Replacement process
Man
ufa
cture
rs
Ret
aile
rs
On-g
oin
g c
ollo
bo
rati
on
1. Retailers place order
3. Retailers replace products
2. Manufacturers fulfill order
Stores
Stores
Stores
Leading Practice: Leveraging Alternative Suppliers
When a large beverage manufacturer experienced anissue with one of its raw material ingredients, it col-laborated with its vendors to obtain replacement rawmaterial within days and ran extra shifts in the plantto replace the product for its customers right away.
• Leverage strategic relationships with transportation companies to track and expedite delivery.
• Develop and implement scientifically based safety stock policies for raw materials and finished goods — particularly if associated vendors are categorized as risky.
Effective Replacement: Tighter Collaboration
To avoid delays, miscommunication or duplication, the two stakeholders in the replacement process — the manufacturerand the retailer — need to collaborate.
As mentioned, 69 percent of the manufacturers participating in the study develop a timeline of when the product will bereturned to the shelf. In many cases, however, they do not communicate this timeline to the retailers; 85 percent of thesurveyed retailers say they ask manufacturers for the replacement timelines.70 Manufacturers may need to be more proac-tive in communicating this information. Only 42 percent of retailers participating in this study build a timeline for storemanagers of when the recalled product will be available and when it needs to be put back on shelves.71 When theyreceive a timeline from manufacturers, retailers may consider developing their own internal timeline to facilitate commu-nication and ensure accountability.
In some cases, retailers receive the replacement shipmentbefore recalled products have been destroyed or completelyremoved from the store or warehouse. When this happens,the recalled product could be mixed with the replacementproduct. Leading manufacturers in our study proactivelyaddress this problem by marking new batches with a differentlabel.
Retailers need confirmation from the manufacturer that the problem with the recalled product has been resolved and thereplacement product can be used safely. In our study, 54 percent of manufacturers surveyed forward to retailers an FDAletter confirming that the product recall case has been closed.72 Manufacturers and retailers could communicate the sta-tus of the replacement process more effectively. According to the retailers surveyed, it takes on average 12 days toreplace 80 percent of the product, whereas manufacturers surveyed report that it takes on average 45 days.73 This dis-crepancy arises because manufacturers are typically informed of the replacement status only well after the fact.
Leading companies surveyed work closely with their business partners to conduct joint replacement planning sessionseither during the semi-annual planning cycles or during an off-cycle meeting. These planning sessions are used to definethe following:
• A timeline in which the manufacturer can deliver a replace-ment product back to stores, although this often varies on acase-by-case basis..
• Interim shelf space plans for retailers and plan B planogram(e.g., the manufacturer’s products that can be substituted ifproduct A has been removed).
• Frequency of communication of metrics and status ofreplacement.
Leading companies use either internal resources or third-partyservices to track metrics related to the number of products replaced. Among companies participating in this study, only 27 percent74 of manufacturers and 8 percent75 of retailers surveyed use a third-party vendor for replacement-metrics tracking.
Collaborative Approaches to Improving Consumer Safety and Confidence 31
Leading Practice: Differentiated Packaging
After a food recall, a large manufacturer added a“new batch” sticker on all its replacement shipment,thereby helping ensure that retailers could alwaysimmediately tell if the product was part of thereplacement batch.
Leading Practice: “Reverse Recall”
According to a leading retailer, once it receives awritten verification that the product is safe, the recallteam issues an electronic “reverse recall” that notifiesall parties involved in the initial recall that the newproduct may now move through the pipeline. Holdsare discontinued, store personnel remove red tagsfrom shelves, and stop-sale is removed from point-of-sale registers.
32 Recall Execution Effectiveness:
Feedback LoopThe feedback loop is the practice of incorporating lessons learned into the recall processes and procedures. With thenumber of recalls increasing every year, companies want to improve their recall practices and reduce food safety riskscontinuously. They can do so by learning from their own and their trading partners’ recall experiences, by running simula-tion exercises or mock recalls, and by participating in various industry initiatives.
Our study found that companies that identify and apply lessons learned after a recall tend to be more sophisticated
in overall recall execution. Many manufacturers and retailers (71 percent and 48 percent, respectively) engage in somefeedback loop activities.76
This section describes the existing and leading practices companies use to capture lessons learned and improving theirrecall processes. Improvement opportunities occur in three categories:
— Prepare: Conduct mock recalls to identify gaps in the recall process
— Follow up: Identify lessons learned from previous recalls
— Share: Transfer knowledge within the organization and with other companies
Prepare — Replicate a Real-Life Scenario
Mock recalls are exercises conducted by companies to assesstheir recall procedures and responsiveness. For manufacturers,mock recalls are critical since most have limited actual recallexperience. Retailers, on the other hand, participate in hun-dreds of recalls per year and do not believe they have to runmock recalls to evaluate their preparedness.
Many manufacturers in our study — 68 percent — performmock recalls.77 However, these exercises may or may notinclude comprehensive simulations that test all company poli-cies. In some cases, production facilities might run less exten-sive exercises, including an inventory tracking exercise to testhow accurately product locations, code numbers and quanti-ties can be pinpointed in the event of a recall. These exercises,while valuable, are not true mock recalls since they are notcomprehensive.78
Also, many companies surveyed reported that they do notinclude all relevant parties in their mock recalls. (Figure 18):
• Only 37 percent of companies surveyed use their dedicatedrecall team during mock recalls.
• Many include supply chain and quality assurance employeesbut do not include legal, sales and public relations. Legalcould help test the procedures and processes associatedwith accurately conducting the identification and replace-ment steps, while sales and public relations are needed dur-ing the notification and removal / destruction.
• Most manufacturers surveyed do not include external constituents in their mock recall procedures. True, it can be chal-lenging to include customers, especially since they might conduct hundreds of actual recalls per year and, therefore, be reluctant to take the time to participate in simulated ones with multiple supliers. However, including external con-stituents can greatly improve lessons learned. For example, companies can place a call to recalls teams of select retailersto establish relationships or update customer recall team contact lists without asking them to execute a full mock recallscenario.
• A limited number — 18 percent of manufacturers surveyed — include third-party facilitation companies in their mock
Leading Practice: Enhancing Recall Plans
Manufacturers continuously improve their recall plansby leveraging expertise of internal resources or third-party providers. Experts work with recall teams toreview recall plans as well as conducting mock recalls.Regardless of the source of expertise, the primaryobjective is to identify gaps in recall plans by eitherconducting crisis simulations or sharing successfulpractices based on past experiences. This assistancefrom internal experts or third parties can be usefulparticularly for those companies that have limitedexperience with recalls.
Leading Practice: Mock Recalls
A manufacturer conducts two kinds of mock recallexercises every year. 1) Imagining a problem with aparticular product in a specific plant; the productionsteps are traced, as is every place the product wassent, to determine how long it would take to notifycustomers. 2) Conducting hypothetical case studieswith different groups to show them how the processworks, as well as review their responsibilities in theevent of a recall.

recalls. Third parties are usually good sources of credible information and can advise on improvement opportunitieswhen internal resources and recall experiences are limited.
• Only 7 percent of the surveyed manufacturers include suppliers in their mock recalls.
Of course, in a perfect case scenario, to be effective a mock recall should include all the constituents — internal andexternal. However, that could be a costly undertaking, not just in dollars-and-cents but in the deflection of resourcesfrom other initiatives. Also, given the number of recalls executed at retail, there is a reasonable probability that a realrecall could occur during the mock recall causing confusion and unnecessary disruption for the retailer. For these reasons,the number and intensity of mock recalls depend on each manufacturer’s self-assessment of its preparedness. (That said,mock recalls should be a top priority for a company’s leadership and should, therefore, be a line item on the operatingbudget.)
Study participants (manufacturers only) shared their goals for mock recalls (Figure 19). Not surprisingly, for most compa-nies surveyed (89 percent) the number one objective is to identify gaps in internal processes. A close second (74 percentof respondents) is to test visibility to the product location, one step forward and one step backward.
Leading companies in our study recognize that including external constituents can help them run recalls faster and moreefficiently in the future. Some 37 percent of manufacturers surveyed try to identify gaps in specific suppliers’ proceduresand to test third parties’ effectiveness in managing recall execution; 15 percent test direct customer preparedness.
To improve their preparedness, manufacturers may consider fully reflecting these objectives in their mock recall plans andcase studies and, at the end of the exercise, measuring results and assessing performance against these objectives.
Collaborative Approaches to Improving Consumer Safety and Confidence 33
Figure 18. Internal and external constituents included during mock recalls, manufacturers
0%
20%
40%
60%
80%
100%
Third-party facilitation companies
SuppliersCustomersPublic relations
Customer service
Quality assurance
Supply chain
SalesLegalDedicated recall team
Recalls Mock recalls
52%
18%
85%
37%
93%
19%
89%
18%
81%
15%
85%
43%
89%
71%
89%
82%78%
0%
74%
7%
Internal consitituents External consitituents
Perc
ent
of c
ompa
nies
Q. Which constituents do you include in recalls and mock recalls?N=27

Follow Up — Go the Extra Mile
Post-recall follow up is a golden opportunity for companies to capture lessons learned and incorporate them into theirrecall processes. More than 65 percent of the surveyed manufacturers perform analysis to capture internal lessonslearned, assess negative impact on their businesses and update internal procedures. However, fewer than half go a stepfurther and evaluate the performance of various customers or hold meetings with their direct customers to discuss eachother’s performance.79
Retailers surveyed do not engage in follow-up procedures asoften as manufacturers do because of the sheer number ofrecalls they manage. However, 58 percent of retailers partici-pating in this study update internal procedures after a recall,and 48 percent capture and document lessons learned. Veryfew retailers (19 percent) hold follow-up meetings with theirsuppliers. Additionally, 19 percent update training documents,which limits the opportunity to improve product removal anddestruction at the store level.80
As these statistics suggests, there is room for improvement incollaboration between manufacturers and retailers in identify-ing lessons learned and uncovering key gaps in recall process-es. Leading companies seek to improve their own and their trading partners’ performances by soliciting feedback fromthem. For example, some leading manufacturers surveyed conduct post-recall follow-up sessions with the suppliers oftheir raw materials to ensure that any issues have been addressed and that preventive measures are in place.
Some companies choose to follow up with their constituents to assure them that the recall has been executed and theissue has been closed. Although most manufacturers and retailers provide evidence of recall completion to regulatoryagencies, leading companies participating in the study choose to notify the investor community and consumers as well,especially after severe recalls that result in high consumer awareness.
34 Recall Execution Effectiveness:
Figure 19. Mock recall objectives, manufacturers
0% 20% 40% 60% 80% 100%
Find gaps in processes and procedure between internal functionsIdentify gaps in overall supply chain (1 step forward, 1 step backward)Identify gaps in specific suppliersTest third party effectiveness in managing recall executionTest direct customers preparedness in the instance of a recall
89%
74%
37%
37%
15%
Q. What are the objectives of the mock recall exercises you conduct within your organization?N=27
Percent of companies
Leading Practice: Identify Lessons Learned
After a recall, one manufacturer conducts meetingswith the different internal constituents as well as bi-monthly conference calls with the sales people out in the field at the time and close to the action. Thisgives them a unique perspective on practices that didor did not work. All lessons learned are then docu-mented and circulated within the entire organization,and status of implementation is reviewed at eachpost-recall meeting.

Share — Why Reinvent the Wheel?
Knowledge sharing allows for cross-pollination of effectivepractices across companies as well as from other industries,which is especially important since industry-level data is limit-ed. Many companies surveyed would like to get more involvedin initiatives that promote the exchange of leading practices.
When interviewed, a QA plant manager for a consumer prod-ucts company said, “It would be beneficial to get best prac-tices from leading organizations. Companies tend to keepthose things close to the vest, but we shouldn’t because thereare no trade secrets here.”
Leading companies participating in the study enable knowl-edge sharing by developing successful practices and casestudies, organizing and participating in industry conferencesand partnering with universities and other professional associ-ations on training programs. Then they share their findingswith their supply chain partners to ensure safer practicesthroughout the value chain.
Leading companies surveyed engage in the following activitiesto enhance knowledge collection and sharing:
• Appoint a specific individual within the company to overseeresearch and knowledge sharing within industry. The indi-vidual should be responsible for conducting research, partic-ipating in industry initiatives, and identifying innovative prac-tices. The company also might host knowledge exchangeevents.
• Gather successful practices from other industries, such ashealthcare and life sciences.
• Get involved with industry committees, trade organizations,research and educational institutions that are focused onpromoting food safety.
Collaborative Approaches to Improving Consumer Safety and Confidence 35
Leading Practice: Using Signage toCommunicate Recall Completion
A leading retailer collaborated with a manufacturer to develop post-recall messaging on shelves. Morespecifically, both trading partners identified shelf sig-nage as an effective mechanism to inform end-con-sumers that the recall was now over and that prod-ucts were safe to consume. The signs containedmessaging around date of recall completion and hotline information to contact in case of questions.These signs were then placed by products on theshelves as well as in a notice area at the front of the store
Leading Practice: Proactive Stance onKnowledge Sharing
A large foodservice provider organizes annual con -ferences; attendance by direct partners (suppliers andcustomers) is required. This conference consists ofworkshops, simulations and discussion on industry-wide challenges and innovative practices, as well as one day of training on the food organization’s specific recall procedures.
Leading Practice: Establishing a Role Tied toKnowledge Sharing
To conduct research and development on industry-wide challenges, a manufacturer created a new rolewithin the company, a person whose responsibilitiesinclude working with universities, regulatory agenciesand trade organizations to improve the accuracy offinished product testing and catch quality issuesbefore products reach the hands of consumers.
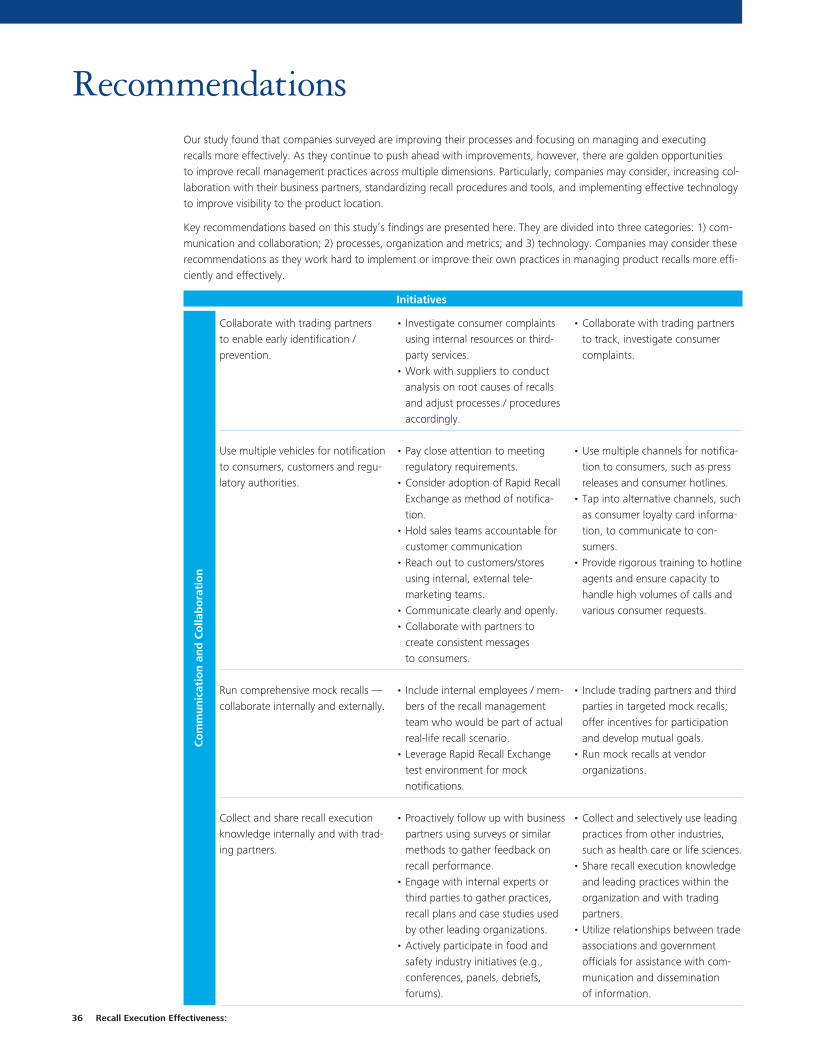
36 Recall Execution Effectiveness:
Co
mm
unic
atio
n a
nd
Co
llab
ora
tio
n
RecommendationsOur study found that companies surveyed are improving their processes and focusing on managing and executing recalls more effectively. As they continue to push ahead with improvements, however, there are golden opportunities to improve recall management practices across multiple dimensions. Particularly, companies may consider, increasing col-laboration with their business partners, standardizing recall procedures and tools, and implementing effective technologyto improve visibility to the product location.
Key recommendations based on this study’s findings are presented here. They are divided into three categories: 1) com-munication and collaboration; 2) processes, organization and metrics; and 3) technology. Companies may consider theserecommendations as they work hard to implement or improve their own practices in managing product recalls more effi-ciently and effectively.
Initiatives
Collaborate with trading partners to enable early identification / prevention.
• Investigate consumer complaintsusing internal resources or third-party services.
• Work with suppliers to conductanalysis on root causes of recallsand adjust processes / proceduresaccordingly.
• Collaborate with trading partnersto track, investigate consumercomplaints.
Use multiple vehicles for notificationto consumers, customers and regu-latory authorities.
• Pay close attention to meetingregulatory requirements.
• Consider adoption of Rapid RecallExchange as method of notifica-tion.
• Hold sales teams accountable forcustomer communication
• Reach out to customers/storesusing internal, external tele-marketing teams.
• Communicate clearly and openly.• Collaborate with partners to
create consistent messages to consumers.
• Use multiple channels for notifica-tion to consumers, such as pressreleases and consumer hotlines.
• Tap into alternative channels, suchas consumer loyalty card informa-tion, to communicate to con-sumers.
• Provide rigorous training to hotlineagents and ensure capacity tohandle high volumes of calls andvarious consumer requests.
Run comprehensive mock recalls —collaborate internally and externally.
• Include internal employees / mem-bers of the recall managementteam who would be part of actualreal-life recall scenario.
• Leverage Rapid Recall Exchangetest environment for mock notifications.
• Include trading partners and thirdparties in targeted mock recalls;offer incentives for participationand develop mutual goals.
• Run mock recalls at vendor organizations.
Collect and share recall executionknowledge internally and with trad-ing partners.
• Proactively follow up with businesspartners using surveys or similarmethods to gather feedback onrecall performance.
• Engage with internal experts orthird parties to gather practices,recall plans and case studies usedby other leading organizations.
• Actively participate in food andsafety industry initiatives (e.g.,conferences, panels, debriefs,forums).
• Collect and selectively use leadingpractices from other industries,such as health care or life sciences.
• Share recall execution knowledgeand leading practices within theorganization and with tradingpartners.
• Utilize relationships between tradeassociations and government officials for assistance with com-munication and dissemination of information.

Collaborative Approaches to Improving Consumer Safety and Confidence 37
Initiatives
Pro
cess
es, O
rgan
izat
ion a
nd
Met
rics
Implement efficient processes forintelligent identification and prevention of issues.
• Run ad-hoc quality tests at variouspoints in the manufacturingprocess.
• Consistently and rigorously useHACCP through the supply chainto identify areas of exposure.
• Leverage scientific / predictivetechniques to understand datapatterns from prior recalls andidentify potential recall issues early in the process.
Invest in training employees onrecall execution practices at the corporate as well as the store level.
• Provide comprehensive training tocross-functional recall manage-ment teams (e.g., general recallprocesses, coordination with otherdepartments, investigation tech-niques, communication strategies,and case studies and lessonslearned).
• Train store employees on standardoperating procedures specific torecall execution.
• Update training materials duringfeedback loop.
• Implement recall execution company certification.
• Leverage internal resources orthird parties to evaluate trainingprocesses and improve themaccordingly.
Identify, track and share recall execution metrics.
• Discuss removal, destruction andreplacement metrics with businesspartners as a part of annual business planning meetings.
• Share notification, removal,destruction and replacement metrics that is tracked in yourcompany with key trading part-ners involved during the recall execution process.
• Develop contingency plans with trading partners to ensureimmediate replacement.
• Track all metrics related to all steps of the recall executionprocess to access performanceand close gaps.
Implement and continuously refinestandard recall execution. processes.
• Develop rigorous recall plan /recall procedures.
• Develop a communication strategywith supporting checklist / tem-plates for notification to consumerand customers.
• Minimize development of tradingpartner-specific processes/tools;look for industry standard solu-tions when possible.
• Include manufacturing contin-gency plans to recall proceduresto support customer restockingrequirements.
• Institute rigorous mock recallprocesses that include both internal and external parties that would be involved in a real-life recall.
Ensure accountability across thevalue chain.
• Define roles and responsibilities ofthe recall team and other respon-sible parties (e.g., store managers,sales force) in advance.
• Develop incentive schemes for allresponsible parties; use othermethods to achieve accountability(e.g., status tracking, confirmationreceipt).
• Run 24/7 operations and havecontact information of all back-uppersonnel.
• Implement supporting technologyto track the status of the recallprocess (e.g., confirmation ofreceipt from a store manager).
• Use internal resources (e.g.,sales.force) or third parties toensure effective removal and/orconduct effectiveness checks.

38 Recall Execution Effectiveness:
Initiatives
Tec
hno
log
y
Automate and integrate technologywithin and beyond the four walls ofthe organization.
• Utilize all capabilities of existingtechnologies to enable effectivetraceability within the organiza-tion.
• Offer technology-related trainingto personnel responsible for recalls/ lot tracking.
• Automate data capture andreporting from raw materials tofinished goods to track productmovement across the shop floorduring the identification process.
• Adopt Rapid Recall Exchange foreffective notification betweenmanufacturers and retailers.
• Use other resources and services(media, tracking services, Websites) to monitor information on recalls.
• Use customer portals (if thoseexist) to notify customer.
• Use Reportable Food Registry to notify FDA.
• Integrate supply chain system withthe new product development system to be able to track allergens and components.
• Integrate systems and processeswith business partners to increasevisibility.
• Define common data standardsfor traceability internally and onestep up and one step down.
• Adopt systems that enable two-way notification across variousconstituents.
• (Retailers): Use an automated system that broadcasts notificationto all DCs / stores and requiresrecipient to verify receipt of information.

Appendix 1. Survey Results
Exhibit 1. Importance of recall steps to increase effectiveness of recall execution*
42%
31%
8%
3%
4%
13%
Identification NotificationRemoval
DestructionReplacementFeedback Loop
Manufacturers, retailers and service providers
* Source: Poll conducted during the Deloitte debrief “Food Recall Prevention: Manage Risk to Protect Your Consumers and Your Brand,” November 12, 2009 (367 participants – manufacturers, retailers and service providers)
Q. Which stage of the recall process needs most attention to increase effectiveness of recall execution?N=367
Exhibit 2. Respondent profile by recall class, percent of total companies
46%
12%
8%
35%
No recallsMost serious recall - Class IIIMost serious recall - Class IIMost serious recall - Class I
Manufacturers
Q. How many Class I, II and III recalls have you had in the past three years?N=26
Exhibit 3. Number of recalls by class, percent of total companies
No recall One recall Two recallsThree recalls Greater than four recalls
Manufacturers
0%
20%
40%
60%
80%
100%
Class IIIClass IIClass I
65%
15%
4%4%
12%4%
12%
15%
69%77%
19%
4%
Average number of product recalls per company:- 2 recalls in the past three years- 0.7 recalls per year
Q. How many Class I, II and III recalls have you had in the past three years?Class I: N=26, Class II: N=27, Class III: N=26
Perc
ent
of m
anuf
actu
rers
Exhibit 4. Number of recalls by class, percent of total companies
No recalls 1-20 recalls 21-50 recalls51-100 recalls 101-300 recalls 301-500 recalls500 or more recalls
Retailers
0%
20%
40%
60%
80%
100%
Class IIIClass IIClass I
23%
19%
19%
27%
8%
4% 8%
12%
27%
35%
19%
23%
8%
19%
15%
15%
15%
4%
Average number of product recalls per company:- 352 recalls in the past three years- 117 recalls per year
Q. How many Class I, II and III recalls have you had (e.g., have you implemented) in the past three years?N=26
Perc
ent
of re
taile
rs
Collaborative Approaches to Improving Consumer Safety and Confidence 39
Introduction

Call to Action
1,2 Source: Deloitte Consulting analysis
Identification
40 Recall Execution Effectiveness:
Exhibit 5. Recall impact on share price, percent change
Recall companies Consumer food product index*
(Average for 12 food product manufacturers)1
-3.0%
-2.5%
-2.0%
-1.5%
-1.0%
-0.5%
0.0%
Day (-1) to Day (1)Day (-1) to Day (0)
• Day (-1) - day before the event• Day (0) - day of the event (when company issues announcement on website)• Day (1) - day after event (typically when FDA issues announcement)
-2.0%
-0.7%
-2.6%
-0.3%
* Consumer food product index reflects the average price of 21 (mid, small and large cap) food product companies in North America
Shar
e p
rice
chan
ge, %
Exhibit 7. Percentage of companies that have standard quality check procedures
81%
19%
Yes No
Manufacturers
Q. Is there a standard quality check procedure for which certain results automatically launch an escalation process leading to a recall?N=26
Exhibit 8. Percentage of facilities with HACCP capabilities
<20% of facilities 20-95% of facilities 95-100% of facilities
Manufacturers
0%
20%
40%
60%
80%
100%
Integrate HACCP with the
Supply Chain
Formally track
HACCP
Have a developed
HACCP approach
4%4% 4%
4%12%
92% 92% 88%
Q. What percentage of your facilities follow HACCP?N=25
Perc
ent
of m
anuf
actu
rers
Exhibit 6. Impact of recall on share price over 15 day period
Manufacturer X2
6
8
10
12
10.7
10.0
7.8
8.68.4
-1 0 1 2 3 4 5 6 7 8 9 10 11 12 13 14 15
Shar
e pr
ice,
$
Days from recall announcement
• Day (-1) - day before the event• Day (0) - day of the event (when company issues announcement on website)• Day (1) - day after event (typically when FDA issues announcement)
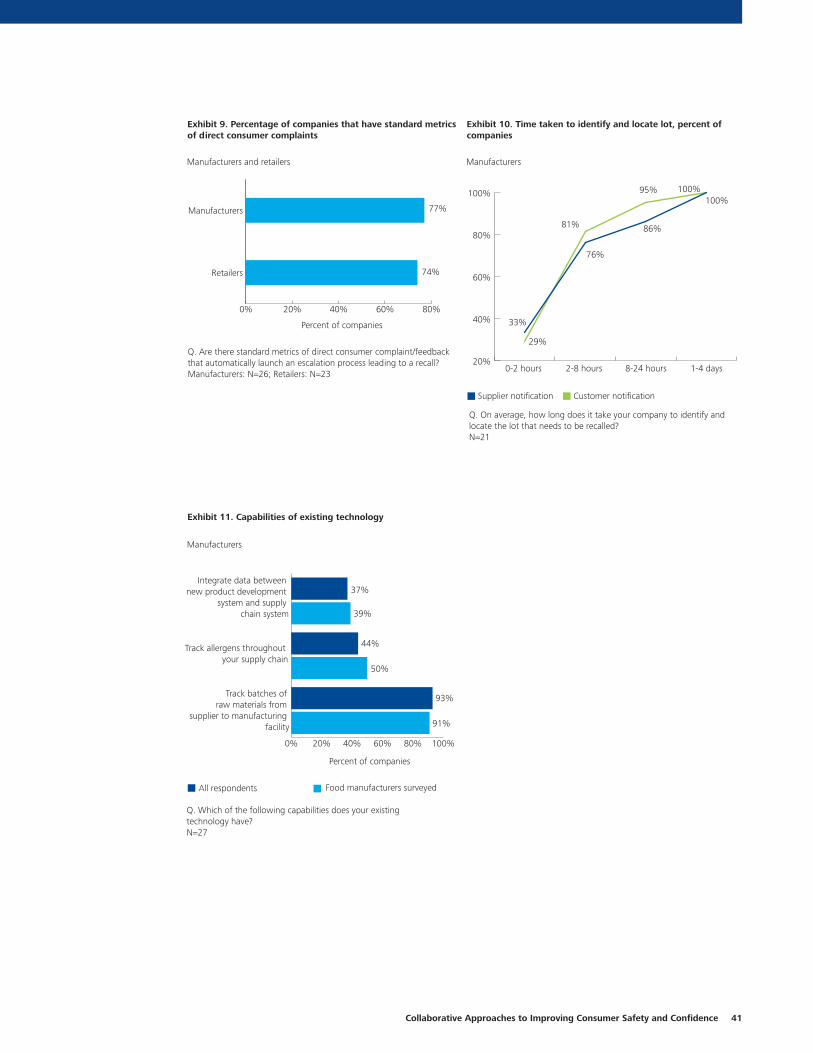
Collaborative Approaches to Improving Consumer Safety and Confidence 41
Exhibit 9. Percentage of companies that have standard metrics of direct consumer complaints
Manufacturers and retailers
0% 20% 40% 60% 80%
Retailers
Manufacturers 77%
74%
Percent of companies
Q. Are there standard metrics of direct consumer complaint/feedback that automatically launch an escalation process leading to a recall?Manufacturers: N=26; Retailers: N=23
Exhibit 11. Capabilities of existing technology
Manufacturers
0% 20% 40% 60% 80% 100%
Track batches of raw materials from
supplier to manufacturing facility
Track allergens throughout your supply chain
Integrate data between new product development
system and supply chain system
91%
50%
39%
37%
44%
93%
Percent of companies
Q. Which of the following capabilities does your existing technology have?N=27
All respondents Food manufacturers surveyed
Exhibit 10. Time taken to identify and locate lot, percent of companies
Manufacturers
20%
40%
60%
80%
100%
1-4 days8-24 hours2-8 hours 0-2 hours
29%
76%
86%
95% 100%100%
81%
33%
Supplier notification Customer notification
Q. On average, how long does it take your company to identify and locate the lot that needs to be recalled?N=21
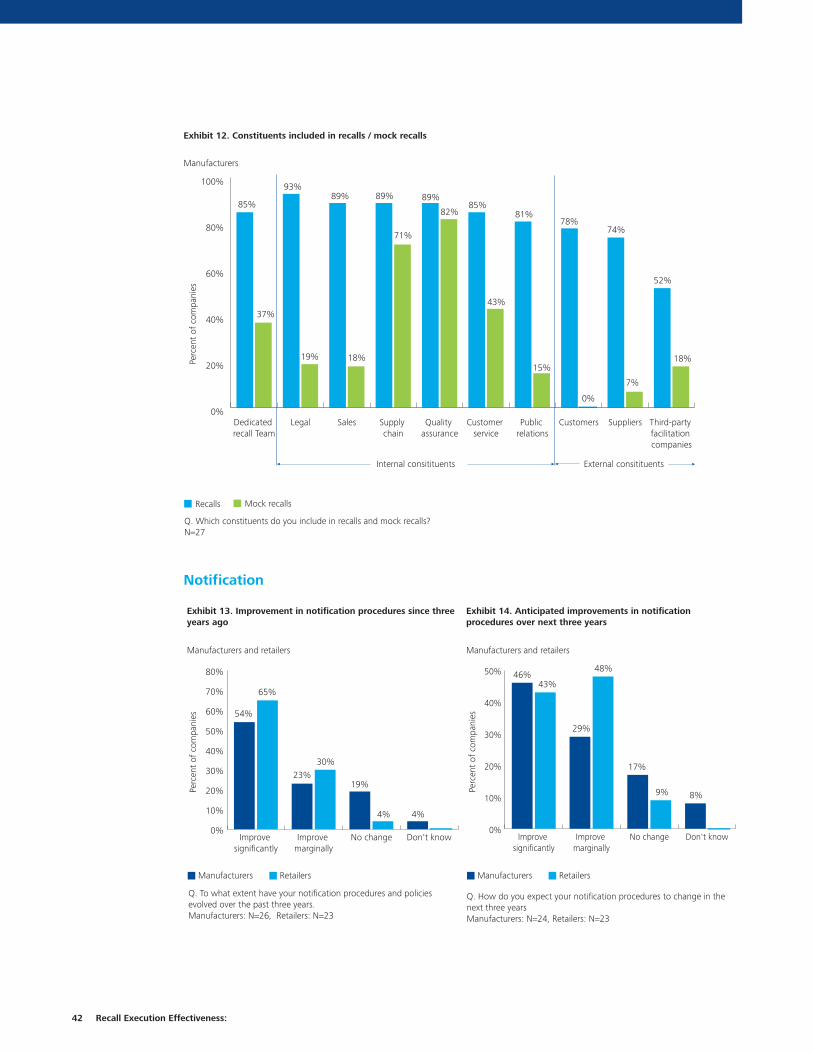
Notification
42 Recall Execution Effectiveness:
Exhibit 12. Constituents included in recalls / mock recalls
0%
20%
40%
60%
80%
100%
Third-party facilitation companies
SuppliersCustomersPublic relations
Customer service
Quality assurance
Supply chain
SalesLegalDedicated recall Team
Recalls Mock recalls
52%
18%
85%
37%
93%
19%
89%
18%
81%
15%
85%
43%
89%
71%
89%
82%78%
0%
74%
7%
Internal consitituents External consitituents
Perc
ent
of c
ompa
nies
Q. Which constituents do you include in recalls and mock recalls?N=27
Manufacturers
Manufacturers and retailers
Exhibit 13. Improvement in notification procedures since three years ago
0%
10%
20%
30%
40%
50%
60%
70%
80%
Don't knowNo changeImprove marginally
Improve significantly
Manufacturers Retailers
54%
65%
23%30%
19%
4% 4%
Q. To what extent have your notification procedures and policies evolved over the past three years. Manufacturers: N=26, Retailers: N=23
Perc
ent
of c
ompa
nies
Manufacturers and retailers
Exhibit 14. Anticipated improvements in notification procedures over next three years
0%
10%
20%
30%
40%
50%
Don't knowNo changeImprove marginally
Improve significantly
Manufacturers Retailers
46%43%
29%
48%
17%
9% 8%
Perc
ent
of c
ompa
nies
Q. How do you expect your notification procedures to change in the next three yearsManufacturers: N=24, Retailers: N=23

Manufacturers
Exhibit 15. Importance of performing multiple activities within notification
Maturity index0
5
10
15
20N
umbe
r of
act
iviti
es p
erfo
rmed
dur
ing
notifi
catio
n
Maturity Index: Index developed based on individual company sophistication of recall practices during each recall stage
Q. What steps do you taken within the notification process? N=26
Low High
Manufacturers
Exhibit 16. Steps / activities performed during the notification process
0%
20%
40%
60%
80%
100%
Upl
oad
info
rmat
ion
into
Ra
pid
Reca
ll Ex
chan
ge
Upl
oad
reca
ll in
form
atio
n/de
tails
to
cus
tom
ers
port
al (i
f app
licab
le)
Upl
oad
info
rmat
ion
into
FD
A R
epor
tabl
e Fo
od R
egis
try
Not
ify s
tore
s by
sal
es fo
rce
Rece
ive
confi
rmat
ion
from
sa
les
forc
e on
cus
tom
er n
otifi
catio
n
Send
out
des
truc
tion
inst
ruct
ions
Gen
erat
e a
lett
er t
hat
can
be u
sed
with
cus
tom
ers
Prov
ide
data
to
be s
ent
to n
ext
cons
titue
nt in
val
ue c
hain
Info
rm y
our
cust
omer
s he
adqu
arte
rs
Con
firm
cus
tom
ers
rece
ived
com
mun
icat
ion
Set
up a
hot
line
for
cust
omer
que
stio
ns
Prov
ide
pres
s re
leas
e
Publ
ish
notifi
catio
n of
re
call
on c
ompa
ny w
ebsi
te
Set
up a
hot
line
for
cons
umer
que
stio
ns
Com
mun
icat
e to
or
gani
zatio
n in
tern
ally
85%
100%
62%
89%
50%
89%
65%
100%
62%67%
77%
89% 89%
65% 65%
89%84%
100%
81%
100% 100%
77%
50%
67% 69%
89%
35%
44%
54%
78%
Notification to consumer
Notification to customer
Notification to consumer
Notifica-tion
to storesPortals
Q. What steps do you taken within the notification process?All companies surveyed: N=26, Companies that have had a Class I recall: N=9
All companies surveyed Companies that have had a Class I recall
Collaborative Approaches to Improving Consumer Safety and Confidence 43

44 Recall Execution Effectiveness:
Exhibit 17. Time taken to complete Identification step of recall execution
Manufacturers
0 10 20 30 40 50 60 70 80
Larger companies(with more than $700MM in revenues and 15 or more facilities)
Hours from QA issue triggers
Smaller companies (with less than $700MM in revenues and less than 15 facilities)
OverallAverage: 21.5 hoursMinimum: 0.5 hoursMaximum: 72 hours
Larger companies Average: 32.1 hours
Smaller compaiesAverage: 6.4 hours
Q. How long does it take you to complete identification process?N=17
Exhibit 18. Time taken to notify public and direct customers
Manufacturers
0 1 2 3 4 5 6
Time taken to notify direct
customers
Time taken to notify general
public on Class I recalls (using press release)
Time taken to notify general public on all recalls (using press release)
Averages:Notification to direct customers: 1.5 daysNotification to public, all recalls: 1 dayNotification to public,Class I recalls only: 0.7 days
Q. How long does it take you to inform general public and direct customers?Time taken to notify direct customers: N=13Time taken to notify general public on class 1 recalls: N=5Time taken to notify general public on all recalls: N=10
Days from recall decision
Exhibit 19. Time taken to complete each recall stage
Manufacturers
0 40 80 120 160
Averages:Notification - 15 daysRemoval - 44 daysReplacement - 45.1 daysMinimums:Notification - 1 dayRemoval - 2 daysReplacement - 5 daysMaximums:Notification - 5 daysRemoval - 150 daysReplacement - 120 days
Replacement
Removal
Notification to direct customers
Days from recall decision
Q. How long does it take you to complete each recall step? Notification: N=13, Removal N=11, Replacement: N=7
Exhibit 20. Time taken to complete each recall stage
Retailers
0 10 20 30 40 50 60
Averages:Notification to end cosumers - 21.4 hoursNotification to stores - 2.4 hoursRemoval - 7.1 hoursMinimums:Notification to end consumers - 2 hoursNotification to stores - 0.15 hoursRemoval - 0.3 hoursMaximums:Notification to end consumers - 48 hoursNotification to stores - 24 hoursRemoval - 36 hours
Removal
Notification to stores
Notification to end
consumers using loyalty
program
Hours from recall decision
Q. How long does it take you to complete each recall step?Notification: N=6, Removal: N=24,

Collaborative Approaches to Improving Consumer Safety and Confidence 45
Exhibit 21. Time taken to replace 80 percent of product
Manufacturers and retailers
0 20 40 60 80 100 120 140
Averages:Retailers: 12 daysManufacturers: 45 days
Minimums:Retailers: 1 dayManufacturers: 5 days
Maximums:Retailers: 30 daysManufacturers: 120 days
Manufacturers
Retailers
Days from recall decision
Q. How long does it take you to replace 80% of products?Retailers: N=17, Manufacturers: N=7
15%
5%
35%
40%
5%
As change occursUpdate after each recallUpdate every six monthsUpdate each year or less frequentlyDo not have such contact list
Manufacturers
Q.How often do you verify and update your contact list (for customer recall teams)?N=24
Exhibit 22. Frequency of customer recall team contact list updates
17%
28%50%
5%
As change occursUpdate after each recallUpdate quarterly (or less)Update every six months or less frequentlyDo not store contact lists
Retailers
Q.How often do you verify and update your contact list (for vendor recall teams)? N=18
Exhibit 23. Frequency of vendor recall team contact list updates

46 Recall Execution Effectiveness:
Exhibit 24. Frequency of use of FDA Reportable Food Registry
76%
5%
19%
Never25 - 50%Always
Manufacturers
Q. How frequently do you use the FDA Recall Food Registry to distribute information concerning a recall?N=21
Manufacturers
Exhibit 26. Informational elements provided during notification process
0%
20%
40%
60%
80%
100%
Reason for recall
Total quantity shipped (recalled)
Product info (name,
description, quantity,
units per case, weight/
size of unit)
UPC code
(customer unit / cases)
Customer instructions
(e.g., destroy, return to
store)
Manufact-urers recall
coordinator (name, contact
information)
Shipping case best by/use by date code
Recall classification
Scope (geographical)
of recall
Customer unit
manufacturing code
(lot code)
Location of codes
on shipping
case
Photo of product
56%
67%70% 70% 70%
74%78% 78% 78%
85% 85%89%
Q. Which of the following informational elements do you provide to FDA/USDA and to your customers?N=27
Perc
ent
of c
ompa
nies
Exhibit 25. Frequency of use of FDA Reportable Food Registry
25%
35%
10%
20%
5%
5%
Never0 - 25% 25 - 50%
50 - 75%75 - 99%Always
Retailers
Q. How frequently do you use the FDA Recall Food Registry to distribute information concerning a recall?N=20
Note: The FDA Reportable Food Registry was launched in September 2009.

Collaborative Approaches to Improving Consumer Safety and Confidence 47
Exhibit 28. Steps / activities performed during the notification process
Retailers
92%
0%
20%
40%
60%
80%
100%
Rece
ive
confi
rmat
ion
of q
uant
ities
of
reca
lled
prod
ucts
loca
ted
in
your
war
ehou
ses/
sto
res
Prov
ide
guid
ance
on
reca
ll ex
ecut
ion
to lo
cal s
uppl
iers
w
ith li
mite
d kn
owle
dge
Upl
oad
info
rmat
ion
into
FD
A R
FR
Upl
oad
info
rmat
ion
to
Rapi
d Re
call
Exch
ange
Set
up a
hot
line
to
addr
ess
cons
umer
que
stio
ns
Prov
ide
pres
s re
leas
e
Set
up s
igna
ge in
sto
re (e
.g.,
upda
tes
and
info
rmat
ion
on p
rodu
ct re
call)
Send
des
truc
tion
inst
ruct
ions
to
sto
re a
nd fa
cilit
y m
anag
ers
Rece
ive
confi
rmat
ion
of
quan
titie
s of
reca
lled
prod
ucts
lo
cate
d in
you
r st
ores
Rece
ive
confi
rmat
ion
from
sto
re m
anag
ers
Gen
erat
e le
tter
tha
t ca
n be
use
d fo
r st
ore
man
ager
s
Send
not
ifica
tion
to s
tore
m
anag
ers
auto
mat
ical
ly
(thr
ough
inte
rnal
sys
tem
)
Set
up t
elem
arke
ting
team
to
info
rm s
tore
man
ager
s
Perc
ent
of c
ompa
nies
Stores Consumers Portals Others
Q. What steps do you take within the notification process? N=26
23%
77%73%
77%85% 85%
69%
38% 38%
12%
35%42%
85%
Exhibit 27b. Usage of recall portals
Manufacturers
0%
20%
40%
60%
80%
100%
Retailers recall portal
Rapid Recall Exchange
FDA Reportable
Food Registry
24%30%
25%
Q. Do you use recall portals or other online tools to capture/distribute information concerning a recall?FDA RFR: N=21; Rapid Recall Exchange: N=23; Retailers recall portal: N=21
Exhibit 27a. Usage of recall portals / informational sources
Retailers
0%
20%
40%
60%
80%
100%
Food Track Internal company
portal
Rapid Recall Exchange
40%
75%
55%92%
Q. Do you use recall portals or other online tools to capture/distribute information concerning a recall?Rapid Recall Exchange: N=20, Internal company portal: N=18; Food Track: N=16
Note: The Rapid Recall Exchange was launched in September 2009. This survey was fielded Oct./Nov. 2009.
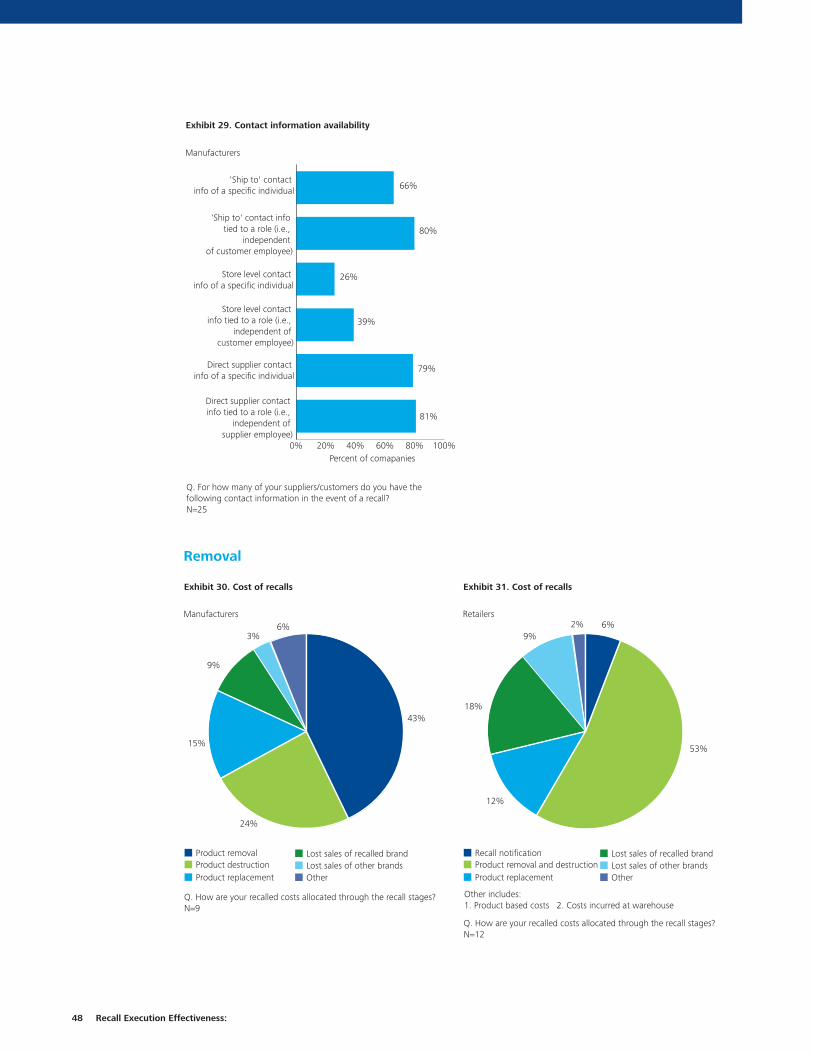
Removal
48 Recall Execution Effectiveness:
Exhibit 30. Cost of recalls
43%
24%
9%
3%6%
15%
Product removalProduct destruction Product replacement
Lost sales of recalled brandLost sales of other brandsOther
Manufacturers
Q. How are your recalled costs allocated through the recall stages?N=9
Exhibit 31. Cost of recalls
53%
12%
9%2% 6%
18%
Recall notificationProduct removal and destruction Product replacement
Lost sales of recalled brandLost sales of other brandsOther
Retailers
Q. How are your recalled costs allocated through the recall stages?N=12
Other includes:1. Product based costs 2. Costs incurred at warehouse
Exhibit 29. Contact information availability
Manufacturers
0% 20% 40% 60% 80% 100%
Direct supplier contact info tied to a role (i.e.,
independent of supplier employee)
Direct supplier contact info of a specific individual
Store level contact info tied to a role (i.e.,
independent of customer employee)
Store level contact info of a specific individual
'Ship to' contact info tied to a role (i.e.,
independent of customer employee)
'Ship to' contact info of a specific individual 66%
80%
26%
39%
79%
81%
Percent of comapanies
Q. For how many of your suppliers/customers do you have the following contact information in the event of a recall?N=25

Collaborative Approaches to Improving Consumer Safety and Confidence 49
Exhibit 32. Capabilities of existing technology
Retailers
0%
20%
40%
60%
80%
100%
Trac
k th
e am
ount
of p
rodu
ct
dest
roye
d at
sto
re-le
vel
Trac
k U
PC n
umbe
rs o
f pr
oduc
ts a
t st
ore
leve
l fo
r pr
oduc
ts d
eliv
ered
th
roug
h w
areh
ouse
Send
not
ifica
tion
mes
sage
s au
tom
atic
ally
to
any
stor
e th
roug
h in
tern
al s
yste
m/t
echn
olog
y
Trac
k am
ount
of p
rodu
ct
repl
aced
at
stor
e-le
vel
Trac
k lo
t nu
mbe
rs o
f pr
oduc
ts a
t st
ore
leve
l for
pro
duct
s de
liver
ed
thro
ugh
war
ehou
se
Stor
e v
endo
r lo
t nu
mbe
r an
d cr
oss-
refe
renc
e w
ith
inte
rnal
lot
num
ber
12% 12%
42%
85%
77%
85%
Q. Which of the following capabilities does your existing technology have?N=26
Perc
ent
of c
ompa
nies
Exhibit 33. Preparation for product removal and disposal
Retailers
0%
20%
40%
60%
80%
100%
Ava
ilabi
lity
of s
peci
alty
sto
rage
Phys
ical
sto
rage
cap
acity
Col
labo
ratio
n w
ith
man
ufac
ture
r’s
dire
ct-s
tore
-del
iver
y pe
rson
nel
Up-
to-d
ate
info
rmat
ion
on re
clam
atio
n ce
nter
s
Sale
s fo
rce
and
labo
r pl
anni
ng
Dire
ct s
uppl
ier
com
mun
icat
ion
4%
13%
65%
17% 29%
62%
5%
5%13%
70%
17%9%
17%
78%
4%
17%
61%
22%
68%
14%
9%
Need significant support/augmentation
Need some supplementary support/augmentation
Fully prepared
N/A
Perc
ent
of c
ompa
nies
Q. How prepared are you to execute product removal and disposal in thefollowing areas?N=23
Exhibit 34. Preparation for product removal and disposal
Manufacturers
0%
20%
40%
60%
80%
100%
Up-
to-d
ate
info
rmat
ion
on re
clam
atio
n ce
nter
s (c
apab
ilitie
s, c
onta
ct li
st e
tc.)
Sale
s fo
rce
and
labo
r pl
anni
ng
Indi
rect
cus
tom
er
com
mun
icat
ion
Dire
ct c
usto
mer
co
mm
unic
atio
n
Ava
ilabi
lity
of s
peci
alty
st
orag
e (e
.g. q
uara
ntin
ed)
Phys
ical
sto
rage
cap
acity
4%
11%
85% 68%
4%
28%
19%
81%
4%
39%
57%
76%
55%
36%
9%
20%
4%
Need significant support
Need supplementary support
Fully prepared
Perc
ent
of c
ompa
nies
Q. How prepared are you to execute product removal and disposal in the following areas?N=23

50 Recall Execution Effectiveness:
Replacement
Feedback Loop
Exhibit 35. Actions taken during Replacement
Retailers
0%
20%
40%
60%
80%
100%
Put
a si
gn fo
r co
nsum
ers
notif
ying
the
m a
bout
pr
oduc
t re
call
Seek
upd
ated
repl
acem
ent
timel
ines
from
man
ufac
ture
rs
Mon
itor
war
ehou
se le
vels
an
d %
of r
ecal
led
prod
uct
retu
rned
/des
troy
ed
Build
tim
elin
e of
whe
n p
rodu
ct w
ill b
e re
plac
ed o
n th
e sh
elf a
nd c
omm
unic
ate
to s
tore
man
ager
s
Trac
k pr
oduc
ts
thro
ugh
supp
ly c
hain
Tem
pora
rily
repl
enis
h t
he s
helf
with
an
othe
r br
and
Empl
oy fa
cilit
atio
n pa
rtie
s to
tra
ck t
he
% o
f pro
duct
repl
aced
8%
42%38% 42%
85%
62%
81%
92%
Perc
ent
of c
ompa
nies
Q. What actions do you take as part of the replacement process?N=26
Manufacturers and retailers
Exhibit 37. Activities performed during Feedback Loop
0%
20%
40%
60%
80%
100%
Assess the negative
impact on your
business
Assess the
negative impact
on direct customers’
business
Compare recall
execution effectiveness
by various retailers
(to identify best practices, etc.)
Incorporate lessons learned and run
mock recalls to test procedures
Update internal
procedures
Hold a meeting with a cross
functional team
Hold a meeting with key contacts
from your direct customer
Capture and document
lessons learned, gaps, opportunities
71%
48%
32%
19%
79%
19%
89%
58%
68%
38% 36%
NA NA NA
43%
75%
Manufacturers Retailers
Q. Which of the following activities do you perform following a recall?Manufacturer: N=28, Retailer: N=26
Exhibit 36. Actions taken during Replacement
Manufacturers
0%
20%
40%
60%
80%
100%
Communicate timelines to retailers
Build timeline of when product
will return
to shelf
Monitor customer
warehouse levels
and % of recalled product that is
returned
Track products through supply chain
Send FDA
confirmation letter
to retailers
Employ third-party facilitators
to track % of product
replaced
27%
54%58%
62%
69%
81%
Perc
ent
of c
ompa
nies
Q. What actions do you take as part of the replacement process?N=26

Appendix 2. Standard Data to Providethe FDA, USDA, State / LocalAuthorities, Customers and Consumers
Collaborative Approaches to Improving Consumer Safety and Confidence 51
Standardized data elements to be provided: FDA USDAState / local authorities
Customer Consumer
Manufacturer's name / recalling company x x x x x
Manufacturing / producing location(s) x x x x x
Address of manufacturing site x x x
Manufacturer's recall coordinator (name, contact information), regulatory contact
x x x
Manufacturer's recall coordinator (name, contact information), customer contact
x
Manufacturer's consumer contact information (toll free number, website, etc.)
x x x x x
USDA establishment number x x x x
Plant number (i.e., dairy) [Not BT food facility registration number] x x x x
Registration number under section 415(a)(3) [BT registration of food facilities]
x
Product name / description x x x x x
Total quantity (cases) produced x x x x x
Number of units per case x x x x
Weight (size) per unit x x x x x
Total quantity under manufacturer's control x x x
Total quantity shipped (i.e., being recalled) x x x x x
UPC code, consumer unit x x x x x
UPC code, cases x x x x
Consumer unit manufacturing code (lot code) x x x x x
Explanation of how to interpret consumer unit manufacturing code x x x
Consumer unit best by / use by date code x x x x x
Location of codes on consumer unit x x x x x
Consumer unit label example x x x x x
Shipping case manufacturing code x x x x
Explanation of how to interpret shipping case manufacturing code x x x
Shipping case best by / use by date code x x x
Location of codes on shipping case x x x x
Reason for recall (i.e. listeria / samonella / allergens / foreign material) x x x x x
Explanation for recall (i.e. consumer complaints received) x x x x x
Consumer instructions (i.e. destroy, return to store) x x x x x
Customer instructions (i.e. destroy, return to manufacturer) x x x x
Scope (geographical) of recall x x x x x
Consignee list (ship to name, address including zipcode, contact information)
x x x
Individual customer consignee information (ship to name, address, contact information)
x
Quantity shipped to consignee with identifier (e.g., date, delivery number)
x x x x
Sold to name (if different from ship to name) x x x
Has company press release been issued? x x x x
Recall classification when known x x x x
Photo of label/product x x x x x

1. Instruct your customers to remove the product and to dispose of it in one of three ways:– Correct/recondition the product (in a Class I and some Class II recalls, any correction/reconditioning of the product,
such as affixing stickers to correct an expiration date or ingredients statement, must be done with the approval of FDA or FSIS).
– Destroy the product at the store.– Return the product to a central location for destruction.
2. If the product is to be destroyed, the instructions should describe the place and manner of destruction.
3. The regulatory authorities should be notified of the plan prior to destroying product. The officials who are investigatingthe situation may request additional samples of the product or may ask to witness the destruction.
4. If the product does not pose a health hazard, customers may usually dispose of the product as if it were other normal waste.
5. If the product poses a health hazard, consider collecting all of it at a central location, so that destruction can be monitored and confirmed.
6. In disposing of the product, comply with federal, state and local environmental regulations on landfills and disposal oftoxic materials.
7. Retain records or receipts substantiating the identification, removal and destruction of all recalled product.
8. If instructions indicate that the product needs to be returned to the supplier, be sure to have specific instructionsregarding how to handle the transport of the product. For example, the supplier may want the product shipped under seal.
9. If the product is only misbranded and does not pose any health hazard (such as undeclared allergens), it may be donated.
Source: The Food Institute, “Food Products Recall Manual,” 2009; The Food Recall Manual, FS&HN, University of Florida,Association of Food and Drug Officials
Appendix 3. Disposition Instructions,Select Guidelines
52 Recall Execution Effectiveness:
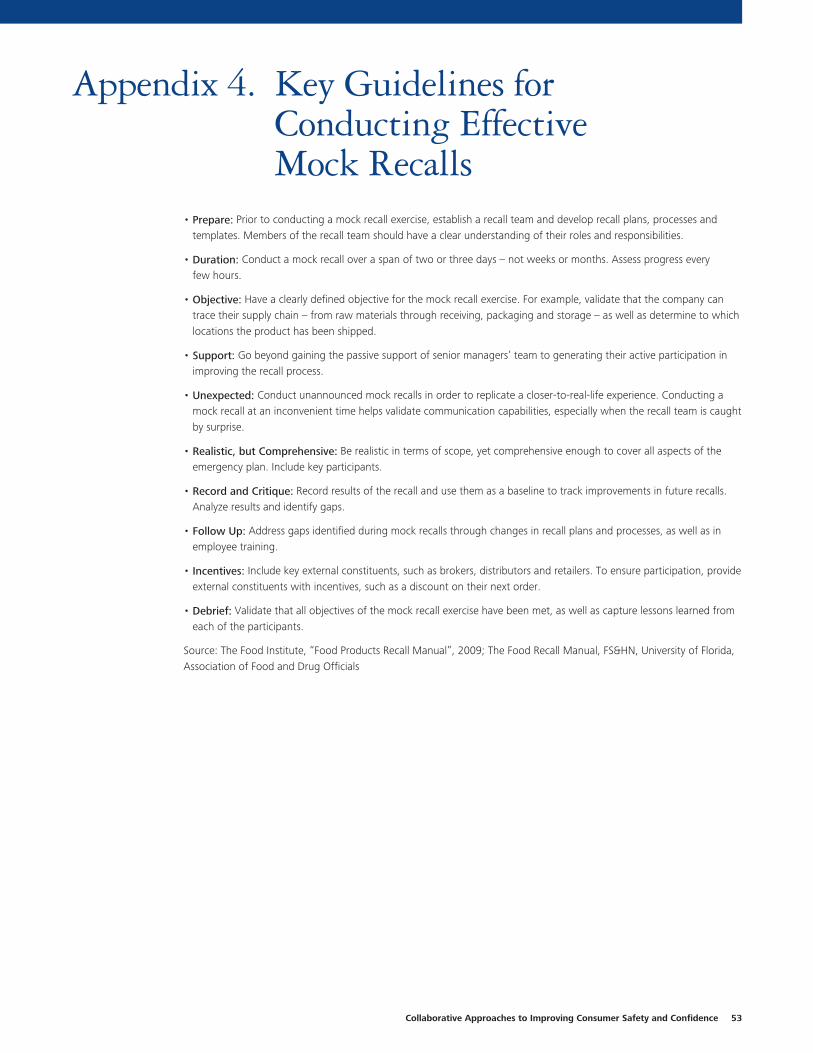
• Prepare: Prior to conducting a mock recall exercise, establish a recall team and develop recall plans, processes and templates. Members of the recall team should have a clear understanding of their roles and responsibilities.
• Duration: Conduct a mock recall over a span of two or three days – not weeks or months. Assess progress every few hours.
• Objective: Have a clearly defined objective for the mock recall exercise. For example, validate that the company cantrace their supply chain – from raw materials through receiving, packaging and storage – as well as determine to whichlocations the product has been shipped.
• Support: Go beyond gaining the passive support of senior managers’ team to generating their active participation inimproving the recall process.
• Unexpected: Conduct unannounced mock recalls in order to replicate a closer-to-real-life experience. Conducting amock recall at an inconvenient time helps validate communication capabilities, especially when the recall team is caughtby surprise.
• Realistic, but Comprehensive: Be realistic in terms of scope, yet comprehensive enough to cover all aspects of theemergency plan. Include key participants.
• Record and Critique: Record results of the recall and use them as a baseline to track improvements in future recalls.Analyze results and identify gaps.
• Follow Up: Address gaps identified during mock recalls through changes in recall plans and processes, as well as inemployee training.
• Incentives: Include key external constituents, such as brokers, distributors and retailers. To ensure participation, provideexternal constituents with incentives, such as a discount on their next order.
• Debrief: Validate that all objectives of the mock recall exercise have been met, as well as capture lessons learned fromeach of the participants.
Source: The Food Institute, “Food Products Recall Manual”, 2009; The Food Recall Manual, FS&HN, University of Florida,Association of Food and Drug Officials
Appendix 4. Key Guidelines forConducting Effective Mock Recalls
Collaborative Approaches to Improving Consumer Safety and Confidence 53

FDA Recalls
• FDA recall regulations (codified at: 21 CFR 7) http://ecfr.gpoaccess.gov/cgi/t/text/text-idx?c=ecfr&sid=b6ab961 50dda3573e74b8d3b5cb72906&rgn=div6&view=text&node=2 1:1 .0.1 .1 .5.3&idno=2 1
Subpart C — RECALLS (INCLUDING PRODUCT CORRECTIONS)—GUIDANCE ON POLICY, PROCEDURES, AND INDUSTRY RESPONSIBILITIES
– §7.40 Recall policy
– §7.41 Health hazard evaluation and recall classification
– §7.42 Recall strategy
– §7.45 Food and Drug Administration-requested recall
– §7.46 Firm-initiated recall
– §7.49 Recall communications
– §7.50 Public notification of recall
– §7.53 Recall status reports
– §7.55 Termination of a recall
– §7.59 General industry guidance
• FDA mandatory recall requirements for infant formula
21 CFR 107 Subpart E—Infant Formula Recalls
– § 107.200 Food and Drug Administration-required recall
– § 107.2 10 Firm-initiated product removals
– § 107.220 Scope and effect of infant formula recalls
– § 107.230 Elements of an infant formula recall
– § 107.240 Notification requirements
– § 107.250 Termination of an infant formula recall
– § 107.260 Revision of an infant formula recall
– § 107.270 Compliance with this subpart
– § 107.280 Records retention
• FDA requirement for a recall plan for manufacturers of acidified canned foods 21 CFR 108.25 (e) Acidified foods.
• FDA requirement for a recall plan for manufacturers of low acid canned foods 21 CFR 108.35 (f) Thermal processing of low-acid foods packaged in hermetically sealed containers.
• FDA’s Investigations Operations Manual (IOM) — the primary guidance document on FDA inspection policy andprocedures for field investigators and inspectors. Chapter 7 deals with FDA recall activities. It also includes examples ofrecall communications documents and the FDA form for recall audit check reporting.
http://www.fda.gov/ICECI/Inspections/IOM/ucm 123363.htm
Appendix 5. Recall Resources, FDA and FSIS
54 Recall Execution Effectiveness:
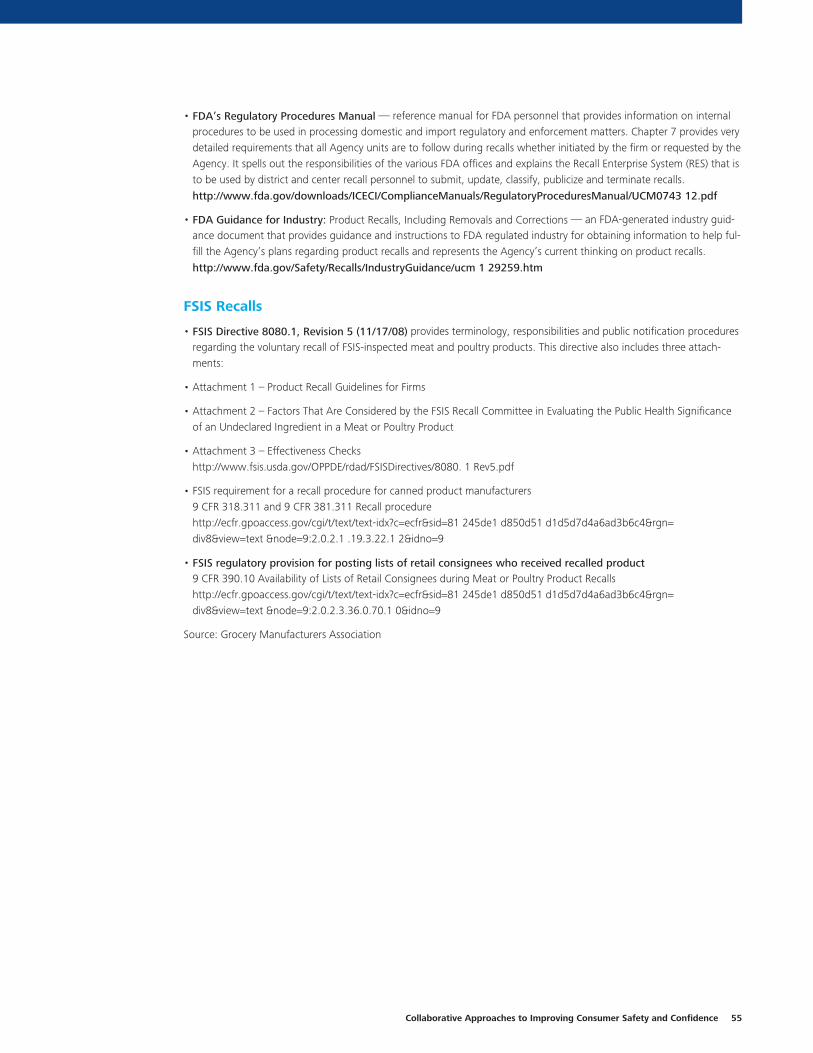
• FDA’s Regulatory Procedures Manual — reference manual for FDA personnel that provides information on internalprocedures to be used in processing domestic and import regulatory and enforcement matters. Chapter 7 provides verydetailed requirements that all Agency units are to follow during recalls whether initiated by the firm or requested by theAgency. It spells out the responsibilities of the various FDA offices and explains the Recall Enterprise System (RES) that isto be used by district and center recall personnel to submit, update, classify, publicize and terminate recalls.
http://www.fda.gov/downloads/ICECI/ComplianceManuals/RegulatoryProceduresManual/UCM0743 12.pdf
• FDA Guidance for Industry: Product Recalls, Including Removals and Corrections — an FDA-generated industry guid-ance document that provides guidance and instructions to FDA regulated industry for obtaining information to help ful-fill the Agency’s plans regarding product recalls and represents the Agency’s current thinking on product recalls.
http://www.fda.gov/Safety/Recalls/IndustryGuidance/ucm 1 29259.htm
FSIS Recalls
• FSIS Directive 8080.1, Revision 5 (11/17/08) provides terminology, responsibilities and public notification proceduresregarding the voluntary recall of FSIS-inspected meat and poultry products. This directive also includes three attach-ments:
• Attachment 1 – Product Recall Guidelines for Firms
• Attachment 2 – Factors That Are Considered by the FSIS Recall Committee in Evaluating the Public Health Significanceof an Undeclared Ingredient in a Meat or Poultry Product
• Attachment 3 – Effectiveness Checks http://www.fsis.usda.gov/OPPDE/rdad/FSISDirectives/8080. 1 Rev5.pdf
• FSIS requirement for a recall procedure for canned product manufacturers 9 CFR 318.311 and 9 CFR 381.311 Recall procedurehttp://ecfr.gpoaccess.gov/cgi/t/text/text-idx?c=ecfr&sid=81 245de1 d850d51 d1d5d7d4a6ad3b6c4&rgn=div8&view=text &node=9:2.0.2.1 .19.3.22.1 2&idno=9
• FSIS regulatory provision for posting lists of retail consignees who received recalled product9 CFR 390.10 Availability of Lists of Retail Consignees during Meat or Poultry Product Recallshttp://ecfr.gpoaccess.gov/cgi/t/text/text-idx?c=ecfr&sid=81 245de1 d850d51 d1d5d7d4a6ad3b6c4&rgn=div8&view=text &node=9:2.0.2.3.36.0.70.1 0&idno=9
Source: Grocery Manufacturers Association
Collaborative Approaches to Improving Consumer Safety and Confidence 55

1 Poll conducted during the Deloitte debrief “Food Recall Prevention: Manage Risk to Protect Your Consumers and YourBrand,” November 12, 2009 (367 participants — manufacturers, retailers and service providers). See Exhibit 1, Appendix1 for poll results.
2 Progressive Grocer, “Ahead of What’s Next,”May2009. <www. progressivegrocer.com>
3 Poll conducted during the Deloitte debrief “Food Recall Prevention: Manage Risk to Protect Your Consumers and YourBrand,” November 12, 2009 (367 participants — manufacturers, retailers and service providers). See Exhibit 1, Appendix1 for poll results.
4 Exhibit 2, Appendix 1
5 U.S. Food and Drug Administration, <http:// www.fda.gov/Safety/Recalls/ ucm165546.htm>
6 U.S. Department of Agriculture Food Safety and Inspection Service, FSIS Directive, “Recall of Meat and PoultryProducts,” November 17, 2008
7 The Food Institute, “Food Products Recall Manual,” 2009
8 U.S. Food and Drug Administration, <http:// www.fda.gov/Safety/Recalls/ ucm165546.htm>
9 Food Industry Report, April 15, 2009
10 The Food Institute, “Food Products Recall Manual,” 2009
11 USA Today, “Peanut product recalls spread fast,” February 2, 2009
12 National Institute of Allergy and Infectious Diseases, <http://www3.niaid.nih.gov/ topics/foodborne/default. htm>
13 Pat Conroy and Diane Kutyla, “What’s for Dinner? Consumers Seek Answers About the Food They Eat,” November2008. <www. deloitte.com>
14 USDA, “Outbreak linked to Spinach Forces Reassessment of Food Safety Practices,” June 2007
15 U.S. Department of Health & Human Services — Public Health Service, “Progress Review Food Safety”, December 20, 2007
16 President’s Food Safety, Working Group, <http://www. foodsafetyworkinggroup.gov>
17 <http://www.consumerfed. org/a bout/def a ult. asp>
18 Exhibit 5, Appendix 1
19 Exhibit 6, Appendix 1
20 Marian Burros, “More Testing of Seafood to Address Mercury Concerns,” The New York Times, January 30, 2008. <http://www. nytimes.com/2008/01/30/ dining/30mercury.html>
21 Poll conducted during the Deloitte debrief “Food Recall Prevention: Manage Risk to Protect Your Consumers and YourBrand,” November 12, 2009 (367 participants — manufacturers, retailers and service providers). See Exhibit 1, Appendix1 for poll results.
22, 23 Exhibit 17, Appendix 1
24 Exhibit 7, Appendix 1
25 Exhibit 8, Appendix 1
26 Exhibit 9, Appendix 1
27 Exhibit 10, Appendix 1
28 Exhibit 11, Appendix 1
29, 30 Exhibit 12, Appendix 1
End Notes
56 Recall Execution Effectiveness:

31 Poll conducted during the Deloitte debrief “Food Recall Prevention: Manage Risk to Protect Your Consumers and YourBrand,” November 12, 2009 (367 participants — manufacturers, retailers and service providers). See Exhibit 1, Appendix1 for poll results.
32 Assuming that each distributor or wholesaler takes approximately the same time as a manufacturer to inform the nextconstituent in the value chain
33 Exhibit 13, Appendix 1
34 Exhibit 14, Appendix 1
35 Exhibit 15, Appendix 1
36 GMA, “GMA Product Recall Manual,” June 2010
37 Exhibit 18, Appendix 1
38 Exhibit 16, Appendix 1
39 Exhibit 20, Appendix 1
40 FMI, “2009 Food Retail Industry Speaks”
41 Center for Science in the Public Interest Newsroom, “Supermarkets Urged to Use Loyalty Card Info to NotifyConsumers Who Purchased Recalled Products,” February 3 2009.
42 Exhibit 18, Appendix 1
43 Exhibit 22, Appendix 1
44 Exhibit 16, Appendix 1
45 Exhibit 16, Appendix 1
47 Exhibit 26, Appendix 1
48 Exhibit 26, Appendix 1
46 Exhibit 27a and 27b, Appendix 1
49 Exhibit 27, Appendix 1
50 Exhibit 20, Appendix 1
51 Exhibit 28, Appendix 1
52 Exhibit 29, Appendix 1
53 IBIS World Industry Report, August 2009
54 Exhibit 30 in Appendix 1; Note: Total recall costs consist of costs for each step of the recall execution process andexclude other costs such as those associated with “brand impact”; Removal & Destruction costs typically consist of cost ofgoods sold, loss of sales, flat or variable fees to retailers for removal services, fees to third parties, and destruction andrefurbishment costs”.
55 Exhibit 31 in Appendix 1; Note: Total recall costs consist of costs for each step of the recall execution process andexclude other costs such as those associated with “brand impact”; Removal & Destruction costs typically consist of cost ofgoods sold, loss of sales, flat or variable fees to retailers for removal services, fees to third parties, and destruction andrefurbishment costs”.
56 FMI, Industry Overview 2008. <http://www.fmi.org/facts_ figs/?fuseaction=superfact>
57 Exhibit 26, Appendix 1
58 Exhibit 32, Appendix 1
59 Exhibit 32, Appendix 1
60 Exhibit 33, Appendix 1
Collaborative Approaches to Improving Consumer Safety and Confidence 57

61 “The Benefits of Using Two-Dimensional Barcodes,” December 2, 2009. <http:// www.articlesbase.com/ industrial--articles/the-benefits¬of-using-twodimensional¬barcodes-1 531858. html>
62 Amit Rawal, “RFID: The Next Generation Auto-ID Technology,” Microwave Journal, March 2009. <http:// www.mwjournal.com/Journal/ article.asp?HH_ID=AR_7232>.
63 Exhibit 34, Appendix 1
64 Exhibit 19 and Exhibit 20, Appendix 1
65 Exhibit 30 and Exhibit 31, Appendix 1
66 Exhibit 21, Appendix 1
67 Exhibit 35, Appendix 1
68 Exhibit 36, Appendix 1
69 Exhibit 36, Appendix 1
70 Exhibit 35, Appendix 1
71 Exhibit 35, Appendix 1
72 Exhibit 36, Appendix 1
73 Exhibit 21, Appendix 1
74 Exhibit 36, Appendix 1
75 Exhibit 35, Appendix 1
76 Exhibit 37, Appendix 1
77 Exhibit 37, Appendix 1
78 The Food Recall Manual, FS&HN, University of Florida, Association of Food & Drug Officials
79 Exhibit 37, Appendix 1
80 Exhibit 37, Appendix
58 Recall Execution Effectiveness:

For More information contact:
Adam MussomeliUS Supply Chain & Operations Practice Leader, Consumer ProductsDeloitte Consulting [email protected] 203-905-2646
Stephen BrownNational Consumer Packaged Goods Leader, [email protected]
Olga LiberzonManagerDeloitte Consulting [email protected] 212-618-4616
Brian LynchDirector, Sales & Sales Promotion/Industry AffairsGrocery Manufacturers [email protected]
Patrick Walsh, Vice President, Industry Collaboration, Education and ResearchFood Marketing Institute [email protected] 202-452-8444
Tamara Kenney Vice President, SolutionsGS1 [email protected] 937-428-3789
Collaborative Approaches to Improving Consumer Safety and Confidence 59

60 Recall Execution Effectiveness:

©2010