recent approaches in sensitive ...digital.csic.es/bitstream/10261/51820/4/recent approaches...1...
TRANSCRIPT
1
RECENT APPROACHES IN SENSITIVE ENANTIOSEPARATIONS BY CE
LAURA SÁNCHEZ-HERNÁNDEZ1, MARÍA CASTRO-PUYANA
2, MARÍA LUISA
MARINA1, ANTONIO L. CREGO
1 *
1) Department of Analytical Chemistry, Faculty of Chemistry, University of Alcalá. Ctra.
Madrid-Barcelona Km. 33.600, 28871 Alcalá de Henares (Madrid), Spain.
2) Laboratory of Foodomics, Institute of Food Science Research (CIAL), CSIC, Nicolas
Cabrera 9, Campus Cantoblanco, 28049 Madrid, Spain.
Correspondence: Antonio Luis Crego, Department of Analytical Chemistry, Faculty of
Chemistry, University of Alcalá, Ctra. Madrid-Barcelona Km. 33.600, 28871 Alcalá de
Henares (Madrid) Spain.
E-mail: [email protected]
Fax: + 34-91-8854971
Keywords: CE; Chiral analysis; derivatization; detection techniques; off-line sample
treatment; on-line sample preconcentration.
Non-standard abbreviations: ASEI, anion-selective exhaustive injection; CBI,
cyanobenz[f]isoindole; C4D, contactless conductivity detection; CMT, counter-
migration technique; CSEI, cation-selective exhaustive injection; DTAF,
dichlorotriazinylaminofluorescein; ECL, electrochemiluminescence; EME, electro
membrane extraction; FASS, field-amplified sample stacking; LLE, liquid-liquid
extraction; LPME, liquid-phase microextraction; LVSS, large volume sample stacking;
NAD, naphthalene-2,3-dicarboxaldehyde; NSS, normal sample stacking; PFT, partial
filling technique; SDME, single drop microextraction; SLE, solid-liquid extraction;
SLM, supported liquid membranes; SPME, solid-phase microextraction; tMCRB,
transient moving chemical reaction boundary.
2
Abstract
The latest strategies and instrumental improvements for enhancing the detection
sensitivity in chiral analysis by CE are reviewed in this work. Following the previous
reviews by García-Ruiz et al. (Electrophoresis 2006, 27, 195-212) and Sánchez-
Hernández et al. (Electrophoresis 2008, 29, 237-251; Electrophoresis 2010, 31, 28-43),
this review includes those papers that were published during the period from June 2009
to May 2011. These works describe the use of off-line and on-line sample treatment
techniques, on-line sample preconcentration techniques based on electrophoretic
principles, and alternative detection systems to UV-Vis to increase the detection
sensitivity. The application of the above-mentioned strategies, either alone or combined,
to improve the sensitivity in the enantiomeric analysis of a broad range of samples, such
as pharmaceutical, biological, food and environmental samples, enables to decrease the
limits of detection up to 10-12
M. The use of microchips to achieve sensitive chiral
separations is also discussed.

3
1. Introduction
Enantioselective analytical techniques have been highly demanded in the last years
due to the well-known relevance of chirality in the biological activity of compounds.
Over the past decades, the use of capillary electromigration techniques, to carry out
enantioselective separations of chiral compounds, has extensively been studied [1, 2].
Nowadays, there is no doubt that CE has evolved as an attractive and powerful
separation technique providing high separation efficiency and short migration times,
and needing low sample volumes. Thus, the latest advances of CE for the separation of
chiral compounds in different fields, such as pharmaceutical industry, food science or
environmental chemistry, among others, have been the subject of different reviews [3-
12].
Different CE modes, such as EKC, MEKC, or ACE, and a huge variety of chiral
selectors can be employed to achieve a chiral separation, making of CE a highly flexible
technique. Among the different modes, EKC is without doubt the most used in the field
of chiral separations. In the EKC mode, each enantiomer interacts in a different way
with the chiral selector, so the enantiomeric discrimination is produced by a
chromatographic mechanism [13-15].
In spite of the attractive properties of CE, it can hardly meet the requirements of
trace or ultratrace analysis when using UV detection because of the small injection
volume and short optical path length of on-column detection. For instance, the detection
sensitivity of a commercial CE-UV system is one of the most serious limitations of CE,
ranging the LODs from 10-5
to 10-6
M [12]. Thus, the development of strategies to
obtain the detection sensitivity needed for a given application is usually required. In this
regard, the approaches to enhance the sensitivity of CE, both in conventional and chiral
analysis, have been focused on three different strategies such as (i) off-line and on-line

4
sample treatments, (ii) on-line sample preconcentratrion techniques based on
electrophoretic or chromatographic principles, and (iii) the use of alternative detection
systems to the UV/Vis detection [16-23]. Although in some cases the use of only one
strategy is enough to improve the detection sensitivity, in other occasions the employ of
a combination of strategies is necessary. Anyway, the combination of strategies is a
current tendency since it can offer certain advantages to enhance the sensitivity as it will
be deduced from the articles published in the period of time covered in this review.
With the aim of providing to the readers an update on the latest strategies and
instrumental improvements developed for enhancing the sensitivity in chiral analysis by
CE, this review summarizes the literature published from June 2009 to May 2011
showing the decrease in the detection limits up to 10-12
M, and serves as a continuation
of the previous reviews on this topic published in 2006 [24], 2008 [25] and 2010 [26].
The potential of these strategies will be demonstrated on many application examples
mainly aimed to the analysis of pharmaceutical, biological, food and environmental
matrices.
2. Approaches for improving the detection sensitivity
Sensitivity is the critical point in the chiral analysis of real samples by CE. This
explains why efforts to improve it are focused either on preconcentration techniques or
on alternative detection systems. In this regard, the use of off-line and on-line sample
treatment techniques, on-line sample preconcentration techniques and/or alternative
detection systems to UV/Vis can significantly enhance both the analytical potential and
the application range of chiral CE, because of they may solve its weakest points such as
poor selectivity and high LOD.
5
Regarding the detection system, it is important to highlight that the combination
of the partial filling technique (PFT) or the counter-migration technique (CMT) with
chiral CE methodologies using UV or MS systems is often necessary to allow analyte
detection. In PFT only a fraction of the capillary is filled with the buffer containing the
chiral selector, while the rest of the capillary is filled with the buffer without the selector
[27]. However, in CMT the capillary can be filled completely with BGE containing
reverse-migrating chiral selectors since they migrate in the opposite direction to the
detection system [28]. In both cases, the chiral selector never reaches the detector. Thus,
this strategy is employed with the UV detector to avoid the presence of chiral selectors
with a high UV absorption (e.g., in the case of selectors as macrocyclic antibiotics, such
as vancomycin, which absorbs at low wavelengths, < 250 nm) in the detection cell, or in
the case of MS detection to avoid the contamination of the ionization source by the
chiral selectors that are usually non-volatile.
Recent chiral approaches based on the above-mentioned strategies in which the
LOD for enantiomers is at least 10-6
M will be described in the next sections.
2.1 Off-line sample treatment techniques
Sample pretreatment plays a key role in the analysis of complex samples in the
performance of CE. Two of the most common procedures involved to obtain a high
sensitivity and selectivity are sample preconcentration and chemical derivatization. The
ideal sample preparation methodology should be fast, accurate, precise, and low solvent
consuming. In addition, it should be easily adapted to the field of work and employ low
cost materials. Table 1 shows the sample treatment techniques used for chiral analysis
by CE-UV in the period of time covered by this review. Although liquid-liquid
extraction (LLE) continues being the preferred off-line sample treatment, SPE is
6
demonstrating to be a powerful alternative, owing to its simplicity and economy in
terms of analysis time and solvent. As it can be observed in Table 1, other treatments
such as solid-liquid extraction (SLE), liquid phase micro-extraction (LPME), and
derivatization have also been employed.
2.1.1 Extraction techniques
LLE is the most widely used sample treatment technique for clean-up and signal
enhancement in routine analysis. This technique provides excellent sample clean-up for
salts and biological macromolecules in spite of a broad range of other compounds may
be co-extracted [38]. LLE has been employed for the extraction and concentration of
drugs in culture media [29, 30] and biological samples [31] or alkaloids in herbs [32]. In
addition, two chiral CE-UV methods, employing LLE and PFT, have been described in
the period of time covered in this review to avoid the presence of amylose [31] or BSA
[32] in the UV detector. Preconcentration factors between 3 [31] and 40 [29] and LODs
up to 2 x 10⁻⁸
M were achieved.
SPE shows a general applicability and can be very efficient yielding high
preconcentration factors. This type of preconcentration prior to the CE separation can be
performed off-line, at-line, in-line or on-line, being the first one the simplest way to
combine SPE and CE [39]. Among these modes, only off-line SPE has been used in the
chiral methodologies included in this review. This technique has been employed for the
extraction and preconcentration of ibuprofen and its metabolites in biological samples
using C18 SPE cartridges [33] and nicotine alkaloids in cigarettes using a strong anion
exchange sorbent [34]. Concentration factors up to 10 [33] were achieved when the
eluted samples were evaporated to dryness and the residues were redissolved in a
7
smaller volume of solvent in order to achieve higher preconcentration with LODs up to
2 x 10⁻⁷
M.
On the other hand, the SLE of some ergostane and lanostane compounds from
Antrodia camphorata fungus was carried out using a soxhlet extractor [35]. After
evaporating the solvent, the residue was subjected to silica gel column chromatography
and eluted with increasing polarity mixtures of n-hexane/ethyl acetate. Then, the CE
method provided efficient achiral and chiral separation of the compounds isolated in one
single run achieving LODs up to 1x 10⁻⁶
M.
2.1.2 Micro-extraction techniques
Although LLE and SPE are the most widely employed extraction methods, they
are time-consuming and need a large amount of organic solvents, which is hazardous for
human health and the environment. To overcome these disadvantages, the miniaturized
modification of the traditional extraction methods, such as solid-phase microextraction
(SPME) or liquid-phase microextraction (LPME) has been carried out [40, 41].
Between them, LPME enables excellent sample clean-up effect, high extraction
efficiency and lower cost than SPME.
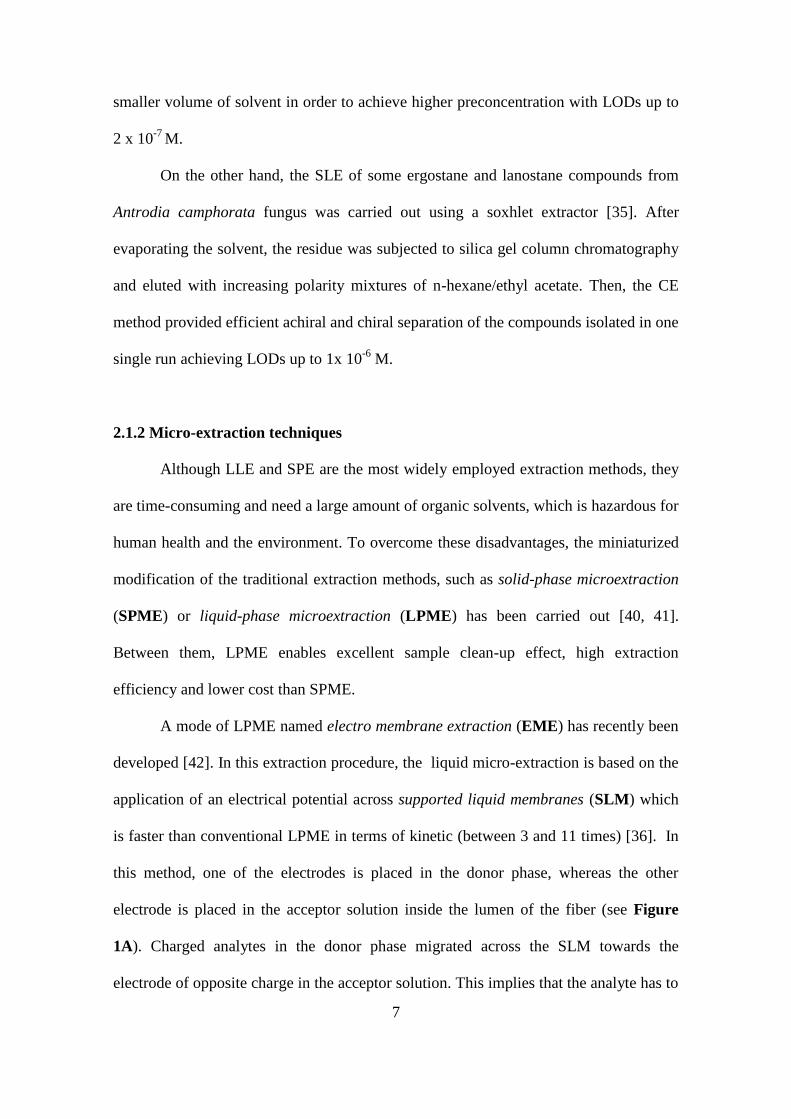
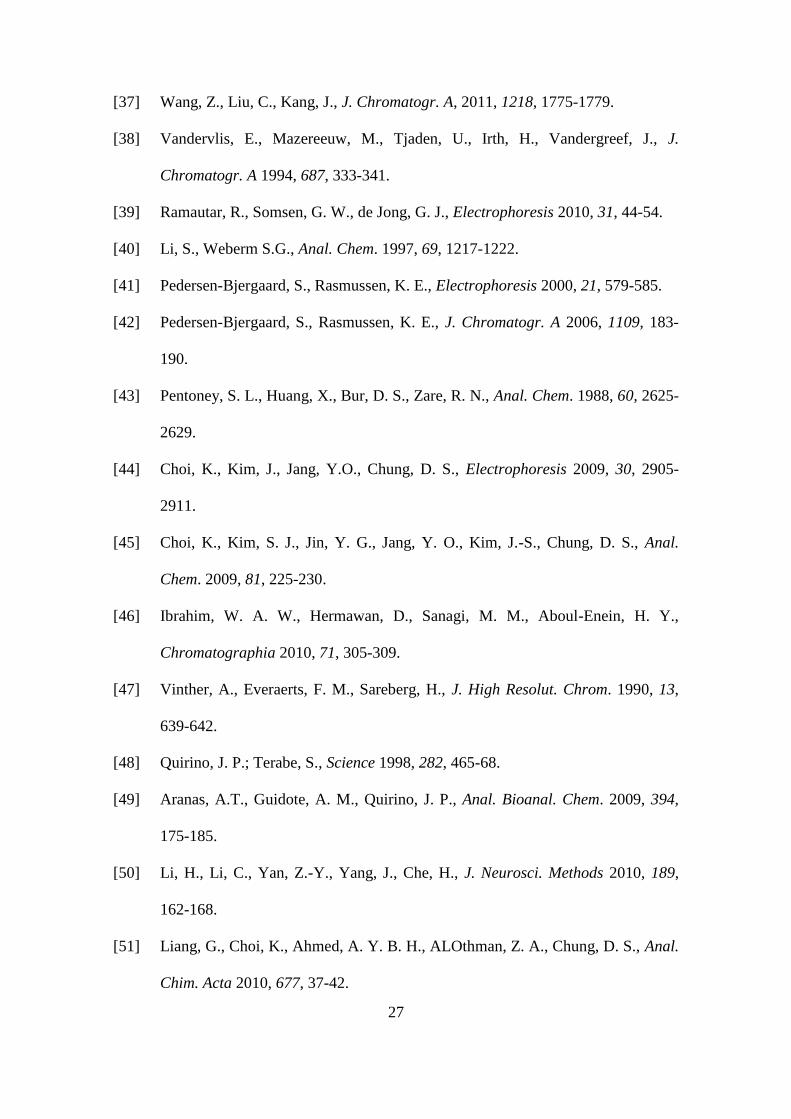
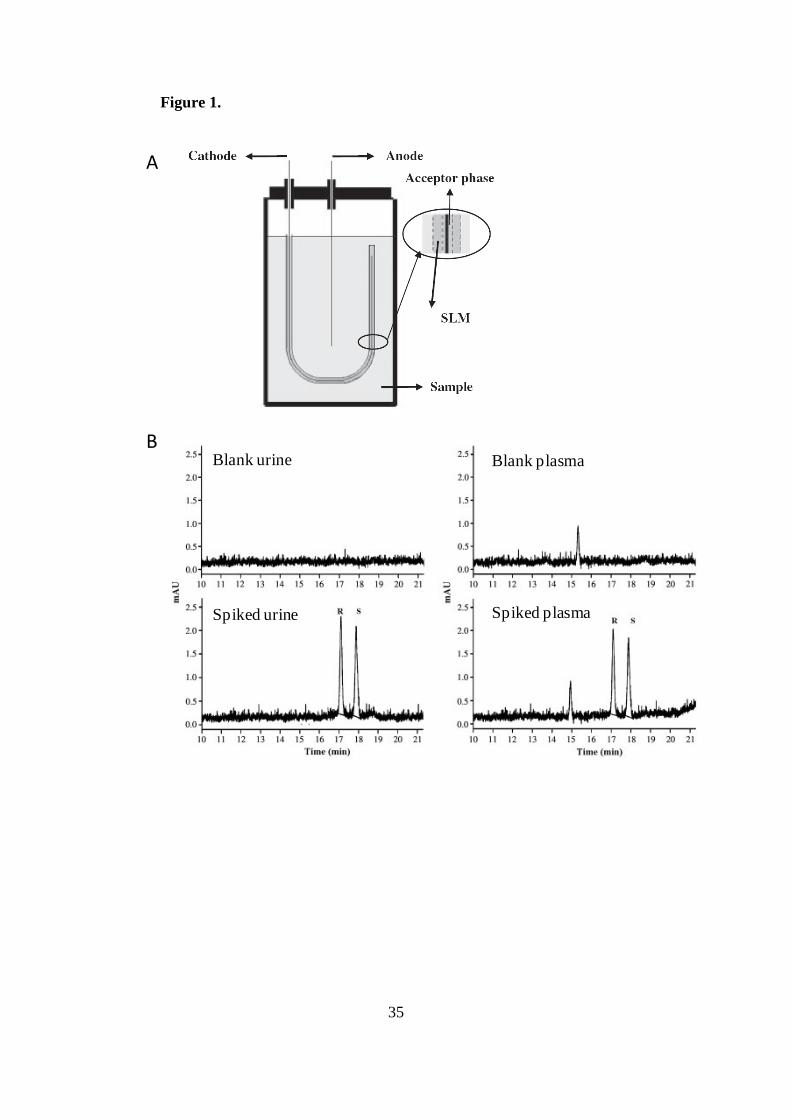
A mode of LPME named electro membrane extraction (EME) has recently been
developed [42]. In this extraction procedure, the liquid micro-extraction is based on the
application of an electrical potential across supported liquid membranes (SLM) which
is faster than conventional LPME in terms of kinetic (between 3 and 11 times) [36]. In
this method, one of the electrodes is placed in the donor phase, whereas the other
electrode is placed in the acceptor solution inside the lumen of the fiber (see Figure
1A). Charged analytes in the donor phase migrated across the SLM towards the
electrode of opposite charge in the acceptor solution. This implies that the analyte has to
8
be ionic in both acceptor and donor phases. EME has been proposed as sample
treatment in the drug amlodipine determination by a chiral EKC-UV method [36]. The
optimization of different extraction parameters such as organic solvent, time and
voltage, pH in the acceptor solution and in the donor phase and stirring speed, was
carried out. Figure 1B shows the electropherogram corresponding to the enantiomeric
separation of amlodipine in spiked and drug-free human urine and plasma samples after
EME. A preconcentration factor of 124 was obtained in 15 min of sample clean-up
reaching LODs of 7 x 10⁻⁹
M for each enantiomer.
2.1.3 Derivatization
The derivatization procedure with a suitable reagent is performed with the
purpose of increasing the detection sensitivity in CE converting the analyte into a
different compound with new chemical properties [43]. In addition, other aspects such
as the separation from interfering compounds, the electrophoretic behavior (namely,
peak shapes or interaction with chiral selectors) or the prevention of decomposition
during the analysis, can also be improved using a derivatization procedure.
As it can be observed in Table 1, only one off-line derivatization method for
chiral analysis of fenoprofen and six protein amino acids using FMOC as derivatization
reagent has been described in the period of time covered in this review [37]. The
derivatization reaction was carried out during 2 min at 25 ºC. Along with the
derivatizacion process, another additional on-line sample preconcentration strategy
(which will be described below) was also used. The combination of both procedures
allowed to reach LODs at 10-9
M level.

9
2.2 On-line sample treatment techniques
On-line sample treatments are attractive because they minimize the consumption
of samples and reagents, reduce the operation cost and can improve the precision of the
analyzed samples. However, in the period of time covered by this review there is only
one work published for chiral analysis by CE with UV detection. A single drop micro-
extraction (SDME) sample treatment was coupled to a chiral EKC-UV methodology for
the analysis of primary amine compounds, amphetamine, p-chloroamphetamine and 2-
amino-1,2-diphenylethanol, in human urine samples [44]. SDME is a LPME mode in
which the capillary inlet surface is covered with hydrophobic octadecyltrimethoxysilane
and whose extraction steps are described in Figure 2A [45]. After injecting an octanol
phase, the analytes of the sample solution (donor phase) are extracted into a single drop
in an acidic buffer (acceptor phase) by applying backpressure from the outlet vial and
covered by the octanol solvent (see image in Figure 2A). The optimum extraction by
SDME was obtained in 10 min using higher concentration of the buffer acceptor phase
for real samples than for standard samples in order to avoid a loss of extraction
efficiency (see Figure 2B). The developed method allowed the separation of the six
enantiomers around 35 min using (+)-(18-crown-6)-tetracarboxylic acid as a chiral
selector with resolutions between 1.6 and 8.0. This hyphenation provided sensitive
analysis yielding preconcentration factors from 400 to 1000-fold improvement in spiked
urine samples and LODs between 2-10 x 10-9
M [44], which are much lower than the
cutoff values of amphetamine test in the EU and USA.

10
2.3 On-line sample preconcentration techniques
Among the three major approaches for enhancing sensitivity in CE, the
application of on-line sample preconcentration techniques is the simplest, effective and
cheapest [12]. The on-line preconcentration techniques used in EKC are mainly
capillary ITP and sample stacking whereas sweeping is the most employed in MEKC.
Detection sensitivity in CE can be further improved by combining two sample
preconcentration techniques, for example, sweeping and stacking. During the period of
time covered in this review, different strategies of stacking and sweeping have been
described to increase the sensitivity in chiral CE-UV analysis, as it can be observed in
Table 2. These strategies have usually been employed in combination with off-line
sample treatment techniques.
2.3.1 Stacking
Stacking is based on the injection of a sample prepared in a matrix with a higher
resistance, i.e, with minor conductivity, than the separation buffer [23, 47]. Thus, the
analytes in the sample zone are stacked when they reach the boundary between the
sample zone and the running buffer zone. Sample stacking techniques include normal
sample stacking (NSS), large volume sample stacking (LVSS), field-amplified sample
stacking (FASS), and anion- or cation-selective exhaustive injection (ASEI or CSEI).
In NSS and LVSS the injection of the sample is hydrodynamic, being a larger injection
in the case of LVSS, while an electrokinetic injection is used in FASS and ASEI or
CSEI. A limitation in NSS is that the optimum sample plug length that can be injected
into the capillary without loss of resolution is small (over 10% of the capillary length).
However, a 1/3-1/2 of the capillary can be hydrodynamically filled with the sample

11
solution using LVSS, because in that case the sample matrix is pushed out of the
capillary by the weak EOF prior to separation. When FASS, ASEI or CSEI are used to
focus the analytes of the sample, there are no limitations in the injection volume.
A highly sensitive strategy for the enantioseparation of fenoprofen and six
FMOC-amino acids by EKC-UV using vancomycin (VC) as the chiral selector was
developed by combining LVSS and ASEI [37]. The experimental schedule for this
strategy is shown in Figure 3A. Before injection, the capillary (total length 39 cm) was
fully filled with the buffer with VC. Large volume of sample (analyte anions dissolved
in water) was thereafter hydrodynamically injected (34.45 mbar for 8 min) to leave a
short plug of the background electrolyte (BGE) in the outlet end of the capillary (only 7
cm). Then, stacking the analytes and removing the water plug by CMT using counter-
current EOF were achieved while additional analytes are selectively injected with
electrokinetic injection by applying a voltage of -5 kV during 12.5 min. It should be
noted that, the velocity of the anodic EOF must be lower than the cathodic velocity of
the analytes to avoid them being pumped out of the capillary. Thus, a dynamically
coating of the capillary with poly(N,N-dimethylacrylamide) was also carried out in
order to almost suppress the EOF and to diminish the adsorption of VC onto the
capillary wall. Electropherograms for enantioseparation obtained after on-line sample
preconcentration by LVSS-ASEI are shown in Figure 3. The combination of all these
strategies enabled to achieve a preconcentration factor of 1000-fold (compared with
normal injection) and LODs as low as 2-21x 10-9
M. This method was successfully
applied to the chiral separation of fenoprofen in a spiked river water sample.
Borges et al. evaluated the possibility of using NSS and FASS as
preconcentration techniques to study the biotransformation of different adrenergic
agents in Czapek culture media (endophytic fungi) with a previous LLE [29, 30]. Thus,
12
NSS was performed using an injection of 50 mbar during 20 s for the chiral analysis of
two β-adrenergic blocking agents (propranolol and its metabolite 4-hydroxypropranolol)
[29]. Using carboxymethyl-β-CD as chiral selector, baseline separations were achieved
within 16 min with LODs at 10-7
M level. This LOD enables the application of the
developed method to study the enantioselective biotransformation of propranolol in its
metabolite by the endophytic fungi after 72 h of incubation. A similar approach using
FASS injection (10 kV during 5 s) has been used to study the biotransformation of
midodrine and desglymidodrine (two -adrenergic agonists) in Czapek culture media
[30]. In this work, the chiral separation of these compounds was obtained in 11 min,
using (2,3,6-tri-O-methyl)-β-CD as chiral selector. Assuming that the studied analytes
in both works are comparable, it could be affirmed that similar LODs (~10-7
M) can be
achieved by NSS and FASS.
Finally, an ACE method with FASS preconcentration combined with PFT (to
avoid BSA reaching the detector) was optimized and validated for the determination of
tetrahydropalmatine enantiomers in herb samples [32]. The enantioresolution was
achieved in less than 9 min and the LODs reported for each enantiomer were around 2 x
10-8
M.
2.3.2 Sweeping
The sweeping mechanism is based on interactions between an additive in the
separation buffer, which acts as a pseudostationary phase (usually micelles, CDs or
complexing agents), and the sample [48, 49]. It enables an exceptional increase in the
detection sensitivity for those analytes with a high solute pseudostationary phase
association constant. Sample matrix may have different or the same conductivity than
the separation buffer but it is very important that the sample matrix does not contain the
13
pseudostationary phase, since it is the component originating the preconcentration of the
analyte by sweeping the sample matrix.
Sweeping and stacking preconcentration techniques have been compared to
enhance the detection sensitivity of three chiral triazole fungicides (hexaconazole,
pentaconazole, myclotbutanil) by MEKC-UV using a CD as chiral selector [46]. The
stacking was carried out by injecting the sample dissolved in water at 50 mbar during 10
s, whereas sweeping strategy was achieved by dissolving the sample in buffer and
injecting it during 70 s. Both methods allowed the separation of the six enantiomers
within 15 min through a BGE of 2-hydroxypropyl-γ-CD and SDS in reverse polarity.
The detection sensitivity of the three fungicides was increased from 9- to 10-times by
stacking whereas sweeping enabled an increase from 62- to 67-times. Besides, better
LODs were achieved by sweeping (3-7 x 10⁻⁷
M) than by stacking (4-14 x 10-6
M).
2.4 Detection techniques
Chiral CE methods are usually carried out using on-column UV absorbance
detection, even though its sensitivity is limited because of the short optical path length
provided by the capillary diameter. This is a serious limitation especially in the analysis
of samples containing low concentrations of enantiomers. For this reason, coupling of
CE with alternative detection systems is of prime interest. During the period of time
covered in this review, the number of publications employing alternative detection
systems to the UV one, has increased compared with those reported in our previous
review [26]. Thus, detection systems such as fluorescence, phosphorescence,
electrochemiluminescence, conductivity and mass spectrometry have been coupled to
CE for chiral analysis as it can be observed in Table 3.
14
2.4.1 Fluorescence
The new developments in chiral analysis with CE describe the use of LIF
detection through three different excitation sources: argon-ion laser [50-52], LED [53-
55] and deep-UV laser [56, 57]. LIF detection with argon-ion laser continues being one
of the most used and most sensitive detection techniques in CE. However, nowadays the
use of LED or deep-UV lasers as excitation sources has increased. Althought LED
sources reduce the overall cost of the detector, the estimated LODs using this device are
higher than those obtained under the same conditions using a LIF detector with argon-
ion laser. On the other hand, deep-UV lasers became an attractive source because of
chemical derivatization is not necessary. Their main disadvantages are high costs and
the specific requirements of their set-up.
As it was discussed in the previous review [25, 26], the main application of CE
with fluorescence detectors is the chiral analysis of amino acids. In the period of time
reviewed in this article, the enantioseparation of amino acids has been achieved in
different matrices such as standard samples [51, 56], pharmaceuticals [52], and
biological samples [50, 53-55]. As it can be seen in Table 3, a previous derivatization
of the amino acids with derivatizing agents such as FITC,
dichlorotriazinylaminofluorescein (DTAF), naphthalene-2,3-dicarboxaldehyde (NAD)
or cyanobenz[f]isoindole (CBI) was necessary in all the cases, except in those in which
a deep-UV laser was employed as excitation source.
In addition, some of the developed methodologies are combined with other off-
line [50] or on-line sample treatments [51], or other on-line sample preconcentration
techniques [54-57] making possible to reach excellent LODs (up to 10-12
M),
demonstrating that fluorescence is a powerful detection system for sensitive chiral
analysis by CE.
15
An example of the combination of off-line treatment and LIF detection was
shown by Li et al [50]. These authors combined an off-line microdialysis method of rat
brain samples with CD-MEKC-LIF for the achiral and chiral determination of several
compounds (seven protein amino acids, two non-protein amino acids, and O-
phosphoethanolamine) and serine, respectively. LODs ~10-10
M were achieved for each
serine enantiomer allowing the study of the increase in the levels of the neuromodulator
D-serine during cerebral ischemia/reperfusion.
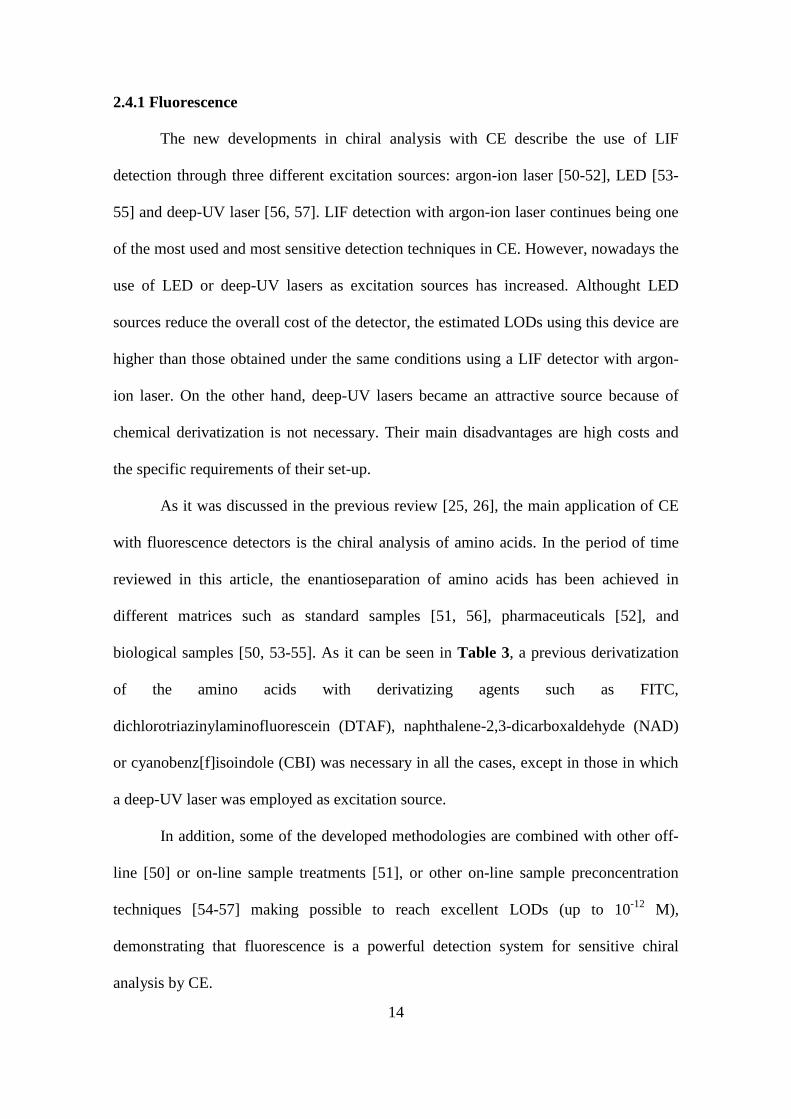
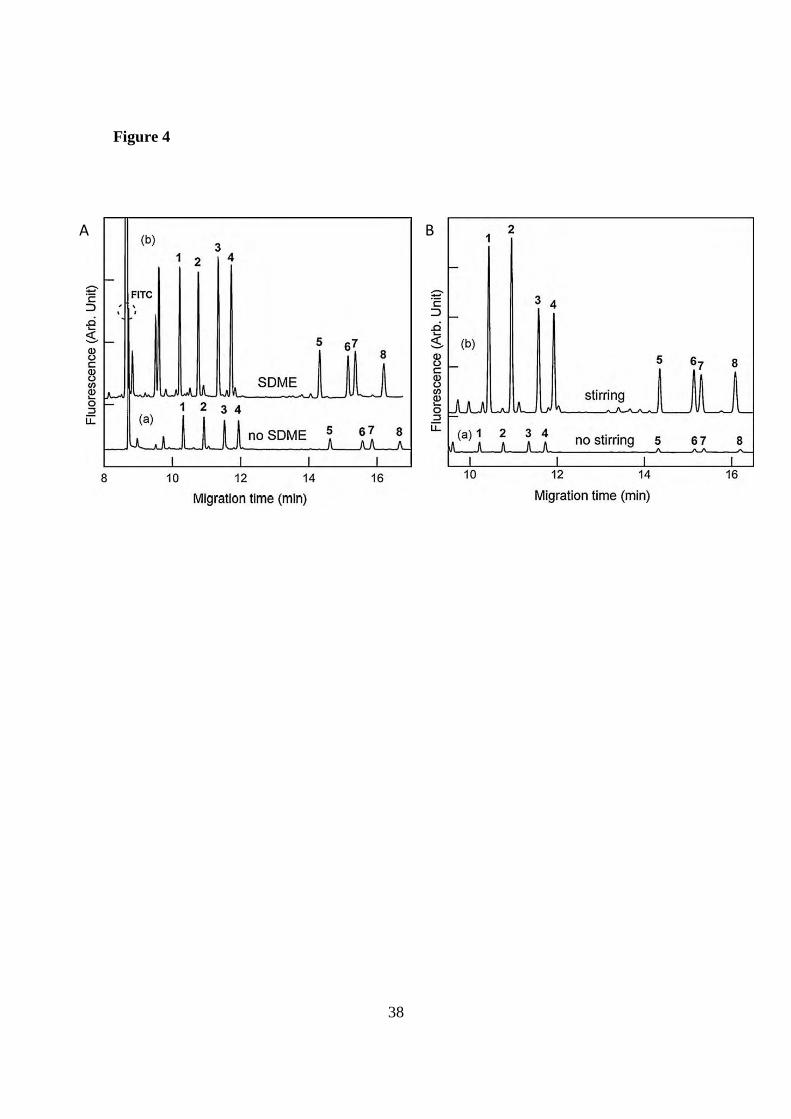
Regarding on-line strategies, a CD-MEKC-LIF methodology was combined with
SDME (approach described in section 2.2) to preconcentrate four FITC-amino acids,
namely leucine, alanine, glutamic acid and aspartic acid, from standard samples [51].
The chiral separation was performed in a short analysis time (16 min) using a dual
chiral selector system with sodium taurodeoxycholate (STC) as chiral bile salt and β-
CD obtaining resolution values from 5 to 11. Preconcentration factors around 400-fold
and LODs of 3-6 x 10-11
M were achieved using SDME during 10 min (see Figure 4A).
Moreover, the additional use of a micro-stirrer during the extraction allowed to reach
enrichments from 3000 to 6800-fold obtaining LODs of 1-3 x 10-12
M (See Figure 4B).
As far as we know these are the lowest LODs achieved for chiral analysis of standard
samples.
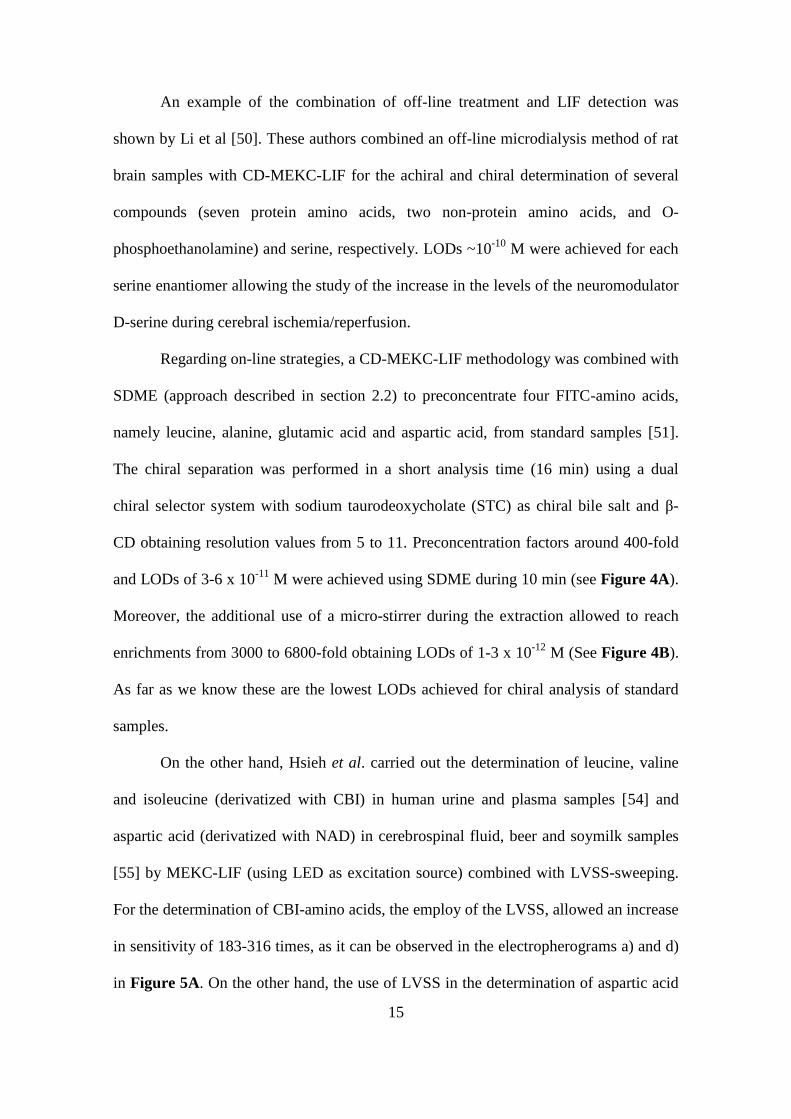
On the other hand, Hsieh et al. carried out the determination of leucine, valine
and isoleucine (derivatized with CBI) in human urine and plasma samples [54] and
aspartic acid (derivatized with NAD) in cerebrospinal fluid, beer and soymilk samples
[55] by MEKC-LIF (using LED as excitation source) combined with LVSS-sweeping.
For the determination of CBI-amino acids, the employ of the LVSS, allowed an increase
in sensitivity of 183-316 times, as it can be observed in the electropherograms a) and d)
in Figure 5A. On the other hand, the use of LVSS in the determination of aspartic acid
16
provided an improvement of about 100-times (see Figure 5B). In both works, poly
ethylene oxide (PEO) acted as a concentrated medium playing an important role in the
stacking of enantiomers when 2-hydroxypropyl-β-CD was employed as chiral selector,
allowing LODs of ~ 2 x 10⁻¹⁰
M.
Finally, only two works about the use of deep UV as excitation source have been
described in the period of time covered in this manuscript. In these works, a laboratory
made miniaturized CE system (with only 10 cm of capillary), using FASS and deep
UV-fluorescence, was applied to the determination of tryptophan [56] and propranolol
[57] in standard samples. Analysis time comparable to those obtained in microchips
(60-84 s) and LODs of 7 x 10-11
M and ~ 2 x 10⁻¹⁰
M for the enantiomeric determination
of tryptophan and propranolol, respectively, were achieved.
2.4.2 Phosphorescence
An attractive detection technique in chiral CE in the last two years has been
phosphorescence at room temperature in liquid deoxygenated solution. Three different
modes can be distinguished, direct phosphorescence, where the phosphorescent analyte
itself is excited by light of an appropriate wavelength, and two modes of indirect
phosphorescence: sensitized and quenched. In the sensitized mode, the analyte is
excited at its optimum excitation wavelength and transfers its energy to an acceptor
(added to the BGE) from which phosphorescence is observed. In the quenched mode,
strong phosphorophore compound (such as biacetyl or bromonaphthalene) is directly
excited and its phosphorescence quantum yield is reduced by biomolecular quenching
process with the analyte [69], which leads to negative peaks in the electropherogram. It
should be noted that in this mode, non-phosphorescent analytes can be detected. It is
also important to highlight that quenched phosphorescence is different from the indirect
17
UV absorption mode, which is based on electrophoretic displacement of the BGE by the
analytes.
Several works published by the Gooijer's research group have demonstrated the
potential of phosphorescence as detection technique in sensitive chiral analysis. In this
works, LED [58], or Nd-YAG laser [59, 60] were employed as excitation sources using
a sensitized phosphorescence mode. As shown in Table 3, different EKC methods
coupled to phosphorescence detection were developed for the determination of
camphorquinone [58, 59] and bupropion [60] in standards and different real samples.
Under the optimal conditions in each case, LODs up to 4 x 10⁻⁸
M were reached.
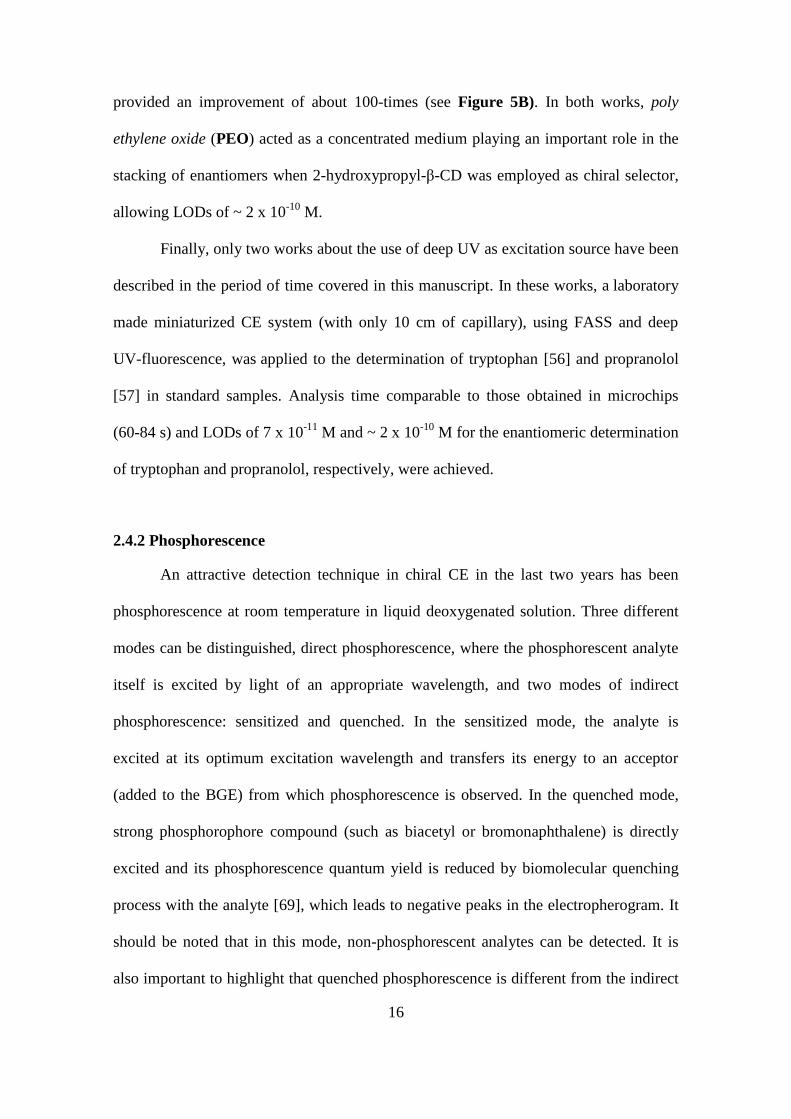
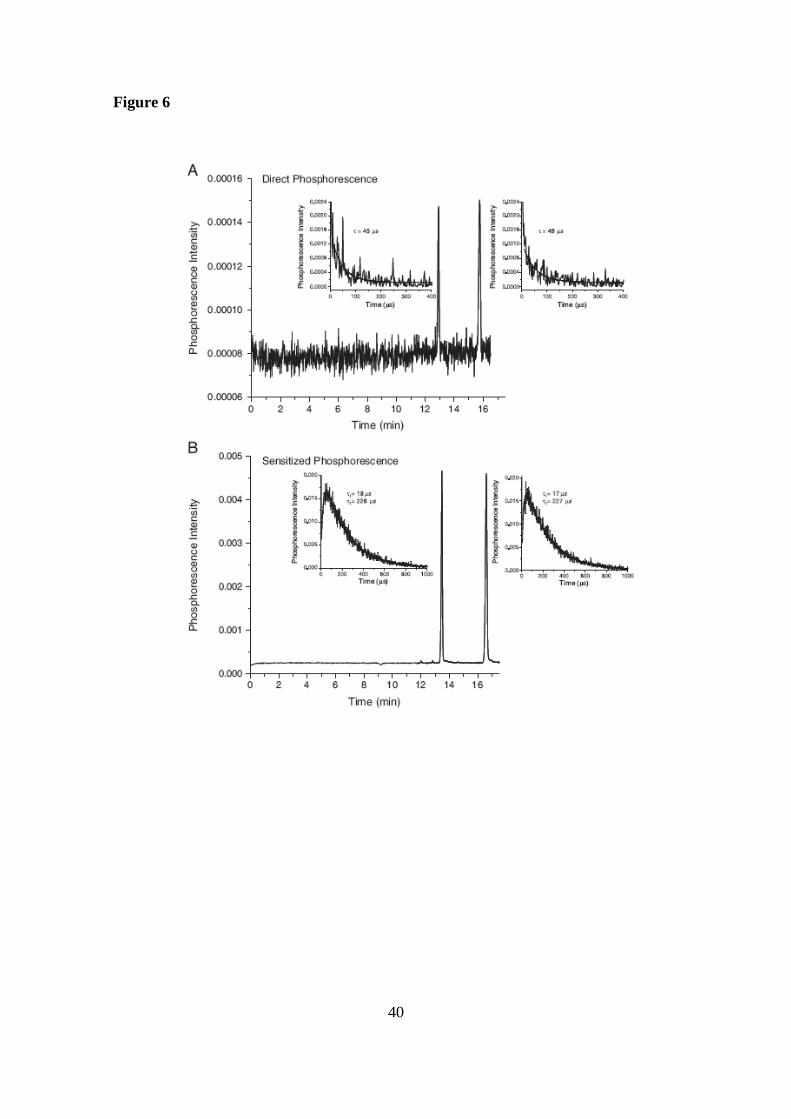
A comparison in terms of sensitivity between direct phosphorescence and
sensitized phosphorescence modes, which were employed as detection systems for the
determination of bupropion enantiomers, is depicted in Figure 6 [60]. As it can be
observed in this figure, an improvement in the sensitivity of 40-times was achieved
using the sensitized phosphorescence mode.
2.4.3 Electrochemiluminescence
CE coupled to Electrochemiluminescence (ECL) detection has extensively been
employed in different fields of analytical chemistry. However, it has rarely been
reported for chiral separations. In spite of the advantages in sensitivity and simplicity
inherent to conventional chemiluminescence methods, one of the shortcomings of ECL
assay is its poor selectivity [70].
A CE-ECL methodology combined with LLE and FASS, as sample treatment
and preconcentration technique, respectively, has been developed to carry out the chiral
determination of dioxopromethazine in human urine samples [61]. Using β-CD as chiral
selector, baseline resolution was obtained in only 13 min, reaching a LOD of 4 x 10⁻⁶
M

18
with 5 mM Ru(bpy)32+
in 100 mM phosphate buffer (pH 8.0) as ECL solution in end-
column detection cell.
2.4.4 Conductivity detectors
CE with contactless conductivity detection (C4D) has progressed in the last years
in terms of applications to different classes of analytes or approaches to the design of
detectors [71]. The detection by C4D can be achieved both off-column and on-column.
However, band broadening due to dead volume is avoided with on-column detection
since the measurement is carried out directly inside the separation capillary. In this
detection system, it is not necessary to remove the protective coating from fused-silica
capillaries and optically non-transparent polymeric tubings may also be employed.
Recently, two CE-C4D methodologies have been developed for the chiral
separation of protein amino acids and/or hydroxy acids [62, 63]. Thus, an EKC-C4D
method has been developed for the enantioseparation of five -hydroxy acids and two
-amino acids (aspartic acid and glutamic acid) using vancomycin as chiral selector
[62]. Resolution values from 1.5 to 3.8 were obtained. The methodology developed in
this work was applied to the determination of lactic acid enantiomers in samples of milk
and yogurt, with LLE sample treatment prior to CE analysis, achieving LODs of 10-6
M
for each enantiomer.
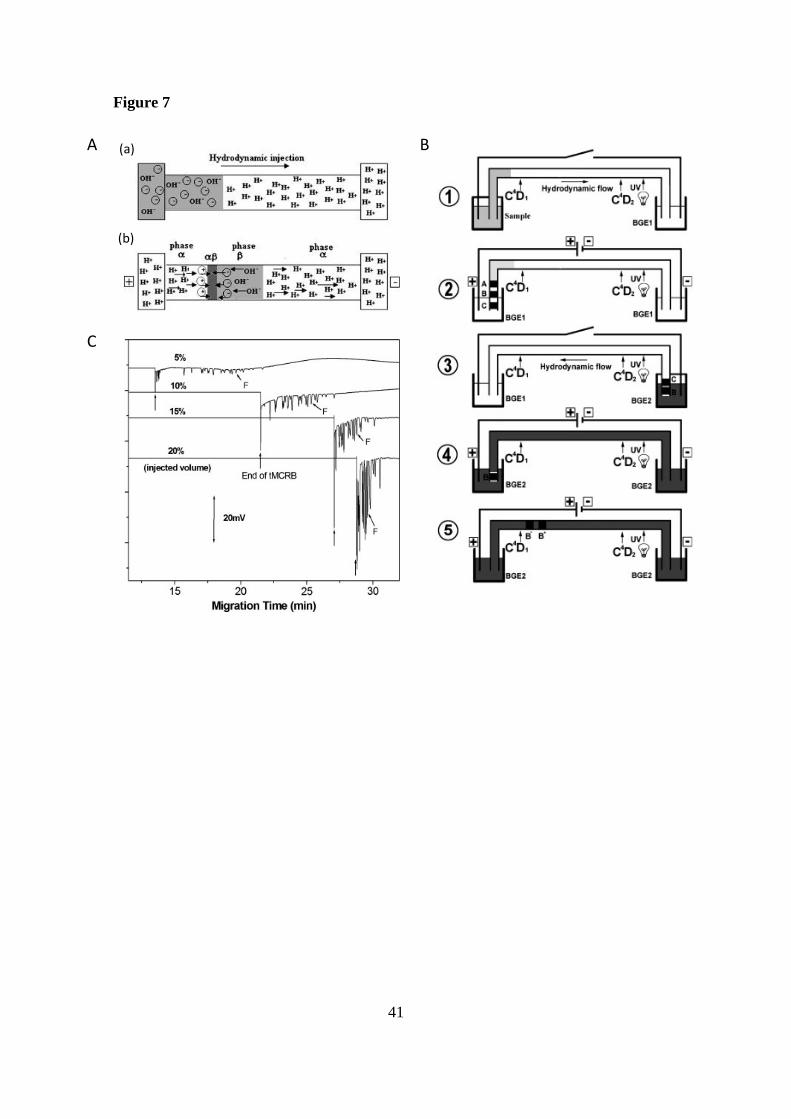
On the other hand, an on-line preconcentration technique of transient moving
chemical reaction boundary (tMCRB) by conductivity detection, with heart-cutting
2D-CE was carried out for the chiral separation of DL-phenylalanine, and DL-threonine
in a mixture of 22 amino acids [63]. The mechanism of focusing by tMCRB (see Figure
7A) is based on a LVSS injection of solutes dissolved in basic medium (phase β)
followed by their on-line focusing in the interface between the sample zone (phase β)
19
and the BGE zone (phase ). Then, a reaction of neutralization of the analytes occurs
between the weak acidic zone (phase ) and the weak alkaline zone (phase β). The
stacked fraction from the first dimension is isolated in the capillary, and separated in the
second dimension by the presence of a chiral selector ((+)-(18-crown-6)-2,3,11,12-
tetracarboxylic acid) as it can be observed in Figure 7B. The use of tMCRB
preconcentration technique improved the LOD by a factor of 10 and 250 for
phenylalanine and threonine, respectively. Figure 7C shows the enhancement of
sensitivity of phenylalanine using different injection volumes in tMCRB. An injection
volume of 10 % was selected as optimum since a higher volume would require the use
of longer capillaries for keeping a sufficient electrophoretic separation increasing the
total analysis time.
2.4.5 MS
One of the major breakthroughs of CE for the determination of chiral analytes in
real matrices has been its online coupling to MS using ESI interfaces [21]. In fact, the
hyphenation of chiral CE with MS is a powerful technique able to determine the
enantiomers of chiral compounds with high selectivity and sensitivity. In addition, it is
also able to solve the identification problems associated with unknown compounds in
real samples since MS allows an unambiguous assignment of the different
electrophoretic peaks and MS/MS spectra can also provide information about the
structure of the analytes [20]. CE-MS is, along with CE-LIF, one of the most employed
detection system for enhancing sensitivity in chiral CE by EKC [64-67] as it can be
observed in Table 3.
One of the main drawbacks of chiral analysis by CE-MS is the contamination of
the ionization source by non-volatile chiral selectors. For this reason, the CE-MS

20
approaches developed in the last two years employ different strategies to avoid the
contamination of the source. So, besides using the strategies of PFT [64, 65], the use of
a very low concentration of chiral selector in EKC [66, 67], or a non ionizable chiral
surfactant in MEKC [72] has been employed. Regarding MEKC mode, molecular
micelles have a high weight allowing to have lower surface activity and volatility with
essentially no background ions, which also enables to enhance the ESI-MS intensity.
Thus, although the LOD was ~ 3 x 10⁻⁵
M, it was 3-5 times better than those obtained
using UV detection.
The enantioseparation of five chiral dipeptides in spiked serum samples was
optimized by an EKC-ESI-MS methodology employing a PFT strategy [64]. Chiral
separations with resolutions above 2.4 in 45 min were obtained, ranging the LODs
obtained from 5 to 20 x 10-8
M. More recently, an EKC-ESI-MS/MS method with PFT
was developed for the chiral separation of three neurotoxins derived from 1,2,3,4-
tetrahydroisoquinoline with the aim of investigating the in vitro formation of one of
these neurotoxins, namely (R/S)-N-methylsalsolinol [65]. This work combines the
strategies of PFT and CMT using an anionic CD (sulfated β-CD) as chiral selector, so
that it migrated away from the MS ionization source during the separation, avoiding
completely a possible contamination. Fast separations (less than 15 min), high
resolutions (from 3.0 to 4.5) and enough sensitivity (LODs about 10-6
M level) were
obtained.
On the other hand, the direct introduction of the chiral selector at very low
concentration has demonstrated to be a strategy that simplifies the PFT methodology
without a significant contamination or loss in sensitivity [66, 67]. Following this idea,
the enantioseparation of five protein amino acids by EKC-ESI-MS was carried out
using a low quantity of modified β-CDs (0.5 mM) [66]. The sensitivity was only 3–5

21
times decreased by the chiral selector giving LODs of 2-19 x 10-7
M, which are higher
than those obtained by a CE-LIF method developed under the same conditions (LODs
from 4-9 x 10⁻⁸
M). The usefulness of the chiral CE-MS method was demonstrated
through the detection of the main D- and L-amino acids found in different real samples
including transgenic versus wild soy and vinegar. The same strategy was applied for the
enantioseparation of the non-protein amino acid carnitine by EKC-ESI-MS2 [67]. A
concentration of only 0.2% (w/v) of succinyl-γ-CD was used to carry out the
enantioseparation. Resolution about 3 and a LOD of 6 x 10⁻⁸
M were obtained, which
was enough to detect enantiomeric impurities up to 0.002% of D-carnitine with respect
to the main enantiomer (L-carnitine) in pharmaceuticals. Figure 8 shows the
enantioseparation of carnitine in a pharmaceutical formulation in which the lowest
percentage of D-carnitine (0.6 %) out of all the samples analyzed, was detected.
In the last two above-described methodologies, the amino acids studied were
labeled with FITC [66] or FMOC [67]. This fact is because of although MS does not
imply derivatization strategies, for small molecules such as amino acids, the increase in
their sizes allows an improvement in the sensitivity because they appear in a higher
range of m/z where the S/N is lower.
Finally, the coupling CE-ICP-MS has been employed, for the first time, for the
development of a chiral methodology for the separation of the enantiomers of the
hormone thyroxine in pharmaceuticals [68]. The method was based on ligand-exchange
mechanism using a Cu(II)/L-proline complex as chiral selector and the monitoring of
iodine (127
I) as specific detection. The chiral separation was achieved in less than 15
min with a resolution around 4 and the LODs obtained (~ 4 x 10⁻⁷
) were similar to those
reached by conventional UV detection.
22
3. Microchips
Chiral microchip CE is gaining popularity due to the development of simple
micro-fabrication methods [73]. The high electric fields in combination with the short
separation lengths can produce analysis times of seconds. However, microchip CE also
suffers from low sensitivity for similar reasons as in conventional CE and very few
works have been reported using UV detection. For instance, using a microchip EKC-
UV method for the enantioseparation of the drug naproxen employing methyl-β-CD as
chiral selector, the LOD was 10-5
M which is 2.5 times lower that the LOD obtained,
under similar conditions, by conventional EKC-UV [74]. Nevertheless, the separation of
(R,S)-naproxen by microchip CE was achieved in just 20 s with better resolution and
similar precision than EKC-UV, showing the potential of this device.
The trend in chiral microchip electrophoresis, as in conventional chiral CE, is
the combination of different strategies to improve the sensitivity in order to carry out its
application in the analysis of real samples, which have had little attention up to now.
Thus, Huang et al. [75] have developed a microchip MEKC-LIF methodology for the
chiral separation of tyrosine previously derivatized with FITC. The enantioresolution
was obtained in around 2 min with a LOD of 3 x 10⁻⁸
M which allowed the
determination of D-tyrosine in human plasma samples previously extracted by LLE.
4. Concluding remarks
This review article summarizes the developments reported to enhance the
sensitivity in enantioseparations by CE in the last two years and their main applications.
CE offers a very high flexibility for enantiomeric separations, due to the wide variety of
chiral selectors that can be used into the CE systems and the different working modes

23
that can be employed. EKC and MEKC were the most employed modes to achieve
enantioseparations by CE although ACE has also been employed.
CE needs of powerful strategies to increase the limited sensitivity of
detection achieved in enantioseparations. Thus, techniques based on effective off-line
and on-line sample pretreatment offer enhanced sensitivity and selectivity. In addition,
the development of micro-extraction techniques allows faster and cheaper procedures
than the conventional ones in terms of solvent and preconcentration factor. In this
regards, enrichments up to 6800-fold have been achieved.
Among the on-line capillary preconcentration techniques, stacking has
predominated because of its relative simplicity compared to other procedures such as
sweeping, achieving significant improvements in sensitivity when a combination of two
sample preconcentration techniques are used, for example, LVSS and ASEI, for which
the best LODs was obtained (up to 2 x 10⁻⁹
M).
However, it is clear that the major trend in the last two years has been the use of
chiral CE methodologies using alternative and more sensitive detection methods than
UV detection, mainly LIF or MS detection. It should be noted that, combinations of
these kind of detectors with other strategies to increase the sensitivity such as, off-line
sample treatment techniques and on-line preconcentration techniques, especially
combinations of two or more of them, is expected to have greater impact on the future
work because LODs up to 10-12
M have been achieved.
24
Acknowledgements
Authors thank the Spanish Ministry of Science and Innovation (project CTQ2009-
09022) and the Comunidad Autónoma of Madrid (Spain) and European funding from FEDER
programme (project S2009/AGR-1464, ANALISYC-II). They also thank the University of
Alcalá and the Comunidad Autónoma of Madrid for project CCG10-UAH/AGR-5950. Laura
Sánchez-Hernández thanks the Comunidad Autónoma of Madrid for her research contract.
Maria Castro Puyana thanks the Spanish Ministry of Science and Innovation for her Juan de la
Cierva contract (JCI-2009-05297).
25
References
[1] Chankvetadze, B., J. Chromatogr. A 2007, 1168, 45–70.
[2] Fanali, S., Electrophoresis 2009, 30, S203–S210.
[3] Mikus, P., Maráková, K., Electrophoresis 2009, 30, 2773-2802.
[4] Kirschner, D. L., Green, T. K., J. Sep. Sci. 2009, 32, 2305-2318.
[5] Prokhorova, A. F., Shapovalova, E.N., Shpigun, O.A., J. Pharm. Biomed. Anal.
2010, 53, 1170-1179.
[6] Suntornsuk, L., Anal. Bioanal. Chem. 2010, 398, 29-52.
[7] Sekhon, B. S., Int, J. Pharm. Tech. Res. 2010, 2, 1584-1594.
[8] Herrero, M., García-Cañas, V., Simó, C., Cifuentes, A., Electrophoresis 2010,
31, 205-228.
[9] Pérez-Fernández, V., García, M. A., Marina, M. L., J. Chromatogr. A 2010,
1271, 968-989.
[10] Caslavska, J., Thormann, W., J. Chromatogr. A 2011, 1218, 588-601.
[11] Schmid, M. G., Gübitz, G., Anal. Bioanal. Chem.2011, 400, 2305-2316.
[12] Lu, H., Chen. G., Anal. Methods 2011, 3, 488-508.
[13] Gubitz, G., Schmid, M. G., J. Chromatogr. A 1997, 792, 179-225.
[14] Chankvetadze, B., J. Chromatogr. A 1997, 792, 269-295.
[15] Chankvetadze, B., Blaschke, G, J. Chromatogr. A 2001, 906, 309-363.
[16] Kastsova, L. A., Bessonova, E. A., J. Anal. Chem. 2009, 64, 326-337.
[17] Almeda, S., Arce, L., Valcárcel, M., Curr. Anal. Chem. 2010, 6, 126-143.
[18] Mikus, P., Maráková, K., Curr. Anal. Chem. 2010, 6, 76-100.
[19] Somsen, G. W., Mol, R., de Jong, G. J., J. Chromatogr. A 2010, 1217, 3978-
3991.
[20] Simó, C., García-Cañas, V., Cifuentes, A., Electrophoresis 2010, 31, 1442-1456.

26
[21] Pantucková, P., Gebauer, P., Bocek, P., Krivánková, L., Electrophoresis 2011,
32, 43-51.
[22] Breadmore, M. C., Dawod, M., Quirino, J. P., Electrophoresis 2011, 32, 127-
148.
[23] Malá, Z., Genauer, P., Bocek, P., Electrophoresis 2011, 32, 116-126.
[24] García-Ruiz, C., Marina, M. L., Electrophoresis 2006, 27, 195-212.
[25] Sánchez-Hernández, L., Crego, A. L., Marina, M. L., García-Ruiz, C.,
Electrophoresis 2008, 29, 237-251.
[26] Sánchez-Hernández, L., García-Ruiz, C., Marina, M. L., Crego, A. L.,
Electrophoresis 2010, 31, 28-43.
[27] Tanaka,Y., Terabe, S., J. Chromatogr. A 1995, 694, 277-284.
[28] Chankvetadze, B., Endresz, G., Blaschke, G., Electrophoresis 1994, 15, 804-
807.
[29] Borges, K. B., Pupo, M. T., Bonato, P. S., Electrophoresis 2009, 30, 3910-3917.
[30] Barth, T., Pupo, M. T., Borges, K. B., Okano, L. T., Bonato, P. S.,
Electrophoresis 2010, 31, 1521-1528.
[31] Wei, W.-L., Guo, B.-Y., Lin, J.-M., J. Chromatogr. A 2009, 1216, 1484-1489.
[32] Ye, H., Yu, L., Xu, X., Zheng, C. Lin, W., Liu, X., Chen, G., Electrophoresis
2010, 31, 2049-2054.
[33] Karazniewicz-Lada, M., Luczak, M., Glówka F., Xenobiotica 2009, 39, 476-485.
[34] Kodama, S., Morikawa, A., Nakagomi, K., Yamamoto, A., Sato, A., Suzuki, K.,
Yamashita, T., Kemmei, T., Taga, A., Electrophoresis 2009, 30, 349-356.
[35] Majid, E., Male, K. B., Tzeng, Y.-M., Omamogho, J. O., Glennon, J. D., Luong,
J. H. T., Electrophoresis 2009, 30, 1967-1975.
[36] Nojavan, S., Fakhari, A. R., J. Sep. Sci. 2010, 33, 3231-3238.
27
[37] Wang, Z., Liu, C., Kang, J., J. Chromatogr. A, 2011, 1218, 1775-1779.
[38] Vandervlis, E., Mazereeuw, M., Tjaden, U., Irth, H., Vandergreef, J., J.
Chromatogr. A 1994, 687, 333-341.
[39] Ramautar, R., Somsen, G. W., de Jong, G. J., Electrophoresis 2010, 31, 44-54.
[40] Li, S., Weberm S.G., Anal. Chem. 1997, 69, 1217-1222.
[41] Pedersen-Bjergaard, S., Rasmussen, K. E., Electrophoresis 2000, 21, 579-585.
[42] Pedersen-Bjergaard, S., Rasmussen, K. E., J. Chromatogr. A 2006, 1109, 183-
190.
[43] Pentoney, S. L., Huang, X., Bur, D. S., Zare, R. N., Anal. Chem. 1988, 60, 2625-
2629.
[44] Choi, K., Kim, J., Jang, Y.O., Chung, D. S., Electrophoresis 2009, 30, 2905-
2911.
[45] Choi, K., Kim, S. J., Jin, Y. G., Jang, Y. O., Kim, J.-S., Chung, D. S., Anal.
Chem. 2009, 81, 225-230.
[46] Ibrahim, W. A. W., Hermawan, D., Sanagi, M. M., Aboul-Enein, H. Y.,
Chromatographia 2010, 71, 305-309.
[47] Vinther, A., Everaerts, F. M., Sareberg, H., J. High Resolut. Chrom. 1990, 13,
639-642.
[48] Quirino, J. P.; Terabe, S., Science 1998, 282, 465-68.
[49] Aranas, A.T., Guidote, A. M., Quirino, J. P., Anal. Bioanal. Chem. 2009, 394,
175-185.
[50] Li, H., Li, C., Yan, Z.-Y., Yang, J., Che, H., J. Neurosci. Methods 2010, 189,
162-168.
[51] Liang, G., Choi, K., Ahmed, A. Y. B. H., ALOthman, Z. A., Chung, D. S., Anal.
Chim. Acta 2010, 677, 37-42.
28
[52] Wang, S., Fan, L., Cui, S., J. Sep. Sci. 2009, 32, 3184-3190
[53] Li, S., Yu, Q., Lu, X., Zhao, S., J. Sep. Sci. 2009, 32, 282-287.
[54] Tseng, W.-L., Hsu, C.-Y., Wu, T.-H., Huang S.-W., Hsieh, M.-M.,
Electrophoresis 2009, 30, 2558-2564.
[55] Lin, K.-C., Hsieh, M.-M., Chang, C.-W., Lin, E.-P., Wu, T.-H., Talanta 2010,
82, 1912-1918.
[56] Belin, G. K., Gärtner, V., Seeger S., J. Chromatogr. B 2009, 877, 3753-3756.
[57] Belin, G. K., Seeger, S., Electrophoresis 2009, 30, 2565-2571.
[58] Lammers, I., Buijs, J., van der Zwan, G., Ariese, F., Gooijer, C., Anal. Chem.
2009, 81, 6226-6233.
[59] Lammers, I., Buijs, J., Ariese, F., Gooijer, C., Anal. Chem. 2010, 82, 9410-9417.
[60] Castro-Puyana, M., Lammers, I., Buijs, J., Gooijer, C., Ariese, F.,
Electrophoresis 2010, 31, 3928-3936.
[61] Li, X., Song, B., Yuan, B., Sun, J., You, T., Chromatographia 2009, 70, 1291-
1293.
[62] Pormsila, W., Gong, W. Y., Hauser, P. C., Electrophoresis 2010, 31, 2044-2048.
[63] Anouti, S., Vandenabeele-Trambouze, O., Cottet, H., Electrophoresis 2010, 31,
1029-1035.
[64] Xia, S., Zhang, L., Lu, M., Qiu, B., Chi, Y., Chen, G., Electrophoresis 2009, 30,
2837-2844.
[65] Wu, H., Yuan, B., Liu, Y.-M., J. Chromatogr. A, 2011, 1218, 3118-3123.
[66] Giuffrida, A., León, C., García-Cañas, V., Cucinotta, V., Cifuentes, A.,
Electrophoresis 2009, 30, 1734-1742.
[67] Sánchez-Hernández, L., García-Ruiz, C., Crego, A. L., Marina, M. L., J. Pharm.
Biomed. Anal. 2010, 53, 1217-1223.
29
[68] Kang, J., Kutscher, D., Montes-Bayón, M., Blanco-González, E., Sanz-Medel,
A., Electrophoresis 2009, 30, 1774–1782.
[69] Kuijt, J., Ariese, F., Brinkman, U. A. T., Gooijer C., Anal. Chim. Acta 2003,
488, 135-177.
[70] Guo, L., Fu, F., Chen, G., Anal. Bioanal. Chem. 2011, 399, 3323-3343.
[71] Kuban, P., Hauser, P. C., Electrophoresis 2011, 32, 30-42.
[72] Wang, B., He, J., Shamsi, S. A., J. Chromatogr. Sci. 2010, 48, 572-583.
[73] Nagl, S., Schulze, P., Ludwig, M., Belder, D., Electrophoresis 2009, 30, 2765-
2772.
[74] Guihen, E., Hogan, A.-M., Glennon, J. D., Chirality 2009, 21, 292-298.
[75] Huang, Y., Shi, M., Zhao, S., Liang, H., J. Chromatogr. B 2011, 879, 191-196.

30
Figure captions
Figure 1. (A) Schematic illustration of the setup for EME. (B) Electropherograms
obtained after EME from spiked with amlodipine and drug-free human urine and
plasma (spiked sample solution: 50 ng/mL of each enantiomer). Extraction conditions:
HCl 10 mM as the acceptor and donor phases, 200 V voltage, 1000 rpm stirring rate,
SLM: nitrophenyl octylether. Electrophoretic conditions: fused silica capillary, 60 cm
total length (50 cm effective length) and 75 µm id; BGE, 100 mM phosphate buffer (pH
2.0) containing 5 mM HP- -CD; applied voltage, +20 kV; temperature, 25ºC; injection,
60 mbar for 5 s; UV detection, 214 nm. Peaks, R-amlodipine and S-amlodipine.
Reprinted from [36] with permission. Copyright Wiley-VCH Verlag BmbH KGaA.
Figure 2. (A) Procedure of SDME-CE: (1) Injection of the organic phase (octanol), (2)
2-phase drop formation by ejection of the organic phase (include the image of a 2-layer
drop formation), (3) extraction of the sample in the donor phase into the acceptor phase,
and (4) injection of the enriched acceptor phase into the capillary for CE chiral
separation (reprinted from [45]. Copyright (2009), with permission from ACS); (B)
Comparison of the electropherograms for the buffer acceptor concentration in urine
sample enriched by 10 min SDME: (a) standard solution (pH 13.7) to the acceptor phase
of 50 mM Bis-Tris/CA (pH 4.0), (b) urine (pH 13.7) to 50 mM Bis-Tris/CA (pH 4.0),
and (c) urine (pH 13.7) to 120 mM Bis-Tris/CA (pH 4.0). Electrophoretic conditions:
fused silica capillary, 60 cm total length (50 cm effective length) and 50 µm id; BGE,
50 mM Bis-Tris/CA containing 0.8 mM 18C6H4 (pH 4.0); applied voltage, +25 kV;
temperature, 25ºC; injection, 0.3 psi for 5 s; UV detection, 200 nm. Peaks: (1) 500 nM

31
amphetamine, (2) 200 nM p-chloroamphetamine, (3) 600 nM 2-amino-1,2-
diphenylethanol, (*) creatinine. Reprinted from [44] with permission. Copyright Wiley-
VCH Verlag BmbH KGaA.
Figure 3. (A) Schematic representation for LVSS-ASEI and enantioseparation: (i)
filling the capillary with the buffer containing vancomycin (); (ii) hydrodynamic
injection of the sample by pressure; (iii) stacking the sample and removing the water
plug by EOF and injection of more sample by ASEI; (iv) enantioseparation. (B) and
(C) Electropherograms for enantioseparation of FMOC-Ala, fenoprofen (Feno) and
other FMOC-amino acids after sample concentration with LVSS-ASEI. Conditions:
fused silica capillary, 50 µm id × 39 cm (29 cm to detection window); BGE used for
filling the capillary before injection, 100 mM Tris–H3PO4 (pH 6.0) containing 2
mmol/L vancomycin; BGE used for separation, 100 mM Tris–H3PO4 (pH 6.0); samples
was injected by pressure at 34.47 mbar for 8 min, followed by electrokinetic injection
by applying voltage of −5 kV for 12.5 min; detection wavelength, 214 nm; column
temperature, 20ºC; applied voltage for separation, −15 kV. Concentrations for each
enantiomer: fenoprofen (Feno), 2.5 ng/mL, and all FMOC-amino acids, 13.5 ng/mL.
Adapted from [37]. Copyright (2011), with permission from Elsevier.
Figure 4. (A) Electropherograms of FITC-AAs (a) 250 nM without SDME (b) 2.5 nM
enriched by 10 min SDME. (B) Electropherograms of 2.5 nM FITC-AAs (a) enriched
by 10 min SDME without stirring, and (b) enriched by 10 min SDME with stirring.
Electrophoretic conditions: fused silica capillary, 60 cm total length (50 cm effective
length) and 25 µm id; BGE, 80 mM borate (pH 9.3) + 12 mM β-CD + 8 mM STC;
applied voltage, +25 kV; temperature, 25ºC; injection, 0.3 psi for 2 s; LIF detection, 488

32
and 520 nm (excitation and emission wavelengths). Peaks: 1. D-Leu, 2. L-Leu, 3. D-
Ala, 4. L-Ala, 5, D-Glu, 6. D-Asp, 7. L-Glu, 8. L-Asp. Reprinted from [51]. Copyright
(2010), with permission from Elsevier.
Figure 5. (A) Electropherograms of 0.1 µM CBI-DL-amino acids by on-line
preconcentration when the sample was hydrodynamic injected at 20-cm height for (a) 3
s, (b) 90 s (c) 120 s and (d) 180 s. Electrophoretic conditions: fused silica capillary, 50
cm total length (40 cm effective length) and 75 µm id; Before separation, the capillary
was filled with a solution of 100 mM tris-borate, 50 mM HP-β-CD, and 150 mM SDS,
whereas buffer vials contain 0.5% w/v PEO, 20 mM tris-borate, 150 mM SDS, and 50
mM HP-β-CD; applied voltage, +10 kV; temperature, 25ºC; LIF detection, 410 nm
(excitation wavelength). Peaks: 1. D-Val; 2. L-Val; 3. D-Ile; 4. D-Ile; 5. D-Leu; 6. L-
Leu. Reprinted from [54] with permission. Copyright Wiley-VCH Verlag BmbH
KGaA. (B) Electropherograms of 0.1 µM NAD-DL-Asp enantiomers by on-line
preconcentration when were hydrodynamic injected (a) 25 nL, (b) 150 nL, (c) 300 nL,
and (d) 600 nL of the sample. Electrophoretic conditions: fused silica capillary, 60 cm
total length (50 cm effective length) and 75 µm id; Before separation, the capillary was
filled with a solution of 150 mM tris-borate, 60 mM HP-β-CD, and 150 mM SDS,
whereas buffer vials contain 0.6% w/v PEO, 150 mM tris-borate, 150 mM SDS, and 60
mM HP-β-CD; applied voltage, +8 kV; temperature, 25ºC; LIF detection, 410 nm
(excitation wavelength). Peaks: 1. D-Val, 2. L-Val. Reprinted from [55]. Copyright
(2010), with permission from Elsevier.

33
Figure 6. Electropherograms showing the separation of bupropion enantiomers (1.5 x
10-5
M each) using direct (A) or sensitized indirect (B) phosphorescence modes. The
decays for the enantiomers at the electrophoretic peak maxima for both detection modes
are also shown. Electrophoretic conditions: fused silica capillary, 90 cm total length (50
cm effective length) and 75 µm id; BGE, without biacetyl (A) or with 2 x 10⁻⁴
M
biacetyl (B) with 5 mM sulfated- -CD in 25mM phosphate (pH 3.0); applied voltage,
-20 kV; temperature, 20ºC; injection, 50 mbar for 0.16 min; Phosphorescence detection,
266 nm (excitation wavelengths); neutral density filter, 3%; cut-off filter, 300 nm; band
pass filter, (A) 415–585 or (B) 490–600 nm. The BGE was purged with nitrogen to
remove oxygen. Reprinted from [60] with permission. Copyright Wiley-VCH Verlag
BmbH KGaA.
Figure 7. (A) Mechanism of focusing by tMCRB. (a) Injection of analytes (anionic)
diluted in alkaline phase (ammonium formate, phase β) by hydrodynamic pressure. The
electrolyte of separation is acidic (phase ). (b) Formation of β boundary where the
analytes stack by application of a voltage. It symbolized the reaction of neutralization
between weak acidic phase consisting of acetic acid (H+) and weak alkaline phase
consisting of ammonium formate (OH-). Analytes are anionic in phase β and cationic in
phase . (B) Principle of the on-line tMCRB preconcentration combined with heart-
cutting 2D-CE for the achiral (first dimension) and chiral separation (second dimension)
of complex mixtures in a single capillary: (1) Hydrodynamic injection of the sample
diluted in alkaline phase for tMCRB preconcentration; (2) Achiral separation of stacked
amino acids and evacuation of fraction A in the first dimension; (3) Introduction of the
second dimension electrolyte (BGE 2) by hydrodynamic flow; (4) Isolation of fraction

34
B in the capillary after evacuation of fraction C by the inlet end of the capillary; (5)
chiral resolution of the fraction B in the second dimension of the separation. (C)
Electropherograms showing the on-line focusing by tMCRB in non-chiral CE
separation of a mixture containing 22 native amino acids at 1 mM of each enantiomer
for different hydrodynamic injection volumes: 50 psi for 0.4 min (5% of the total
capillary volume); for 0.8 min (10%); for 1.2 min (15%,), for 1.6 min (20%).
Electrophoretic conditions: fused silica capillary, 60 cm total length (46.6 cm effective
length) and 10 µm id; BGE, 2.3 M acetic acid; applied voltage, +30 kV; temperature,
25ºC; Conductivity detection. Peak F, DL-Phe. Reprinted from [63] with permission.
Copyright Wiley-VCH Verlag BmbH KGaA.
Figure 8. CE-ESI-MS2 EIE for a pharmaceutical sample and the corresponding MS
2
spectra for the peaks of L- and D-carnitine. Electrophoretic conditions: fused silica
capillary, 100 cm total length and 50 µm id; BGE, 0.5 M ammonium formate (pH 2.5)
with 0.2% (m/v) succ-γ-CD; applied voltage, +25 kV; temperature, 25ºC; injection by
pressure at 50 mbar×12 s. ESI conditions: positive ion mode; spray voltage, 4.5 kV;
sheath liquid, isopropanol/water (50/50 v/v) with 0.1% formic acid at 3.3 µL/min;
drying gas flow, 5 L/min; drying temperature, 300 ◦C; nebulizer pressure, 2 psi;
compound stability, 50%. MS2 transitions, 384→179 m/z; width, 4 m/z; fragmentation
amplitude, 1.20 V. Reprinted from [67]. Copyright (2010), with permission from
Elsevier.
35
A
BBlank urine Blank plasma
Spiked urine Spiked plasma
Figure 1.

36
A
B
c)
b)
a)
Figure 2

37
Figure 3
(A)
(B)
(C)
Ala
38
A B
Figure 4

39
A
B
Figure 5
40
Figure 6
41
Figure 7
(a)
(b)
A
C
B

42
Figure 8

43
Table 1. Off-line sample treatment techniques employed for the enhancement of the sensitivity in chiral analysis by CE-UV.
Sample
treatment
CE mode
(λ detection) Chiral analyte Sample BGE LOD (M) Ref.
LLE EKC
(208 nm)
Propranolol, 4-hydroxypropranolol Czapek culture
medium
25 mM triethylamine/phosphoric acid (pH 9.0)
+ 4% (w/v) CM-β-CD
~ 1 x 10⁻⁷
29
LLE EKC
(200 nm)
Midodrine, desglymidodrine Czapek culture
medium
70 mM acetate (pH 5.0)
+ 30 mM TM-β-CD
~ 1 x 10⁻⁷
30
LLE EKC
(214 nm)
Trihexyphenidyl, primaquine,
Sulconazole, cetirizine
Rabbit blood
20 mM phosphate in water (pH 3.0)
PFT: 20 mM phosphate in DMSO/water (40/60,
v/v) (pH 3.0) + 10% (w/v) amylose (2 psi x 240 s)
~ 3 x 10⁻⁷
31
LLE ACE
(200 nm)
Tetrahydropalmatine
Herbs 20 mM phosphate (pH 7.4)
PFT: 50 µM BSA (50 mbar x 100s)
~ 2 x 10⁻⁸
32
SPE EKC
(220 nm)
Ibuprofen, (R,S)-29-
hydroxyibuprofen, (RR,RS,SR,SS)-
29-carboxyibuprofen
Human Urine 20 mM triethanoloamine/phosphoric acid (pH 5.0)
+ 50 mM TM-β-CD
~ (2-24) x 10-7
33
SPE EKC
(260 nm)
Nicotine, cotinine, nornicotine,
anatabine, anabasine
Cigarettes 30 mM acetate (pH 5.0)
+ 8% (w/v) S-β-CD
~ (9-20) x 10-7
34
SLE EKC
(243 nm)
Methyl antcinate B, Antcin B,
Zhankuic acid C, Antcin A, Antcin C
Antrodia
camphorata
fungus
20 mM borate (pH 9.3) + 5 % DMF
+ 20 mM M-β-CD + 30 mM SB-β-CD
~ (1-9) x 10-6
35
LPME EKC
(214 nm)
Amlodipine Plasma and
human urine
100 mM phosphate (pH 2.0)
+ 5 mM HP- -CD
~ 7 x 10⁻⁹
36
Derivatization
with FMOC
EKC
(214 nm)
Fenoprofen,
Ala, Leu, Met, Phe, Ser, Val
River water 100 mM Tris–phosphate (pH 6.0)
+ 2 mM vancomycin
~ (2-21) x 10-9
37
Ala, Alanine; Arg, arginine; Asn, asparagine; Asp, aspartic acid; CM-β-CD, carboxymethyl-β-CD; DNS, dansyl; His, histidine; HP- -CD: 2-hydroxypropyl- -CD; HP-γ-
CD, 2-hydroxypropyl-γ-CD; Ile, isoleucine; Leu, leucine; Lys, lysine; M-β-CD, methyl-β-CD; MeOH, methanol; Met, methionine; Phe, phenylalanine; S-β-CD, sulphated-
β-CD; SB-β-CD, sulfobutylether-β-CD; Ser, serine; Thr, Threonine; TM-β-CD, heptakis (2, 3, 6-tri-O-methyl)-β-CD;; Trp, tryptophan; Tyr, tyrosine; Val, valine.

44
Table 2. On-line sample preconcentration techniques employed to enhance the sensitivity in chiral analysis by CE-UV.
Concentration
strategy
CE mode
(λ detection) Analyte Sample BGE Injection conditions LOD (M) Ref.
LVSS-ASEI EKC
(214 nm)
Fenoprofen, Ala, Leu,
Met, Phe, Ser, Val
River water 100 mM Tris– phosphoric acid (pH 6.0)
+ 2 mM vancomycin
Injection: 34.45 mbar x 8 min,
and -5 kV x 12.5 min
Sample solvent: H2O
(2-21) x 10-9
37
NSM EKC
(208 nm)
Propranolol,
4-hydroxypropranolol
Czapek
culture
medium
25 mM triethylamine/phosphoric acid (pH 9.0)
+ 4% (w/v) CM-β-CD
Injection: 50 mbar x 20 s
Sample solvent: 1/10 buffer
~ 10-7
29
FASS EKC
(200 nm)
Midodrine,
desglymidodrine
Czapek
culture
medium
70 mM acetate (pH 5.0)
+ 30 mM TM-β-CD
Injection: 10 kV x 5 s, and
water plug: 35 mbar x 5 s
Sample solvent: H2O/MeOH
(10/90 v/v)
~ 10-7
30
FASS ACE
(200 nm)
Tetrahydropalmatine Corydalis
yanhusuo herb
20 mM phosphate (pH 7.4)
PFT: 50 µM BSA (50 mbar x 100s)
Injection: 15 kV x 12 s, and
water plug: 25 mbar x 8 s
Sample solvent: H2O;
~ 2 x 10⁻⁸
32
Sweeping MEKC
(200 nm)
Hexaconazole,
pentaconazole,
myclotbutanil
Standards 25 mM phosphate (pH 3.0) + 50 mM SDS
+ 40 mM HP-γ-CD
Injection: 50 mbar x 70 s
Sample solvent: buffer
without SDS and CD
(3-7) x 10-7
46
Ala, Alanine; CM-β-CD, carboxylmethyl-β-CD; HP-γ-CD, 2-hydroxypropyl-γ-CD; Leu, leucine; MeOH, methanol; Met, methionine; Phe,
phenylalanine; Ser, serine; TM-β-CD, heptakis (2, 3, 6-tri-O-methyl)-β-CD; Val, valine.

45
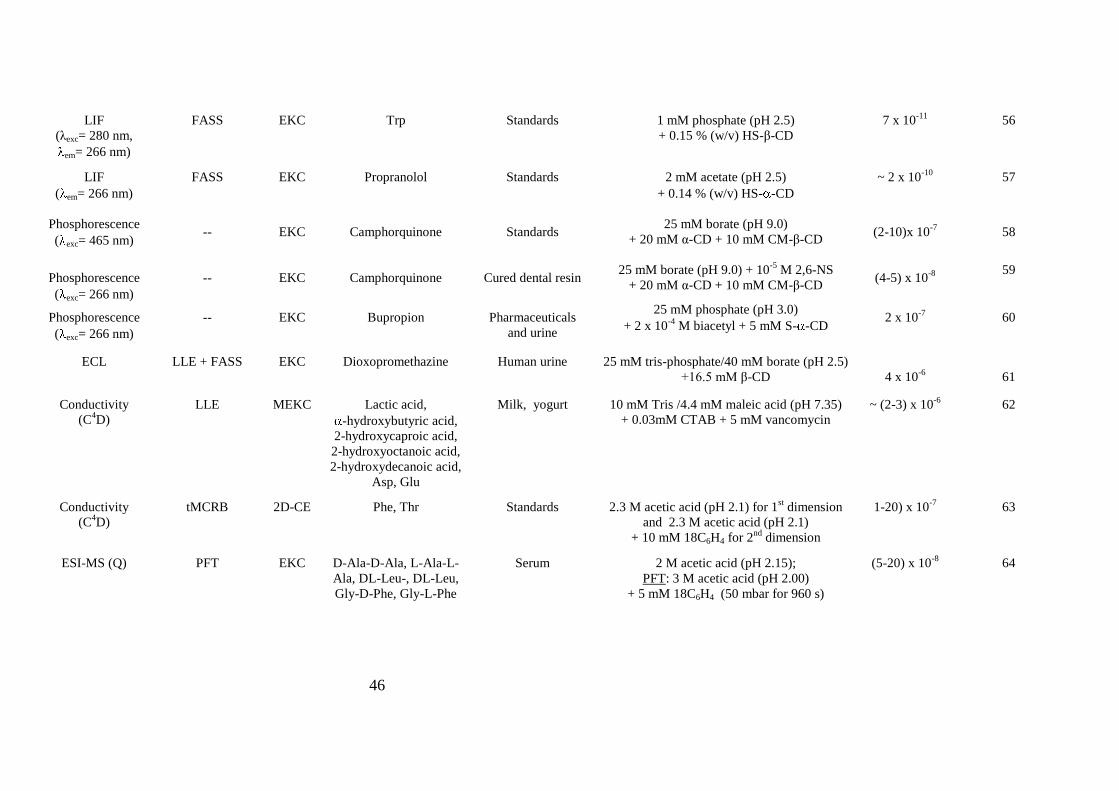
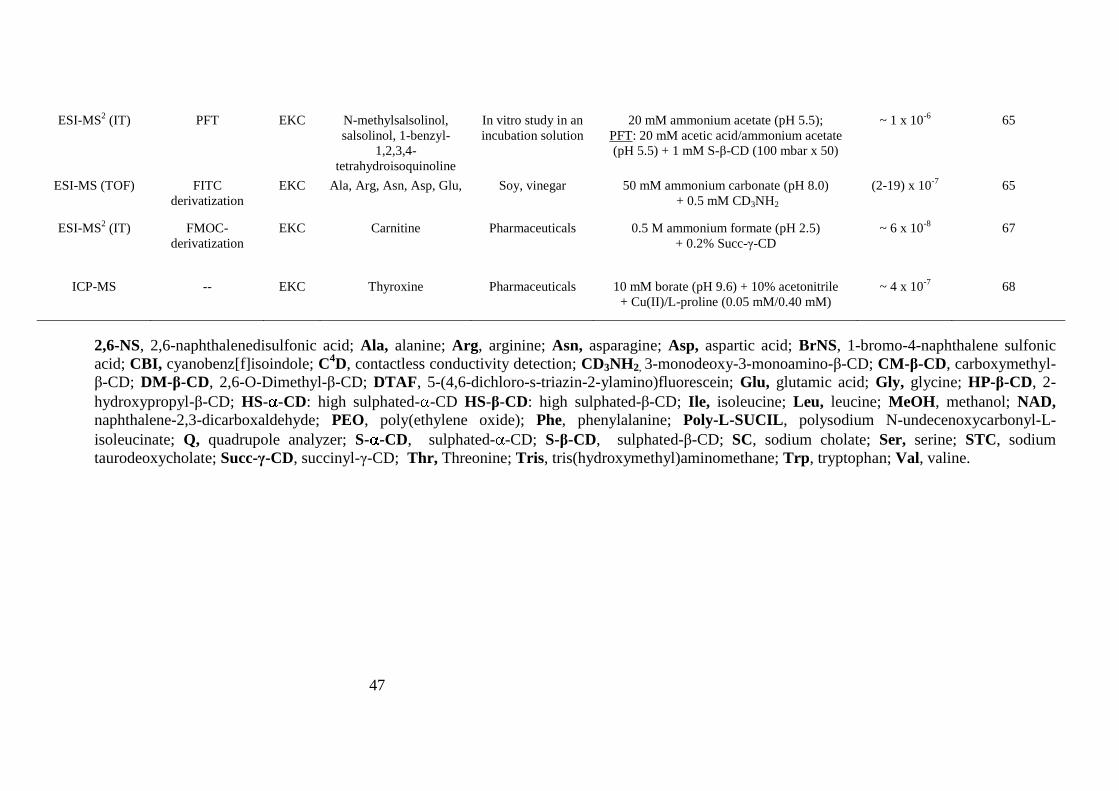
Table 3. Alternative detection systems to UV detector, with or without other strategies, to improve sensitivity detection in chiral analysis by CE.
Detection System Other strategies CE
mode Analyte Sample BGE LOD (M) Ref.
LIF
(λexc = 488 nm) FITC
derivatization
+ off-line
microdialysis
MEKC Ser Extracellular fluid
of rat hypothalamus
15 mM borate (pH 10.2) + 70 mM SDS
+ 5% (v/v) MeOH
+ 17.5 mM HP-β-CD + 5 mM DM-β-CD
~ 1 x 10⁻¹⁰
50
LIF
(λexc= 488 nm,
λem= 520 nm)
FITC
derivatization
+ on-line SDME
MEKC Ala, Asp,
Glu, Leu,
Standards
80 mM borate (pH 9.3)
+ 8 mM STC + 12 mM β-CD
(1-3) x 10-12
51
LIF
( λexc = 488 nm,
λem = 520 mm)
DTAF-
derivatization
MEKC Asp Pharmaceuticals 8 mM borate (pH 8.9) + 10% (v/v) MeOH
+12 mM SC + 0.8% (w/v) HSA
3 x 10⁻¹⁰
52
LIF
( λexc = 488 nm,
λem = 520 mm)
DTAF-
derivatization
MEKC Glu Pharmaceuticals 10 mM borate (pH 9.1) + 5% (v/v) MeOH
+ 12 mM SC + 1.6 % (w/v) HSA 1 x 10
-10
52
LIF
(λexc = 475 nm)
FITC
derivatization
MEKC Ser Midbrain of a
Parkinson's disease
mouse
25 mM borate (pH 9.5) + 50 mM SDS
+ 10 mM γ-CD ~ 2 x 10
-8 53
LIF
(λexc = 410 nm)
CBI derivatization
+ LVSS-sweeping
MEKC Leu, Ile, Val Human urine and
plasma
100 mM tris-borate (pH 9.0) + 150 mM SDS
+ 50 mM HP-β-CD
~ 2 x 10⁻¹⁰
54
LIF
(λexc = 410 nm)
NAD
derivatization
+ LVSS-sweeping
MEKC Asp Cerebrospinal fluid,
soymilk, beer
150 mM tris-borate (pH 9.0) + 150 mM SDS
+ 60 mM HP-β-CD
~ 2 x 10⁻¹⁰
55
46
LIF
(λexc= 280 nm,
em= 266 nm)
FASS EKC Trp Standards 1 mM phosphate (pH 2.5)
+ 0.15 % (w/v) HS-β-CD
7 x 10-11 56
LIF
( em= 266 nm)
FASS EKC Propranolol Standards 2 mM acetate (pH 2.5)
+ 0.14 % (w/v) HS- -CD
~ 2 x 10⁻¹⁰
57
Phosphorescence
( exc= 465 nm) -- EKC Camphorquinone Standards
25 mM borate (pH 9.0)
+ 20 mM α-CD + 10 mM CM-β-CD
(2-10)x 10-7
58
Phosphorescence
( exc= 266 nm)
-- EKC Camphorquinone Cured dental resin 25 mM borate (pH 9.0) + 10
-5 M 2,6-NS
+ 20 mM α-CD + 10 mM CM-β-CD (4-5) x 10
-8
59
Phosphorescence
( exc= 266 nm)
-- EKC Bupropion Pharmaceuticals
and urine
25 mM phosphate (pH 3.0)
+ 2 x 10⁻⁴
M biacetyl + 5 mM S- -CD 2 x 10
-7 60
ECL LLE + FASS EKC Dioxopromethazine Human urine 25 mM tris-phosphate/40 mM borate (pH 2.5)
+16.5 mM β-CD
4 x 10⁻⁶
61
Conductivity
(C4D)
LLE MEKC Lactic acid,
-hydroxybutyric acid,
2-hydroxycaproic acid,
2-hydroxyoctanoic acid,
2-hydroxydecanoic acid,
Asp, Glu
Milk, yogurt 10 mM Tris /4.4 mM maleic acid (pH 7.35)
+ 0.03mM CTAB + 5 mM vancomycin
~ (2-3) x 10-6
62
Conductivity
(C4D)
tMCRB 2D-CE Phe, Thr Standards 2.3 M acetic acid (pH 2.1) for 1st dimension
and 2.3 M acetic acid (pH 2.1)
+ 10 mM 18C6H4 for 2nd
dimension
1-20) x 10-7 63
ESI-MS (Q) PFT EKC D-Ala-D-Ala, L-Ala-L-
Ala, DL-Leu-, DL-Leu,
Gly-D-Phe, Gly-L-Phe
Serum 2 M acetic acid (pH 2.15);
PFT: 3 M acetic acid (pH 2.00)
+ 5 mM 18C6H4 (50 mbar for 960 s)
(5-20) x 10-8
64
47
ESI-MS2 (IT) PFT EKC N-methylsalsolinol,
salsolinol, 1-benzyl-
1,2,3,4-
tetrahydroisoquinoline
In vitro study in an
incubation solution
20 mM ammonium acetate (pH 5.5);
PFT: 20 mM acetic acid/ammonium acetate
(pH 5.5) + 1 mM S-β-CD (100 mbar x 50)
~ 1 x 10⁻⁶
65
ESI-MS (TOF) FITC
derivatization
EKC Ala, Arg, Asn, Asp, Glu,
Soy, vinegar 50 mM ammonium carbonate (pH 8.0)
+ 0.5 mM CD3NH2
(2-19) x 10-7
65
ESI-MS2 (IT) FMOC-
derivatization
EKC Carnitine Pharmaceuticals 0.5 M ammonium formate (pH 2.5)
+ 0.2% Succ-γ-CD
~ 6 x 10⁻⁸
67
ICP-MS -- EKC Thyroxine Pharmaceuticals 10 mM borate (pH 9.6) + 10% acetonitrile
+ Cu(II)/L-proline (0.05 mM/0.40 mM)
~ 4 x 10⁻⁷
68
2,6-NS, 2,6-naphthalenedisulfonic acid; Ala, alanine; Arg, arginine; Asn, asparagine; Asp, aspartic acid; BrNS, 1-bromo-4-naphthalene sulfonic
acid; CBI, cyanobenz[f]isoindole; C4D, contactless conductivity detection; CD3NH2, 3-monodeoxy-3-monoamino-β-CD; CM-β-CD, carboxymethyl-
β-CD; DM-β-CD, 2,6-O-Dimethyl-β-CD; DTAF, 5-(4,6-dichloro-s-triazin-2-ylamino)fluorescein; Glu, glutamic acid; Gly, glycine; HP-β-CD, 2-
hydroxypropyl-β-CD; HS- -CD: high sulphated- -CD HS-β-CD: high sulphated-β-CD; Ile, isoleucine; Leu, leucine; MeOH, methanol; NAD,
naphthalene-2,3-dicarboxaldehyde; PEO, poly(ethylene oxide); Phe, phenylalanine; Poly-L-SUCIL, polysodium N-undecenoxycarbonyl-L-
isoleucinate; Q, quadrupole analyzer; S- -CD, sulphated- -CD; S-β-CD, sulphated-β-CD; SC, sodium cholate; Ser, serine; STC, sodium
taurodeoxycholate; Succ-γ-CD, succinyl-γ-CD; Thr, Threonine; Tris, tris(hydroxymethyl)aminomethane; Trp, tryptophan; Val, valine.