recent evidence on market demand systems for food in canada
TRANSCRIPT
Cdn. J. o f Agric. Economics NOTE
34 (November 1986)
Recent Evidence on Market Demand Systems
For Food i n Canada
A . N. Safyurtlu,* S. R . Johnson,** and 2. A . Hassan***
Introduction
Market demand systems f o r food commodities conta in important informa- t i o n f o r fo recas t ing and dec is ion ana lys is and, as we l l , the design o f government commodity programs. For t h i s reason, subs tan t ia l e f f o r t has been devoted t o es t imat ing the parameters o f market demand systems, i.e., own-price, cross-pr ice, and income e l a s t i c i t i e s . However, wh i l e the methods o f es t imat ing market demand systems have increased i n so- p h i s t i c a t i o n , there remains considerable unce r ta in t y about the values o f the parameters as w e l l as appropr ia te es t imat ion methods given the theo- r y and ava i l ab le t ime ser ies data.
The present paper provides market demand parameter est imates f o r food employing t ime ser ies data and the r e s t r i c t i o n s from the i nd i v idua l conL sumer demand theory, l o c a l l y and s tochas t i ca l l y . These es t imators can be viewed as r e s u l t i n g from a stream o f empi r i ca l ana lys is t h a t has pro- ceeded from ad hoc spec i f i ca t i ons o f demand equations, t o the construc- t i o n o f demand systems (Brandow 1961; George and King 1971; Hassan and Johnson 19761, t o the app l i ca t i on o f i nd i v idua l consumer theory r e s t r i c - t i o n s exac t l y (Byron 1970: Court 1967: Huang 1985: Huang and Haidacher 1983). I nd i v idua l consumer demand r e s t r i c t i o n s and market data are com- bined e m p i r i c a l l y t o generate a l t e r n a t i v e systems estimates and explore i n d e t a i l the consistency o f the r e s t r i c t i o n s , l o c a l l y appl ied.
Market Demmnd Systems
The empi r i ca l study o f i nd i v idua l consumer demand i s w e l l developed (e.g., Deaton and Muellbauer 1980; Johnson, Hassan and Green 1984: Ph l i ps 1974). I n cont ras t , the market demand theory lends i t s e l f less t o empi r i ca l study (Diewert 1976: Eisenberg 1961: Mantel 1977; Sonnen- schein 1973a, 1973b). I n general, market demand theory shows t h a t the homogeneity, symmetry, and adding-up r e s t r i c t i o n s (hereafter, Slutsky cond i t ions) f o r i nd i v idua l consumer demand systems do no t ho ld . a t the
* ATLT Communications ** Center f o r A g r i c u l t u r a l and Rural Development and Department o f
*** Marketing and Economics Branch, Ag r i cu l tu re Canada, Ottawa Economics, Iowa S ta te Un ive rs i t y
476
market l e v e l un less s e p a r a b i l i t y i s assumed. U n f o r t u n a t e l y , however, t h e s e p a r a b i l i t y assumptions necessary t o develop t h e correspondence be- tween t h e market and i n d i v i d u a l demand systems a re b e h a v i o r a l l y incon- s i s t e n t w i t h s p e c i f i c a t i o n s f o r d isaggregated commodity groups: a major focus o f market demand s t u d i e s f o r a g r i c u l t u r a l commodities.
The conundrum p r o v i d e d by the l i m i t a t i o n s o f t h e theo ry o f market de- mand and t h e requi rement f o r demand parameters i n f o r e c a s t i n g and p o l i c y a n a l y s i s f o r a g r i c u l t u r a l commodities has prompted a number o f e m p i r i c a l a t tempts t o supply "workable" market demand systems es t ima tes . These s t u d i e s f a l l i n t o t h r e e ca tegor ies :
1 . those t h a t have a p p l i e d t h e S l u t s k y c o n d i t i o n s i n t h e market d a t a t o es t ima te o r " c o n s t r u c t " market demand systems es t ima tes (Bran- dow 1961; Byron 1970; Chavas 1983; Cour t 1967; George and K ing 1971; Hassan and Johnson 1976; Huang 1985; Huang and Haidacher 1983; Pope, Green and Eales 1980)
2 . those t h a t have es t ima ted market systems and/or eva lua ted t h e S l u t s k y c o n d i t i o n s u s i n g consumer budget survey d a t a (Goddard 1983; Salvas-Bronsard 1978; Salvas-Bronsard and B a s t i e n 1984) , and f i n a l l y
3. those t h a t have imposed s e p a r a b i l i t y , a c h i e v i n g a correspondence between market and i n d i v i d u a l demand systems b u t a t a h i g h c o s t b e h a v i o r a l l y (e.g., B l a n c i f o r t i and Green 1983)
General conc lus ions f rom these e x p l o r a t o r y e m p i r i c a l i n v e s t i g a t i o n s i n v o l v e b o t h the p l a u s i b i l i t y o f demand systems parameter es t ima tes and t h e S l u t s k y c o n d i t i o n s . From t h e f i r s t category o f s t u d i e s , i t i s ap- p a r e n t t h a t t he "cons t ruc ted" market demand systems p r o v i d e p l a u s i b l e es t ima tes . A l t e r n a t i v e l y , i n c o r p o r a t i n g the S l u t s k y c o n d i t i o n s e x a c t l y w i t h t h e market da ta u s i n g a r e s t r i c t e d l e a s t squares framework r e s u l t s i n es t ima tes o f demand parameters a t va r iance w i t h conven t iona l wisdom and even observed r e l a t i o n s h i p s i n t h e p r i c e and q u a n t i t y da ta .
S tud ies from the second ca tegory have suggested t h a t symmetry i s more l i k e l y t o apply i n t h e market d a t a than t h e homogeneity o r Engel aggre- g a t i o n . Reasons f o r these c la ims a r e n o t a l t o g e t h e r c l e a r ; however, they may f o l l o w from income d i s t r i b u t i o n i n s t a b i l i t y , d i f f e r e n c e s i n marg ina l p r o p e n s i t i e s , and problems i n measuring p r i c e , income, and q u a n t i t y v a r i a b l e s . Eva lua t i ons o f homogeneity and Engel agg rega t ion i n t ime s e r i e s market d a t a have p r o v i d e d r e s u l t s c o n s i s t e n t w i t h these con- c l u s i o n s (Byron 1970: Cour t 1967; Pope e t a l . 1980). F i n a l l y , f o r t h e t h i r d category, f l e x i b l e systems but w i t h s e p a r a b i l i t y have produced es- t i m a t e s somewhat c o n s i s t e n t w i t h t h e c o n s t r u c t e d systems r e s u l t s . How- ever , t h e tho rny problem of t h e a p p l i c a b i l i t y o f s e p a r a b i l i t y i n d i - saggregated demand systems d e t r a c t s f rom the use fu lness o f these r e s u l t s (Deaton and nuel lbauer 1980) .
A l t e r n a t i v e s t o these t h r e e approaches f o r deve lop ing es t ima tes o f market demand systems f o r a p p l i e d p o l i c y and f o r e c a s t i n g work a r e l i m i t - ed. One a l t e r n a t i v e i s t o r e f l e c t t h e c h a r a c t e r i s t i c s t h a t d i f f e r e n t i -
a t e households o r i n d i v i d u a l s i n t h e observed market d a t a through s c a l i n g and t r a n s l a t i n g (Po l l ak and Wales 1981). A second a l t e r n a t i v e i s t o examine e m p i r i c a l l y t h e S l u t s k y c o n d i t i o n s i n t h e market l e v e l da ta and t o develop e s t i m a t i o n techniques t h a t use t h e i n f o r m a t i o n about these c o n d i t i o n s t h a t i s ob ta ined . The l a t t e r approach i s adopted f o r t he c u r r e n t s tudy. S p e c i f i c a l l y , t h e S l u t s k y c o n d i t i o n s a r e l o c a l i z e d by u s i n g " r e p r e s e n t a t i v e " budget shares t o e s t i m a t e a cons tan t e l a s t i c i - t y market demand system for food. The S l u t s k y c o n d i t i o n s a r e a p p l i e d s t o c h a s t i c a l l y and eva lua ted s t a t i s t i c a l l y . R e s u l t s o f t h e e v a l u a t i o n a r e used t o gu ide t h e i n c o r p o r a t i o n o f p r i o r i n f o r m a t i o n w i t h t h e market da ta f o r e s t i m a t i n g a f o o d demand system.
Estimtion with Local, Stochastic Slutsky
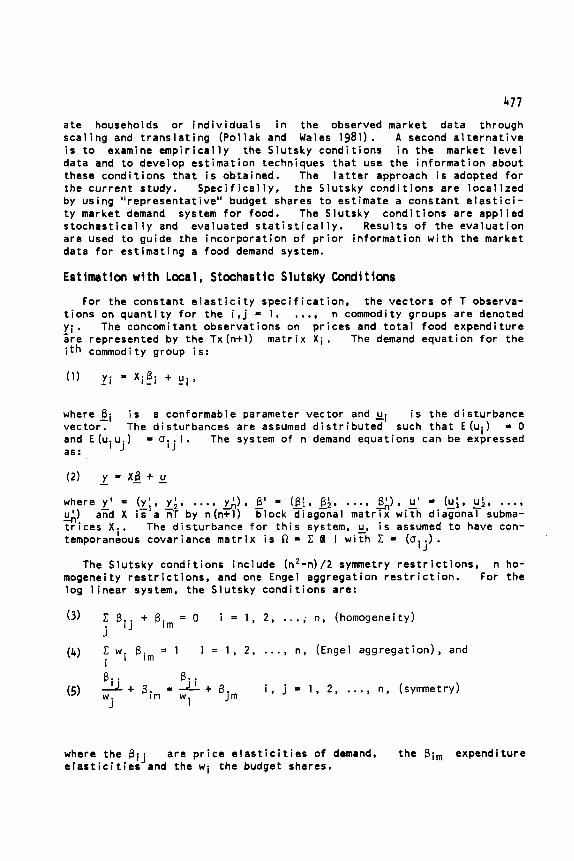
For t h e c o n s t a n t e l a s t i c i t y s p e c i f i c a t t i o n s on q u a n t i t y f o r t h e i,j = 1, ..., y i . The concomi tant obse rva t i ons on p r a r e rep resen ted by t h e Tx(n+l ) m a t r i x X i i t h commodity group i s :
( 1 ) y i = xj_Bi + LJi'
Condi t ions on, t h e v e c t o r s o f T observa- n commodity groups a r e denoted ces and t o t a l f ood e x p e n d i t u r e
The demand e q u a t i o n f o r t h e
w h e r e l i i s a conformable parameter v e c t o r and 3 i s t h e d i s t u r b a n c e v e c t o r . The d i s tu rbances a r e assumed d i s t r i b u t e d such t h a t E(ui) = 0 and E (u.u.) - O i j I . The system o f n demand equa t ions can be expressed as: I J
( 2 )
where Y ' - ( Y ' . 3, .... YJ. 1' = (si. 14. ..., 8 ' ) . u' - (xi, $, ..., ?n
$,) b l o c k d iagona l m a t r i x w i t h d iagona l subma- t r i c e s Xi . The d i s t u r b a n c e f o r t h i s system, u-, i s assumed t o have con- temporaneous cova r iance m a t r i x i s R = C I I w i t h Z = (aij).
The S l u t s k y c o n d i t i o n s i n c l u d e (n2-n)/2 symmetry, r e s t r i c t i o n s , n ho- mogeneity r e s t r i c t i o n s , and one Engel agg rega t ion r e s t r i c t i o n . For t h e l o g l i n e a r system, t h e S l u t s k y c o n d i t i o n s are:
- y = x j + 0
axd X i r ' a nT by n(n+l )
+ Pi, = 0 i = 1 , 2, ...; n, (homogeneity)
Bim = 1 i = 1 , 2 , ..., n , (Engel agg rega t ion ) , and
B.. = 2. Bjm i, j = I , 2 , ..., n, (symmetry) ' im wi
where t h e f3lj a r e p r i c e e l a s t i c i t i e s o f demand, t h e p im e x p e n d i t u r e e l a s t i c i t i e s and t h e w i t h e budget shares.
478
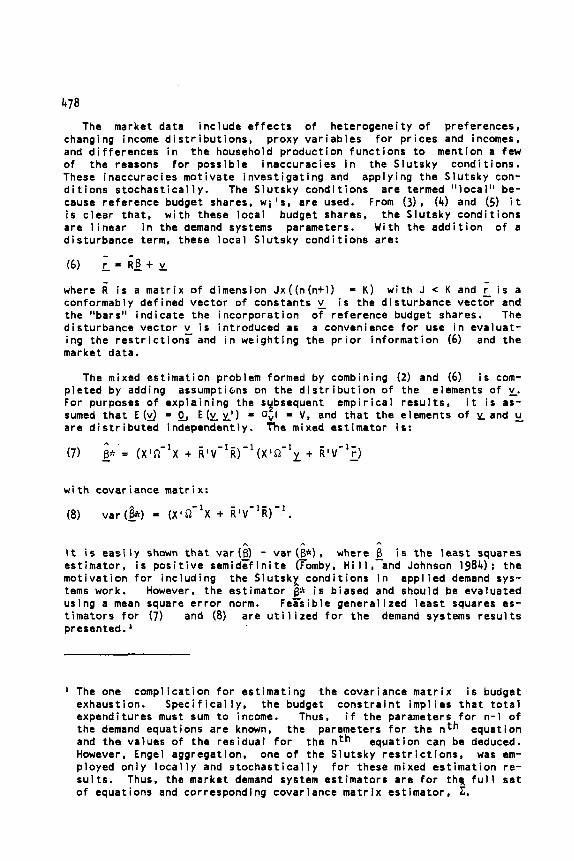
The market data include e f f e c t s o f heterogeneity o f preferences, changing income d i s t r i b u t i o n s , proxy var iab les f o r p r ices and incomes, and d i f fe rences i n the household product ion func t ions t o mention a few o f the reasons f o r poss ib le inaccuracies i n the Slutsky condi t ions. These inaccuracies mot ivate i nves t i ga t i ng and apply ing the Slutsky con- d i t i o n s s tochas t i ca l l y . The S lu tsky cond i t ions are termed " l oca l " be- cause reference budget shares, w i 's, are used. From ( 3 ) , (4) and (5) i t i s c lea r tha t , w i t h these local budget shares, the Slutsky cond i t ions are l i nea r i n the demand systems parameters. With the a d d i t i o n o f a disturbance term, these loca l Slutsky cond i t ions are:
where 6 i s a mat r ix o f dimension Jx( (n (n+ l ) i s a conformably def ined vector o f constants i s the disturbance vector and the "bars" ind ica te the incorpora t ion o f reference budget shares. The disturbance vector i s introduced as a convenience f o r use i n evaluat- ing the r e s t r i c t i o n s and i n weight ing the p r i o r informat ion ( 6 ) and the market data.
= K ) w i t h J < K and
The mixed es t imat ion problem formed by combining (2) and ( 6 ) i s com- p le ted by adding assumptiGns on the d i s t r i b u t i o n o f the elements o f v. For purposes o f exp la in ing the sybsequent i t i s as- sumed t h a t E(d - & E ( v _ v _ ' ) = avl = V, and t h a t the elements o f and % are d i s t r i b u t e d independently. t h e mixed est imator is:
empir ical resu l t s ,
w i t h covariance matr ix:
A ,. e
It i s eas i l y shown t h a t var(6) - var(B*), where i s the l eas t squares est imator, i s p o s i t i v e semidz f i n i t e (Tomby, H i l l , and Johnson 1984); the mot iva t ion f o r inc lud ing the S l u t s k r cond i t ions i n app l ied demand sys- tems work. However, the est imator Bk i s biased and should be evaluated using a mean square e r r o r norm. Fezsibble general ized l eas t squares es- t imators f o r (7) and (8) are u t i l i z e d for the demand systems r e s u l t s presented.'
' The one compl icat ion f o r es t imat ing the covariance ma t r i x i s budget exhaustion. S p e c i f i c a l l y , the budget cons t ra in t imp l ies t h a t t o t a l expenditures must sum t o income. Thus, i f the parameters f o r n-1 o f the demand equations are known, the parameters f o r the nth equation and the values o f the residual f o r the nth equation can be deduced. However, Engel aggregation, one o f the Slutsky r e s t r i c t i o n s , was cm- ployed on ly l o c a l l y and s tochas t i ca l l y f o r these mixed es t imat ion re - su l t s . Thus, the market demand system est imators are f o r t h q f u l l s e t o f equations and corresponding covariance ma t r i x est imator, E.
479
F i n a l l y , t h e S l u t s k y c o n d i t i o n s can be we igh ted more o r l e s s s t r o n g l y r e l a t i v e t o t h e sample d a t a by i n c o r p o r a t i n g t h e f a c t o r l / w . The mixed e s t i m a t o r i n t h i s case i s :
(9) & = ( X ' R - l X + R'PV-lP'i i)-l(X'R-'y - + R'PV- lP ' ; ) -
where P i s a d iagona l m a t r i x w i t h nonzero elements u-lj2. T h i s approach t o e s t i m a t i n g t h e demand systems parameters i s used f o r e v a l u a t i n g t h e r e s t r i c t i o n s and f o r merg ing t h e p r i o r and sample i n f o r m a t i o n .
Data
The market demand f u n c t i o n s r e q u i r e r e t a i l p r i c e s , per c a p i t a food consumption and pe r c a p i t a t o t a l f ood expend i tu re . For t h e market de- mand s p e c i f i c a t i o n used i n t h i s a n a l y s i s , f ood consumption i s d i saggre - ga ted i n t o e i g h t c a t e g o r i e s . S p e c i f i c a l l y . d a t a f rom Canada on p r i c e s , q u a n t i t i e s , t o t a l f ood expend i tu re and e x p e n d i t u r e p r o p o r t i o n s f o r t h e p e r i o d 1960 through 1982 were u t i l i z e d i n e s t i m a t i n g t h e demand parame- t e r s f o r t h e e i g h t commodity groups: a l l meats. t o t a l d a i r y , b r e a k f a s t foods and c e r e a l s , eggs, f r u i t s and vegetables, beverages, sugar, and t o t a l f a t s and o i l s .
Time s e r i e s d a t a on r e t a i l p r i c e s , per c a p i t a food consumption and per c a p i t a t o t a l food expend i tu re were o b t a i n e d f rom t h e Handbook o f Food Expend i tu res , Pr i ces and Consumpt i on ( 1 983) . The annua 1 pr i c e i n - d i c e s (1971 - 100) used were s imp le averages o f r e p o r t e d month ly p r i c e s . F i n a l l y , t h e e s t i m a t i o n method used r e q u i r e s r e f e r e n c e e x p e n d i t u r e shares. The e x p e n d i t u r e shares used were s imp le averages f rom c ross - s e c t i o n data: t h e Fami ly Food Expend i tu re Survey o f 1974, 1976, and 1978 ( S t a t i s t i c s Canada 1974, 1976, 1978).
The dependent v a r i a b l e s f o r t h e e i g h t commodity demand system were annual per c a p i t a consumption l e v e l s . P r i c e v a r i a b l e s were per pound p r i c e o f a l l meats, s tandard m i l k (or powdered sk im m i l k ) , ' w h i t e f l o u r , eggs, f r u i t s . and vege tab les , beverages, sugar, and t o t a l f a t . The ex- p e n d i t u r e v a r i a b l e used was per c a p i t a t o t a l food expend i tu re i n c u r r e n t d o l l a r s . Thus, a l l p r i c e s and t o t a l f ood were i n nominal d o l l a r va lues .
Prior and Sanple Information
T h e i l l s (1963) c o m p a t a b i l i t y t e s t can be a p p l i e d t o examine t h e va- l i d i t y o f t h e S l u t s k y c o n d i t i o n s (6) . The hypo thes i s i s :
The a l t e r n a t i v e p r i c e index f o r da l e c t e d t o demonstrate t h e s e n s i t i v t o f o r t u i t o u s cho ices o f da ta when exac t 1 y.
r y , powder sk im m t y o f t h e demand
t h e S l u t s k y cond
I k p r i c e , was se- systems es t ima tes t i o n s a r e a p p l i e d
480
where 6 is the ordinary least squares estimator from (2). The compatibil ity staIistic evaluates the unbiasedness of the stochastic prior information RB+ v - 1. Under the null hypothesis
n
The test statistic is:
If l a n d v are normally dist:ibuted then the quadratic form ( 1 1 ) is dis- tributed approximately as X with J degrees of freedom under the null hypothesis (Yancey et al. 1974). Theil's compatibility statistic, 1, and an F-statistic, derived by reformulating mixed estimation on an ex- tended parameter space, are asymptotically equivalent (Fomby, Hill, and Johnson 1984; Judge, Yancey, and Bock 1973)..
The prior (p) and the sample (5) "precision" shares for the mixed es- timator ore:
where k is the number of parameters and tr the trace operator. Clearly, if the nonzero elements of V grow without bound, p converges to zero and s to 1. Conversely, as n increases (in a positive definite sense), the sample share converges to zero and the prior share to one.
Results In this section, results for selected combinations of the prior
sample information on the market demand system are reported. First, unrestricted and exactly restricted least squares estimators for food demand system are presented. Then, an example of results that be obtained with exact restrictions and a fortuitous choice of data provided. Finally, mixed estimators, using the local, stochastic S sky conditions and based on an evaluation of these restrictions shown .
Unrestricted and Exactly Restricted Estimators
and the the can are ut- are
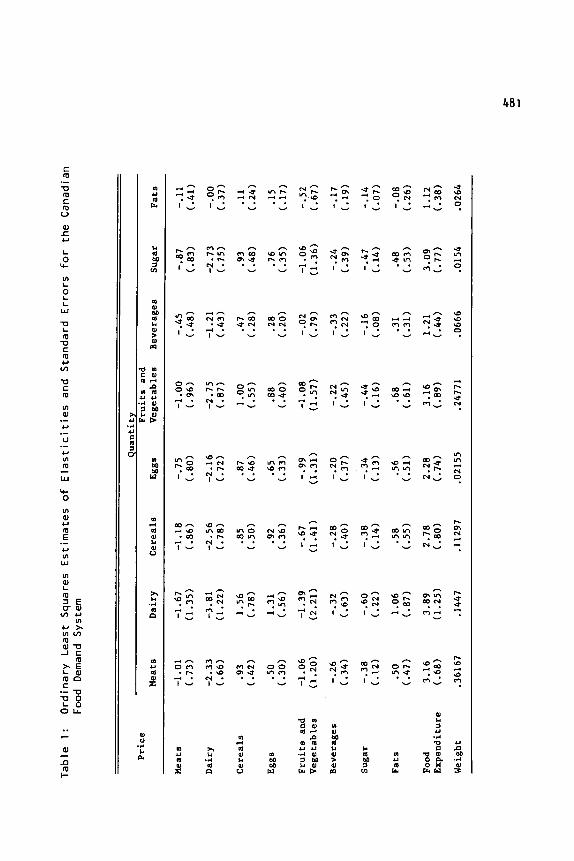
Table 1 contains unconstrained or ordinary least squares estimators of the parameters of the market demand system. Casual observation of the results in Table 1 shows that they are inconsistent with observed relationships between prices and quantities, and generally accepted em- pirical work. For example, the estimated own-price elasticities for ce- reals and eggs are positive, .85 and .65, respectively. Also, the total food expenditure elasticities are relatively high. Thus, for applied forecasting and decision analysis, the unconstrained ordinary least squares estimators for market demand system provided in Table 1 are of 1 imi ted value.
Ta
ble
1:
Ord
ina
ry
Le
as
t S
qu
ares
E
sti
ma
tes
of
Ela
sti
cit
ies
an
d S
tan
da
rd E
rro
rs f
or
the
Can
adia
n
Food
D
eman
d S
yste
m
Qu
anti
ty
Mea
ts
Dai
ry
Cer
ea 1
s E
ggs
Veg
etab
les
Bev
erag
es
Suga
r F
ats
Pri
ce
Fru
its
and
Mea
ts
-1.01
-1.67
-1.18
-.75
-1.00
-.45
-.87
-.11
(.73)
(1.35)
(-86
) (.
80
) (.96)
(.48)
c.83)
C.41)
Dai
ry
-2.33
-3.81
-2.56
-2.16
-2.75
-1.21
-2.73
-.oo
(.66)
(1.22)
(. 78)
(.72)
(.87)
(.43)
C.75)
(.37)
Cer
eals
.93
1.56
.85
.87
1.00
.47
.93
.ll
Egg
s .50
1.31
.92
-65
.88
.28
.76
.15
(.42)
(.78)
(.50)
(.46)
(.55)
(.2
8)
(.48)
(.24)
(.30)
(.56)
(.36)
(.33)
(.40)
(.2
0)
(.35)
(.17)
Fru
its
and
-1.06
-1.39
-.67
-.99
-1.08
-.02
-1.06
-.52
Veg
etab
les
(1.20)
(2.21)
(1.41)
(1.31)
(1.57)
(-79
) (1.36)
(.67)
Bev
erag
es
-.26
-.32
-.2
8
-.2
0
-.22
-.33
-.24
-.17
(.34)
(.63)
(.40)
(.37)
(.45)
(.2
2)
(.39)
(.19)
Suga
r -.38
-.60
-.38
-.34
-.44
-.16
-.47
-.14
(.12)
(.2
2)
(. 14)
(.13)
(.16)
(-0
8)
(. 14)
(.07)
Fat
s .50
1.06
.58
.56
.68
-31
.48
-.08
(.47)
(.87)
C.55)
(.51)
(.61)
C.31)
(.53)
(.26)
Food
3.16
3.89
2.78
2.28
3.16
1.21
3.09
1.12
Exp
end
itu
re
(-68
) (1.25)
(.80)
(.74)
(.89)
(.44)
C.77)
Wei
ght
.36167
.1447
. 11 297
.02155
.24771
.0666
.0154
.0264
482
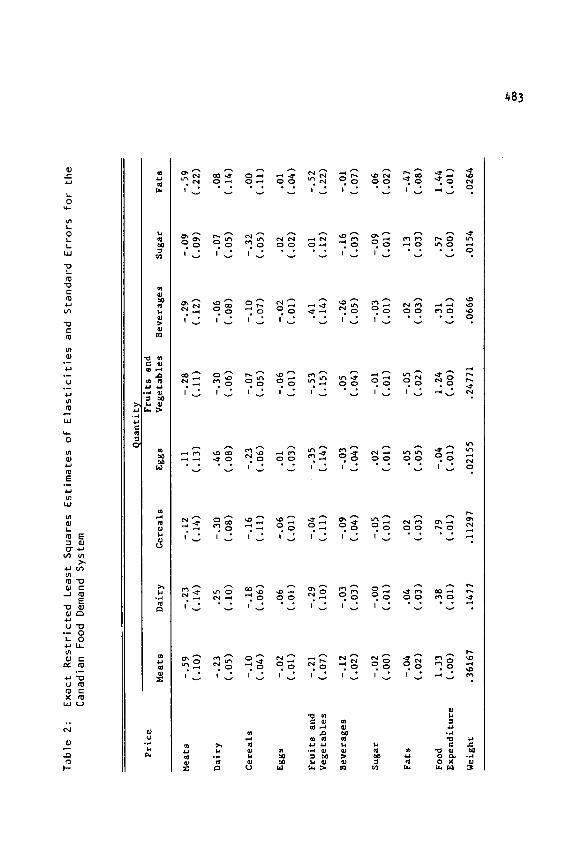
At the other extreme, is the situation typical of Byron 1970; Court 1967; Huang 1985; and Huang and Haidacher 1983, where the Slutsky condi- tions are applied exactly and at the reference budget shares. An esti- mated market demand system using the data for the estimates in Table 1 but exact localized Slutsky conditions as prior restrictions ,is present- ed in Table 2. Notice that the own-price elasticities are, in general, smaller in Table 2 than in Table 1 . Also, the income elasticity for eggs is negative. However, as with the unconstrained case, there are positive own-price elasticities; .25 for dairy and .01 for eggs. Final- ly, the cross-price elasticities are small in magnitude relative to those in Table 1 . The conclusion from Tables 1 and 2 is that neither set of market demand system parameters is adequate for application in routine economic forecasting and policy analysis; confirming results of earlier partial analyses of the Slutsky conditions (Chavas 1983; Pope, Green, and Eales 1980) . Alternative Sanple Data
We know that the Slutsky conditions are appropriate only at a select- ed set of prices. quantities, and total expenditure or implicitly, budg- et shares in the absence of strong separability assumptions. One ap- proach to developing improved exactly restricted estimators is to "experiment" with alternative explanatory variables, prices and total expenditure. Given the level of aggregation and the limitations of the data on prices and total expenditure, this is not an unreasonable ap- proach. However, the result is a demand system estimate that depends on fortuitous data choices by the researcher.
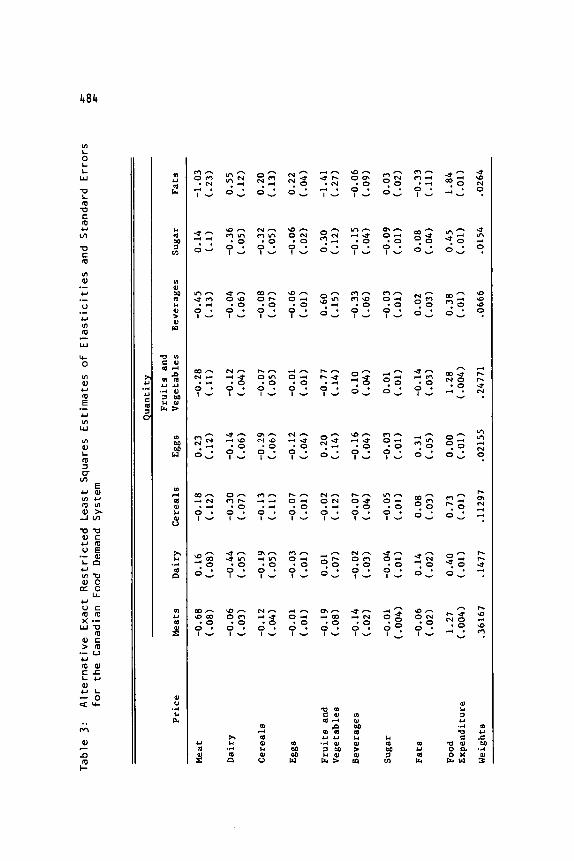
Exact restricted least squares estimates of the market demand system for the eight food commodities using alternative price index for dairy group, the powder skim milk price, are reported in Table 3. These re- sults are an outcome of various ad hoc experiments with the data involv- ing alternative choices of prices for commodity groups. These experi- ments were motivated by own and income elasticity estimates not in agreement with prior reasoning when the Slutsky conditions were applied exactly with general price aggregates (Johnson and Safyurtlu 1984). The estimates in Table 3 appear improved over those of Table 2. Specifical- ly, all of the own-price elasticities for the eight food commodities are negative. The income elasticities are positive, and signs on the cross- price elasticities are generally consistent with common perceptions and previous constructed systems results on substitution effects.
Yeiqhting Prior and Sanple Information
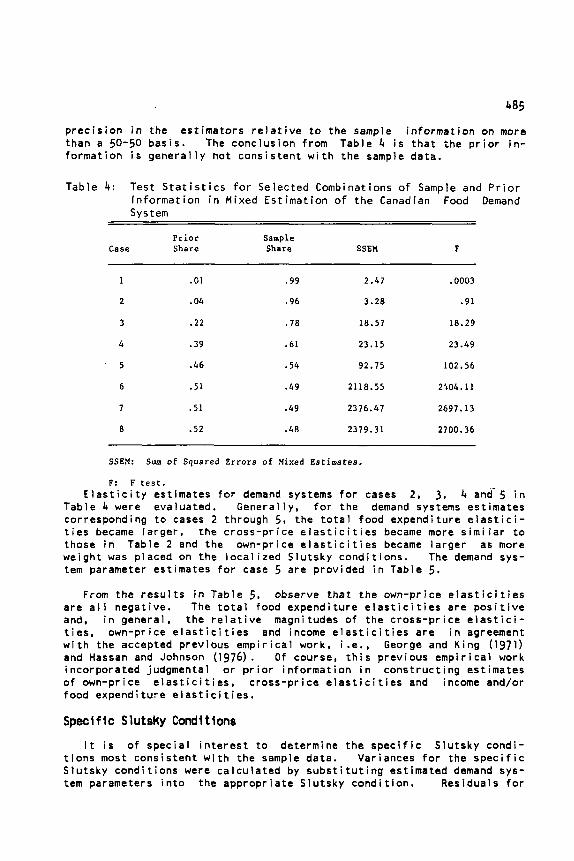
The appropriateness empirically of the Slutsky conditions in the Sam- ple data is indicated by Table 4. In Table 4, F statistics for selected weightings of the prior and sample information are displayed. Observe that the F statistic "rejects" the restrictions when the prior informa- tion represents four percent of the precision in the estimators. How- ever, over the range where the prior information content increases to 46 percent of the precision in the estimators, the value of the F statistic remains relatively similar in value. A large jump in the F statistic occurs when the prior and sample information begins to account for the
Ta
ble
2:
Ex
ac
t R
es
tric
ted
Le
as
t S
qu
ares
E
sti
ma
tes
of
Ela
sti
cit
ies
an
d
Sta
nd
ard
Err
ors
fo
r th
e
Can
adia
n
Food
D
eman
d S
yste
m
Qu
anti
ty
Mea
ts
Dai
ry
Ce r
ea 1s
E
ggs
Veg
eta
ble
s B
ever
ages
Su
gar
Fat
s P
rice
F
ruit
s an
d
Mea
ts
-.59
(.lo)
Dai
ry
-.23
(.05)
Cer
eals
-.lo
(.04)
Egg
s -.
02
(.01)
Fru
its
and
-.21
-.23
(. 14)
.25
(.lo)
-.18
(.06)
.06
(.0
1)
-.29
-.12
(. 14)
-.30
(.0
8)
-.16
C.11)
-.06
(-01
)
-.04
.ll
(. 13)
.46
(.0
8)
-. 23
C.06)
.01
(.03)
-.35
-.28
(.
I11
-.30
(.06)
-.07
(.0
5)
-.06
(.01)
-.53
-.29
(. 12)
-.06
C.0
8)
-.lo
(.07)
-.0
2
C.01)
.41
-.0
9
(.0
9)
-.07
(-0
5)
-.32
(.05)
.02
(.0
2)
.01
Veg
eta
ble
s (.07)
( .lo)
(.11)
(. 14)
(. 15)
(.14)
(.12)
Bev
erag
es
-.12
-.03
-.09
-.03
.05
-.26
-.16
(.02)
(.0
3)
C.04)
(-04
) (.04)
(.05)
C.03)
Suga
r -.
02
-.o
o -.
05
.0
2 -.01
-.03
-.09
(.O
O)
(.01)
(.01)
(.0
1)
(.01)
(.01)
(.01)
-. 59
(. 22
)
.08
(.14
1
. 00
(.11
)
.Ol
(.04)
-.52
.22
)
-.01
.07)
.06
.02
)
Fat
s -.04
.04
.02
.05
-.05
.02
.13
-.47
(.0
2)
(.03)
(.03)
(.0
5)
(.02)
C.03)
C.03)
(.0
8)
Foo
d 1.33
.38
.79
-.04
1.24
.31
.57
1.44
Exp
end
itu
re
(.O
O)
(.01)
C.01)
(.01)
(.O
O)
(.01)
(.O
O)
(.01)
Wei
ght
.36167
.1477
.11297
.021
55
.24771
.0666
.0154
.0264
t
a0
w
c
W
Table
3: Alternative Exact Restricted L
east Squares Estimates of Elasticities and Standard Errors
for the Canadian F
ood Demand S
ystem
t
Fru
its
and
Pri
ce
Mea
ts
Dai
ry
Cer
eals
Eg
gs
Veg
eta
ble
s B
ever
ages
Su
gar
Fat
s
Hea
t
Dai
ry
Cer
eals
Fru
its
and
Veg
eta
ble
s
Bev
erag
es
Su
gar
Fat
s
Foo
d E
xpen
dit
ure
Wei
ghts
-0.68
(.0
8)
-0.06
(.03)
-0.12
(.04)
-0.01
(.01)
-0.19
(.0
8)
-0.14
(.0
2)
-0.01
(.004)
-0.06
(.0
2)
1.27
(.004)
.36167
0.16
(-0
8)
-0.44
(.05)
-0.19
C.05)
-0.03
(.01)
0.01
C.07)
-0.02
C.03)
-0.04
(.01)
0.14
(.0
2)
0.40
(.01)
.1477
-0.18
(-12
)
-0.30
(.07)
-0.13
(.I11
-0.07
(-01)
-0.02
(.12)
-0.07
C.04)
-0.05
(.01)
0.08
C.03)
0.73
(-01
)
.11297
0.23
(. 12)
-0.14
(.06)
-0.29
(.0
6)
-0.12
(.04)
0.20
( .14)
-0.16
(-04
)
-0.03
(.0
1)
0.31
(-05
)
0.00
(.01)
.02155
-0.28
(.11)
-0.12
(.04)
-0.07
(.05)
-0.01
(.0
1)
-0.77
(-14)
0.10
(.04)
0.01
(.01)
-0.14
C.03)
1.28
(.004)
.24771
-0.45
(-13
)
-0.04
(.06)
-0.08
C.07)
-0.06
(.01)
0.60
C.15)
C.06)
(.01)
0.02
(.03)
0.38
(.01)
.0666
-0.33
-0.03
0.14
(-1)
-0.36
(.05)
-0.32
(.05)
-0.06
(.0
2)
0.30
(.12)
-0.15
(.04)
(.01)
0.0
8
(.04)
0.45
C.01)
.0154
-0.09
-1.03
(.23)
0.55
(. 12)
0.20
(.13)
0.22
(-04
)
-1.41
C.27)
-0.06
(.09)
0.03
(-0
2)
(.11)
1.84
(.01)
.0264
-0.33
485
on in the estimators relative to the sample information on more 50-50 basis. The conclusion from Table 4 is that the prior in- on is generally not consistent with the sample data.
precis than a format
Table : Test Statistics for Selected Combinations of Sample and Prior Information in Mixed Estimation of the Canadian Food Demand System
Prior Sample Case Share Share SSEM F
.01
.04
.22
.39
.46
.51
.51
.52
.99
.96
.78
.61
.54
.49
.49
.48
2.47
3.28
18.57
23.15
92.75
2118.55
2376.47
2379.31
.0003
.91
18.29
23.49
102.56
2$04.11
2697.13
2700.36
SSEM: Sum of Squared Errors of Mixed Estimates.
F: F t e s t . Elasticity estimates for demand systems for cases 2, 3, 4 and-5 in
Table 4 were evaluated. Generally, for the demand systems estimates corresponding to cases 2 through 5, the total food expenditure elastici- ties became larger, the cross-price elasticities became those in Table-2 and the own-price elasticities became weight was placed on the localized Slutsky conditions. tern parameter estimates for case 5 are provided in Table
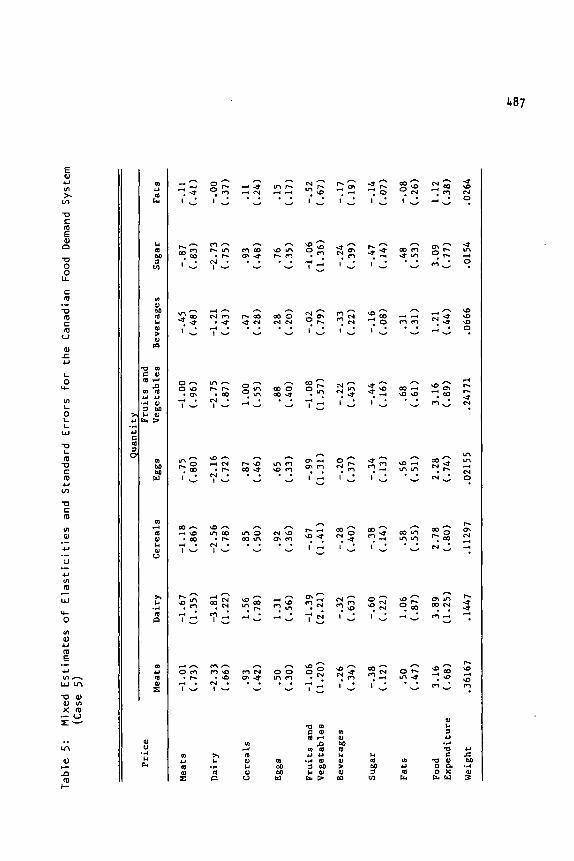
more similar to larger as more The demand sys- 5.
From the results in Table 5, observe that the own-pr ce elasticities are all negative. The total food expenditure elasticit es are positive and, in general, the relative magnitudes of the cross-price elastici- ties, own-price elasticities and income elasticities are in agreement with the accepted previous empirical work, i.e., George and King (1971) and Hassan and Johnson (1976). Of course, this previous empirical work incorporated judgmental or prior information in constructing estimates of own-price elasticities, cross-price elasticities and income and/or food expenditure elasticities.
Specific Slutsky Conditions It is of special interest to determine the specific Slutsky condi-
tions most consistent with the sample data. Variances for the specific Slutsky conditions were calculated by substituting estimated demand sys- tem parameters into the appropriate Slutsky condition. Residuals for
486
each S l u t s k y c o n d i t i o n , eva lua ted f o r a l l sample obse rva t i ons , were then u t i l i z e d f o r c a l c u l a t i n g es t ima ted va r iances o f t h e " e r r o r s " f o r t he r e - s t r i c t i o n s . These es t ima ted va r iances p r o v i d e an i n d i c a t i o n o f t h e con- s i s t e n c y o f t h e p a r t i c u l a r S l u t s k y c o n d i t i o n w i t h t h e sample data.
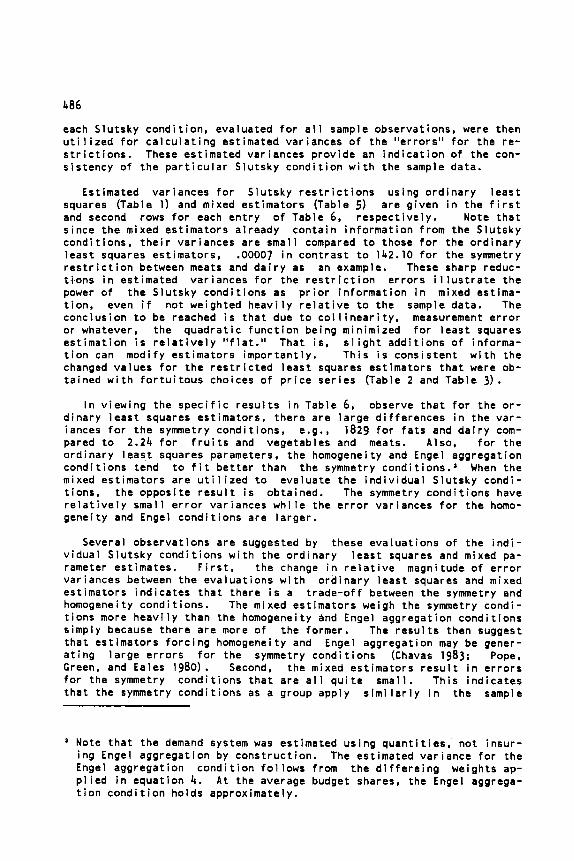
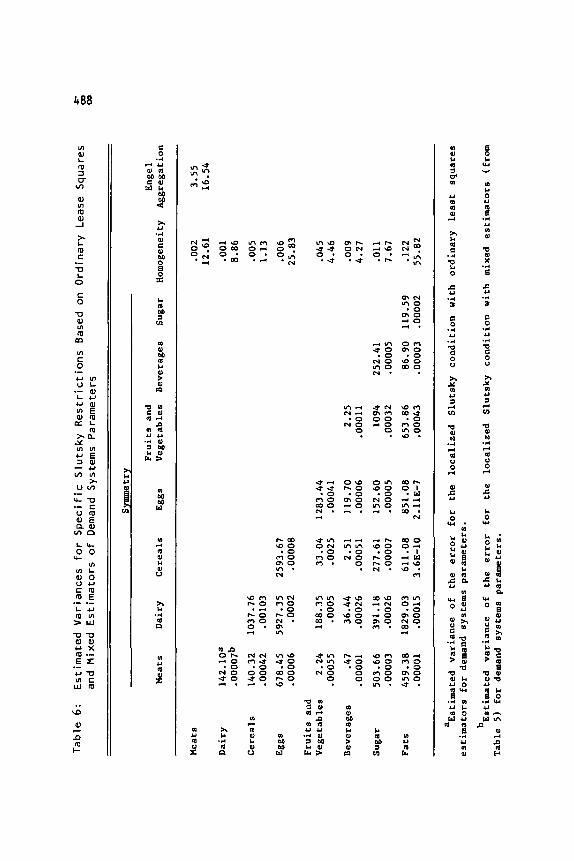
Est imated va r iances f o r S l u t s k y r e s t r i c t i o n s us ing o r d i n a r y l e a s t squares (Table I ) and mixed e s t i m a t o r s (Table 5) a r e g i v e n i n t h e f i r s t and second rows f o r each e n t r y o f Table 6, r e s p e c t i v e l y . Note t h a t s i n c e t h e mixed e s t i m a t o r s a l r e a d y c o n t a i n i n f o r m a t i o n from t h e S l u t s k y c o n d i t i o n s , t h e i r va r iances a r e smal l compared t o those f o r t he o r d i n a r y l e a s t squares es t ima to rs , .OOOO7 i n c o n t r a s t t o 142.10 f o r t h e symmetry r e s t r i c t i o n between meats and d a i r y as an example. These sharp reduc- t i o n s i n es t ima ted va r iances f o r t h e r e s t r i c t i o n e r r o r s i l l u s t r a t e t h e power o f t h e S l u t s k y c o n d i t i o n s as p r i o r i n f o r m a t i o n i n mixed est ima- t i o n , even i f n o t weighted h e a v i l y r e l a t i v e t o t h e sample data. The c o n c l u s i o n t o be reached i s t h a t due t o c o l l i n e a r i t y , measurement e r r o r o r whatever, t h e q u a d r a t i c f u n c t i o n be ing m in im ized f o r l e a s t squares e s t i m a t i o n i s r e l a t i v e l y " f l a t . " That i s , s l i g h t a d d i t i o n s o f in forma- t i o n can mod i f y e s t i m a t o r s i m p o r t a n t l y . T h i s i s c o n s i s t e n t w i t h t h e changed v a l u e s f o r t h e r e s t r i c t e d l e a s t squares e s t i m a t o r s t h a t were ob- t a i n e d w i t h f o r t u i t o u s choices o f p r i c e s e r i e s (Table 2 and Table 3 ) .
I n v i e w i n g t h e s p e c i f i c r e s u l t s i n Table 6, observe t h a t f o r t he o r - d i n a r y l e a s t squares es t ima to rs , t h e r e a r e l a r g e d i f f e r e n c e s i n t h e v a r - iances for t h e symmetry c o n d i t i o n s , e.g., 1829 f o r f a t s and d a i r y corn- pared t o 2.24 f o r f r u i t s and vege tab les and meats. Also, f o r t h e o r d i n a r y l e a s t squares parameters, t h e homogeneity and Engel agg rega t ion c o n d i t i o n s tend t o f i t b e t t e r t han t h e symmetry cond i t i ons . ' When t h e mixed e s t i m a t o r s a r e u t i l i z e d t o e v a l u a t e t h e i n d i v i d u a l S l u t s k y cond i - t i o n s , t h e o p p o s i t e r e s u l t i s obta ined. The symmetry c o n d i t i o n s have r e l a t i v e l y smal l e r r o r va r iances w h i l e t h e e r r o r va r iances f o r t h e homo- g e n e i t y and Engel c o n d i t i o n s a r e l a r g e r .
Several obse rva t i ons a r e suggested by these e v a l u a t i o n s o f t h e i n d i - v i d u a l S l u t s k y c o n d i t i o n s w i t h t h e o r d i n a r y l e a s t squares and mixed pa- rameter es t ima tes . F i r s t , t h e change i n r e l a t i v e magnitude o f e r r o r va r iances between t h e e v a l u a t i o n s w i t h o r d i n a r y l e a s t squares and mixed e s t i m a t o r s i n d i c a t e s t h a t t h e r e i s a t r a d e - o f f between t h e symmetry and homogeneity c o n d i t i o n s . The mixed e s t i m a t o r s weigh the symmetry cond i - t i o n s more h e a v i l y t han t h e homogeneity and Engel agg rega t ion c o n d i t i o n s s imply because t h e r e a r e more o f t h e former. The r e s u l t s then suggest t h a t e s t i m a t o r s f o r c i n g homogeneity and Engel agg rega t ion may be gener- a t i n g l a r g e e r r o r s f o r t h e symmetry c o n d i t i o n s (Chavas 1983; Pope, Green, and Eales 1980). Second, t h e mixed e s t i m a t o r s r e s u l t i n e r r o r s f o r t h e symmetry c o n d i t i o n s t h a t a r e a l l q u i t e smal l . T h i s i n d i c a t e s t h a t t h e symmetry c o n d i t i o n s as a group app ly s i m i l a r l y i n t h e sample
Note t h a t t h e demand system was es t ima ted u s i n g q u a n t i t i e s , n o t i n s u r - i n g Engel agg rega t ion by c o n s t r u c t i o n . The es t ima ted v a r i a n c e f o r t h e Engel agg rega t ion c o n d i t i o n f o l l o w s from t h e d i f f e r e i n g we igh ts ap- p l i e d i n equa t ion 4. A t t he average budget shares, t h e Engel aggrega- t i o n c o n d i t i o n h o l d s approx ima te l y .
Ta
ble
5:
Mix
ed E
sti
ma
tes
of
Ela
sti
cit
ies
and
Sta
nd
ard
Err
ors
fo
r th
e C
anad
ian
Foo
d D
eman
d S
yste
m
(Cas
e 5)
Qu
anti
ty
Mea
ts
Dai
ry
Cer
eals
E
ggs
Veg
eta
ble
s B
ever
ages
Su
gar
Fat
s P
rice
F
ruit
s an
d
Mea
ts
Cer
eals
Fru
its
and
Veg
eta
ble
s
Bev
erag
es
Suga
r
Fa
ts
Foo
d E
xpen
dit
ure
Wei
ght
-1.01
C.73)
-2.33
(.66)
.93
(.42)
.50
(.30)
-1.06
(1.20)
(.34)
-.38
C.12)
.50
(.47)
3.16
( .68)
.36167
-.26
-1.67
(1.35)
-3.81
(1.22)
1.56
(.78)
1.31
(.56)
-1.39
(2.21)
-.32
(.63)
-.60
(. 22)
1.06
(.a71
3.89
(1.25)
.1447
-1.18
(.8
6)
-2.56
(.78)
.85
C.50)
.92
(.36)
-.67
(1.41)
-. 28
C.40)
-.38
(. 14)
.58
(.55)
2.78
(.8
0)
.11297
-.75
(.80)
C.72)
.87
C.46)
.65
C.33)
-.99
(1.31)
-.20
-2.16
(.37)
-.34
(.I31
.56
(.51)
2.28
C.74)
.02155
-1 .o
o (.96)
-2.75
(.a71
1.00
(.55)
.88
(.40)
-1.08
(1.57)
-.22
(.45)
-.44
(. 16)
.68
(-61
)
3.16
(-89
)
.24771
-.45
(.48)
-1.21
(.43)
.47
(.28)
.28
(.20)
-.02
(.79)
-.33
(.22)
-. 16
(.08)
.31
(.31)
1.21
C.44)
.0666
-.a7
(.a31
-2.73
(. 75)
.93
(.48)
.76
(.35)
-1.06
(1.36)
-.24
C.39)
-.47
(.14)
.48
(.53)
3.09
(.77)
.0154
-.11
(.41)
-.oo
(.37)
.ll
(.24)
.15
(.17)
-.52
(.67)
C.19)
-. 14
(.07)
-.08
(.26)
1.12
C.38)
.0264
-.17
&
00
U
J?
W
W
Table 6: Estimated Variances for Specific Slutsky Restrictions Based on O
rdinary
Lease Squares
and Mixed
Estimators of Demand S
ystems Parameters
Symmetry Fr
uits and
Enge 1
Meats
Dairy
Cereals
Eggs
Vegetables Beverages
Sugar
Homogeneity
Aggregation
Meats
Dairy
142.10a
. 00007b
Cereals
140.32
1037.76
.00042
.00103
Eggs
678.45
5921.35
2593.67
.00006
.000
2 .0
0008
Fruits and
Vegetables
2.24
188.35
33.04
.00055
.0005
.0025
Beverages
.47
36.44
2.51
.00001
.00026
-00051
Sugar
503.66
391.18
277.61
.00003
.00026
.00007
Fats
459.38
1829.03
611.08
.00001
.00015
3.6E-10
1283.44
.00041
119.70
.00006
152.60
.00005
851.08
2.11E-7
.002
3.55
12.61
16.54
.001
8.86
.005
1.13
.006
25.83
-045
4.46
2.25
-009
.00011
4.27
1094
252.41
.011
.00032
.00005
7.67
653.86
86.90
119.59
-122
.00043
.00003 .00002
55.82
aEstimated variance
of th
e error
for
the
localized
Slutsky
condition
with ordinary least
squares
bEstimated variance of
th
e error
for
the
localized
Slutsky
condition with mixed
estimators (from
estimators for demand systems parameters.
Table
5)
for demand systems parameters.
489
data. F i n a l l y , a l t e r n a t i v e n o n l i n e a r e s t i m a t o r s a r e suggested w i t h r e l - a t i v e r e s t r i c t i o n we igh ts and we igh ts o f t h e f u l l s e t o f S l u t s k y r e - s t r i c t i o n s r e l a t i v e t o t h e sample data, meet ing predetermined t a r g e t l e v e l s f o r t h e e r r o r va r iances r e p o r t e d i n Tab le 6.
A 1 ternative Eetlmators
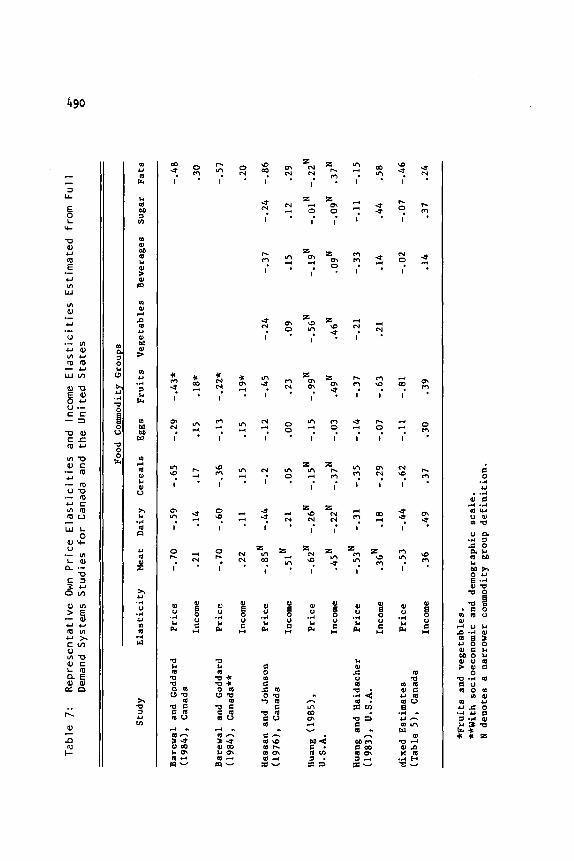
I n Table 7, t h e own-price and income e l a s t i c i t i e s for t h e e i g h t com- m o d i t i e s f rom s e l e c t e d r e l a t e d s t u d i e s o f demand systems have been sum- marized. Obvious ly , commodity d e f i n i t i o n s d i f f e r e d g r e a t l y between s t u d i e s . Where p o s s i b l e , p a r t i c u l a r l y f o r meat, t h i s d i f f e r e n c e i n corn- mod i t y d e f i n i t i o n s has been i n d i c a t e d . From Tab le 7 observe t h a t t h e es t ima tes p r o v i d e d by Tab le 5 ( t h e mixed e s t i m a t o r s ) a r e r e l a t i v e l y con- s i s t e n t w i t h va lues r e p o r t e d f rom t h e s e l e c t e d o t h e r s t u d i e s . These d i f f e r e n t s t u d i e s rep resen t a l t e r n a t i v e s p e c i f i c a t i o n s , exac t imposi- t i o n s o f t h e r e s t r i c t i o n s , i .e . , i n t h e case o f Huang (1985) and Huang and Haidacher (1983) , and f i n a l l y , t h e use o f survey and t ime s e r i e s d a t a .
I t i s c l e a r f rom t h i s comparison, r e c o g n i z i n g t h e d i f f e r e n c e s i n the commodity groups, t h a t t h e e s t i m a t o r s ob ta ined by combining t h e S l u t s k y c o n d i t i o n s and t h e sample i n f o r m a t i o n on a 40-60 b a s i s a r e r e l a t i v e l y c o n s i s t e n t w i t h those o f Hassan and Johnson (1976). F u r t h e r s e l e c t e d comparisons t o Canadian es t ima tes f r o m survey d a t a by Barewal and God- da rd and U n i t e d S t a t e s t ime s e r i e s es t ima tes by Huang (1985) and Huang and Haidacher (1980) a r e i n f o r m a t i v e , a l s o . A major i m p l i c a t i o n f rom these comparisons i s t h a t on t h e b a s i s o f key parameters, i.e.. t h e ones f o r which the most e x t e n s i v e p r e v i o u s e m p i r i c a l i n f o r m a t i o n i s a v a i l - ab le , t h e mixed e s t i m a t o r s produced r e l a t i v e l y more p l a u s i b l e r e s u l t s . For t h i s reason, mixed w i t h l o c a l , s t o c h a s t i c S l u t s k y c o n d i t i o n s appear f rom t h i s e m p i r i c a l e x e r c i s e t o be a t t r a c t i v e f o r demand systems est ima- t i o n . Fo rc ing r e s t r i c t i o n s t h a t a r e h i g h l y a t v a r i a n c e w i t h t h e sample d a t a (Table 6) leads t o e m p i r i c a l r e s u l t s t h a t a r e d i f f i c u l t t o j u s t i f y based on p a s t e m p i r i c a l r e s u l t s .
Conclusions
There a r e a number o f conc lus ions t o be drawn f rom t h i s e x p l o r a t o r y e m p i r i c a l exe rc i se . F i r s t , u n t i l t h e theo ry o f market demand r e s u l t s i n s p e c i f i c a t i o n s t h a t produce e s t i m a t o r s t h a t a r e improved over those p ro - v i d e d by o r d i n a r y l e a s t squares and t h e sample i n f o r m a t i o n a lone, i t i s l i k e l y t h a t some fo rm o f t h e S l u t s k y c o n d i t i o n s w i l l be a p p l i e d f o r es- t i m a t i n g market demand systems. Secondly, i t i s w e l l known t h a t t h e S l u t s k y c o n d i t i o n s do n o t h o l d i n market demand systems un less h i g h l y s p e c i a l i z e d s e p a r a b i l i t y r e s t r i c t i o n s , i m p l y i n g behav io r t h a t i s implau- s i b l e i n t h e c o n t e x t o f d i saggrega ted commodity groups, a r e app l i ed . The e m p i r i c a l r e s u l t s ob ta ined a p p l y i n g t h e S l u t s k y c o n d i t i o n s e x a c t l y i n e s t i m a t i n g a food demand system suppor t t h i s t h e o r e t i c a l r e s u l t . T h i r d , combining t h e S l u t s k y c o n d i t i o n s e m p i r i c a l l y w i t h t h e t ime s e r i e s market d a t a produced e s t i m a t o r s p l a u s i b l e i n v a l u e and w i t h r e l a t i v e l y sma l l s tandard e r r o r s compared t o those i n Tab le 1 .
Tabl
e 7:
Repr
esen
tati
ve O
wn Pr
ice
Elas
tici
ties
and
In
come
Ela
stic
itie
s Es
tima
ted
from
Ful
l De
mand
Sy
stem
s St
udie
s fo
r Ca
nada
an
d th
e Un
ited
St
ates
t
W
0
~ ~
~~
~~
Food
C
omm
odity
Gro
ups
Stu
dy
E
last
icit
y
Mea
t D
airy
C
erea
ls
Egg
s F
ruit
s V
eget
able
s B
ever
ages
S
ugar
F
ats
Bar
ewal
and
G
odda
rd
(198
41,
Can
ada
Bar
ewal
and
G
odda
rd
(198
41,
Can
ada*
*
Has
san
and
Joh
nso
n
(197
61,
Can
ada
Hua
ng (
1985
),
U.S.A.
Hua
ng a
nd H
aid
ach
er
(19831, U.S.A.
Mix
ed
Est
imat
es
(Tab
le 5
1,
Can
ada
Pri
ce
Inco
me
Pri
ce
Inco
me
Pri
ce
Inco
me
Pri
ce
Inco
me
Pri
ce
Inco
me
Pri
ce
Inco
me
-.70
.21
-.70
.22
-.asN
.51N
.45N
-.53
N
-.62
N
.36N
-.53
.36
-.59
.14
-.60
.ll
-.44
-21
-.26
N
-. 2Z
N
-.31
.18
-.44
.49
-.65
.17
-.36
.15
-.2 .05
-.15
N
-.37
N
-.35
-.29
-.62
.37
-.29
.15
-.13
.15
-.12 .oo
-.
15
-.03 -. 14
-.07
-.11
.30
-.43
* . 1 a*
-. 22*
.19*
-.45
.23
-. 9gN
.49N
-.37
-.63
-.81
.39
-.24
-.37
.09
-1.5
-.56
N
-.19
N
.46N
. 09
N
-. 21
-.3
3
.21
.14
-.0
2
.14
-.24
.12
-.O
IN
-.09
N
-.ll
.44
-.07
.37
-.48
.30
-.57
.20
-.a6
.29
-.22
A
.37N
-.1
5
.58
-.46
.24
*F
ruit
s an
d v
eget
able
s.
**W
ith
soci
oec
on
om
ic a
nd d
emog
raph
ic
sca
le.
N d
eno
tes
a n
arro
wer
com
mod
ity
gro
up
de
fin
itio
n.
Implications of this empirical exercise for the future relate largely to the information in Table 6, evaluating individual Slutsky conditions with ordinary least squares and mixed estimators for the demand system parameters. Clearly, all the Slutsky conditions do not apply with the same level of error in the sample data. This result i s consistent with more structured results for homogeneity and symmetry that have been de- veloped recently for the Rotterdam system (Taylor, Shonkwiler, and Theil 1986; Thei I , Shonkwi ler, and Taylor 1985). Tests of individual Slutsky conditions can be utilized in developing a fuller appreciation for the results of applied demand systems work and in producing demand systems parameter estimates.
We do not claim to have provided a solution to the demand systems es- timation problem with the mixed estimation results in Table 5. Instead, we have developed an explanation for why the exactly restricted and or- dinary least squares demand systems parameter estimates differ so radi- cally and an approach for combining these two sources of information more flexibly. Additional testing with different functional forms, im- proved rationales for localizing restrictions and different approaches to combining the sample and prior information are suggested. These re- sults and perhaps Monte Carlo eva uations o f the correspondence of mar- ket level and individual restrict ons may lead to improved estimates of the market demand parameters for ood that are now used widely in policy analysis and forecasting.
[Received October 1984, Accepted March 19861
References
Agriculture Canada. Handbook of Food Expenditure Prices and Consumption. Ottawa. 1983-
Barewal, S., and Goddard, 0. The Parameters of Consumer Food Demand -- in Canada. Economics Branch Publication, Agriculture Canada, Ottawa. 1984.
Blanciforti. L . , and Green, R. D. "An Almost Ideal Demand System Incor- porating Habits: An Anlysis of Expenditures on Food and Aggregate Commodity Groups." Review of Economics and Statistics 54 (1983): 51 1-515.
Brandow, G. E. Interrelationships Among Demands for Farm Products and Implications for Control of Market Supply. Pennsylvania Agricultural Experiment Station Bulletin 680, University Park, 1961.
Byron, R. P. "The Restricted Aitken Estimation of Sets of Demand Relations." Econometrica 38 (1970) : 816-830.
Chavas, J. P. "Structural Change in the Demand for Heat." American -- Journal of Agricultural Economics 65 (1983): 148-153.
Court, R. H. "Uti I ity Maximization and the Demand for New Zealand
492 Meats." Econometrica 35 (1967) : 424-446.
Deaton, A. S., and Muellbauer, J. Economics and Consumer Behavior. New York: Cambridge Un ivers i ty Press. 1980.
Diewert. W. E. "Generalized Slutsky Condit ions f o r Aggregate Consumer Demand Functions." Discussion paper 76-05, Un ive rs i t y o f B r i t i s h Co- lumbia, 1976.
Eisenberg, B. "Aggregation o f U t i l i t y Functions." Manaaement Science 7 (1961): 337-350-
Methods. New York: Springer-Verlag. 1984. Fomby, T. B.; H i l l , R. C.; and Johnson, S. R. Advanced Econometric
George, P. S., and King, G. A. Consumer Demand f o r Food Commodities ----- i n the United States w i t h Pro iec t ions fo r 1980. Monograph 26, Un ive rs i t y o f Ca l i f o rn ia , Davis, 1971.
Giannini Foundation
Goddard. 0. "An Analysis o f Aaareaate Canadian Demand f o r Food a t Home -- - and Away from Home." Canadian Journal of Aa r i cu l tu ra l Economics 31 (1983) : 239-318.
Hassan, 2. A., and Johnson, S. R. Consumer Demand f o r Major Foods i n Canada. Ag r i cu l tu re Canada, Economics Branch No. 76/2. A p r i l 1976.
Huang, K. S. "U. S. Demand f o r Food: A Complete System o f Income Ef fec ts . " USDA/ERS Technical B u l l e t i n No. 1714,
Huang, K. S., and Haidacher, R . C. "Est imat ion o f a Compos mand System f o r the United S,tates." Journal o f Business S t a t i s t i c s 1 (1983): 285-291.
Pr ice and 985 *
t e Food De- - and Economic
Johnson, S. R . : Hassan, Z.A.; and Green, R . 0. Demand Systems Estimation. Ames: Iowa State Press. 1984.
Johnson, S. R., and Safyur t lu , A. N. "A Demand Mat r ix f o r Major Food Commodities i n Canada." Marketing and Economics Branch Working Paper 5/84. Agr i cu l tu re Canada, Ottawa, 1984.
Judge, G. G.; Yancey, T. A.: and Bock, M. E. "Propert ies o f Estimators A f t e r Prel iminary Tests o f S ign i f i cance Wh,en Stochast ic Res t r i c t i ons are Used i n Regression." Journal o f Econometrics 1 (1973): 29-47.
Mantel l , R. " Imp l ica t ions of Microeconomic Theory f o r Commodity Excess Demand Functions." I n F ron t i e rs g Q u a n t i t a t i v e Economics Vol. I I I A (Ed.) H. 0. I n t r i l i g a t o r . Amsterdam: North-Holland Pub l ish ing Com- pany. 1977.
Ph
Po
ips, L . Applied Consumption Analysis. Amsterdam: North-Holland Publ ishing Company. 1974.
lak, R. A., and Wales, T. J. llOemographlc Var iables i n Demand Analysis." Econometrica 49 (1981): 1533-1551.
493
Pope, R.; Green, R.; and Eales, J. "Testing for Homogeneity and Habit Formation in a Flexible Demand Specification of U. 5 . heat Consump- tion." American Journal of Aqricultural Economics 62 (1980): ,
778-784.
Salvas-Bronsard, L. "Estimating Systems of Demand Equations from French Time-Series of Cross-Section Data." Annales de I'INSEE 30 (1978) : 543-64.
Salvas-Bronsard, L . , and Bastien, E. " A Note on the Estimation of Com- plete Demand Systems from Canadian Household Budget Data." Canadian -- Journal of Economics 17 (1984): 48-61.
Sonnenschein, H . "Do Walras' Identity and Continuity Characterize the Class of Communi ty Excess Demand- Functions?" Journal of Economic Theory 6 (1973a) : 345-354.
Sonnenschein. H. "The Utility Hypothesis and Market Demand Theory." Western Economic Journal 1 1 (1973b): 404-410.
Statistics Canada. Family Food Expenditure Surveys. Ottawa. 1974, 1976, 1978.
Taylor, T. G.; Shonkwiler, J. S . ; and Theil, H. "A Monte Carlo and Bootstrap Testing of Demand Homogeneity." Economic Letters 20 (1986) : 55-57.
Theil, H. "On the Use of Incomplete Prior Information in Regression Analysis.'' Journal of American Statistical Association. 58 (1963) : 40 1-4 14.
Theil, H . ; Shonkwiler, J. S.; and Taylor, T. G. "A honte Carlo Test of Slutsky Symmetry." Economic Letters 19 (1985): 331-332.
Yancey, T. A.; Judge, G. G.; and Bock, h . E. "A hean Square Error Test When Stochastic Restrictions are Used in Regression." Communications - in Statistics 3 (1974): 755-768.