recombinant human growth hormone (r-hgh) to treat hiv-associated adipose redistribution syndrome...
TRANSCRIPT
Recombinant human Growth Hormone (r-hGH)
to treat HIV-associated Adipose Redistribution Syndrome (HARS): 12-Week Induction and
24-Week Maintenance TherapyCarl Grunfeld, MD, PhD
Professor of Medicine, UCSFChief, Metabolism and Endocrine Sections, VAMC
Veterans Affairs Medical CenterSan Francisco, CA
Melanie Thompson, Stephen Brown, Gary Richmond, Daniel Lee, Norma Muurahainen, Donald P. Kotler
and the Study 24380 Investigators Group

Background: HARS• Increased Visceral Adipose Tissue (VAT) often
accompanied by subcutaneous lipoatrophy
• Both have metabolic consequences
• Characterized by abdominal fat accumulation (truncal fat, primarily VAT); may occur with subcutaneous fat depletion
• Patients may also exhibit:- Dyslipidemia, insulin resistance, glucose
intolerance- Excess dorsocervical fat (“buffalo hump”)- Poor quality of life, particularly psychological
distress

Healthy HARS
SAT* Less SAT*
VAT More VAT
Visceral Adipose Tissue on Abdominal Cross-sectional CT Scan (L4-L5 Level)
*Subcutaneous Adipose Tissue (SAT)

Phase III Trial Design: Study 24380
o Double-Blindo Placebo-Controlledo N = 325o Duration 36 weeks:
o 12 Wks Induction o 24 Wks Maintenance (ARM A only)
PRE-SPECIFIED EFFICACY ENDPOINTS: INDUCTION PHASE: Reduction of VAT at Week 12 (GH 4 mg DD vs Placebo DD)
MAINTENANCE PHASE: During Weeks 12 to 36, less than 50% of pts on GH 2 mg AD regain >50% of VAT that they lost during the induction phase (baseline to Week 12)
Baseline 12 Wks 24 Wks 36 Wks
Randomized
3:1
Placebo DD
GH 2 mg AD
Placebo AD
Placebo AD Placebo ADGH 4 mg DD
GH 4 mg DD
GH 2 mg ADR
ARM A = 244
ARM B = 81
Weeks 0 - 12 Weeks 12-36
Ope
n-la
bel e
xten
sion
S
tudy
253
73
n = 92
n = 73
n = 93
n = randomized and received study drug

Endpoints & Eligibility: Study 24380
Induction and Maintenance Therapy Endpoints (EP):Primary EP:
• VAT at Week 12
Key Secondary EP:• Trunk fat on DXA• Fasting lipid profile• Maintain reduced
VAT
Eligibility Criteria• Documented HIV infection• Receiving antiretroviral therapy• Excess VAT by anthropometric
criteria• Men: WC > 88.2 cm and WHR
0.95• Women: WC > 75.3 cm and
WHR 0.90
• Not diabetic or receiving medications for diabetes
• Lipid-lowering agents permitted• Glucose tolerance criteria
• Fasting glucose < 110 mg/dL 2-hr glucose < 140 mg/dL after 75 g oral glucose load
VAT = Visceral Adipose Tissue on CT scan at L4-5
WC = Waist circumference
WHR = Waist:Hip Ratio

Baseline Characteristics: Study 24380
CharacteristicPlacebo(n=79)
4 mg DD (n=243) p-value
Age (yrs)* 45 ± 0.8 45 ± 0.4 0.365
% Female 11 (14) 36 (15) 0.846
CD4 (cells/mm3)* 493 ± 32 501 ± 18 0.814
BMI (kg/m2)* 27.8 ± 0.5 27.2 ± 0.2 0.629
% Body Fat 22 ± 1 22 ± 0.5 0.432
CT VAT (cm2)* 135 ± 7 136 ± 4 0.620
DXA Trunk Fat (kg)* 12.3 ± 0.5 11.8 ± 0.3 0.346
DXA Limb SAT (kg)* 6.1 ± 0.5 5.6 ± 0.2 0.289
Use of PI (n [%]) 50 (62) 152 (62) >0.999
Use of NRTI (n [%]) 81 (100) 228 (93) 0.015
Use of NNRTI (n [%]) 37 (46) 114 (47) 0.898
*Mean ± SEM

-30-25-20-15-10-505
10
VAT
SAT
% C
han
ge
fro
m b
asel
ine
*
*5% loss
Placebo r-hGH 4 mg DD
VAT & SAT (CT scan)
Primary and Secondary Endpoints,Baseline to Week 12: Study 24380
Decrease in VAT > SAT on r-hGH Decrease in Trunk Fat > Limb Fat on r-hGH
-30-25-20-15-10-505
10
Trunk fat
Limb SAT
Placebo r-hGH 4 mg DD
*
*
% c
han
ge
fro
m b
asel
ine
*p < 0.001 for r-hGH vs. Placebo
Trunk Fat & Limb Fat (DXA scan)
-5
0
5
10
HDL
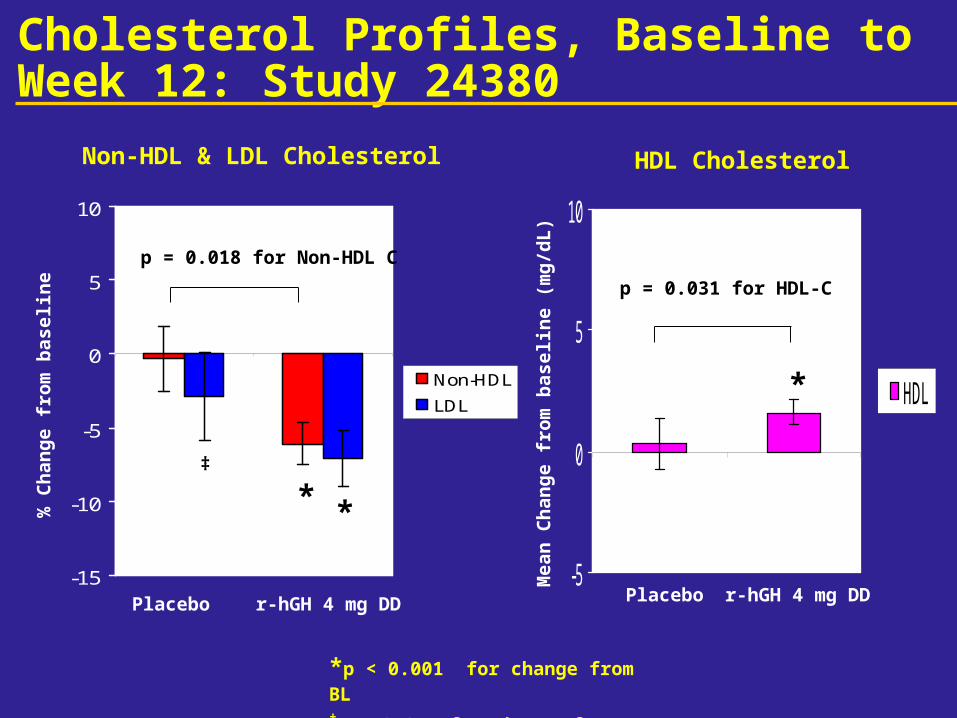
Cholesterol Profiles, Baseline to Week 12: Study 24380
*p < 0.001 for change from BL‡p < 0.05 for change from BL
Non-HDL & LDL Cholesterol
-15
-10
-5
0
5
10
Non-HDL
LDL
Placebo r-hGH 4 mg DD
*% C
han
ge
fro
m b
asel
ine
*
‡
HDL Cholesterol
p = 0.018 for Non-HDL C
p = 0.031 for HDL-C
*
Mea
n C
ha
ng
e fr
om
bas
elin
e (m
g/d
L)
Placebo r-hGH 4 mg DD

-40-35-30-25-20-15-10-505
1015
VAT: Weeks 12 to 36 VAT: Baseline to Week 36
Maintenance Therapy: Study 24380
• Major efficacy EP for maintenance was met: Less than 50% on r-hGH maintenance regained more than 50% of VAT lost during induction
• Endpoint: Failure Rate = % who re-gained > 50% of VAT lost during induction
• Placebo FAILED;
53.7% regained more than 50% of VAT lost
• r-hGH 2 mg AD SUCCEEDED; 40.3% regained more than 50% of VAT lost
All Patients (ITT)
‡ from baseline, p = 0.295 between groups
Patients who lost VAT from Weeks 1 to 12
‡ from baseline, p = 0.473 between groups
GH-Placebo
-25-20-15-10
-505
1015
p = 0.027‡
- 7.9 cm2
Mea
n C
han
ge
(cm
2 )
- 15.7 cm2
p < 0.001‡
GH-GH 2ADGH-Placebo
p <0.001‡
p = 0.008‡
-10.0 cm2
Mea
n C
han
ge
(cm
2 )-26.6 cm2
GH-GH 2AD

100
200
300
400
500
600
BL Wk 12 Wk 24 Wk 36
*p < 0.001
* *
24380 Safety: CD4, Fasting Glucose, IGF-I, Insulin AUC in those receiving r-hGH induction-maintenance (Baseline-Week 36)
80
90
100
110
120
BL Wk 2 Wk 4 Wk 12 Wk 16 Wk 24 Wk 26 Wk 28 Wk 36
Mean fasting glucose (mg/dL)
0
2000
4000
6000
8000
10000
BL Wk 12 Wk 24 Wk 36DD-PL-PL DD-AD-AD
Mean Insulin AUC (IU/mL-minute)Mean IGF-I (ng/mL)
Mean CD4 counts (cells/L)
200
300
400
500
600
700
BL Wk 12 Wk 36

Most Common Adverse Events (10%)*Week 12, Study 24380
Adverse Event, n (%)Placebo(n=81)
4 mg DD(n=244) p-value
Edema peripheral 4 (5) 113 (46) <0.001
Arthralgia 14 (17) 95 (39) <0.001
Pain in extremity 3 (4) 46 (19) <0.001
Headache 3 (4) 39 (16) 0.004
Hypoesthesia 0 34 (14) <0.001
Myalgia 3 (4) 34 (14) 0.014
Blood glucose increased 2 (3) 33 (14) 0.003
Paresthesia 3 (4) 25 (10) 0.107
*Overall, ~95% of events were only mild to moderate in severity.All serious adverse events were unlikely related, except for 1 possibly related SAE (migraine).

Most Common AEs (10%), n (%)
4DD-PL-PL(n=93)
4DD-2AD-2AD(n=92) p-value
Upper respiratory tract infection
15 (16) 7 (8) 0.110
4DD-PL-PL 4DD-2AD-2AD
Typical AEs, n (%) (n=93) (n=92) p-value
Edema peripheral 4 (4) 6 (7) 0.536Arthralgia 5 (5) 8 (9) 0.405Pain in extremity 5 (5) 2 (2) 0.444Headache 4 (4) 5 (5) 0.747Hypoesthesia 1 (1) 5 (5) 0.118Myalgia 2 (2) 2 (2) >0.999Blood glucose increased 3 (3) 6 (6) 0.330Paresthesia 4 (4) 4 (4) >0.999
Most Common AEs and Typical AEs*Weeks 12-36; Study 24380
*Overall, ~95% of events were mild to moderate in severity.All serious adverse events unrelated or unlikely related, except 1 possibly related SAE (basal cell skin carcinoma).

Induction Therapy (r-hGH 4 mg/day, Weeks 1-12) Significant reduction in VAT on r-hGH 4mg/day versus Placebo Reduction in trunk fat Improvement in cholesterol profile
Maintenance Therapy (r-hGH 2 mg alt day) Fewer than 50% of patients on r-hGH regain >50% of VAT lost during
induction therapy Improvement in cholesterol profile
Safety Profile of r-hGH: as anticipated AEs mostly mild to moderate Greater loss of VAT and trunk fat - than of abdominal SAT and limb
fat Transient increases in glucose, HbA1c, and insulin AUC
Summary & Conclusions: Study 24380

Thanks to all 24380 Study Subjects, Thanks to all 24380 Study Subjects, Study Personnel, Advisors, and InvestigatorsStudy Personnel, Advisors, and Investigators
Acknowledgements
Gary Blick, Norwalk, CTCynthia Brinson, Austin, TXStephen Brown, West Hollywood, CACalvin Cohen, Boston, MADaniel Coulston, Spokane, WAEric Daar, Los Angeles, CAGeorge Drusano, Albany, NYMichael Dube, Indianapolis, INJeffrey Fessel, San Francisco, CAMarshall Glesby, New York, NYCarl Grunfeld, San Francisco, CAKeith Henry, Minneapolis, MNDonald Kotler, New York, NYDaniel Lee, San Diego, CAKen Lichtenstein, Denver, COArdis Moe, Los Angeles, CA
Anne Morris, Springfield, MA Julio Montaner, Vancouver, BCRichard Pollard, Sacramento, CABruce Rashbaum, Washington, DCGary Richmond, Miami, FLMichael Saag, Birmingham, ALSteve Santiago, Miami, FLMorris Schambelan, San Francisco, CAMike Somero, Palm Springs, CACorklin Steinhart, Miami, FLAlan Tenorio, Chicago, ILMelanie Thompson, Atlanta, GAVilma Vega, Sarasota, FLChristine Wanke, Boston, MADavid Wheeler, Annandale, VAMichael Wohlfeiler, North Miami Beach, FL Antonio Urbina, New York, NY

Back-up Slides
0
20
40
60
80
100
120
140
160
180
200
0
20
40
60
80
100
120
140
160
180
200
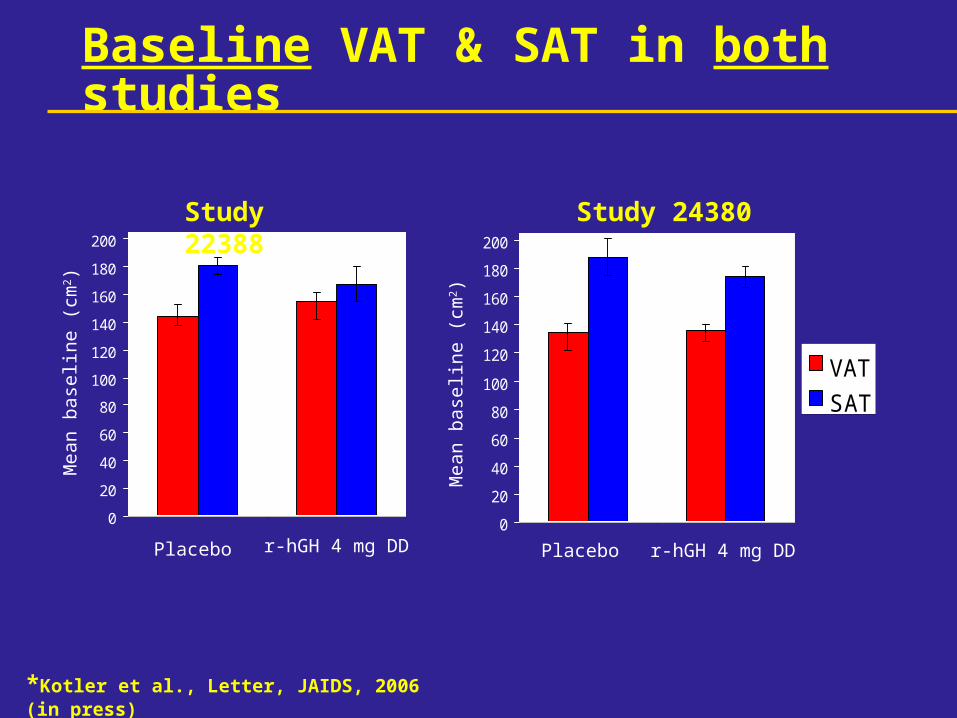
VAT
SAT
Mea
n ba
selin
e (
cm2)
Placebo r-hGH 4 mg DD
Baseline VAT & SAT in both studies
Study 24380
*Kotler et al., Letter, JAIDS, 2006 (in press)
Placebo r-hGH 4 mg DD
Study 22388
Mea
n ba
selin
e (
cm2)

-45-40-35-30-25-20-15-10-505
10
VATSAT
Mea
n ch
ange
fro
m b
asel
ine
(cm
2)
*
*
Placebo r-hGH 4 mg DD
Mean Change in VAT & SAT during 12-Week Induction Therapy in Both Studies
Greater percent decrease in VAT than SAT on r-hGH
Study 24380
*p < 0.001 compared to placebo, corrected data (Kotler et al., Letter, JAIDS, 2006, in press)
*p < 0.001 compared to placebo
-45-40-35-30-25-20-15-10
-505
10
VATSAT
Placebo r-hGH 4 mg DD
Study 22388
*
*
Mea
n ch
ange
fro
m b
asel
ine
(cm
2)

HbA1c and HIV-1 RNA levels, Baseline to Week 36: Study 24380
4.5
5
5.5
6
6.5
BL Wk 12 Wk 36
DD-PL-PL
DD-AD-AD
Mean HbA1c (%)
0
10
20
30
40
50
60
70
80
90
100
Baseline Week 12 Week 36
DD-PL-PL
DD-AD-AD
Study Group
Proportions of patients with HIV-1-RNA 400 copies/mL

-25
-20
-15
-10
-5
0
5
10
Non-HDL
LDL
GH-Placebo GH-GH 2 mg AD
Mea
n C
han
ge f
rom
ba
selin
e (m
g/d
L)
**
All Patients
GH-Placebo GH-GH 2 mg AD
Mean Change in Non-HDL and LDL Cholesterol, BL to Week 36: Study 24380
‡p < 0.05 for change from BL*p < 0.001 for change from BL
No significant differences - GH-GH 2 mg AD and GH-Placebo maintenance groups
Dyslipidemic at Baseline†
†Non-HDL-C 130 mg/dLLDL-C 100 mg/dL
-25
-20
-15
-10
-5
0
5
10
Non-HDL
LDL
Mea
n C
han
ge f
rom
ba
selin
e (m
g/d
L)
‡

-5
0
5
10
HDL
Dyslipidemic at Baseline†All Patients (ITT)
Mean Change in HDL Cholesterol, Baseline to Week 36: Study 24380
*p < 0.001 for change from BL
No significant differences - GH-GH 2 mg AD and GH-Placebo maintenance groups
*
Mea
n C
han
ge f
rom
ba
selin
e (m
g/d
L)
GH-Placebo
*
GH-GH 2 mg DD
†HDL-C <40 mg/dL
-5
0
5
10
HDL
*
Mea
n C
han
ge f
rom
ba
selin
e (m
g/d
L)
GH-Placebo
*
GH-GH 2 mg DD

-15
-10
-5
0
5
10
15
-25
-20
-15
-10
-5
0
5
10
15
VAT: Weeks 12 to 36 Percent change VAT: BL to Week 36
Maintenance Therapy, Study 24380
• Major endpoint for Maintenance was met: No more than 50% of pts regained more than 50% of the VAT lost during induction therapy
• Pre-specified Endpoint:Failure Rate = Percentage of patients who (during Wks 12-36) regained > 50% of VAT lost during r-hGH induction therapy• Placebo FAILED; 53.7%
regained more than 50% of VAT lost
• r-hGH dosed 2 mg AD SUCCEEDED; 40.3% regained more than 50% of VAT lost
All Patients (ITT): 24380
‡ from baseline, p = 0.367 between groups
Patients who lost VAT from Weeks 1 to 12
% C
han
ge
% C
han
ge
‡ from baseline, p = 0.911 between groups
p < 0.001‡
p = 0.014‡
p = 0.018‡ p = 0.103‡
GH-GH 2ADGH-Placebo
GH-GH 2ADGH-Placebo
+3.1% -3.5%
+0.8% -14.7%