recommendation from the scientific committee on
TRANSCRIPT

SCOEL/SUM/123 December 2008
Recommendation from the Scientific Committee on Occupational Exposure Limits
for Flour Dust
8 hour TWA: (see recommendation)
STEL (15 min) : (see recommendation)
Notation: sensitizer
Substance identity "Flour dust" refers to dust coming from finely milled or otherwise processed cereal. Hypersensitivity reactions as well as irritant symptoms caused by flour dust constitute a well recognized occupational problem world-wide. Most data on flour dusts have been derived from studies on wheat (Triticum sp.) and rye (Secale cereale), and to a lesser extent on barley (Hordeum sp.) and oats (Avenea sativa). From the point of view of hazard assessment, all these taxonomically related cereals, belonging to the family Poaceae, are relevant. The allergens they contain have been shown to cross-react with each other, indicating that these allergens are common to different species. Flour from corn or maize (Zea mays) is not included in the present risk assessment, as maize flour seems to present a low allergenic potency (Crippa & Pasolini 1997; Park et al 1998) and less cross-sensitisation with other cereal grain flours (Heiss et al 1996; Baldo et al 1980; Kalveram & Forck 1978). Other sensitizing flour dusts from non-cereal grains, such as soy (Glycine hispida) and buckwheat (Fagopyrum escalentum) are also excluded for taxonomical reasons. The flour dust in the bakery industry may contain several other non-cereal components, so called dough-improvers, such as a variety of enzymes (e.g. α-amylase of various origin, malt enzymes, cellulase, hemi-cellulase, xylanase), chemical ingredients (e.g. preservatives, bleaching agents, antioxidants), flavourings, spices, and other additives (e.g. baker’s yeast, egg powder, sugar) as well as contaminants such as storage-related mites and microbes (Tiikkainen et al 1996). Several of these components are sensitizers. α-Amylase is an important sensitizer small amounts of which (0.1 to 1.0 mg/g flour) are naturally present in wheat (Jauhiainen et al 1993; Burdorf et al 1994). α-Amylase may be of different origin which may determine its

2
allergenic properties (Vanhanen 2000); most commonly it is derived from fungal organisms such as Aspergillus oryzae or A. niger. The dose-response data used for the present risk assessment are derived from studies on cereal flour dust sensitisation, and therefore this recommenndation applies to flour dust from wheat and other cereals. Physical and biochemical properties Wheat is the primary cereal grain used in bread making. Seeds are composed of endosperm (85%), husk (13%) and germ (2%). The milling process separates the endosperm from husk and germ and reduces the particle size of the endosperm. Wheat flour is made from the endosperm. This wheat flour contains starch and four different groups of proteins (water soluble albumins, globulins, prolamins (gliadin), and glutelins (glutenin)). Both gliadins and glutenins form viscous complexes, called gluten, which determine the structure and texture of bread to a great extent. The proteins present in flour dust are potential allergens. The strongest allergic potency has been observed with water-soluble albumin fractions in vitro (Baldo & Wrigley 1978; Prichard et al 1985), but the allergic potency of gliadin, globulin and glutenin protein fractions should not be ruled out (Walsh et al 1985). The number of potent dust flour allergens from these four protein fractions is large. In one study, 40 different allergens were identified by crossed immuno-electrophoresis (Blands et al 1976). Sander et al. (2001) reported that each patient showed an individual IgE-binding pattern with 4 to 50 different protein spots in the immunoblots. The IgE-antibodies in sensitized reacted with several of these flour allergens, although individual reaction profiles showed large variability (Sutton et al 1984). Airborne flour dust particle sizes have been measured by several investigators. Lillienberg and Brisman (1994) showed a bimodal distribution of aerodynamic diameters of flour dust, using an IOM dust spectrometer. The smallest particles were around 5 µm, and the bigger ones around 15-30 µm. Over 50% of the particle mass had an aerodynamic diameter over 15 µm. Using the IOM personal inspirable aerosol spectrometer, Burdorf et al. (1994) estimated that the thoracic fraction contributed 39% to the total mass of inhalable dust. The respirable fraction (particles ≤4) amounted to 19%. Sandiford et al. (1994c) measured that approximately 9%, 52% and 20% of the airborne flour proteins were borne on particles 6 µm diameter in the bakery dough-brake, bakery roll-production and in the flour mill-packing areas, respectively. The investigators conclude that in dusty areas up to 20% of the airborne flour particles are of a diameter likely to allow them to be deposited in the bronchial airways and alveoli. Characterization of allergens The molecular weights of identified flour allergens vary between 12-64 kDa (Fränken et al 1991; Pfeil et al 1990; Sandiford et al 1994b). The major allergens (about 15 kDa) of flours belong to the group of the α-amylase inhibitors (Fränken et al 1994; Gomez et al 1990) which prevent insect α-amylases from harming the cereal. The

3
glycosylated forms of these proteins have been suggested to be the most potent allergens (Sanchez-Monge et al 1992). Some allergens from different cereals are chemically and functionally so closely related, that cross-reactivity occurs. Block et al. (1984) showed the existence of cross-antigenicity between different cereal grains, by using radio-allergosorbent (RAST) inhibition tests. The degree of cross-reactivity closely paralleled their taxonomic relationship and appeared to be in the following order of decreasing closeness: wheat, triticale, rye, barley, oat, rice and corn. Baldo et al. (1980) showed that the sera from subjects sensitised to wheat and rye flour reacted with seed extracts of 12 different cereals, for instance wheat, rye, barley, and oats. In studies on wheat allergens, most sera from sensitised workers reacted with allergens having a protein mass of 12-17 kDa (Gómez et al 1990; Pfeil et al 1990; Sandiford et al 1990; 1995). The mayor types of allergens of 12-15 kDa belong to the α-amylase/trypsin inhibitor family (Boisen 1983; Fränken et al 1994; Posch et al 1995; Sandifjord 1994b; Weiss et al 1997). Purified enzymes of this enzyme inhibitor family have been shown to be allergenic, both in vitro (Sanchez-Monge et al 1992; Fränken et al 1994) as well as in vivo (Armentia et al 1993), and this was irrespective of the cereal species used (García-Casado et al 1996). For instance, García-Casado et al. (1995) isolated a rye flour protein of about 13.5 kDa, as well as its barley homologue. The rye component was recognized in vitro by IgE of allergic patients and provoked positive responses in 15 out of 21 baker's asthma patients (71%) when skin prick tests were performed. Its barley homologue showed no detectable in vitro reactivity and caused positive responses in only one-third of patients. Kinetics The location where flour dust particles will most likely deposit is influenced by several factors. The particles’ size, density, shape, aerodynamic properties, as well as the volume of respiration determine the deposition of the particles in the lung. In general, particles having an aerodynamic diameter of 5 to 30 µm are deposited in the naso-pharyngeal region. Particles with lower aerodynamic diameters are deposited in the trachea, bronchial and bronchiolar region or in the alveolar region (≤ 1 µm). The American Conference of Governmental Industrial Hygienists (1999) uses the terms inhalable (≥10 µm, 100 µm cut-point), thoracic (4 -10 µm) and respirable (≤ 4 µm) particulate mass for Threshold Limit Values for particulates that may be hazardous when inhaled. Substantial amounts of flour dust particles are over 10 µm in diameter and, therefore, they remain in the upper respiratory tract. In dusty areas up to 20% of the airborne flour particles are of a diameter likely to allow them to be deposited in the bronchial airways and alveoli (Sandifjord et al 1994c). Macrophages and the mucociliary system are responsible for the clearance of flour particles from the lungs. However, heavy exposure may lower the ability of macrophages to eliminate particles, which may result in penetration of the dust particles into the interstitium. (Parkes 1994; Tiikkainen et al 1996). Analytical methods

4
The EU-countries have adopted a standard which defines three categories of conventions for selective sampling (European Committee for Standardisation 1993). The inhalable fraction is the fraction of airborne particles inhaled through the nose and mouth. The thoracic fraction is the fraction of inhaled particles penetrating beyond the larynx, and the respirable fraction is the one penetrating to the un-ciliated airways. The work of defining and specifying the sampling devices fulfilling the requirements of the standard is ongoing. Up to now several different filters and samplers have been used for flour dust sampling which makes it difficult to interpret dust measurements. For example, Lillienberg and Brisman (1994) found that there was a linear correlation between the IOM sampler and the traditional Millipore cassette, but the IOM collects almost twice as much flour dust as the conventional total dust sampler. Personal sampling should generally be emphasised because it determines the exposure of different individuals or task groups. Stationary sampling gives usually lower dust concentrations than personal sampling and reflects the general area situation and is suitable for preventive measures. Most of the results are expressed as arithmetic means (AM) with a standard deviation and range. The distributions of total dust are often log-normal, and geometric means (GM) and deviations should be used. The most recent instrument for sampling inhalable dust is the IOM inhalable dust sampler which was developed to follow the criteria for inhalable dust. (Nieuwenhuijsen et al 1995a; Lilienberg & Brisman 1994). To measure respirable dust fractions size-selective heads have been used (Nieuwenhuijsen et al 1994).
The allergen content of the dust can be evaluated by recently developed immunoassays (Sandiford et al 1994a; Houba et al 1996a; Wiley 1997), in which allergens bind to specific antibodies. Sandiford et al. (1994a) developed a method for measuring airborne wheat flour allergens in bakeries and flour mills, using polyclonal rabbit IgG-antibodies in a Radio-Allergo-Sorbent-Test (RAST) whereas Houba et al. (1996a) used an anti-wheat IgG4 serum pool from bakery workers in an Enzyme- Linked Immuno-Sorbent Assay (ELISA). Both methods measure the total spectrum of allergens in wheat flour. A method more specific for one of the major allergens in wheat flour, the 15 kDa alpha-amylase inhibitor protein, uses monoclonal antibodies (Wiley 1997). These techniques are not yet standardised for routine monitoring. Uses and exposure Flours from cereal grains are used for human and animal consumption. Exposure to flour dust occurs mainly in bakeries, where mixing, dough-making and bread-forming, as well as cleaning are the dustiest tasks, and in mills, where milling, packing, cleaning and maintenance are associated with exposure. Other occupations involving flour dust exposure include confectionery (weighing, mixing, production), pasta and pizza bakeries, animal feed plants, malt factories (drying, sieving, packing) and agriculture (milling, feeding). In the baking industry small companies, often family enterprises, with less than five employees dominate the branch. Especially in smaller enterprises it is common to move from one task to another. Mills can also be divided into small and large industrial sites. Typical work tasks for a miller are grain receiving and handling, milling, sacking or bagging. In larger mills special cleaning staff is employed.

5
Studies on exposure levels have used varying sampling strategies and sampling equipment. Sometimes essential information has not been reported, such as information on sampled dust fraction and duration of sampling. Results are, therefore, not always comparable. Results on exposure levels in bakeries and mills have been summarised in Tables 1 and 2. In summary, bakers working in the dough making area (dough making and bread-forming) usually were exposed to the highest dust concentrations with mean levels varying-from 2.3 - 8.6 mg/m 3. Mean flour dust exposure levels of oven workers varied from 1.1 - 3.2 mg/m 3. Bakery workers involved in slicing and packing of the bread or other products usually were exposed to levels less than 1 mg/m3. Two studies examined the variability in full-shift inhalable dust exposure levels more closely. In both studies, the type of occupation was considered as the most important determinant of dust exposure and the best way to categorize bakery workers into exposure groups for studying dose-response relationships (Nieuwenhuijsen et al 1995a; Houba et al 1997). In these studies, job title explained 43-50% of the variability in dust exposure levels. No important differences in dust exposure levels were found between the bakeries in both studies. A study on 55 UK bakeries assessing exposure levels in relation to job tasks and bakery size revealed that "micro" (1-9 employees) and "small" (10-49 employees) had higher mean levels than "medium-sized" (50-249 employees) and "large" (>250) bakeries (Elms et al 2004). Measuring inhalable dust exposures by 208 long-term personal samples (8 h TWA, IOM samplers, GF/A Millipore filters), resulted in a median level of 3.7 mg/m3, 75th percentile at 7.7 mg/m3 (table 1). It was reported that 17% of results exceeded the UK MEL of 10 mg/m3. Interestingly, only 27 % of bakeries were aware of the existence of a MEL or a STEL. In bakeries with appointed safety representatives, exposure levels were lower. In general, the knowledge of elementary working practices to reduce dust levels and exposures was poor. Only 28 % of bakeries possessed a copy of the booklet released by the Health and Safety in Bakeries Liaison Committee (1998) on guidance to reduce exposures. For instance, in 82% of bakeries flour dusting by hand throwing was employed in stead of the recommended use of dredgers or sprinklers (Elms et al 2004). Few studies describe exposure levels in flour milling industry. Overall, exposure levels seem higher in flour milling operations than in the baking. Some studies report extremely high exposure levels exceeding 100 mg/m3; however, without specifying sampling and analytical techniques (Bergmann et al 1979; Taytard et al 1988; Fakhri 1992). More detailed information was reported in a South African study (Bachmann & Myers 1991). Average total dust levels ranged from 0.5 mg/m 3 (office workers) up to 1.4 mg/m 3 (millers), 3.5 mg/m 3 (cleaners and sweepers and bag handlers), and 17.6 mg/m 3 (shovel workers, grain packers) (Table 2). Short-term exposures to high concentration of flour dust are known to be frequent in bakeries. Although there is no univocal consensus as regards the duration of peak exposures, these denote mostly exposure periods from 30 seconds to four minutes. These contribute to time-weighted averages and may be essential in the progress of sensitisation. Continuous registration of exposure levels showed that during the work-shift peak exposures occurred frequently, whereas between those peak exposures almost no exposure took place. The peak exposures were related to work activities (Pater et al 2002) .Lilienberg & Brisman (1996) examined the peak exposure
6
concentrations of flour and frequency of peaks in dough makers and bread formers. Tipping flour, mixing dough and manual handling of flours were the dustiest tasks where concentrations varied from a few mg/m3 up to 100 mg/mg3. The duration of the peaks were 3-4 min and 2-6 peaks per hour were recorded. Cleaning the bins in bakeries have given peak values (total dust) of 390 mg/m3 and maintenance cleaning in mills of 458 mg/m3 (Nieuwenhuijsen et al 1995b). The relationship between inhalable dust and airborne flour allergen levels are of importance in the assessment of health risks of wheat flour dust exposure. The personal exposure to wheat allergen has been correlated to personal inhalable dust levels in a couple of studies (Houba et al. 1996a; Pater et al. (2002). Both studies used the same assay for airborne wheat flour. The results have been given in Table 3. Results should, however, still be interpreted with care for several reasons. Currently, not all wheat flour antigens are characterised and therefore some could be missed in the assays. Although the most recent immunoassays enable to screen for a broad variety of wheat allergens, these techniques still need to be standardised and validated. Therefore, airborne allergen measurements are still inadequate for assessing a health risk of wheat flour dust exposure. Results on personal dust measurements and its allergen content as well as inhalable dust measurements and allergen content have been given in Tables 3 and 4. Health effects Observations in man Irritation and sensitisation Cereal flour dust cause respiratory, conjunctival and dermal reactions in exposed workers. The most severe reaction is asthma, known as baker’s asthma. Typical symptoms include asthma-like symptoms such as cough, wheezing and shortness of breath with or without concomitant decrease in pulmonary function tests required for an diagnosis of asthma,, rhinitis (frequent sneezing, nasal obstruction and rhinorrhea), conjunctivitis (itching and inflamed, red eyes). These symptoms are either allergic in origin or caused by non-specific irritation. For the interpretation of symptoms it is important to make a distinction between non-immunological and immunological responses. In practice, symptoms are associated with irritation if immunological responses are ruled out. Zuskin et al. (1994b) showed that most respiratory symptoms in a group of confectionery workers (n=71; mean exposure 11 years) were caused by irritation of the respiratory tract. Skin prick tests were performed with food extracts (e.g. flour, wheat and rye, milk, cacao) and respiratory symptoms and smoking histories were recorded. The high prevalence of acute symptoms such as coughing, dyspnea, throat irritation) during the work shift did not display any, significant association with immunological tests. In another study, involving 344 workers from bakeries and mills, it was suggested that respiratory symptoms, measured by skin tests using wheat flour and α -amylase, may have resulted from direct irritation (Cullinan et al 1994). In both studies, these conclusions were made, because the authors could not correlate the results with immunological responses.

7
In a study performed in the Netherlands, 393 bakery workers were surveyed of which 23% reported work-related rhinitis and/or chest tightness, but in only 30% of this group (7% of all bakery workers) an immunological response to wheat flour or fungal α –amylase could be demonstrated (Houba 1996). Although the authors noted that the sensitivity of the immunological test (IgE-test) was not perfect and that there are also other potential bakery allergens that have not been tested, they consider a non-specific reaction to the dusty environment in the bakeries as one of the likely explanations for this finding. Most workers with work-related symptoms, but without an immunologic response (sensitisation) to wheat flour or fungal amylase, had IgE antibodies to non-occupational allergens (58%), had a history of allergic symptoms to common allergens (27%), or reported chronic respiratory symptoms outside the job environment (55%). Smith and Lumley (1996) screened 3,450 bakery workers with a questionnaire. An overall prevalence of work-related asthmatic symptoms of 4.4% was found. After a closer examination by a physician, only 9% of this group had occupational asthma. The majority was thought to arise from irritation or aggravation of pre-existing asthma. In a group of workers (n=679) from 18 different UK flour mills, the prevalence of respiratory symptoms and their relationship to sensitisation to wheat flour allergens and fungal amylases was determined. 20.5% described upper respiratory tract symptoms of an occasional nature, which the investigators related to short-term exposures to high levels of dust. Only three individuals were identified as having symptoms due to wheat flour allergy. Of the workers, 1.2% was sensitised to wheat flour allergens (positive skin prick test). Levels of inhalable dust were high; median levels of 6.2 mg/m 3 were measured (range 1-10 mg/m 3; TWA 8 h) for production personnel and a median of 18.7 mg/m 3 for hygiene operatives. Overall, 43% of the samples taken exceeded 10 mg/m 3 (TWA 8 h). The authors concluded that the principal cause of symptoms were non-specific irritant effects related to short-term exposures to high levels of total inhalable dust (Smith et al 2000). Brisman et al. (1998) examined 12 currently flour-exposed bakers in a cross-sectional study. They were tested for nasal symptoms, and their current and cumulative exposure to inhalable flour dust was estimated after exposure measurements. Personal inhalable dust measurements among bakers working as a dough maker or bread former ranged from 1.0 to 3.8 mg/m3. Of the 12 bakers, 10 reported at least 1 nasal symptom, a proportion significantly higher than that of the controls (office workers without occupational exposure to dust or any other known nasal irritant or sensitizer). Two bakers were sensitised to wheat. Closer examination of the nasal symptoms revealed mucosal inflammation. Furthermore, the investigators proposed that the inflammation might be non-allergic, characterized by the release of myeloperoxidase from neutrophils and of hyaluronic acid from fibroblasts and subsequent lymphatic oedema. The conclusion that exposure to inhalable flour dust may cause nasal inflammation, must be interpreted with caution, because the population studied was small and the observed relationship was considered to being influenced by the strong responses of the two sensitised bakers. A study on 324 supermarket in-store bakeries evaluated the accuracy of a health surveillance programme focusing on work-related chest symptoms together with specific IgE either to wheat flour or fungal α-amylase as a surrogate for occupational

8
asthma (Brant et al 2005). The surveillance included three stages from a short questionnaire on respiratory symptoms (stage 1), a further questionnaire on work-relatedness of symptoms, if any (stage 2) to an IgE-analysis of a serum samples (stage3). To assess the accuracy, a cross-sectional survey was undertaken in 20 bakeries. The surveillance system resulted in a quarter of those with symptoms reporting that symptoms were work-related; 61 % of those with work-related chest symptoms had specific IgE antibodies to wheat or fungal α-amylase, which corresponded to 1 % of the bakers. However, the cross-sectional survey arrived at a prevalence of 4%. The authors concluded that the surveillance system underestimated the disease and that research is needed to achieve a more efficient method of surveillance in bakeries. Epidemiological studies Prevalence of sensitisation against wheat flour allergens Studies on the percentage of workers who are sensitised after exposure to (wheat) flour dust are listed in Table 5. As indicated in the table, the prevalence rates for sensitisation vary between 5 and 28% among bakery workers. Similar and even higher prevalence rates have been reported for workers in flour mills (Fakhri 1992; Bergmann et al 1997). The origin and concentration of the extracts used for skin prick testing differed among the studies. This could be explained by the absence of standardised extracts for flour dust allergens. This and the fact that for the skin prick tests various methods and cut-off time points were used, hamper a valid comparison of the study results. In spite of these differences, the available studies clearly show that immunological sensitisation to wheat flour is common in bakery and flour milling workers. Pavlovic et al. (2001) evaluated the prevalence of bronchial hyperreactivity in bakers, and correlated bronchial hyperreactivity with positive skin tests and atopy. Out of one hundred workers (54 males and 46 females) 11 % of the bakers were positive in a bronchial challenge test with methacholine and 2% with wheat flour. The skin prick test was positive in 15% of the bakers. The prevalence of atopy was 18%. In one recent study, the frequency of work-related symptoms and the clinical relevance of sensitisation to allergens in bakers have been investigated. Three groups participated: a group (n=43) comprising subjects not working in bakeries; a group A (n=89) comprising bakery workers; and, a group B (n=104) comprising bakery workers filing a claim for compensation of baker's asthma. For sensitisation, a skin prick test with wheat, rye and other allergens was carried out, as well as blood analyses to the presence of specific IgE antibodies against wheat and rye. The test revealed that 0% (control), 16% (group A) and 47% (group B) scored positive for the skin prick test (wheal > 3mm) against wheat allergens, and 5%, 11% and 37% against rye allergens, respectively. In addition, 15% (control), 53% (group A) and 62% (group B) scored positive concerning the presence of IgE antibodies (> 0.35 IU/ml) against wheat allergens, whereas in respectively 10%, 34% and 50% of the subjects IgE antibodies were found against rye (Baur et al 1998b). Furthermore, the authors made a distinction between asymptomatic (n=45) and symptomatic (n=142) bakers, selected from group A and B. Bakery-associated symptoms included eczema, conjunctivitis, rhinitis and dyspnea. Of the asymptomatic bakers nobody responded positive on the

9
skin prick test (wheat and rye), whereas 44% and 34% of the symptomatic bakers scored positive for wheat and rye allergens, respectively. Concerning IgE antibodies, 14% and 13% of the asymptomatic bakers and 65% and 52% of the symptomatic bakers scored positive against wheat and rye allergens, respectively. The outcomes between symptomatic and asymptomatic bakers differed significantly (p .0.0001) on all the parameters measured (Baur et al 1998). Armentia et al. (1990) investigated the prevalence of bakers’ asthma and sensitisation to various work-related allergens in the Northwest region of Spain. The total number of workers evaluated was 1,395, distributed among 454 factories (bakeries, pastry factories, animal feed). Of these, 139 workers showed symptoms of rhino-conjunctivitis and/or asthma, 35 of which showed allergic sensitisation to wheat flour. The major percentage of sensitisation (demonstrated by the skin prick test and specific IgE) was to wheat flour (100%), and in decreasing order to barley flour (48.6%), grass pollen (45.7%) and mites (28.6%). The investigators did not find positive reactions to gluten, alpha-gliadin and alpha-amylase. The average time of exposure before onset of symptoms was 12.8 ± 9.6 years. In 57.1% of the population studied, onset of symptoms occurred after less than 10 years exposure to wheat flour. Two studies suggest that there is some background level of sensitisation in the general population. In one, Houba et al. (1996b) reported positive reactions in skin prick tests with a wheat extract in 2.1% of the 416 tested laboratory animal workers. The number of IgE positive workers in the population has been estimated to be approximately 6% (serum concentration of specific IgE against wheat flour allergen, >0.35 IU/ml) (Heederik & Houba 2001). In the other study, Gautrin et al (1997) found in a cohort of 769 apprentices starting career programs, that 1.2% and 4.1% of apprentices in animal health and dental hygiene, respectively, were sensitised to wheat flour compared to 5% of baker's apprentices. This background level may be explained by cross-reactivity among other (related) allergens, such as pollen (Gautrin et al 1997), in atopics, or by a lack of standardised methods for testing specific sensitisation. Prevalence of respiratory symptoms Prevalence rates of respiratory symptoms among bakery workers are summarised in Table 6. Zuskin et al. (1998) investigated the respiratory function and immunological status in 53 flour-processing workers in a Croatian confectionary industry and in 65 unexposed control workers in the same industry. A high prevalence of chronic respiratory symptoms was recorded varying from 5.7% (occupational asthma) to 28.3% (chronic coughing) in flour workers (control workers, 0.0% and 6.2%, respectively). There was also a high prevalence of acute symptoms that developed during the work shift in flour workers, being highest for coughing (50.9%) and eye irritation (54.7%) (data on controls not presented). In the flour processing area, the mean total dust was 12.3 mg/m3 (range: 2.4-17.1 mg/m3) and the respirable fraction was 1.9 mg/m3 (range: 0.5-2.7 mg/m3). These dust samples were taken over the entire work shift of 8 hours. Gimenez et al. (1995) compared the prevalence of respiratory symptoms, ventilatory impairment and variations in pulmonary function over a work shift, in a group of mill workers (n=142) exposed to wheat flour and in unexposed workers (n=37; controls).

10
Concentrations of the inhalable fraction of airborne flour dust (11 samples at seven work stations) ranged from 5 mg/m 3 (bagging flour) to 54 mg/m 3 (cleaning sifters). The duration of sampling differed by operation: for bagging flour it was 157 minutes and for cleaning sifters is was 96 minutes. The concentration of respirable particles (aerodynamic diameter < 5 µm) was low and sometimes below the detection limit. Only the peak expiratory flow rate and the forced expiratory flow rate at 75% of the forced vital capacity was significantly lower (p<0.05) in exposed workers compared to controls, both before and after the work shift. Workers with asthma (n=6) showed significant differences in lung function across the work shift. The prevalence of respiratory symptoms was significantly higher (p<0.05) in exposed workers compared to controls: any respiratory symptoms (56.3% versus 27.0%), usual coughing (14.8% versus 0.0%), morning phlegm (12.7% versus 0.0%) and usual phlegm (13.4% versus 0.0%). The authors could not exclude a healthy worker effect. A cohort comprising 487 randomly chosen Danish bakers was re-examined 5-6 years after the initial survey (Gadborg 1956) Nineteen of them had developed wheat flour sensitisation and 7 had developed a wheat flour induced respiratory allergy. This suggests an incidence rate for wheat flour sensitisation of about 10 per 1,000 workers per year. For respiratory allergic symptoms, an incidence rate of 3-4 per 1,000 per year was found. In another study, 880 bakers' apprentices were followed for 5 years (Herxheimer 1973). The percentage sensitised persons increased by year: 12% (2nd yr), 19% (3 rd yr), 27% (4th yr) and 30% (5th yr), using skin prick tests for sensitivity testing. Symptom rates “compatible to allergic rhinitis or asthma” rose as well from 0.2% to 7% (3 rd yr), but then dropped to 4.8% (5th yr). These data may have been influenced by the large drop-out; after having finished their apprenticeship, many young men left the workplace and could not be traced anymore (start, 100%; 1st year, 74%; 2nd yr, 48%; 3 rd yr, 33%; 4th yr, 11%; 5th yr, 4.2%). A Swedish retrospective cohort study, carried out in 1959 and 1989, involved 2,226 persons trained as baker, and two external reference groups. One group comprised per-sons, who went to the same trade schools as the bakers, but followed another program in the trade schools (I; n=1,258). The second group comprised persons selected at random from the Swedish population register (II; n=1,258) (Brisman et 1995). Asthmatic bakers had changed work significantly more than referents (2.5% versus 1.1% (both reference groups), p<0.05). Incidence rates of asthma for men during employment as a baker was 3.0 cases per 1,000 person-years, compared to 1.1 and 1.9 cases for reference groups I and II, respectively. This indicates that the incidence of asthma attributable to being a baker was 1-2 cases per 1,000 person-years. The relative risk of asthma for male bakers during employment compared to referents was 2.7 (95% confidence interval 1.3-6.0; reference I) or 1.6 (95% confidence interval 0.82-3.1; reference II). When all reference groups were combined and compared to employed bakers, the relative risk to asthma was 1.8 (95% confidence interval 1.3-2.6). For female bakers, no differences were found compared to their respective referents. The authors estimated that male bakers have an approximately double risk to develop asthma.

11
Time of onset between exposure, appearance of specific sensitisation and allergic Symptoms Several studies among bakery students show that sensitisation can occur within a few months after exposure to flour dust has started, whereas it can take several years for symptoms to develop. In one study comprising 258 baker's apprentices, the prevalence of positive wheat flour specific IgE tests in students after 4 to 20 weeks of exposure was as high as 17% (Popp et al 1994). Cullinan et al. (2001) investigated the incidence of specific IgE sensitisation and allergic respiratory symptoms among 300 new UK bakery and flour mill workers, without previous occupational exposure to flour. The follow-up time was 1-91month, median 40 months. The accumulation of cases (i.e. positive skin prick test to flour or alpha-amylase, chest symptoms, eye symptoms and skin symptoms) by time since first employment was highest during the first 12 months of employment, and approximated 50% of the incident symptoms and positive skin tests. Other studies have estimated the latency period for the development of respiratory symptoms by asking asthmatic bakers for the time since first exposure and the onset of first symptoms. The mean latency period for each study population varied from 4 to 13 years (Diederich et al 1955; Popp et al 1970; Järvinen et al 1979; Hartmann et al 1985; Brisman et al 1995; Smith et al 1996), and on individual levels this varied even more (months to >30 years). In a British study on 264 bakery workers, the median duration of employment before onset of chest symptoms was 1 year (1 month - 4.2 year), and of eye and nose symptoms 0.5 year (1 month - 3.3 year) (Cullinan et al 1994). However, the results may have been underestimated, because bakers working in the trade longer than 4 years had been excluded. De Zotti and Bovenzi (2000) investigated work-related respiratory symptoms among 125 trainee bakers. A questionnaire plus skin prick test with wheat flour and α –amylase allergens was performed at the first day and then after 6, 18 and 30 months. The cumulative incidence of work-related respiratory symptoms increased from 3.2% (first day), 3.4% (6 mo), 4.8% (18 mo) to 9.0% (30 mo). The work-related symptoms were significantly associated with a personal history of allergic diseases (odds ratio 5.8 (1.8- 18.2)) and skin sensitisation to wheat flour or α -amylase (odds ratio 4.3 (1.2-14.9). Dose-response relationships Studies on exposure-response relationships suitable for risk estimation have been compiled in Tables 10-11. Musk et al. (1989) performed a cross-sectional survey of 279 bakery workers in a modern British bakery. Employment was categorised by perceived dustiness and ranked from 0 (no exposure) to 10 (highest exposure). In general, the ranking correlated well with the concentrations of inhalable dust obtained from personal air measurements, although there was residual variation within some exposure ranks (e.g. geometric means: rank 6 (staff attending ovens or in cooking areas), 1.7 mg/m3
12
(range, 0.00-37.57); rank 10 (flour room staff, scone production staff), 6.6 mg/m 3 (range, 1.84-13.03)).All participants completed a self administered questionnaire on respiratory symptoms. Furthermore, lung function (spirometry) and skin prick tests were performed. Fourteen participants had a positive skin test to mixed flour. Logistic regression analysis of a positive skin test to one or more bakery allergens was significantly associated with atopy (OR, 16.3), a history of exposure in rank 6 or higher (OR 3.0, CI 95% 1.4-6.3), and the number of years worked in the bakery (10-yr period: OR, 1.8, range 1.5-2.8). Of the participants, 13% reported work-related chest symptoms and 19% work-related nasal symptoms. Statistical analyses were not made separately for each allergen from the work environment. Furthermore, possible associations between respiratory symptoms and exposure ranking or scores of the skin prick test were not presented. Cullinan and colleagues (1994) presented an initial cross-sectional phase of a cohort study in three modern British bakeries. The survey included 264 workers from bakeries and flour mills, without a previous flour exposure. The participants were divided into three flour dust (<1 mg/m3, 1-5 mg/m3, >5 mg/m3) or three wheat flour allergen (<101 µg/m3, 101-225 µg/m3 , >225 µg/m3 ) exposure categories according to job title. The prevalence of sensitisation to wheat flour extracts (skin prick test), tended to increase with intensity of dust exposure (low 2%, intermediate 6% and high 5%) (test for trend =0.28), which was slightly clearer with wheat allergen exposure (1, 5, and 6%, respectively) (test for trend p=0.099). By comparison, non-atopics were only sensitized if exposed to the highest dose levels, whereas several atopics were sensitised at lower dose levels. Furthermore, atopics were more often sensitized to work-related allergens than non-atopics. The authors did not test for statistical significance, but multiple regression analyses (correcting for age, gender, smoking and atopy) did not reveal an independent effect of allergen exposure, probably because of lack of sufficient power (data not presented). Average exposure was not given for the three exposure categories, and relationships between exposure and symptoms were not stratified for atopic status or work-related sensitization. In 2001, Cullinan and colleagues described a nested case-control analysis of the longitudinal phase of the same cohort. A total of 300 workers, who had never previously worked in this industry, were included in this analysis. Health information was obtained by a questionnaire. Skin prick tests were performed using a prepared extract of five Canadian and British wheat flours. As in the previous study, participants were divided into three exposure categories (inhalable dust, geometric means in mg/m3): 0.58 (low), 1.17 (medium), 4.37 (high); flour allergen (geometric means in µg/m3): 65 (low), 144 (medium), 296 (high)). Mutually adjusted odds ratios and 95% confidence intervals derived from logistic regression analysis showed a clear increase in chest, eye/nose and skin symptoms by increased exposure. Furthermore, skin prick tests with extracts of wheat flour revealed an increase in positive scores by increasing exposure (total dust exposure (OR, 95% CI): 1 (-, low), 5.0 (0.4-58, medium), 21 (1.2-363, high); flour allergen exposure (OR, 95% CI): 1 (-, low), 6.1 (0.5-71.0, medium), 14.0 (1- 199, high). Houba et al. (1998) conducted a cross-sectional study among 393 bakery workers from 21 bakeries to study the relationship between wheat allergen exposure and wheat sensitization and work-related allergic symptoms. All workers completed a short self-administered questionnaire. From 346 workers, venous blood was obtained and

13
analysed for total IgE and specific IgE antibodies to common allergens and to wheat flour. Personal inhalable total dust samples were collected in the worker’s breathing zone during full-shift periods of 6 to 8 hours. Wheat allergen exposure varied considerably among bakery workers, depending on the type of job and on the type of bakery (Table 3) (Houba et al 1996a). For the assessment of dose-response relationships, three wheat allergen exposure groups were formed according to job title, i) low (n=151, mean 0.2 µg/ m3 , range 0.03-7.7 µg/ m3 ), ii) intermediate (n=120, mean 3.5 µg/ m3 , range 0.03-74.6 µg/m3 ), and iii) high (n=178, mean 11.0 µg/ m3 , range 0.03-252.4 µg/ m3 ); the geometric mean total inhalable dust exposure levels for the three groups were, i) 0.46 mg/m 3 (low), ii) 0.78 mg/ m3(intermediate), and iii) 2.37 mg/ m3 (high). The prevalence of wheat flour sensitisation (specific IgE plus total serum IgE 100 kU/L) in the three exposure categories increased from 4.4% (low exposed category), 7.8% (intermediate exposed category) to 14.1% (high exposed category). The category-related increase was steeper if only atopics were taken into account (25%, 87/346) of the persons in study were atopic): from low to high exposed category: 4.6, 11.8 and 22.9%, respectively. The corresponding prevalence of non-atopics was 4.4, 6.4 and 11.1 %, respectively. Thus, the rate of sensitization did not differ among atopics and non-atopics in the lowest exposure category of corresponding to about 0.5 mg/m3. In fact, the rate of sensitization was roughly of the same order as among the occupationally non-exposed population (Gautrin et al. 1997, Houba et al.1996, Houba et al. 1998). Using conventional analysis, the data suggested a dose-dependent effect from an average cumulative exposure of 12 mg/m3 years corresponding to an exposure level of 1 mg/ m3. The conventional epidemiological analyses seemed to give evidence for the existence of an exposure threshold or "non observed effect level (NOEL)" for specific wheat sensitisation between 0.5 and 1 mg/ m3 inhalable dust" (Houba et al. 1998). The prevalence of work-related symptoms (rhinitis and/or chest tightness) in relation to wheat allergen exposure increased from 15.4% (low exposed category), 23.4% (intermediate exposed category) to 28.7% (high exposed category). In the group of workers, who were sensitised to wheat flour (36/346), the prevalence of symptoms ranged from 14.3 (1/7), 40.0 (4/10) and 52.6 % (10/19), respectively. In the non-sensitized group, corresponding rates were 15.5, 21.6 and 24.3 %, respectively. At the lowest exposure level, the rate of work-related symptoms did not differ between sensitized and non-sensitized. Chest tightness was reported by 7% (29/393) (Houba et al 1998, DECOS 2004). To what extent chest tightness corresponded to asthma remains uncertain. For example, 50% of the 29 workers reporting chest tightness were smokers, part of whom may have suffered from COPD. Heederik and Houba (2001) used the data of the previous study by Houba et al. (1998) to evaluate the presence of an exposure threshold using both conventional statistical analysis and a more advanced analytical approach (non-parametric generalized additive modelling and smoothed plots). The job titles were further divided into broader exposure categories: three by current, three by past, and five by cumulative exposures. The cumulative exposure appeared to fit the model best. Cumulative inhalable dust and wheat allergen exposure was calculated as the sum of the products of job (arithmetic exposures) and duration of the exposure in that particular job title; the bakery workers had on average worked 11.7 years in the baking industry. For the assessment of dose-response relationships five cumulative exposure groups were

14
formed, of which the corresponding prevalence ratios of wheat allergen sensitisation are shown in Table 8. Smoothed plots are given for inhalable dust in Fig 1 for the whole population including both atopics and non-atopics. In none of these curves representing smoothed plots can evidence of an exposure threshold be seen (Heederik & Houba 2001, DECOS 2004). Risk of sensitization clearly levelled off at higher exposure levels resulting in a less steep dose-response relationship (Fig.1). A similar levelling off in plots are shown in Fig 2, demonstrating a decrease in risk at higher exposure levels for atopics and sensitized persons with clinical symptoms (Fig 2). The authors, suggested that the decrease in risk at higher exposure levels may be caused by the healthy worker effect, in which symptomatically sensitised workers change to jobs with no or low exposure risks. This hypothesis receives support from several studies demonstrating that sensitization causes workers to leave the exposed work environment (Houba 1996; Houba et al 1998; Oostenbrink et al 2001). Especially asthma has been shown to cause workers to leave (Brisman et al. 2000). It is also possible that a migration of symptomatic and/or sensitized individuals towards tasks associated with lower exposure has taken place which could have cause an overestimation of sensitization, as well as symptoms, in the lowest exposure categories and explain the absence of a dose-related sensitisation rate in the 5.4 and 12 mg/ m3 categories. Such a migration may also have influenced calculations of a threshold. The authors, moreover, attempted to assess a LOEL by defining an unacceptable arbitrary increase in risk of sensitization of 1.5 or 2. Applying these prevalence ratios and using either the smoothed plot or the linear intrapolation between the five exposure categories, estimated LOEL-values between 1.3-1.8 (prevalence rate 1.5) and 2.3-3.6 mg/m3 (prevalence rate 2) of inhalable dust were obtained (Heederik and Houba 2001). In all calculations performed on the original, cross-sectional data by Houba et al. (1996, 1998)), a decline in the risk has been seen at levels above 3 mg/ m3 (Houba et al 1998, Heederik and Houba 2001). Heederik and Houba (2001) evaluated the role of atopy in two models. The first model assumed that the ratio of prevalence ratios for atopics and non-atopics per exposure category remains constant over the exposure range. The model assumes, moreover, that the difference in sensitization risk increases with increasing exposure. In this model there is interaction on an additive scale only. The second model allowed the effect for atopy to vary over different exposure categories allowing interaction on the multiplicative scale. The second model performed slightly better in terms of overall fit. Models for atopics and non-atopics showed steeper slopes for atopics with the risk levelling off at higher exposure levels. As also was pointed out, these models have certain weaknesses, for instance, the first model assuming a systematic elevated risk of sensitization for atopics, even in the absence of exposure. In general, the biological basis for choosing a particular statistical model or analytical approach is so far not established.

15
Figure .1 Dose-response relationship for estimated inhalable dust exposure with wheat specific sensitisation for the whole studied population (n=346). Adapted from Heederik & Houba 2001.
Figure.2 Dose-response relationship for estimated average inhalable wheat allergen exposure with wheat specific sensitisation (●, o) for the whole studies population (n=346) and for sensitisation accompanied by rhinitis () or asthmatic (∆) symptoms. Adapted from Heederik & Houba 2001.

16
Largely based on the data by Houba (1996) and Houba et al (1996a,b,1998) and Heederik and Houba (2001), the Dutch Expert Committee (DECOS 2004) chose to consider sensitization the most critical effect of flour dust exposure. The rationale for protecting against sensitization was that symptoms induced by non-specific irritation did not seem to occur at lower exposure levels than sensitization. Protecting against sensitization should, therefore, also protect against irritant-induced symptoms. The Dutch study by Houba and colleagues (Houba 1996, Houba et al 1998, Heederik & Houba 2001) was considered the most appropriate study for the risk estimation of specific sensitisation against wheat flour allergens. Assuming a linear relationship between inhalable dust exposure and flour dust sensitisation up to an exposure level of 3 mg/m3 and based on linear regression, the additional risk of sensitization risk at various exposure levels was calculated (DECOS 2004). Taking into account a background risk of sensitization of the general population of 4 % (Gautrin et al 1997; Houba et al 1996), the calculated additional risk referred to an excess sensitization under normal working conditions of eight hours a day, five days a week, during a life-long employment. The estimated additional sensitisation risk for wheat flour dust was presented as the concentration inhalable dust (time-weighted average) with excess sensitisation risk of 1 per 10 (10%), 1 per 100 (1%) and 1 per 1,000 (0.1%) persons. According to the DECOS (2004) calculations, a person who starts working in the bakery industry for the first time would have an additional risk of 10% to ever becoming sensitised to flour dust, if occupationally exposed to an average of 1.2 mg/ m3 inhalable dust. In a large Dutch study, Oostenbrink et al. (2001, DECOS 2004) investigated the prevalence of respiratory tract symptoms (rhinitis, asthma) and sensitisation to various work-related flour dust allergens. Participants underwent lung function tests and blood analysis, and completed a questionnaire. Of the 391 participants, 154 worked in traditional bakeries, 85 in large industrial bakeries, 83 in flour mills and 69 in the ‘raw material’ industry. In 11.5% of the workers, work-related asthma was found (disturbed lung function with or without medication/ rhino-conjunctivitis), and 8.2% of the workers suffered from work-related rhino-conjunctivitis (nasal or eye symptoms, normal lung function, no lung medication). Sensitisation to flour wheat allergens was found in more than 25% of the workers. Of these sensitised workers 52.3% had asthma, 33.7% rhinitis (without asthma) and 14.0% had no clinical symptoms. Furthermore, the investigators categorised all workers in five exposure categories, from low to high exposure, to study exposure-response relationships for the whole study population (Table 9). A significant relationship between exposure to wheat flour dust and sensitisation to wheat flour allergens (IgE class 1 or higher) was found. This relationship had a bell-shaped form, indicating that fewer workers were sensitized when exposed to high concentrations. In this study, no association was found between the levels of exposure and the presence of clinical symptoms. Using the crude data of the previous study, Peretz et al. (2003, DECOS 2004) analysed in more detail the relationship between exposure and specific sensitization. For this, she and her colleagues used a two-stage modelling approach (semi-parametric generalised additive modelling and a parametric logistic model), and combined actual measured exposure data with variance weighted estimates to reduce the effect of exposure measurement errors. With the analysis the authors confirmed that the overall exposure-response relationship seemed to be quadratic (bell-shaped). Overall, the risk

17
for sensitization increased with increasing exposure until about 2.7 mg/m3 (inhalable dust) or about 25.7 µgEQ/ m3 (wheat allergens). However, when looking more closely at the data, the investigators found some heterogenic outcomes among the four sectors of industry. The quadratic relationship was strongly driven by data from flour mills, whereas in the other three industries the relationship was best described in between a linear or quadratic one (Fig 3). Concerning the flour mill sector, the authors noted that the population characteristics in this sector differed from the other sectors; workers in this sector were exposed to the highest flour dust concentrations, whereas the number of atopics and sensitized workers was the lowest (atopy: traditional bakeries, 64%; industrialised bakeries, 55.0%; bakery ingredients industry, 50.3%; flour mills, 26.3%). The authors stated that the quadratic relationship suggests that selection bias (healthy worker effect) or immunological tolerance could have occurred. Selection bias is the more likely explanation as a similar decrease in risk at higher exposure was not observed in the other three sectors at the same exposure range.
Figure.3 Probability for sensitisation (P) as function of exposure to wheat allergens (logged µgEQ/m3). Results for dust exposure were similar (not shown) (Peretz et al 2003)
Atopy was a strong determinant for sensitization (50.6% atopics and 16.1% non-atopics). In a Swedish retrospective cohort study, Brisman et al. (2000) investigated the exposure-response relationship between estimates of inhalable dust exposure and the incidence rates of asthma and rhinitis, among 2,226 bakers and two control groups (n=931school controls; n=930 population controls). Information on the diseases and the exposure was obtained from a postal questionnaire. From a previous study performed by the same authors and experiences from working conditions in bakeries,

18
Brisman and colleagues distinguished three current estimated exposure categories, 1, 3 and 6 mg/m3 inhalable dust for the different combinations of the reported job-tasks. Also three different cumulative exposure groups were established: 1-9, 10-29, and .30 mg/m 3 years. The incidence rate of asthma in men increased by current exposure at time of onset from 0.5 to 7.3/1000 person-years in men (p for trend 0.001). No significant increase was observed in women (p=0.60). The incidence rate of asthma increased non-significantly by cumulative dose from 2.3 to 4.8 cases/1000 persons-years in men (p for trend 0.15) and from 2.0 to 5.5/1000 persons-years in women (p for trend 0.82). The incidence rate for rhinitis increased by current exposure at time of onset from 18.8 to 43.4 cases/1000 person-years in men (p for trend 0.0004) and from 29.6 to 38.5 cases/1000 person-years in women (p for trend 0.65). No statistically significant increases were observed by cumulative dose, either in men (p for trend 0.09) or in women (p for trend 0.48). The authors concluded that “the risk for asthma and rhinitis was increased by current exposure to dust at the onset of disease. This indicates that mean concentrations of inhalable dust should be < 1 mg/ m3 to prevent rhinitis and < 3 mg/ m3 if only asthma is considered”. Peak exposures are very frequent in certain tasks and operations in mills and bakeries. Typical short-term tasks associated with peak exposures exceeding shift averages in other tasks include cleaning operations in both mills and bakeries. In mills, high peak exposures are common in many cleaning tasks, in loading and unloading, grinding and sifting as well as bagging off. Similarly, peak exposures occur in bakeries in cleaning of flour silos, bins, break downs, in tipping areas, bread production, roll production and dough brake. Peaks may exceed 30-40 mg/m3 and the peaks frequently last for up to 30 minutes (Niewenhuijsen et al 1995b, Tiikkainen et al 1996, de Pater et al 2002, DECOS 2004). Peak exposures are likely to play an important role in inducing work-related health effects (Smith et al 2000). However, studies on dose-response have not been able to quantitatively assess the influence of high exposures of short duration on sensitization and work-related symptoms. Carcinogenicity studies Some reports have been published suggesting that workers in bakeries had higher risks for developing nasal or other respiratory tract cancers. Other reports, however, did not show any relationship between bakery workers and increased risk of cancer. Increased risks of uncertain significance of nasal cancer among bakers and pastry cooks were reported in a case-control study (period 1963-1967) (Acheson et al 1981). In a case-control study comprising 207 cases and 409 controls , significant excesses in risk of squamous nasal cell cancer were noted for bakers, pastry cooks and grain millers (OR=3.9, 95% 95% CI 1.2-12.8) (Luce et al 1992). Using the Swedish Cancer Environment Registry, which links cancer incidence with employment data, Malker et al. (1986) observed more nasal cancers for bakers and pastry makers than expected on the basis of the age and sex-specific nasal cancer incidence rates of the Swedish population (6 times that of the population as a whole). Significantly increased mortality rates for cancer of the respiratory tract for bakery workers in small plants (standardised mortality ratio of 136, 95% confidence interval limits 110-164, p=0.0033%) were found compared to all skilled workers (all economically active men) in a Danish death registry cohort study (Tüchsen & Nordholm 1986). However, exposure data were not available and the increased risk could not be attributed to any specific agent in the work environment. No increased mortality risk from respiratory cancers (nasal cancer or lung cancer) was found for bakery workers in a retrospective
19
cohort study among 327 male millers and bakers in England and Wales (Alderson 1987). Furthermore, no statistically significant association between hypopharyngeal and laryngeal cancer was found in a French study, in which 'never' and 'ever' flour dust exposed male patients were questioned. Odds ratios were 1.92 (95% CI 0.82 to 4.50) for hypopharyngeal cancer (n=21) and 1.52 (95% CI 0.69 to 3.34) for laryngeal cancer (n=22). These odds ratios were adjusted for age, smoking and alcohol habits (Laforest et al 2000). Asthma mortality Asthma mortality rates for bakery workers have been reported in a study performed in the US. Among the 184 death certificates examined (persons aged 20-35 years), with at least asthma contributing to the cause of death, were closer examined. Bakers appeared to have markedly higher mortality rates than expected, with almost nine times the age and race adjusted rates for the city of Chicago and 41 times the national rate (DeMers & Orris 1994). The committee noted that raw data were not presented and the results should be interpreted with care, also because of the small size of the study. The authors concluded that these bakers might suffer from early mortality because of chronic exposure. Only one case of baker's asthma with fatal outcome has been described, but special social circumstances were an important factor in this particular case (Ehrlich 1994). Effects on skin Allergic contact dermatitis among bakery workers has been reported from the beginning of this century (Grosfeld 1951; Bonnevie 1958; Heyl 1970; Teleky 1927), but the contact dermatitis was later attributed to the dough improvers ammonium and potassium persulphate, (Forck 1968; Young 1974). Still, occupational skin diseases are reported and may be a serious problem in the bakery occupation, with prevalence rates varying from 5 to 8% (Järvienen et al 1979; Hartmann 1986; Cullinan et al 1994). In Finland, 101 new cases with dermatosis among grain and flour dust workers were registered between 1980 and 1989; the annual incidence for dermatosis was estimated to be 0.6 per 10,000 workers (Tossavainen & Jaakkola 1994). There are a variety of agents that have been have been identified as potential dermal sensitizers, such as cereal flours (Pigatto et al 1987), cellulase, xylanase enzymes (Tarvainen et al 1991), fungal α -amylase (Schirme et al 1987), baker's yeast (Kortekangas-Savolainen et al 1994), cinnamon oil/cinnamic aldehyde (Nethetcott & Holness 1989), benzoyl peroxide (Baird 1945; Fisher 1989), certain emulsifiers ( Vincenzi et al 1995) and antioxidants (propyl gallate) (Bojs et al 1987)). Recommendation The symptoms induced by cereal flour exposure that should be prevented are symptoms from the respiratory tract and the eyes, such as rhinitis, conjunctivitis and, especially, asthma. The symptoms may be induced immunologically, mostly mediated by IgE-type antibodies, or by irritation. Symptoms induced by irritation are reversible, whereas immunologically induced sensitization is persistent. Allergic symptoms may thus continue even after cessation of occupational exposure to flour dusts. The available literature does not demonstrate a trustworthy threshold for any of the flour dust-induced effects.

20
Sensitization signifies the development of specific IgE antibodies to any of several flour dust allergens. The vast majority of studies on flour dust have been done on wheat. Sensitization to wheat allergen occurs in the general population not occupationally exposed at a prevalence rate of about 2-4%. In tasks associated with exposure to wheat flour, there is an excess risk of sensitization that becomes clearly dose-dependent at a time-weighted average of about 1 mg/m3 of inhalable flour dust. The dose-response curve was linear in the range 1 - 3 mg/m3 (Heederik & Houba 2001; Peretz et al 2003; DECOS 2004). Based on advanced analyses of dose-response data (Houba et al 1998, Heederik and Houba 2001), it has been calculated that a person who starts working in the bakery industry for the first time, would have an additional risk of 10% to ever becoming sensitized to flour dust over a working life of forty years, if occupationally exposed to an average of 1.2 mg/ m3 inhalable dust (DECOS 2004). Sensitization causes an about four-fold risk of developing respiratory symptoms (De Zotti and Bovenzi 2000). Sensitization as such should be considered a sentinel event that warrants preventive action at the work place. Sensitized workers ought to be subjected to intensified health surveillance. Due to the clearly increased risk of sensitized workers of developing symptoms, measures to reduce exposure should be taken. A retrospective incidence study suggests that the risk of nasal symptoms starts to increase at concentrations exceeding 1 mg/m3 inhalable flour dust in all bakery job tasks; the risk of asthma increases at levels above 3 mg/ m3, respectively (Brisman et al 2000). This is in rather good concordance with other studies (Cullinan et al 1994; 2001; Houba et al 1998). Studies on dose-response indicate that symptoms, especially symptoms from the lower respiratory tract, asthma, as well as sensitization, are rare in the range of 0.5-1,0 mg/m3 inhalable dust, which thus gives a range for a LOEL. (Houba et al 1998; Heederik and Houba 2001; Brisman et al 2000). As a general rule, the SCOEL committee does not recommend health-based OELs for sensitizers, as no threshold can be identified. However, in view of the large number of workers exposed and the relatively large data base, SCOEL recognizes that exposures ≤1 mg/m3 of inhalable flour dust would protect the majority of exposed workers from the on-set of disease and that the envisaged symptoms would be mild. However, concentrations <1 mg/m3 may trigger symptoms in already sensitized workers. As an OEL that protects all workers cannot be identified, it would be advisable to routinely apply good practices and health surveillance systems to bakery and mill environments. Peak exposures of short duration occur frequently in certain, easily specified, tasks within the bakery and flour mill industries. The importance of peak exposure of short duration for the development of sensitization and symptoms is likely to be considerable. Although a scientifically based STEL for flour dust cannot be established, efforts should be made to control peak exposures. Such measures include both technical interventions as well as improvement of working practices (Elms et al 2004). The measure of exposure of choice is inhalable flour dust. Reliable standardised methods for sampling of dust as well as analytical assays for inhalable dust are available.

21
References American Conference of Governmental Industrial Hygienists. Document on Flour Dust.
ACGIH, Cincinnati, 1999.
Acheson ED, Cowdell RH, Rang EH. Nasal cancer in England and Wales: an occupational survey. Br J Ind Med 1981; 38:218-224.
Alderson MR. Mortality of millers and bakers. Br J Cancer 1987; 55:695-696.
Armentia A, martin-Santos MJ, Quintero A, Fernandez A et al. Baker’s asthma: prevalence and evaluation of immunotherapy with wheat flour extract. Annals of Allergy 1990; 65: 265-272.
Bachmann M, Myers JE. Grain dust and respiratory health in South African milling workers. Br J Ind Med 991; 48: 656-662.
Baird KA. Allergy to chemicals in flour. J Allergy 1945; 16:195-198.
Baldo BA, Wrigley CW. IgE-antibodies to wheat flour components. Clin Allergy 1978; 8:109-124.
Baldo BA, Krilis S, Wrigley CW. Hypersensitivity to inhaled flour allergens - comparison between cereals. Allergy 1980; 35:45-56.
Baur X, Fruhmann G, Haug B, Rasche B, Reiher W, Weiss W. Role of aspergillus amylase in baker's asthma. The Lancet 1986; 1:43.
Baur X and Posch A. Characterized allergens causing baker's asthma. Allergy 1998; 53: 562-566.
Bergmann I, Wallenstein G, Rebohle E, Schneider WD. Berufsbedingte allergische und irritative Atemerkrankungen bei Müllern. Z ges Hyg 1997; 25: 287-290.
Blands J, Diamant B, Kallós P, Kallós-Deffner L, Løwenstein H. Flour Allergy in Bakers - Identification of Allergenic Fractions in Flour and Comparison of Diagnostic Methods. Int Archs Allergy Appl Immun 1976; 52:392-406.
Block G, Tse KS, Kijek K, Chan H, Chan-Yeung M. Baker's asthma - studies of the cross-antigenicity between different cereal grains. Clin Allergy 1984; 14:177-185.
Bohadana AB, Massin N, Wild P, Kolopp MN, Toamain JP. Respiratory symptoms and airway responsiveness in apparently healthy workers exposed to flour dust. Eur Respir J 1994; 7:1070-1076.
Boisen S. Comparative physico-chemical studies on purified trypsin inhibitors from the endosperm of barley, rye, and wheat. Z Lebensm Unters Forsch 1983; 176:434-439.
Bojs G, Nicklasson B & Svensson Å. Allergic contact dermatitis to propyl gallate. Contact Dermatitis 1987; 17:294-298.
Bonnevie P. Occupational allergy in bakery. In: Occupational allergy - lectures held during a course on occupational allergy, Stenfert Kroese NV, Leiden, The Netherlands, 1958.
Brant A, Nightingale S, Berriman J, Sharp C, Welch J, Newman Taylor AJ, Cullinan P.Supermarket baker's asthma: how accurate is routine health surveillance? Occup Environ Med 205; 62: 395-399.

22
Brisman J, Järvholm BG. Occurrence of self-reported asthma among Swedish bakers. Scand J Work Environ Health 1995; 21:487-493.
Brisman J, Torén K, Lillienberg L, Karlsson G and Ahlstedt S. Nasal symptoms and indices of nasal inflammation in flour-dust exposed bakers. Int Arch Occup Environ Health 1998; 71: 525-532.
Brisman J, Järvholm B and Lillienberg L. Exposure-response relations for self reported asthma and rhinitis in bakers. Occup Environ Med 2000; 57: 335-340.
Burdorf A, Lillienberg L, Brisman J. Characterization of exposure to inhalable flour dust in Swedish bakeries. Ann Occup Hyg 1994; 38:67-78.
Burstyn I, Teschke K, Kennedy SM. Exposure levels and determinants of inhalable dust exposure in bakeries. Ann Occup Hyg 1997a; 41: 609 - 624.
Crippa M, and Pasolini G. Allergic reactions due to glove-lubricant-powder in health-care workers. Int Arch Occup Environ Health 1997; 70: 399-402.
Cullinan P, Lowson D, Nieuwenhuijsen MJ, Sandiford C, Tee RD, Venables KM, McDonald JC, Newman Taylor AJ. Work related symptoms, sensitisation, and estimated exposure in workers not previously exposed to flour. Occup Environ Med 1994; 51:579-583.
Cullinan P, Lowson D, Nieuwenhuijsen M, Sandiford C, Tee RD, Venables KM, McDonald JC, Newman Taylor AJ. Work-related symptoms, specific sensitisation and exposure in a cohort of flour workers. Eur Resp J 1995; 8 (Suppl) 19:272s.
Cullinan P, Cook A, Nieuwenhuijsen MJ, Sandiford C, Tee RD, et al. Allergen and dust exposure as determinants of work-related symptoms ans sensitization in a cohort of flour-exposed workers; a casecontrol analysis. Ann Occup Hyg 2001; 45: 97-103.
DECOS. Wheat and other cereal flour dusts. An approach for evaluating health effects from occupational exposure. Dutch Expert Committee on Occupational Standards. No. 2004/020SH, The Hague, August 10, 2004
DeMers MP, Orris P. Occupational exposure and asthma mortality. JAMA 1994; 272:1575.
De Zotti R, Larese F, Bovenzi M, Negro C, Molinari S. Allergic airway disease in Italian bakers and pastry makers. Occup Environ Med 1994; 51:548-552.
De Zotti R, Molinari S, Larese F, Bovenzi M. Pre-employment screening among trainee bakers. Occup Environ Med 1995; 52:279-283.
De Zotti R, Bovenzi M, Negro C, Cirla A, et al. Specific inhalation challenge with wheat flour in workers with suspected baker's asthma. Int Arch Occup Environ Health 1999; 72: 335-337.
De Zotti R and Bovenzi M. Prospective study of work related respiratory symptoms in trainee bakers. Occup Environ Med 2000; 57: 58-61.
Diederich W, Lübbers P. Das Mehlasthma als Berufskrankheit. Zentralblatt für Arbeitsmedizin und Arbeitsschutz 1995; 5:189-197. [in german]
Ehrlich RI. Fatal asthma in a baker: a case report. Am J Ind Med 1994; 26:799-802.
Fakhri ZI. Causes of hypersensitivity reactions in flour mill workers in Sudan. Occup Med 1992; 49: 149- 154.
23
Elms J, Robinson E, Rahman S, Garrod A. Exposure to Flour Dust in UK Bakeries: Current Use of Contro measures. Ann Occup Hyg 2005;49:2005.
European Committee for Standardisation. Workplace atmospheres - Size fraction definitions for measurement of airborne particles. In: European Standard EN 481. 1993.
Fisher AA. Dermatitis due to cinnamon and cinnamic aldehyde. Cutis 1975; 16:383-388.
Fisher AA. Allergic baker's dermatitis due to benzoyl peroxide. Cutis 1989; 43:128-129.
Forck G. Vorkommen und Persistenz von Persulfatallergien. Berufsdermatosen 1968; 16:84-92. [in German]
Fränken J, Stephan U, Neuber K, Bujanowski-Weber J, Ulmer WT, König W. Characterization of allergenic components of rye and wheat flour (Secale, Triticum vulgaris) by western blot with sera of bakers: their effects on CD23 expression. Int Arch Allergy Appl Immunol 1991; 96:76-83.
Fränken J, Stephan U, Meyer HE, König W. Identification of alpha-amylase inhibitor as a major allergen of wheat flour. Int Arch Allergy Immunol 1994; 104:171-174.
Gadborg E. Allergy to flour. Thesis. 1956. Copenhagen. (as quoted by: Bonnevie P. Occupational allergy in bakery, 1958; and in: Thiel H & Kallweit C. Das Bäckerasthma - eine klassische allergische Berufskrankheit, 1984).
Clin Exp Allergy 1996; 26: 428-435.
Garcia-Olmedo F, Salcedo G, Sanchez-Monge R, Gomez L, Royo J, Carbonero P. Plant proteinaceous inhibitors of proteinases and -amylases. Oxford Surveys Plant Mol Cell Biol 1987; 4: 275-334.
Gautrin D, Infante-Rivard C, Dao TV, Magnan-Larose M, Desjardins D, Malo JM. Specific IgE-dependent sensitisation, atopy, and bronchial hyperresponsiveness in apprentices starting exposure to protein-derived agents. Am J Respir Crit Care Med 1997; 155: 1841-1847.
Gimenez C, Fouad K, Choudat D, Laureillard J, Bouscaillou P and Leib E. Chronic and acute respiratory effects among grain mill workers. Int Arch Occup Environ Health 1995; 67: 311-315.
Gómez L, Martin E, Hernández D, Sánchez-Monge R, Barber D, del Pozo V, et al. Members of the –amylase inhibitors family from wheat endosperm are major allergens associated with baker's asthma. FEBS letters 1990; 261: 85-88.
Hartmann AL, Wüthrich B, Deflorin-Stolz R, Helfenstein U, Hewitt B, Guérin B. Atopie-Screening: Prick- Multitest, Gesamt-IgE oder RAST? Schweiz med Wschr 1985; 115: 466-475. [in German]
Hartmann AL. "Berufsallergien bei Bäckern - Epidemiologie; Diagnose, Therapie und Prophylaxe; Versicherungsrecht." München-Deisenhofen, Germany: Dustri-Verlag Dr. Karl Feistle, 1986. [in German]
Health and Safety in Bakeries Liaison Committee. Guidance on dust control and health surveillance in bakeries, London, HSBLC 1998.
Heederik D, R Houba. An explorative quantitative risk assessment for high molecular weight sensitizers: wheat flour. Ann of Occup Hyg 2001; 45: 175-185.
24
Heiss S, S Flicker, DA Hamilton, D Kraft, JP Mascarenhas and R Valenta. Expression of Zm13, a pollen specific maize protein, in Escherichia coli reveals IgE-binding capacity and allergenic potential. FEBS letters 1996; 381: 217-221.
Herxheimer H. Skin sensitivity to flour in bakers' apprentices. The Lancet 1967; 1: 83-84.
Herxheimer H. The skin sensitivity fo flour of bakers' apprentices. Acta Allergologica 1973; 28: 42-49.
Heyer N. Backmittel als berufsbedingte Inhalationsallergene bei mehlverarbeitenden Berufen. Allergologie 1983; 6: 389-392. [in German]
Heyl U. Das Bäckerekzem. Therapeutische Umschau 1970; 27: 521-524. [in German]
Houba R. "Occupational respiratory allergy in bakery workers - relationships with wheat and fungal alpha-amylase aeroallergen exposure." Thesis. Wageningen, The Netherlands: Agricultural University Wageningen, Department of Occupational and Environmental Health, Wageningen, 1996.
Houba R, van Run P, Heederik D, Doekes G. Wheat antigen exposure assessment for epidemiologic studies in bakeries using personal dust sampling and inhibition ELISA. Clin Exp Allergy 1996a; 26: 154-163.
Houba R, Heederik DJJ, Doekes G, van Run PEM. Exposure-sensitisation relationship for a-amylase allergens in the baking industry. Am J Respir Crit Care Med 1996b; 154: 130-136.
Houba R, Heederik D, Kromhout K. Grouping strategies for exposure to inhalable dust, wheat allergens and -amylase allergens in bakeries. Ann Occup Hyg 1997; 41: 287-296.
Houba R, D Heederik, G Doekes. Wheat sensitisation and work related symptoms in the baking industry are preventable: an epidemiological study. Am J Resp Crit Care Med 1998; 158: 1499-1503.
Järvinen KAJ, Pirilä V, Björksten F, Keskinen H, Lehtinen M, Stubb S. Unsuitability of bakery work for a person with atopy: a study of 234 bakery workers. Ann of Allergy 1979; 42: 192-195.
Jauhiainen A, Louhelainen K, Linnainmaa M. Exposure to Dust and a-Amylase in Bakeries. Appl Occup Environ Hyg 1993; 8: 721-725.
Kalveram KJ and G Forck. Cross-reactivity between grass and corn pollen antigens. Int Arch Allergy Appl Immunol 1978; 549-553.
Kortekangas-Savolainen O, Savolainen J, Lantto R & Kalimo K. Immediate hypersensitivity to bakery, brewery and wine products in yeast-sensitive atopic dermatitis patients. Clin Exp Allergy 1994; 24: 836-842.
Laforest L, Luce D, Goldberg P, Bégin D, Gérin M, Demers PA, Brugère J, LeclercA. Laryngeal and hypopharyngeal cancers and occupational exposure to formaldehyde and various dusts: a case-control study in France. Occup Environ Med 2000; 57: 767-773.
Lillienberg L, Brisman J. Flour dust in bakeries - a comparison between methods. Ann
Occup Hyg 1994; 38 Suppl: 571-575.

25
Lilienberg L & Brsiman J. Peak exposure concentrations of dust in bakeries. In: Second International Symposium on Modern Principles of Air Monitoring. Sälen. Sweden 5-8 Febraury, 1996.
Luce D, Leclerc A, Morcet JF, Casal-Lareo A, Gérin M, Brugère J, Haguenoer JM, Goldberg M. Occupational risk factors for sinonasal cancer: a case-control study in France. Am J Ind Med 1992; 21: 163-175.
Malker HSR, McLaughlin JK, Blott WJ, Weiner JA, Malker BK, Ericcson JLE & Stone BJ. Nasal cancer and occupation in Sweden, 1961-1979. Am J Ind Med 1986; 9: 477-485.
Morren MA, Janssens V, Dooms-Goossens A, van Hoeyveld E, Cornelis A, de Wolf-Peeters C, Musk AW, Venables KM, Crook B, Nunn AJ, Hawkins R, Crook GD, et al. Respiratory symptoms, lung function, and sensitisation to flour in a British bakery. Br J Ind Med 1989; 46: 636-642.
Nethercott JR & Holness DL. Occupational dermatitis in food handlers and bakers. J Am Acad Dermatol 1989; 21: 485-490.
Nieuwenhuijsen MJ, Sandiford CP, Lowson D, Tee RD, Venables KM, McDonald JC, Newman Taylor AJ. Dust and flour aeroallergen exposure in flour mills and bakeries. Occ Environ Med 1994; 51: 584-588.
Nieuwenhuijsen MJ, Lowson D, Venables KM, Newman Taylor AJ. Flour dust exposure variability in flour mills and bakeries. Ann Occup Hyg 1995a; 39: 299-305.
Nieuwenhuijsen MJ, Sandiford CP, Lowson D, Tee RD, Venables KM, Newman Taylor AJ. Peak exposure concentrations of dust and flour aeroallergen in flour mills and bakeries. Ann Occup Hyg 1995b; 39: 193- 201.
Nieuwenhuijsen MJ, Lowson D, Venables M and Newman Taylor AJ. Correlation between different measures of exposure in a cohort of bakery workers in flour millers. Ann Occup Hyg, 1995; 3: 291-298.
Oostenbrink JH, Tomee JFC, Heide van der S, Steketee I, Kerkhof M and Monchy de JGR. Aard en omvang van beroepsgebonden klachten bij werknemers in bakkerijen, meelfabrieken en grondstoffenindustrie. Resultaten Fase II onderzoek. Verslag Onderzoeksprogramma Grondstofallergie van het Productschap Granen, Zaden en Peulvruchten, december 2001. [in Dutch]
Park HS, Nahm DH, Kim HY, Such CH, Kim KS. Role of specific IgE, IgG and IgG4. antibodies to corn dust in exposed workers. Korean J intern Med 1998:13;88-94.
Pater de, Doekes G, Miedema E, Goede H, van Hemmen J, Heederick D. Expositie aan stof, tarweallergenen en schimmel alfa-amylase en stand der techniek in ambachtelijke bakkerijen, meelmaalderijen en bakkerijgrondstoffen leverencierss. Verslag onderzoeksprogramma Grondstofallergie van het Productschap Granen, Zaden en Peuvruchten. TNO Voeding (Zeist), maart 2002. (in Dutch).
Pavlovic M, Spasojevic M, Tasic Z and Tacevic S. Bronchial hyperreactivity in bakers and its relation to atopy and skin reactivity. Science of the Total Environ 2001; 270: 71-75.
Peretz C, Pater de N, Monchy de J, Oostenbrink J and Heederik D. Assessment of Exposure to wheat flour and the shape of its relationship with specific sensitization. Chapter 6. In thesis: Repeated measurement data for exposure assessment, Utrecht University, the Netherlands, 2003. Submitted for publication.

26
Pfeil T, Schwabl U, Ulmer WT, König W. Western Blot Analysis of Water-Soluble Wheat Flour (Triticum vulgaris) Allergens. Int Arch Allergy Appl Immunol 1990; 91: 224-231.
Pigatto PD, Polenghi MM & Altomare GF. Occupational dermatitis in bakers: a clue for atopic contact dermatitis. Contact Dermatitis 1987; 16: 263-271.
Popp W, Wagner C, Kiss D, Zwick H, Sertl K. Prediction of sensitisation to flour allergens. Allergy 1994; 49: 376-379.
Posch A, Weiss W, Wheeler C, Dunn MJ, Görg A. Sequence analysis of wheat grain allergens separated by two-dimensional electrophoresis with immobilized pH gradients. Electrophoresis 1995; 16: 1115-1119.
Prichard MG, Ryan G, Walsh BJ, Musk AW. Skin test and RAST responses to wheat and common allergens and respiratory disease in bakers. Clin Allergy 1985; 15: 203-210.
Sanchez-Monge R, Gomez L, Barber D, Lopez-Otin C, Armentia A, Salcedo G. Wheat and barley allergens associated with baker's asthma - glycosylated subunits of the -amylase-inhibitor family have enhanced IgE-binding capacity. Biochem J 1992; 281: 401-405.
Sandiford CP, Tee RD, Newman Taylor AJ. Identification of major allergenic flour proteins in order to develop assays to measure flour aeroallergen. Clin Exp Allergy 1990; 20 Suppl 1: 3.
Sandiford CP, Nieuwenhuijsen MJ, Tee RD, Newman Taylor AJ. Measurement of airborne proteins involved in Bakers' asthma. Clin Exp Allergy 1994; 24: 450-456.
Sandiford CP, Tee RD, Newman Taylor AJ. The role of cereal and fungal amylases in cereal flour hypersensitivity. Clin Exp Allergy 1994; 24: 549-557.
Sandiford CP, Nieuwenhuijsen MJ, Tee RD, Newman Taylor AJ. Determination of the size of airborne flour particles. Allergy 1994; 49: 891-893.
Sandiford CP, Tee RD, Newman Taylor AJ. Identification of cross-reacting wheat, rye, barley and soya flour allergens using sera from individuals with wheat-induced asthma. Clin Exp Allergy 1995; 25: 340-349.
Schirmer RH, Kalveram KJ, Kalveram CM, Siebert J & Kunze J. Chronisch lichenoide Dermatitis bei Sensibilisierung gegen Alpha-Amylase bei einem Bäcker. Z Hautkr 1987; 62: 792-797. [in German]
Smith TA, Lumley KPS. Work-related asthma in a population exposed to grain, flour and other ingredient dusts. Occup Med 1996; 46: 37-40.
Smith TA, Parker G and Hussain T. Respiratory symptoms and wheat flour exposure: a study of flour millers. Occup Med 2000; 50: 25-29.
Suarthana E, Vergouwe Y, Nieuwenhuijsen M, Heederik D, Grobbee DE, Meijer E. Diagnostic model for sensitization in workers exposed to occupational high molecular weight allergens. Am J Ind Med 2005; 168-174.
Sutton R, Skerritt JH, Baldo BA, Wrigley CW. The diversity of allergens involved in
bakers' asthma. Clin Allergy 1984; 14: 93-07.

27
Tarvainen K, Kanerva L, Tupasela O, Grenquist-Nordén B, Jolanki R, Estlander T, Keskinen H. Allergy from cellulase and xylanase enzymes. Clin Exp Allergy 1991a; 21: 609-615.
Teleky L. Bäckerekzem. Zbl Haut Geschl Kr 1927; 21: 682-683. [in German]
Tiikkainen U, Louhelainen K and Nordman H. 120. Flour dust. The Nordic Expert Group for Criteria Documentation of Health Risks from Chemicals. Nordic Council of Ministers. Arbete och Hälsa 1996; 27: 1-45.
Tossavainen A, Jaakkola J. Occupational exposure to chemical agents in Finland. Appl. Occup Environ Hyg 1994; 9: 28-31.
Tüchsen F, Nordholm L. Respiratory cancer in Danish bakers: a 10 year cohort study. Br J Ind Med 1986; 43: 516-521.
Valdivieso R, Pola J, Zapata C. Farm animal feeders: another group affected by cereal flour asthma. Allergy 1988; 43: 406-410.
Vanhanen M, Tuomi T, Hokkanen H, Tupasela O, Tuomainen A, et al. Enzyme exposure and enzyme sensitisation in the baking industry. Occup Environ Med 1996; 53: 670-676.
Vanhanen M. Exposure, Sensitization and Allergy to Industrial Enzymes. Doctoral Thesis. People and Work Research Reports 46, 2000;58-60.
Vincenzi C, Stinchi C, Ricci C & Tosti A. Contact dermatitis due to an emulsifying agent in a baker. Contact Dermatitis 1995; 32: 57.
Walsh BJ, Wrigley CW, Musk AW, Baldo BA. A comparison of the binding of IgE in the sera of patients with bakers' asthma to soluble and insoluble wheat-grain proteins. J Allergy Clin Immunol 1985; 76: 23-28.
Weiss W, Huber G, Engel KH, Pethran A, Dunn MJ, Gooley AA, Görg A. Identification and characterization of wheat grain albumine/globulin allergens. Electrophoresis 1997; 18: 826-833.
Wiley K. Development of an assay for wheat allergens. International Occupational Hygiene Association Meeting, Switzerland, September 1997.
Young E. Allergic reactions among bakers. Dermatologica 1974; 148: 39-42.
Zuskin E, Mustajbegovic J, Schachter EN, Kern J. Respiratory symptoms and ventilatory function inconfectionery workers. Occup Environ Med 1994a; 51: 435-439.
Zuskin E, Kanceljak B, Mustajbegovic J, Schachter EN. Immunologic findings in confectionary workers. Ann Allergy 1994b; 73: 521-526.
Zuskin E, Kanceljak B, Schachter En et al. Respiratory function and immunological status on cocoa and flour processing workers. Am J Ind Med 1998; 33: 24-32.

28
Annex I Table 1 Levels of flour dust in the workplace in the baking industry. reference sampling type of samplers dust fraction N n job title concentration of dust (mg/m3)
time (hr) GM(GSD)AM±SD range Hatmann et al 1986
3 - - 31 - all - - 0.2-19.8
Masalin et al 1988 full-shift PVC filters total dust 56 49 all 1.7 - 0.1-8.0
Musk et al 1989 full-shift Casella/Millipore total dust 79 10 dough makers 2.7 - 0.6-14.1
16 oven staff 1.7 - 0.0-37.6
Jeffrey 1992 full-shift 7-hole ore Casella
inhalable and total 68 3 weighing/mixing 8.6 2.3 - 3.3-15.8
dust 16 dividing/moulding 4.7 2.0 - 1.6-19.1 Jauhiainen et al 1993 4-7 3-piece cassettes total dust 20 13 making of dough - 4.6±3.6 0.9-14.7
7 making of bread - 2.3±0.9 1.5-3.5 Kolopp-Sarda et al 19l94 full-shift - inhalable
flour dust 1 38 all - 4.9±9.1 -
Bohadana et al 1994 4 Millipore total dust 21 14 general baker - 3.4±3.7 0.7-8.7
6 oven handler - 1.1±0.9 0.5-2.7 Lillienberg & Brisman 1994 full-shift IOM sampler inhalable
dust 29 6 dough mixing 7.5 5.4 - -
10 dough forming 2.5 0.8 - -
3 oven control 3.2 1.7 - - Burdorf et al 1994 1-7 IOM sampler inhalable
dust 129 34 dough makers 5.5 2.1a - 1.2-16.9
62 bread formers 2.7 2.0a - 0.6-14.2
10 oven workers 1.2 2.4a - 0.2-4.0
Nieuewenhuijsen et al 1994 full-shift 7-hole inhalable 352 24 dispense/ 5.0 2.5 - 1.4-86.0
32 mixing roll production
2.4 2.5 - 0.4-21.1
Houba et al 1996a full-shift PAS-6 inhalable 546 105 dough makers 3.0 - 0.4-37.7
81 oven staff 0.6 - 0.1-5.1 Vanhanen et al 1996
full-shiftb
Millipore 30 7 dough making - 8.4 3.0-18.8
total dust 10 bread making - 3.2 1.2-5.5 Burdoef et al 1997 full-shift 7-hole inhalable 96 - bakers 2.1 5.1 - 0.1-110
Talini 2002 > 4 - total dust - 11 mixing and roll 2.1 - 0.5-6.6
48 ovens area 0.6 - 0.1-1.6 Elms et al 2004
full-shift
IOM-sampler
inhalable
208
9
108 59 6
35
bread wrapping dough maker mixing cleaning others
2.3 3.3 3.4 4.7 3.4 3.8 3.5 2.2 2.8
0.2-12.6
- Not reported. Abbreviations: N = Total number of personal samples; n = number of samples in occupational title; AM±SD = -arithmetical mean ± standard deviation; GM±GSD = geometrical mean ± standard deviation. a GM and GSD could be biased, because of large variations in sampling time. b
Sampling time varied between 2-4 hours, but several consecutive personal samples were taken to cover the whole working shift.

29
Table 2. Levels of flour dust in the workplace in the milling industry. reference sampling
time (hr) type of samplers
dust fraction N n job title concentration of dust (mg/m3)
GM±GSM AM±SD range Awad El Karim et al 1986
4-8 horizontal two
total dust - - plan sifters room - 3.6±1.6 -
stage sampler Hexlett
sacks room - 3.5±1.6 -
wheat cleaning - 2.7±1.3 -
rollers room - 2.2±1.0 -
packing area - 1.6±0.8 -
wheat store - 1.4±0.1 - Bachamann & Myers 1991 full-shift 37 mm
cassettes - 50 - shovel/pack grain - 17.6 0.8-96
millers/silo, packing
- 1.3 0.4-2.4
Fakhri 1992 - Bendix super sampler
respirable dust 7 237 several
occupational titles - - 20-160
Kolopp-Sarda et al 1994 full-shift - inhalable
flour 11 121 all - 10.1±12.7? -45
dust Massin et al 1995 5-7 37-mm
cassettes approximates 83 - reception work 27 - 8-58
11/min inhalable dust
wheat crushing saking
4.8 - 1.2-27
14.3 - 1-76
polyvalent 13.8 - 2.2-79
Talini et al 2002 > 4 - total dust - 11 unloading area 1.1 - 0.1-6.9 6 grain cleaning 1.0 - 0.3-5.8
6 flour mill 0.2 - 0.3-0.4
15 packing area 2.2 . 0.1-8.7
- Not reported. Abbreviations: N = Total number of personal samples; n = number of samples in occupational title; AM±SD = arithmetical mean ± standard deviation; GM±GSD = geometrical mean ± standard deviation.

30
Table 3 Characteristics of all personal dust measurements and its wheat allergen content
(Houba et al 1996a). job category personal dust
exposure personal wheat allergen exposure mean ratio
allergen/ (mg/m3) (µg/m3) dustf
n GM range n GM range (µg/mg)
total 546 1.0 0.1-37.7 449 0.7 0.03-252 1.5 large bakeries dough makers 105 3.0a
0.4-37.7 76 5.3a 0.03-252 2.9a
all-round staff 66 0.9b 0.1-26.8 54 0.9c
0.03-68 1.6c
oven staff 81 0.6 0.1-5.1 71 0.3 0.03-28 1.2 slicers and packers 132 0.4a
0.1-2.8 109 0.8a 0.03-8 0.4a
production managers
20 0.6 0.1-4.9 17 0.5 0.03-74.6 2.1d
maintenance and 27 0.7 0.3-5.5 20 0.2 0.03-2.5 0.6 cleaning workers small bakeries bread baker 36 3.3a
1.2-8.8 31 6.0a 1.3-53.3 2.0e
mixed baker 57 2.0a 0.3-14.2 55 2.7a
0.3-44.2 1.6 confectioner 22 0.7a
0.1-3.7 16 0.6a 0.03-3.8 1.6
n = number of measurements; GM = geometric mean. a Significantly different from all other job categories in large and small bakeries (p<0.05). b Significantly different from oven staff (p<0.05). cSignificantly different from oven staff and maintenance and cleaning workers (p<0.05). dSignificantly different from maintenance and cleaning workers (p<0.05). eSignificantly different from confectioner’s (p<0.05). fdust = inhalable total dust. Table 4 Characteristics of all inhalable dust and wheat allergen measurements
(Pater de et al 2002). type of industry inhalable flour dust exposure wheat allergen exposure mean ratio (mg/m3) (µg/m3) allergen/
n GM range n GM range dust (µg/mg)a
traditional bakeries
162 1.5 0.2-318 134 5.5 0.1-5,365
5.7
(n=55) large industrial bakeries
186 1.0 0.1-292 175 2.2 0.0-7,571
2.1
(n=16) flour mills 156 3.2 0.1-
1,837 140 11.7 0.0-
3,874 5.7
(n=6) ‘raw material’ industry
128 2.0 0.0-627 114 4.0 0.1-1,517
2.6
(n=7) n = number of measurements; GM = geometric mean. adust = inhalable total dust; regression coefficients of 0.06 (R2=99.6%), 0.04 (R2=98.9%), 0.05 (R2=59.5%), 0.12 (R2=8.7%) for the small bakeries, large bakeries, flour mills and ‘raw material’ industry, respectively, all p<0.001.
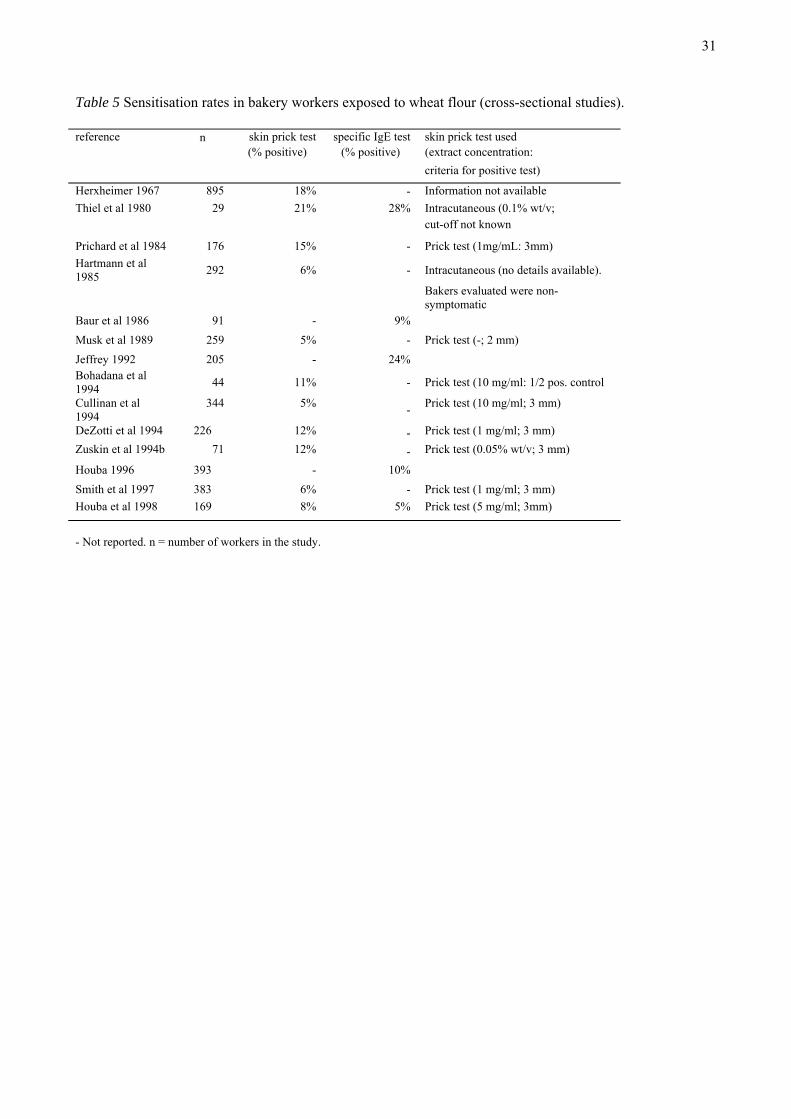
31
Table 5 Sensitisation rates in bakery workers exposed to wheat flour (cross-sectional studies). reference n skin prick test specific IgE test skin prick test used (% positive) (% positive) (extract concentration:
criteria for positive test)
Herxheimer 1967 895 18% - Information not available Thiel et al 1980 29 21% 28% Intracutaneous (0.1% wt/v;
cut-off not known
Prichard et al 1984 176 15% - Prick test (1mg/mL: 3mm) Hartmann et al 1985 292 6% - Intracutaneous (no details available).
Bakers evaluated were non-symptomatic
Baur et al 1986 91 - 9% Musk et al 1989 259 5% - Prick test (-; 2 mm) Jeffrey 1992 205 - 24% Bohadana et al 1994 44 11% - Prick test (10 mg/ml: 1/2 pos. control
Cullinan et al 1994
344 5% - Prick test (10 mg/ml; 3 mm)
DeZotti et al 1994 226 12% - Prick test (1 mg/ml; 3 mm) Zuskin et al 1994b 71 12% - Prick test (0.05% wt/v; 3 mm)
Houba 1996 393 - 10% Smith et al 1997 383 6% - Prick test (1 mg/ml; 3 mm) Houba et al 1998 169 8% 5% Prick test (5 mg/ml; 3mm)
- Not reported. n = number of workers in the study.

32
Table 6. Prevalence of respiratory symptoms in occupationally exposed bakery workers. ref. countr
y type of bakery
n Partici-pation rate
method used prevalence of symptoms remarks
Baagöe 1993 DK 22 SB 66 - - N 12% Mill-workers excluded Dishoek & Roud 1939 NL LB, SB, C 152 100% - N 26% Linko 1947 SF LB, SB, C 328 100% - N 18%, A 8% Pestalozzi & Schnyder 1955 S 5 LB, MB 159 - - N 26%, A 4% Gadborg 1956 DK -1,316 78% - N 15%, A 7% Sensitised workers with
symptoms Beritic-Stahuljak et al 1977
Croatia
-130 - Q N 30%, A 3% Non-smokers
Järvinen et al 1979 SF 1 LB (b) 234 - Q N 23%, A 9% Not necessarily work-related
Wallenstein et al 1979 D B 354 - Q, CI R 60%, A 35%, Br 30%
FM 25 - Q, CI R 40%, A 25%, Br 60% grinding 58 - Q, CI R 20%, A 8%, Br 60% Thiel & Ulmer 1980
BRD -29 - - N 21%, A 10% Not necessarily work-related
Charpin et al 1984 F -154 91% Q N 22%, A 5% Not necessarily work-related
Prichard et al 1984 AU 18 B 176 - Q N 19%, A 5% Physician administered questionnaire
Hartmann et al 1985
S 1 LB 314 - Q N 7% No further definition symptoms given
Thiel 1987 BRD -242 - - N 14%, A 7% Musk et al 1989 UK 1 LB 279 88% Q N 13-19%, A 7% Self administered
questionnaire
Rosenberg et al 1991 F B, 7 C 2088 - Q N or A 6% Jeffrey 1992 UK B 224 - Q N 21%, R27% Physician administered
questionnaire
DeZotti et al 1994 I 105 SB 226 82% Q N 14%, A5% Bohadana 1994 F 1 B 44 85% Q N 18%, A2% Not necessarily work-
related
Cullinan et al 1994 UK 3 LB, 3FM 344 86% Q N 14-29%
Zuskin et al 1994a Croatia 1 C 78 85% Q N 14-41%,
A 4%
Symptoms of flour exposed workers; confirmed by medical records
Zuskin et al 1994b Croatia 1 C 71 - Q N 24-48% Exposure to various agents
Shammsain 95 S-Africa
-63 - Q N 54% Houba et al 1996 NL C, RB, L/SB 178 75% Q N 5-15% Self administered
questionnaire Houba et al 1996 NL C, RB,
L/SB 393 75% Q N 7-21% Self administered
questionnaire Smith et al 1996 UK 1 FM 3,45 - Q N 7%, A 4% Vanhanen et al 1996 SF 4 B, 1 CB 303 90% Q R and N: 14-17% Smith et al 1997 UK 19 B 385 99% CI N 3-17%, A 0.5%
Baue et al 1998b D B 104 100% CI R 39%, D 37% (plus eczema 11%, conjunctivitis 20%)
lung functions tests, inhalative and methacholine challenge test
- Not reported. Abbreviations:A, asthma; B, bakery; Br, bronchitis; C, confectionery; CB, crisp bread bakery; CI, clinical investigation; D, dyspnea; FM, flour mill; LB, large bakery; MD, medium size bakery; N, nasal symptoms and non-specified symptoms; Q = questionnaire; R, rhinitis; RB, rusk bakery; SB, small bakery.

33
Table 8. Dose-response relation between cumulative wheat allergen and inhalable dust exposure- and prevalence of specific wheat allergen sensitisation in the whole population in study (n=346) (Heederik & Houba 2001). exposure group
cumulative wheat allergen exposure cumulative inhalable dust exposure
average (SD) prevalence ratio average (SD) prevalence ratio
((µg/m3)×yr) (confidence interval) ((mg/m3)×yr) (confidence interval)
1. low 0.7 (0.5) 1.0 (-) 1.5 (0.8) 1.0 (-) 2. 5.3 (3.0) 1.6 (0.4–14.0) 5.4 (1.7) 1.3 (0.3-4.7) 3. 22.4 (8.0) 1.7 (0.4-7.1) 12.0 (3.0) 1.2 (0.3-4.5) 4. 70.6 (2.4) 3.7 (1.0-13.3) 29.3 (8.2) 2.4 (0.8-7.7) 5. high 224.0 (109.0) 3.9 (1.1-13.9) 81.9 (39.3) 3.0 (1.0-9.2) 2 log likelihood
411.9 414.2
SD = standard deviation. Table 9. Relationship between flour dust, wheat allergen exposure and the risk for sensitisation and work-related symptoms: all 4 sectors taken together (Oostenbrink et al 2001). IgE to wheat floura Symptoms (%)b
No. of
workers Positive (%) Odds ratio Asthma Rhinitis Conjuncitivitis
Inhalable dust - < 1.6 mg/m3(low) 54 29 - 12 20 15 - 1.6 – 2.0 mg/m3 102 31 1.04 (p=0.92) 16 23 19 - 2.1 – 3.5 mg/m3 73 23 0.72 (p=0.42) 7 13 9 - 3.6 – 10.0 mg/m3 51 26 0.81 (p=0.64) 14 19 13 - > 10.1 mg/m3(high) 111 20 0.59 (p=0.16) 10 16 8
Wheat allergen in air - < 13.4 µg/m3(low) 80 24 - 7 12 8 - 13.4 – 16.0 µg/m3 84 32 1.52 (p=0.23) 17 23 19 - 16.1 – 36.0 µg/m3 71 19 0.79 (p=0.55) 4 15 11 - 36.1 – 106.0 µg/m3 50 36 1.81 (p=0.55) 18 24 16 - > 106.1 µg/m3 106 20 0.79 (p=0.52) 8 15 8 aIgE class 1 or higher; bData obtained from a graph, no absolute values given in original document.
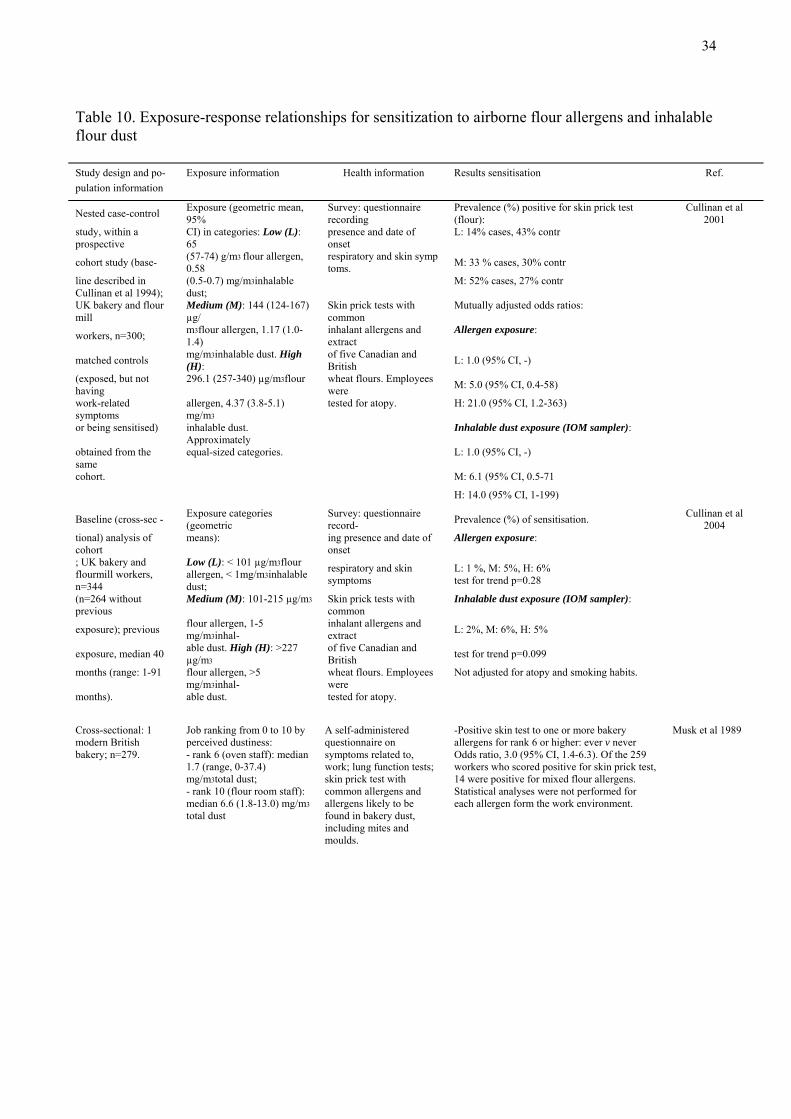
34
Table 10. Exposure-response relationships for sensitization to airborne flour allergens and inhalable flour dust Study design and po- Exposure information Health information Results sensitisation Ref. pulation information Nested case-control Exposure (geometric mean,
95% Survey: questionnaire recording
Prevalence (%) positive for skin prick test (flour):
Cullinan et al 2001
study, within a prospective
CI) in categories: Low (L): 65
presence and date of onset
L: 14% cases, 43% contr cohort study (base- (57-74) g/m3 flour allergen,
0.58 respiratory and skin symp toms. M: 33 % cases, 30% contr
line described in Cullinan et al 1994);
(0.5-0.7) mg/m3inhalable dust; M: 52% cases, 27% contr
UK bakery and flour mill
Medium (M): 144 (124-167) µg/
Skin prick tests with common
Mutually adjusted odds ratios: workers, n=300; m3flour allergen, 1.17 (1.0-
1.4) inhalant allergens and extract
Allergen exposure: matched controls mg/m3inhalable dust. High
(H): of five Canadian and British L: 1.0 (95% CI, -)
(exposed, but not having
296.1 (257-340) µg/m3flour wheat flours. Employees were M: 5.0 (95% CI, 0.4-58)
work-related symptoms
allergen, 4.37 (3.8-5.1) mg/m3
tested for atopy. H: 21.0 (95% CI, 1.2-363) or being sensitised) inhalable dust.
Approximately Inhalable dust exposure (IOM sampler):
obtained from the same
equal-sized categories. L: 1.0 (95% CI, -) cohort. M: 6.1 (95% CI, 0.5-71 H: 14.0 (95% CI, 1-199) Baseline (cross-sec - Exposure categories
(geometric Survey: questionnaire record- Prevalence (%) of sensitisation. Cullinan et al
2004 tional) analysis of cohort
means): ing presence and date of onset
Allergen exposure: ; UK bakery and flourmill workers, n=344
Low (L): < 101 µg/m3flour allergen, < 1mg/m3inhalable dust;
respiratory and skin symptoms
L: 1 %, M: 5%, H: 6% test for trend p=0.28
(n=264 without previous
Medium (M): 101-215 µg/m3 Skin prick tests with common
Inhalable dust exposure (IOM sampler): exposure); previous flour allergen, 1-5
mg/m3inhal- inhalant allergens and extract L: 2%, M: 6%, H: 5%
exposure, median 40 able dust. High (H): >227 µg/m3
of five Canadian and British test for trend p=0.099
months (range: 1-91 flour allergen, >5 mg/m3inhal-
wheat flours. Employees were
Not adjusted for atopy and smoking habits. months). able dust. tested for atopy. Cross-sectional: 1 modern British bakery; n=279.
Job ranking from 0 to 10 by perceived dustiness: - rank 6 (oven staff): median 1.7 (range, 0-37.4) mg/m3total dust; - rank 10 (flour room staff): median 6.6 (1.8-13.0) mg/m3 total dust
A self-administered questionnaire on symptoms related to, work; lung function tests; skin prick test with common allergens and allergens likely to be found in bakery dust, including mites and moulds.
-Positive skin test to one or more bakery allergens for rank 6 or higher: ever v never Odds ratio, 3.0 (95% CI, 1.4-6.3). Of the 259 workers who scored positive for skin prick test, 14 were positive for mixed flour allergens. Statistical analyses were not performed for each allergen form the work environment.
Musk et al 1989

35
Study design and po- Exposure information Health information Results sensitisation Ref. pulation information Cross-sectional study; Dutch bakers (n=270) from different industries. Number of workers in traditional bakeries, n=70; industrialized bakeries, n=72; flour-mills, n=73; and, bakery-ingredient industry, n=55
Personal inhalable dust and wheat allergen concentrations measured. Categories inhalable dust exposure: 0.01-0.59, 0.59-1.14, 1.14-2.06, 2.06-4.70 and-4.70-100.00 mg/m3 Categories wheat allergen expo sure: 0.03-0.34, 0.34-4.84, 4.84-15.18, 15.18-47.39, and 47.39-400 µgeq/m3. Number of workers per group = 54.
Test for wheat specific sensitisation by blood analyses of specific IgE-antibodies. Also tested for presence of atopy.
Prevalence (%) of sensitisation. Inhalable dust exposure (PAS6 sampler): 0.01-0.59: 18.5% 0.59-1.14: 33.3% 1.14-2.06: 29.6% 2.06-4.70: 27.7% 4.70-100.00: 20.4% Test for trend significant described by smoothing. Wheat allergen exposure: 0.03-0.34: 10.6% 0.34-4.84: 25.5% 4.84-15.18: 34.0% 15.18-47.39: 29.8% 47.39-400: 27.1% Test for trend significant (described by smoothing) Based on actual measured exposure levels, the relationship was found to be monotonic up to a value of ~2.7 mg/m3inhalable dust or ~25.7 µgeq/m3wheat allergen. By sector: traditional b: 37.1% industrial. b: 34.7% ingredients ind.: 16.4% flour mills: 13.7% Exposure-response relationship all sectors (except flour mills): between linear and quadratic relationship. Flour mill sector, quadratic relationship (bell shaped). Atopy was a significant modifier in exposure-response relationship.
Peretz et al 2003 Oostenbrink et al 2001
Cross-sectional; Dutch bakers (n=393) from small (traditional) and large industrial bakeries
Personal inhalable dust and wheat allergen concentrations measured. Categories cumulative inhalable dust exposure: 1.5±0.8, 5.4±1.7, 12.0±3.0, 29.3±8.2 and 81.9±39.3 mg/m3-yr. Categories cumulative wheat allergen exposure: 0.7±0.5, 5.3±3.0, 22.4±8.0, 70.6±2.4 and 224.0±109.0 µg/m3-yr. Average exposure duration 11.7 years.
A self-administered questionnaire on respiratory symptoms. Specific IgE antibodies to wheat flour in blood. Also tested for presence of atopy.
Prevalence (%) ratios Cumulative dust exposure: 1.5±0.8: 1.0 (95% CI, -) 5.4±1.7: 1.3 (CI, 0.3-4.7) 12.0±3.0: 1.2 (CI, 0.3-4.5) 29.3±8.2: 2.4 (CI, 0.8-7.7) 81.9±39.3: 3.0 (CI, 1.0-9.2) 2 log likelihood 414.2 Cumulative wheat allergen exposure: 0.7±0.5: 1.0 (95% CI, -) 5.3±3.0: 1.6 (CI, 0.4-14.0) 22.4±8.0: 1.7 (CI, 0.4-7.1) 70.6±2.4: 3.7 (CI, 1.0-13.3) 224±109: 3.9 (CI,1.1-13.9) 2 log likelihood 411.9
Heederik & Houba 2001 Houba et al 1998

36
Table 11. Exposure-response relationship for eye, nasal and chest symptoms Study design and po- Exposure information Health information Symptoms Ref. pulation information Baseline (cross-sectional) analysis of cohort; UK bakery and flourmill workers, n=344(n=264 without previous exposure); median 40 months (range: 1-91 months).
Exposure categories inhalable dust (geometric means) Low : < 1mg/m3 Medium: 1-5 mg/m3 High : >5 mg/m3
Survey: questionnaire recording presence and date of onset respiratory and skin symptoms Skin prick tests with common inhalant allergens and extract of five Canadian and British wheat flours. Employees were tested for atopy
Chest symptoms: chest tightness, wheeze, difficulty in breathing Low : 5% Medium: 3 % High: 11 % Eye/nose symptoms: itching of eyes/nose, sneezing, running or blockage of nose Low: 11 % Medium: 15 % High: 31 % Itchy skin rash Low: 2 % Medium: 10 % High: 10 %
Cullinan et al 1994 Niewenhuijsen et al 1994
Nested case-control study, within a prospective cohort (baseline cohort same as in Cullinan et al 1994); Average follow-up time 3,5 years; UK bakery and flour mill workers, n=300; Cases= work-related (w-r) symptoms or sensitization to α-amylase. Matched controls =exposed, no w-r symptoms nor sensitization
Exposure categories inhalable dust (geometric mean, 95% CI): Low: 0.58 (0.5-0.7) mg/m3 Medium: 1.17 (1.0-1.4) mg/m3. High: 4.37 (3.8-5.1) mg/m3 Approximately equal-sized categories
Survey: questionnaire recording presence and date of onset respiratory and skin symptoms. Skin prick tests with common inhalant allergens and extract of five Canadian and British wheat flours. Employees were tested for atopy.
Chest, eye/nose and skin symptoms defined as in Cullinan et al, 1994. Logistic regression analysis. Odds ratios ( 95% CI ) Chest symptoms Low: 1 Medium: 1.1 (0.3-4.1) High: 5.2 (1.3 - 21) Eye/nose Low: 1 Medium: 1.4 (0.7 - 3.2) High: 4.5 (2.9 - 10) Skin Low: 1 Medium: 1.1 (0.4 - 3.5) High: 2 (0.6 - 6.5)
Cullinan et al 2001 Niewenhuijsen et al 1994
Retrospective. cohort, 2923 bakers. All Swedish bakery schools 1961-89. Controls: 1. from same schools and years, different programme,1290 persons, 2. Random population sample, matched for sex and age, 1258 (74% participation)
Estimated exposure based on random sample of Swedish bakeries and job-task duration, inhalable dust. Three current exposure categories distinguished: 1, 3 and 6 mg/m3. Cumulative exposure categories: 1-9, 10-29 and >30 mg/ m3
Postal questionnaire on asthma and rhintis. Incidence rates (95% CI) of asthma and rhinitis calculated. Associations not significant for women due to low power. Asthma cases among women only eight. Women predominantly in low-exposed tasks. Significant association between asthma and rhinitis in men and current exposure, not with cumulative exposure
Doctor's diagnosis of asthma. Rhinitis: history of hay fever, blocking or running nose, attacks of sneezing. IR of asthma in men increased from 0.5 to 7.3/1000 person-years (p for trend 0.001). IR of rhinitis from 18.8 to 43.4/1000 p-y in men (p for trend 0.0004), from 29.6 to 38.5 p-y in women. Mean concentrations of inhalable dust < 3 mg/ m3 seemed to prevent asthma, < 1 mg/ m3 to prevent rhinitis
Brisman et al 2000 Burdorf et al 1994
Cross-sectional: 1 modern British bakery; n=279
Job ranking from 0 to 10 by perceived dustiness, total dust: Rank 0-5: range of GM 0.01 -3.0 (range 0-4) mg/m 3 Rank 6-10 : range of GM 1.7 - 11.0 (range, 0-38) mg/m3
A self-administered questionnaire on work-related symptoms; lung function tests; skin prick test with common allergens and allergens likely to be found in bakery dust, including mites and moulds.
Rank 6, GM 1.73 mg/m3 0.00-37 mg/m3 or more correlated best with symptoms. Analysis according to never >6 mg/m3 and current > 6 mg/m3 . Chest symptoms: Wheeze, chest tightness, difficulty in breathing, chronic bronchitis. Nasal symptoms; sneezing, itchy, running nose. Frequency of symptoms in percentage Chest symptoms : Never > 6 mg/ m3: 9 % Current > 6 mg/ m3 17 % Nasal symptoms Never > 6 mg/ m3 : 13 % Current > 6 mg/m3: 30%
Musk et al 1989

37
Study design and po- Exposure information Health information Symptoms Ref. pulation information Cross-sectional; Dutch bakers (n=393) from small (traditional) and large industrial bakeries
Personal inhalable dust concentrations measured. Five categories of cumulative inhalable dust exposure (in mg/ m3-yr): 1 = 1.5±0.8 2 = 5.4±1.7 3 = 12.0±3.0 4 = 29.3±8.2 5 = 81.9±39.3. Average exposure duration 11.7 years
A self-administered questionnaire on respiratory symptoms. Specific IgE antibodies to wheat flour in blood. Also tested for presence of atopy
Work-related rhinitis and/or chest symptoms. Prevalence rates (PR, 95%CI). Cumulative exposure category: 1. 1 2. 1.3 (CI 0.3 - 4.7) 3. 1.2 (CI 0.3 - 4.5) 4. 2.4 (CI 0.8 - 7.7) 5. 3.0 (CI 1.0 - 9.2)
Houba et al 1998 Heederik & Houba 2001