recommendations on feasibility study and actuarial analysis
TRANSCRIPT
Recommendations on feasibility study and actuarial analysis
(FY2019 Appropriation Act - Public Act 207 of 2018)
January 20, 2021
Sec. 1510. (1) From the funds appropriated in part 1 for medical services
administration, the department shall match 100% of any private funds, up to $100,000.00, with state general fund/general purpose revenues for the purpose of contracting for an independent feasibility study and actuarial model of public, private, and public-private hybrid options to help individuals prepare for, access, and afford long-term services and supports. The study must include models for all of the following:
(a) An affordable annual long-term care benefit available to all individuals who meet the minimum eligibility of needing assistance with 2 activities of daily living, with the maximum benefit amount to be determined by actuarial analysis.
(b) A public-private reinsurance or risk-sharing model, with the purpose of providing a stable and ongoing source of reimbursement to insurers for a portion of their catastrophic long-term care services and supports losses in order to provide additional insurance capacity for the state. The entity would operate as a public-private partnership supporting the private sector’s role as the primary risk bearer.
(c) A long-term care benefit paid for and open to those that are not currently eligible for the state Medicaid program.
(2) The awarded contractor shall provide a report to the department on the independent feasibility study and actuarial model that includes all of the following:
(a) An analysis of public and private long-term care programs that exist in the state, the participation rates for those programs, and any clear gaps that exist, including, but not limited to, gaps in coverage, affordability, and participation.
(b) The expected costs and benefits for participants in a new long-term care benefit program, when accounting for a living wage rate for home care workers and compliance with the fair labor standards act of 1938, 29 USC 201 to 219, the federal regulations in 29 CFR 552 relating to that act, and state labor laws.
(c) The total anticipated number of participants. (d) The impact on the current workforce. (e) A recruitment and retention plan to meet anticipated shortage in the workforce
due to the increasing aging population. (f) The impact of current services, access to a paid workforce, and affordability of
care on family caregivers, including how many family members are providing care to the individual, the impact that providing care has on a family caregiver’s job, family caregivers’ access to training programs, how many hours of care a family caregiver is providing, the types of services a family caregiver is performing, if the primary caregiver is also caring for a child, and if there are children present in the home who also assist with caring for the aging adult in the home.
(g) The projected savings to the state Medicaid program, if any. (h) Legal and financial risks to the state. (3) The department shall provide oversight and direction for the analysis described in
subsection (2) and shall convene meetings for interested stakeholders, including

consumer and worker representatives, to provide ongoing input on the feasibility study design. The department shall hold not fewer than 3 meetings for stakeholders to comply with the provisions of this subsection, as follows: a meeting before the study begins, a meeting during the study’s implementation, and a meeting after the study is completed.
(4) The feasibility study and the actuarial analysis that is included in the feasibility study must be completed and submitted to the department no later than 270 days after the start date of the feasibility study. The department shall hold a public hearing presenting its findings. The department shall submit a report, including the director’s findings and recommendations based on the feasibility study and actuarial analysis, to the legislature no later than 60 days after the completion of the feasibility study.
0
12/1/2020
Michigan Long-term Services and Supports A feasibility study of potential long-term benefits and the potential workforce implications
Medical Services Administration MICHIGAN DEPARTMENT OF HEALTH AND HUMAN SERVICES
1
Table of Contents Executive Summary ...................................................................................................................................... 2
Background .................................................................................................................................................. 2
Figure 1: Sec. 1510 Boilerplate Language ............................................................................................ 4
LTSS in Michigan ........................................................................................................................................... 5
Medicaid LTSS Benefits ................................................................................................................................. 5
Skilled Nursing Facilities ............................................................................................................................ 6
Homes for the Aged/Adult Foster Care .................................................................................................... 6
MI Health Link ........................................................................................................................................... 6
Program of All-Inclusive Care for the Elderly (PACE) ............................................................................... 6
MI Choice .................................................................................................................................................. 7
Home Help ................................................................................................................................................ 7
Behavioral Help Services ........................................................................................................................... 7
Other Long-term Medicaid Services ........................................................................................................ 8
Brain Injury Services ......................................................................................................................... 8 Community Transition Services ...................................................................................................... 8 Home Health .................................................................................................................................... 8 Hospice ............................................................................................................................................. 8
Managed Long-Term Services and Supports (MLTSS) .............................................................................. 8
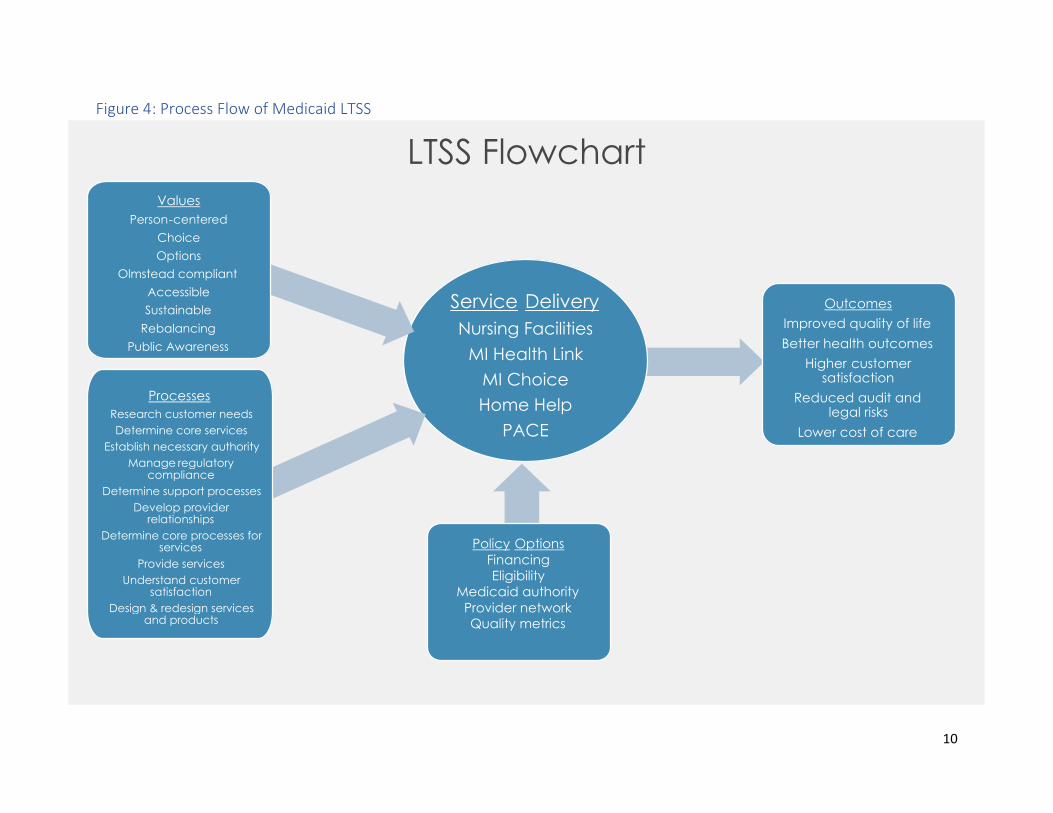
Figure 2: Process Flow of Medicaid LTSS ........................................................................................ 9
Attachment 1: Long-Term Services and Supports – Milliman Report ...................................................... 10
Attachment 2: Michigan’s Long-Term Care Workforce: Needs, Strengths, and Challenges .................... 60
Findings and Recommendations ............................................................................................................... 153
2
Executive Summary Section 1510 of Michigan’s Fiscal Year 2019 appropriations bill directed the Michigan Department of Health and Human Services (MDHHS) to facilitate a feasibility study on possible public, private, and hybrid models for the provision of long-term services and supports (LTSS). This study was modeled after similar research conducted for the state of Washington. The report is also to include a review and recommendations regarding workforce issues for those providing LTSS. This paper consolidates the research studies conducted by Milliman and by Altarum in response to that boilerplate language.
Background This report is the culmination of an effort that began in 2018 to produce a feasibility study on LTSS in Michigan. The intent was to begin building a reference on which to base future public policy. While the scope of a truly comprehensive report would exceed the capacity of the MDHHS, its available resources, and the time available to conduct this research, this report is still ground-breaking in its reach. The report begins by taking a cursory look at what LTSS Services are available in Michigan, both publicly and privately. It then presents the actuarial study produced by Milliman on the possible public, private, and hybrid options of developing a LTSS benefit. A report produced by Altarum then follows; it examines some key issues of particular concern regarding the LTSS workforce and the provision of services. Finally, the report provides basic conclusions based on the information presented, though the reader is ultimately left to draw their own conclusions on future next steps. Long-term services and supports are critical to the lives and livelihoods of hundreds of thousands of Michiganders each year. Activities of Daily Living (ADL) include such critical functions as eating, dressing, and grooming, and are key elements of daily living. Instrumental Activities of Daily Living (IADL), such as shopping, laundry, or housekeeping are essential when physical or cognitive deficits erode an individual’s ability to accomplish any of them on their own. The delivery of such services is often combined with clinical types of care such as medication management or nursing care and are likely to be delivered in settings that range from institutional to home-based. Individuals might require assistance sporadically during the week or extensively to the point of around the clock care. LTSS which is truly long-term often imposes a major financial burden on both individuals and families. It is not uncommon for persons needing LTSS to exhaust all personal resources to the degree of having to depend on Michigan’s Medicaid program to cover their continuation of care. Few Michiganders have the personal financial resources to meet their daily life-long demands. Long-term care insurance policies have been available for years, but acquiring LTSS coverage tends to be too expensive for most people and usually provide an overly restrictive benefit. Medicaid programs are, by far, the largest payer of LTSS, both in Michigan and throughout the United States.
3
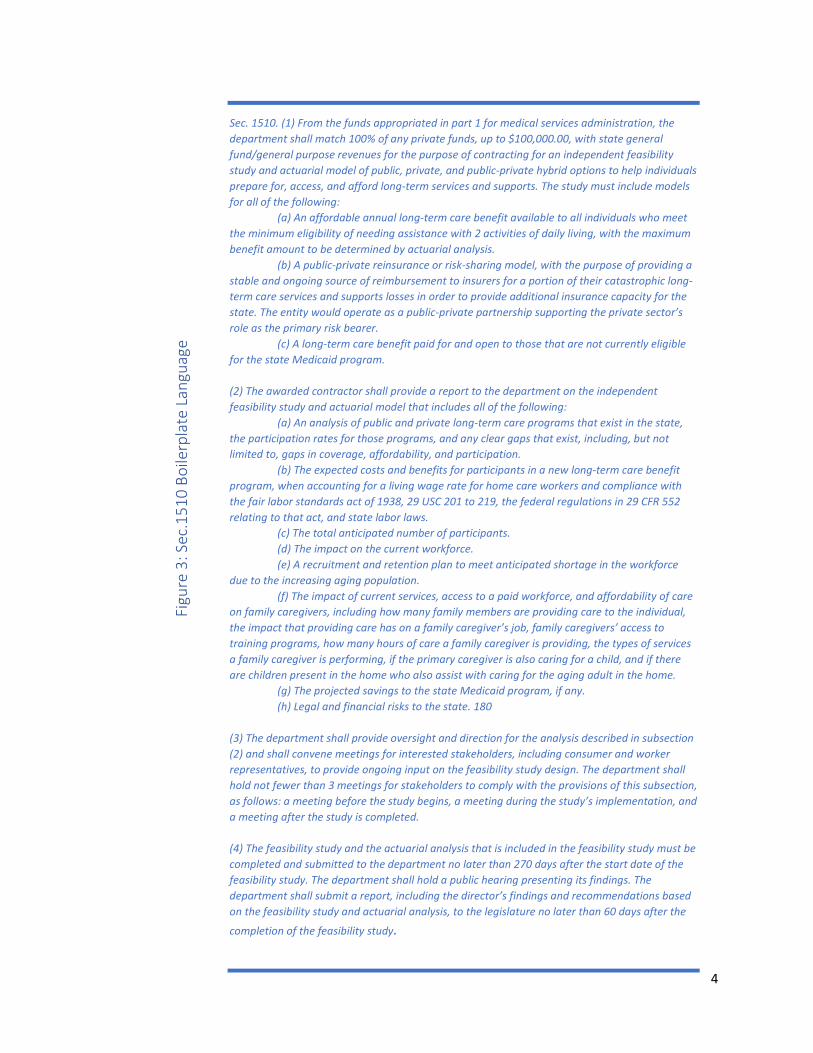
The impact of LTSS on Medicaid is significant. In Michigan, 5% of all Medicaid beneficiaries, hundreds of thousands of people, are receiving some sort of support1 each year. They account for 21% of all Medicaid expenditures; roughly $2.5 billion annually. While Medicaid LTSS expenditures do not quite reach those attributed to Medicaid-funded acute care, they are not far behind and that gap is closing. The challenge of developing a sustainable care model that is effective for both privately and publicly provided LTSS is therefore a growing concern in Michigan. The state requires an approach that assures adequate care for those in need while not overburdening public services. Individuals who might not ever be eligible for Medicaid might well find themselves physically in need of LTSS. Both the extensive scope of potential need and the global impact of meeting that need necessitates a broader understanding of long-term options and impacts; an understanding that does not currently exist. To begin building that base of knowledge, the Michigan Legislature added a boilerplate provision to the 2019 appropriation bill directing the MDHHS to undertake a wide-ranging feasibility study of LTSS opportunities in Michigan with an eye toward defining a common benefit available to all residents. Section 1510 of Public Act 207 of 2018 directs the department to conduct a feasibility study of all long-term services and supports available in Michigan and to develop actuarily sound service delivery models that would make such services available to all state residents. The study is based on similar work conducted for Washington State. While that study was used to develop a payroll tax to support the provision of services, it must be noted that the Michigan study has no preconceived outcome. It is hoped that the study will serve as a watershed on which to build future research and to guide the development of public policy in this area going forward. The boilerplate language is rather prescriptive and details both the content for the study as well as a timeline. MDHHS has followed that language to the extent possible. The boilerplate section can be found in Figure 1 on Page 4. Conducting such extensive research on such a restricted timeline is well beyond the resource capacity of the department. Therefore, MDHHS reached out to contractual partners to handle the research itself. Milliman, who conducted the original research project for the State of Washington, conducted further work on the actuarial models of the study. Similarly, Altarum directed the research on workforce issues. To avoid a Medicaid bias, Michigan United served as a facilitator for all public workgroups and forums and helped coordinate much of the overall effort on the study. A public stakeholder meeting was held in Mt. Pleasant on September 5, 2019 to review plans for the conduct and timing of the study. With that input, the study officially kicked off on October 1, 2019 although some of the contacted research was underway by that point. Research was reviewed in a public forum of December 4, 2019. This provided additional guidance for the final phase of the research which was conducted over the first four months of 2020. Despite the COVID-19 pandemic, contractors were able to finish their work essentially on time. Their final reports were presented in a virtual meeting held on September 17, 2020.
1 Based on Medicaid utilization data from Fiscal Year 2017.
4
Sec. 1510. (1) From the funds appropriated in part 1 for medical services administration, the department shall match 100% of any private funds, up to $100,000.00, with state general fund/general purpose revenues for the purpose of contracting for an independent feasibility study and actuarial model of public, private, and public-private hybrid options to help individuals prepare for, access, and afford long-term services and supports. The study must include models for all of the following:
(a) An affordable annual long-term care benefit available to all individuals who meet the minimum eligibility of needing assistance with 2 activities of daily living, with the maximum benefit amount to be determined by actuarial analysis.
(b) A public-private reinsurance or risk-sharing model, with the purpose of providing a stable and ongoing source of reimbursement to insurers for a portion of their catastrophic long-term care services and supports losses in order to provide additional insurance capacity for the state. The entity would operate as a public-private partnership supporting the private sector’s role as the primary risk bearer.
(c) A long-term care benefit paid for and open to those that are not currently eligible for the state Medicaid program. (2) The awarded contractor shall provide a report to the department on the independent feasibility study and actuarial model that includes all of the following:
(a) An analysis of public and private long-term care programs that exist in the state, the participation rates for those programs, and any clear gaps that exist, including, but not limited to, gaps in coverage, affordability, and participation.
(b) The expected costs and benefits for participants in a new long-term care benefit program, when accounting for a living wage rate for home care workers and compliance with the fair labor standards act of 1938, 29 USC 201 to 219, the federal regulations in 29 CFR 552 relating to that act, and state labor laws.
(c) The total anticipated number of participants. (d) The impact on the current workforce. (e) A recruitment and retention plan to meet anticipated shortage in the workforce
due to the increasing aging population. (f) The impact of current services, access to a paid workforce, and affordability of care
on family caregivers, including how many family members are providing care to the individual, the impact that providing care has on a family caregiver’s job, family caregivers’ access to training programs, how many hours of care a family caregiver is providing, the types of services a family caregiver is performing, if the primary caregiver is also caring for a child, and if there are children present in the home who also assist with caring for the aging adult in the home.
(g) The projected savings to the state Medicaid program, if any. (h) Legal and financial risks to the state. 180
(3) The department shall provide oversight and direction for the analysis described in subsection (2) and shall convene meetings for interested stakeholders, including consumer and worker representatives, to provide ongoing input on the feasibility study design. The department shall hold not fewer than 3 meetings for stakeholders to comply with the provisions of this subsection, as follows: a meeting before the study begins, a meeting during the study’s implementation, and a meeting after the study is completed. (4) The feasibility study and the actuarial analysis that is included in the feasibility study must be completed and submitted to the department no later than 270 days after the start date of the feasibility study. The department shall hold a public hearing presenting its findings. The department shall submit a report, including the director’s findings and recommendations based on the feasibility study and actuarial analysis, to the legislature no later than 60 days after the
completion of the feasibility study.
Figu
re 3
: Sec
.151
0 Bo
ilerp
late
Lan
guag
e
5
While the COVID-19 pandemic had minimal impact on the production of the LTSS Feasibility study, it might have a lasting impact on the provision of LTSS in Michigan. Changes made in response to the pandemic may also become permanent fixtures of the LTSS landscape. LTSS may look very different in a post-pandemic world.
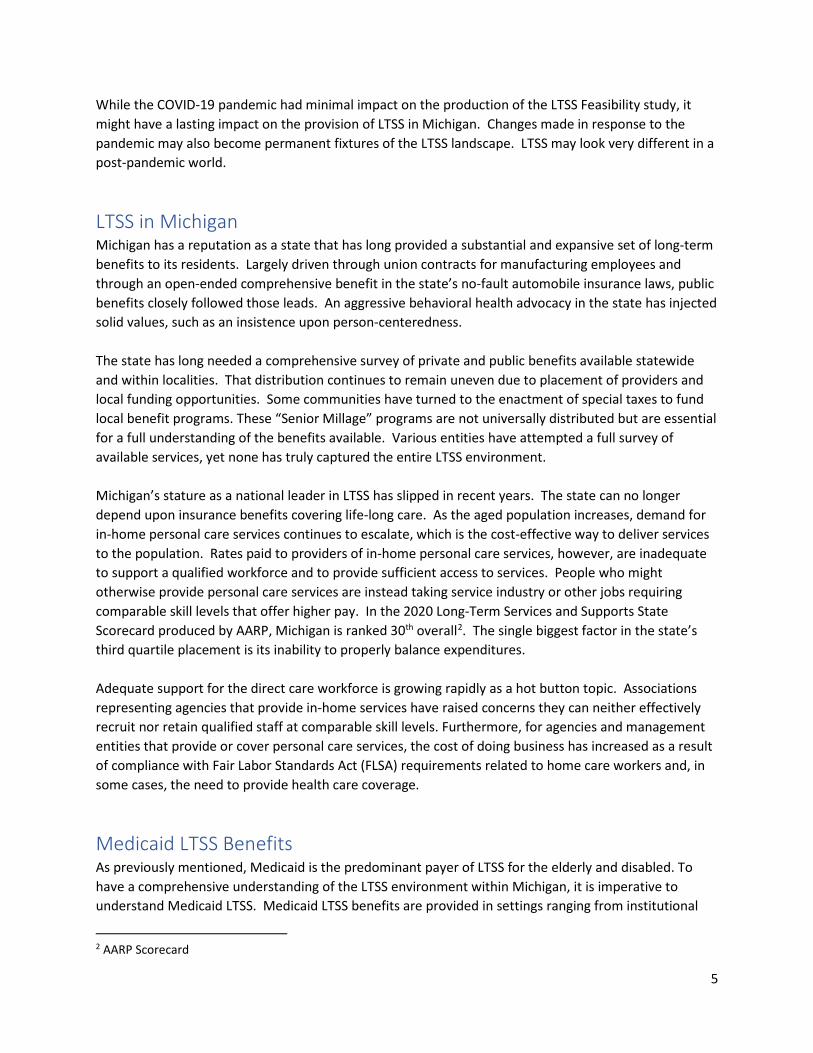
LTSS in Michigan Michigan has a reputation as a state that has long provided a substantial and expansive set of long-term benefits to its residents. Largely driven through union contracts for manufacturing employees and through an open-ended comprehensive benefit in the state’s no-fault automobile insurance laws, public benefits closely followed those leads. An aggressive behavioral health advocacy in the state has injected solid values, such as an insistence upon person-centeredness. The state has long needed a comprehensive survey of private and public benefits available statewide and within localities. That distribution continues to remain uneven due to placement of providers and local funding opportunities. Some communities have turned to the enactment of special taxes to fund local benefit programs. These “Senior Millage” programs are not universally distributed but are essential for a full understanding of the benefits available. Various entities have attempted a full survey of available services, yet none has truly captured the entire LTSS environment. Michigan’s stature as a national leader in LTSS has slipped in recent years. The state can no longer depend upon insurance benefits covering life-long care. As the aged population increases, demand for in-home personal care services continues to escalate, which is the cost-effective way to deliver services to the population. Rates paid to providers of in-home personal care services, however, are inadequate to support a qualified workforce and to provide sufficient access to services. People who might otherwise provide personal care services are instead taking service industry or other jobs requiring comparable skill levels that offer higher pay. In the 2020 Long-Term Services and Supports State Scorecard produced by AARP, Michigan is ranked 30th overall2. The single biggest factor in the state’s third quartile placement is its inability to properly balance expenditures. Adequate support for the direct care workforce is growing rapidly as a hot button topic. Associations representing agencies that provide in-home services have raised concerns they can neither effectively recruit nor retain qualified staff at comparable skill levels. Furthermore, for agencies and management entities that provide or cover personal care services, the cost of doing business has increased as a result of compliance with Fair Labor Standards Act (FLSA) requirements related to home care workers and, in some cases, the need to provide health care coverage.
Medicaid LTSS Benefits As previously mentioned, Medicaid is the predominant payer of LTSS for the elderly and disabled. To have a comprehensive understanding of the LTSS environment within Michigan, it is imperative to understand Medicaid LTSS. Medicaid LTSS benefits are provided in settings ranging from institutional
2 AARP Scorecard
6
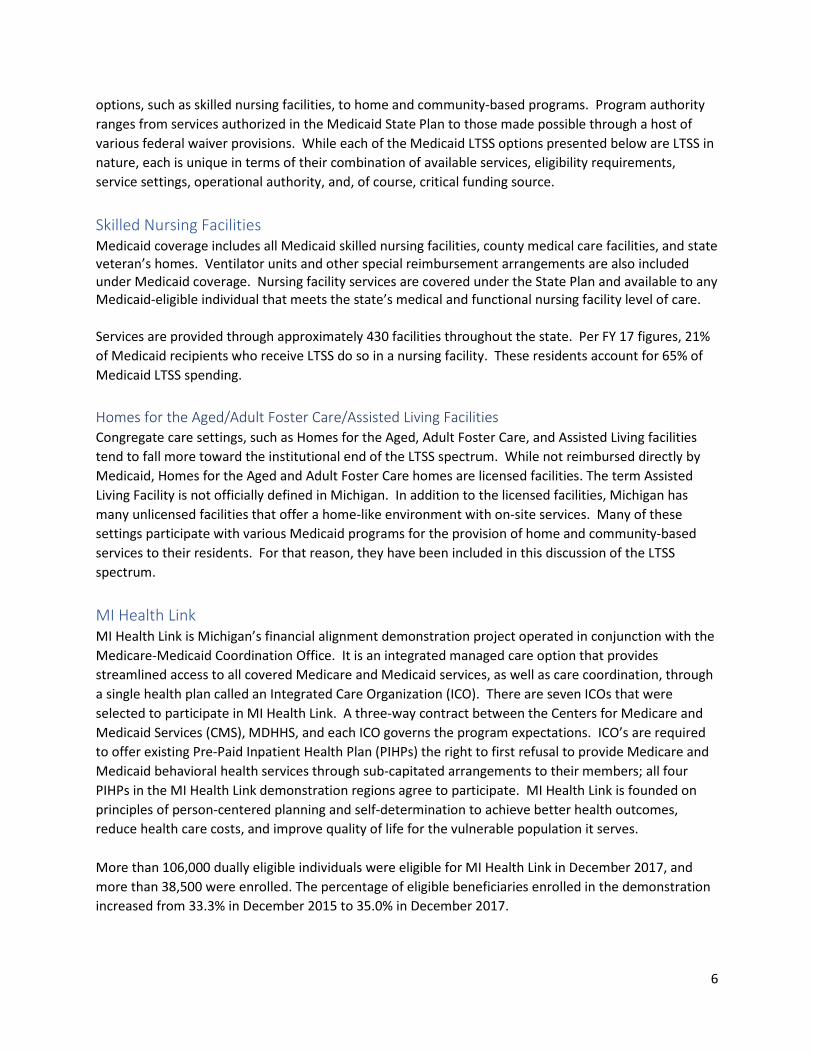
options, such as skilled nursing facilities, to home and community-based programs. Program authority ranges from services authorized in the Medicaid State Plan to those made possible through a host of various federal waiver provisions. While each of the Medicaid LTSS options presented below are LTSS in nature, each is unique in terms of their combination of available services, eligibility requirements, service settings, operational authority, and, of course, critical funding source.
Skilled Nursing Facilities Medicaid coverage includes all Medicaid skilled nursing facilities, county medical care facilities, and state veteran’s homes. Ventilator units and other special reimbursement arrangements are also included under Medicaid coverage. Nursing facility services are covered under the State Plan and available to any Medicaid-eligible individual that meets the state’s medical and functional nursing facility level of care. Services are provided through approximately 430 facilities throughout the state. Per FY 17 figures, 21% of Medicaid recipients who receive LTSS do so in a nursing facility. These residents account for 65% of Medicaid LTSS spending. Homes for the Aged/Adult Foster Care/Assisted Living Facilities Congregate care settings, such as Homes for the Aged, Adult Foster Care, and Assisted Living facilities tend to fall more toward the institutional end of the LTSS spectrum. While not reimbursed directly by Medicaid, Homes for the Aged and Adult Foster Care homes are licensed facilities. The term Assisted Living Facility is not officially defined in Michigan. In addition to the licensed facilities, Michigan has many unlicensed facilities that offer a home-like environment with on-site services. Many of these settings participate with various Medicaid programs for the provision of home and community-based services to their residents. For that reason, they have been included in this discussion of the LTSS spectrum.
MI Health Link MI Health Link is Michigan’s financial alignment demonstration project operated in conjunction with the Medicare-Medicaid Coordination Office. It is an integrated managed care option that provides streamlined access to all covered Medicare and Medicaid services, as well as care coordination, through a single health plan called an Integrated Care Organization (ICO). There are seven ICOs that were selected to participate in MI Health Link. A three-way contract between the Centers for Medicare and Medicaid Services (CMS), MDHHS, and each ICO governs the program expectations. ICO’s are required to offer existing Pre-Paid Inpatient Health Plan (PIHPs) the right to first refusal to provide Medicare and Medicaid behavioral health services through sub-capitated arrangements to their members; all four PIHPs in the MI Health Link demonstration regions agree to participate. MI Health Link is founded on principles of person-centered planning and self-determination to achieve better health outcomes, reduce health care costs, and improve quality of life for the vulnerable population it serves. More than 106,000 dually eligible individuals were eligible for MI Health Link in December 2017, and more than 38,500 were enrolled. The percentage of eligible beneficiaries enrolled in the demonstration increased from 33.3% in December 2015 to 35.0% in December 2017.

7
Program of All-Inclusive Care for the Elderly (PACE) The Program of All-Inclusive Care for the Elderly (PACE) is a capitated benefit authorized by the Balanced Budget Act of 1997 that features a comprehensive service delivery system and integrated Medicare and Medicaid financing for frail, elderly individuals that meet the state’s nursing facility level of care criteria. Services are most often delivered in a geographically centralized PACE center. To be eligible for PACE, participants must meet the following criteria:
• Medically qualified, must meet Medicaid's eligibility criteria • Must be at least 55 years of age or older • Must live within the approved geographic area of the PACE organization • Must be able to live safely in the community (not residing in a nursing facility) at the time of
PACE enrollment
Michigan currently has eleven PACE organizations operating throughout the state serving roughly 3,500 participants. The program differs from other Medicaid programs because organizations that invest in this program make a financial commitment in advance of any guarantee of funding from the state. Development needs to start well in advance of the regular budget cycle because of the need to invest in bricks and mortar for a physical PACE center.
MI Choice MI Choice is a managed care program authorized as a combination §1915(b) (1) & (4) and § 1915(c) waiver. This waiver delivers home and community-based services to elderly and disabled adults (aged 18 or older) meeting the nursing facility level of care criteria who, but for the provision of home-based services, would require care in a nursing facility. The goal is to provide home and community-based services and supports to participants using a person-centered planning process that allows them to maintain or improve their health, welfare, and quality of life. The program offers a menu of 17 available services. MI Choice has been operational since March 1992. Twenty Prepaid Ambulatory Health Plans, referred to as Waiver Agencies, administer the program. The 20 waiver agencies serve fourteen service areas providing statewide coverage. The waiver agencies include Area Agencies on Aging, Community Mental Health agencies, Information and Referral agencies and a Home Health Agency. MI Choice serves approximately 16,000 individuals each year.
Home Help The Home Help program provides Medicaid state plan personal care assistance such as eating, bathing, and grooming. Additional assistance with items such as chore services, medication set-up, shopping, and laundry is also available. Home Help is available to any Medicaid beneficiary with a verified medical need who requires assistance with at least one activity of daily living (ADL).
Behavioral Health Services Individuals living with intellectual or developmental disabilities often receive LTSS through programs offered through the Behavioral Health and Developmental Disabilities Administration in MHSAA. Services often mirror those offered through other Medicaid LTSS programs, although some services are more targeted to the needs of this population. Services are offered through state plan authority as well as waiver programs such as the Habilitation Supports Waiver and the Children’s Services Waiver.
8
Other Long-term Medicaid Services Brain Injury Services Brain Injury Services focus on specialized rehabilitation and supportive services required upon release from an acute care setting following a moderate or severe brain injury. A brain injury does not include damage to the brain resulting from neurodegenerative disorders such as Alzheimer’s disease or dementia. These services are for beneficiaries who can benefit from the advanced level of rehabilitative therapies and other services offered. These services can be obtained in either a transitional residential or outpatient setting. The program provides critical brain injury-specific rehabilitation and support in the post-acute injury period with the goal of assisting the participant in becoming capable of living safely in the most independent setting. All providers for BIS must have appropriate accreditation, certifications, or specialized training in serving individuals with brain injuries. Transitional residential services are limited to six months for each brain injury.
Community Transition Services As of October 1, 2018, nursing facility transition services are authorized through a §1915(i) State Plan Amendment for Home and Community-Based Services. This is the culmination of a three-year effort by a Lean Process Improvement Design team and five action teams to create a sustainable nursing facility transition services option in Michigan. Transition navigators work with nursing facility residents who wish to transition back into the community to assure a successful outcome. Home Health Home Health are therapy services provided in the home. These include physical, occupational, and speech therapies. A home health aide can be assigned for personal care needs. The therapies must be ordered by a physician.
Hospice Hospice provides medical and palliative care services for terminally ill individuals determined by a physician to have a life expectancy of 6-months or less. Per federal regulation, if the terminally ill individual elects hospice the individual may re-elect hospice every 6-months if, again, they are determined by a physician to have a life expectancy of 6 months or less.
Managed Long-term Services and Supports (MLTSS) According to CMS, managed long-term services and supports (MLTSS) “refers to the delivery of long term supports and services through capitated Medicaid managed care programs.” As of 2012, 16 states had MLTSS programs and interest in the model continues to grow. The provision of long-term services and supports is perhaps the last element of health care to venture down the path of managed care. Managed care has been a staple in the physical health realm as well as in the behavioral health world. As efforts intensify to integrate services, it becomes increasingly important that the services be provided from similar platforms. MLTSS has, in fact, already gained a foothold in Michigan as several of the Medicaid LTSS programs are reimbursed through capitation. This includes MI Choice, PACE, MI Health Link, and the Community Living Support (CLS) services provided through the Behavioral Health waivers. This managed care experience must be recognized in the planning and design of a more global delivery system.
9
Past legislative boilerplate mandated MDHHS to investigate the possibility of moving to a Managed Long-term Services and Supports process. To that end, the department partnered with the Center for Healthcare Research and Transformation headquartered at the University of Michigan, Public Sector Consultants, and Health Policy Matters to begin that work. Thus far, the group has looked at the growth of MLTSS nationally and best practices from other states, including lessons learned from the development and implementation of their processes. They recently released report on the state’s MLTSS effort, describes possible straw models to be used in future MLTSS discussions. Also described were potential scenarios on how MLTSS might be implemented over the next few years.
10
Figure 4: Process Flow of Medicaid LTSS
LTSS Flowchart
Service Delivery
Nursing Facilities
MI Health Link
MI Choice
Home Help
PACE
Values Person - centered
Choice Options
Olmstead compliant Accessible Sustainable
Rebalancing Public Awareness
Processes Research customer needs Determine core services
Establish necessary authority Manage regulatory
compliance Determine support processes
Develop provider relationships
Determine core processes for services
Provide services Understand customer
satisfaction Design & redesign services
and products
Outcomes Improved quality of life Better health outcomes
Higher customer satisfaction
Reduced audit and legal risks
Lower cost of care
Policy Options Financing Eligibility
Medicaid authority Provider network Quality metrics
11
Attachment 1: Long-Term Services and Supports Milliman Report
15800 W. Bluemound Road Suite 100 Brookfield, WI 53005 USA Tel +1 262 784 ax +1 262 923 3680 milliman.com
MILLIMAN REPORT
Long-Term Services and Supports Feasibility Study Commissioned by the State of Michigan Department of Health and Human Services February 8, 2021
Christopher Giese, FSA, MAAA Allen Schmitz, FSA, MAAA Christopher Pettit, FSA, MAAA Principal and Consulting Actuary Principal and Consulting Actuary Principal and Consulting Actuary Sarah Wunder, FSA, MAAA Jeremy Hamilton, FSA, MAAA Jeremy Cunningham, FSA, MAAA Consulting Actuary Consulting Actuary Consulting Actuary Annie Gunnlaugsson, ASA, MAAA Associate Actuary
•

MILLIMAN REPORT
_______________________________________________________________________________________________________________________
State of Michigan Department of Health and Human Services Long-Term Services and Supports Feasibility Study Report February 8, 2021
Table of Contents I. OVERVIEW ........................................................................................................................................................... 1
II. BASELINE RESULTS FOR PUBLIC BENEFIT MODEL ..................................................................................... 3
III. PLAN DESIGN ALTERNATIVES FOR PUBLIC BENEFIT MODEL…………………………………………. ........ ..6
IV. RESULTS FOR PUBLIC-PRIVATE PARTNERSHIP MODEL………………………………………………………..12
V. DISCUSSION OF CONSIDERATIONS .............................................................................................................. 21
VI. FISCAL IMPACT TO MICHIGAN MEDICAID PROGRAM ................................................................................. 24
VII. MODELING ASSUMPTIONS SENSITIVITY TESTING ...................................................................................... 28
VIII. METHODOLOGY AND ASSUMPTIONS............................................................................................................ 32
IX. CAVEATS AND LIMITATIONS .......................................................................................................................... 36
EXHIBITS EXHIBIT 1: SUMMARY OF PROGRAM ALTERNATIVES MODELED EXHIBIT 2: ESTIMATED PAYROLL TAX FOR PROGRAM ALTERNATIVES
MILLIMAN REPORT
_______________________________________________________________________________________________________________________
State of Michigan Department of Health and Human Services Page 1 Long-Term Services and Supports Feasibility Study Report February 8, 2021
I. OVERVIEW The State of Michigan Department of Health and Human Services (DHHS) is conducting a feasibility study regarding public and private options to help Michiganders prepare to meet their long-term services and supports (LTSS) needs. The study was mandated by the passage of House Bill No. 4674.3 Milliman, an international actuarial and consulting firm, was selected through a non-competitive bid process to conduct the actuarial analysis component of the study. SCOPE OF ENGAGEMENT AND WORK PROCESS The scope of our engagement included two main components: 1) gathering stakeholder feedback, and 2) actuarial modeling of LTSS programs. The actuarial analysis focuses on quantitative and qualitative analyses of three tasks, per the direction of the Michigan Legislature in House Bill 4674, Section 2.
Task 1a – A long-term care benefit for all Michiganders who meet benefit eligibility criteria
Task 1b – A public-private risk-sharing insurance program that reimburses private insurers
Task 1c – A long-term care benefit for those who do not qualify for Medicaid
Based on discussions with DHHS, we addressed these three proposals by focusing on two “endpoints,” ranging from a mandatory, public program design, to a voluntary, public-private program design. The model parameters incorporate desired attributes by DHHS under the following two general structures:
Public Benefit Model (combines task 1a and 1c) - A public long-term care benefit available to all individuals who meet the minimum eligibility of needing assistance with two activities of daily living, with the maximum benefit amount to be determined by actuarial analysis. In Section III, we consider variations where the program excludes the population below certain Federal Poverty Levels (FPL), which we use to approximate the impact of only providing a benefit to those not currently eligible for the state Medicaid program.
Public-Private Partnership Model (task 1b) - A public-private reinsurance or risk-sharing model, with the
purpose of providing a stable and ongoing source of reimbursement to insurers for a portion of their catastrophic LTSS losses, in order to provide additional insurance capacity for the state. The entity would operate as a public-private partnership supporting the private sector’s role as the primary risk bearer.
An important starting place for a discussion of the design of various LTSS finance reform approaches is to identify both the problems to be solved and the objectives that are most important to address as part of a new LTSS program. We gathered input through a series of interviews and discussions with various stakeholders. We compiled stakeholder feedback to create a list of modeling alternatives for actuarial analysis. Overall, stakeholders revealed a strong preference for the “Public Benefit Model,” as opposed to the “Public-Private Partnership Model.” Many stakeholders felt actuarial analysis of a variety of options and alternatives would be most beneficial to program decision-making. In particular, participants indicated the analysis should include sensitivity testing around major parameters. Stakeholders also stated it would be helpful to see options across the LTSS benefits spectrum, ranging from lean to rich parameters. The modeling alternatives analyzed in this report are not intended to be an exhaustive list of options; instead, they serve to illustrate a wide variety of options that will help guide further discussions regarding the LTSS program parameters. COMMENTS ON LTSS DEFINITION AND LONG-TERM ACTUARIAL PROJECTIONS For the purposes of this report, we use the terms LTSS and long-term care (LTC) interchangeably. LTSS is a range of services and supports for individuals who need assistance with daily living tasks, such as bathing, dressing, ambulation, transfers, toileting, medication administration or assistance, personal hygiene, transportation, and other health-related
3 House Bill No. 4674. (2017) Retrieved July 21, 2020, from https://www.legislature.mi.gov/documents/2017-2018/billintroduced/House/pdf/2017-HIB-4674.pdf
MILLIMAN REPORT
_______________________________________________________________________________________________________________________
State of Michigan Department of Health and Human Services Page 2 Long-Term Services and Supports Feasibility Study Report February 8, 2021
tasks. Often, this type of assistance is needed by individuals who experience functional limitations due to age, or physical or cognitive disability. LTSS includes services provided in:
Institutional settings – Includes skilled, intermediate, and custodial care provided in an institutional facility setting, such as a nursing home or dedicated wing of a hospital.
Home and community-based settings (HCBS) – Includes care provided in a person’s own home or in a
community-based setting, such as an assisted living facility or adult family home. Coverage includes both the services rendered and the room and board in a community-based setting.
The estimates provided throughout this report are prepared to assist in evaluating the feasibility of offering a new LTC program using design elements as requested by DHHS. Any estimates around required program revenue are for feasibility purposes only and not intended, and should not be used, for setting the program tax rate. This report includes estimates projected many years into the future. Actual expenses and related required revenue will inevitably vary from the estimates within this report. Examples of items that are difficult to project include the level of utilization of LTC services over time, duration of care needs, charge trends by site of care, emergence of new service and care modalities, wage growth and labor force participation, effectiveness of regulations and procedures to determine coverage and qualifications for benefits, migration patterns into and out of Michigan, and future mortality. Section VIII (methodology and assumptions) provides further background on our modeling. Any reader of this report should possess a certain level of expertise and background in actuarial projections related to financing LTSS / LTC benefits to assist in understanding the significance of the assumptions used and the impact of these assumptions on the illustrated results. The reader should be advised by, among other experts, actuaries or other professionals competent in the area of actuarial projections of the type in this report, so as to properly interpret the estimates. The information included in this report should only be considered in its entirety. Please see Section IX for additional caveats and limitations regarding this report.
MILLIMAN REPORT
_______________________________________________________________________________________________________________________
State of Michigan Department of Health and Human Services Page 3 Long-Term Services and Supports Feasibility Study Report February 8, 2021
II. BASELINE RESULTS FOR PUBLIC BENEFIT MODEL Based on stakeholder feedback and input from DHHS, the program modeled as the basis for this LTSS feasibility study is defined as a public, time-limited long-term care insurance benefit for workers, funded through a payroll deduction. The plan would be financed by a flat state tax on all wages and self-employment reported wages; therefore, participation is mandatory. Coverage is limited to workers and does not include spousal coverage. Funding is assumed to be pay-as-you-go for a social insurance program, though the program does include some measure of prefunding. Section V includes additional details regarding prefunding and other funding considerations. RESULTS SUMMARY – BASE PLAN Based on stakeholder feedback and input from DHHS, we modeled the Public Benefit Model as a public long-term care insurance benefit for workers, funded through a payroll deduction that would provide a time-limited long term care insurance benefit. For the purposes of this feasibility study, we assumed the plan would be financed by a flat state tax on all wages and self-employment income; therefore, participation is mandatory. Coverage is limited to workers and does not include spousal coverage. Funding is assumed to be pay-as-you-go for a social insurance program, although the program does include some measure of prefunding. Please note, the Base Plan does not represent a recommended plan. Instead, we display the Base Plan as a reference point to evaluate the incremental cost or savings associated with other alternatives. Sections III and VII of this report include program alternatives and sensitivities relative to the Base Plan. For the Base Plan and all alternatives and sensitivities, we modeled the required revenue (payroll tax), benefit payments, and balance of a possible separate trust fund. We estimate the Base Plan will require a 0.63% payroll surtax rate over the 75-year period. Section V of this report includes additional discussion of the program tax rate and fund balance calculation. The calculated payroll surtax rates do not reflect any assumed savings or reductions in other state funded programs. To the extent that those savings are diverted to this program, the tax rate may vary. The plan features for Base Plan are outlined in the section that follows. Our projection model produces year-by-year cash flow projections, such that the value and scope of the program can be estimated for any of the years in the 75-year projection period window. Revenue collected under the program is assumed to be placed into a trust fund for the sole purpose of paying expected program benefits and expenses. Program revenue consists of income to the program from taxes and interest earned from the fund balance. Program expenditures consist of benefit payments in institutional or home and community-based care settings and administrative expenses. Please refer to Section VIII for additional details regarding the methodology and assumptions used in the actuarial modeling. The estimated payroll tax is highly sensitive to the underlying projection assumptions used in the modeling. Section VII includes additional details regarding sensitivity tests of the key assumptions. Based on testing various key assumptions one at a time, we observe the tax rate for the Base Plan ranging from 0.40% to 0.93%. The results of the testing should be taken into consideration when evaluating the feasibility of offering a new LTSS benefit program. Understanding the sensitivity of the program results under different conditions and the program’s ability to adjust features when experience materializes differently than expected is a key initial step to inform rate setting. DESCRIPTION OF BASE PLAY KEY FEATURES The Base Plan features are outlined below. Tests regarding alternative plan designs and the sensitivity of changing program features, eligible population, and other modeling assumptions relative to the Base Plan are discussed later in the report. As mentioned above, the Base Plan does not represent a recommended plan, but rather a reference point to evaluate the incremental cost or savings associated with other alternatives.
Comprehensive covered services similar to private market.
Institutional settings.
• Includes skilled, intermediate, and custodial care provided in an institutional facility setting, such as
a nursing home or dedicated wing of a hospital.

MILLIMAN REPORT
_______________________________________________________________________________________________________________________
State of Michigan Department of Health and Human Services Page 4 Long-Term Services and Supports Feasibility Study Report February 8, 2021
Home and Community-based settings.
• Includes care provided in a person’s own home or in a community-based setting (such as an assisted
living facility or adult family home).
Minimum age requirement for participation of 18, disabled after 18.
Individuals are not eligible for program benefits until they turn age 18 and are not eligible for program
benefits if they were disabled before age 18.
HIPAA definition for benefit eligibility (i.e., “benefit trigger”).
Individuals who are vested can draw benefits once they meet the HIPAA eligibility “trigger.” The HIPAA
trigger is defined as needing assistance with two or more ADLs or severe cognitive impairment, where the individual is expected to meet the definition for at least the next 90 days.
Starting program maximum daily benefit amount of $150 in 2025, indexing at 3% per year thereafter.
Benefits are paid by reimbursing an individual for actual expenses incurred, subject to a daily maximum.
The daily maximum increases at a rate of 3% per year.
Starting pool of benefit dollars of $54,750, indexing at 3% per year.
The pool of money is calculated as a one-year (365-day) maximum benefit (over an individual’s lifetime)
multiplied by the daily benefit amount. The pool of money approach implies that a person may receive benefits for more than the benefit period (in this case, for more than one year).
Reimbursement benefit structure.
Benefits are paid only as reimbursement for an individual’s actual expenses incurred.
90-day elimination period.
Benefit payment commences following satisfaction of a one-time “deductible” period of 90 consecutive
days during which the individual has a qualifying level of disability meeting the benefit eligibility trigger.
Vesting by tax payments in three of last six years, or 10 years total.
To be eligible for benefits, individuals must pay the tax for a specified number of years, known as the
vesting period. The Base Plan assumes vesting is satisfied by tax payments in three of the last six years, or 10 total years during an individual’s work history.
Divesting period grading to 0% after five years.
If a vested individual moves from the state, that person will be eligible for a prorated maximum benefit,
grading down to no benefit after five years outside the state (80% of the benefit after one year, 60% of the benefit after two years, etc.).
MILLIMAN REPORT
_______________________________________________________________________________________________________________________
State of Michigan Department of Health and Human Services Page 5 Long-Term Services and Supports Feasibility Study Report February 8, 2021
Program revenue source is payroll tax on wages.
Financing for the program will come solely from tax payments. There are no premiums required once an
individual no longer receives wages.
DESCRIPTION OF TAX BASIS FOR REVENUE SOURCES A fundamental facet in creating a new LTSS program is the funding source for the LTSS benefits. Per conversations with DHHS, we used a flat payroll tax as a benchmark to present the revenue required to finance different program structures and parameters for feasibility study purposes. For purposes of this analysis, the payroll tax is calculated based off all covered earnings subject to the Medicare tax. Covered earnings is comprised of all wages (including self-employment reported wages). While a flat payroll tax is calculated for ease of comparison in this study, there are numerous options for revenue sources that should be considered. Per DHHS’ request, alternative revenue sources (such as a non-level payroll tax or other tax bases) were not considered as part of the initial feasibility study, but should be considered once the scope of program benefits is narrowed. POPULATION COVERAGE EXPLANATION The Public Benefit Model is designed to provide a public long-term care insurance benefit for current, or future, program-eligible individuals (based on requirements below). It is intended to benefit a large number of individuals, including both the aged and disabled populations. It is important to understand the population eligible for benefits, given the following program specifications:
Benefit Age Eligibility: The Base Plan focuses on providing benefits to individuals who are 18 and older. Given the vesting requirements, this does not have a large impact on the eligible population, as we do not expect most individuals under age 18 to have worked long enough to vest.
Disabled Population: Individuals who were disabled prior to age 18 (consistent with the disability definitions
under the new LTSS program) are not eligible to receive benefits under the program. These individuals typically receive benefits from other state-funded programs.
Vesting Requirements: To be eligible for benefits, individuals must pay the tax for a specified number of years,
known as the vesting period. Therefore, individuals who never work will not vest. Similarly, individuals who are already retired or nearing retirement will likely not be eligible to receive benefits under the program unless a buy-in option is included.
Individual Coverage: The program does not allow spousal or other family member coverage. Only the vested
individual is covered.
Eligibility criteria are crucial assumptions in estimating the benefit payments from this program. Section III contains several plan alternatives that focus on varying program eligibility requirements.
MILLIMAN REPORT
_______________________________________________________________________________________________________________________
State of Michigan Department of Health and Human Services Page 6 Long-Term Services and Supports Feasibility Study Report February 8, 2021
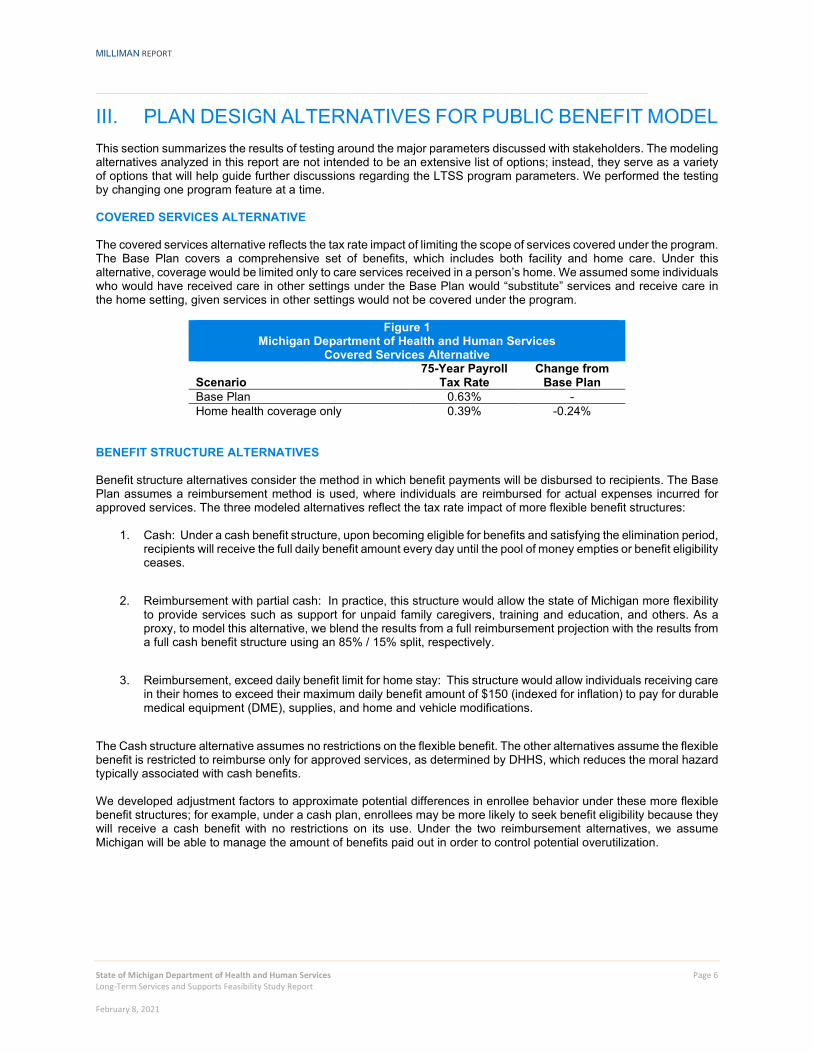
III. PLAN DESIGN ALTERNATIVES FOR PUBLIC BENEFIT MODEL This section summarizes the results of testing around the major parameters discussed with stakeholders. The modeling alternatives analyzed in this report are not intended to be an extensive list of options; instead, they serve as a variety of options that will help guide further discussions regarding the LTSS program parameters. We performed the testing by changing one program feature at a time. COVERED SERVICES ALTERNATIVE The covered services alternative reflects the tax rate impact of limiting the scope of services covered under the program. The Base Plan covers a comprehensive set of benefits, which includes both facility and home care. Under this alternative, coverage would be limited only to care services received in a person’s home. We assumed some individuals who would have received care in other settings under the Base Plan would “substitute” services and receive care in the home setting, given services in other settings would not be covered under the program.
Figure 1 Michigan Department of Health and Human Services
Covered Services Alternative
Scenario 75-Year Payroll
Tax Rate Change from
Base Plan Base Plan 0.63% - Home health coverage only 0.39% -0.24%
BENEFIT STRUCTURE ALTERNATIVES Benefit structure alternatives consider the method in which benefit payments will be disbursed to recipients. The Base Plan assumes a reimbursement method is used, where individuals are reimbursed for actual expenses incurred for approved services. The three modeled alternatives reflect the tax rate impact of more flexible benefit structures:
1. Cash: Under a cash benefit structure, upon becoming eligible for benefits and satisfying the elimination period, recipients will receive the full daily benefit amount every day until the pool of money empties or benefit eligibility ceases.
2. Reimbursement with partial cash: In practice, this structure would allow the state of Michigan more flexibility
to provide services such as support for unpaid family caregivers, training and education, and others. As a proxy, to model this alternative, we blend the results from a full reimbursement projection with the results from a full cash benefit structure using an 85% / 15% split, respectively.
3. Reimbursement, exceed daily benefit limit for home stay: This structure would allow individuals receiving care
in their homes to exceed their maximum daily benefit amount of $150 (indexed for inflation) to pay for durable medical equipment (DME), supplies, and home and vehicle modifications.
The Cash structure alternative assumes no restrictions on the flexible benefit. The other alternatives assume the flexible benefit is restricted to reimburse only for approved services, as determined by DHHS, which reduces the moral hazard typically associated with cash benefits. We developed adjustment factors to approximate potential differences in enrollee behavior under these more flexible benefit structures; for example, under a cash plan, enrollees may be more likely to seek benefit eligibility because they will receive a cash benefit with no restrictions on its use. Under the two reimbursement alternatives, we assume Michigan will be able to manage the amount of benefits paid out in order to control potential overutilization.
MILLIMAN REPORT
_______________________________________________________________________________________________________________________
State of Michigan Department of Health and Human Services Page 7 Long-Term Services and Supports Feasibility Study Report February 8, 2021
Figure 2 Michigan Department of Health and Human Services
Benefit Structure Alternatives
Scenario 75-Year Payroll
Tax Rate Change from
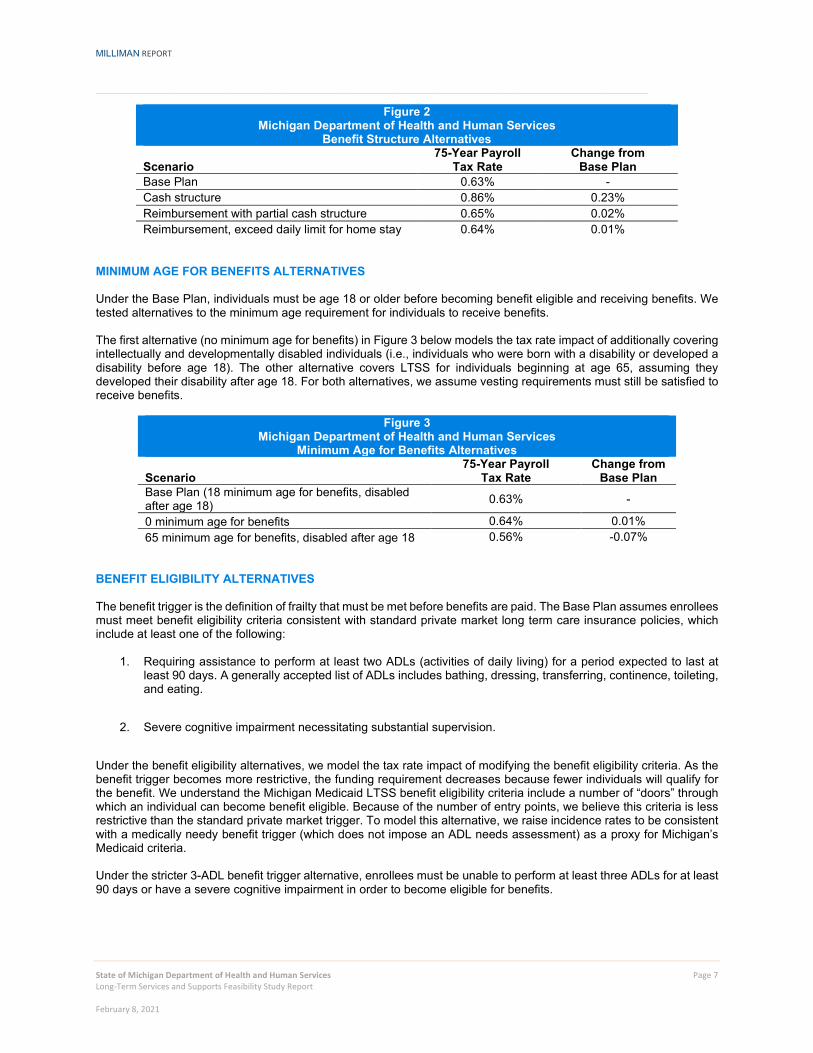
Base Plan Base Plan 0.63% - Cash structure 0.86% 0.23% Reimbursement with partial cash structure 0.65% 0.02% Reimbursement, exceed daily limit for home stay 0.64% 0.01%
MINIMUM AGE FOR BENEFITS ALTERNATIVES Under the Base Plan, individuals must be age 18 or older before becoming benefit eligible and receiving benefits. We tested alternatives to the minimum age requirement for individuals to receive benefits. The first alternative (no minimum age for benefits) in Figure 3 below models the tax rate impact of additionally covering intellectually and developmentally disabled individuals (i.e., individuals who were born with a disability or developed a disability before age 18). The other alternative covers LTSS for individuals beginning at age 65, assuming they developed their disability after age 18. For both alternatives, we assume vesting requirements must still be satisfied to receive benefits.
Figure 3 Michigan Department of Health and Human Services
Minimum Age for Benefits Alternatives
Scenario 75-Year Payroll
Tax Rate Change from
Base Plan Base Plan (18 minimum age for benefits, disabled after age 18) 0.63% -
0 minimum age for benefits 0.64% 0.01% 65 minimum age for benefits, disabled after age 18 0.56% -0.07%
BENEFIT ELIGIBILITY ALTERNATIVES The benefit trigger is the definition of frailty that must be met before benefits are paid. The Base Plan assumes enrollees must meet benefit eligibility criteria consistent with standard private market long term care insurance policies, which include at least one of the following:
1. Requiring assistance to perform at least two ADLs (activities of daily living) for a period expected to last at least 90 days. A generally accepted list of ADLs includes bathing, dressing, transferring, continence, toileting, and eating.
2. Severe cognitive impairment necessitating substantial supervision.
Under the benefit eligibility alternatives, we model the tax rate impact of modifying the benefit eligibility criteria. As the benefit trigger becomes more restrictive, the funding requirement decreases because fewer individuals will qualify for the benefit. We understand the Michigan Medicaid LTSS benefit eligibility criteria include a number of “doors” through which an individual can become benefit eligible. Because of the number of entry points, we believe this criteria is less restrictive than the standard private market trigger. To model this alternative, we raise incidence rates to be consistent with a medically needy benefit trigger (which does not impose an ADL needs assessment) as a proxy for Michigan’s Medicaid criteria. Under the stricter 3-ADL benefit trigger alternative, enrollees must be unable to perform at least three ADLs for at least 90 days or have a severe cognitive impairment in order to become eligible for benefits.

MILLIMAN REPORT
_______________________________________________________________________________________________________________________
State of Michigan Department of Health and Human Services Page 8 Long-Term Services and Supports Feasibility Study Report February 8, 2021
Figure 4 Michigan Department of Health and Human Services
Benefit Eligibility Alternatives
Scenario 75-Year Payroll
Tax Rate Change from
Base Plan Base Plan 0.63% - Medical necessity trigger 0.77% 0.14% 3+ ADL benefit trigger 0.60% -0.03%
DAILY BENEFIT AMOUNT ALTERNATIVES The daily benefit amount (DBA) alternatives consider the tax rate impact of lowering or raising the daily benefit amount. The Base Plan assumes a $150 daily benefit amount. A higher or lower daily benefit amount will directly impact the lifetime maximum benefit amount (i.e., pool of money). We assume 100% benefit utilization for daily benefit amounts $150 and lower, given we expect the average daily cost of care in in Michigan will exceed $150 in a skilled nursing facility, assisted living facility, or home health care setting in 2025. For the $200 and $300 daily benefit amount alternatives, we assume beneficiaries may not utilize the full benefit each day, as they will only be reimbursed for the actual cost of services incurred. The uncapped DBA variation removes the daily benefit limit from the Base Plan. Under this scenario, the lifetime benefit pool remains the same (i.e., $54,750 in 2025), but individuals can use the benefit at a faster rate. On average, we expect this will result in an increase in daily benefit distributions and a shorter window of benefit payments. This provision will increase the cost of the program. We developed adjustments, by attained age, to account for the increase in benefits paid over the lifetime of a claim due to the uncapped daily benefit. We assumed an average level of expenditures given the assumed cost of care in Michigan.
Figure 5 Michigan Department of Health and Human Services
Daily Benefit Amount Alternatives
Scenario 75-Year Payroll
Tax Rate Change from
Base Plan Base Plan 0.63% - $100 DBA, starting pool = $36,500 0.42% -0.21% $200 DBA, starting pool = $73,000 0.83% 0.20% $300 DBA, starting pool = $109,500 1.21% 0.58% No DBA, starting pool = $54,750 0.67% 0.04%
DAILY BENEFIT INDEX ALTERNATIVES Daily benefit index refers to the rate at which benefits will be increased each year for the entirety of the program. Under the Base Plan, a 3.0% inflation rate is used. We tested the following alternatives:
1. 3.5% inflation rate, which can be viewed as a proxy tied to wage growth.
2. 2.5% inflation rate, which can be viewed as a proxy tied to the Consumer Price Index (CPI).
Figure 6
Michigan Department of Health and Human Services Inflation Alternatives
Scenario 75-Year Payroll
Tax Rate Change from
Base Plan Base Plan 0.63% - DBA inflation tied to wage growth 0.77% 0.14% DBA inflation tied to CPI 0.51% -0.12%
MILLIMAN REPORT
_______________________________________________________________________________________________________________________
State of Michigan Department of Health and Human Services Page 9 Long-Term Services and Supports Feasibility Study Report February 8, 2021
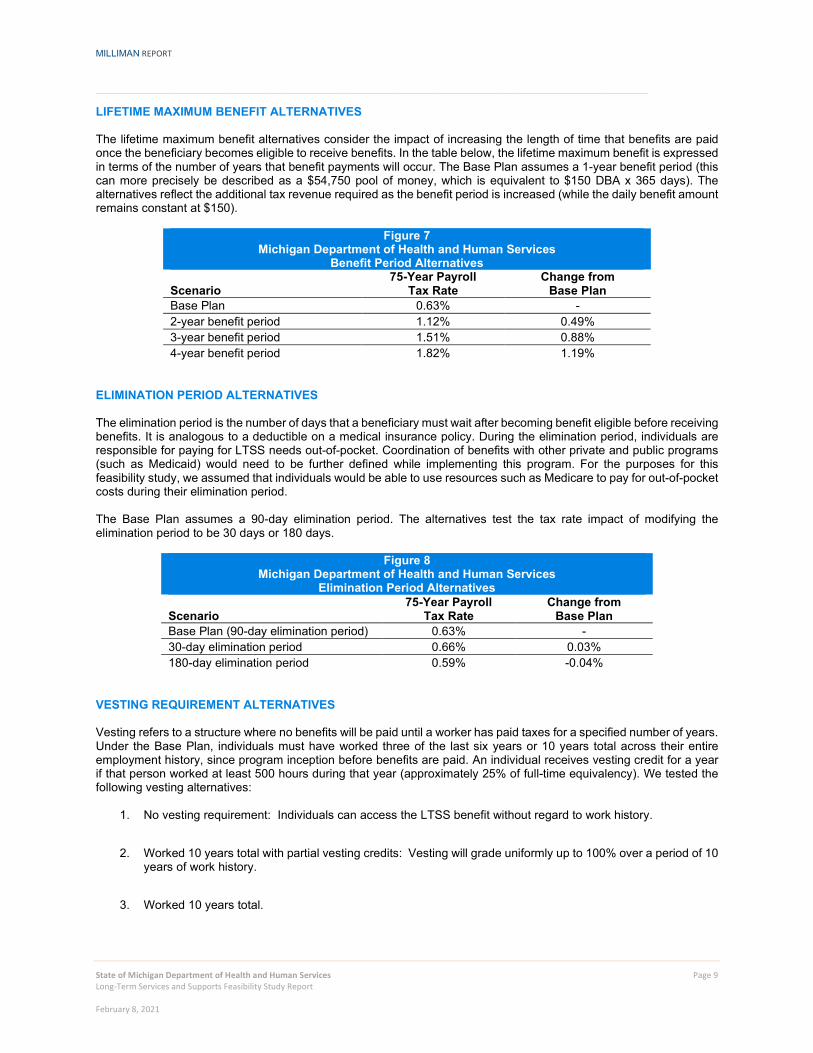
LIFETIME MAXIMUM BENEFIT ALTERNATIVES The lifetime maximum benefit alternatives consider the impact of increasing the length of time that benefits are paid once the beneficiary becomes eligible to receive benefits. In the table below, the lifetime maximum benefit is expressed in terms of the number of years that benefit payments will occur. The Base Plan assumes a 1-year benefit period (this can more precisely be described as a $54,750 pool of money, which is equivalent to $150 DBA x 365 days). The alternatives reflect the additional tax revenue required as the benefit period is increased (while the daily benefit amount remains constant at $150).
Figure 7 Michigan Department of Health and Human Services
Benefit Period Alternatives
Scenario 75-Year Payroll
Tax Rate Change from
Base Plan Base Plan 0.63% - 2-year benefit period 1.12% 0.49% 3-year benefit period 1.51% 0.88% 4-year benefit period 1.82% 1.19%
ELIMINATION PERIOD ALTERNATIVES The elimination period is the number of days that a beneficiary must wait after becoming benefit eligible before receiving benefits. It is analogous to a deductible on a medical insurance policy. During the elimination period, individuals are responsible for paying for LTSS needs out-of-pocket. Coordination of benefits with other private and public programs (such as Medicaid) would need to be further defined while implementing this program. For the purposes for this feasibility study, we assumed that individuals would be able to use resources such as Medicare to pay for out-of-pocket costs during their elimination period. The Base Plan assumes a 90-day elimination period. The alternatives test the tax rate impact of modifying the elimination period to be 30 days or 180 days.
Figure 8 Michigan Department of Health and Human Services
Elimination Period Alternatives
Scenario 75-Year Payroll
Tax Rate Change from
Base Plan Base Plan (90-day elimination period) 0.63% - 30-day elimination period 0.66% 0.03% 180-day elimination period 0.59% -0.04%
VESTING REQUIREMENT ALTERNATIVES Vesting refers to a structure where no benefits will be paid until a worker has paid taxes for a specified number of years. Under the Base Plan, individuals must have worked three of the last six years or 10 years total across their entire employment history, since program inception before benefits are paid. An individual receives vesting credit for a year if that person worked at least 500 hours during that year (approximately 25% of full-time equivalency). We tested the following vesting alternatives:
1. No vesting requirement: Individuals can access the LTSS benefit without regard to work history.
2. Worked 10 years total with partial vesting credits: Vesting will grade uniformly up to 100% over a period of 10
years of work history.
3. Worked 10 years total.
MILLIMAN REPORT
_______________________________________________________________________________________________________________________
State of Michigan Department of Health and Human Services Page 10 Long-Term Services and Supports Feasibility Study Report February 8, 2021
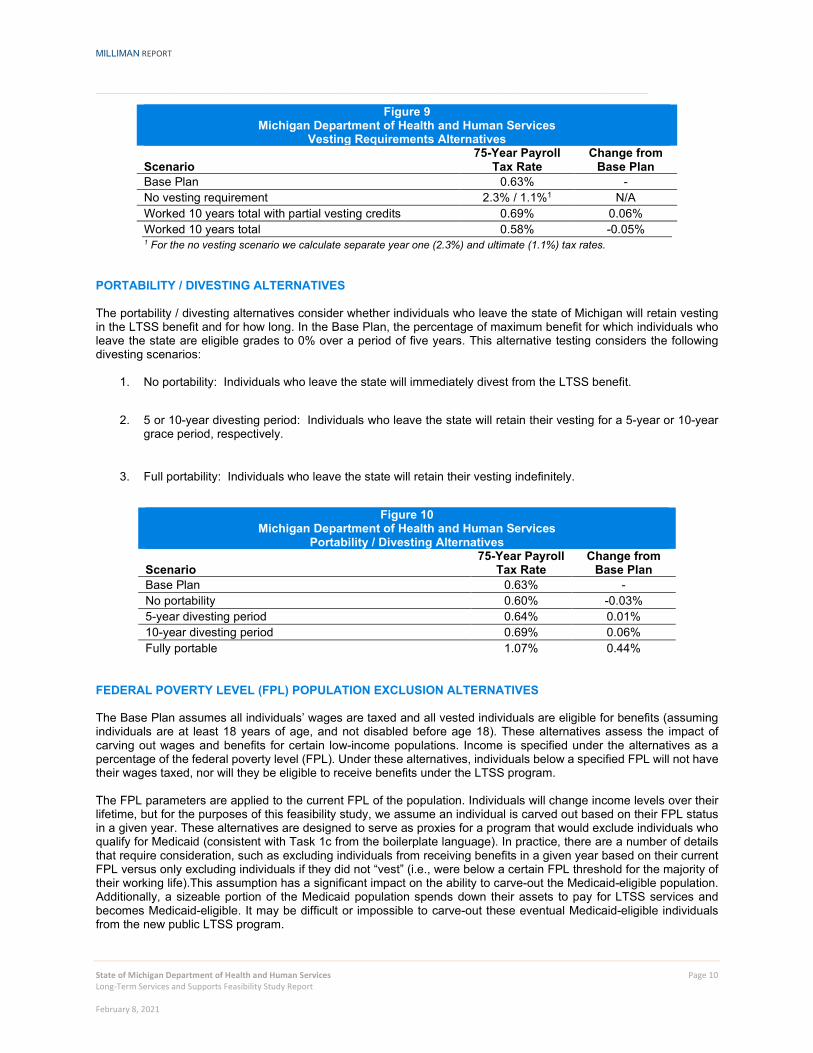
Figure 9 Michigan Department of Health and Human Services
Vesting Requirements Alternatives
Scenario 75-Year Payroll
Tax Rate Change from
Base Plan Base Plan 0.63% - No vesting requirement 2.3% / 1.1%1 N/A Worked 10 years total with partial vesting credits 0.69% 0.06% Worked 10 years total 0.58% -0.05% 1 For the no vesting scenario we calculate separate year one (2.3%) and ultimate (1.1%) tax rates.
PORTABILITY / DIVESTING ALTERNATIVES The portability / divesting alternatives consider whether individuals who leave the state of Michigan will retain vesting in the LTSS benefit and for how long. In the Base Plan, the percentage of maximum benefit for which individuals who leave the state are eligible grades to 0% over a period of five years. This alternative testing considers the following divesting scenarios:
1. No portability: Individuals who leave the state will immediately divest from the LTSS benefit.
2. 5 or 10-year divesting period: Individuals who leave the state will retain their vesting for a 5-year or 10-year
grace period, respectively.
3. Full portability: Individuals who leave the state will retain their vesting indefinitely.
Figure 10
Michigan Department of Health and Human Services Portability / Divesting Alternatives
Scenario 75-Year Payroll
Tax Rate Change from
Base Plan Base Plan 0.63% - No portability 0.60% -0.03% 5-year divesting period 0.64% 0.01% 10-year divesting period 0.69% 0.06% Fully portable 1.07% 0.44%
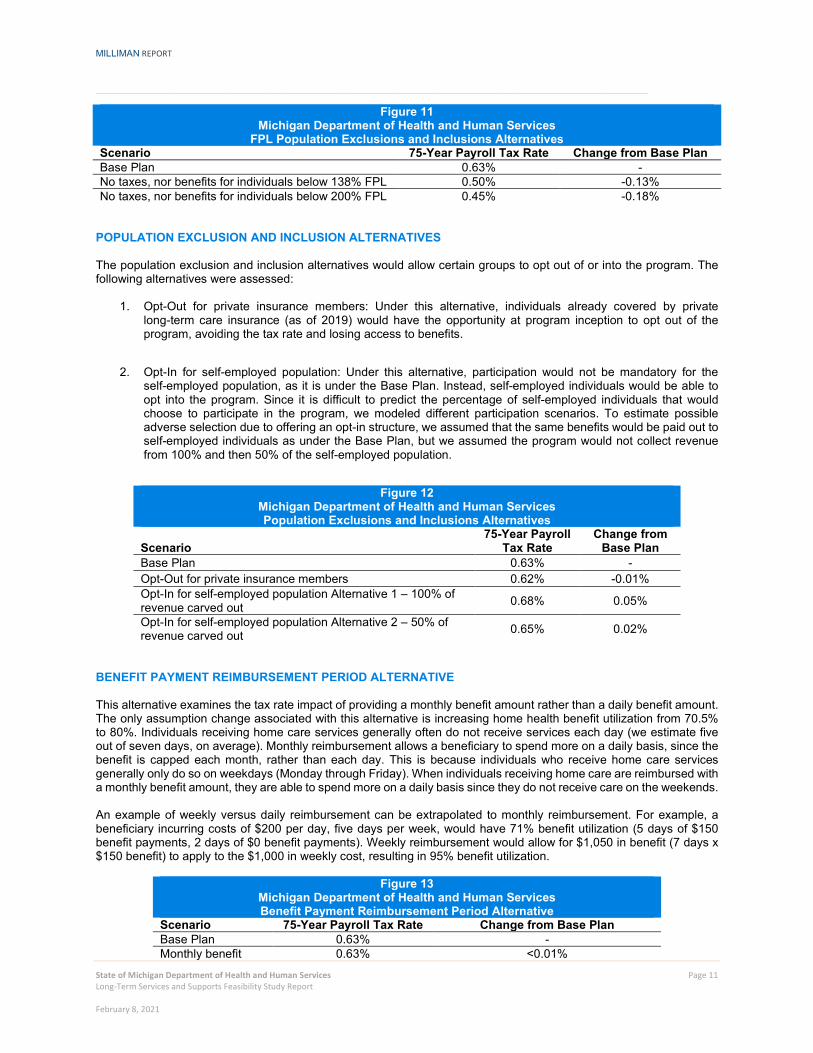
FEDERAL POVERTY LEVEL (FPL) POPULATION EXCLUSION ALTERNATIVES The Base Plan assumes all individuals’ wages are taxed and all vested individuals are eligible for benefits (assuming individuals are at least 18 years of age, and not disabled before age 18). These alternatives assess the impact of carving out wages and benefits for certain low-income populations. Income is specified under the alternatives as a percentage of the federal poverty level (FPL). Under these alternatives, individuals below a specified FPL will not have their wages taxed, nor will they be eligible to receive benefits under the LTSS program.
The FPL parameters are applied to the current FPL of the population. Individuals will change income levels over their lifetime, but for the purposes of this feasibility study, we assume an individual is carved out based on their FPL status in a given year. These alternatives are designed to serve as proxies for a program that would exclude individuals who qualify for Medicaid (consistent with Task 1c from the boilerplate language). In practice, there are a number of details that require consideration, such as excluding individuals from receiving benefits in a given year based on their current FPL versus only excluding individuals if they did not “vest” (i.e., were below a certain FPL threshold for the majority of their working life).This assumption has a significant impact on the ability to carve-out the Medicaid-eligible population. Additionally, a sizeable portion of the Medicaid population spends down their assets to pay for LTSS services and becomes Medicaid-eligible. It may be difficult or impossible to carve-out these eventual Medicaid-eligible individuals from the new public LTSS program.
MILLIMAN REPORT
_______________________________________________________________________________________________________________________
State of Michigan Department of Health and Human Services Page 11 Long-Term Services and Supports Feasibility Study Report February 8, 2021
Figure 11 Michigan Department of Health and Human Services
FPL Population Exclusions and Inclusions Alternatives Scenario 75-Year Payroll Tax Rate Change from Base Plan Base Plan 0.63% - No taxes, nor benefits for individuals below 138% FPL 0.50% -0.13% No taxes, nor benefits for individuals below 200% FPL 0.45% -0.18%
POPULATION EXCLUSION AND INCLUSION ALTERNATIVES The population exclusion and inclusion alternatives would allow certain groups to opt out of or into the program. The following alternatives were assessed:
1. Opt-Out for private insurance members: Under this alternative, individuals already covered by private long-term care insurance (as of 2019) would have the opportunity at program inception to opt out of the program, avoiding the tax rate and losing access to benefits.
2. Opt-In for self-employed population: Under this alternative, participation would not be mandatory for the
self-employed population, as it is under the Base Plan. Instead, self-employed individuals would be able to opt into the program. Since it is difficult to predict the percentage of self-employed individuals that would choose to participate in the program, we modeled different participation scenarios. To estimate possible adverse selection due to offering an opt-in structure, we assumed that the same benefits would be paid out to self-employed individuals as under the Base Plan, but we assumed the program would not collect revenue from 100% and then 50% of the self-employed population.
Figure 12
Michigan Department of Health and Human Services Population Exclusions and Inclusions Alternatives
Scenario 75-Year Payroll
Tax Rate Change from
Base Plan Base Plan 0.63% - Opt-Out for private insurance members 0.62% -0.01% Opt-In for self-employed population Alternative 1 – 100% of revenue carved out 0.68% 0.05%
Opt-In for self-employed population Alternative 2 – 50% of revenue carved out 0.65% 0.02%
BENEFIT PAYMENT REIMBURSEMENT PERIOD ALTERNATIVE This alternative examines the tax rate impact of providing a monthly benefit amount rather than a daily benefit amount. The only assumption change associated with this alternative is increasing home health benefit utilization from 70.5% to 80%. Individuals receiving home care services generally often do not receive services each day (we estimate five out of seven days, on average). Monthly reimbursement allows a beneficiary to spend more on a daily basis, since the benefit is capped each month, rather than each day. This is because individuals who receive home care services generally only do so on weekdays (Monday through Friday). When individuals receiving home care are reimbursed with a monthly benefit amount, they are able to spend more on a daily basis since they do not receive care on the weekends. An example of weekly versus daily reimbursement can be extrapolated to monthly reimbursement. For example, a beneficiary incurring costs of $200 per day, five days per week, would have 71% benefit utilization (5 days of $150 benefit payments, 2 days of $0 benefit payments). Weekly reimbursement would allow for $1,050 in benefit (7 days x $150 benefit) to apply to the $1,000 in weekly cost, resulting in 95% benefit utilization.
Figure 13 Michigan Department of Health and Human Services Benefit Payment Reimbursement Period Alternative
Scenario 75-Year Payroll Tax Rate Change from Base Plan Base Plan 0.63% - Monthly benefit 0.63% <0.01%

MILLIMAN REPORT
_______________________________________________________________________________________________________________________
State of Michigan Department of Health and Human Services Page 12 Long-Term Services and Supports Feasibility Study Report February 8, 2021
MILLIMAN REPORT
_______________________________________________________________________________________________________________________
State of Michigan Department of Health and Human Services Page 13 Long-Term Services and Supports Feasibility Study Report February 8, 2021
IV. RESULTS FOR PUBLIC-PRIVATE PARTNERSHIP MODEL Michigan House Bill 4674 mandated modeling a public-private reinsurance or risk-sharing model, with the purpose of providing a stable and ongoing source of reimbursement to insurers for a portion of their catastrophic long-term services and supports losses, in order to provide additional insurance capacity for the state. We focused on two reinsurance design structures for the Public-Private Partnership Model:
Reinsurance Structure 1 – Reinsurance pool pays LTSS benefits after a specified number of years for known claims. For example, for a plan that offers lifetime benefits, reinsurance would be responsible for all benefit payments after the first four years of a claim. Reinsurance Structure 2 – Reinsurance program covers risk of total claims exceeding expectations, which could be the result of claim frequency or claim severity exceeding expectations. Under this structure, the reinsurance pool pays for the present value of lifetime LTSS benefits per cohort grouping above a certain dollar amount.
We assumed the Public-Private Partnership Model would rely upon the existing structure of the private LTC insurance market with no subsidies from other funding sources. Funds to set up and administer the reinsurance pool are assumed to be collected through a premium surcharge on policies from participating insurers. The private insurance market offers individuals a wide variety of benefit options including:
Benefit period options (three years is the most common – coverage is typically structured as a “pool of money” derived from the benefit period duration times the daily benefit amount).
Elimination period options (90 days is the most common – this is the period of time during which the
policyholder has a qualifying degree of disability but policy benefits are not paid).
Inflation options (3% compound inflation is the most common – this inflates both the “pool of money”
and any daily or monthly benefit limit).
Various levels of underwriting.
Premium discounts including marital, preferred, and worksite.
Coordination with governmental programs including Medicaid and Medicare.
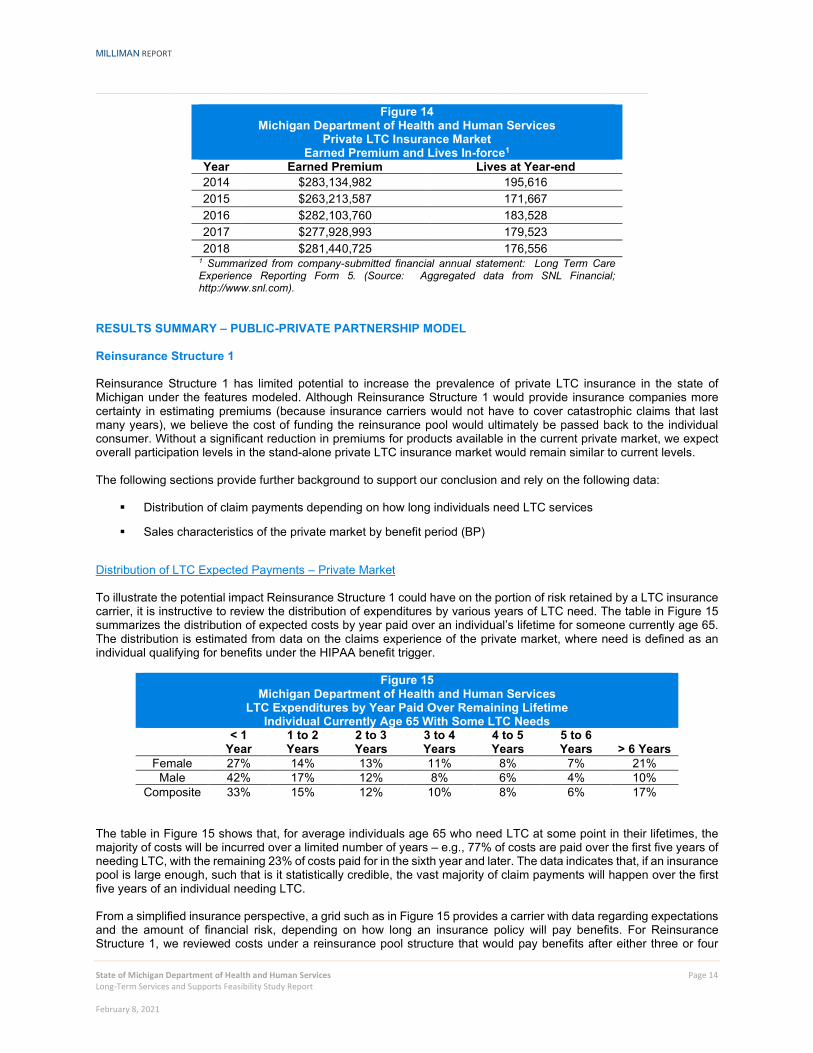
These benefit options allow individuals to choose their desired levels of coverage. In most cases, coverage is richer than the specifications laid out for the public program outlined in Section II of this report. However, underwriting is used in the private market to align premiums with the underlying health risk of policyholders; therefore, individuals who apply for a LTC policy are not guaranteed to be accepted for coverage. The cost of private insurance has continued to increase over the past decade. Many private market insurance companies have filed for rate increases on groups or “classes” of policyholders because actual experience has been worse than anticipated compared with original pricing assumptions. Because of this, LTC policy sales have decreased over time with the increased expense to policyholders. Many LTC insurance carriers have exited the market, concerned about the level of risk for the return available. Michigan’s private LTC insurance market penetration is relatively low compared to other states in the U.S., with only about 3.5% of the adult population age 40 and older holding private LTC insurance as of 2018 (nationwide market penetration between 4% and 5%). The table in Figure 14 provides a snapshot of the size of the private LTC market in Michigan for stand-alone policies.
MILLIMAN REPORT
_______________________________________________________________________________________________________________________
State of Michigan Department of Health and Human Services Page 14 Long-Term Services and Supports Feasibility Study Report February 8, 2021
Figure 14 Michigan Department of Health and Human Services
Private LTC Insurance Market Earned Premium and Lives In-force1
Year Earned Premium Lives at Year-end 2014 $283,134,982 195,616 2015 $263,213,587 171,667 2016 $282,103,760 183,528 2017 $277,928,993 179,523 2018 $281,440,725 176,556
1 Summarized from company-submitted financial annual statement: Long Term Care Experience Reporting Form 5. (Source: Aggregated data from SNL Financial; http://www.snl.com).
RESULTS SUMMARY – PUBLIC-PRIVATE PARTNERSHIP MODEL Reinsurance Structure 1 Reinsurance Structure 1 has limited potential to increase the prevalence of private LTC insurance in the state of Michigan under the features modeled. Although Reinsurance Structure 1 would provide insurance companies more certainty in estimating premiums (because insurance carriers would not have to cover catastrophic claims that last many years), we believe the cost of funding the reinsurance pool would ultimately be passed back to the individual consumer. Without a significant reduction in premiums for products available in the current private market, we expect overall participation levels in the stand-alone private LTC insurance market would remain similar to current levels. The following sections provide further background to support our conclusion and rely on the following data:
Distribution of claim payments depending on how long individuals need LTC services
Sales characteristics of the private market by benefit period (BP)
Distribution of LTC Expected Payments – Private Market To illustrate the potential impact Reinsurance Structure 1 could have on the portion of risk retained by a LTC insurance carrier, it is instructive to review the distribution of expenditures by various years of LTC need. The table in Figure 15 summarizes the distribution of expected costs by year paid over an individual’s lifetime for someone currently age 65. The distribution is estimated from data on the claims experience of the private market, where need is defined as an individual qualifying for benefits under the HIPAA benefit trigger.
Figure 15 Michigan Department of Health and Human Services
LTC Expenditures by Year Paid Over Remaining Lifetime Individual Currently Age 65 With Some LTC Needs
< 1
Year 1 to 2 Years
2 to 3 Years
3 to 4 Years
4 to 5 Years
5 to 6 Years > 6 Years
Female 27% 14% 13% 11% 8% 7% 21% Male 42% 17% 12% 8% 6% 4% 10%
Composite 33% 15% 12% 10% 8% 6% 17% The table in Figure 15 shows that, for average individuals age 65 who need LTC at some point in their lifetimes, the majority of costs will be incurred over a limited number of years – e.g., 77% of costs are paid over the first five years of needing LTC, with the remaining 23% of costs paid for in the sixth year and later. The data indicates that, if an insurance pool is large enough, such that is it statistically credible, the vast majority of claim payments will happen over the first five years of an individual needing LTC. From a simplified insurance perspective, a grid such as in Figure 15 provides a carrier with data regarding expectations and the amount of financial risk, depending on how long an insurance policy will pay benefits. For Reinsurance Structure 1, we reviewed costs under a reinsurance pool structure that would pay benefits after either three or four
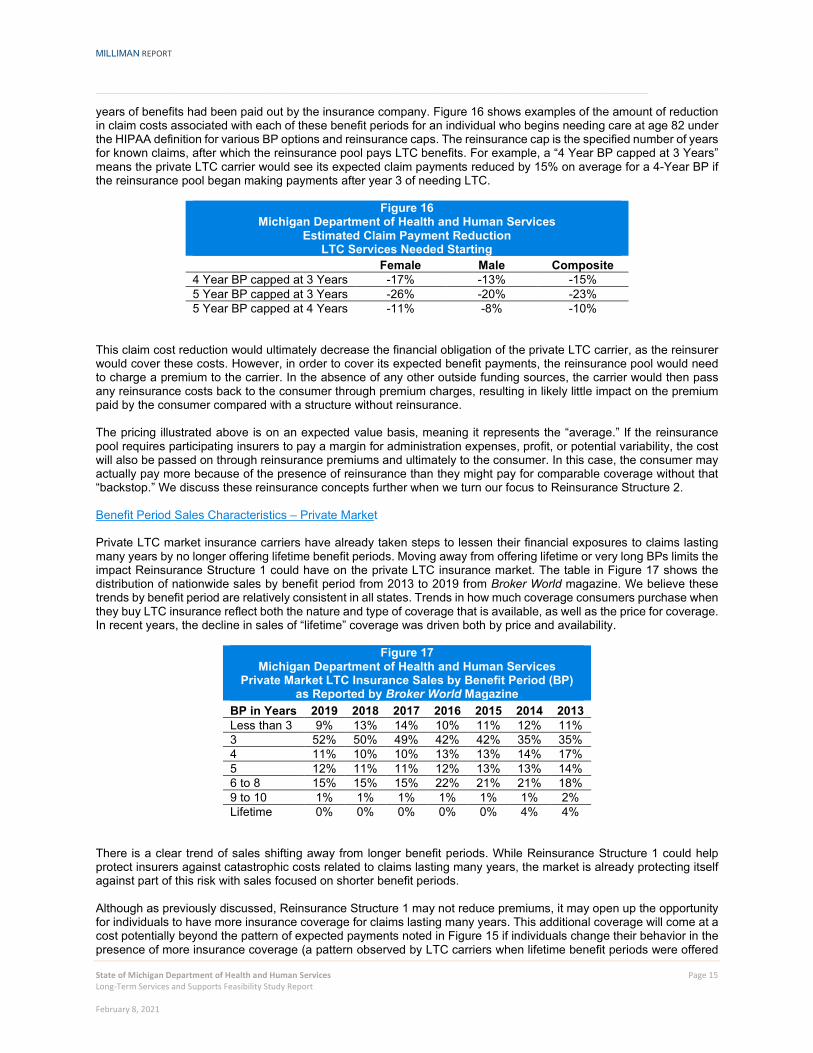
MILLIMAN REPORT
_______________________________________________________________________________________________________________________
State of Michigan Department of Health and Human Services Page 15 Long-Term Services and Supports Feasibility Study Report February 8, 2021
years of benefits had been paid out by the insurance company. Figure 16 shows examples of the amount of reduction in claim costs associated with each of these benefit periods for an individual who begins needing care at age 82 under the HIPAA definition for various BP options and reinsurance caps. The reinsurance cap is the specified number of years for known claims, after which the reinsurance pool pays LTC benefits. For example, a “4 Year BP capped at 3 Years” means the private LTC carrier would see its expected claim payments reduced by 15% on average for a 4-Year BP if the reinsurance pool began making payments after year 3 of needing LTC.
Figure 16 Michigan Department of Health and Human Services
Estimated Claim Payment Reduction LTC Services Needed Starting
Female Male Composite 4 Year BP capped at 3 Years -17% -13% -15% 5 Year BP capped at 3 Years -26% -20% -23% 5 Year BP capped at 4 Years -11% -8% -10%
This claim cost reduction would ultimately decrease the financial obligation of the private LTC carrier, as the reinsurer would cover these costs. However, in order to cover its expected benefit payments, the reinsurance pool would need to charge a premium to the carrier. In the absence of any other outside funding sources, the carrier would then pass any reinsurance costs back to the consumer through premium charges, resulting in likely little impact on the premium paid by the consumer compared with a structure without reinsurance. The pricing illustrated above is on an expected value basis, meaning it represents the “average.” If the reinsurance pool requires participating insurers to pay a margin for administration expenses, profit, or potential variability, the cost will also be passed on through reinsurance premiums and ultimately to the consumer. In this case, the consumer may actually pay more because of the presence of reinsurance than they might pay for comparable coverage without that “backstop.” We discuss these reinsurance concepts further when we turn our focus to Reinsurance Structure 2. Benefit Period Sales Characteristics – Private Market Private LTC market insurance carriers have already taken steps to lessen their financial exposures to claims lasting many years by no longer offering lifetime benefit periods. Moving away from offering lifetime or very long BPs limits the impact Reinsurance Structure 1 could have on the private LTC insurance market. The table in Figure 17 shows the distribution of nationwide sales by benefit period from 2013 to 2019 from Broker World magazine. We believe these trends by benefit period are relatively consistent in all states. Trends in how much coverage consumers purchase when they buy LTC insurance reflect both the nature and type of coverage that is available, as well as the price for coverage. In recent years, the decline in sales of “lifetime” coverage was driven both by price and availability.
Figure 17 Michigan Department of Health and Human Services
Private Market LTC Insurance Sales by Benefit Period (BP) as Reported by Broker World Magazine
BP in Years 2019 2018 2017 2016 2015 2014 2013 Less than 3 9% 13% 14% 10% 11% 12% 11% 3 52% 50% 49% 42% 42% 35% 35% 4 11% 10% 10% 13% 13% 14% 17% 5 12% 11% 11% 12% 13% 13% 14% 6 to 8 15% 15% 15% 22% 21% 21% 18% 9 to 10 1% 1% 1% 1% 1% 1% 2% Lifetime 0% 0% 0% 0% 0% 4% 4%
There is a clear trend of sales shifting away from longer benefit periods. While Reinsurance Structure 1 could help protect insurers against catastrophic costs related to claims lasting many years, the market is already protecting itself against part of this risk with sales focused on shorter benefit periods. Although as previously discussed, Reinsurance Structure 1 may not reduce premiums, it may open up the opportunity for individuals to have more insurance coverage for claims lasting many years. This additional coverage will come at a cost potentially beyond the pattern of expected payments noted in Figure 15 if individuals change their behavior in the presence of more insurance coverage (a pattern observed by LTC carriers when lifetime benefit periods were offered
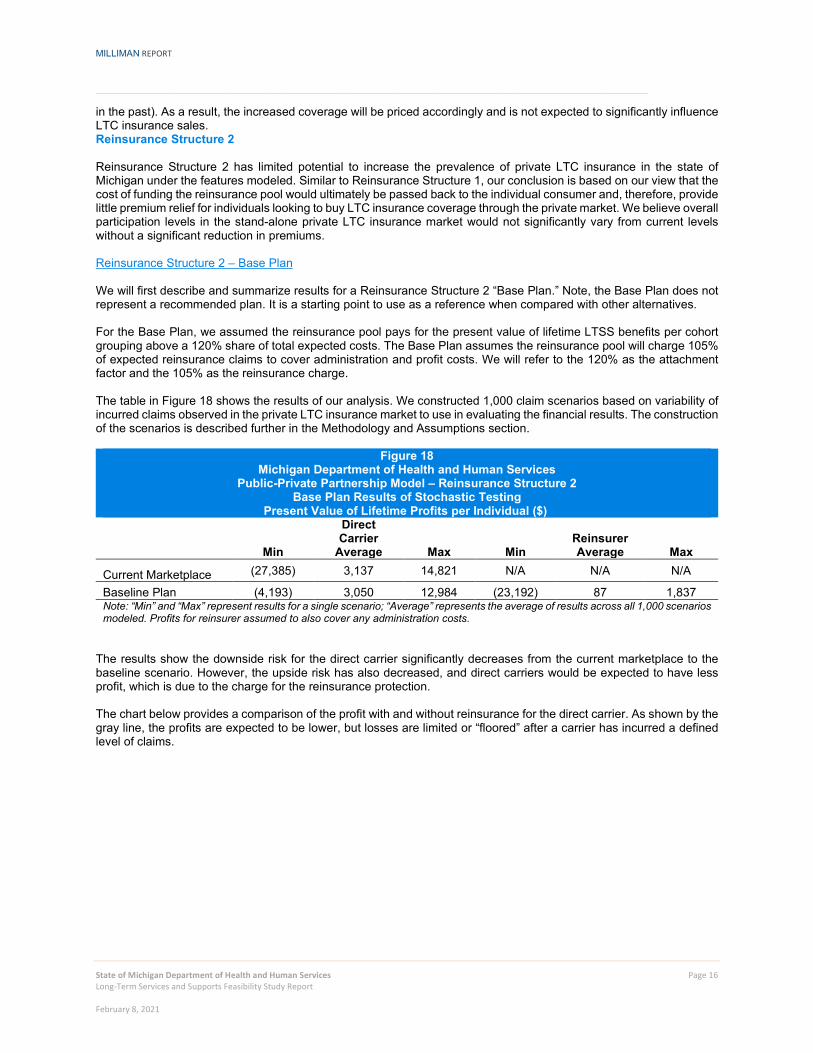
MILLIMAN REPORT
_______________________________________________________________________________________________________________________
State of Michigan Department of Health and Human Services Page 16 Long-Term Services and Supports Feasibility Study Report February 8, 2021
in the past). As a result, the increased coverage will be priced accordingly and is not expected to significantly influence LTC insurance sales. Reinsurance Structure 2 Reinsurance Structure 2 has limited potential to increase the prevalence of private LTC insurance in the state of Michigan under the features modeled. Similar to Reinsurance Structure 1, our conclusion is based on our view that the cost of funding the reinsurance pool would ultimately be passed back to the individual consumer and, therefore, provide little premium relief for individuals looking to buy LTC insurance coverage through the private market. We believe overall participation levels in the stand-alone private LTC insurance market would not significantly vary from current levels without a significant reduction in premiums. Reinsurance Structure 2 – Base Plan We will first describe and summarize results for a Reinsurance Structure 2 “Base Plan.” Note, the Base Plan does not represent a recommended plan. It is a starting point to use as a reference when compared with other alternatives. For the Base Plan, we assumed the reinsurance pool pays for the present value of lifetime LTSS benefits per cohort grouping above a 120% share of total expected costs. The Base Plan assumes the reinsurance pool will charge 105% of expected reinsurance claims to cover administration and profit costs. We will refer to the 120% as the attachment factor and the 105% as the reinsurance charge. The table in Figure 18 shows the results of our analysis. We constructed 1,000 claim scenarios based on variability of incurred claims observed in the private LTC insurance market to use in evaluating the financial results. The construction of the scenarios is described further in the Methodology and Assumptions section.
Figure 18 Michigan Department of Health and Human Services
Public-Private Partnership Model – Reinsurance Structure 2 Base Plan Results of Stochastic Testing
Present Value of Lifetime Profits per Individual ($)
Min
Direct Carrier
Average Max Min Reinsurer Average Max
Current Marketplace (27,385) 3,137 14,821 N/A N/A N/A
Baseline Plan (4,193) 3,050 12,984 (23,192) 87 1,837 Note: “Min” and “Max” represent results for a single scenario; “Average” represents the average of results across all 1,000 scenarios modeled. Profits for reinsurer assumed to also cover any administration costs.
The results show the downside risk for the direct carrier significantly decreases from the current marketplace to the baseline scenario. However, the upside risk has also decreased, and direct carriers would be expected to have less profit, which is due to the charge for the reinsurance protection. The chart below provides a comparison of the profit with and without reinsurance for the direct carrier. As shown by the gray line, the profits are expected to be lower, but losses are limited or “floored” after a carrier has incurred a defined level of claims.
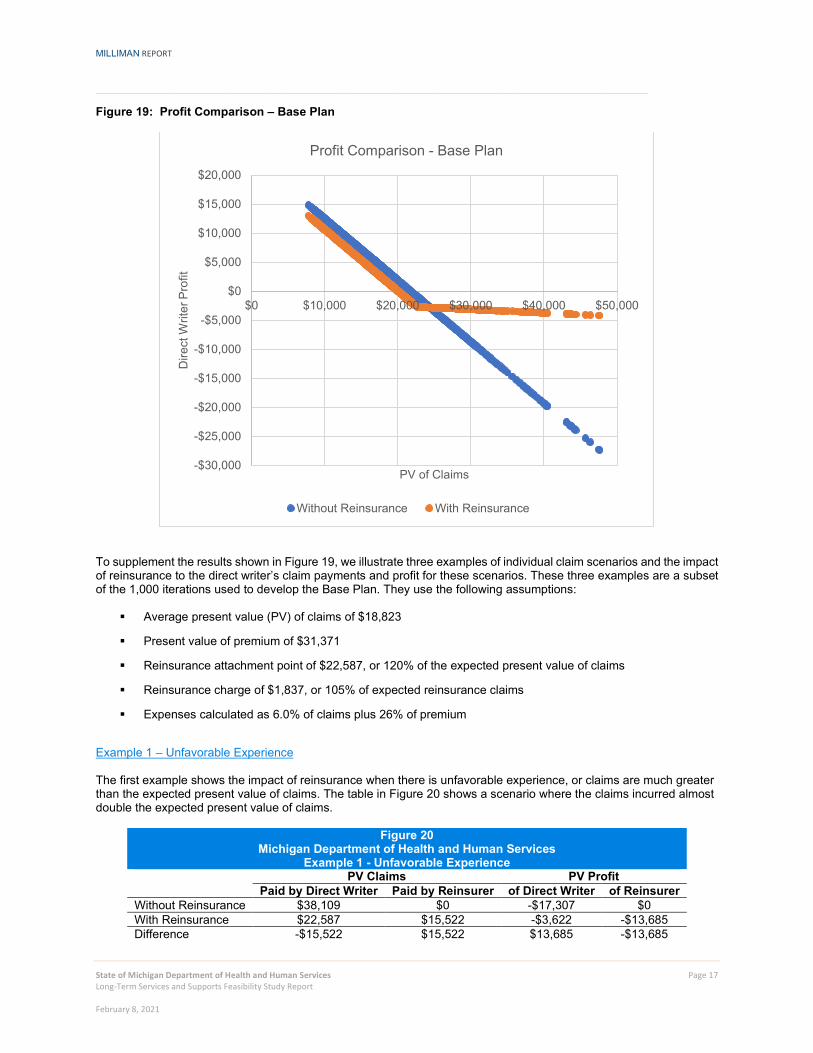
MILLIMAN REPORT
_______________________________________________________________________________________________________________________
State of Michigan Department of Health and Human Services Page 17 Long-Term Services and Supports Feasibility Study Report February 8, 2021
Figure 19: Profit Comparison – Base Plan
To supplement the results shown in Figure 19, we illustrate three examples of individual claim scenarios and the impact of reinsurance to the direct writer’s claim payments and profit for these scenarios. These three examples are a subset of the 1,000 iterations used to develop the Base Plan. They use the following assumptions:
Average present value (PV) of claims of $18,823
Present value of premium of $31,371
Reinsurance attachment point of $22,587, or 120% of the expected present value of claims
Reinsurance charge of $1,837, or 105% of expected reinsurance claims
Expenses calculated as 6.0% of claims plus 26% of premium
Example 1 – Unfavorable Experience The first example shows the impact of reinsurance when there is unfavorable experience, or claims are much greater than the expected present value of claims. The table in Figure 20 shows a scenario where the claims incurred almost double the expected present value of claims.
Figure 20 Michigan Department of Health and Human Services
Example 1 - Unfavorable Experience PV Claims PV Profit
Paid by Direct Writer Paid by Reinsurer of Direct Writer of Reinsurer Without Reinsurance $38,109 $0 -$17,307 $0 With Reinsurance $22,587 $15,522 -$3,622 -$13,685 Difference -$15,522 $15,522 $13,685 -$13,685
-$30,000
-$25,000
-$20,000
-$15,000
-$10,000
-$5,000
$0
$5,000
$10,000
$15,000
$20,000
$0 $10,000 $20,000 $30,000 $40,000 $50,000
Dire
ct W
riter
Pro
fit
PV of Claims
Profit Comparison - Base Plan
Without Reinsurance With Reinsurance

MILLIMAN REPORT
_______________________________________________________________________________________________________________________
State of Michigan Department of Health and Human Services Page 18 Long-Term Services and Supports Feasibility Study Report February 8, 2021
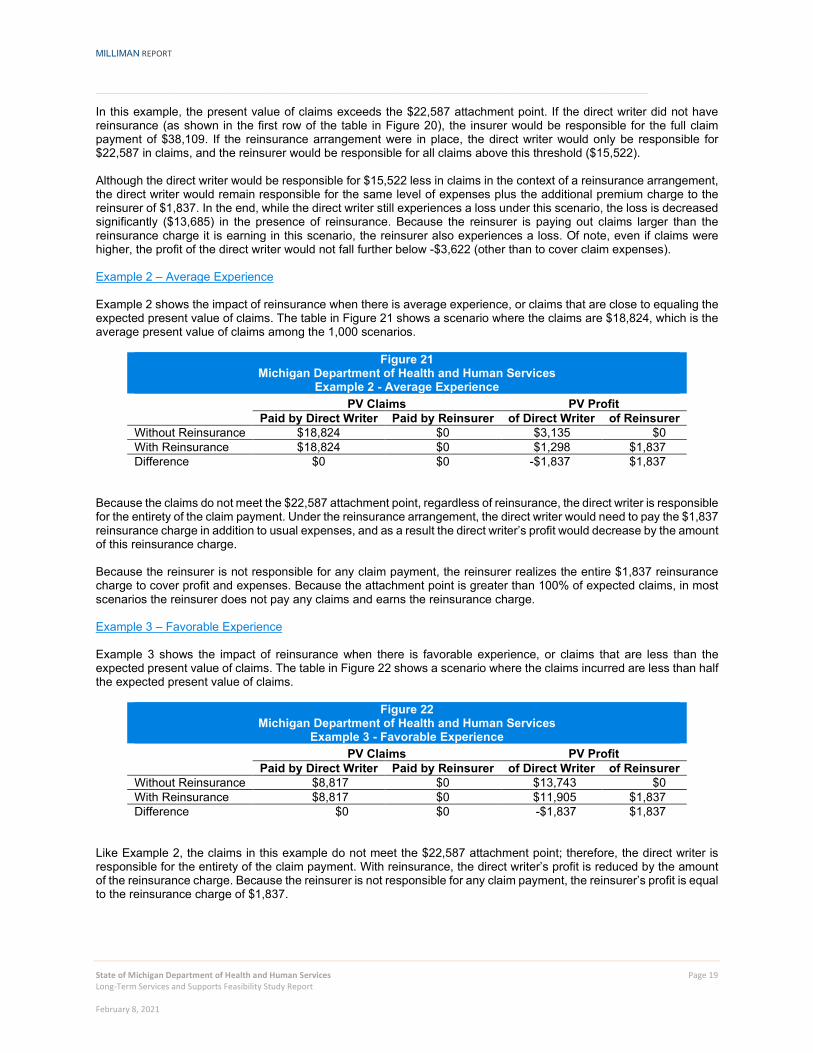
MILLIMAN REPORT
_______________________________________________________________________________________________________________________
State of Michigan Department of Health and Human Services Page 19 Long-Term Services and Supports Feasibility Study Report February 8, 2021
In this example, the present value of claims exceeds the $22,587 attachment point. If the direct writer did not have reinsurance (as shown in the first row of the table in Figure 20), the insurer would be responsible for the full claim payment of $38,109. If the reinsurance arrangement were in place, the direct writer would only be responsible for $22,587 in claims, and the reinsurer would be responsible for all claims above this threshold ($15,522). Although the direct writer would be responsible for $15,522 less in claims in the context of a reinsurance arrangement, the direct writer would remain responsible for the same level of expenses plus the additional premium charge to the reinsurer of $1,837. In the end, while the direct writer still experiences a loss under this scenario, the loss is decreased significantly ($13,685) in the presence of reinsurance. Because the reinsurer is paying out claims larger than the reinsurance charge it is earning in this scenario, the reinsurer also experiences a loss. Of note, even if claims were higher, the profit of the direct writer would not fall further below -$3,622 (other than to cover claim expenses). Example 2 – Average Experience Example 2 shows the impact of reinsurance when there is average experience, or claims that are close to equaling the expected present value of claims. The table in Figure 21 shows a scenario where the claims are $18,824, which is the average present value of claims among the 1,000 scenarios.
Figure 21 Michigan Department of Health and Human Services
Example 2 - Average Experience PV Claims PV Profit
Paid by Direct Writer Paid by Reinsurer of Direct Writer of Reinsurer Without Reinsurance $18,824 $0 $3,135 $0 With Reinsurance $18,824 $0 $1,298 $1,837 Difference $0 $0 -$1,837 $1,837
Because the claims do not meet the $22,587 attachment point, regardless of reinsurance, the direct writer is responsible for the entirety of the claim payment. Under the reinsurance arrangement, the direct writer would need to pay the $1,837 reinsurance charge in addition to usual expenses, and as a result the direct writer’s profit would decrease by the amount of this reinsurance charge. Because the reinsurer is not responsible for any claim payment, the reinsurer realizes the entire $1,837 reinsurance charge to cover profit and expenses. Because the attachment point is greater than 100% of expected claims, in most scenarios the reinsurer does not pay any claims and earns the reinsurance charge. Example 3 – Favorable Experience Example 3 shows the impact of reinsurance when there is favorable experience, or claims that are less than the expected present value of claims. The table in Figure 22 shows a scenario where the claims incurred are less than half the expected present value of claims.
Figure 22 Michigan Department of Health and Human Services
Example 3 - Favorable Experience PV Claims PV Profit
Paid by Direct Writer Paid by Reinsurer of Direct Writer of Reinsurer Without Reinsurance $8,817 $0 $13,743 $0 With Reinsurance $8,817 $0 $11,905 $1,837 Difference $0 $0 -$1,837 $1,837
Like Example 2, the claims in this example do not meet the $22,587 attachment point; therefore, the direct writer is responsible for the entirety of the claim payment. With reinsurance, the direct writer’s profit is reduced by the amount of the reinsurance charge. Because the reinsurer is not responsible for any claim payment, the reinsurer’s profit is equal to the reinsurance charge of $1,837.
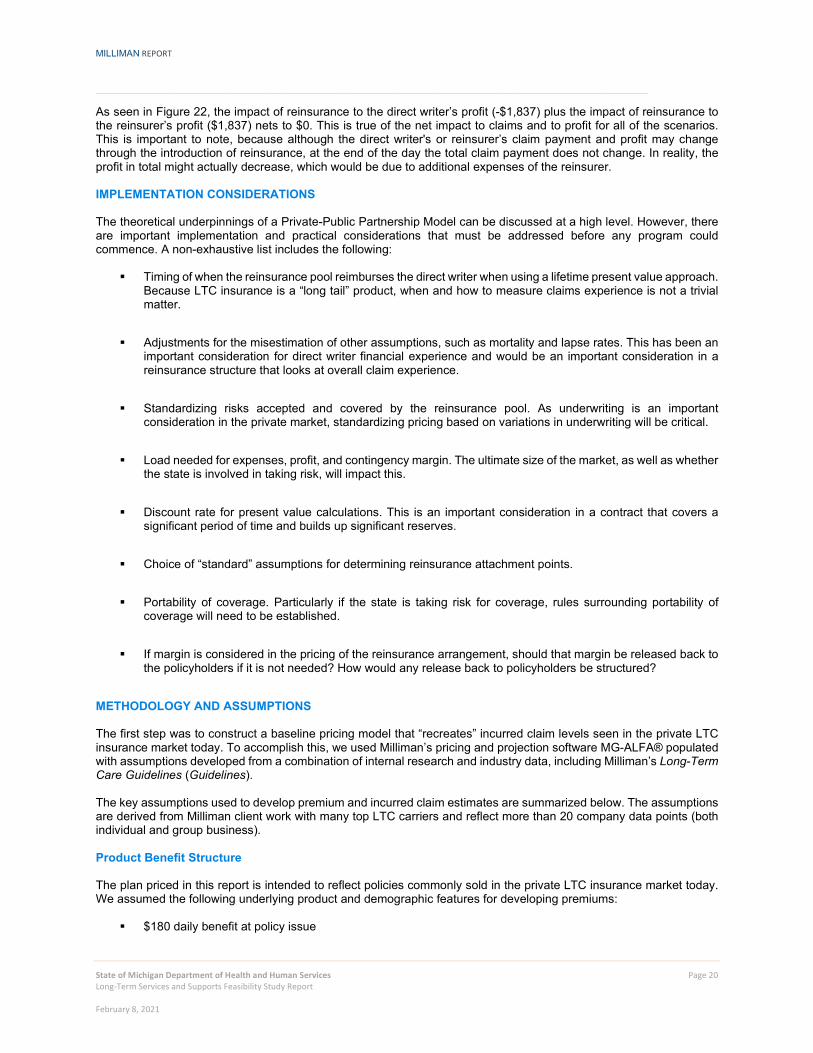
MILLIMAN REPORT
_______________________________________________________________________________________________________________________
State of Michigan Department of Health and Human Services Page 20 Long-Term Services and Supports Feasibility Study Report February 8, 2021
As seen in Figure 22, the impact of reinsurance to the direct writer’s profit (-$1,837) plus the impact of reinsurance to the reinsurer’s profit ($1,837) nets to $0. This is true of the net impact to claims and to profit for all of the scenarios. This is important to note, because although the direct writer's or reinsurer’s claim payment and profit may change through the introduction of reinsurance, at the end of the day the total claim payment does not change. In reality, the profit in total might actually decrease, which would be due to additional expenses of the reinsurer. IMPLEMENTATION CONSIDERATIONS The theoretical underpinnings of a Private-Public Partnership Model can be discussed at a high level. However, there are important implementation and practical considerations that must be addressed before any program could commence. A non-exhaustive list includes the following:
Timing of when the reinsurance pool reimburses the direct writer when using a lifetime present value approach. Because LTC insurance is a “long tail” product, when and how to measure claims experience is not a trivial matter.
Adjustments for the misestimation of other assumptions, such as mortality and lapse rates. This has been an
important consideration for direct writer financial experience and would be an important consideration in a reinsurance structure that looks at overall claim experience.
Standardizing risks accepted and covered by the reinsurance pool. As underwriting is an important
consideration in the private market, standardizing pricing based on variations in underwriting will be critical.
Load needed for expenses, profit, and contingency margin. The ultimate size of the market, as well as whether
the state is involved in taking risk, will impact this.
Discount rate for present value calculations. This is an important consideration in a contract that covers a
significant period of time and builds up significant reserves.
Choice of “standard” assumptions for determining reinsurance attachment points.
Portability of coverage. Particularly if the state is taking risk for coverage, rules surrounding portability of
coverage will need to be established.
If margin is considered in the pricing of the reinsurance arrangement, should that margin be released back to
the policyholders if it is not needed? How would any release back to policyholders be structured?
METHODOLOGY AND ASSUMPTIONS The first step was to construct a baseline pricing model that “recreates” incurred claim levels seen in the private LTC insurance market today. To accomplish this, we used Milliman’s pricing and projection software MG-ALFA® populated with assumptions developed from a combination of internal research and industry data, including Milliman’s Long-Term Care Guidelines (Guidelines). The key assumptions used to develop premium and incurred claim estimates are summarized below. The assumptions are derived from Milliman client work with many top LTC carriers and reflect more than 20 company data points (both individual and group business). Product Benefit Structure The plan priced in this report is intended to reflect policies commonly sold in the private LTC insurance market today. We assumed the following underlying product and demographic features for developing premiums:
$180 daily benefit at policy issue
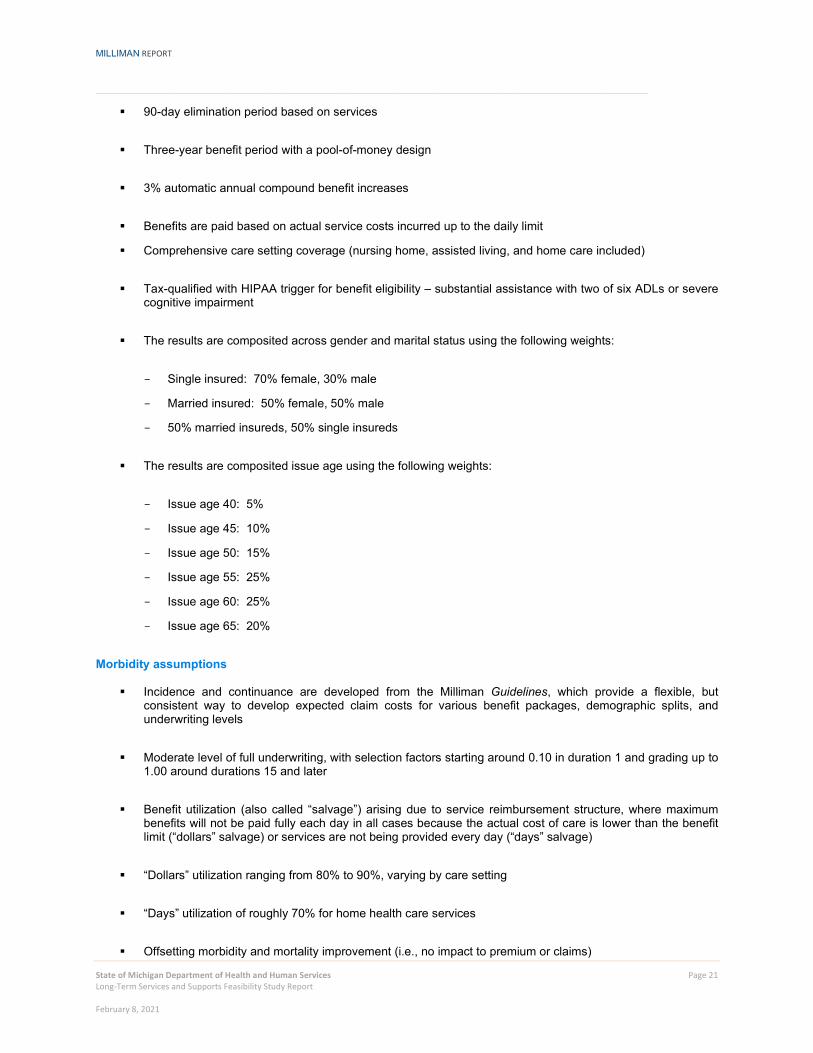
MILLIMAN REPORT
_______________________________________________________________________________________________________________________
State of Michigan Department of Health and Human Services Page 21 Long-Term Services and Supports Feasibility Study Report February 8, 2021
90-day elimination period based on services
Three-year benefit period with a pool-of-money design
3% automatic annual compound benefit increases
Benefits are paid based on actual service costs incurred up to the daily limit
Comprehensive care setting coverage (nursing home, assisted living, and home care included)
Tax-qualified with HIPAA trigger for benefit eligibility – substantial assistance with two of six ADLs or severe
cognitive impairment
The results are composited across gender and marital status using the following weights:
Single insured: 70% female, 30% male
Married insured: 50% female, 50% male
50% married insureds, 50% single insureds
The results are composited issue age using the following weights:
Issue age 40: 5%
Issue age 45: 10%
Issue age 50: 15%
Issue age 55: 25%
Issue age 60: 25%
Issue age 65: 20%
Morbidity assumptions
Incidence and continuance are developed from the Milliman Guidelines, which provide a flexible, but consistent way to develop expected claim costs for various benefit packages, demographic splits, and underwriting levels
Moderate level of full underwriting, with selection factors starting around 0.10 in duration 1 and grading up to
1.00 around durations 15 and later
Benefit utilization (also called “salvage”) arising due to service reimbursement structure, where maximum
benefits will not be paid fully each day in all cases because the actual cost of care is lower than the benefit limit (“dollars” salvage) or services are not being provided every day (“days” salvage)
“Dollars” utilization ranging from 80% to 90%, varying by care setting
“Days” utilization of roughly 70% for home health care services
Offsetting morbidity and mortality improvement (i.e., no impact to premium or claims)
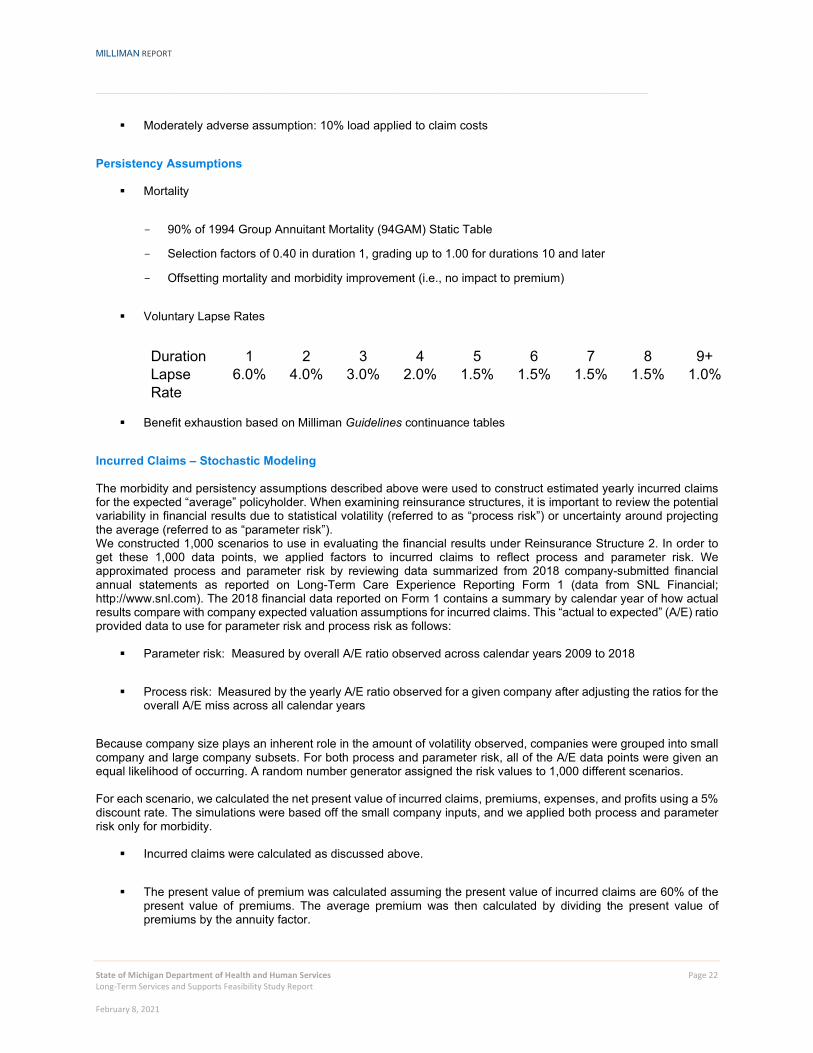
MILLIMAN REPORT
_______________________________________________________________________________________________________________________
State of Michigan Department of Health and Human Services Page 22 Long-Term Services and Supports Feasibility Study Report February 8, 2021
Moderately adverse assumption: 10% load applied to claim costs
Persistency Assumptions
Mortality
90% of 1994 Group Annuitant Mortality (94GAM) Static Table
Selection factors of 0.40 in duration 1, grading up to 1.00 for durations 10 and later
Offsetting mortality and morbidity improvement (i.e., no impact to premium)
Voluntary Lapse Rates
Duration 1 2 3 4 5 6 7 8 9+ Lapse Rate
6.0% 4.0% 3.0% 2.0% 1.5% 1.5% 1.5% 1.5% 1.0%
Benefit exhaustion based on Milliman Guidelines continuance tables
Incurred Claims – Stochastic Modeling The morbidity and persistency assumptions described above were used to construct estimated yearly incurred claims for the expected “average” policyholder. When examining reinsurance structures, it is important to review the potential variability in financial results due to statistical volatility (referred to as “process risk”) or uncertainty around projecting the average (referred to as “parameter risk”). We constructed 1,000 scenarios to use in evaluating the financial results under Reinsurance Structure 2. In order to get these 1,000 data points, we applied factors to incurred claims to reflect process and parameter risk. We approximated process and parameter risk by reviewing data summarized from 2018 company-submitted financial annual statements as reported on Long-Term Care Experience Reporting Form 1 (data from SNL Financial; http://www.snl.com). The 2018 financial data reported on Form 1 contains a summary by calendar year of how actual results compare with company expected valuation assumptions for incurred claims. This “actual to expected” (A/E) ratio provided data to use for parameter risk and process risk as follows:
Parameter risk: Measured by overall A/E ratio observed across calendar years 2009 to 2018
Process risk: Measured by the yearly A/E ratio observed for a given company after adjusting the ratios for the
overall A/E miss across all calendar years
Because company size plays an inherent role in the amount of volatility observed, companies were grouped into small company and large company subsets. For both process and parameter risk, all of the A/E data points were given an equal likelihood of occurring. A random number generator assigned the risk values to 1,000 different scenarios. For each scenario, we calculated the net present value of incurred claims, premiums, expenses, and profits using a 5% discount rate. The simulations were based off the small company inputs, and we applied both process and parameter risk only for morbidity.
Incurred claims were calculated as discussed above.
The present value of premium was calculated assuming the present value of incurred claims are 60% of the
present value of premiums. The average premium was then calculated by dividing the present value of premiums by the annuity factor.
MILLIMAN REPORT
_______________________________________________________________________________________________________________________
State of Michigan Department of Health and Human Services Page 23 Long-Term Services and Supports Feasibility Study Report February 8, 2021
Expenses were calculated as 6% of incurred claims plus 26.4% of premiums.
Profit was calculated before and after the reinsurance plan for both the direct carrier and the reinsurer.
Direct Carrier
• Before reinsurance: PV Premiums – PV Incurred Claims – PV Expenses
• After reinsurance: PV Premiums – minimum (PV Incurred Claims, Attachment Point) – PV Expenses – PV of Reinsurance Charge
o Attachment point is set at 120% of incurred claims (baseline)
o Reinsurance charge is set at 105% of expected reinsurance claims (baseline)
Reinsurer
• Reinsurance charge: Claims paid by reinsurer
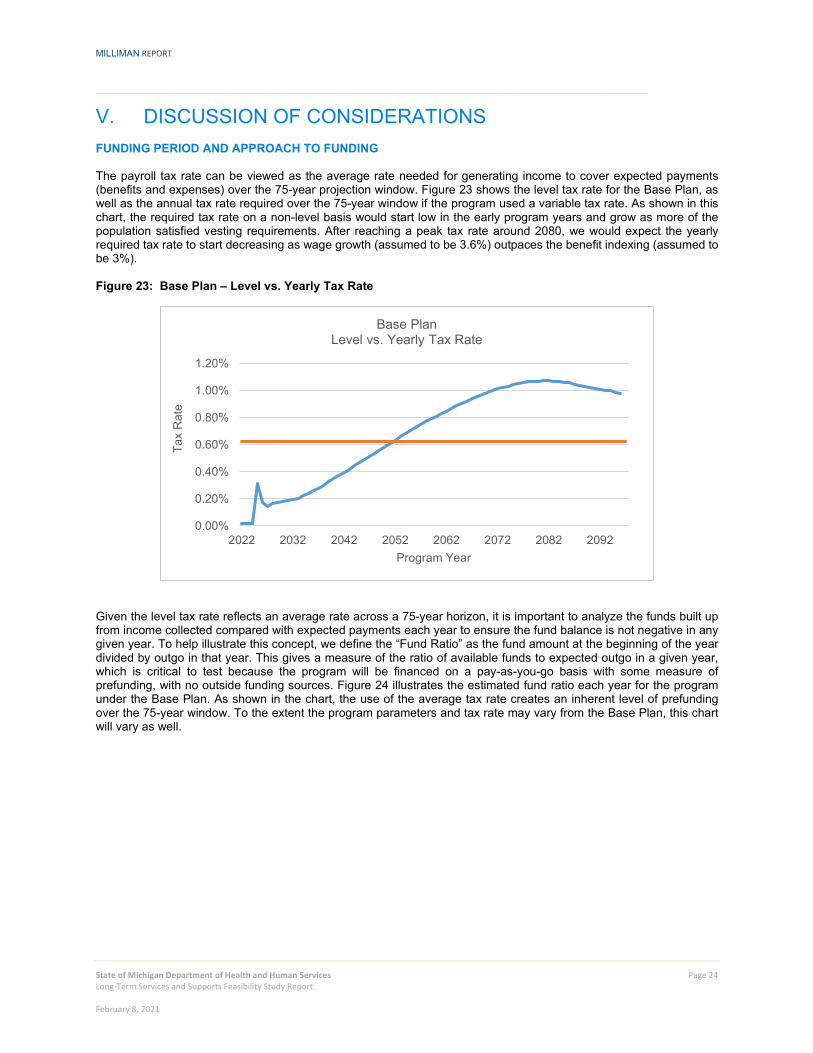
MILLIMAN REPORT
_______________________________________________________________________________________________________________________
State of Michigan Department of Health and Human Services Page 24 Long-Term Services and Supports Feasibility Study Report February 8, 2021
V. DISCUSSION OF CONSIDERATIONS FUNDING PERIOD AND APPROACH TO FUNDING The payroll tax rate can be viewed as the average rate needed for generating income to cover expected payments (benefits and expenses) over the 75-year projection window. Figure 23 shows the level tax rate for the Base Plan, as well as the annual tax rate required over the 75-year window if the program used a variable tax rate. As shown in this chart, the required tax rate on a non-level basis would start low in the early program years and grow as more of the population satisfied vesting requirements. After reaching a peak tax rate around 2080, we would expect the yearly required tax rate to start decreasing as wage growth (assumed to be 3.6%) outpaces the benefit indexing (assumed to be 3%). Figure 23: Base Plan – Level vs. Yearly Tax Rate
Given the level tax rate reflects an average rate across a 75-year horizon, it is important to analyze the funds built up from income collected compared with expected payments each year to ensure the fund balance is not negative in any given year. To help illustrate this concept, we define the “Fund Ratio” as the fund amount at the beginning of the year divided by outgo in that year. This gives a measure of the ratio of available funds to expected outgo in a given year, which is critical to test because the program will be financed on a pay-as-you-go basis with some measure of prefunding, with no outside funding sources. Figure 24 illustrates the estimated fund ratio each year for the program under the Base Plan. As shown in the chart, the use of the average tax rate creates an inherent level of prefunding over the 75-year window. To the extent the program parameters and tax rate may vary from the Base Plan, this chart will vary as well.
0.00%
0.20%
0.40%
0.60%
0.80%
1.00%
1.20%
2022 2032 2042 2052 2062 2072 2082 2092
Tax
Rat
e
Program Year
Base PlanLevel vs. Yearly Tax Rate
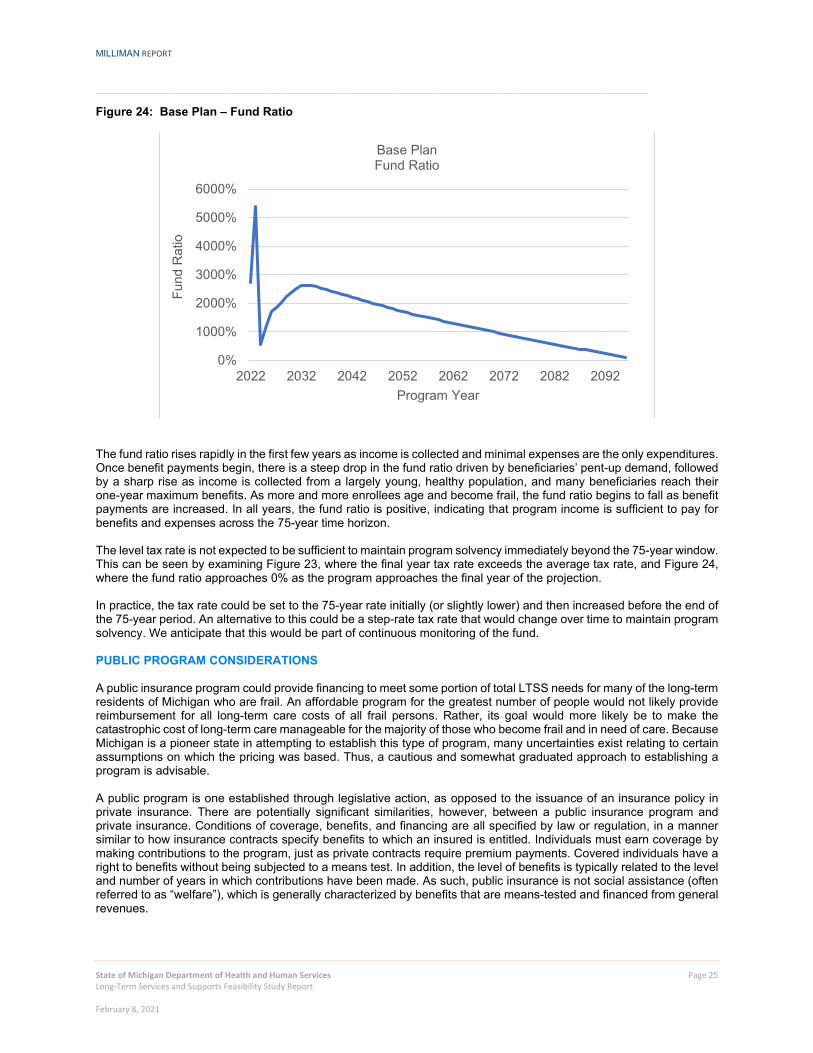
MILLIMAN REPORT
_______________________________________________________________________________________________________________________
State of Michigan Department of Health and Human Services Page 25 Long-Term Services and Supports Feasibility Study Report February 8, 2021
Figure 24: Base Plan – Fund Ratio
The fund ratio rises rapidly in the first few years as income is collected and minimal expenses are the only expenditures. Once benefit payments begin, there is a steep drop in the fund ratio driven by beneficiaries’ pent-up demand, followed by a sharp rise as income is collected from a largely young, healthy population, and many beneficiaries reach their one-year maximum benefits. As more and more enrollees age and become frail, the fund ratio begins to fall as benefit payments are increased. In all years, the fund ratio is positive, indicating that program income is sufficient to pay for benefits and expenses across the 75-year time horizon. The level tax rate is not expected to be sufficient to maintain program solvency immediately beyond the 75-year window. This can be seen by examining Figure 23, where the final year tax rate exceeds the average tax rate, and Figure 24, where the fund ratio approaches 0% as the program approaches the final year of the projection. In practice, the tax rate could be set to the 75-year rate initially (or slightly lower) and then increased before the end of the 75-year period. An alternative to this could be a step-rate tax rate that would change over time to maintain program solvency. We anticipate that this would be part of continuous monitoring of the fund.
PUBLIC PROGRAM CONSIDERATIONS A public insurance program could provide financing to meet some portion of total LTSS needs for many of the long-term residents of Michigan who are frail. An affordable program for the greatest number of people would not likely provide reimbursement for all long-term care costs of all frail persons. Rather, its goal would more likely be to make the catastrophic cost of long-term care manageable for the majority of those who become frail and in need of care. Because Michigan is a pioneer state in attempting to establish this type of program, many uncertainties exist relating to certain assumptions on which the pricing was based. Thus, a cautious and somewhat graduated approach to establishing a program is advisable. A public program is one established through legislative action, as opposed to the issuance of an insurance policy in private insurance. There are potentially significant similarities, however, between a public insurance program and private insurance. Conditions of coverage, benefits, and financing are all specified by law or regulation, in a manner similar to how insurance contracts specify benefits to which an insured is entitled. Individuals must earn coverage by making contributions to the program, just as private contracts require premium payments. Covered individuals have a right to benefits without being subjected to a means test. In addition, the level of benefits is typically related to the level and number of years in which contributions have been made. As such, public insurance is not social assistance (often referred to as “welfare”), which is generally characterized by benefits that are means-tested and financed from general revenues.
0%
1000%
2000%
3000%
4000%
5000%
6000%
2022 2032 2042 2052 2062 2072 2082 2092
Fund
Rat
io
Program Year
Base PlanFund Ratio
MILLIMAN REPORT
_______________________________________________________________________________________________________________________
State of Michigan Department of Health and Human Services Page 26 Long-Term Services and Supports Feasibility Study Report February 8, 2021
In some major ways, public insurance does differ from private insurance. Private insurance is voluntary and based on the principle of "individual equity" and risk classification, which are necessary to obtain participation. Individual equity means that each person is classified into groups of individuals with similar cost characteristics, such as age and health status, and a premium is charged so that each individual class finances its own expected benefits. The classification of individuals into groups is known as underwriting. In addition to risk classification groups, this process also allows for individuals to be placed in a group that is deemed to be uninsurable. In other words, those who already need LTC or are reasonably expected to need care in the near future cannot be offered insurance, or the insurance program will quickly fail. Mandatory public insurance can contain elements of "social adequacy." For example, individuals with high incomes can cross-subsidize those with low incomes in order to provide a minimum adequate benefit to all, including individuals whose contributions are small. Also, those who are of advanced age when the program begins can be subsidized by younger (less-risky) participants. Otherwise, benefits may be too low to meet program goals for many years. Cross-subsidies are possible through a universal public program if the program is mandatory or subsidized. A universal, or nearly universal, program can anticipate that its costs will be "average" (and not just a high cost subset of the population), and a mandatory program can assure that social goals can be pursued without jeopardizing the viability of the program (because low-cost individuals cannot drop out). Voluntary programs, including private insurance, must give primary attention to risk classification and individual equity. This means that premiums must reflect benefit levels, age, health status, and little else, which leads to underwriting. Thus, individuals who are young and healthy would have very low rates, while those who are old and / or unhealthy would not be able to purchase coverage. Another aspect of mandatory public insurance is that such programs can modify benefits by changing laws or regulations to keep benefits and costs in balance with public goals and intentions. Such changes are usually applied prospectively so that benefits already granted are not taken away. Private insurance is based on the premise of the contractual right to benefits that cannot be modified once the contract is made (although disputes do arise on contract meaning, which can result in court settlements where benefits are sometimes granted that were not intended). To be viable, private insurance must be "fully funded," i.e., have enough assets at any point in time to pay for future benefits earned from past contributions. Full funding protects the benefits of insured individuals in the event that a large proportion of participants stop paying premiums or the plan terminates. Full funding also requires that current plan participants pay for their own benefits, not relying on new members to keep the plan solvent. Because public insurance programs are assured of new entrants and that the government will not "go out of business,” they need not be fully funded, although overall benefit levels must be lower because of the inadequate funding for the initial beneficiaries. Considerations around funding and actuarial soundness will also vary depending on the public program entity (e.g., federal vs. state vs. local government). Testing for the actuarial soundness of the funding of public insurance programs is designed to assure that benefits can be paid on a timely basis. COVID-19 CONSIDERATIONS In preparing this study, we considered the potential impact of the emerging situation regarding the COVID-19 pandemic. Given the substantial uncertainty regarding the impact of COVID-19 on claims costs, including whether the pandemic will increase or decrease LTSS costs in the future, we have not made adjustments to the projections in our modeling of a Public Benefit or Public-Private Partnership Model. At the time of publishing this report, it is not possible to predict the outcomes, particularly over the 75-year projection period of this study; however, the COVID-19 pandemic could have a material impact on future costs. Section VII of this report includes sensitivities to pricing assumptions, including sensitivities to morbidity, mortality, and economic assumptions, all of which have been affected by COVID-19 in some capacity. Additional considerations related to pandemic risks and LTSS are discussed in the following Milliman article: https://us.milliman.com/en/insight/pandemic-risk-on-ltc-insurance-reserves.
MILLIMAN REPORT
_______________________________________________________________________________________________________________________
State of Michigan Department of Health and Human Services Page 27 Long-Term Services and Supports Feasibility Study Report February 8, 2021
VI. FISCAL IMPACT TO MICHIGAN MEDICAID PROGRAM Medicaid is the primary payer of LTSS in the United States. In 2017, approximately 52% of LTSS expenditures were paid for by Medicaid.4 Medicaid is jointly funded by states and the federal government, but LTSS may require individual out-of-pocket costs as well. We estimate that the Michigan Medicaid program, which provides LTSS services to qualifying Medicaid eligible individuals, spent approximately $4 billion on LTSS expenditures in 2018, including both institutional care and HCBS for the physically and developmentally disabled populations. Medicaid is generally the payer of last resort.5 This means private insurance, including LTC insurance or Medicare, must pay for medical and LTSS costs incurred by a Medicaid-eligible individual before Medicaid.6 If Michigan created a new public LTSS program, it may provide LTSS coverage before Medicaid would pay or concurrently with Medicaid, similar to other non-Medicaid payers. For example, the Medicaid program may pay concurrently with the new public LTSS program if the daily benefit amount from the new public LTSS program did not cover the total cost of the LTSS services and the individual was unable to cover the remaining cost out-of-pocket. Given Michigan’s Medicaid program is jointly funded by Michigan and the federal government, if Medicaid expenditures were reduced because of a new public LTSS program, federal financial participation would also be reduced. Therefore, as part of this LTSS feasibility study, we have analyzed how a new public LTSS program would interact with the Medicaid program. More specifically, our analysis models the percentage of total LTSS recipients projected to receive LTSS services under a new public program that would have ended up receiving the services from the Medicaid program, absent the new program. For each of these LTSS recipients, we have also projected the corresponding fiscal impact to the Medicaid program resulting from a new public LTSS program. For purposes of this analysis, we have focused on estimating the Medicaid fiscal impact of the Base Plan. ANALYSIS LIMITATIONS The Medicaid fiscal impacts developed in this analysis are based on our understanding of how Michigan’s Medicaid program will interplay with a new public LTSS program. We received historical data from DHHS underlying the fee-for-service (FFS) and managed care programs to support this analysis. However, data was not readily available to support all assumptions needed for this analysis. In those cases, we relied on other publicly available data, as well as our research and experience to develop assumptions for these projections. Additionally, changes to the state Medicaid reimbursement or eligibility, federal regulations or executive orders, as well as state insurance laws will impact the conclusions made in this report. Further consideration of the following issues, outside the scope of our analysis, should be made when evaluating the Medicaid impacts of a public LTSS program proposal:
We have not adjusted for any increased use of services due to awareness or use of services, as individuals with coverage may use services at a higher rate and then become eligible for Medicaid
We have not adjusted for any cost increases due to potential increased demand in the LTSS marketplace.
Demand may increase and put pressure on wages and other costs for personal care workers
We have not reflected any impact to nursing home provider taxes
We have not varied LTSS incidence rates for different federal poverty level (FPL) groupings (e.g., under 138%
FPL)
4 Musumeci, M., Chidambaram, P., & O’Malley Watts, M. (February 2020). Medicaid Home and Community-Based Services Enrollment and Spending. Kaiser Family Foundation Issue Brief. Retrieved February 12, 2020, from http://files.kff.org/attachment/Issue-Brief-Medicaid-Home-and-Community-Based-Services-Enrollment-and-Spending. 5 U.S. Department of Health and Human Services (June 1, 2018). Medicaid Provisions in Recently Passed Federal Budget Legislation Bipartisan Budget Act of 2018 – Third Party Liability in Medicaid and CHIP. Retrieved February 12, 2020, from https://www.medicaid.gov/sites/default/files/federal-policy-guidance/downloads/cib060118.pdf 6 Medicaid and CHIP Payment and Access Commission. Third party liability. Retrieved February 12, 2020, from https://www.macpac.gov/subtopic/third-party-liability/

MILLIMAN REPORT
_______________________________________________________________________________________________________________________
State of Michigan Department of Health and Human Services Page 28 Long-Term Services and Supports Feasibility Study Report February 8, 2021
To the extent that DHHS further considers the implementation of a public LTSS program following this feasibility study, these items should be studied in greater detail to understand how they would impact the analysis of a new public LTSS program.
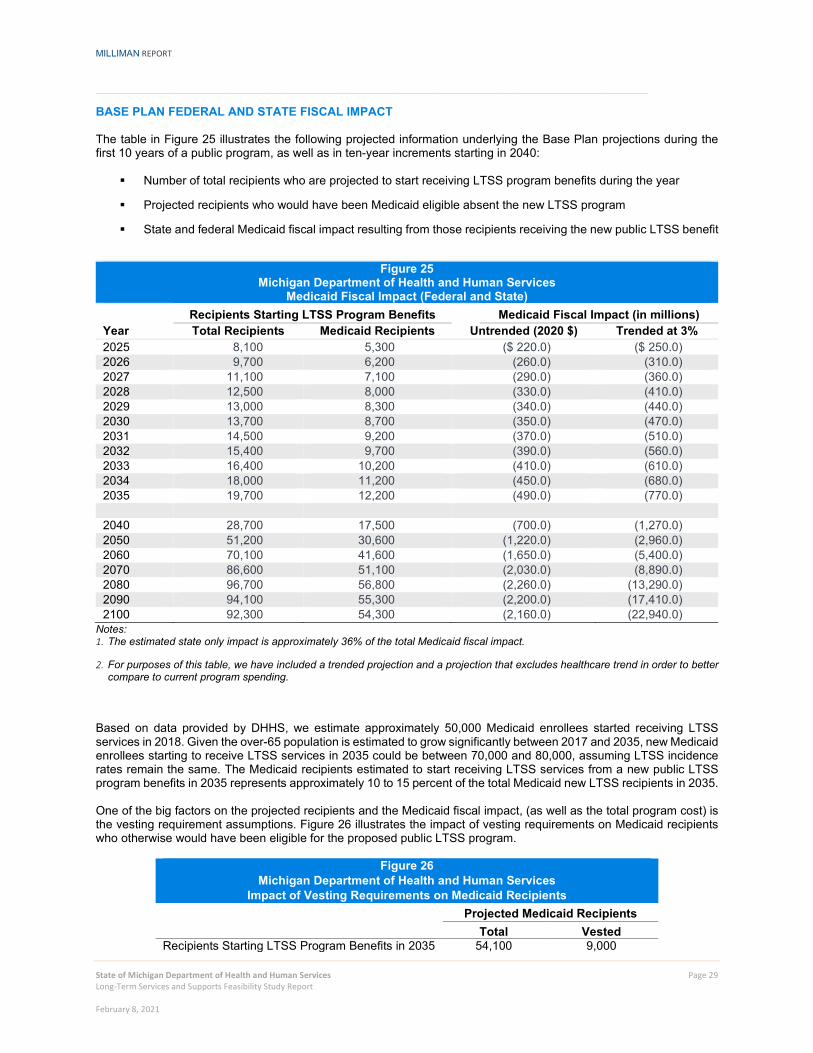
MILLIMAN REPORT
_______________________________________________________________________________________________________________________
State of Michigan Department of Health and Human Services Page 29 Long-Term Services and Supports Feasibility Study Report February 8, 2021
BASE PLAN FEDERAL AND STATE FISCAL IMPACT The table in Figure 25 illustrates the following projected information underlying the Base Plan projections during the first 10 years of a public program, as well as in ten-year increments starting in 2040:
Number of total recipients who are projected to start receiving LTSS program benefits during the year
Projected recipients who would have been Medicaid eligible absent the new LTSS program
State and federal Medicaid fiscal impact resulting from those recipients receiving the new public LTSS benefit
Figure 25
Michigan Department of Health and Human Services Medicaid Fiscal Impact (Federal and State)
Recipients Starting LTSS Program Benefits Medicaid Fiscal Impact (in millions) Year Total Recipients Medicaid Recipients Untrended (2020 $) Trended at 3% 2025 8,100 5,300 ($ 220.0) ($ 250.0) 2026 9,700 6,200 (260.0) (310.0) 2027 11,100 7,100 (290.0) (360.0) 2028 12,500 8,000 (330.0) (410.0) 2029 13,000 8,300 (340.0) (440.0) 2030 13,700 8,700 (350.0) (470.0) 2031 14,500 9,200 (370.0) (510.0) 2032 15,400 9,700 (390.0) (560.0) 2033 16,400 10,200 (410.0) (610.0) 2034 18,000 11,200 (450.0) (680.0) 2035 19,700 12,200 (490.0) (770.0) 2040 28,700 17,500 (700.0) (1,270.0) 2050 51,200 30,600 (1,220.0) (2,960.0) 2060 70,100 41,600 (1,650.0) (5,400.0) 2070 86,600 51,100 (2,030.0) (8,890.0) 2080 96,700 56,800 (2,260.0) (13,290.0) 2090 94,100 55,300 (2,200.0) (17,410.0) 2100 92,300 54,300 (2,160.0) (22,940.0)
Notes: 1. The estimated state only impact is approximately 36% of the total Medicaid fiscal impact.
2. For purposes of this table, we have included a trended projection and a projection that excludes healthcare trend in order to better compare to current program spending.
Based on data provided by DHHS, we estimate approximately 50,000 Medicaid enrollees started receiving LTSS services in 2018. Given the over-65 population is estimated to grow significantly between 2017 and 2035, new Medicaid enrollees starting to receive LTSS services in 2035 could be between 70,000 and 80,000, assuming LTSS incidence rates remain the same. The Medicaid recipients estimated to start receiving LTSS services from a new public LTSS program benefits in 2035 represents approximately 10 to 15 percent of the total Medicaid new LTSS recipients in 2035. One of the big factors on the projected recipients and the Medicaid fiscal impact, (as well as the total program cost) is the vesting requirement assumptions. Figure 26 illustrates the impact of vesting requirements on Medicaid recipients who otherwise would have been eligible for the proposed public LTSS program.
Figure 26 Michigan Department of Health and Human Services
Impact of Vesting Requirements on Medicaid Recipients Projected Medicaid Recipients Total Vested Recipients Starting LTSS Program Benefits in 2035 54,100 9,000

MILLIMAN REPORT
_______________________________________________________________________________________________________________________
State of Michigan Department of Health and Human Services Page 30 Long-Term Services and Supports Feasibility Study Report February 8, 2021
MILLIMAN REPORT
_______________________________________________________________________________________________________________________
State of Michigan Department of Health and Human Services Page 31 Long-Term Services and Supports Feasibility Study Report February 8, 2021
As the public LTSS program matures, the impact of the vesting requirement will become less of an impact and the percentage of new Medicaid enrollees who will receive the public LTSS benefit will increase. Therefore, the Medicaid fiscal impact will be increased accordingly. It is also important to note, that a significant portion of the Medicaid LTSS recipients will not be eligible for the public LTSS program. This is further described in the next section. ESTIMATING PROJECTED MEDICAID RECIPIENTS The Medicaid program provides LTSS services for tens of thousands of Michiganders. However, we are only projecting a portion of those would receive services under the proposed new public LTSS program. There are a few key differences between the existing Medicaid program and Base Plan modeled in the LTSS feasibility study that account for why only a portion of the Medicaid population would receive services under a new public program. The primary differences between the Base Plan scenario of a new public program and the Medicaid program include the following:
Vesting requirements
New public program: To be eligible for benefits, individuals must pay the tax for a specified number of
years, known as the vesting period.
Medicaid: Must meet Medicaid eligibility requirements.
Benefit eligibility
New public program: Individuals who vested can draw benefits once they meet the HIPAA eligibility
“trigger.” The HIPAA trigger is defined as needing assistance with two or more ADLs or severe cognitive impairment, where the individual is expected to meet the definition for at least the next 90 days.
Medicaid: There are multiple LTSS programs operated by DHHS. Our understanding is that these
programs are less restrictive than the HIPAA eligibility “trigger.”
Minimum age requirements
New public program: To be eligible for benefits, individuals must be over the age of 18 and become
disabled after the age of 18.
Medicaid: Medicaid provides essential services to children needing LTSS services and individuals who
became disabled prior to the age of 18.
Because of these differences, we have utilized the total new LTSS recipients projected for the new program as a starting point for our analysis. To estimate projected Medicaid recipients, we modeled the projected percentage of total recipients accessing the new LTSS program that would have accessed the Medicaid LTSS benefit without the public program. As we discussed above, Medicaid is the primary payer of LTSS services, accounting for 52% of total nationwide LTSS spend. However, for purposes of this analysis, we are interested in what percentage of the projected LTSS new program recipients would ever become Medicaid eligible without the public LTSS program. Based on industry research and our experience, we understand that a portion of individuals who begin covering LTSS costs out of their own pocket or using other sources besides LTC insurance ultimately spend down their assets and qualify for Medicaid. Individuals who spend down onto Medicaid represent approximately 40% of the Medicaid nursing home residents.7 This likely also occurs for individuals receiving home and community-based services, but to a lesser extent than the nursing home population. Overall, we have targeted approximately 60% of total LTSS recipients receiving the new public program benefit would have become Medicaid eligible without the program. Additionally, we estimate Medicaid will represent a higher portion of the nursing home recipients than other care settings.
7 U.S. Department of Health and Human Services (January 1, 1992). An Analysis of the Impact of Spend-Down on Medicaid Expenditures. ASPE. Retrieved February 12, 2020, from https://aspe.hhs.gov/basic-report/analysis-impact-spend-down-medicaid-expenditures#impact.

MILLIMAN REPORT
_______________________________________________________________________________________________________________________
State of Michigan Department of Health and Human Services Page 32 Long-Term Services and Supports Feasibility Study Report February 8, 2021
Michigan’s Medicaid program includes a large number of LTSS recipients who participate in cost sharing requirements. For these individuals who are also eligible for the public LTSS program, we recognize that the combination of the individuals’ out-of-pocket costs and the daily benefit amount from a public LTSS program may cover the total cost of LTSS and defer an individual’s need for Medicaid assistance.
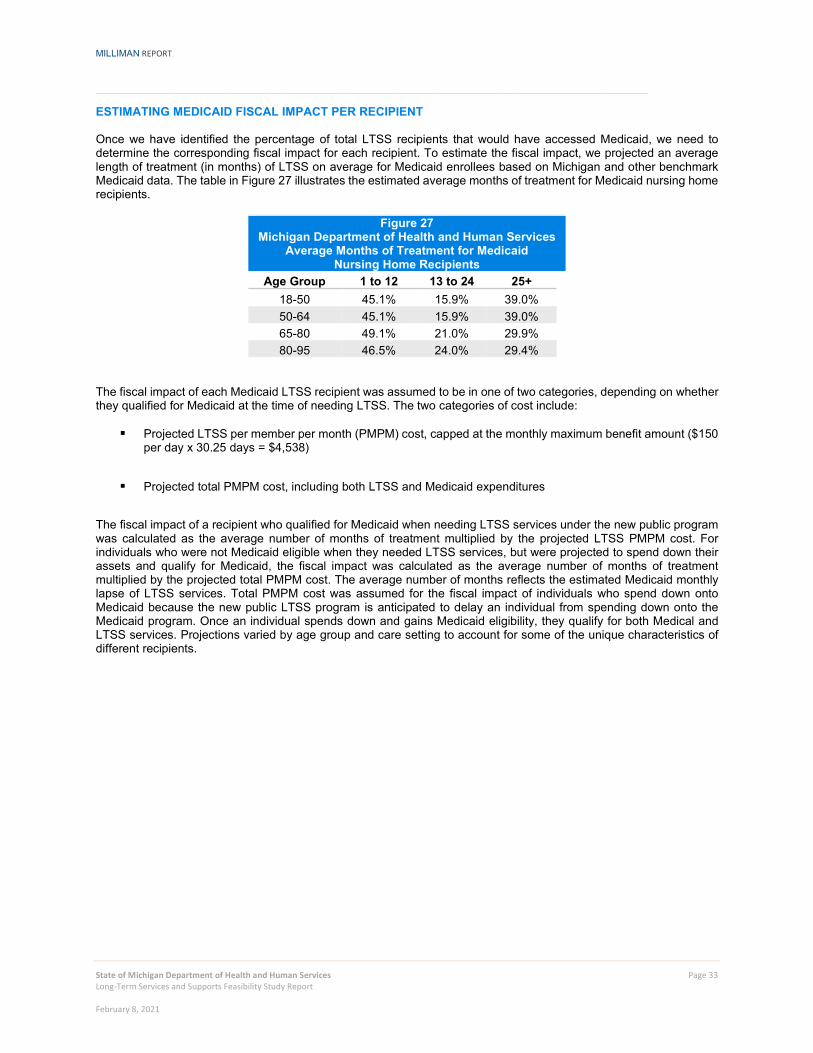
MILLIMAN REPORT
_______________________________________________________________________________________________________________________
State of Michigan Department of Health and Human Services Page 33 Long-Term Services and Supports Feasibility Study Report February 8, 2021
ESTIMATING MEDICAID FISCAL IMPACT PER RECIPIENT Once we have identified the percentage of total LTSS recipients that would have accessed Medicaid, we need to determine the corresponding fiscal impact for each recipient. To estimate the fiscal impact, we projected an average length of treatment (in months) of LTSS on average for Medicaid enrollees based on Michigan and other benchmark Medicaid data. The table in Figure 27 illustrates the estimated average months of treatment for Medicaid nursing home recipients.
Figure 27 Michigan Department of Health and Human Services
Average Months of Treatment for Medicaid Nursing Home Recipients
Age Group 1 to 12 13 to 24 25+ 18-50 45.1% 15.9% 39.0% 50-64 45.1% 15.9% 39.0% 65-80 49.1% 21.0% 29.9% 80-95 46.5% 24.0% 29.4%
The fiscal impact of each Medicaid LTSS recipient was assumed to be in one of two categories, depending on whether they qualified for Medicaid at the time of needing LTSS. The two categories of cost include:
Projected LTSS per member per month (PMPM) cost, capped at the monthly maximum benefit amount ($150 per day x 30.25 days = $4,538)
Projected total PMPM cost, including both LTSS and Medicaid expenditures
The fiscal impact of a recipient who qualified for Medicaid when needing LTSS services under the new public program was calculated as the average number of months of treatment multiplied by the projected LTSS PMPM cost. For individuals who were not Medicaid eligible when they needed LTSS services, but were projected to spend down their assets and qualify for Medicaid, the fiscal impact was calculated as the average number of months of treatment multiplied by the projected total PMPM cost. The average number of months reflects the estimated Medicaid monthly lapse of LTSS services. Total PMPM cost was assumed for the fiscal impact of individuals who spend down onto Medicaid because the new public LTSS program is anticipated to delay an individual from spending down onto the Medicaid program. Once an individual spends down and gains Medicaid eligibility, they qualify for both Medical and LTSS services. Projections varied by age group and care setting to account for some of the unique characteristics of different recipients.
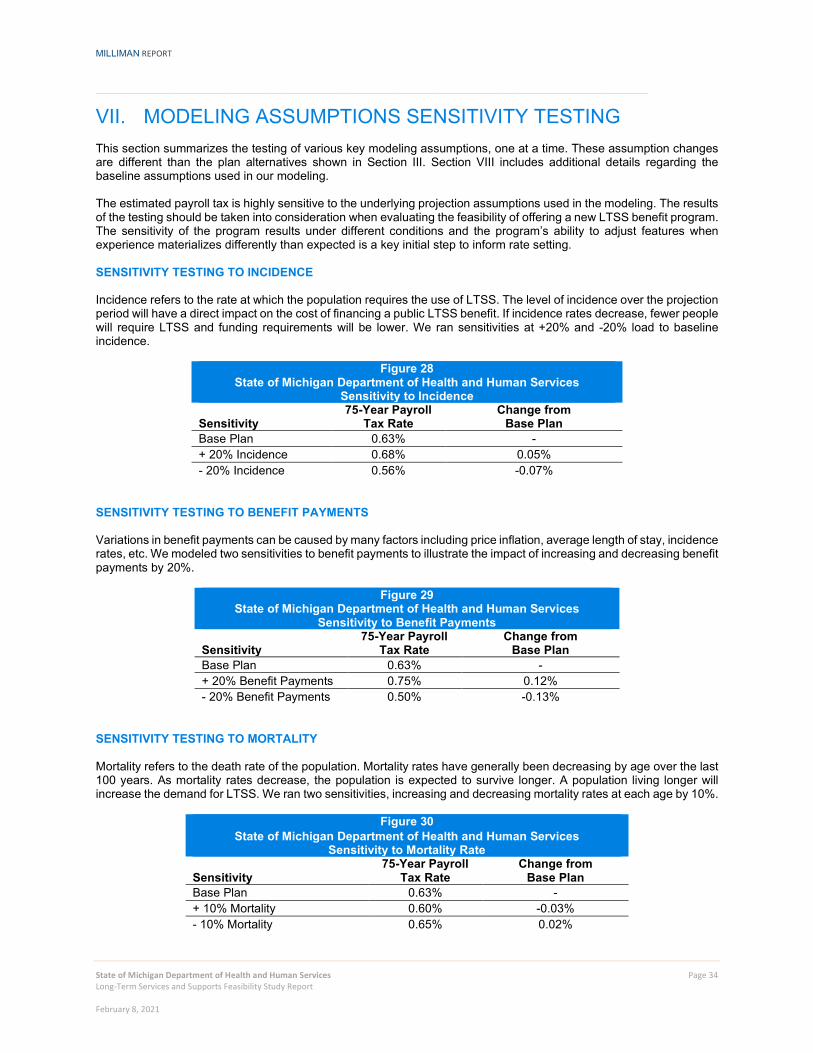
MILLIMAN REPORT
_______________________________________________________________________________________________________________________
State of Michigan Department of Health and Human Services Page 34 Long-Term Services and Supports Feasibility Study Report February 8, 2021
VII. MODELING ASSUMPTIONS SENSITIVITY TESTING This section summarizes the testing of various key modeling assumptions, one at a time. These assumption changes are different than the plan alternatives shown in Section III. Section VIII includes additional details regarding the baseline assumptions used in our modeling. The estimated payroll tax is highly sensitive to the underlying projection assumptions used in the modeling. The results of the testing should be taken into consideration when evaluating the feasibility of offering a new LTSS benefit program. The sensitivity of the program results under different conditions and the program’s ability to adjust features when experience materializes differently than expected is a key initial step to inform rate setting. SENSITIVITY TESTING TO INCIDENCE Incidence refers to the rate at which the population requires the use of LTSS. The level of incidence over the projection period will have a direct impact on the cost of financing a public LTSS benefit. If incidence rates decrease, fewer people will require LTSS and funding requirements will be lower. We ran sensitivities at +20% and -20% load to baseline incidence.
Figure 28 State of Michigan Department of Health and Human Services
Sensitivity to Incidence
Sensitivity 75-Year Payroll
Tax Rate Change from
Base Plan Base Plan 0.63% - + 20% Incidence 0.68% 0.05% - 20% Incidence 0.56% -0.07%
SENSITIVITY TESTING TO BENEFIT PAYMENTS Variations in benefit payments can be caused by many factors including price inflation, average length of stay, incidence rates, etc. We modeled two sensitivities to benefit payments to illustrate the impact of increasing and decreasing benefit payments by 20%.
Figure 29 State of Michigan Department of Health and Human Services
Sensitivity to Benefit Payments
Sensitivity 75-Year Payroll
Tax Rate Change from
Base Plan Base Plan 0.63% - + 20% Benefit Payments 0.75% 0.12% - 20% Benefit Payments 0.50% -0.13%
SENSITIVITY TESTING TO MORTALITY Mortality refers to the death rate of the population. Mortality rates have generally been decreasing by age over the last 100 years. As mortality rates decrease, the population is expected to survive longer. A population living longer will increase the demand for LTSS. We ran two sensitivities, increasing and decreasing mortality rates at each age by 10%.
Figure 30 State of Michigan Department of Health and Human Services
Sensitivity to Mortality Rate
Sensitivity 75-Year Payroll
Tax Rate Change from
Base Plan Base Plan 0.63% - + 10% Mortality 0.60% -0.03% - 10% Mortality 0.65% 0.02%
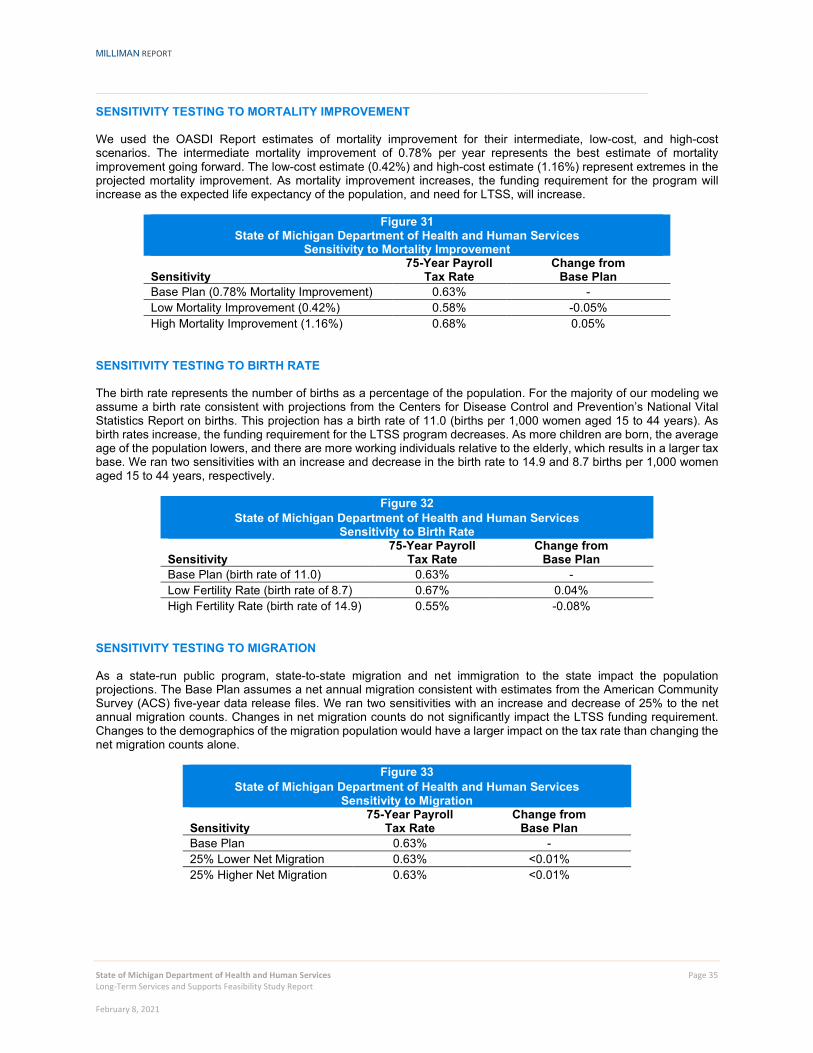
MILLIMAN REPORT
_______________________________________________________________________________________________________________________
State of Michigan Department of Health and Human Services Page 35 Long-Term Services and Supports Feasibility Study Report February 8, 2021
SENSITIVITY TESTING TO MORTALITY IMPROVEMENT We used the OASDI Report estimates of mortality improvement for their intermediate, low-cost, and high-cost scenarios. The intermediate mortality improvement of 0.78% per year represents the best estimate of mortality improvement going forward. The low-cost estimate (0.42%) and high-cost estimate (1.16%) represent extremes in the projected mortality improvement. As mortality improvement increases, the funding requirement for the program will increase as the expected life expectancy of the population, and need for LTSS, will increase.
Figure 31 State of Michigan Department of Health and Human Services
Sensitivity to Mortality Improvement
Sensitivity 75-Year Payroll
Tax Rate Change from
Base Plan Base Plan (0.78% Mortality Improvement) 0.63% - Low Mortality Improvement (0.42%) 0.58% -0.05% High Mortality Improvement (1.16%) 0.68% 0.05%
SENSITIVITY TESTING TO BIRTH RATE The birth rate represents the number of births as a percentage of the population. For the majority of our modeling we assume a birth rate consistent with projections from the Centers for Disease Control and Prevention’s National Vital Statistics Report on births. This projection has a birth rate of 11.0 (births per 1,000 women aged 15 to 44 years). As birth rates increase, the funding requirement for the LTSS program decreases. As more children are born, the average age of the population lowers, and there are more working individuals relative to the elderly, which results in a larger tax base. We ran two sensitivities with an increase and decrease in the birth rate to 14.9 and 8.7 births per 1,000 women aged 15 to 44 years, respectively.
Figure 32 State of Michigan Department of Health and Human Services
Sensitivity to Birth Rate
Sensitivity 75-Year Payroll
Tax Rate Change from
Base Plan Base Plan (birth rate of 11.0) 0.63% - Low Fertility Rate (birth rate of 8.7) 0.67% 0.04% High Fertility Rate (birth rate of 14.9) 0.55% -0.08%
SENSITIVITY TESTING TO MIGRATION As a state-run public program, state-to-state migration and net immigration to the state impact the population projections. The Base Plan assumes a net annual migration consistent with estimates from the American Community Survey (ACS) five-year data release files. We ran two sensitivities with an increase and decrease of 25% to the net annual migration counts. Changes in net migration counts do not significantly impact the LTSS funding requirement. Changes to the demographics of the migration population would have a larger impact on the tax rate than changing the net migration counts alone.
Figure 33 State of Michigan Department of Health and Human Services
Sensitivity to Migration
Sensitivity 75-Year Payroll
Tax Rate Change from
Base Plan Base Plan 0.63% - 25% Lower Net Migration 0.63% <0.01% 25% Higher Net Migration 0.63% <0.01%
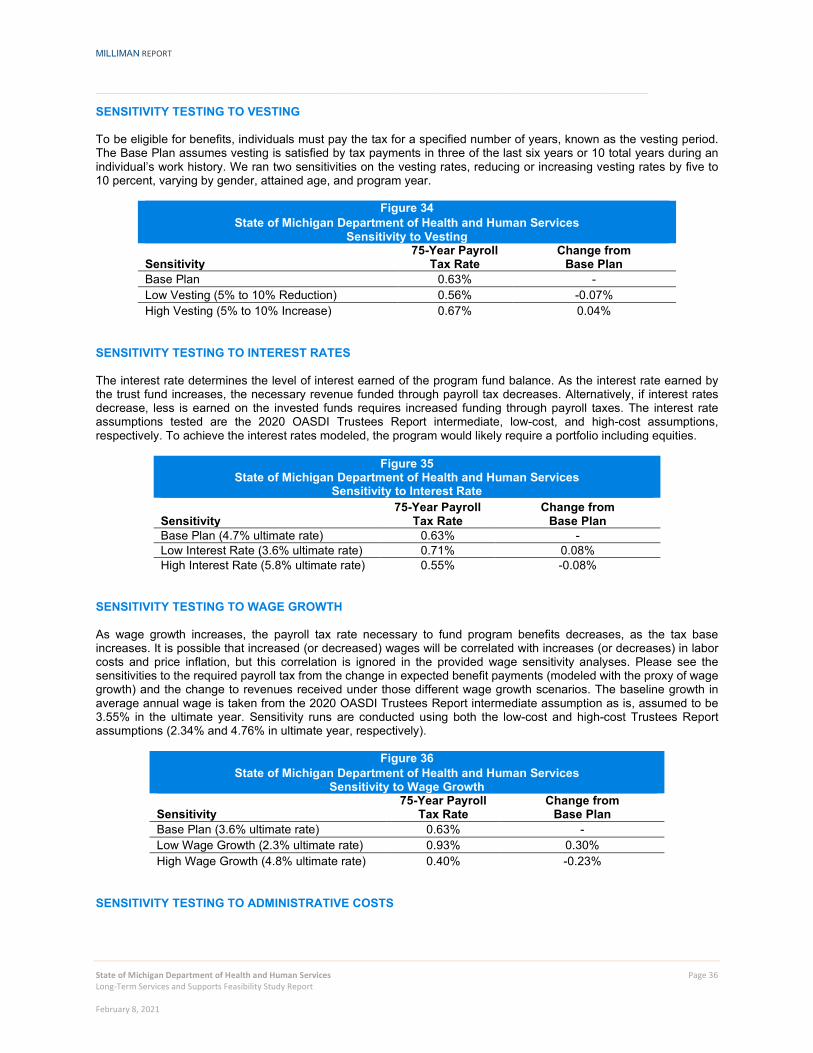
MILLIMAN REPORT
_______________________________________________________________________________________________________________________
State of Michigan Department of Health and Human Services Page 36 Long-Term Services and Supports Feasibility Study Report February 8, 2021
SENSITIVITY TESTING TO VESTING To be eligible for benefits, individuals must pay the tax for a specified number of years, known as the vesting period. The Base Plan assumes vesting is satisfied by tax payments in three of the last six years or 10 total years during an individual’s work history. We ran two sensitivities on the vesting rates, reducing or increasing vesting rates by five to 10 percent, varying by gender, attained age, and program year.
Figure 34 State of Michigan Department of Health and Human Services
Sensitivity to Vesting
Sensitivity 75-Year Payroll
Tax Rate Change from
Base Plan Base Plan 0.63% - Low Vesting (5% to 10% Reduction) 0.56% -0.07% High Vesting (5% to 10% Increase) 0.67% 0.04%
SENSITIVITY TESTING TO INTEREST RATES The interest rate determines the level of interest earned of the program fund balance. As the interest rate earned by the trust fund increases, the necessary revenue funded through payroll tax decreases. Alternatively, if interest rates decrease, less is earned on the invested funds requires increased funding through payroll taxes. The interest rate assumptions tested are the 2020 OASDI Trustees Report intermediate, low-cost, and high-cost assumptions, respectively. To achieve the interest rates modeled, the program would likely require a portfolio including equities.
Figure 35 State of Michigan Department of Health and Human Services
Sensitivity to Interest Rate
Sensitivity 75-Year Payroll
Tax Rate Change from
Base Plan Base Plan (4.7% ultimate rate) 0.63% - Low Interest Rate (3.6% ultimate rate) 0.71% 0.08% High Interest Rate (5.8% ultimate rate) 0.55% -0.08%
SENSITIVITY TESTING TO WAGE GROWTH As wage growth increases, the payroll tax rate necessary to fund program benefits decreases, as the tax base increases. It is possible that increased (or decreased) wages will be correlated with increases (or decreases) in labor costs and price inflation, but this correlation is ignored in the provided wage sensitivity analyses. Please see the sensitivities to the required payroll tax from the change in expected benefit payments (modeled with the proxy of wage growth) and the change to revenues received under those different wage growth scenarios. The baseline growth in average annual wage is taken from the 2020 OASDI Trustees Report intermediate assumption as is, assumed to be 3.55% in the ultimate year. Sensitivity runs are conducted using both the low-cost and high-cost Trustees Report assumptions (2.34% and 4.76% in ultimate year, respectively).
Figure 36 State of Michigan Department of Health and Human Services
Sensitivity to Wage Growth
Sensitivity 75-Year Payroll
Tax Rate Change from
Base Plan Base Plan (3.6% ultimate rate) 0.63% - Low Wage Growth (2.3% ultimate rate) 0.93% 0.30% High Wage Growth (4.8% ultimate rate) 0.40% -0.23%
SENSITIVITY TESTING TO ADMINISTRATIVE COSTS

MILLIMAN REPORT
_______________________________________________________________________________________________________________________
State of Michigan Department of Health and Human Services Page 37 Long-Term Services and Supports Feasibility Study Report February 8, 2021
The administrative load represents the expense necessary to conduct program operations, including premium collection and payment of benefits. We test two variations of administrative loads (4% and 10%). The incremental change in the administrative load flows directly to the required tax rate.
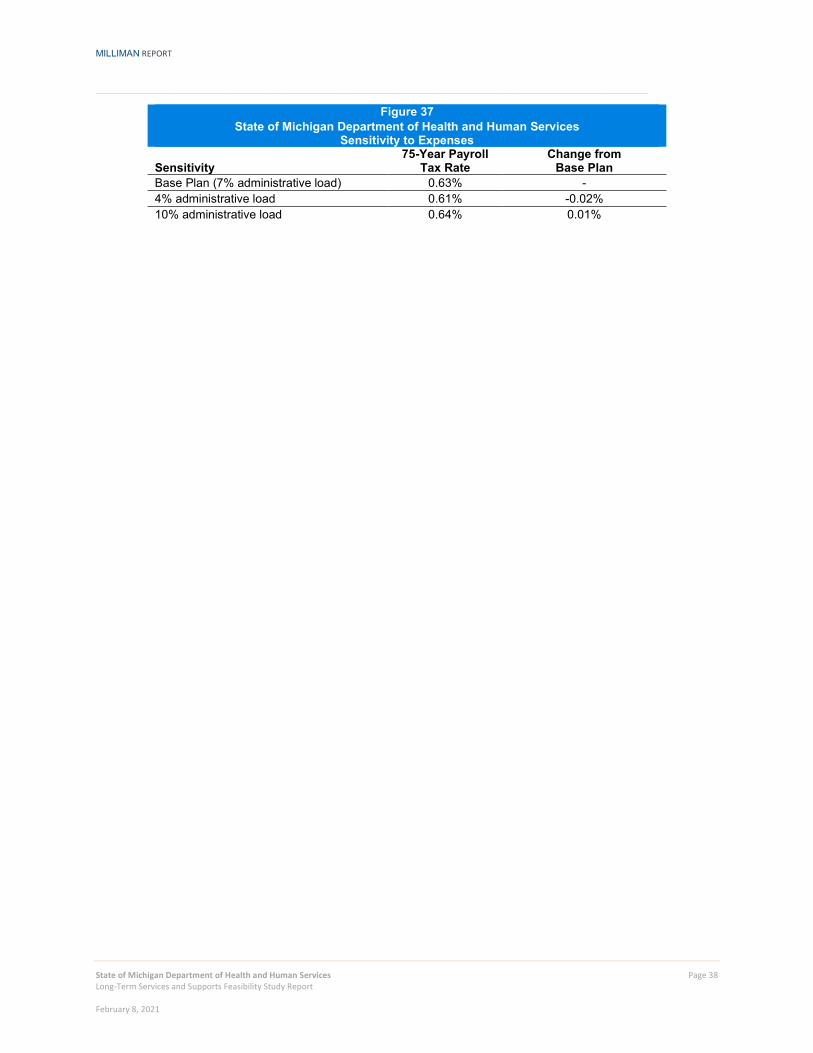
MILLIMAN REPORT
_______________________________________________________________________________________________________________________
State of Michigan Department of Health and Human Services Page 38 Long-Term Services and Supports Feasibility Study Report February 8, 2021
Figure 37 State of Michigan Department of Health and Human Services
Sensitivity to Expenses
Sensitivity 75-Year Payroll
Tax Rate Change from
Base Plan Base Plan (7% administrative load) 0.63% - 4% administrative load 0.61% -0.02% 10% administrative load 0.64% 0.01%
MILLIMAN REPORT
_______________________________________________________________________________________________________________________
State of Michigan Department of Health and Human Services Page 39 Long-Term Services and Supports Feasibility Study Report February 8, 2021
VIII. METHODOLOGY AND ASSUMPTIONS We projected long-term care beneficiaries and costs using Milliman’s modeling software, MG-ALFA®. The projection started with the current population of the state of Michigan by age, sex, and region, and projected forward for 75 years. The projected Michigan population is estimated based on the number of births, deaths, and net migrants in each future year. To calculate the long-term care beneficiaries and costs for the projected population in each year, the model utilizes Milliman’s proprietary Long-Term Care Guidelines (Guidelines) calibrated from an insured basis to the Michigan population characteristics. The Guidelines provide frequencies, continuance curves, utilization assumptions, and claims costs developed from a large number of product designs, based on data from the past two decades. The Guidelines incorporate both private and public sector data sources. The Guidelines are updated triennially to reflect the most comprehensive and current information available in the market. The breadth of underlying data and the comprehensiveness of analysis position the Guidelines to be an unrivaled benchmark for LTC morbidity. The projection is for the 75-year period 2022 through 2097. A 75-year projection is established by the Social Security Administration (SSA) and the Centers for Medicare and Medicaid Services (CMS) as the standard projection period for determining the actuarial balance of a public insurance program. The 75-year period covers the expected lifetime of the vast majority of residents just entering their working ages. Thus, a 75-year projection period covers all the working years and all of the benefit years of those just beginning their participation. The model produces year-by-year cash flow projections, such that the value and scope of the program can be estimated for any of the years in the 75-year projection period. A projection period of at least 75 years is necessary to see the ultimate costs of the program, because it allows for a full career contribution period (so that the ultimate effects of the vesting rules can be modeled), and the full benefit period (so that the benefits paid over all retirement years based on a specified indexing option can be modeled). The cash flow consists of income to the program from taxes, premiums, subsidies, and interest on any fund. Expenditures from the program consist of benefit payments for nursing home or home care services and administrative expenses. We projected each of these items on a year-by-year basis for 75 years. DEMOGRAPHIC ASSUMPTIONS The demographic assumptions relate to the projection of the population of Michigan. For a pay-as-you-go public insurance program, the covered population is of fundamental importance in the estimation of costs. The income to the program depends on the number of contributors and the outgo of the program depends on the number of beneficiaries, most of whom are aged 65 or over. Estimates of the number of contributors and of the number of beneficiaries are based on the population projection. The estimate of the resident population starts with the census count of the resident population for Michigan by age and sex as of 2016. We use a 2016 starting population to build-up a stable disabled population and appropriately reflect LTC prevalence at the time of first program payments (2025). The model projects the Michigan population by estimating the number of births, deaths, and net migrants for each future year. Starting Population The estimate of the 2016 starting population is from the State of Michigan Department of Health and Human Services estimates as of June 2018. This survey was used to tabulate State population estimates by age and sex and is the starting point for the Michigan population projection. Migration Net migration to Michigan is based on the American Community Survey (ACS) five-year data release files. The relativities of state-to-state immigration and emigration, as well as immigration and emigration into and out of the United States, are also tabulated from the ACS five-year data release files. The data files are used to calculate the distribution by age and sex of domestic and international net migration into and from Michigan. Yearly totals of immigrants and emigrants are based on the relativities noted above. Individuals who emigrate are kept track of separately in the model. Such individuals who contributed to the program could be eligible for partial benefits outside of Michigan as they divest from the program. In most of the modeled alternatives, benefit credits are assumed lost over five years once an individual leaves Michigan. The eligible beneficiary population includes emigrants in addition to persisting and immigrating Michigan residents. The model does not track the legal status of immigrants or emigrants.
MILLIMAN REPORT
_______________________________________________________________________________________________________________________
State of Michigan Department of Health and Human Services Page 40 Long-Term Services and Supports Feasibility Study Report February 8, 2021
Births The number of births in Michigan are estimated using the projected birth rates from the Centers for Disease Control and Prevention’s National Vital Statistics Report on births. These birth rates are trended according to the fertility rate projection provided in the 2020 OASDI Trustees Report. Deaths We applied separate mortality rates to the active (or “healthy”) lives and disabled lives.
Active Life Mortality: Current and projected U.S. active life mortality rates by age and sex were calculated using multiple sources, including the Guidelines, 2020 OASDI Trustees Report (after backing out disabled life mortality), Society of Actuaries (SOA) 2012 Individual Annuity Mortality (IAM) table (after backing out disabled life mortality), and SOA Intercompany data.
Disabled Life Mortality: Current and projected U.S. disabled life mortality rates by age, sex, duration, and care
setting were calculated from Milliman’s proprietary Guidelines.
The projected U.S. mortality rates were calibrated to Michigan using the CDC age-adjusted mortality rates by state. This data shows that Michigan’s mortality rates are 7% to 10% higher than the national average. In our modeling, we grade off this Michigan calibration factor over a period of 20 years, assuming mortality rates will gradually approach nationwide levels. Mortality improvement rates by age and sex were estimated from the 2020 OASDI Trustees Report. The Trustees Report mortality rates are projected through 2095. As a final step, projected lives by calendar year were compared against the State of Michigan Bureau of Labor Market Information and Strategic Initiatives projections for 2020 through 2028. ECONOMIC ASSUMPTIONS Economic parameters concerning trends in the labor force, wages, and costs of LTC services are of primary importance for the projection of the income and expenditures of the LTC program. Because the program is financed by a payroll tax, the labor force participation and wage level will directly affect annual program income. The index used to trend the daily benefit amount is important because it affects program liabilities in the future. The interest rate assumption is important because it affects the interest income earned by the LTC fund (and the present value of the future benefit stream). Labor Force Participation and Unemployment U.S. labor force participation rates (LFPR) and unemployment rates (UR) by age and sex are from the 2020 OASDI Trustees Report. These rates are adjusted to Michigan-specific levels using the ratio of Michigan LFPR to U.S. LFPR, and Michigan UR to U.S. UR. Michigan-specific and U.S. employment data for this adjustment comes from the U.S. Bureau of Labor Statistics (BLS) Local Area Unemployment Statistics. This data is used to project the labor force and unemployment rate in each year of the projection period. The labor force is calculated in order to estimate the tax base in each year. The labor force calculations do not take into account workers’ legal status. Wages Projections of U.S. average taxable earnings from 2018 to 2095 are found in the 2020 OASDI Trustees Report. Taxable earnings are the amount of covered earnings subject to the Social Security payroll tax. Taxable earnings for years after 2095 are projected using the 5-year trend from 2091 to 2095. In order to estimate the Michigan tax base, we adjust the average U.S. earnings to Michigan-specific earnings by the ratio of the average wage in Michigan over the average wage in the United States. We grade off the Michigan-specific wage adjustment over 20 years, assuming wages will approximate national average wages over time. Wage data for this adjustment comes from BLS Occupational Employment Statistics. We then convert the taxable earnings into covered earnings using the ratio of taxable earnings to covered earnings from the 2020 OASDI Trustees Report. Average covered earnings are multiplied by the labor force each year to determine the tax base in that year.
MILLIMAN REPORT
_______________________________________________________________________________________________________________________
State of Michigan Department of Health and Human Services Page 41 Long-Term Services and Supports Feasibility Study Report February 8, 2021
We assumed average increases in wages are the same as assumed in the OASDI Trustees Report, with an ultimate wage trend of 3.55% per year. Vesting In order to become eligible for benefits, a worker must become vested (or in other words, become insured). To vest in the LTSS benefit, an individual must work and pay taxes for a specified number of years. We used the 2006 Earnings Public Use Microdata File to estimate the percentage of Michiganders that would become vested by age, sex, and projection year. This data provides annual earnings information (i.e., a lifetime earnings profile) for a 1% random sample of all Social Security numbers issued before January 1, 2007. Under the Base Plan, individuals are fully vested if they work more than 500 hours per year for three of the last six years, or for 10 years total over their lifetimes. To find the percentage of the working population meeting these requirements, we observed the work histories of the random sample of data. For each age, the percentage of individuals who had recorded income for three of the previous six years or eight years total is tabulated. We used eight instead of 10 years in this tabulation since becoming insured under this program provides an added incentive to continue working for those who are almost insured. For each year of the program, we vary the number of years of work history to be included in this tabulation. For example, in year 10 of the program, we only considered work history for individuals going back 10 years to estimate vesting percentages. Because of this, the vesting percentages by age and gender vary in each program year. We used American Time Use Survey to determine the percentage of workers who work more than 500 hours per year (approximately 95%) and apply this percentage to the vesting percentages by age, gender, and program year. We observed that females’ work histories changed significantly since the beginning of the data collection period in 1951, with the last five to ten years of data approximating the male work history. As such, we set the female vesting percentages equal to the male vesting percentages. We did not vary the migration assumptions for individuals who migrated into the State. This is a conservative assumption, since we are basically assuming they are able to bring their work histories in other states with them, however, varying this assumption had a relatively low impact on results and seemed appropriate given we do not know how many individuals moving into the state lived in Michigan previously and would be moving into the state with some relevant work history. We used similar methodology for alternatives where the changes to program parameter would affect the vesting, observing an individual’s qualifying working years based on a “look-back” period consistent with program duration, to determine partial vesting credits earned. Interest Rates The interest rates used in modeling come from the 2020 OASDI Trustees Report. Annual interest rates start at 2.2% in 2019, grow to 4.7% by 2029, and remain at 4.7% for the remaining years of the projection. The interest rates are assumed to represent earnings net of investment expenses and the cost of defaults. Federal Poverty Level Groupings Federal poverty levels for the Michigan State population and working population come from the ACS five-year data set. FPL groups are tabulated by age and sex at 100% FPL, 138% FPL, 200%, 500%, and 500%+ FPL. These tabulated rates are assumed to be fixed over the projection period. MORBIDITY ASSUMPTIONS To calculate the long-term care beneficiaries and costs for the projected population in each year, we utilized Milliman’s proprietary Guidelines. The Guidelines provide frequencies, continuance curves, utilization assumptions and claim costs from a large number of fully-insured, long-term care product designs sold over the past two decades. The Guidelines incorporate both private and public sector data sources and are periodically updated to reflect the most comprehensive and current information available in the market. The first set of Guidelines was developed in 1992 and is updated regularly, with the most recent edition completed in 2017. The breadth of underlying data and the comprehensiveness of analysis position the LTC Guidelines to be an unrivaled benchmark for LTC morbidity of the fully-insured population. We did not assume any morbidity improvement as part of our modeling.
MILLIMAN REPORT
_______________________________________________________________________________________________________________________
State of Michigan Department of Health and Human Services Page 42 Long-Term Services and Supports Feasibility Study Report February 8, 2021
Eligibility Criteria Frailty is traditionally been measured by a person's ability to perform activities of daily living (ADLs). As originally conceived by Katz in his paper "A Measure of Primary Sociobiological Functions," there were six ADLs: bathing, dressing, transferring, continence, toileting, and eating. Later, some researchers proposed mobility (i.e., the ability to get about inside of a house), and others the taking of medication, as additional ADLs. This original measure of frailty was expanded to include cognitive ability in addition to physical abilities as an indication of the need for long-term care services.
The criteria for eligibility for benefits in the Base Plan is based on the HIPAA definition. This is the industry standard measure for when LTC is required, as used universally by federally tax-qualified private LTC insurance plans. An individual is defined as satisfying this benefit trigger when that person needs hands-on or supervisory assistance with two or more ADLs for a period expected to last at least 90 days, or if that person has a severe cognitive impairment. The ADLs now have specific definitions and include bathing, dressing, toileting, transferring, eating, and caring for incontinence. Benefit Utilization The model assumes that the full daily benefit amount is utilized for nursing home beneficiaries each day. It is assumed that home care beneficiaries receive the full daily benefit amount on roughly 70.5% of days. Incidence Calibration The Milliman Long Term Care Guidelines incidence rates are representative of a fully-insured population. A fully-insured population will have different morbidity than the population under this program for a few reasons, including:
Insured data may have inherent anti-selection as it reflects individuals who choose to purchase care and may have reason to believe they will need care in the future.
Insured data reflects a higher income population, which are generally healthier lives with lower morbidity.
Most individuals insured in the private market had to complete underwriting, ensuring they were relatively
healthy at least when they first purchased coverage. There is no underwriting qualification associated with the public program in this study, although individuals will need to be at least healthy enough to satisfy vesting requirements.
We calibrated the incidence rates to a general population basis using a variety of data sources including selection factors from the Guidelines and other industry general population prevalence studies. While general population data exists, morbidity data reflecting a “public option” program does not exist and was not used for this feasibility study. It is unknown how individuals will react to having a public benefit available. PARTICIPATION AND ADVERSE SELECTION Universal mandatory programs can be assured that the experience of the group will be average, because everyone will be in the program. Voluntary programs, however, are subject to anti-selection (i.e., those with the highest need of services will be most likely to enroll). Since the Base Plan and alternatives are mandatory, no anti-selection assumptions were modeled. ADMINISTRATIVE EXPENSES In addition to the cost of benefits, we also projected costs incurred to administer the program. In general, public insurance programs have been able to return a high portion of income in benefits. The administrative expenses as a percent of benefit payments for the various Social Security and Medicare programs (as shown in the Trustees Reports) have been less than 3 percent of the benefits, although some studies indicate it may be higher than this amount. A long-term care program would likely cost more than any of these programs, because it would entail the high cost of determining eligibility (as in the Disability Insurance program) and the high cost of paying claims (as in the Supplementary Medical Insurance program). In addition, the administrative costs as a percent of contributions for Social Security and Medicare programs would be several times greater than the recent figures for the first several years of the programs, because of start-up costs.
MILLIMAN REPORT
_______________________________________________________________________________________________________________________
State of Michigan Department of Health and Human Services Page 43 Long-Term Services and Supports Feasibility Study Report February 8, 2021
The Medicaid program, CalPERS LTC Program, and the Federal Employees LTC Insurance program also provide information on the potential costs of administering a LTC program. Given the administration structure of the program is unknown, we assumed administration expenses to be 3.5% of revenue and 3.5% of benefits based on our high-level review of other government programs and programs offering LTC benefits.
MILLIMAN REPORT
_______________________________________________________________________________________________________________________
State of Michigan Department of Health and Human Services Page 44 Long-Term Services and Supports Feasibility Study Report February 8, 2021
IX. CAVEATS AND LIMITATIONS This report was prepared for the internal use of the State of Michigan Department of Health and Human Services (DHHS), and it should not be distributed, in whole or in part, to any external parties without the prior permission of Milliman. Notwithstanding the foregoing, Milliman recognizes that this report may be subject to disclosure to the Michigan State Legislature and its committees, including persons participating in legislative reviews and deliberations, and/or requests made under the Michigan Freedom of Information Act. In the event such disclosures to third parties occur, Milliman does not intend to benefit or create a legal liability to any third party. Any distribution of this work product to a third party must be made in its entirety. The information in this report provides a current view of LTSS financing, a stakeholder perspectives report, and the final report outline for the actuarial modeling and analysis regarding the feasibility of policy options to finance long-term services and supports in the state of Michigan. It may not be appropriate, and should not be used, for other purposes. In completing this analysis, we relied on information provided by DHHS and publicly available data, which we accepted without audit. However, we did review this information for general reasonableness. Guidelines issued by the American Academy of Actuaries require actuaries to include their professional qualifications in all actuarial communications. Chris Giese, Al Schmitz, Chris Pettit, Jeremy Cunningham, Annie Gunnlaugsson, Jeremy Hamilton, and Sarah Wunder are members of the American Academy of Actuaries, and meet the qualification standards for performing the analyses in this report. The terms of the Consulting Services Contract with DHHS effective September 13, 2019, apply to this engagement.

MILLIMAN REPORT
_______________________________________________________________________________________________________________________
State of Michigan Department of Health and Human Services Long-Term Services and Supports Feasibility Study Report February 8, 2021
EXHIBITS
MILLIMAN RESEARCH REPORT
15800 W. Bluemound Road Suite 100 Brookfield, WI 53005 USA Tel +1 262 784 ax +1 262 923 3680 milliman.com
For more information about Milliman, please visit us at:
milliman.com
1.1.1 Milliman is among the world’s largest providers of actuarial and related products and services. The firm has consulting practices in life insurance and financial services, property and casualty insurance, healthcare, and employee benefits. Founded in 1947, Milliman is an independent firm with offices in major cities around the globe.
CONTACT
Christopher Giese [email protected]
Allen Schmitz [email protected]
Chris Pettit [email protected]
Sarah Wunder [email protected]
Jeremy Hamilton [email protected]
Jeremy Cunningham [email protected]
Annie Gunnlaugsson [email protected]
© 2020 Milliman, Inc. All Rights Reserved. The materials in this document represent the opinion of the authors and are not representative of the views of Milliman, Inc. Milliman does not certify the information, nor does it guarantee the accuracy and completeness of such information. Use of such information is voluntary and should not be relied upon unless an independent review of its accuracy and completeness has been performed. Materials may not be reproduced without the express consent of Milliman.

Attachment 2: Michigan’s Long-Term Care Workforce: Needs, Strengths, and Challenges
Altarum Report

MICHIGAN'S LONG-TERM CARE WORKFORCE: NEEDS, STRENGTHS, AND CHALLENGES AUTHORS: Ani Turner and Sarah Slocum, Altarum Stephen Campbell and Kezia Scales, PHI June 26, 2020 This report was sponsored by the Michigan Legislature and the Michigan Department of Health and Human Services.
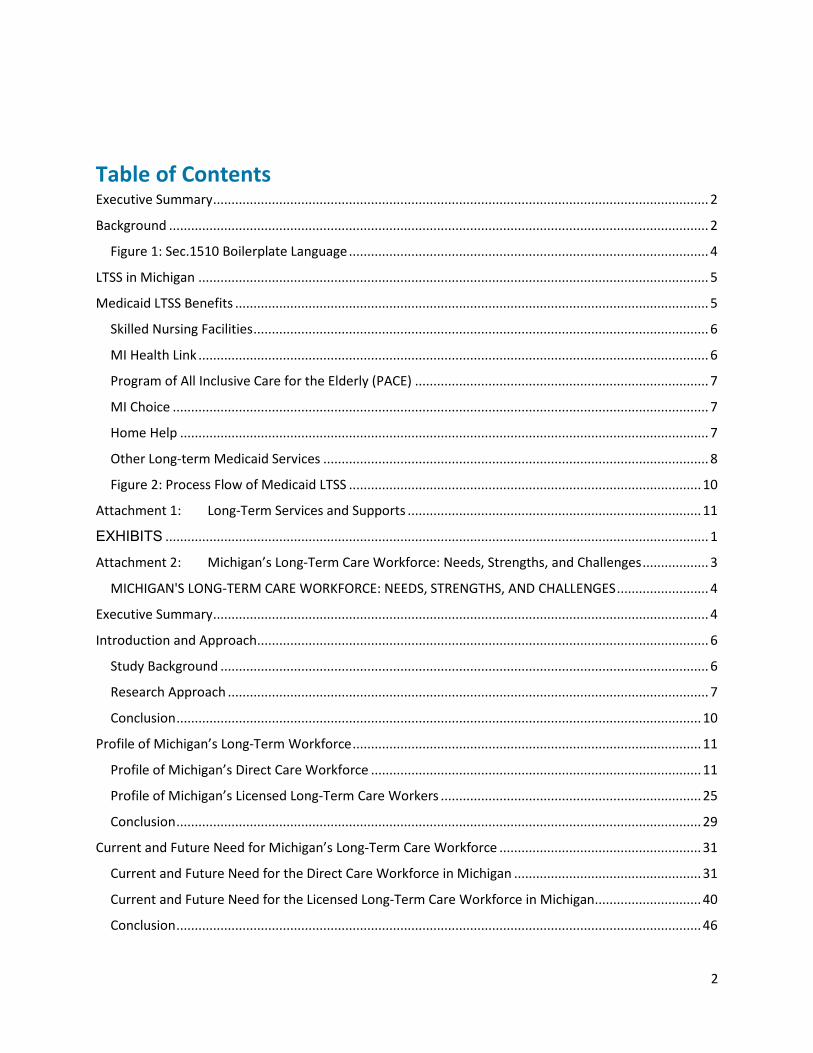
2
Table of Contents Executive Summary ....................................................................................................................................... 2
Background ................................................................................................................................................... 2
Figure 1: Sec.1510 Boilerplate Language .................................................................................................. 4
LTSS in Michigan ........................................................................................................................................... 5
Medicaid LTSS Benefits ................................................................................................................................. 5
Skilled Nursing Facilities ............................................................................................................................ 6
MI Health Link ........................................................................................................................................... 6
Program of All Inclusive Care for the Elderly (PACE) ................................................................................ 7
MI Choice .................................................................................................................................................. 7
Home Help ................................................................................................................................................ 7
Other Long-term Medicaid Services ......................................................................................................... 8
Figure 2: Process Flow of Medicaid LTSS ................................................................................................ 10
Attachment 1: Long-Term Services and Supports ................................................................................ 11
EXHIBITS .................................................................................................................................................... 1
Attachment 2: Michigan’s Long-Term Care Workforce: Needs, Strengths, and Challenges .................. 3
MICHIGAN'S LONG-TERM CARE WORKFORCE: NEEDS, STRENGTHS, AND CHALLENGES ......................... 4
Executive Summary ....................................................................................................................................... 4
Introduction and Approach ........................................................................................................................... 6
Study Background ..................................................................................................................................... 6
Research Approach ................................................................................................................................... 7
Conclusion ............................................................................................................................................... 10
Profile of Michigan’s Long-Term Workforce ............................................................................................... 11
Profile of Michigan’s Direct Care Workforce .......................................................................................... 11
Profile of Michigan’s Licensed Long-Term Care Workers ....................................................................... 25
Conclusion ............................................................................................................................................... 29
Current and Future Need for Michigan’s Long-Term Care Workforce ....................................................... 31
Current and Future Need for the Direct Care Workforce in Michigan ................................................... 31
Current and Future Need for the Licensed Long-Term Care Workforce in Michigan ............................. 40
Conclusion ............................................................................................................................................... 46
3
Direct Care Workforce Training Requirements and Delivery in Michigan .................................................. 47
Methods .................................................................................................................................................. 47
Training Requirements for Direct Care Workers in Michigan ................................................................. 47
The Direct Care Training Delivery Landscape in Michigan ...................................................................... 50
Conclusion ............................................................................................................................................... 51
Hearing from Those Most Impacted: Care Recipients, Families, and Direct Care Workers ....................... 52
Methods .................................................................................................................................................. 52
Care Recipient Perspectives .................................................................................................................... 52
Family and Unpaid Caregivers’ Perspectives .......................................................................................... 53
Direct Care Worker Perspectives ............................................................................................................ 54
Conclusion ............................................................................................................................................... 55
Conclusions and Recommendations ........................................................................................................... 56
Strengthening the Long-Term Care Workforce ...................................................................................... 56
Supporting Family Caregivers ................................................................................................................. 58
Appendices .................................................................................................................................................. 61
Findings and Recommendations ................................................................................................................. 93
4
Executive Summary
As policymakers in Michigan consider options for financing long-term care in the future, it will be critical to consider the capacity and needs of the long-term care workforce. To that end, this report provides an in-depth analysis of Michigan’s long-term care workforce, synthesizing quantitative and qualitative data to describe the profile of the workforce, current and future workforce demand, the workforce training landscape, and the unique experiences of long-term care consumers and family caregivers. The report starts by presenting a profile of the long-term care workforce in Michigan, focusing in detail on direct care workers, who comprise the vast majority of the total workforce. Of the 106,000 workers providing long-term care services in Michigan, 76,000 are direct care workers and 30,000 are nurses, therapists, and other licensed professionals. A key finding of this study that while demand is high for direct care workers in Michigan, their compensation is low: median wages for these workers are $12.49 per hour and median annual earnings are $16,600. Consequently, 22 percent live in poverty, 52 percent live in low-income households (below 200 percent of the federal poverty line), and 48 percent rely on public benefits to support themselves and their families. Economic conditions are markedly worse for women of color, as compared to other segments of the direct care workforce. Licensed professionals in the long-term care workforce, notably registered nurses and social workers, are also often paid at lower rates than their counterparts in acute care settings. The next chapter describes current and future needs for the long-term care workforce in Michigan. There will be 238,200 total job openings in direct care from 2016 to 2026—the third highest number of job openings for any occupation in Michigan. These job openings will be generated by a combination of high turnover and rapid growth in demand for long-term care services from an aging population. Data from in-depth interviews conducted for this study show, further, that employers are already experiencing immense difficulty recruiting and retaining direct care workers, and that these shortages are leaving some Michiganders without needed services. Shortages are currently less acute for licensed workers, although challenges were reported finding therapists in the Upper Peninsula, and there were often few nursing candidates for open positions. Employers reported uncertainty about their continued ability to fill positions should current staff leave, and federal models project particular shortages of LPNs in Michigan in the coming decades. The third chapter of this report explores the direct care workforce training landscape, showing that training regulations for this workforce are highly fragmented and generally inadequate. As a result, training quality varies considerably from employer to employer, training credentials are rarely transferable across settings or among employers, and workers are unprepared for their challenging roles in the field—undermining care quality as well as workforce mobility and stability. Finally, this report summarizes findings from listening sessions and phone interviews conducted with consumers, family caregivers, and direct care workers across the state of Michigan. A key theme throughout this chapter is the challenges that consumers and family members face in navigating a complicated, fractured long-term care system to secure the assistance they need.

5
The report concludes with seven recommendations, informed by this research, for strengthening the long-term care workforce in Michigan. Outlined in detail in the final chapter of the report, these recommendations are to:
1. Improve compensation for the direct care workforce; 2. Invest in direct care workforce recruitment and retention; 3. Enhance training for direct care workers across long-term care settings and programs; 4. Strengthen long-term care workforce data collection and reporting; 5. Improve navigation assistance for family caregivers; 6. Create new funding and benefit structures to support family caregivers; and 7. Devise additional supports for family caregivers to improve their physical and mental/emotional
health.
These recommendations could be implemented within the current long-term care system in Michigan or as part of a new financing approach. Taken together, the recommendations are designed to improve access to high-quality long-term care for consumers by ensuring a stable, sustainable supply of direct care workers and licensed professionals to provide these critical services and supports.

6
Introduction and Approach Consumers in Michigan will not receive the long-term services and supports (LTSS) they need without an adequate long-term care workforce to provide that care. As the state considers new benefit options for people who need LTSS, the long-term care workforce must be kept front of mind—including both unlicensed direct care workers and licensed professionals. Already, some service providers cannot take on new clients – not because they don’t have the budget or administrative capacity, but because they cannot find staff to provide services. This report documents the current state of the long-term care workforce in Michigan and points to policy changes to support and build a robust, well-trained, adequately compensated workforce.
Study Background Legislative Origins In the Michigan appropriations bill for fiscal year 2019, the Michigan Department of Health and Human Services (MDHHS) was charged with conducting a study of individual benefit options for LTSS and a study of the Michigan LTSS workforce. The study was commissioned because an adequate long-term care workforce is key to new public programs. Milliman, Inc. conducted the benefit option study which was published separately. For the workforce study, MDHHS contracted with PHI and Altarum to research the current LTSS workforce in Michigan, to delineate gaps in workforce availability, and to craft recommendations based on these findings. This study began October 1, 2019 and was completed on June 26, 2020. All of these efforts were informed by a group of key stakeholders.8 In Chapter 2 this report presents a description of the size, demographics, economic stability, and geographic distribution of the direct care workforce, as well as the size and distribution of the licensed professional workforce. Chapter 3 explores the current capacity of the long-term care workforce and examines future need. Chapter 4 delineates training regulations for the direct care workforce and describes how direct care training is delivered in practice. The final chapter of analysis, Chapter 5, summarizes data from listening sessions with workers, consumers, and family caregivers. The report concludes with a set of recommendations for strengthening the long-term care workforce within the current LTSS system or under a new public long-term care financing program.
8 MDHHS contracted with Michigan United to recruit, convene and staff a Stakeholder Group to gather input on the benefit options and the workforce study. The Stakeholder Group met in September and December 2019 and attended a webinar on the workforce study in February 2020. Members of the group included consumers, caregivers, providers, payers, and other experts.
This study on Michigan’s long-term care workforce was commissioned by the Michigan Department of Health and Human Services and completed by Altarum and PHI. Altarum is a nonprofit research and consulting organization that creates and implements solutions to advance health among vulnerable and publicly insured populations. For this study, Altarum analyzed the licensed long-term care workforce as well as gathering the perspectives of consumers, family caregivers, and direct care workers. PHI is a national nonprofit research and consulting organization that works to ensure quality of care for older adults and people with disabilities by creating quality jobs for direct care workers. PHI led the direct care workforce component of this study.
7
Research Approach To create a picture of the current and future LTSS workforce in Michigan and explore how workforce issues affect both workers and consumers, PHI and Altarum drew on a range of quantitative and qualitative data as described below.
Quantitative Data and Methods The quantitative data in this report were sourced primarily from public datasets published by state and federal agencies. Data from the U.S. Bureau of Labor Statistics Occupational Employment Survey were used to quantify wages and employment for both the direct care and licensed long-term care workforce. Projected employment, as well as population projections, were provided by the Michigan Department of Technology, Management and Budget. Finally, Payroll-Based Staffing Journal data from the Centers for Medicare and Medicaid Services (CMS) were analyzed to delineate licensed and unlicensed staffing levels in nursing homes. Three datasets from the U.S. Census—the American Community Survey, the Current Population Survey (CPS) Outgoing Rotation Group, and the CPS March Supplement—were used to explore direct care workforce demographics, economic stability, employment trajectories, and workforce capacity by region. Several additional sources were used to examine the licensed long-term care workforce in Michigan. Data published in the U.S. Health Workforce Chartbook by the U.S. Department of Health and Human Services, Health Resources and Services Administration (HRSA) was used to compare the per capita supply of licensed long-term care professionals in Michigan to the national average. Data on board certified geriatricians published by the American Geriatrics Society were used to estimate geriatricians in Michigan and compare Michigan’s supply to the national average. Finally, to examine potential future gaps in the registered nurse (RN) and licensed practical nurse (LPN) supply, we used published projections of RN and LPN supply and demand in Michigan produced by HRSA’s National Center for Health Workforce Analysis.
Regional Definitions To identify variations in the long-term care workforce across Michigan, this report includes comparative analyses of nine regions of the state the Ann Arbor Area, the Detroit Metropolitan Area, the Flint Area, the Grand Rapids Area, the Kalamazoo Area, the Lansing Area, the Non-Metropolitan Lower Peninsula, the Saginaw Area, and the Upper Peninsula (see map that follows). Each of these regions consists of one to three metropolitan statistical areas as defined by the U.S. Census Bureau.9 Similar or proximal metropolitan statistical areas were combined as needed to achieve adequate sample sizes. (See Appendix 1 for detailed regional definitions.) Map of Michigan Regions Defined for LTC Workforce Study
9 Missouri Census Data Center. 2018. Geocorr 2018: Geographic Correspondence Engine. http://mcdc.missouri.edu/applications/geocorr2018.html.

8
9
Occupations and Industries This report studies a range of occupational groups employed in long-term care industries. On the frontlines of care are unlicensed direct care workers, including personal care aides, home health aides, and nursing assistants, who provide hands-on support with daily activities, like eating, bathing, dressing. Personal care aides also often assist consumers with instrumental activities of daily (IADLs), including housekeeping, meal preparation, medication management, shopping, and attending appointments. Home health aides and nursing assistants also perform certain nurse-delegated tasks, like taking blood pressure readings and assisting with range of motion exercises. While they formally fall into one of these three occupational categories, direct care workers are known by a range of other job titles in Michigan’s long-term care sector, including “resident aides,” “direct support staff,” and “home care specialists,” among others. Also, on the frontlines of long-term care are licensed nurses, including registered nurses and licensed practical nurses, whose responsibilities center on the clinical aspects of long-term care. Other members of the long-term care workforce include physicians, nurse practitioners, social workers, dieticians, as well as speech, physical, occupational, and respiratory therapists. (For detailed occupational definitions, see Appendix 2.) The long-term care industries described in this report are based on the following North American Industry Classification System (NAICS) definitions10:
• “Home Care” includes two long-term care industries: Home Health Care Services and Services for the Elderly and Persons with Disabilities. This report refers to direct care workers employed in the home care setting as “home care workers.”
• “Residential Care Homes” comprises two industries: Residential Intellectual and Developmental Disability Facilities and Continuing Care Retirement Communities and Assisted Living Facilities for the Elderly. Direct care workers employed in residential care are called “residential care aides” in this report.
• “Nursing Homes” refers to the Nursing Care Facilities (Skilled Nursing Homes) industry. Direct care workers employed in this industry are referred to in this report as “nursing assistants in nursing homes.”
For detailed industry definitions, see Appendix 3.
Qualitative Data and Methods Key Informant Interviews
PHI and Altarum conducted eight in-depth interviews during February 2020 with a range of long-term care providers, trade associations, and agencies that administer the state’s MI Choice Medicaid Waiver program (“waiver agencies”). The interview participants represented rural, suburban, and urban areas. Interview questions centered on LTSS workforce supply and demand, prevalence and impact of workforce shortages, and descriptions of training standards, models and gaps. Interviewees were also asked for their ideas about innovations and interventions to prepare Michigan to care for growing
10 U.S. Census Bureau. “North American Industry Classification System.” Last updated February 26, 2020. http://www.census.gov/eos/www/naics/. To note, these industry codes include some establishments outside the long-term care (such as foster homes, rehabilitation centers, and self-help organizations). However, because these ancillary settings employ few direct care workers and licensed professionals that are the subject of this report, their impact on the findings and conclusions are negligible.
10
numbers of older adults and people with disabilities. Interview data were used to corroborate and expand on the findings presented in Chapters 2, 3, and 4.
Listening Sessions and Individual Interviews Michigan United, with assistance from Altarum, conducted three listening sessions, one each in Kalamazoo, Grand Rapids and Detroit. Michigan United also conducted 10 interviews with individuals who live in Michigan’s Upper Peninsula. Participants in listening sessions and interviews were family caregivers, care recipients, and direct care workers. Themes from listening sessions and phone interviews are fully described in Chapter 5.
Conclusion Describing the challenges facing providers, the workforce, and people who use services is critical start to designing a better long-term care system in Michigan. To highlight the current state of Michigan’s LTSS workforce, PHI and Altarum employed a variety of methods to gather data and input and to create a picture of the workforce and of family caregiver experiences. The following chapters provide detail on these findings and ultimately lead to specific recommendations. These findings prepare Michigan to take action to assure Michigan can provide adequate, high-quality services to consumers in the setting of their choice.

11
Profile of Michigan’s Long-Term Workforce Michigan’s long-term care workforce provides essential supports and services to older adults and people with disabilities across a variety of settings. On the frontlines of care are unlicensed direct care workers, including personal care aides, home health aides, and nursing assistants, who provide hands-on support with daily activities. Also, on the frontlines are licensed nurses, including registered nurses and licensed practical nurses, whose responsibilities center on the clinical aspects of long-term care. Other members of the long-term care workforce include physicians, nurse practitioners and physician’s assistants, social workers, therapists, and dieticians. This chapter explores the size and distribution of Michigan’s long-term care workforce across occupations, settings, and geographic areas—focusing on unlicensed direct care workers in the first section and licensed professionals in the second. In addition to employment numbers, the first section also explores the demographic and economic characteristics of direct care workers. This additional attention on unlicensed frontline workers is due to their outsized role in long-term care and the unique challenges that they face. Together, these analyses provide a detailed portrait of the long-term care workforce in Michigan.
Profile of Michigan’s Direct Care Workforce This section offers a comprehensive overview of the direct care workforce across Michigan in terms of workforce size, demographic profile, and socioeconomic status. These three dimensions provide valuable insights when designing a long-term care financing system that best supports both workers and consumers.
Methods All employment and wage data for this analysis were sourced from the federal U.S. Bureau of Labor Statistics Occupational Employment Survey, which offers both statewide and regional data. All other analyses on workforce demographics and job quality drew from the U.S. Census Bureau’s American Community Survey 2013 to 2017 five-year dataset. Finally, insights from the in-depth interviews with key stakeholders in Michigan were used to corroborate or elaborate on the quantitative findings.
Michigan’s Large and Growing Direct Care Workforce In 2018, there were 116,080 direct care workers employed across all industries in Michigan, including 49,760 nursing assistants, 39,740 personal care aides, and 26,580 home health aides.11 Notably, this workforce has expanded and changed in composition over the last decade. From 2008 to 2018, the direct care workforce added nearly 20,000 new jobs in Michigan. Looking across the occupational groups, however, personal care aides added 25,740 jobs while the number of home health aides and nursing assistants fell by 5,130 and 640, respectively. While nursing assistants continue to outnumber home health aides and personal care aides, demand is rising the fastest for personal care aides.
11 U.S. Bureau of Labor Statistics (BLS), Division of Occupational Employment Statistics (OES). 2019. May 2008 to May 2018 State Occupational Employment and Wage Estimates. https://www.bls.gov/oes/home.htm; analysis by PHI (October 22, 2019).
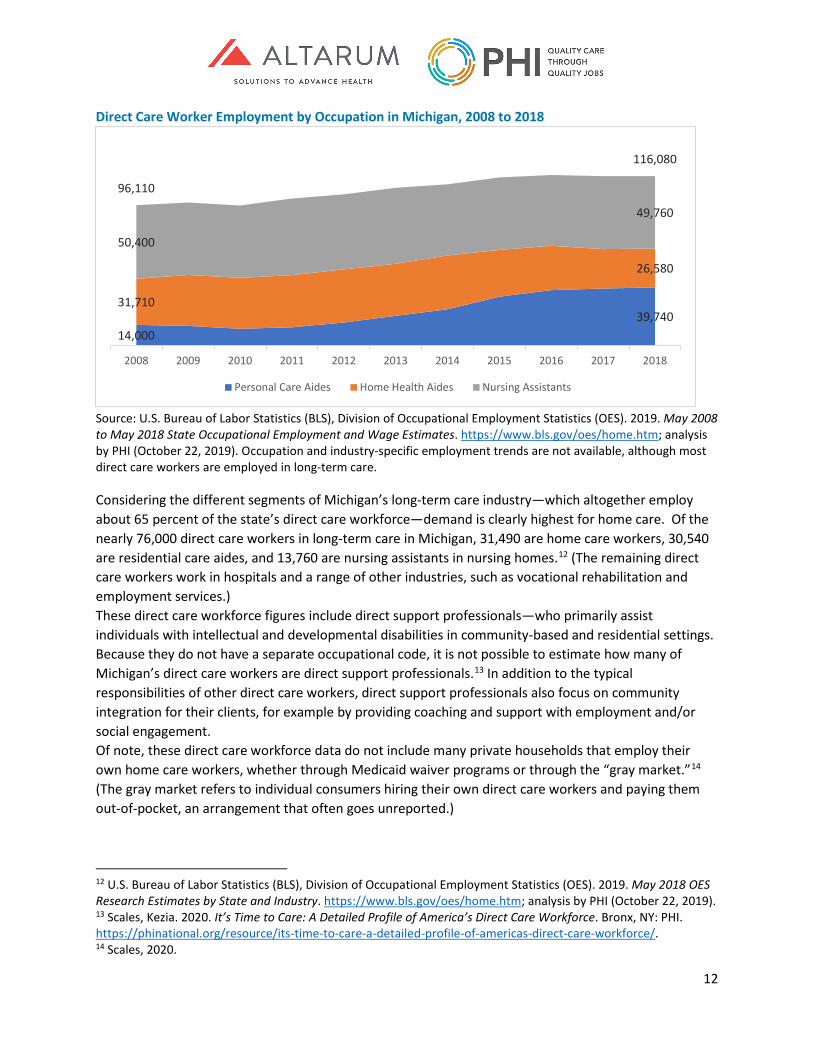
12
Direct Care Worker Employment by Occupation in Michigan, 2008 to 2018
Source: U.S. Bureau of Labor Statistics (BLS), Division of Occupational Employment Statistics (OES). 2019. May 2008 to May 2018 State Occupational Employment and Wage Estimates. https://www.bls.gov/oes/home.htm; analysis by PHI (October 22, 2019). Occupation and industry-specific employment trends are not available, although most direct care workers are employed in long-term care.
Considering the different segments of Michigan’s long-term care industry—which altogether employ about 65 percent of the state’s direct care workforce—demand is clearly highest for home care. Of the nearly 76,000 direct care workers in long-term care in Michigan, 31,490 are home care workers, 30,540 are residential care aides, and 13,760 are nursing assistants in nursing homes.12 (The remaining direct care workers work in hospitals and a range of other industries, such as vocational rehabilitation and employment services.) These direct care workforce figures include direct support professionals—who primarily assist individuals with intellectual and developmental disabilities in community-based and residential settings. Because they do not have a separate occupational code, it is not possible to estimate how many of Michigan’s direct care workers are direct support professionals.13 In addition to the typical responsibilities of other direct care workers, direct support professionals also focus on community integration for their clients, for example by providing coaching and support with employment and/or social engagement. Of note, these direct care workforce data do not include many private households that employ their own home care workers, whether through Medicaid waiver programs or through the “gray market.”14 (The gray market refers to individual consumers hiring their own direct care workers and paying them out-of-pocket, an arrangement that often goes unreported.)
12 U.S. Bureau of Labor Statistics (BLS), Division of Occupational Employment Statistics (OES). 2019. May 2018 OES Research Estimates by State and Industry. https://www.bls.gov/oes/home.htm; analysis by PHI (October 22, 2019). 13 Scales, Kezia. 2020. It’s Time to Care: A Detailed Profile of America’s Direct Care Workforce. Bronx, NY: PHI. https://phinational.org/resource/its-time-to-care-a-detailed-profile-of-americas-direct-care-workforce/. 14 Scales, 2020.
14,00039,740
31,710
26,580
50,400
49,760
96,110
116,080
2008 2009 2010 2011 2012 2013 2014 2015 2016 2017 2018
Personal Care Aides Home Health Aides Nursing Assistants
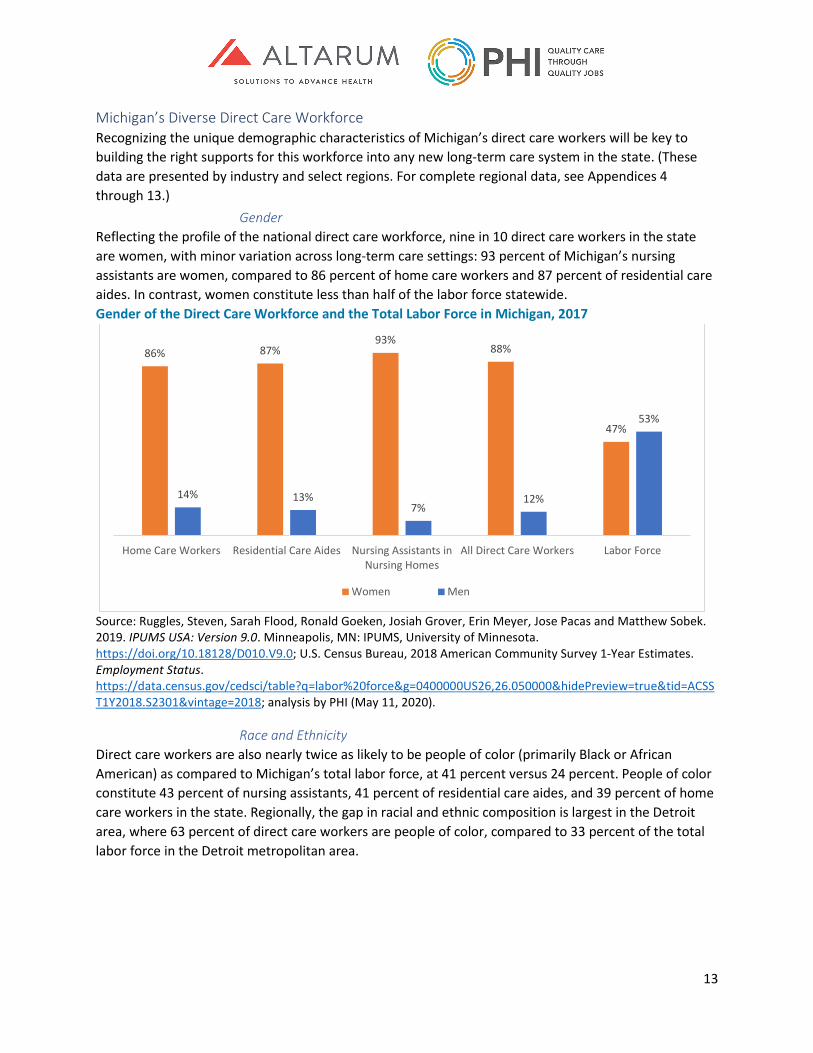
13
Michigan’s Diverse Direct Care Workforce Recognizing the unique demographic characteristics of Michigan’s direct care workers will be key to building the right supports for this workforce into any new long-term care system in the state. (These data are presented by industry and select regions. For complete regional data, see Appendices 4 through 13.)
Gender Reflecting the profile of the national direct care workforce, nine in 10 direct care workers in the state are women, with minor variation across long-term care settings: 93 percent of Michigan’s nursing assistants are women, compared to 86 percent of home care workers and 87 percent of residential care aides. In contrast, women constitute less than half of the labor force statewide. Gender of the Direct Care Workforce and the Total Labor Force in Michigan, 2017
Source: Ruggles, Steven, Sarah Flood, Ronald Goeken, Josiah Grover, Erin Meyer, Jose Pacas and Matthew Sobek. 2019. IPUMS USA: Version 9.0. Minneapolis, MN: IPUMS, University of Minnesota. https://doi.org/10.18128/D010.V9.0; U.S. Census Bureau, 2018 American Community Survey 1-Year Estimates. Employment Status. https://data.census.gov/cedsci/table?q=labor%20force&g=0400000US26,26.050000&hidePreview=true&tid=ACSST1Y2018.S2301&vintage=2018; analysis by PHI (May 11, 2020).
Race and Ethnicity Direct care workers are also nearly twice as likely to be people of color (primarily Black or African American) as compared to Michigan’s total labor force, at 41 percent versus 24 percent. People of color constitute 43 percent of nursing assistants, 41 percent of residential care aides, and 39 percent of home care workers in the state. Regionally, the gap in racial and ethnic composition is largest in the Detroit area, where 63 percent of direct care workers are people of color, compared to 33 percent of the total labor force in the Detroit metropolitan area.
86% 87%93%
88%
47%
14% 13%7%
12%
53%
Home Care Workers Residential Care Aides Nursing Assistants inNursing Homes
All Direct Care Workers Labor Force
Women Men
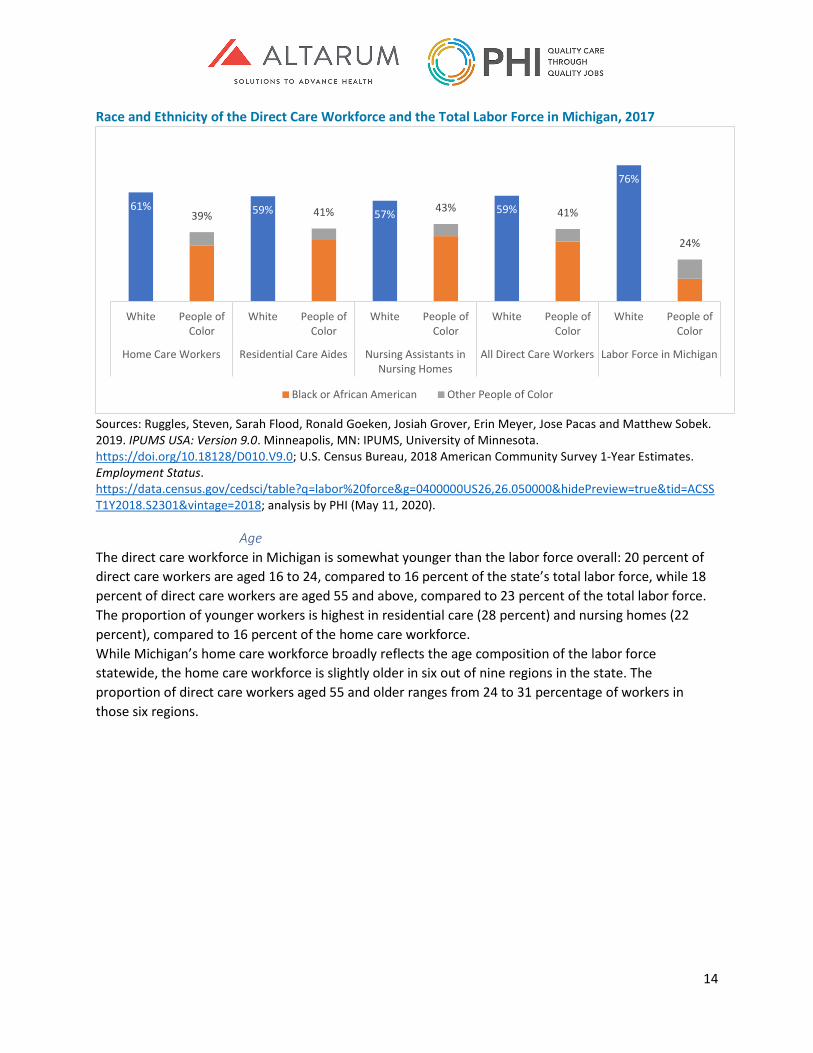
14
Race and Ethnicity of the Direct Care Workforce and the Total Labor Force in Michigan, 2017
Sources: Ruggles, Steven, Sarah Flood, Ronald Goeken, Josiah Grover, Erin Meyer, Jose Pacas and Matthew Sobek. 2019. IPUMS USA: Version 9.0. Minneapolis, MN: IPUMS, University of Minnesota. https://doi.org/10.18128/D010.V9.0; U.S. Census Bureau, 2018 American Community Survey 1-Year Estimates. Employment Status. https://data.census.gov/cedsci/table?q=labor%20force&g=0400000US26,26.050000&hidePreview=true&tid=ACSST1Y2018.S2301&vintage=2018; analysis by PHI (May 11, 2020).
Age The direct care workforce in Michigan is somewhat younger than the labor force overall: 20 percent of direct care workers are aged 16 to 24, compared to 16 percent of the state’s total labor force, while 18 percent of direct care workers are aged 55 and above, compared to 23 percent of the total labor force. The proportion of younger workers is highest in residential care (28 percent) and nursing homes (22 percent), compared to 16 percent of the home care workforce. While Michigan’s home care workforce broadly reflects the age composition of the labor force statewide, the home care workforce is slightly older in six out of nine regions in the state. The proportion of direct care workers aged 55 and older ranges from 24 to 31 percentage of workers in those six regions.
61% 59% 57% 59%
76%
39% 41% 43% 41%
24%
White People ofColor
White People ofColor
White People ofColor
White People ofColor
White People ofColor
Home Care Workers Residential Care Aides Nursing Assistants inNursing Homes
All Direct Care Workers Labor Force in Michigan
Black or African American Other People of Color
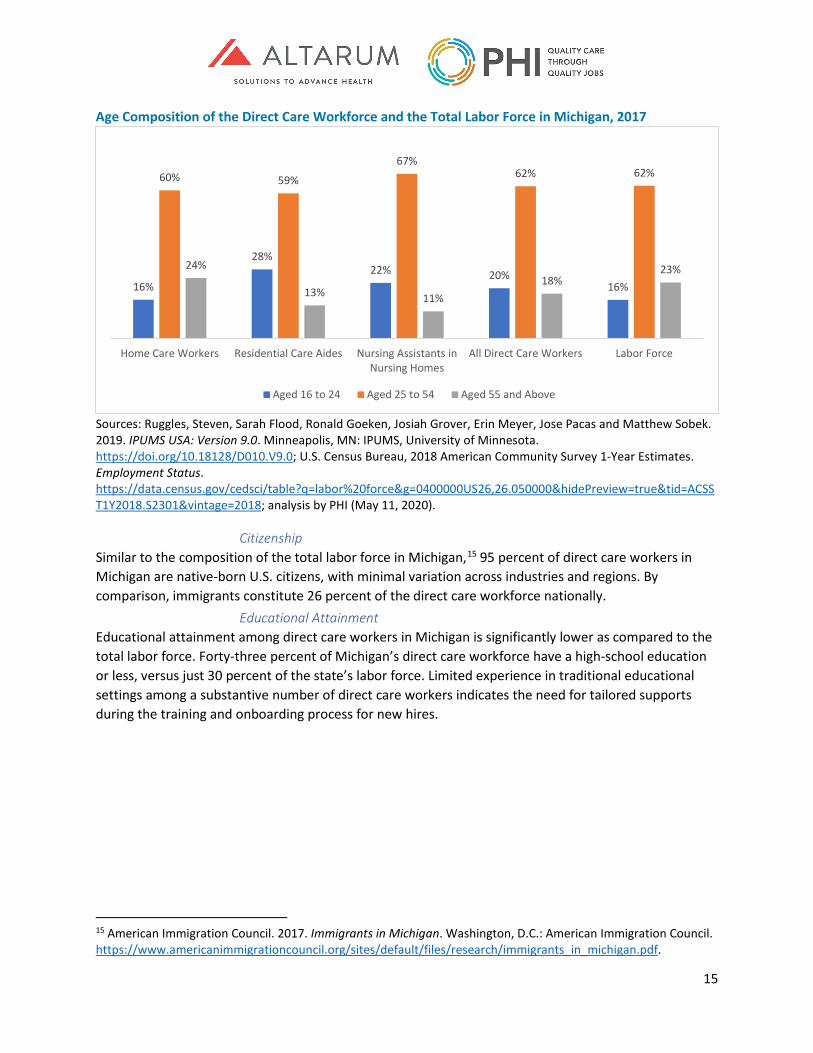
15
Age Composition of the Direct Care Workforce and the Total Labor Force in Michigan, 2017
Sources: Ruggles, Steven, Sarah Flood, Ronald Goeken, Josiah Grover, Erin Meyer, Jose Pacas and Matthew Sobek. 2019. IPUMS USA: Version 9.0. Minneapolis, MN: IPUMS, University of Minnesota. https://doi.org/10.18128/D010.V9.0; U.S. Census Bureau, 2018 American Community Survey 1-Year Estimates. Employment Status. https://data.census.gov/cedsci/table?q=labor%20force&g=0400000US26,26.050000&hidePreview=true&tid=ACSST1Y2018.S2301&vintage=2018; analysis by PHI (May 11, 2020).
Citizenship Similar to the composition of the total labor force in Michigan,15 95 percent of direct care workers in Michigan are native-born U.S. citizens, with minimal variation across industries and regions. By comparison, immigrants constitute 26 percent of the direct care workforce nationally.
Educational Attainment Educational attainment among direct care workers in Michigan is significantly lower as compared to the total labor force. Forty-three percent of Michigan’s direct care workforce have a high-school education or less, versus just 30 percent of the state’s labor force. Limited experience in traditional educational settings among a substantive number of direct care workers indicates the need for tailored supports during the training and onboarding process for new hires.
15 American Immigration Council. 2017. Immigrants in Michigan. Washington, D.C.: American Immigration Council. https://www.americanimmigrationcouncil.org/sites/default/files/research/immigrants_in_michigan.pdf.
16%
28%22% 20%
16%
60% 59%
67%62% 62%
24%
13% 11%18%
23%
Home Care Workers Residential Care Aides Nursing Assistants inNursing Homes
All Direct Care Workers Labor Force
Aged 16 to 24 Aged 25 to 54 Aged 55 and Above
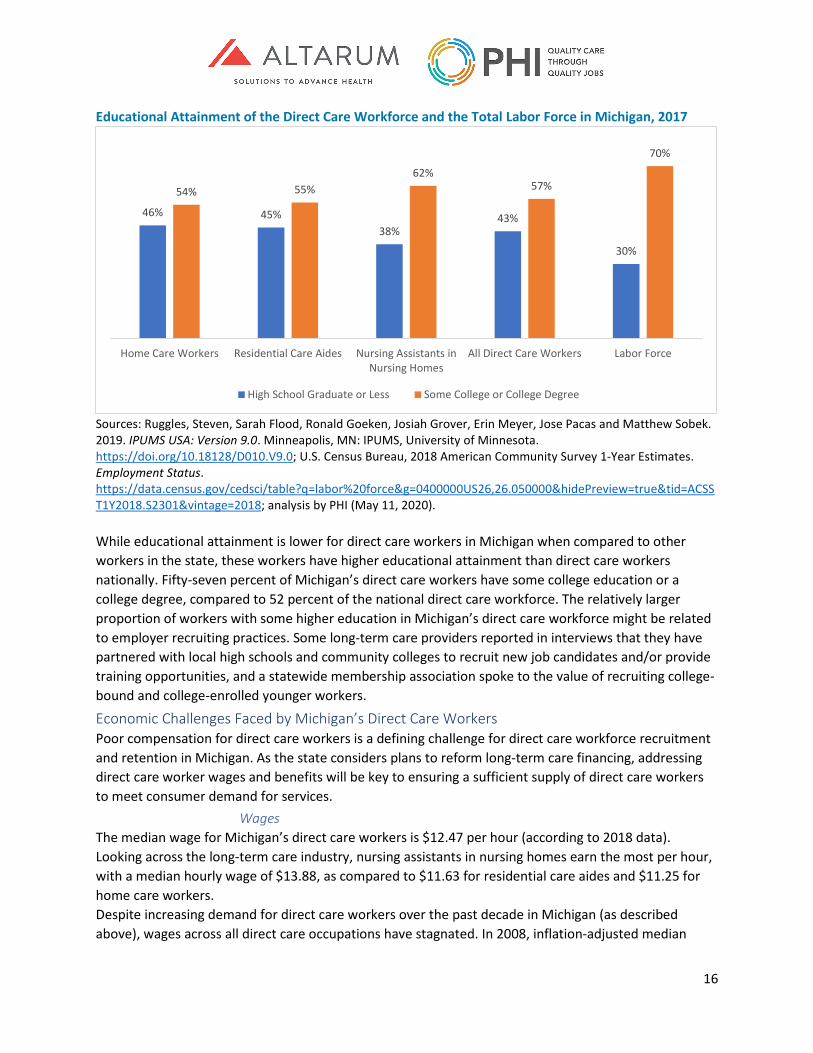
16
Educational Attainment of the Direct Care Workforce and the Total Labor Force in Michigan, 2017
Sources: Ruggles, Steven, Sarah Flood, Ronald Goeken, Josiah Grover, Erin Meyer, Jose Pacas and Matthew Sobek. 2019. IPUMS USA: Version 9.0. Minneapolis, MN: IPUMS, University of Minnesota. https://doi.org/10.18128/D010.V9.0; U.S. Census Bureau, 2018 American Community Survey 1-Year Estimates. Employment Status. https://data.census.gov/cedsci/table?q=labor%20force&g=0400000US26,26.050000&hidePreview=true&tid=ACSST1Y2018.S2301&vintage=2018; analysis by PHI (May 11, 2020). While educational attainment is lower for direct care workers in Michigan when compared to other workers in the state, these workers have higher educational attainment than direct care workers nationally. Fifty-seven percent of Michigan’s direct care workers have some college education or a college degree, compared to 52 percent of the national direct care workforce. The relatively larger proportion of workers with some higher education in Michigan’s direct care workforce might be related to employer recruiting practices. Some long-term care providers reported in interviews that they have partnered with local high schools and community colleges to recruit new job candidates and/or provide training opportunities, and a statewide membership association spoke to the value of recruiting college-bound and college-enrolled younger workers.
Economic Challenges Faced by Michigan’s Direct Care Workers Poor compensation for direct care workers is a defining challenge for direct care workforce recruitment and retention in Michigan. As the state considers plans to reform long-term care financing, addressing direct care worker wages and benefits will be key to ensuring a sufficient supply of direct care workers to meet consumer demand for services.
Wages The median wage for Michigan’s direct care workers is $12.47 per hour (according to 2018 data). Looking across the long-term care industry, nursing assistants in nursing homes earn the most per hour, with a median hourly wage of $13.88, as compared to $11.63 for residential care aides and $11.25 for home care workers. Despite increasing demand for direct care workers over the past decade in Michigan (as described above), wages across all direct care occupations have stagnated. In 2008, inflation-adjusted median
46% 45%38%
43%
30%
54% 55%62%
57%
70%
Home Care Workers Residential Care Aides Nursing Assistants inNursing Homes
All Direct Care Workers Labor Force
High School Graduate or Less Some College or College Degree
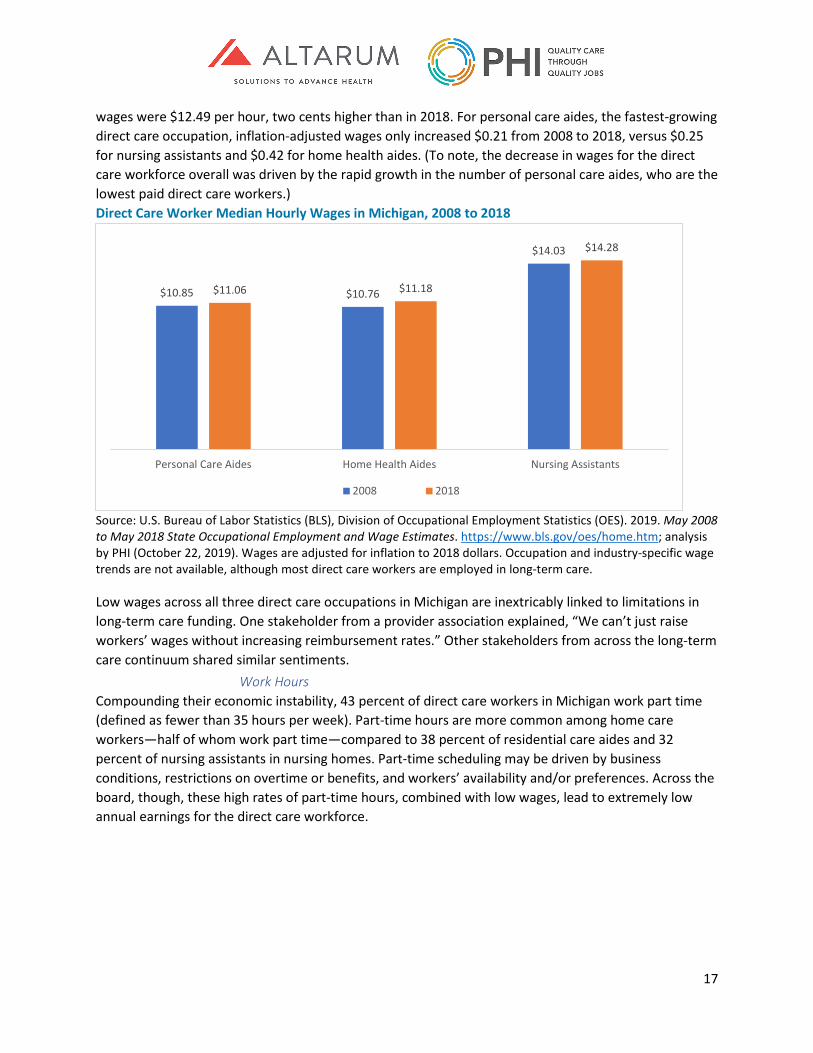
17
wages were $12.49 per hour, two cents higher than in 2018. For personal care aides, the fastest-growing direct care occupation, inflation-adjusted wages only increased $0.21 from 2008 to 2018, versus $0.25 for nursing assistants and $0.42 for home health aides. (To note, the decrease in wages for the direct care workforce overall was driven by the rapid growth in the number of personal care aides, who are the lowest paid direct care workers.) Direct Care Worker Median Hourly Wages in Michigan, 2008 to 2018
Source: U.S. Bureau of Labor Statistics (BLS), Division of Occupational Employment Statistics (OES). 2019. May 2008 to May 2018 State Occupational Employment and Wage Estimates. https://www.bls.gov/oes/home.htm; analysis by PHI (October 22, 2019). Wages are adjusted for inflation to 2018 dollars. Occupation and industry-specific wage trends are not available, although most direct care workers are employed in long-term care.
Low wages across all three direct care occupations in Michigan are inextricably linked to limitations in long-term care funding. One stakeholder from a provider association explained, “We can’t just raise workers’ wages without increasing reimbursement rates.” Other stakeholders from across the long-term care continuum shared similar sentiments.
Work Hours Compounding their economic instability, 43 percent of direct care workers in Michigan work part time (defined as fewer than 35 hours per week). Part-time hours are more common among home care workers—half of whom work part time—compared to 38 percent of residential care aides and 32 percent of nursing assistants in nursing homes. Part-time scheduling may be driven by business conditions, restrictions on overtime or benefits, and workers’ availability and/or preferences. Across the board, though, these high rates of part-time hours, combined with low wages, lead to extremely low annual earnings for the direct care workforce.
$10.85 $10.76
$14.03
$11.06 $11.18
$14.28
Personal Care Aides Home Health Aides Nursing Assistants
2008 2018

18
Employment Status of the Direct Care Workforce in Michigan, 2017
Source: Ruggles, Steven, Sarah Flood, Ronald Goeken, Josiah Grover, Erin Meyer, Jose Pacas and Matthew Sobek. 2019. IPUMS USA: Version 9.0. Minneapolis, MN: IPUMS, University of Minnesota. https://doi.org/10.18128/D010.V9.0; analysis by PHI (January 14, 2020).
Earnings
Statewide, Michigan’s direct care workers earn a median annual income of $16,600. Because of their lower wages and higher likelihood of part-time work, home care workers tend to earn the least, with a median annual income of $13,400. By comparison, residential care aides earn $17,200 and nursing assistants in nursing homes typically earn $21,200. Median annual earnings for all direct care workers are lowest in the Flint area, at $12,100, and highest in the Ann Arbor area, at $18,400. Direct Care Worker Median Annual Earnings in Michigan, 2017
Source: Ruggles, Steven, Sarah Flood, Ronald Goeken, Josiah Grover, Erin Meyer, Jose Pacas and Matthew Sobek. 2019. IPUMS USA: Version 9.0. Minneapolis, MN: IPUMS, University of Minnesota. https://doi.org/10.18128/D010.V9.0; analysis by PHI (January 14, 2020).
50%
62%66%
57%
50%
38%34%
43%
Home Care Workers Residential Care Aides Nursing Assistants in NursingHomes
All Direct Care Workers
Full-Time Part-Time
$13,400
$17,200
$21,200
$16,600
Home Care Workers
Residential Care Aides
Nursing Assistants in Nursing Homes
All Direct Care Workers
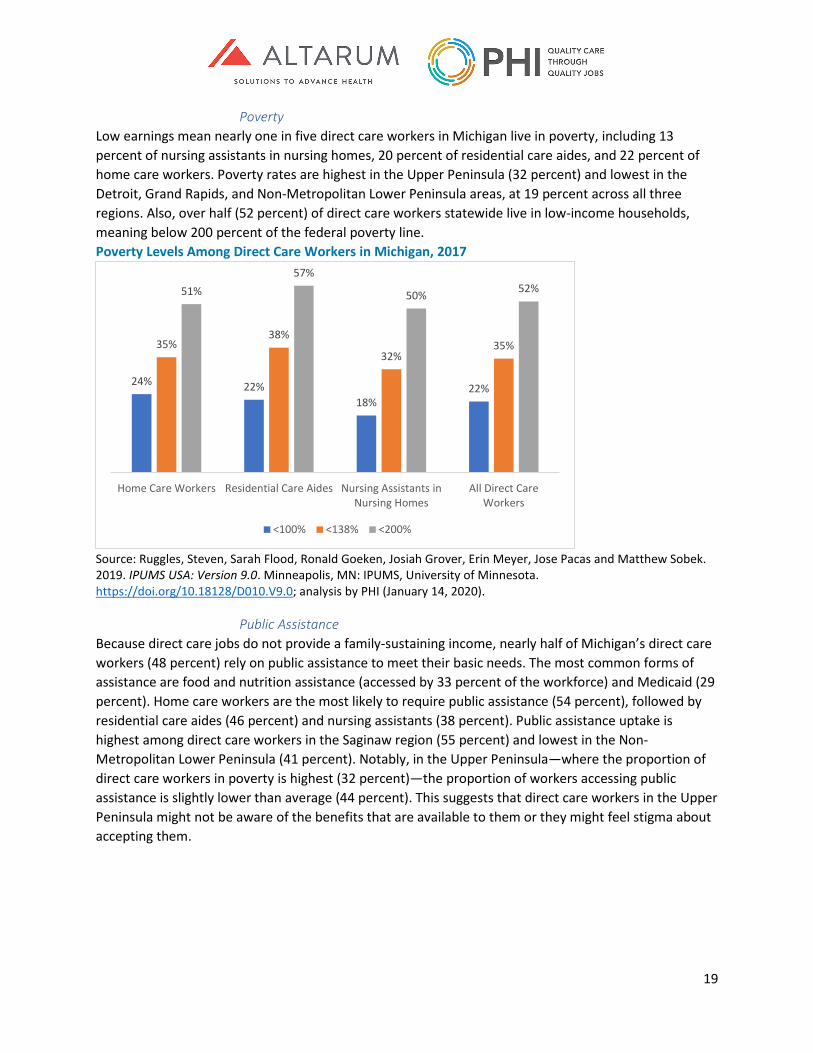
19
Poverty Low earnings mean nearly one in five direct care workers in Michigan live in poverty, including 13 percent of nursing assistants in nursing homes, 20 percent of residential care aides, and 22 percent of home care workers. Poverty rates are highest in the Upper Peninsula (32 percent) and lowest in the Detroit, Grand Rapids, and Non-Metropolitan Lower Peninsula areas, at 19 percent across all three regions. Also, over half (52 percent) of direct care workers statewide live in low-income households, meaning below 200 percent of the federal poverty line. Poverty Levels Among Direct Care Workers in Michigan, 2017
Source: Ruggles, Steven, Sarah Flood, Ronald Goeken, Josiah Grover, Erin Meyer, Jose Pacas and Matthew Sobek. 2019. IPUMS USA: Version 9.0. Minneapolis, MN: IPUMS, University of Minnesota. https://doi.org/10.18128/D010.V9.0; analysis by PHI (January 14, 2020).
Public Assistance Because direct care jobs do not provide a family-sustaining income, nearly half of Michigan’s direct care workers (48 percent) rely on public assistance to meet their basic needs. The most common forms of assistance are food and nutrition assistance (accessed by 33 percent of the workforce) and Medicaid (29 percent). Home care workers are the most likely to require public assistance (54 percent), followed by residential care aides (46 percent) and nursing assistants (38 percent). Public assistance uptake is highest among direct care workers in the Saginaw region (55 percent) and lowest in the Non-Metropolitan Lower Peninsula (41 percent). Notably, in the Upper Peninsula—where the proportion of direct care workers in poverty is highest (32 percent)—the proportion of workers accessing public assistance is slightly lower than average (44 percent). This suggests that direct care workers in the Upper Peninsula might not be aware of the benefits that are available to them or they might feel stigma about accepting them.
24% 22%18%
22%
35%38%
32%35%
51%57%
50% 52%
Home Care Workers Residential Care Aides Nursing Assistants inNursing Homes
All Direct CareWorkers
<100% <138% <200%
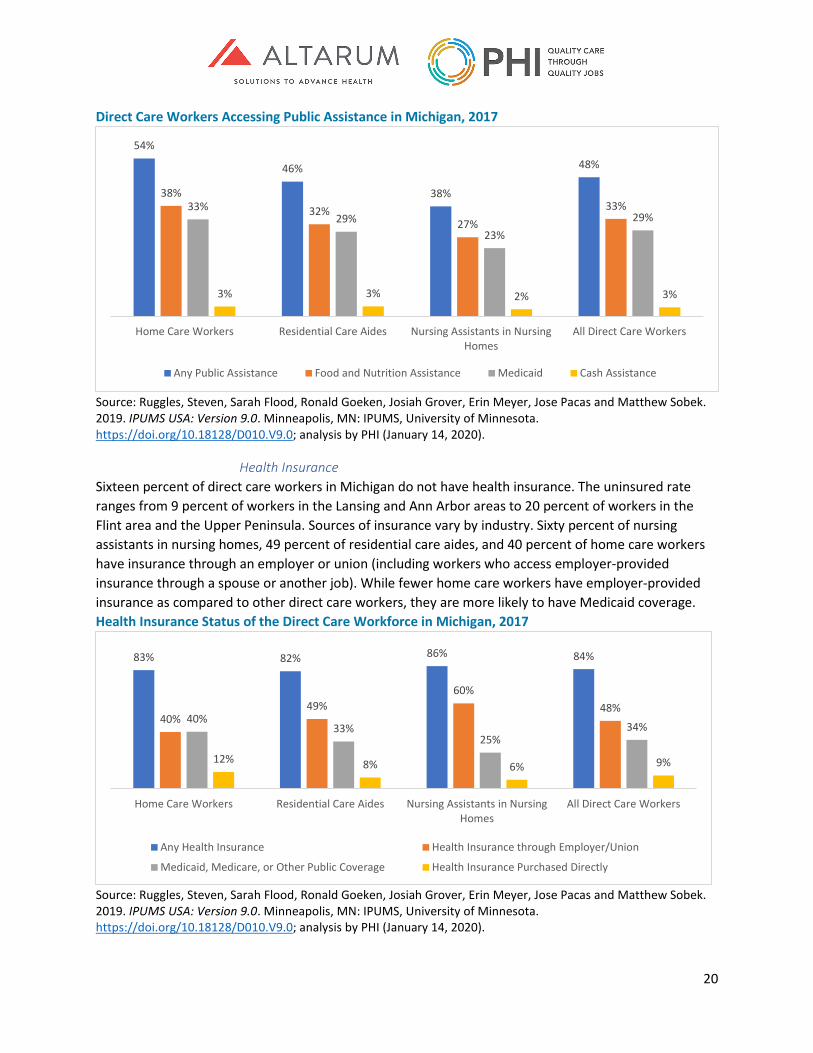
20
Direct Care Workers Accessing Public Assistance in Michigan, 2017
Source: Ruggles, Steven, Sarah Flood, Ronald Goeken, Josiah Grover, Erin Meyer, Jose Pacas and Matthew Sobek. 2019. IPUMS USA: Version 9.0. Minneapolis, MN: IPUMS, University of Minnesota. https://doi.org/10.18128/D010.V9.0; analysis by PHI (January 14, 2020).
Health Insurance Sixteen percent of direct care workers in Michigan do not have health insurance. The uninsured rate ranges from 9 percent of workers in the Lansing and Ann Arbor areas to 20 percent of workers in the Flint area and the Upper Peninsula. Sources of insurance vary by industry. Sixty percent of nursing assistants in nursing homes, 49 percent of residential care aides, and 40 percent of home care workers have insurance through an employer or union (including workers who access employer-provided insurance through a spouse or another job). While fewer home care workers have employer-provided insurance as compared to other direct care workers, they are more likely to have Medicaid coverage. Health Insurance Status of the Direct Care Workforce in Michigan, 2017
Source: Ruggles, Steven, Sarah Flood, Ronald Goeken, Josiah Grover, Erin Meyer, Jose Pacas and Matthew Sobek. 2019. IPUMS USA: Version 9.0. Minneapolis, MN: IPUMS, University of Minnesota. https://doi.org/10.18128/D010.V9.0; analysis by PHI (January 14, 2020).
54%
46%
38%
48%
38%32%
27%33%33%
29%23%
29%
3% 3% 2% 3%
Home Care Workers Residential Care Aides Nursing Assistants in NursingHomes
All Direct Care Workers
Any Public Assistance Food and Nutrition Assistance Medicaid Cash Assistance
83% 82% 86% 84%
40%49%
60%48%
40%33%
25%34%
12% 8% 6% 9%
Home Care Workers Residential Care Aides Nursing Assistants in NursingHomes
All Direct Care Workers
Any Health Insurance Health Insurance through Employer/Union
Medicaid, Medicare, or Other Public Coverage Health Insurance Purchased Directly
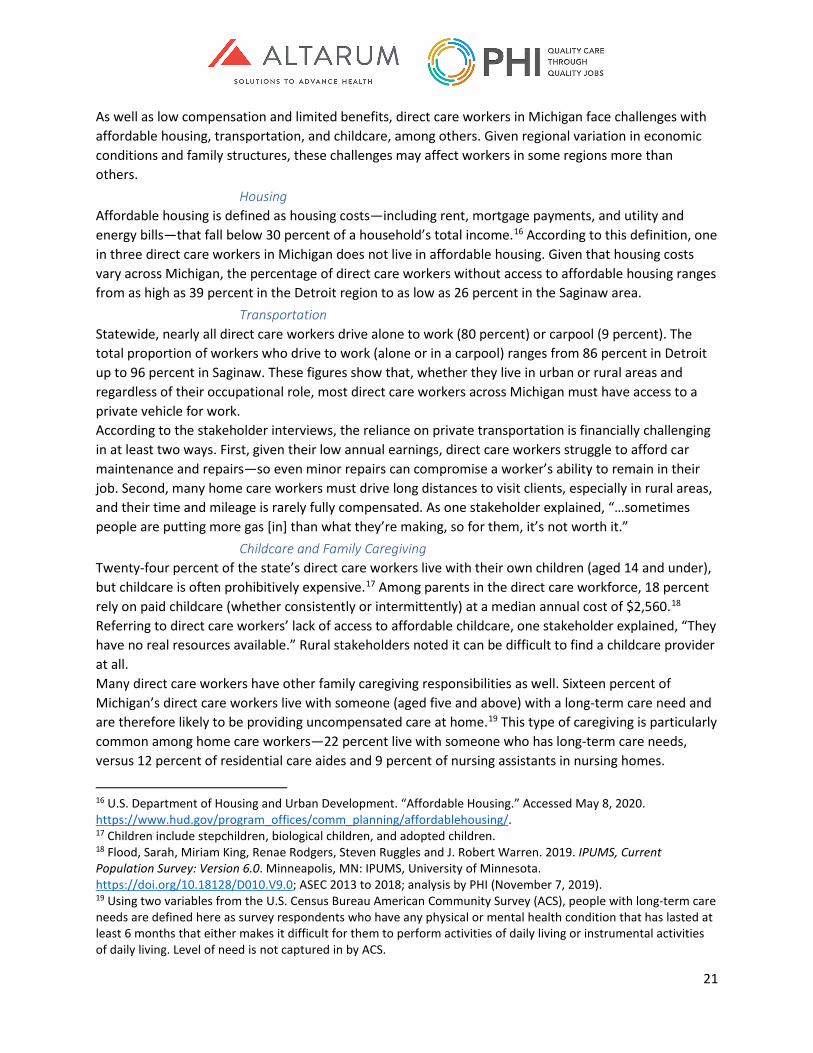
21
As well as low compensation and limited benefits, direct care workers in Michigan face challenges with affordable housing, transportation, and childcare, among others. Given regional variation in economic conditions and family structures, these challenges may affect workers in some regions more than others.
Housing Affordable housing is defined as housing costs—including rent, mortgage payments, and utility and energy bills—that fall below 30 percent of a household’s total income.16 According to this definition, one in three direct care workers in Michigan does not live in affordable housing. Given that housing costs vary across Michigan, the percentage of direct care workers without access to affordable housing ranges from as high as 39 percent in the Detroit region to as low as 26 percent in the Saginaw area.
Transportation Statewide, nearly all direct care workers drive alone to work (80 percent) or carpool (9 percent). The total proportion of workers who drive to work (alone or in a carpool) ranges from 86 percent in Detroit up to 96 percent in Saginaw. These figures show that, whether they live in urban or rural areas and regardless of their occupational role, most direct care workers across Michigan must have access to a private vehicle for work. According to the stakeholder interviews, the reliance on private transportation is financially challenging in at least two ways. First, given their low annual earnings, direct care workers struggle to afford car maintenance and repairs—so even minor repairs can compromise a worker’s ability to remain in their job. Second, many home care workers must drive long distances to visit clients, especially in rural areas, and their time and mileage is rarely fully compensated. As one stakeholder explained, “…sometimes people are putting more gas [in] than what they’re making, so for them, it’s not worth it.”
Childcare and Family Caregiving Twenty-four percent of the state’s direct care workers live with their own children (aged 14 and under), but childcare is often prohibitively expensive.17 Among parents in the direct care workforce, 18 percent rely on paid childcare (whether consistently or intermittently) at a median annual cost of $2,560.18 Referring to direct care workers’ lack of access to affordable childcare, one stakeholder explained, “They have no real resources available.” Rural stakeholders noted it can be difficult to find a childcare provider at all. Many direct care workers have other family caregiving responsibilities as well. Sixteen percent of Michigan’s direct care workers live with someone (aged five and above) with a long-term care need and are therefore likely to be providing uncompensated care at home.19 This type of caregiving is particularly common among home care workers—22 percent live with someone who has long-term care needs, versus 12 percent of residential care aides and 9 percent of nursing assistants in nursing homes.
16 U.S. Department of Housing and Urban Development. “Affordable Housing.” Accessed May 8, 2020. https://www.hud.gov/program_offices/comm_planning/affordablehousing/. 17 Children include stepchildren, biological children, and adopted children. 18 Flood, Sarah, Miriam King, Renae Rodgers, Steven Ruggles and J. Robert Warren. 2019. IPUMS, Current Population Survey: Version 6.0. Minneapolis, MN: IPUMS, University of Minnesota. https://doi.org/10.18128/D010.V9.0; ASEC 2013 to 2018; analysis by PHI (November 7, 2019). 19 Using two variables from the U.S. Census Bureau American Community Survey (ACS), people with long-term care needs are defined here as survey respondents who have any physical or mental health condition that has lasted at least 6 months that either makes it difficult for them to perform activities of daily living or instrumental activities of daily living. Level of need is not captured in by ACS.
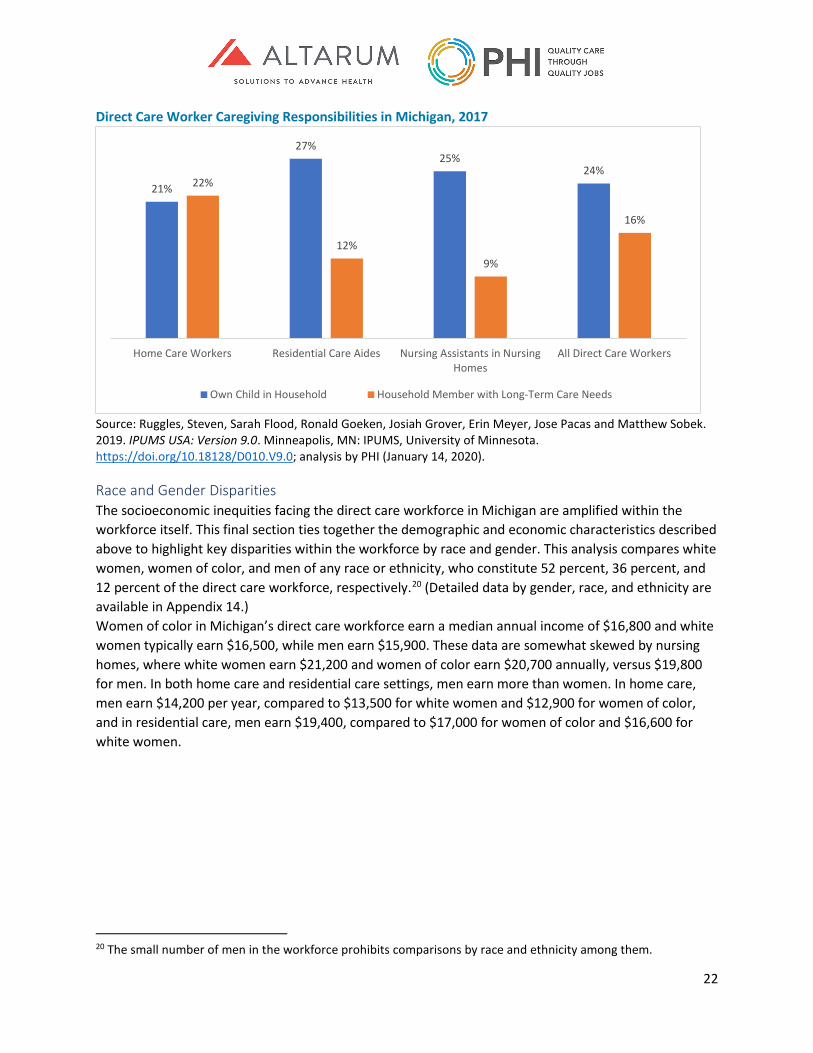
22
Direct Care Worker Caregiving Responsibilities in Michigan, 2017
Source: Ruggles, Steven, Sarah Flood, Ronald Goeken, Josiah Grover, Erin Meyer, Jose Pacas and Matthew Sobek. 2019. IPUMS USA: Version 9.0. Minneapolis, MN: IPUMS, University of Minnesota. https://doi.org/10.18128/D010.V9.0; analysis by PHI (January 14, 2020).
Race and Gender Disparities The socioeconomic inequities facing the direct care workforce in Michigan are amplified within the workforce itself. This final section ties together the demographic and economic characteristics described above to highlight key disparities within the workforce by race and gender. This analysis compares white women, women of color, and men of any race or ethnicity, who constitute 52 percent, 36 percent, and 12 percent of the direct care workforce, respectively.20 (Detailed data by gender, race, and ethnicity are available in Appendix 14.) Women of color in Michigan’s direct care workforce earn a median annual income of $16,800 and white women typically earn $16,500, while men earn $15,900. These data are somewhat skewed by nursing homes, where white women earn $21,200 and women of color earn $20,700 annually, versus $19,800 for men. In both home care and residential care settings, men earn more than women. In home care, men earn $14,200 per year, compared to $13,500 for white women and $12,900 for women of color, and in residential care, men earn $19,400, compared to $17,000 for women of color and $16,600 for white women.
20 The small number of men in the workforce prohibits comparisons by race and ethnicity among them.
21%
27%25%
24%22%
12%9%
16%
Home Care Workers Residential Care Aides Nursing Assistants in NursingHomes
All Direct Care Workers
Own Child in Household Household Member with Long-Term Care Needs
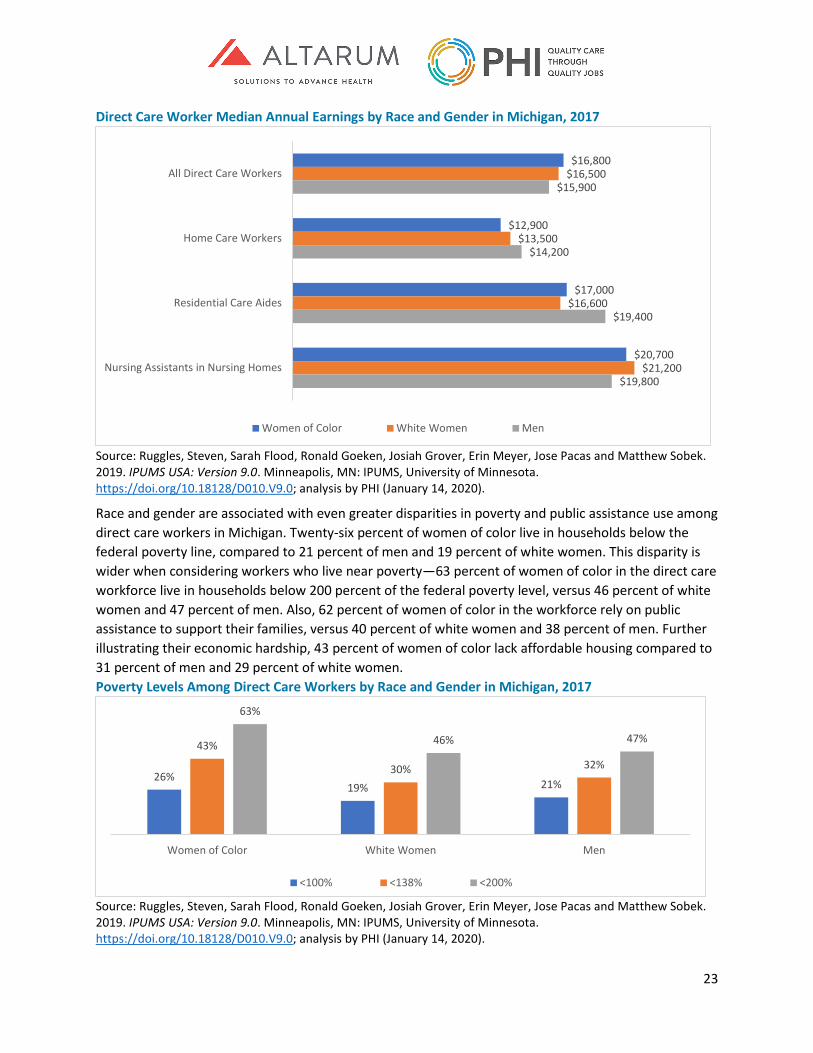
23
Direct Care Worker Median Annual Earnings by Race and Gender in Michigan, 2017
Source: Ruggles, Steven, Sarah Flood, Ronald Goeken, Josiah Grover, Erin Meyer, Jose Pacas and Matthew Sobek. 2019. IPUMS USA: Version 9.0. Minneapolis, MN: IPUMS, University of Minnesota. https://doi.org/10.18128/D010.V9.0; analysis by PHI (January 14, 2020).
Race and gender are associated with even greater disparities in poverty and public assistance use among direct care workers in Michigan. Twenty-six percent of women of color live in households below the federal poverty line, compared to 21 percent of men and 19 percent of white women. This disparity is wider when considering workers who live near poverty—63 percent of women of color in the direct care workforce live in households below 200 percent of the federal poverty level, versus 46 percent of white women and 47 percent of men. Also, 62 percent of women of color in the workforce rely on public assistance to support their families, versus 40 percent of white women and 38 percent of men. Further illustrating their economic hardship, 43 percent of women of color lack affordable housing compared to 31 percent of men and 29 percent of white women. Poverty Levels Among Direct Care Workers by Race and Gender in Michigan, 2017
Source: Ruggles, Steven, Sarah Flood, Ronald Goeken, Josiah Grover, Erin Meyer, Jose Pacas and Matthew Sobek. 2019. IPUMS USA: Version 9.0. Minneapolis, MN: IPUMS, University of Minnesota. https://doi.org/10.18128/D010.V9.0; analysis by PHI (January 14, 2020).
$16,800
$12,900
$17,000
$20,700
$16,500
$13,500
$16,600
$21,200
$15,900
$14,200
$19,400
$19,800
All Direct Care Workers
Home Care Workers
Residential Care Aides
Nursing Assistants in Nursing Homes
Women of Color White Women Men
26%19% 21%
43%
30% 32%
63%
46% 47%
Women of Color White Women Men
<100% <138% <200%
24
Finally, women in the direct care workforce are more likely than men to have health insurance—at 86 percent of white women and 84 percent of women of color, compared to 76 percent of men. However, women are much more likely to be covered by Medicaid (43 percent of women of color and 31 percent of white women) than men (23 percent), which may relate to both poverty levels and health care utilization patterns.21
Summary of Findings on the Profile of the Direct Care Workforce Even though Michigan’s direct care workforce grew from 96,110 in 2008 to 116,080 in 2018, wages have not kept up, especially for personal care aides—the lowest-paid, highest-demand segment of the direct care workforce. Across long-term care settings, low wages and earnings mean that many direct care workers live in poverty and rely on public assistance to get by. As well as wages and compensation, the unique demographic profile of the direct care workforce in Michigan is another key consideration in recruiting and retaining these workers. Compared to the overall labor force in Michigan, direct care workers are more likely to be women, young workers, and people of color, and they often have lower educational attainment. For some of these groups, demographics are linked to job quality—within the direct care workforce, economic conditions are generally worse for women, and especially women of color, as compared to men—and these populations might require tailored workforce supports to be successful in their roles. High-quality long-term care depends on a strong direct care workforce, so job quality improvements must be considered in efforts to revise Michigan’s long-term care financing system. The findings presented here clearly indicate that Michigan’s direct care workforce would benefit from improved compensation, as well as interventions focused on affordable health insurance, housing, transportation, and childcare, among others—with special attention to the unique needs of younger people, women, and people of color.
21 Gunja, Munira, Sara Collins, Michelle Doty, and Sophie Beutel. 2017. How the Affordable Care Act Has Helped Women Gain Insurance and Improved Their Ability to Get Health Care. Washington, D.C.: The Commonwealth Fund. https://www.commonwealthfund.org/publications/issue-briefs/2017/aug/how-affordable-care-act-has-helped-women-gain-insurance-and.
25
Profile of Michigan’s Licensed Long-Term Care Workers In addition to direct care workers, several health professions with more formal training and licensure play an important role in providing long term services and supports. Registered nurses (RNs) and licensed practical nurses (LPNs) are the core of the licensed long-term care workforce. RNs provide daily patient care and play an important supervisory role overseeing and coordinating the care provided by LPNs and other licensed and direct care workers, especially in nursing homes and home care. Minimum RN staffing levels are mandated by the state in some settings. LPNs provide much of the daily patient care in nursing homes, which is the predominant LPN employment setting. Social workers provide counseling and assistance to patients in all long-term care settings, especially home care. Therapists, including physical, occupational, and respiratory therapists as well as speech pathologists, work with patients to recover and maintain function in both residential and home settings, while dieticians/nutritionists oversee patient dietary needs, especially in nursing homes.22 For these professions, this section examines national and state-level data on employment by occupation and industry to provide a benchmark profile of the licensed long-term care workforce in Michigan. It also compares wages in long-term care against wages in other health care settings for these professions in Michigan. While not providers of long-term care services, primary care physicians (including family medicine, internal medicine, and pediatrics) are involved in the care of patients receiving long-term care through provision of scheduled on-site medical care, coordination with home or facility staff on patient health conditions, or oversight of nursing home care as chief medical officers. Because of these important roles in the care of patients receiving long-term services, we also provide information on the supply of primary care physicians, and specifically geriatricians, in Michigan. Methods Like the previous section on direct care workers, all employment and wage data for licensed professionals in this analysis were from the U.S. Bureau of Labor Statistics Occupational Employment Statistics survey, which offers statewide data on workers by both occupation and industry. Counts and per capita ratios of primary care physicians in Michigan and the U.S. were from United Health Foundation’s America’s Health Rankings, and similar measures for geriatricians were from the American Geriatrics Society. Insights from the in-depth interviews with key stakeholders in Michigan were used to corroborate or elaborate on the quantitative findings. Licensed Health Care Workers in Long-Term Care in Michigan Nearly 30,000 licensed health care professionals work in long-term care settings in Michigan (29,780 total jobs). Just under half (47 percent) work in home care. Another 39 percent work in nursing homes, and 14 percent in other residential care settings.
22 While our focus is on workers providing patient care, nursing home administrators are also a licensed occupation. The Michigan Department of Licensing and Regulatory Affairs (LARA) reports 1,204 active nursing home administrator licenses in the state as of June 2020.
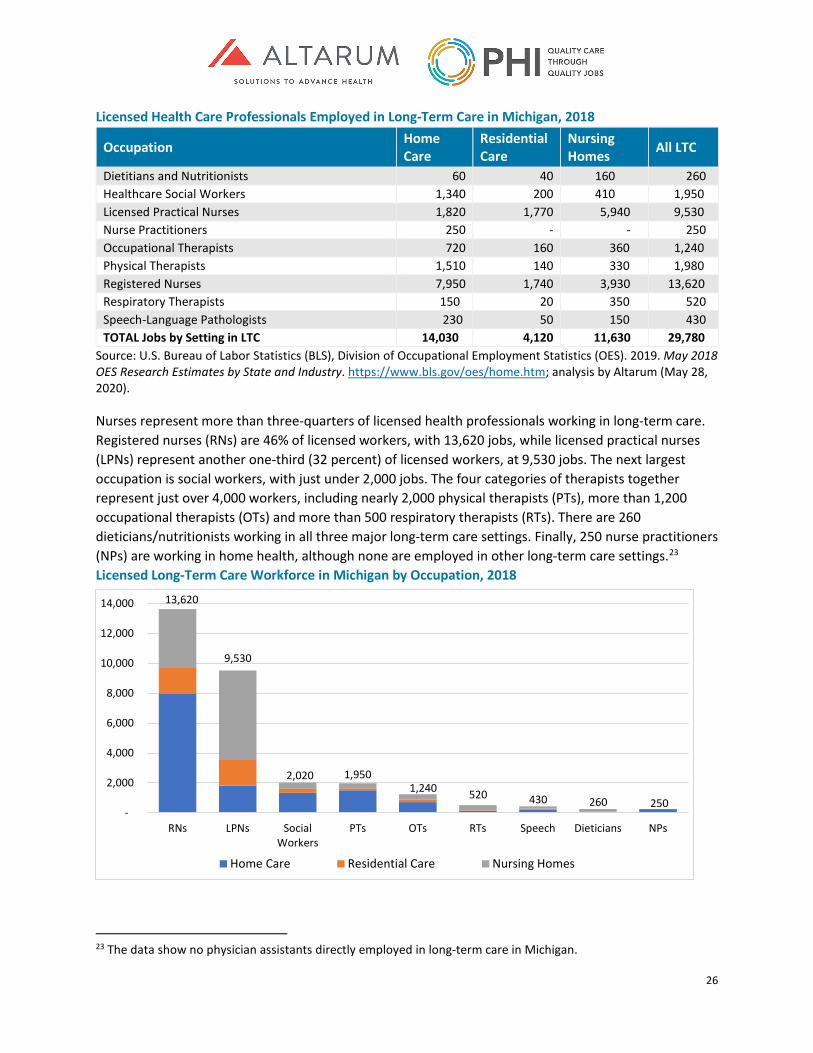
26
Licensed Health Care Professionals Employed in Long-Term Care in Michigan, 2018
Occupation Home Care
Residential Care
Nursing Homes All LTC
Dietitians and Nutritionists 60 40 160 260 Healthcare Social Workers 1,340 200 410 1,950 Licensed Practical Nurses 1,820 1,770 5,940 9,530 Nurse Practitioners 250 - - 250 Occupational Therapists 720 160 360 1,240 Physical Therapists 1,510 140 330 1,980 Registered Nurses 7,950 1,740 3,930 13,620 Respiratory Therapists 150 20 350 520 Speech-Language Pathologists 230 50 150 430 TOTAL Jobs by Setting in LTC 14,030 4,120 11,630 29,780
Source: U.S. Bureau of Labor Statistics (BLS), Division of Occupational Employment Statistics (OES). 2019. May 2018 OES Research Estimates by State and Industry. https://www.bls.gov/oes/home.htm; analysis by Altarum (May 28, 2020).
Nurses represent more than three-quarters of licensed health professionals working in long-term care. Registered nurses (RNs) are 46% of licensed workers, with 13,620 jobs, while licensed practical nurses (LPNs) represent another one-third (32 percent) of licensed workers, at 9,530 jobs. The next largest occupation is social workers, with just under 2,000 jobs. The four categories of therapists together represent just over 4,000 workers, including nearly 2,000 physical therapists (PTs), more than 1,200 occupational therapists (OTs) and more than 500 respiratory therapists (RTs). There are 260 dieticians/nutritionists working in all three major long-term care settings. Finally, 250 nurse practitioners (NPs) are working in home health, although none are employed in other long-term care settings.23 Licensed Long-Term Care Workforce in Michigan by Occupation, 2018
23 The data show no physician assistants directly employed in long-term care in Michigan.
13,620
9,530
2,020 1,9501,240 520 430 260 250
-
2,000
4,000
6,000
8,000
10,000
12,000
14,000
RNs LPNs SocialWorkers
PTs OTs RTs Speech Dieticians NPs
Home Care Residential Care Nursing Homes
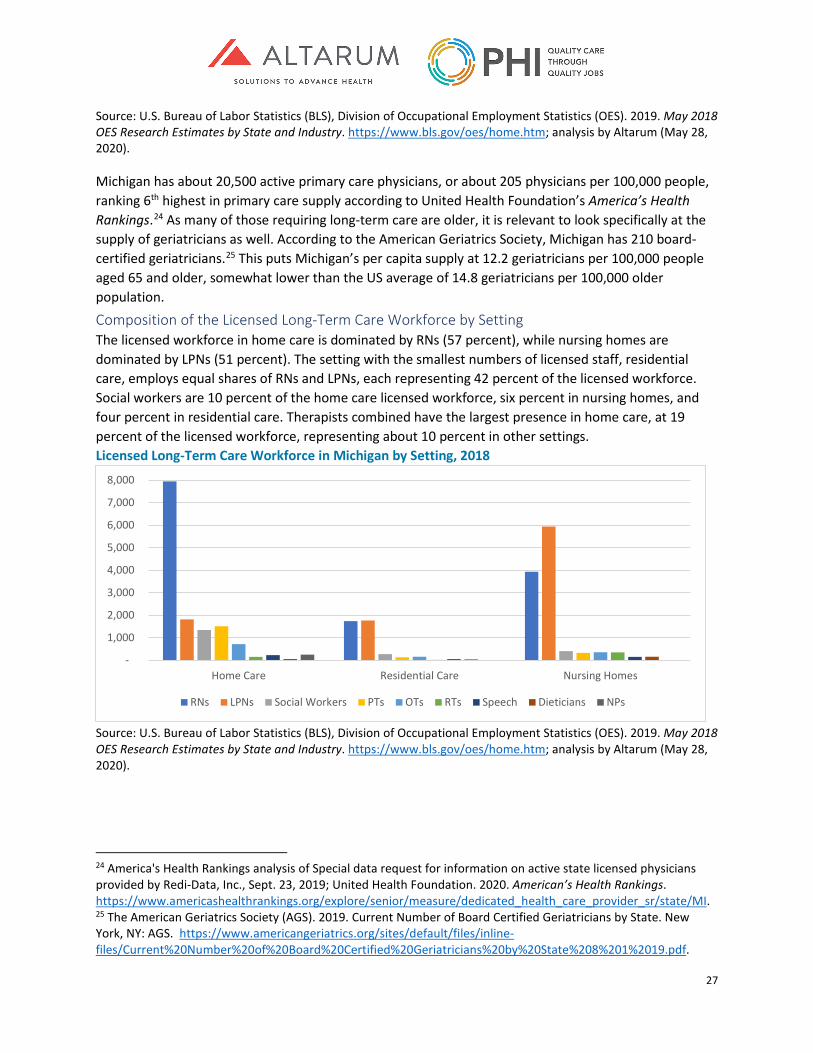
27
Source: U.S. Bureau of Labor Statistics (BLS), Division of Occupational Employment Statistics (OES). 2019. May 2018 OES Research Estimates by State and Industry. https://www.bls.gov/oes/home.htm; analysis by Altarum (May 28, 2020).
Michigan has about 20,500 active primary care physicians, or about 205 physicians per 100,000 people, ranking 6th highest in primary care supply according to United Health Foundation’s America’s Health Rankings.24 As many of those requiring long-term care are older, it is relevant to look specifically at the supply of geriatricians as well. According to the American Geriatrics Society, Michigan has 210 board-certified geriatricians.25 This puts Michigan’s per capita supply at 12.2 geriatricians per 100,000 people aged 65 and older, somewhat lower than the US average of 14.8 geriatricians per 100,000 older population. Composition of the Licensed Long-Term Care Workforce by Setting The licensed workforce in home care is dominated by RNs (57 percent), while nursing homes are dominated by LPNs (51 percent). The setting with the smallest numbers of licensed staff, residential care, employs equal shares of RNs and LPNs, each representing 42 percent of the licensed workforce. Social workers are 10 percent of the home care licensed workforce, six percent in nursing homes, and four percent in residential care. Therapists combined have the largest presence in home care, at 19 percent of the licensed workforce, representing about 10 percent in other settings. Licensed Long-Term Care Workforce in Michigan by Setting, 2018
Source: U.S. Bureau of Labor Statistics (BLS), Division of Occupational Employment Statistics (OES). 2019. May 2018 OES Research Estimates by State and Industry. https://www.bls.gov/oes/home.htm; analysis by Altarum (May 28, 2020).
24 America's Health Rankings analysis of Special data request for information on active state licensed physicians provided by Redi-Data, Inc., Sept. 23, 2019; United Health Foundation. 2020. American’s Health Rankings. https://www.americashealthrankings.org/explore/senior/measure/dedicated_health_care_provider_sr/state/MI. 25 The American Geriatrics Society (AGS). 2019. Current Number of Board Certified Geriatricians by State. New York, NY: AGS. https://www.americangeriatrics.org/sites/default/files/inline-files/Current%20Number%20of%20Board%20Certified%20Geriatricians%20by%20State%208%201%2019.pdf.
-
1,000
2,000
3,000
4,000
5,000
6,000
7,000
8,000
Home Care Residential Care Nursing Homes
RNs LPNs Social Workers PTs OTs RTs Speech Dieticians NPs
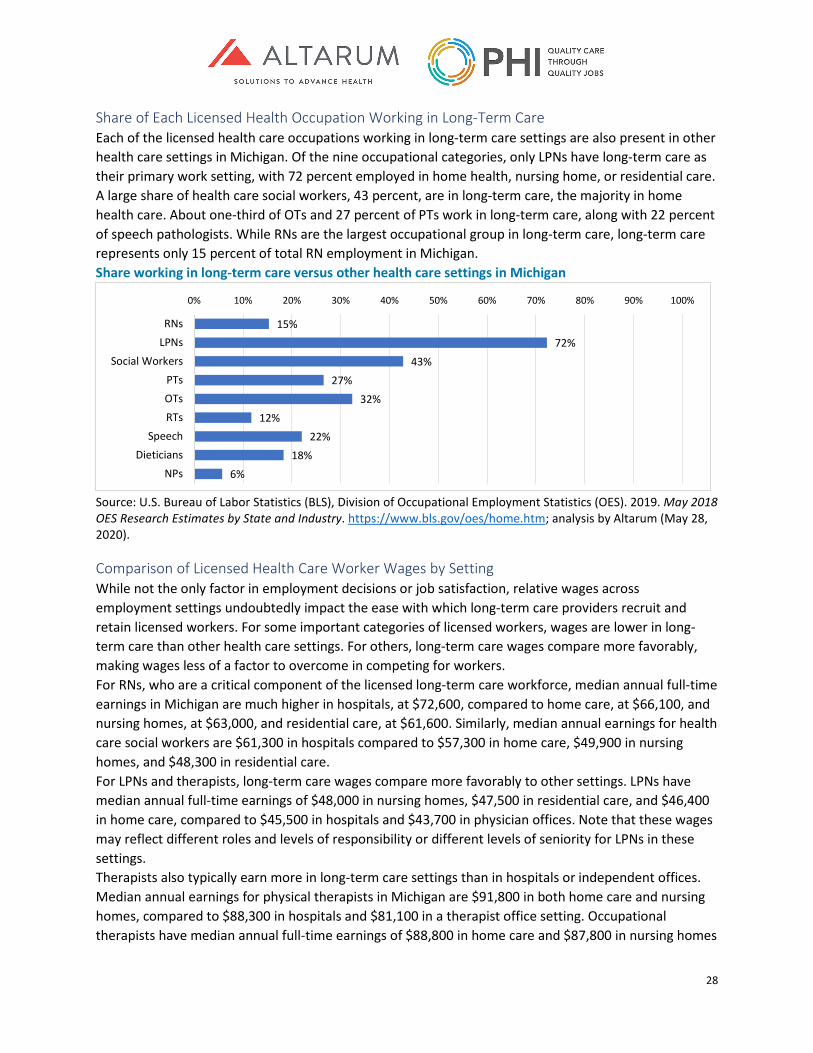
28
Share of Each Licensed Health Occupation Working in Long-Term Care Each of the licensed health care occupations working in long-term care settings are also present in other health care settings in Michigan. Of the nine occupational categories, only LPNs have long-term care as their primary work setting, with 72 percent employed in home health, nursing home, or residential care. A large share of health care social workers, 43 percent, are in long-term care, the majority in home health care. About one-third of OTs and 27 percent of PTs work in long-term care, along with 22 percent of speech pathologists. While RNs are the largest occupational group in long-term care, long-term care represents only 15 percent of total RN employment in Michigan. Share working in long-term care versus other health care settings in Michigan
Source: U.S. Bureau of Labor Statistics (BLS), Division of Occupational Employment Statistics (OES). 2019. May 2018 OES Research Estimates by State and Industry. https://www.bls.gov/oes/home.htm; analysis by Altarum (May 28, 2020).
Comparison of Licensed Health Care Worker Wages by Setting While not the only factor in employment decisions or job satisfaction, relative wages across employment settings undoubtedly impact the ease with which long-term care providers recruit and retain licensed workers. For some important categories of licensed workers, wages are lower in long-term care than other health care settings. For others, long-term care wages compare more favorably, making wages less of a factor to overcome in competing for workers. For RNs, who are a critical component of the licensed long-term care workforce, median annual full-time earnings in Michigan are much higher in hospitals, at $72,600, compared to home care, at $66,100, and nursing homes, at $63,000, and residential care, at $61,600. Similarly, median annual earnings for health care social workers are $61,300 in hospitals compared to $57,300 in home care, $49,900 in nursing homes, and $48,300 in residential care. For LPNs and therapists, long-term care wages compare more favorably to other settings. LPNs have median annual full-time earnings of $48,000 in nursing homes, $47,500 in residential care, and $46,400 in home care, compared to $45,500 in hospitals and $43,700 in physician offices. Note that these wages may reflect different roles and levels of responsibility or different levels of seniority for LPNs in these settings. Therapists also typically earn more in long-term care settings than in hospitals or independent offices. Median annual earnings for physical therapists in Michigan are $91,800 in both home care and nursing homes, compared to $88,300 in hospitals and $81,100 in a therapist office setting. Occupational therapists have median annual full-time earnings of $88,800 in home care and $87,800 in nursing homes
15%72%
43%27%
32%12%
22%18%
6%
0% 10% 20% 30% 40% 50% 60% 70% 80% 90% 100%
RNsLPNs
Social WorkersPTsOTsRTs
SpeechDieticians
NPs

29
compared to $84,800 in hospitals and $83,500 in therapist offices. Respiratory therapists show somewhat less variation by setting, with median annual earnings of $61,000 in home care and $59,000 in nursing homes, compared to $60,400 in hospitals. Finally, speech and language pathologists earn significantly more in long-term care settings, with median annual earnings of $92,300 in home care and $94,400 in nursing homes, compared to $84,100 in hospitals and $79,400 in therapist offices.
Summary of Findings on the Profile of Licensed Long-term Care Workers More than 30,000 licensed professionals work in long-term care in Michigan. Nearly half of these are RNs and another one-third LPNs. Long-term care settings also employ roughly 4,000 therapists and 2,000 social workers. Of the licensed professions, long-term care is the dominant setting employing more than half the profession only for LPNs. Wages for RNs and social workers are much higher in hospitals than in long-term care providers, presenting one challenge in competing for these workers. For LPNs, wages do not appear to disadvantage long-term care. For therapists, earnings in long-term care settings compare favorably to hospital and office settings.
Conclusion Nearly three-quarters of Michigan’s long-term care workforce—which employs more than 100,000 people altogether—are direct care workers. While demand is high for direct care workers, their compensation is low reflecting an under-resourced public financing system as well as the marginalization of the people who do this work, as evidenced by the job quality and workforce disparities data discussed in this chapter. Licensed nurses also constitute a sizeable proportion of the long-term care workforce (22 percent)—especially in nursing homes (39 percent). By comparison, other health care professionals constitute the smallest share of the long-term care workforce, although long-term care does employ a substantial proportion of all therapists in Michigan. We close this chapter with the summary page that follows combining our estimates of the direct care and licensed workforce by LTC setting in Michigan. Every person working in the long-term care sector plays a critical role in delivering long-term services and supports. The findings presented in this chapter underline the importance of a sector-wide workforce development strategy to ensure quality, consistent care for older adults and people with disabilities in Michigan.
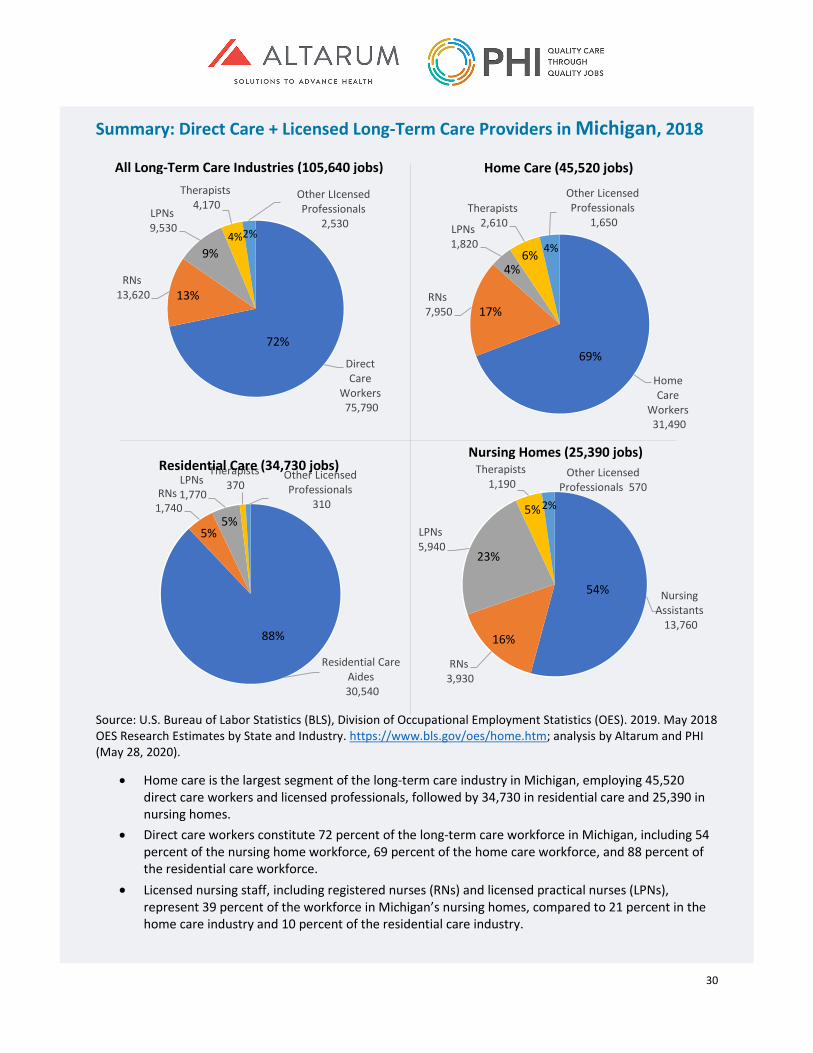
30
Summary: Direct Care + Licensed Long-Term Care Providers in Michigan, 2018
Source: U.S. Bureau of Labor Statistics (BLS), Division of Occupational Employment Statistics (OES). 2019. May 2018 OES Research Estimates by State and Industry. https://www.bls.gov/oes/home.htm; analysis by Altarum and PHI (May 28, 2020).
• Home care is the largest segment of the long-term care industry in Michigan, employing 45,520 direct care workers and licensed professionals, followed by 34,730 in residential care and 25,390 in nursing homes.
• Direct care workers constitute 72 percent of the long-term care workforce in Michigan, including 54 percent of the nursing home workforce, 69 percent of the home care workforce, and 88 percent of the residential care workforce.
• Licensed nursing staff, including registered nurses (RNs) and licensed practical nurses (LPNs), represent 39 percent of the workforce in Michigan’s nursing homes, compared to 21 percent in the home care industry and 10 percent of the residential care industry.
Direct Care
Workers75,790
RNs13,620
LPNs9,530
Therapists4,170
Other LIcensed Professionals
2,530
72%
13%
9%4%2%
Home Care
Workers31,490
RNs7,950
LPNs1,820
Therapists2,610
Other Licensed Professionals
1,650
69%
17%
4%6% 4%
Residential Care Aides30,540
RNs1,740
LPNs1,770
Therapists370
Other Licensed Professionals
310
88%
5%5%
Nursing Assistants
13,760
RNs3,930
LPNs5,940
Therapists1,190
Other Licensed Professionals 570
54%
16%
23%
5%2%
All Long-Term Care Industries (105,640 jobs) Home Care (45,520 jobs)
Residential Care (34,730 jobs) Nursing Homes (25,390 jobs)

31
Current and Future Need for Michigan’s Long-Term Care Workforce As well as understanding the size and characteristics of Michigan’s long-term care workforce, it is necessary to examine whether this workforce is sufficient to meet long-term care employer demand and the needs of older adults and people with disabilities in Michigan. This chapter explores the capacity of Michigan’s long-term care workforce through data that speak to workforce stability and current and future capacity as well as drawing on responses gathered directly from long-term care stakeholders in the state. We first discuss evidence on gaps in the direct care workforce, then present information on the future demand for long-term care in Michigan and conclude with evidence of current and future gaps in the long-term care licensed workforce.
Current and Future Need for the Direct Care Workforce in Michigan The previous chapter described a paradox facing Michigan’s direct care workforce: demand for direct care services is increasing, but job quality for these workers remains extremely poor. As a result, long-term care providers report difficulties attracting and retaining enough direct care workers to meet growing needs in the state. This section draws on qualitative and quantitative data to explore instability and gaps in the unlicensed workforce across regions and industries in Michigan. Methods Data from the Michigan Department of Technology, Management, and Budget were analyzed to generate general population projections from 2020 to 2045 and projected job openings in the direct care workforce from 2016 to 2026. Although it was not possible to quantify current workforce shortages across the state nor project future shortages from the available data sources, the following two quantitative approaches were used to broadly estimate workforce capacity and quantify occupational turnover (as a measure of workforce stability relative to growing demand). Where relevant, findings from the qualitative interviews were included to support or extend the findings from these quantitative analyses.
Direct Care Workforce Capacity The U.S. Census Bureau’s American Community Survey (ACS) 2014 to 2018 five-year sample was used to estimate a ratio of full-time equivalent home care workers to “likely consumers” of long-term services and supports (LTSS). This analysis focused exclusively on home care workers rather than all direct care workers for methodological and conceptual reasons. Methodologically, it was not possible to estimate the ratio of direct care workers to consumers in nursing homes and residential care settings because the ACS “group quarters” designation (which subsumes these settings within a much larger range of settings, including college dorms and correctional facilities) cannot be disaggregated by particular settings at the regional level. Conceptually, the priority in this analysis was to identify the capacity of the existing direct care workforce to serve consumers in the setting of their choice, which for the overwhelming majority of consumers, is their own homes and communities. (To note, Spotlight on Nursing Homes on page 46 provides insight on staffing levels for the nursing assistant workforce in nursing homes.) Likely consumers are defined in this analysis as older adults aged 65 and above living alone with self-care or independent living difficulties.26 This definition is based on the literature on paid care utilization,
26 Difficulty with “self-care” is measured in the ACS by asking if respondents have “difficulty dressing or bathing.” Difficulty with “independent living” is measured by asking if respondents have difficulty “doing errands alone such
32
which suggests that older adults living alone with personal assistance needs are more likely to rely on paid caregivers than younger people with disabilities and older adults in multi-member households.27 However, because it is not possible to identify individuals’ levels of need or sources of care using the ACS data, this definition of likely consumers necessarily includes older adults who receive assistance only from unpaid caregivers (i.e., those who do not currently rely on paid direct care workers for support) and excludes younger people with disabilities who receive paid care (i.e., those under the age of 65 who do not exclusively rely on unpaid caregivers).
Occupational Turnover The U. S. Census Bureau’s Current Population Survey (CPS) was used to estimate occupational turnover within the direct care workforce. Specifically, the analysis drew on pooled data from the 2014 to 2018 CPS March Supplement survey, which asks respondents about their current occupation and the occupation they held for the longest period during the previous year. Data from the 2014 to 2018 CPS Outgoing Rotation Group were matched across one year and pooled into a single dataset to analyze and compare average wages among direct care workers who stayed in their roles versus those who left for other occupations. To note, this approach measures movement in and out of the direct care workforce and between direct care occupations, but not within-occupation “churn”—meaning the amount of turnover within one direct care workforce in a single long-term care provider type. For example, a home care worker who moved into a nursing assistant role in a nursing home would be captured in the occupational turnover estimates reported here, but a nursing assistant who moved from one nursing home to another would not be captured.
Current Capacity of the Direct Care Workforce in Michigan The previous chapter described how direct care workforce employment levels vary by region in Michigan, with higher employment in metropolitan areas and lower employment in rural areas. However, these data only become meaningful when aligned with service demand—in other words, are there enough direct care workers employed in any given region of the state to meet consumers’ needs? Long-term care providers and membership associations suggested in their interviews that the current direct care workforce supply in Michigan does not meet consumer demand. When asked whether there is a workforce shortage in Michigan, more than one stakeholder replied, “Absolutely.” Stakeholders further reported that workforce shortages are causing wide-ranging harm to long-term care consumers and the sector overall. In some cases, individuals are not able to access the services they need due to a lack of local workers—and home care agencies are at risk of closing altogether due to the shortage. Stakeholders noted that some nursing homes, on the other hand, can offset job vacancies by scheduling more overtime, but that this may be leading to staff burnout. While these qualitative data are illuminating, it is not possible to quantify workforce shortages: there are no reliable data available on the number of consumers receiving paid long-term care services and supports across the state, or even specific data on authorized hours of service under Medicaid, that can
as visiting a doctor’s office or shopping.” U.S. Census Bureau. 2018. American Community Survey and Puerto Rico Community Survey 2018 Subject Definitions. Washington, D.C.: U.S. Census Bureau. https://www2.census.gov/programs-surveys/acs/tech_docs/subject_definitions/2018_ACSSubjectDefinitions.pdf?#. 27 Kaye, Stephen, Charlene Harrington, and Mitchell LaPlante. 2010. “Long-Term Care: Who Gets It, Who Provides It, Who Pays, And How Much?” HealthAffairs, 29(1). https://doi.org/10.1377/hlthaff.2009.0535.
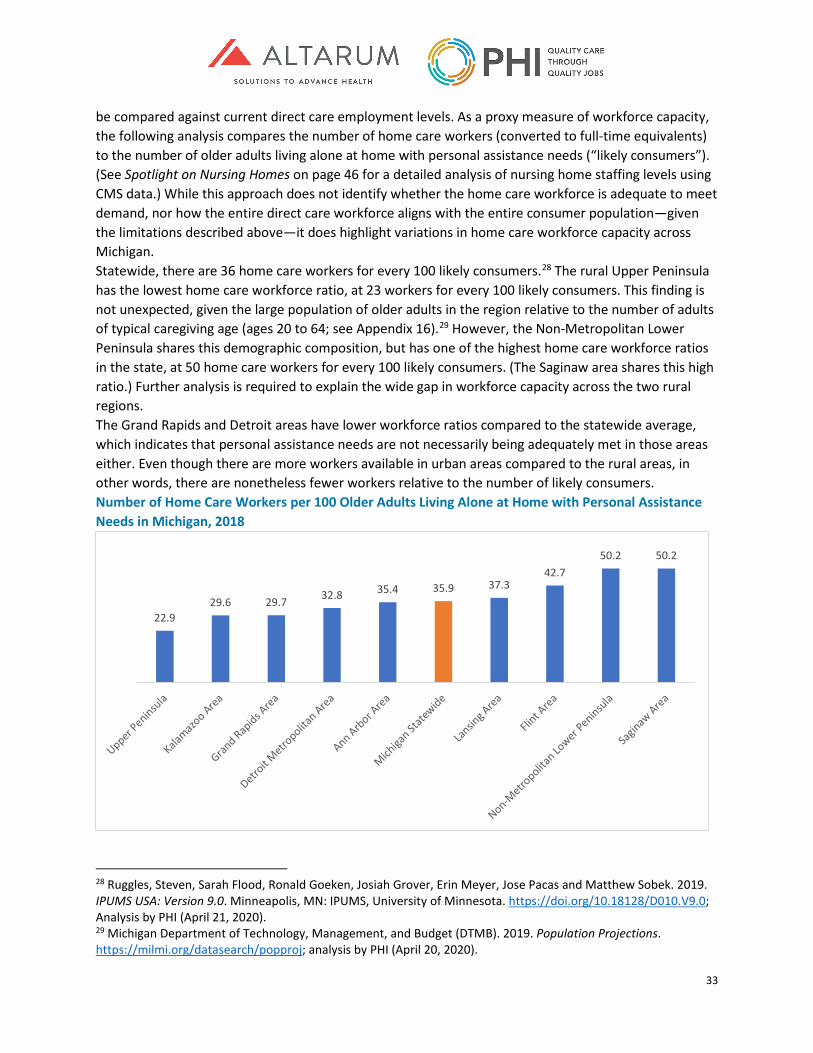
33
be compared against current direct care employment levels. As a proxy measure of workforce capacity, the following analysis compares the number of home care workers (converted to full-time equivalents) to the number of older adults living alone at home with personal assistance needs (“likely consumers”). (See Spotlight on Nursing Homes on page 46 for a detailed analysis of nursing home staffing levels using CMS data.) While this approach does not identify whether the home care workforce is adequate to meet demand, nor how the entire direct care workforce aligns with the entire consumer population—given the limitations described above—it does highlight variations in home care workforce capacity across Michigan. Statewide, there are 36 home care workers for every 100 likely consumers.28 The rural Upper Peninsula has the lowest home care workforce ratio, at 23 workers for every 100 likely consumers. This finding is not unexpected, given the large population of older adults in the region relative to the number of adults of typical caregiving age (ages 20 to 64; see Appendix 16).29 However, the Non-Metropolitan Lower Peninsula shares this demographic composition, but has one of the highest home care workforce ratios in the state, at 50 home care workers for every 100 likely consumers. (The Saginaw area shares this high ratio.) Further analysis is required to explain the wide gap in workforce capacity across the two rural regions. The Grand Rapids and Detroit areas have lower workforce ratios compared to the statewide average, which indicates that personal assistance needs are not necessarily being adequately met in those areas either. Even though there are more workers available in urban areas compared to the rural areas, in other words, there are nonetheless fewer workers relative to the number of likely consumers. Number of Home Care Workers per 100 Older Adults Living Alone at Home with Personal Assistance Needs in Michigan, 2018
28 Ruggles, Steven, Sarah Flood, Ronald Goeken, Josiah Grover, Erin Meyer, Jose Pacas and Matthew Sobek. 2019. IPUMS USA: Version 9.0. Minneapolis, MN: IPUMS, University of Minnesota. https://doi.org/10.18128/D010.V9.0; Analysis by PHI (April 21, 2020). 29 Michigan Department of Technology, Management, and Budget (DTMB). 2019. Population Projections. https://milmi.org/datasearch/popproj; analysis by PHI (April 20, 2020).
22.929.6 29.7 32.8 35.4 35.9 37.3
42.750.2 50.2
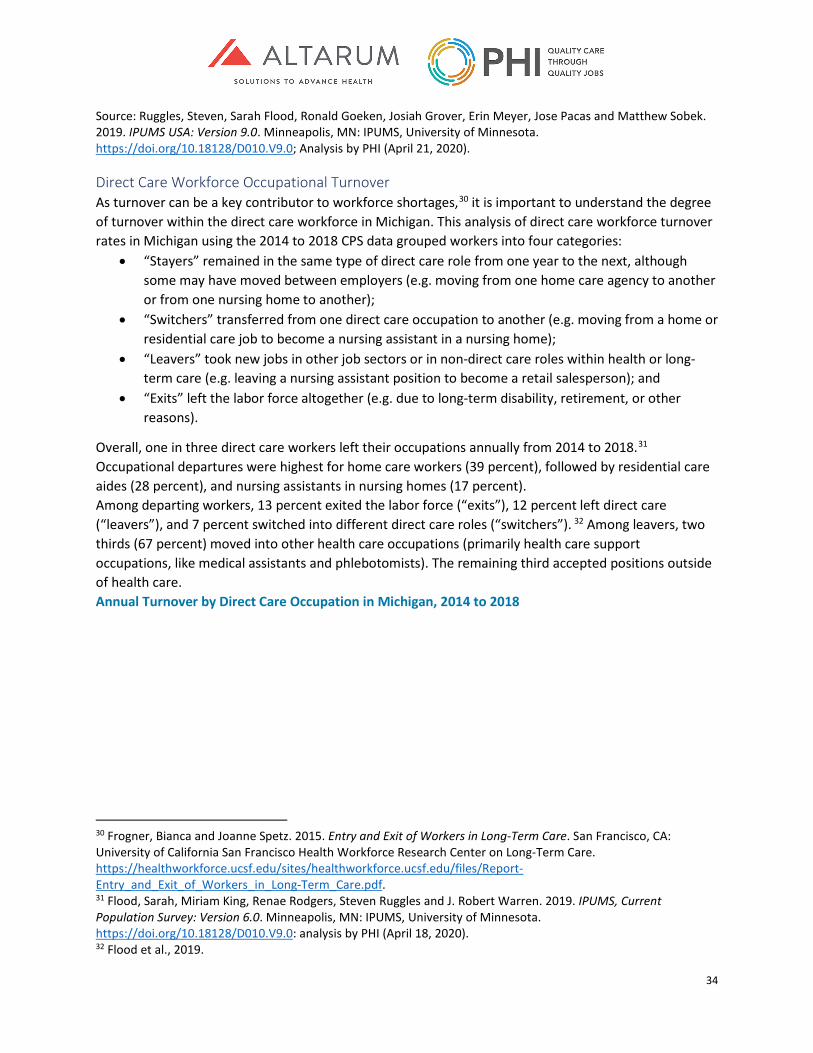
34
Source: Ruggles, Steven, Sarah Flood, Ronald Goeken, Josiah Grover, Erin Meyer, Jose Pacas and Matthew Sobek. 2019. IPUMS USA: Version 9.0. Minneapolis, MN: IPUMS, University of Minnesota. https://doi.org/10.18128/D010.V9.0; Analysis by PHI (April 21, 2020).
Direct Care Workforce Occupational Turnover As turnover can be a key contributor to workforce shortages,30 it is important to understand the degree of turnover within the direct care workforce in Michigan. This analysis of direct care workforce turnover rates in Michigan using the 2014 to 2018 CPS data grouped workers into four categories:
• “Stayers” remained in the same type of direct care role from one year to the next, although some may have moved between employers (e.g. moving from one home care agency to another or from one nursing home to another);
• “Switchers” transferred from one direct care occupation to another (e.g. moving from a home or residential care job to become a nursing assistant in a nursing home);
• “Leavers” took new jobs in other job sectors or in non-direct care roles within health or long-term care (e.g. leaving a nursing assistant position to become a retail salesperson); and
• “Exits” left the labor force altogether (e.g. due to long-term disability, retirement, or other reasons).
Overall, one in three direct care workers left their occupations annually from 2014 to 2018.31 Occupational departures were highest for home care workers (39 percent), followed by residential care aides (28 percent), and nursing assistants in nursing homes (17 percent). Among departing workers, 13 percent exited the labor force (“exits”), 12 percent left direct care (“leavers”), and 7 percent switched into different direct care roles (“switchers”). 32 Among leavers, two thirds (67 percent) moved into other health care occupations (primarily health care support occupations, like medical assistants and phlebotomists). The remaining third accepted positions outside of health care. Annual Turnover by Direct Care Occupation in Michigan, 2014 to 2018
30 Frogner, Bianca and Joanne Spetz. 2015. Entry and Exit of Workers in Long-Term Care. San Francisco, CA: University of California San Francisco Health Workforce Research Center on Long-Term Care. https://healthworkforce.ucsf.edu/sites/healthworkforce.ucsf.edu/files/Report-Entry_and_Exit_of_Workers_in_Long-Term_Care.pdf. 31 Flood, Sarah, Miriam King, Renae Rodgers, Steven Ruggles and J. Robert Warren. 2019. IPUMS, Current Population Survey: Version 6.0. Minneapolis, MN: IPUMS, University of Minnesota. https://doi.org/10.18128/D010.V9.0: analysis by PHI (April 18, 2020). 32 Flood et al., 2019.
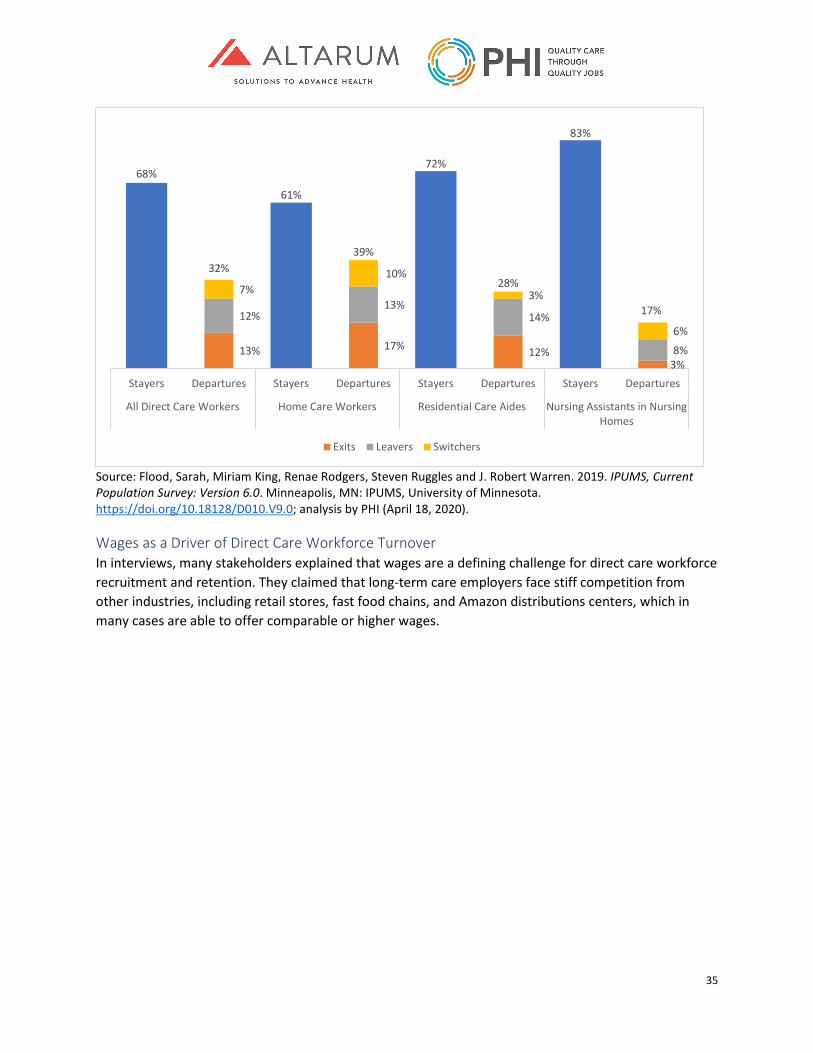
35
Source: Flood, Sarah, Miriam King, Renae Rodgers, Steven Ruggles and J. Robert Warren. 2019. IPUMS, Current Population Survey: Version 6.0. Minneapolis, MN: IPUMS, University of Minnesota. https://doi.org/10.18128/D010.V9.0; analysis by PHI (April 18, 2020).
Wages as a Driver of Direct Care Workforce Turnover In interviews, many stakeholders explained that wages are a defining challenge for direct care workforce recruitment and retention. They claimed that long-term care employers face stiff competition from other industries, including retail stores, fast food chains, and Amazon distributions centers, which in many cases are able to offer comparable or higher wages.
13% 17% 12%3%
12%13%
14%
8%
7%10%
3%
6%
68%
32%
61%
39%
72%
28%
83%
17%
Stayers Departures Stayers Departures Stayers Departures Stayers Departures
All Direct Care Workers Home Care Workers Residential Care Aides Nursing Assistants in NursingHomes
Exits Leavers Switchers
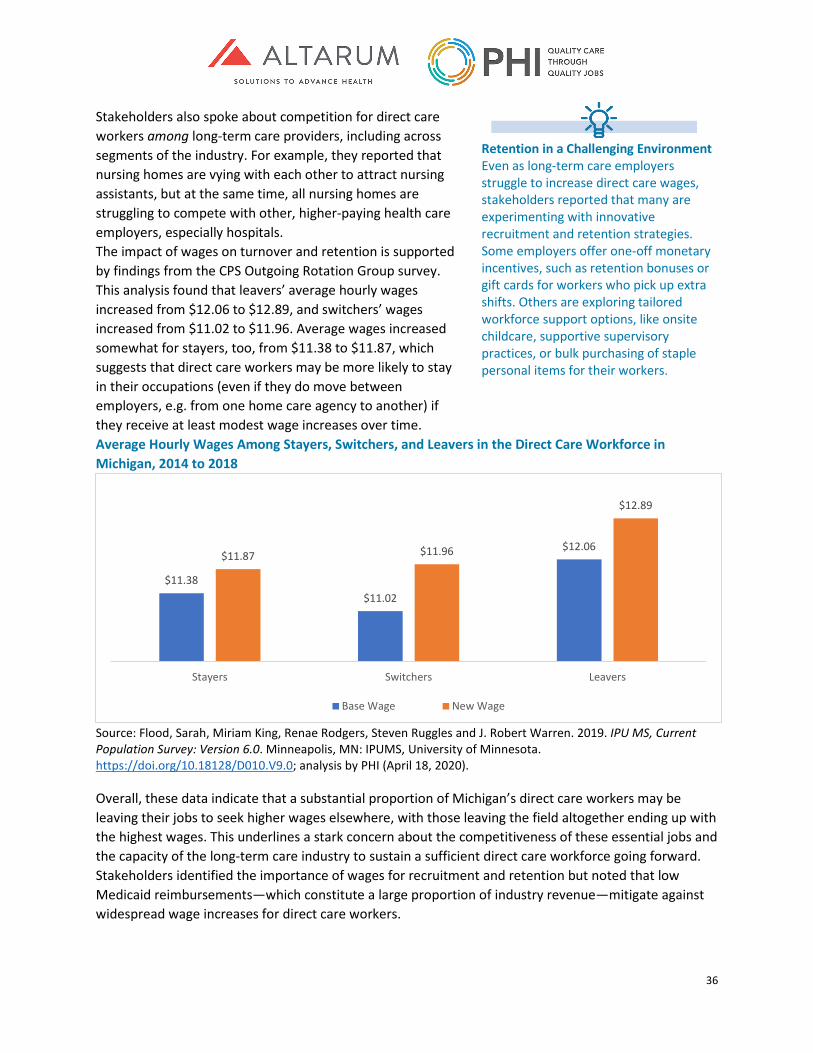
36
Stakeholders also spoke about competition for direct care workers among long-term care providers, including across segments of the industry. For example, they reported that nursing homes are vying with each other to attract nursing assistants, but at the same time, all nursing homes are struggling to compete with other, higher-paying health care employers, especially hospitals. The impact of wages on turnover and retention is supported by findings from the CPS Outgoing Rotation Group survey. This analysis found that leavers’ average hourly wages increased from $12.06 to $12.89, and switchers’ wages increased from $11.02 to $11.96. Average wages increased somewhat for stayers, too, from $11.38 to $11.87, which suggests that direct care workers may be more likely to stay in their occupations (even if they do move between employers, e.g. from one home care agency to another) if they receive at least modest wage increases over time. Average Hourly Wages Among Stayers, Switchers, and Leavers in the Direct Care Workforce in Michigan, 2014 to 2018
Source: Flood, Sarah, Miriam King, Renae Rodgers, Steven Ruggles and J. Robert Warren. 2019. IPU MS, Current Population Survey: Version 6.0. Minneapolis, MN: IPUMS, University of Minnesota. https://doi.org/10.18128/D010.V9.0; analysis by PHI (April 18, 2020).
Overall, these data indicate that a substantial proportion of Michigan’s direct care workers may be leaving their jobs to seek higher wages elsewhere, with those leaving the field altogether ending up with the highest wages. This underlines a stark concern about the competitiveness of these essential jobs and the capacity of the long-term care industry to sustain a sufficient direct care workforce going forward. Stakeholders identified the importance of wages for recruitment and retention but noted that low Medicaid reimbursements—which constitute a large proportion of industry revenue—mitigate against widespread wage increases for direct care workers.
$11.38 $11.02
$12.06 $11.87 $11.96
$12.89
Stayers Switchers Leavers
Base Wage New Wage
Retention in a Challenging Environment Even as long-term care employers struggle to increase direct care wages, stakeholders reported that many are experimenting with innovative recruitment and retention strategies. Some employers offer one-off monetary incentives, such as retention bonuses or gift cards for workers who pick up extra shifts. Others are exploring tailored workforce support options, like onsite childcare, supportive supervisory practices, or bulk purchasing of staple personal items for their workers.
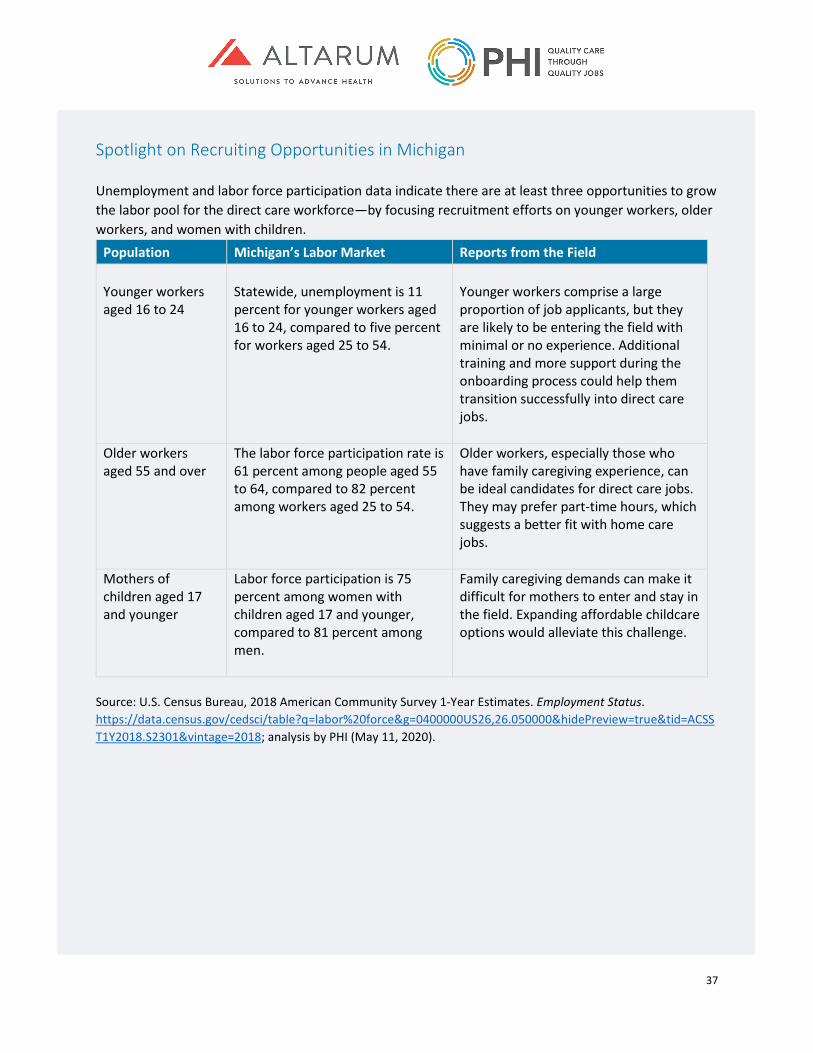
37
Spotlight on Recruiting Opportunities in Michigan Unemployment and labor force participation data indicate there are at least three opportunities to grow the labor pool for the direct care workforce—by focusing recruitment efforts on younger workers, older workers, and women with children.
Population Michigan’s Labor Market Reports from the Field Younger workers aged 16 to 24
Statewide, unemployment is 11 percent for younger workers aged 16 to 24, compared to five percent for workers aged 25 to 54.
Younger workers comprise a large proportion of job applicants, but they are likely to be entering the field with minimal or no experience. Additional training and more support during the onboarding process could help them transition successfully into direct care jobs.
Older workers aged 55 and over
The labor force participation rate is 61 percent among people aged 55 to 64, compared to 82 percent among workers aged 25 to 54.
Older workers, especially those who have family caregiving experience, can be ideal candidates for direct care jobs. They may prefer part-time hours, which suggests a better fit with home care jobs.
Mothers of children aged 17 and younger
Labor force participation is 75 percent among women with children aged 17 and younger, compared to 81 percent among men.
Family caregiving demands can make it difficult for mothers to enter and stay in the field. Expanding affordable childcare options would alleviate this challenge.
Source: U.S. Census Bureau, 2018 American Community Survey 1-Year Estimates. Employment Status. https://data.census.gov/cedsci/table?q=labor%20force&g=0400000US26,26.050000&hidePreview=true&tid=ACSST1Y2018.S2301&vintage=2018; analysis by PHI (May 11, 2020).

38
Future Demand for Direct Care Workers in Michigan Already, stakeholders report that long-term care employers in Michigan cannot hire enough direct care workers to fill vacant jobs and meet rising demand. Looking at population and workforce projections, we can extrapolate that these workforce challenges will likely worsen in the years ahead without targeted intervention.
Direct Care Workforce Projections According to the most recent employment projections available, the direct care workforce in Michigan is projected to have 34,090 job openings due to growth in demand from 2016 to 2026.33 The direct care field will add more new jobs than fast food and registered nursing combined, which are the second and third occupations with the most job growth. Most new direct care jobs (15,570) will be personal care aide positions. Notably, projected growth varies by region: the direct care workforce is projected to grow fastest (24 percent) in the Grand Rapids and Ann Arbor areas, and slowest in the Upper Peninsula (7 percent).34 (Detailed employment projections by region are available in Appendix 15.) Projected Job Openings due to Growth by Occupation in Michigan, 2016 to 2026
Source: Michigan Department of Technology, Management, and Budget. 2018. Michigan Statewide Short-Term and Long-Term Employment Projections. http://milmi.mt.gov/datasearch/projections-excel; analysis by PHI (April 20, 2020). Occupation and industry-specific employment projections are not available, although most direct care workers are employed in long-term care. Importantly, these projections are based solely on past employment growth and assume that base year employment meets demand. Therefore, because the projections do not account for vacant jobs or for increased future demand (driven by population aging, as described below), they likely underestimate future growth in the direct care workforce. Further, projected employment growth alone does not provide a complete picture of Michigan’s direct care workforce needs over the next decade—as thousands more direct care positions will need to be filled when existing workers leave their jobs. From 2016 to 2026, 75,400 direct care workers are projected to leave the field for other occupations and 94,400 are projected to leave the labor force due
33 Michigan Department of Technology, Management, and Budget (DTMB). 2018a. Michigan Statewide Short-Term and Long-Term Employment Projections. http://milmi.mt.gov/datasearch/projections-excel; analysis by PHI (April 20, 2020). 34 The state uses special regional definitions, called “Prosperity Regions,” for employment projections, and these do not align with other datasets. Michigan Department of Technology, Management, and Budget (DTMB). 2018b. Michigan Regional Long-Term Employment Projections 2016-2026. http://milmi.mt.gov/datasearch/projections-excel; analysis by PHI (April 20, 2020).
6,460
6,470
13,370
17,970
34,090
Software Application Developers
Janitors and Cleaners
Registered Nurses
Fast Food Workers
Direct Care Workers
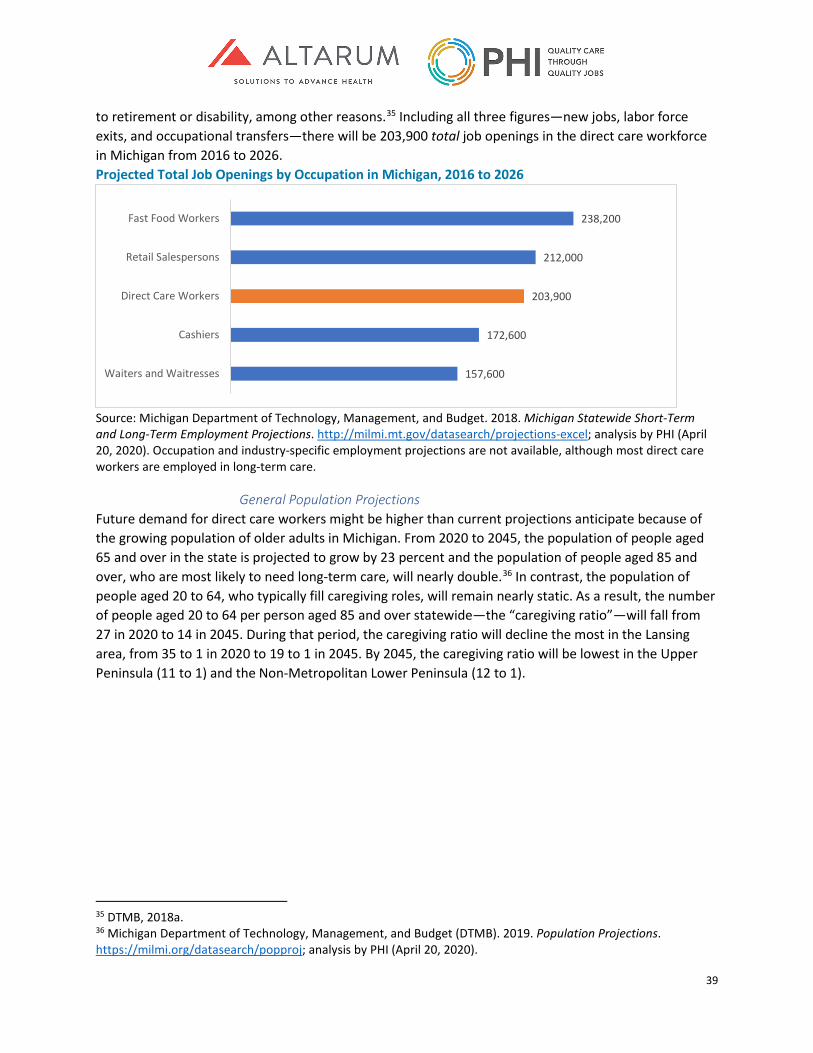
39
to retirement or disability, among other reasons.35 Including all three figures—new jobs, labor force exits, and occupational transfers—there will be 203,900 total job openings in the direct care workforce in Michigan from 2016 to 2026. Projected Total Job Openings by Occupation in Michigan, 2016 to 2026
Source: Michigan Department of Technology, Management, and Budget. 2018. Michigan Statewide Short-Term and Long-Term Employment Projections. http://milmi.mt.gov/datasearch/projections-excel; analysis by PHI (April 20, 2020). Occupation and industry-specific employment projections are not available, although most direct care workers are employed in long-term care.
General Population Projections Future demand for direct care workers might be higher than current projections anticipate because of the growing population of older adults in Michigan. From 2020 to 2045, the population of people aged 65 and over in the state is projected to grow by 23 percent and the population of people aged 85 and over, who are most likely to need long-term care, will nearly double.36 In contrast, the population of people aged 20 to 64, who typically fill caregiving roles, will remain nearly static. As a result, the number of people aged 20 to 64 per person aged 85 and over statewide—the “caregiving ratio”—will fall from 27 in 2020 to 14 in 2045. During that period, the caregiving ratio will decline the most in the Lansing area, from 35 to 1 in 2020 to 19 to 1 in 2045. By 2045, the caregiving ratio will be lowest in the Upper Peninsula (11 to 1) and the Non-Metropolitan Lower Peninsula (12 to 1).
35 DTMB, 2018a. 36 Michigan Department of Technology, Management, and Budget (DTMB). 2019. Population Projections. https://milmi.org/datasearch/popproj; analysis by PHI (April 20, 2020).
157,600
172,600
203,900
212,000
238,200
Waiters and Waitresses
Cashiers
Direct Care Workers
Retail Salespersons
Fast Food Workers
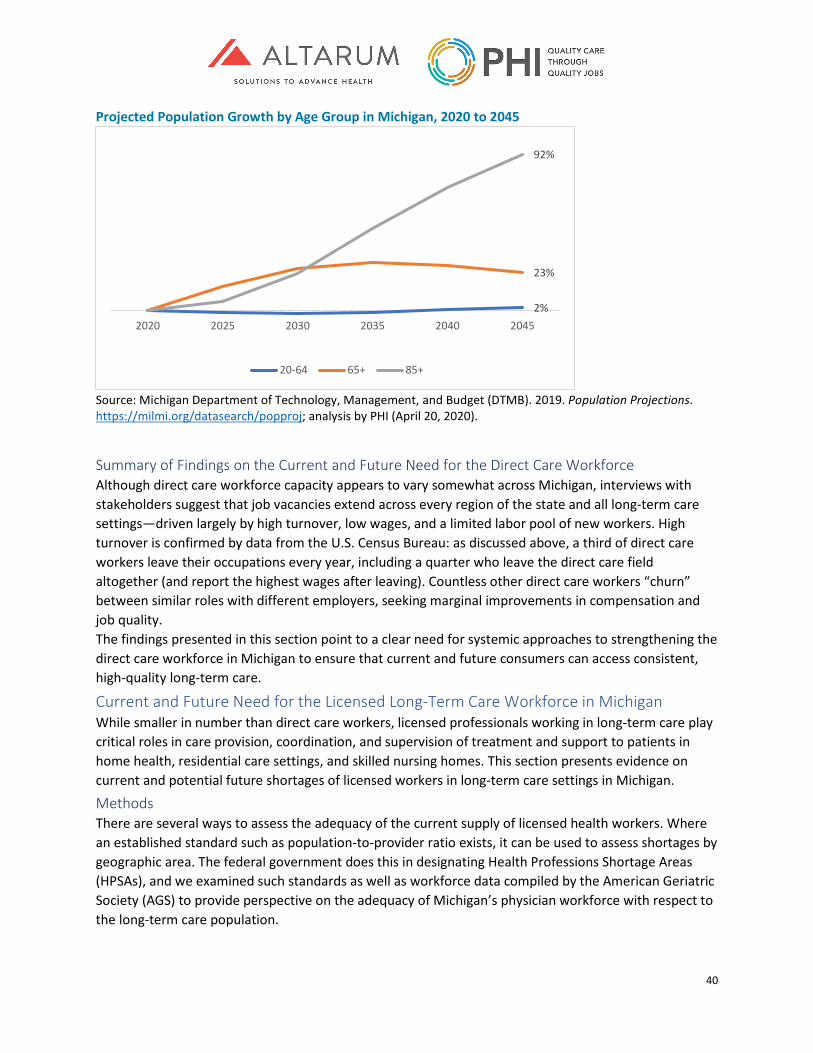
40
Projected Population Growth by Age Group in Michigan, 2020 to 2045
Source: Michigan Department of Technology, Management, and Budget (DTMB). 2019. Population Projections. https://milmi.org/datasearch/popproj; analysis by PHI (April 20, 2020).
Summary of Findings on the Current and Future Need for the Direct Care Workforce Although direct care workforce capacity appears to vary somewhat across Michigan, interviews with stakeholders suggest that job vacancies extend across every region of the state and all long-term care settings—driven largely by high turnover, low wages, and a limited labor pool of new workers. High turnover is confirmed by data from the U.S. Census Bureau: as discussed above, a third of direct care workers leave their occupations every year, including a quarter who leave the direct care field altogether (and report the highest wages after leaving). Countless other direct care workers “churn” between similar roles with different employers, seeking marginal improvements in compensation and job quality. The findings presented in this section point to a clear need for systemic approaches to strengthening the direct care workforce in Michigan to ensure that current and future consumers can access consistent, high-quality long-term care.
Current and Future Need for the Licensed Long-Term Care Workforce in Michigan While smaller in number than direct care workers, licensed professionals working in long-term care play critical roles in care provision, coordination, and supervision of treatment and support to patients in home health, residential care settings, and skilled nursing homes. This section presents evidence on current and potential future shortages of licensed workers in long-term care settings in Michigan.
Methods There are several ways to assess the adequacy of the current supply of licensed health workers. Where an established standard such as population-to-provider ratio exists, it can be used to assess shortages by geographic area. The federal government does this in designating Health Professions Shortage Areas (HPSAs), and we examined such standards as well as workforce data compiled by the American Geriatric Society (AGS) to provide perspective on the adequacy of Michigan’s physician workforce with respect to the long-term care population.
2%
23%
92%
2020 2025 2030 2035 2040 2045
20-64 65+ 85+
41
For many other licensed health professions, the federal Health Resources and Services Administration (HRSA) National Center for Health Workforce Analysis (NCHWA) compiles data and develops detailed models and projections of workforce supply and demand at both the national and state level. We used published data from HRSA NCHWA to compare the per capita supply of relevant licensed health professionals in Michigan to the national average. We also examined NCHWA modeled projections of supply and demand for RNs and LPNs in Michigan.37 While neither the data nor the modeling disaggregated workers by practice setting, they inform an overall assessment of Michigan’s supply of each profession. Labor market indicators such as vacancy rates, the ability of new graduates of a profession to obtain jobs, and trends in salaries or hiring bonuses can also be used to assess health workforce shortages, but such data are not yet systematically collected and tracked in Michigan (or in most states), so could not be used in this study. The most straightforward method, and the one primarily relied upon here, is to gather qualitative data through interviews with those in the field about their ability to hire and retain qualified workers.
Gaps in Physician Supply Relevant to the Long-Term Care Population As noted in Chapter 2, physicians are not direct providers of long-term care, but they are involved in the health and well-being of long-term care consumers. Long-term care providers may coordinate with a consumer’s primary care provider on issues around management of a patient’s chronic conditions or medication adherence. Michigan, like much of the country, is concerned about access to primary care physicians or other primary care practitioners, particularly for vulnerable populations. While surveys show most primary care physicians in Michigan are currently accepting patients,38 and Michigan has a relatively high supply of physicians per capita compared to the rest of the country,39 there are important gaps by geographic area and type of insurance. HRSA has designated 259 primary care Health Professional Shortage Areas in Michigan, and estimates that 546 additional primary care practitioners would be needed to eliminate these designations.40 As stated earlier in this report, Michigan has 12.2 geriatricians per 100,000 people aged 65 and older, less than the U.S. average of 14.8.41 Michigan would need an additional 45 geriatricians for a total of 255 geriatricians to meet the U.S. average.42 From the perspective of best patient care, however, the U.S. average supply of geriatricians is well below need for their services. The AGS cites research finding that 30 percent of those age 65 and older need care from a geriatrician and that one geriatrician can care for
37 U.S. Department of Health and Human Services, Health Resources and Services Administration, National Center for Health Workforce Analysis (NCHWA). 2017. National and Regional Supply and Demand Projections of the Nursing Workforce: 2014-2030. Rockville, MD: NCHWA. 38 Thompson, Carol. 2019. “Michigan Is Facing a Shortage of Primary Care Doctors. Where Does That Leave Patients?” Lansing State Journal, October 16. https://www.lansingstatejournal.com/story/news/local/2019/10/17/finding-primary-care-doctors-lansing-michigan-shortage-health/2366486001/. 39 U.S. Department of Health and Human Services, Health Resources and Services Administration (HRSA). 2018. The U.S. Health Workforce Chartbook. Rockville, MD: HRSA. https://bhw.hrsa.gov/sites/default/files/bhw/health-workforce-analysis/research/hrsa-us-health-workforce-chartbook-in-brief.pdf. 40 HRSA. 2020. Second Quarter of Fiscal Year 2020 Designated HPSA Quarterly Summary. Rockville, MD: HRSA https://data.hrsa.gov/Default/GenerateHPSAQuarterlyReport 41 AGS, 2019. 42 Authors’ calculations using data noted in the text and cited by American Geriatric Society; AGS, 2019.
42
700 patients.43 Under these assumptions, Michigan has a need for 736 geriatricians, or about 3.5 times as many as the current supply.44 The shortage of geriatricians in Michigan, as across the U.S., is due to broad factors including low pay relative to most physician specialties, partly because most geriatric patients are Medicare beneficiaries and Medicare rates tend to be lower than private insurance. These are not factors that Michigan alone can solve easily. However, these figures are useful in planning and goal setting around the workforce supporting the needs of Michigan’s long-term care population. Gaps in Other Licensed Long-Term Care Occupations The consensus of the long-term care stakeholders we interviewed was that shortages of licensed workers are of less concern than shortages of direct care workers. Most organizations reported they were not currently experiencing a shortage of licensed workers. Stakeholders reported that while the pool of candidates for an open nurse or social worker position might be small, they were receiving an adequate number of applicants and it was a matter of finding the right match. Vacancies were reported to be filled typically within a few months. In general, stakeholders reported that it was easier to fill licensed positions than direct care positions because qualified candidates could be readily identified, and a pipeline could be created through relationships with local community colleges or other professional training programs. There were some reports of difficulties finding physical and occupational therapists in the Upper Peninsula. Some stakeholders also qualified their answers by saying that they were not currently experiencing a shortage of licensed workers but that this could become a concern in the future. It may be that direct care worker shortages are currently the main constraint to providing more services. If direct care shortages were alleviated so services could be expanded to meet demand, then shortages of licensed workers in long-term care settings might emerge. For additional context, we compared the per capita supply of each licensed profession to the national average using US chartbook data published by HRSA NCHWA.45 Michigan has a low supply of dieticians and speech pathologists (lowest quintile) compared to the rest of the country, a somewhat low supply of LPNs (2nd lowest quintile), an average supply of RNs, physical therapists, and respiratory therapists (middle quintile), and a relatively high supply of occupational therapists and, as stated earlier, physicians (second highest quintile).
Gaps in Future Supply of Licensed Long-Term Care Workers To inform long-term workforce planning, it is important to assess the direction of trends in both supply and demand. The projected aging of the Michigan population will certainly increase the demand for both direct care and licensed long-term care workers. HRSA NCHWA has developed projection models of nursing supply and demand that produce results by state. Comparisons of projected supply and demand for RNs in Michigan using these models show no projected shortages for RNs overall.46 To assure an adequate number of RNs in the long-term care
43 AGS. “Geriatrics Workforce by the Numbers.” Last modified June 22, 2020. https://www.americangeriatrics.org/geriatrics-profession/about-geriatrics/geriatrics-workforce-numbers. Accessed June 4, 2020. 44 Authors’ calculations using data noted in the text and cited by American Geriatric Society; AGS, 2019. 45 HRSA, 2018. 46 U.S. Department of Health and Human Services, Health Resources and Services Administration, National Center for Health Workforce Analysis (NCHWA). 2017. National and Regional Supply and Demand Projections of the Nursing Workforce: 2014-2030. Rockville, MD: NCHWA. https://bhw.hrsa.gov/sites/default/files/bhw/nchwa/projections/NCHWA_HRSA_Nursing_Report.pdf.

43
workforce, it will be important to monitor results by practice setting, as RN salaries are lower in nursing homes than in other settings, so distribution of the RN workforce between hospitals, office settings, and long-term care may create setting-specific shortages. For LPNs, the largest group among the licensed workers, HRSA modeling points to future workforce shortages under current trends in supply and demand. By 2030, HRSA projects a shortage of about 3,000 LPNs in Michigan. Given that Michigan’s population is dramatically aging and LPNs are predominantly employed in long-term care, it is not surprising that demand is projected to increase faster than the historical rate of new LPN graduates. It will be important for the state to track whether shortages of LPNs are emerging through periodic stakeholder surveys or tracking of vacancies, to inform the need to pursue an increase in training, recruitment, or retention of LPNs.
Summary of Findings on the Current and Future Need for the Licensed Long-Term Care Workforce While shortages of licensed personnel in long-term care are currently less acute than shortages of direct care workers, there are some notable challenges. For example, stakeholders reported a shortage of therapists in the Upper Peninsula and some were concerned by the small number of candidates for open nursing positions. Looking to the future, the growing need for long-term care will require the state to closely monitor the supply of licensed professionals—especially RNs, LPNs and therapists, who are critical to the provision of long-term care. Employers reported uncertainty about their continued ability to fill these positions when staff turnover occurs, and projections reveal a likely shortage of LPNs in Michigan in the coming decades.
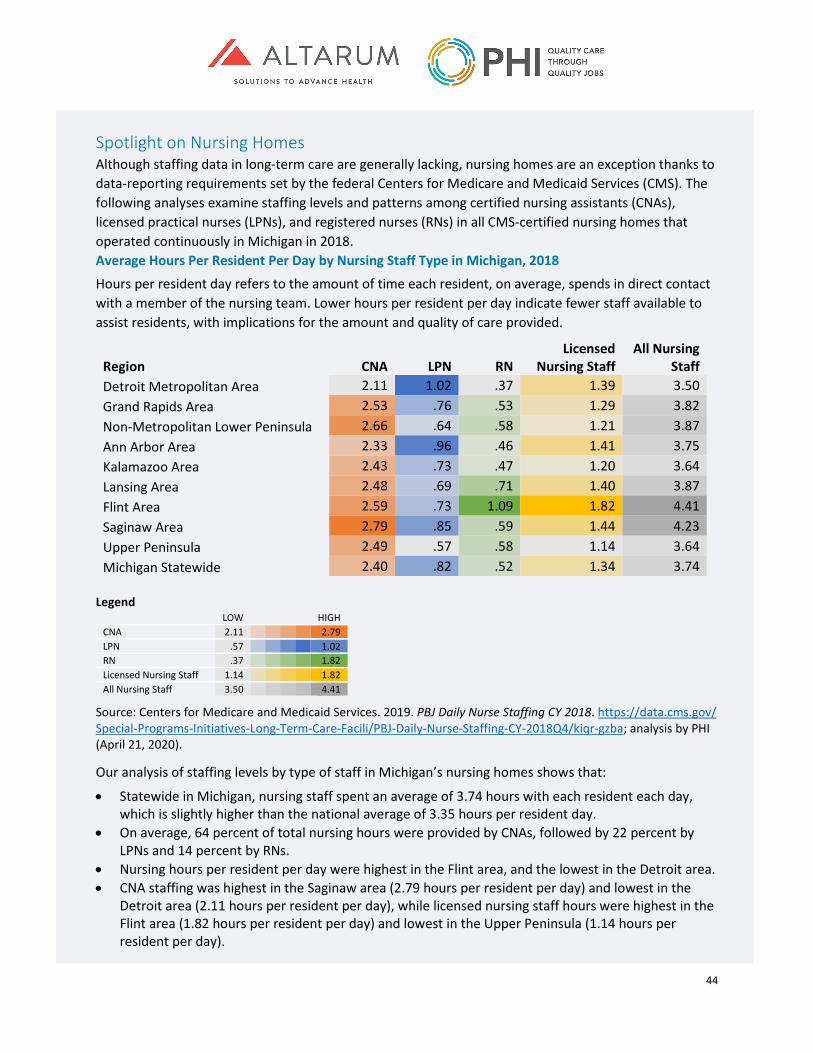
44
Spotlight on Nursing Homes Although staffing data in long-term care are generally lacking, nursing homes are an exception thanks to data-reporting requirements set by the federal Centers for Medicare and Medicaid Services (CMS). The following analyses examine staffing levels and patterns among certified nursing assistants (CNAs), licensed practical nurses (LPNs), and registered nurses (RNs) in all CMS-certified nursing homes that operated continuously in Michigan in 2018. Average Hours Per Resident Per Day by Nursing Staff Type in Michigan, 2018
Hours per resident day refers to the amount of time each resident, on average, spends in direct contact with a member of the nursing team. Lower hours per resident per day indicate fewer staff available to assist residents, with implications for the amount and quality of care provided.
Region CNA LPN RN Licensed
Nursing Staff All Nursing
Staff Detroit Metropolitan Area 2.11 1.02 .37 1.39 3.50 Grand Rapids Area 2.53 .76 .53 1.29 3.82 Non-Metropolitan Lower Peninsula 2.66 .64 .58 1.21 3.87 Ann Arbor Area 2.33 .96 .46 1.41 3.75 Kalamazoo Area 2.43 .73 .47 1.20 3.64 Lansing Area 2.48 .69 .71 1.40 3.87 Flint Area 2.59 .73 1.09 1.82 4.41 Saginaw Area 2.79 .85 .59 1.44 4.23 Upper Peninsula 2.49 .57 .58 1.14 3.64 Michigan Statewide 2.40 .82 .52 1.34 3.74
Legend
LOW HIGH CNA 2.11 2.79 LPN .57 1.02 RN .37 1.82 Licensed Nursing Staff 1.14 1.82 All Nursing Staff 3.50 4.41
Source: Centers for Medicare and Medicaid Services. 2019. PBJ Daily Nurse Staffing CY 2018. https://data.cms.gov/ Special-Programs-Initiatives-Long-Term-Care-Facili/PBJ-Daily-Nurse-Staffing-CY-2018Q4/kiqr-gzba; analysis by PHI (April 21, 2020).
Our analysis of staffing levels by type of staff in Michigan’s nursing homes shows that:
• Statewide in Michigan, nursing staff spent an average of 3.74 hours with each resident each day, which is slightly higher than the national average of 3.35 hours per resident day.
• On average, 64 percent of total nursing hours were provided by CNAs, followed by 22 percent by LPNs and 14 percent by RNs.
• Nursing hours per resident per day were highest in the Flint area, and the lowest in the Detroit area. • CNA staffing was highest in the Saginaw area (2.79 hours per resident per day) and lowest in the
Detroit area (2.11 hours per resident per day), while licensed nursing staff hours were highest in the Flint area (1.82 hours per resident per day) and lowest in the Upper Peninsula (1.14 hours per resident per day).
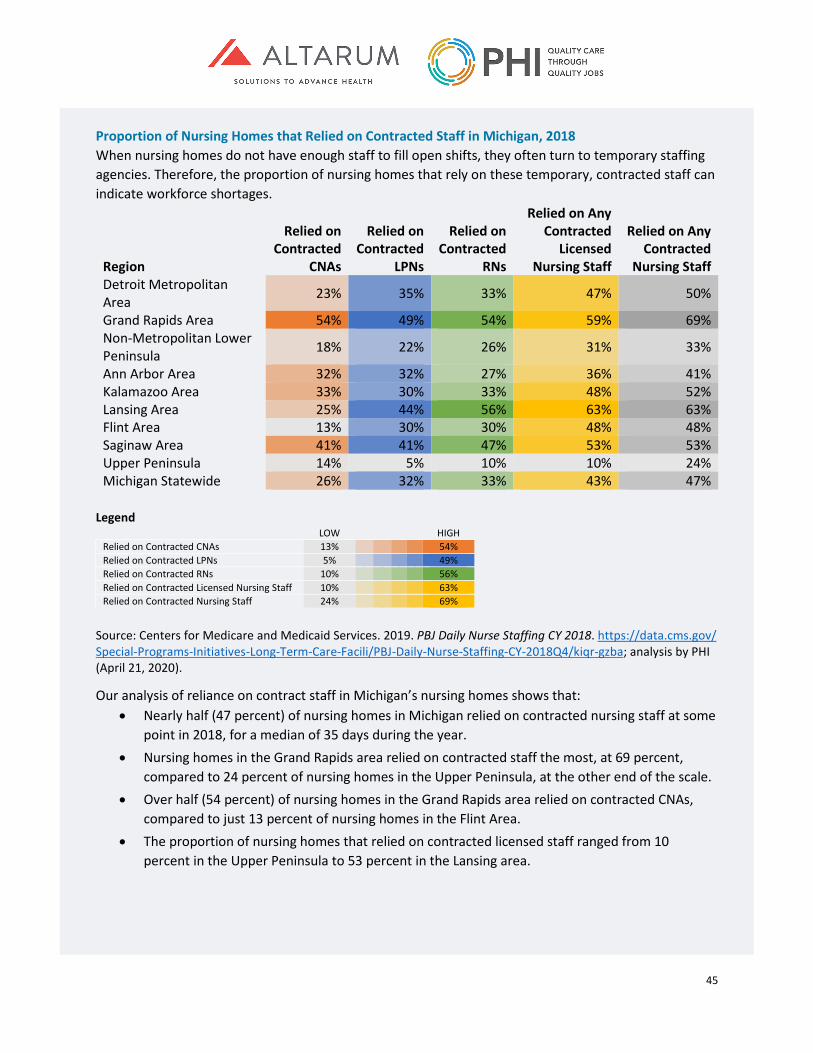
45
Proportion of Nursing Homes that Relied on Contracted Staff in Michigan, 2018 When nursing homes do not have enough staff to fill open shifts, they often turn to temporary staffing agencies. Therefore, the proportion of nursing homes that rely on these temporary, contracted staff can indicate workforce shortages.
Region
Relied on Contracted
CNAs
Relied on Contracted
LPNs
Relied on Contracted
RNs
Relied on Any Contracted
Licensed Nursing Staff
Relied on Any Contracted
Nursing Staff Detroit Metropolitan Area 23% 35% 33% 47% 50%
Grand Rapids Area 54% 49% 54% 59% 69% Non-Metropolitan Lower Peninsula 18% 22% 26% 31% 33%
Ann Arbor Area 32% 32% 27% 36% 41% Kalamazoo Area 33% 30% 33% 48% 52% Lansing Area 25% 44% 56% 63% 63% Flint Area 13% 30% 30% 48% 48% Saginaw Area 41% 41% 47% 53% 53% Upper Peninsula 14% 5% 10% 10% 24% Michigan Statewide 26% 32% 33% 43% 47%
Legend
LOW HIGH Relied on Contracted CNAs 13% 54% Relied on Contracted LPNs 5% 49% Relied on Contracted RNs 10% 56% Relied on Contracted Licensed Nursing Staff 10% 63% Relied on Contracted Nursing Staff 24% 69%
Source: Centers for Medicare and Medicaid Services. 2019. PBJ Daily Nurse Staffing CY 2018. https://data.cms.gov/ Special-Programs-Initiatives-Long-Term-Care-Facili/PBJ-Daily-Nurse-Staffing-CY-2018Q4/kiqr-gzba; analysis by PHI (April 21, 2020).
Our analysis of reliance on contract staff in Michigan’s nursing homes shows that: • Nearly half (47 percent) of nursing homes in Michigan relied on contracted nursing staff at some
point in 2018, for a median of 35 days during the year. • Nursing homes in the Grand Rapids area relied on contracted staff the most, at 69 percent,
compared to 24 percent of nursing homes in the Upper Peninsula, at the other end of the scale. • Over half (54 percent) of nursing homes in the Grand Rapids area relied on contracted CNAs,
compared to just 13 percent of nursing homes in the Flint Area. • The proportion of nursing homes that relied on contracted licensed staff ranged from 10
percent in the Upper Peninsula to 53 percent in the Lansing area.
46
Conclusion While there is some regional variation in direct care workforce capacity in Michigan, stakeholders reported that job vacancies exist in all areas of the state and in all long-term care settings. Some of the causes for these vacancies are low wages, high turnover, and a limited labor pool of new workers. High turnover is confirmed by analysis of U.S. Census Bureau data: as discussed above, a third of direct care workers leave their occupations every year, including a quarter who leave the direct care field altogether—and this cohort reports the highest wages after leaving. Countless other direct care workers “churn” between similar roles with different employers, seeking marginal improvements in compensation and job quality. Workforce shortages in long-term care are currently less acute for licensed workers than for direct care workers, although challenges were reported finding therapists in the Upper Peninsula, and there were often few nursing candidates for open positions. Long-term care employers reported uncertainty about their continued ability to fill positions should current staff leave, and federal models project particular shortages of LPNs in Michigan in the coming decades. Although data are lacking for many settings and occupations within long-term care, nursing home workforce data provides a more complete view of the numbers and distribution of workers within that industry. Workforce supply and shortages are more apparent in this setting because of the detailed data collected from nursing homes on residents, hours for various workers, and providers’ use of contract workers to fill out the daily roster. More robust data from all long-term care settings and occupations would provide a more complete picture of availability and gaps in the total long-term care workforce. A systemic approach to addressing these findings will be essential to future efforts to strengthen the long-term care workforce in Michigan—to ensure that current and future consumers can access consistent, high-quality long-term care.

47
Direct Care Workforce Training Requirements and Delivery in Michigan As established in the previous chapter, Michigan’s growing population of older adults is driving up demand for long-term care services. Acuity is also increasing across long-term care settings. Many individuals with complex needs who would have received 24-hour nursing home care in the past now receive services at home or in community-based settings, as a result of rebalancing policies enacted over recent decades. Nursing homes continue to serve many people with high needs.47 These twin pressures—the demand for long-term care services, plus the need for complex care across settings—create an urgent need to ensure that long-term care workers in the state receive the training they need to fulfill their jobs successfully. This chapter begins by describing the state and federal training requirements for different direct care occupations in Michigan. It then summarizes where and how training is delivered, to explore how training standards are implemented, highlight variation across training programs, and identify training gaps and opportunities for improvement.
Methods The findings in this chapter are based on a detailed review of Medicaid regulations and waiver documents, provider policy manuals, licensure requirements, and federal laws pertaining to training for direct care workers. The chapter also integrates findings from structured interviews conducted with a cross-section of stakeholders representing diverse long-term care settings and geographic areas in Michigan.
Training Requirements for Direct Care Workers in Michigan Personal care aides, home health aides, residential care aides, and nursing assistants are regulated by a range of state and federal policies. Even though many of these training regulations contain overlapping requirements, they tend to be limited to particular long-term care settings, populations, and programs—allowing limited portability of training credentials from one direct care role to another. Personal Care Aides The federal government provides minimal oversight for home care agencies that provide personal care, and Michigan does not license these agencies at the state level. As a result, the only training standards for personal care aides in Michigan are tied to Medicaid waiver program requirements. Under the MI Choice waiver program, older adults and people with disabilities may either receive services through an agency or direct their own services (although most consumers who direct their services are enrolled in the Home Help program described below).48 Workers who provide services under the MI Choice waiver program are required to receive training in five topics: first aid and CPR; good health practices; housekeeping and household management; universal precautions and blood-borne pathogens; and observing, reporting, and recording information. However, the requirements remain broad, with employers free to determine how many hours of training to provide and how to assess worker competency and job preparedness.
47 Scales, Kezia. 2019. Envisioning the Future of Home Care: Trends and Opportunities in Workforce Policy and Practice. Bronx, NY: PHI. https://phinational.org/resource/envisioning-the-future-of-home-care-trends-and-opportunities-in-workforce-policy-and-practice/. 48 Centers for Medicaid and Medicare Services (CMS). 2018. MI Choice Renewal. 0241.R05.00. Washington, D.C.: CMS. https://www.michigan.gov/documents/mdch/1915-c_HCBS_Waiver-6-2007_205659_7.pdf.

48
In contrast with the MI Choice waiver program, the Home Help program grants consumers total control over their workers’ training, as well as over many other aspects of employment.49 As with other consumer-directed programs, the lack of training regulations for workers hired through the Home Help program is rooted in the belief that consumers are experts in their care and should therefore determine their own workers’ training.50
Home Health Aides Training is more stringently regulated for home health aides than for personal care aides. Although the home health agencies that employ home health aides are not licensed by the state of Michigan, they are subject to federal regulations as part of the Medicare certification process. While Medicare does not cover long-term care, home health agencies may receive Medicare reimbursement for serving clients who require short-term post-acute care (after a hospitalization). Under the federal regulations for home health agencies, home health aides must complete at least 75 hours of training (including 16 hours of clinical experience) covering 15 broad topics. These topics include communication; observing, recording, and reporting changes in condition; working with different populations; and infection control, among others.51 The training must be provided by a registered nurse and workers must pass a state-mandated competency exam, including a written or oral test and a skills demonstration. Following their entry-level training, home health aides must complete 12 hours of continuing education annually.
Residential Care Aides Unlike home care agencies, residential care providers are licensed by the state of Michigan, with licensure regulations specifying training requirements. While these regulations vary by setting and populations served, each set of regulations requires residential care aides to demonstrate competency in six areas: personal care; first aid and CPR; reporting requirements and documentation; safety and fire prevention; resident rights and responsibilities; and standard precautions and the prevention and containment of infectious disease. “Homes for the aged,” which are residential care communities serving 21 or more people aged 55 and over, must also provide training in medication administration, if the residential care aides provide that service.52 The regulations also require that workers receive training according to the needs of residents and the overall focus of the organization (for example, a community that explicitly specializes in dementia care must train workers in Alzheimer’s disease and other dementias). In addition to covering the training topics that are required for all residential care providers, “adult foster care homes”—which serve 20 or fewer older adults, people with mental illness, or people with
49 Michigan Department of Health and Human Services. “Home Help.” Last updated October 20, 2020. https://web.archive.org/web/2019*/https://www.michigan.gov/mdhhs/0,5885,7-339-71551_2945_42542_42543_42549_42590---,00.html. 50 PHI. 2019. “Personal Care Aide Training Requirements.” Last updated August 10, 2020. https://phinational.org/advocacy/personal-care-aide-training-requirements/. 51 Code of Federal Regulations. 2001. Condition of Participation: Home Health Services. 42 CFR §484.36. https://www.law.cornell.edu/cfr/text/42/484.36; Michigan Department of Licensing and Regulatory Affairs. “Home Health Agencies.” Last updated April 22, 2020. https://www.michigan.gov/lara/0,4601,7-154-89334_63294_72971_75375---,00.html. 52 National Center for Assisted Living (NCAL). 2019. 2019 Assisted Living State Regulatory Review. Washington, D.C.: NCAL. https://www.ahcancal.org/ncal/advocacy/regs/Documents/2019_reg_review.pdf.

49
intellectual and development disabilities—must provide training on the supervision and safety of residents.53 Across the board, the regulations and state-approved curricula for licensed residential care homes do not specify a minimum number of training hours nor do they stipulate any particular assessment methods, although employers are required to assess and record worker competency. Also, licensure requirements exempt certain residential settings, like homes for the aged with 20 or fewer residents and adult foster homes with four or fewer residents with mental health disorders.54 These providers are not subject to any staff training requirements.
Direct Support Professionals In home and community-based settings, training is regulated separately for direct support professionals who support people with intellectual and developmental disabilities. Training requirements are minimal under the Habilitation Supports waiver, which serves people with intellectual and developmental disabilities who live at home. Under this program, direct support professionals must be competent in first aid, CPR, and infection prevention, as well as all the skills required for each individual consumer’s service plan.55 Employing agencies or consumer employers must verify worker qualifications and submit documentation of competency to the Prepaid Inpatient Health Plan (PIHP) that pays for their services. (PIHPs are private health insurance plans that use monthly per-capita payments from the state to manage services for consumers enrolled in the Habilitation Supports waiver.) In residential settings, adult foster care homes that serve people with intellectual and developmental disabilities must train workers with a state-sponsored curriculum, “Providing Residential Services in Community Settings: A Training Guide,” or an equivalent, state-approved curriculum.56 Similar to training regulations for other residential care aides, duration and assessment methods are not specified in training regulations, although employers must still assess and record competency.
Nursing Assistants Nursing homes are the most regulated long-term care sector in Michigan, as they are both state-licensed and federally certified. (They are federally certified because, like home health agencies, they accept Medicare for post-acute care services.) Michigan requires that training programs for nursing assistants follow a state-sponsored curriculum titled “State of Michigan Nurse Aide Training Curriculum Model.”57 The curriculum reflects the federal training requirements, which outline a range of detailed training topics under seven areas.58 Many of the topics are similar to those covered by the home health aide training requirements, but nursing
53 NCAL, 2019. 54 Michigan Department of Licensing and Regulatory Affairs. “What Needs to Be Licensed.” Accessed June 12, 2020. https://www.michigan.gov/lara/0,4601,7-154-89334_63294_27717-245180--,00.html. 55 Centers for Medicaid and Medicare Services (CMS). 2019. Habilitation Supports Waiver. 0167.R06.00. Washington, D.C.: CMS. https://www.medicaid.gov/medicaid/section-1115-demo/demonstration-and-waiver-list/82091. 56 Michigan Department of Licensing and Regulatory Affairs. “Direct Care Staff Training for Certified Facilities.” Last updated October 17, 2019. https://www.michigan.gov/lara/0,4601,7-154-89334_63294_27717-224979--,00.html. 57 Michigan Department of Licensing and Regulatory Affairs (LARA). “Nurse Aide Training Program.” Last updated April 18, 2020. https://www.michigan.gov/lara/0,4601,7-154-89334_63294_74190---,00.html. 58 Code of Federal Regulations. 1991. Requirements That Must Be Met by States and State Agencies: Nurse Aide Training and Competency Evaluation, and Paid Feeding Assistants. 42 CFR Subpart D. https://www.law.cornell.edu/cfr/text/42/part-483/subpart-D.
50
assistants’ training must cover additional health-related content, including body systems and functions. Like home health aides, nursing assistants must complete 75 hours of training (including 16 hours of clinical experience).59 Training for nursing assistants must be provided by a registered nurse with at least two years of experience, including one year in long-term care. Like home health aides, nursing assistants must pass a state-mandated written exam and demonstrate their skills in front of a registered nurse, and they must complete 12 hours of continuing education annually to maintain their certification. Stakeholder Perspectives on Training Requirements When asked in their interviews about the adequacy of training standards for direct care workers in Michigan, stakeholders’ responses fell into three categories. First, some stakeholders reported a need for better job preparedness training for entry-level direct care workers, covering topics such as professionalism and workplace communication. Second, some stakeholders mentioned a need for condition-specific training for direct care workers, especially on Alzheimer’s disease and other forms of dementia. By contrast, some other stakeholders reported that direct care training requirements are adequate and do not need to be revised or expanded.
The Direct Care Training Delivery Landscape in Michigan Unfortunately, there are no centralized data available on the supply, cost, content, or outcomes of training programs for any group of direct care workers in Michigan. To describe and assess the training delivery landscape, therefore, this report relies on in-depth interviews conducted with providers, membership associations, consumer advocates, and MI Choice waiver agencies. From these relatively limited interview data, it appears that long-term care employers in Michigan tend to design and provide their own training programs in-house, although nursing homes sometimes partner with local educational institutions to provide training. Also, one provider membership association reported that it strives to scale-up training capacity in the industry by hosting train-the-trainer sessions and distributing standardized training curricula to its members. In general, stakeholders did not report major gaps in training availability, but did note wide variation in training hours, content, and overall quality. At one end of the spectrum, some home care agencies reported they provide less than one day of training as part of their onboarding process for new hires. At other end of the spectrum, one nursing home reported providing a 120-hour nursing assistant certification course, far exceeding the required 75-hour training requirement. Stakeholder comments also suggested that although most long-term care providers do not surpass minimum entry-level training requirements, they may cover additional topics through in-service or individualized trainings. One home care agency described its commitment to ensuring that all staff benefit from an extensive range of in-service trainings (regardless of their occupational role or which clients they serve)—which it develops and offers in-house or in partnership with local community-based organizations. Stakeholders also reported that employers sometimes supplement formal training through peer mentorship programs, whereby new workers can learn from experienced workers in the field. The cost of training poses challenges for providers across long-term care settings, as training is not factored into Medicaid reimbursement rates and may yield a variable return on investment. (Cost may
59 While the federal government has waived federal training requirements, Michigan has not waived its requirements, except that nursing assistants may complete there 16 hours of practical training in a health care setting outside of nursing homes; LARA, 2020.

51
also be a prohibitive factor for potential trainees, but it was not possible in this study to ascertain the individualized costs of direct care training.) One nursing home representative explained that their nursing home once offered a free, on-site training to new job applicants, but out of the 27 people who enrolled, only 10 stayed on the job after one year. The total cost of providing training and certification for those 10 workers was $20,000, a high price tag for a smaller than anticipated cohort of long-term employees. One stakeholder reported that their home care organization requires job candidates to have a nursing assistant certification or six months of related experience, thereby reducing the need to provide extensive training for new hires. As noted, some nursing homes partner with local community colleges to provide training on site, but this approach can have downsides—if a community college offers its training program infrequently to maximize attendance, for example, the nursing home may need to wait a long time for prospective employees.
Conclusion Training requirements for direct care workers in Michigan are highly fragmented. At one end of the spectrum are training regulations for personal care aides, which require trainees to demonstrate competency in a few topics but leave many training elements (from duration to instructor qualifications) unspecified. In contrast, home health aides and nursing assistants are subject to more robust training standards under federal law, while residential care aides fall somewhere in the middle. Importantly, because requirements for personal care aides and residential care aides are thin, their training is not transferable among employers, nor does it count toward home health or nursing assistant training. Credentials are similarly non-transferable among home health aide and nursing assistant positions, despite the overlapping competencies these positions require. This lack of portability impedes the mobility of individual workers and the flexibility of the full direct care workforce. In the field, the inadequacy of training regulations leads to wide variation in training delivery. Some employers provide the bare minimum training to meet requirements—often because of financial constraints—whereas others go above and beyond, for example by offering specialized training on specific conditions. A new long-term care financing system in Michigan could aim to improve and standardize training requirements for all direct care workers in order to achieve parity for workers and the consumers they serve across long-term care settings, programs, and populations. The new system could also ensure that key training data are collected by the state to systematically address training gaps and quality concerns.

52
Hearing from Those Most Impacted: Care Recipients, Families, and Direct Care Workers The voices of those who need and provide long-term supports and services (LTSS) help ground this study in the real needs of Michigan residents. Directly asking the people who receive care about their experiences elucidates their particular needs, challenges, and priorities. This chapter reviews the learnings from listening sessions and individual interviews that were conducted to inform the study results and infuse future policy recommendations with real-life relevance. Family and unpaid caregivers described a range of pressures and needs. Numerous unpaid caregivers expressed their concern about the paid home care workers who assist their loved ones. They acknowledged the challenges that home care workers face, including low wages, long hours, transportation barriers, and difficult on-the-job responsibilities. Direct care workers also explained the issues that impact their ability to work in their chosen professions.
Methods The listening sessions and individual interviews, which were held in November 2019 across three regions of the state, provided opportunities for care recipients, family and unpaid caregivers, and direct care workers to tell their care stories and provide researchers with a rich background story of the real-world issues, challenges, joys and sorrows of care in Michigan. The majority of participants were either family and unpaid caregivers or direct care workers (in equal numbers), while a small number of care recipients also participated. Session attendance was 13 participants in Kalamazoo; 17 participants in Grand Rapids; and 25 participants in Detroit. These participation rates surpassed the original goal of an average of 15 attendees per session. Michigan United, a non-profit advocacy and community organizing agency, provided a small stipend to each participant as well as gas cards to those who traveled farther than 50 miles to attend. In addition, Michigan United conducted 10 telephone interviews with care recipients, family and unpaid caregivers, and direct care workers in Michigan’s Upper Peninsula. The agenda for each listening session began with a description of the legislative language establishing the long-term care then facilitators from Michigan United described the purpose of the session and the ground rules (which were to provide personal statements related to LTSS and care, with eight minutes allowed per person), then asked each participant to introduce themselves. Each participant then took a turn describing their care story and experiences receiving or providing care. Michigan United audio-recorded each session for reference only and Altarum staff took detailed written notes.
Care Recipient Perspectives People using services expressed several consistent themes: a strong desire to remain at home rather than moving into institutional care; a preference for controlling their own lives and services; appreciation for the paid and unpaid caregivers who assist them; a need for well-trained direct care workers; the link between the consistent assignment of direct care workers and service quality; and a need for higher wages and benefits for direct care workers.
According to AARP’s 2019 report, Valuing the Invaluable, Michigan’s 1.3 million family caregivers provided 1.1 billion hours of care – an average of about 850 unpaid hours of care per year from each caregiver. These hours, if valued at $13.66 per hour, would cost $15 billion dollars, if not provided by family and close friends. Supporting those who provide unpaid care is an essential part of strengthening the whole long-term care system in Michigan.
53
Individuals who need supports clearly articulated a preference for living in their own homes rather than in nursing home or other residential care settings. This preference was most often expressed with reference to having used nursing home care for short-term rehabilitation or post-hospital care to recover and regain strength or function in order to return home. Care recipients also discussed the balance between autonomy and choice, on one hand, and the difficulties of finding, managing, and training direct care workers that comes with self-determination options. Having a sense of control over their lives was named as a priority by care recipients, but they also expressed a strong need for support and guidance to arrange for care. Several people said they floundered trying to navigate hard-to-understand benefits and direct care worker recruitment tasks before they encountered local agencies that help organize care, assistance, and support from care managers. Some spoke of feeling alone when trying to hire direct care workers without any support and experiencing uncertainty about how to recruit, screen, train, and retain workers. Local agencies, such as Area Agencies on Aging, were cited by care recipients as helpful in facilitating connections to home care providers and direct care workers and in providing organized plans of care, equipment resources, assistance with Medicaid paperwork and other resources they need in their homes. Care recipients using Medicare or Medicaid who reported having access to such organizations appeared to be generally satisfied with the home care they were receiving. Care recipients also expressed great appreciation and care for the paid and unpaid caregivers in their lives. They often spoke of concern for the well-being of family or friends who assist them and reported monitoring their stress and thinking about how to bring in more paid help to support them. Similarly, care recipients were mindful of their paid direct care workers’ job conditions, hours, pay, and other concerns. Care recipients said they acutely feel the need for higher wages and benefits for direct care workers. They reported understanding the difficulties these workers have meeting their own needs when working for low wages without benefits or sick time and expressed empathy for their workers’ economic struggles. Further, care recipients expressed a need for well-trained direct care workers and described multiple instances of having to train direct care workers in their homes. While people generally did not mind teaching new workers how to best care for them, several care recipients said that better basic training would benefit both themselves and the direct care workers, who want to do well in their jobs and could avoid physical injury (from improper transfers, for example) and attain higher quality of care. Listening session participants also linked consistency of direct care worker assignment to quality of care. In addition to developing detailed knowledge of the individual’s personal needs and a related skill set, direct care workers who support the same care recipients over time are better able to form relationships that enhance both their lives. Care recipients expressed higher confidence in their direct care workers when they had the same caregiver over time and felt more secure in their ability to stay in their homes when they had a consistent person or set of people providing services.
Family and Unpaid Caregivers’ Perspectives Family caregivers and other unpaid caregivers with close relationships to care recipients provide the majority of hands-on care in Michigan. The challenges described by caregivers included: financing care while maintaining their own financial wellbeing; a lack of help navigating care and benefits; difficulty finding assistance; the physical and emotional tolls of caregiving; and poor direct care worker job quality. Unpaid caregivers described their surprise at the cost of care for their loved ones. Most were accustomed to paying co-pays and deductibles for other types of health care and planned for that type
54
of expense. Participants stated that the lack of coverage and high out-of-pocket costs of LTSS came as a surprise and in many cases, they only found out about the financial impact of LTSS as they were experiencing it. Additionally, unpaid caregivers spoke of their own financial struggles related to caregiving. Several had to leave their own jobs to provide care. Some moved across the country to provide care. Some purchased housing to live with their loved one and because moves were often made in emergent situations, some took financial losses on their previous property. Some unpaid caregivers experienced catastrophic financial losses like foreclosure on their own homes and bankruptcy. Unpaid caregivers described using up their own retirement savings while caregiving. Others had to take part time or lower paying jobs to have flexible time for caregiving and many reported problems with employment such as missing work and using up their own sick leave to provide care. Another theme in unpaid caregivers’ comments was the need for assistance in finding, organizing, and paying for care. Some found assistance through local Area Agencies on Aging. However, most had not found any guidance for unpaid caregivers. Families did not know where to go for help and they experienced challenges navigating a complicated and decentralized process to find the resources and support they need to care for their loved one. Even families who had some previous personal or professional experience with aging services found the process of securing help for their loved ones complicated and hard to understand. Those caregivers expressed wonder that others managed to get care without the same knowledge or experience. Unpaid caregivers also spoke of a lack of care coordination, with the hospital not knowing what the nursing home knows, or the home care agency or individual required to find out on their own what the person needs. Unpaid caregivers felt that they were left to coordinate care as best they could and felt ill-prepared for these tasks. Even with knowledge and skills, they reported that it is difficult to get different parts of the system (e.g. hospitals, doctors, pharmacies, nursing homes, or home care providers) to work together and avoid undermining each other—and the person’s care plan and wishes. Another concern raised by unpaid caregivers was the difficulty maintaining their own physical and emotional health. Several reported neglecting own physical and mental health care because of the time and effort required to provide full-time care for a family member. Caregivers spoke of a lack of exercise, high blood pressure, sleep deprivation, difficulty maintaining good nutrition, losing control of their diabetes, and physical injuries from caregiving. The demands of caregiving were sometimes all-consuming and the sense that they are all on their own fed into this pattern of lacking self-care. Regarding emotional health, family caregivers said they were honored to provide care, but that caregiving exacts a toll. They experienced much distress from issues like lack of time for their children, an inability to relax or socialize, and the pressure of responsibility for their loved one.
Direct Care Worker Perspectives Common threads in direct care workers’ comments were: having a strong personal connection to their work and pride in doing it well; the need for better and more comprehensive training; the need for higher wages and more benefits versus the need to work multiple jobs; and the need for emotional support, especially when dealing with grief. Direct care workers all spoke about how much they love providing care and about the sense of pride they feel in helping others live their best lives. Several workers acknowledged that they could earn more by working in lower-stress sectors like retail or fast food, but their care work gave them a feeling of accomplishment in assisting others.

55
However, direct care workers also spoke of the low wages and benefits that they receive and the income insecurity inherent in their roles. When a client dies or moves into a different care setting, their job ends. If they work as an independent provider, there is often no unemployment benefit or other income replacement program for them. Some direct care workers spoke of losing their car, credit, or housing because of the lack of stability in their income. Others spoke with regret about having to work long hours at multiple jobs just to make ends meet. All who addressed wages said they love their work but need to pay their own bills and are not able to completely devote themselves to direct care work due to the low pay and lack of benefits. Several said they may have to leave direct care work altogether for the sake of their own families. Overall, direct care workers expressed a strong desire for structural supports to make it possible for them to stay in their field of choice. Workers also expressed the need for better-quality, more comprehensive training. They felt the need for more training to manage difficult behaviors, to stay safe in difficult household circumstances, to properly perform transfers and other manual care tasks, and to communicate and work effectively with people with dementia. Finally, some direct care workers described challenges they faced dealing with grief. When a care recipient dies, there is often nothing more for the worker than a brief notification from the agency or family. Workers expressed a wish to participate in commemorating their clients’ lives and a need for support for their own emotional wellbeing.
Conclusion The three groups most impacted by LTSS--care recipients, direct care workers, and family caregivers—experience different but intertwined challenges and rewards. An overarching theme from all their remarks is the strong wish for mutual support and improvements in each other’s wellbeing. All three groups of participants viewed each other as partners in care and described a deep respect for the others’ contributions. The listening sessions and individual interviews analyzed here showed that families care for their loved ones with LTSS needs, but also admire and care for the direct care workers who support their situations. Direct care workers form close bonds with their clients and are concerned about the stresses they see families undergo. And care recipients appreciate both paid and unpaid caregivers for the roles they play in assisting them to live their lives in dignity and security. Policy recommendations that impact one of these groups should be designed to support all three groups and should also account for any unintended impacts on the other two. For example, any new benefit option for care recipients should be designed to address family caregivers’ support needs and the need for better wages and benefits for direct care workers. Requirements for direct care worker training must consider the individualized learning that is also needed to meet individual clients’ needs and preferences. Family supports must consider how to also address direct care workers’ and care recipients’ needs to optimize the system of long-term care.

56
Conclusions and Recommendations This study, which was commissioned by the Michigan Department of Health and Human Services (MDHHS), sought to examine the current long-term services and supports (LTSS) workforce in Michigan and to assess the state’s future LTSS workforce needs. The research showed that, even though the LTSS workforce in Michigan plays a critical role in service delivery for older adults and people with disabilities, direct care workers are extremely low-paid, while licensed professionals are often compensated at lower rates than their counterparts in acute care settings. Another challenge for direct care workers in particular is the inadequate, fragmented training landscape—which falls short of ensuring a consistent supply of confident, well-prepared workers to fill vacant positions. Stakeholders interviewed for this study reported that, as a result of these and other job quality concerns, there are widespread gaps in the workforce, with direct care worker recruitment and retention the most pressing concern. Without intervention, vacancies in the LTSS workforce will only increase in the coming years—even as the growing population of older adults continues to drive up demand for LTSS—which will exacerbate the challenges faced by unpaid family caregivers that were also reported in this research. The following recommendations aim to address these issues by strengthening LTSS policies and programs and better supporting LTSS consumers, family caregivers, and the long-term care workforce that serves them.
Strengthening the Long-Term Care Workforce Improve compensation for Michigan’s direct care workforce. Direct care workers in Michigan earn a median wage of just $12.49 per hour and their median annual earnings are $16,600 per year. Not only does poor compensation weaken direct care workers’ economic security, but it also contributes to high turnover in the workforce and undermines recruitment efforts.
KEY STRATEGIES • Provide direct care workers with a family-sustaining wage. New and existing long-term care
financing programs in Michigan should ensure direct care workers are sufficiently compensated to support themselves and their families without public assistance. Wage floors or wage pass-throughs should be structured to account for variation in cost of living across regions of the state and over time.
• Require racial and gender-based equity in compensation practices. Collecting demographic and wage data from employers could help the state develop and enforce policies to address race and gender-based disparities in the direct care workforce.
• Promote full-time hours for those who want them. Full-time scheduling would help increase direct workers’ annual compensation and optimize scheduling and deployment of the workforce. Full-time schedules could be achieved using innovative tools that connect workers with available cases or shifts.
• Provide workers with benefits. Factoring health insurance, paid leave, and retirement contributions (among other benefits) into reimbursement rates would help workers transition off public supports—without fear of sudden disruption to their benefits—and achieve economic self-sufficiency.

57
Invest in direct care workforce recruitment and retention in Michigan. As the growing older population in Michigan drives up demand for long-term care services, it is imperative that the state adopt a coordinated, multi-faceted approach to improving workforce recruitment and retention across occupational roles and care settings.
KEY STRATEGIES • Convene a standing body of diverse stakeholders to inform statewide direct care workforce
development activities. Developing effective solutions to direct care workforce challenges requires input from a diverse range of stakeholders—including direct care workers, consumers, and family members; service providers; state policymakers; and more.
• Establish a state program to fund innovative projects that strengthen direct care workforce recruitment and retention. Program priorities should focus on interventions to improve supervision, expand childcare resources, offer transportation assistance, or enhance racial and gender equity in employment practices, among others. The program funding should be sufficient to allow for rigorous evaluation of each initiative, toward the goal of scaling-up successful models.
• Launch a workforce development program aimed at recruiting, training, and deploying new direct care workers where they are most needed. Following a public-private partnership model, long-term care providers and the state could work together to launch communications campaigns, offer free training, develop resources to connect job seekers with employers, and provide retention incentives to new workers.
• Establish a matching service registry. These free, online job boards can assist self-directing consumers with finding and retaining workers, while also helping consumer-directed workers to build their work schedules.60 This resource could build on the existing offline registry offered under Michigan’s Home Help program, and it should be expanded to serve consumers and workers across programs and payment models.61
Strengthen training for direct care workers across long-term care settings and programs in Michigan. The direct care workforce training landscape is fractured and inadequate in Michigan, with inconsistent training standards across settings, wide variation in training quality among employers, and limited portability of training credentials for workers. These shortfalls compromise care quality, workers’ skills and confidence, and overall workforce capacity.
KEY STRATEGIES • Mandate the use of high-quality, direct care training curricula. Well-developed, standardized
training curricula and competency assessment methods should be implemented for direct care workers in all roles and settings.
• Enact a stackable, portable credentialing system for direct care workers. Enabling workers to carry recognized training credentials across employers and settings would help optimize the existing direct care workforce and maximize training resources. Training records for credentialed workers should be housed in a searchable online registry.
60 PHI. “Matching Service Registries.” Accessed June 4, 2020. https://phinational.org/advocacy/matching-service-registries/. 61 Michigan Department of Health and Human Services (MDHHS). 2016. Home Help Services. Lansing, MI: MDHHS. https://www.michigan.gov/documents/dhs/DHS-PUB-0815_198252_7.pdf.

58
• Designate funds for entry-level training for direct care workers. State-level investment in training would allow long-term care employers and training providers to enhance their training programs to meet new and existing requirements.
• Allocate funds to pilot-test and scale-up advanced roles for direct care workers. Advanced roles include: condition-specific specialists, senior aides, peer mentors, and training assistants, among others. Providing career advancement opportunities within direct care can increase the value of the workforce by improving the health and wellness of consumers (e.g. by preventing avoidable hospitalizations). These roles can also strengthen recruitment and retention among advanced workers and the workers whom they support (e.g. through mentor-mentee relationships). Reimbursement rates should be structured to support wage increases commensurate with additional training and new responsibilities.
Strengthen long-term care workforce data collection and reporting in Michigan. This report identifies several limitations in the available data on the long-term care workforce in Michigan—which hinder efforts to identify and address workforce shortages. Public survey data on workforce employment and wages, for example, conceal key differences among direct care workers and exclude consumer-directed workers altogether—and no data on workforce stability and gaps are currently collected. While there are more data available on the size and characteristics of licensed professionals in Michigan, it will be important to track indicators of shortages specific to long-term care settings, especially for RNs and LPNs.
KEY STRATEGIES • Collect detailed data on the size and compensation of the direct workforce across settings,
payers, programs, and employment models. These data could be collected through provider surveys and administrative data from state agencies, Prepaid Inpatient Health Plans (PIHPs), county-based Home Help programs, and other private and public entities.
• Measure long-term care workforce stability and shortage indicators. For both direct care and licensed positions, these measures should include, but are not limited to, workforce turnover, job vacancies, time to fill vacancies, and unfilled service hours among long-term care consumers.
• Publish workforce data and make them widely available. State policymakers, long-term care providers, and other stakeholders should be able to access data on the direct care workforce for policy and program development as well as for evaluation and research purposes.
Supporting Family Caregivers Improve navigation assistance for Michigan’s family caregivers. During listening sessions, families and other unpaid caregivers consistently reported difficulties finding and accessing available supports and services. Issues of complex, or hard to locate information about what services exist in their area, eligibility criteria, and how to initiate services were named as contributors to stress and burnout in their caregiving roles.
KEY STRATEGIES • Review and assess current web-based sources for information on care families can access.
Current information systems (web-based, print, telephone-based) should be assessed by a neutral party who can make detailed findings about the adequacy, accuracy, and completeness of information provided to consumers. Such a review should include a “secret shopper”
59
component to gain real-world information about how well the systems work and what improvements are needed.
• Engage current Aging and Disability Resource Centers (ADRC), Area Agencies on Aging, and Centers for Independent Living to specify strengths and weaknesses of current website and toll-free ADRC services. Local agencies that already have experience with information systems for consumers in need of LTSS will have considerable understanding and input about what improvements the systems need. Tapping this expertise is an effective and efficient way to learn about strengths and weaknesses of current systems.
• Pilot new models of navigation assistance, such as hands-on help from trained navigators. The addition of a navigator role will require state and federal funding to assure that navigators are widely available and fully informed about available services. Any new navigation service must be conflict-free and structured so as not to allow self-referral or any gain by a particular provider.
• Engage other community resources like hospital discharge planners and 211 to enhance their ability to access and distribute timely and accurate information to families. Broadening the reach of systems that assist consumers in accessing LTSS will add different viewpoints to the assessment of the information services. Inclusion of these community partners is also a step toward broader recognition of human needs and toward further integration of LTSS with other service types.
Create new funding and benefit structures to support family caregivers in Michigan. Family and unpaid caregivers assisting people who need LTSS spoke often of the high cost of paid services. Families reported being unprepared for the large expense of paying for LTSS, whether in-home or residential, and spoke of resulting problems like loss of housing, loss of retirement savings, and the financial impact of leaving the workforce to provide care.
KEY STRATEGIES • Develop new benefit options for people who need care to pay for some of their services and
reduce their reliance on unpaid family caregivers. Many families who participated in the study noted the need for a benefit to support their unpaid caregiving. Rather than wanting a benefit to completely replace the care they are providing, families spoke of needing a mix of paid care and services so that they can continue to be a caregiver without falling into bankruptcy.
• Create income-replacement mechanisms (similar to unemployment benefits) for families who must leave employment to provide care. Benefits that compensate unpaid caregivers who must reduce hours or leave employment would be instrumental in staving off other negative effects of lost income, like foreclosure or eviction, and reliance on other public benefits.
• Institute protections from foreclosure and eviction for family caregivers who lose income and face difficulty continuing to pay mortgage, taxes, rent or other housing costs. For instances where families are not able to replace income and their housing becomes unstable, protections to maintain their housing (and often the housing for the person receiving care) will enhance their ability to continue caregiving and, in some instances, delay institutionalization.
• Engage employers in devising new benefits and protections for their employees who are also family caregivers. Lost productivity and loss of experienced workers who are also providing care will increasingly impact employers. Engaging employers in planning for specific supports will help ensure that the needs of employers are considered in policy development.

60
Devise additional supports for Michigan’s family caregivers to improve their physical and mental/emotional health. Policy makers should encourage innovation and create pathways for dissemination of new supports that prove most beneficial to families. Supports to family caregivers will require identifying family caregivers and determining their levels of need—initial data gathering should precede policy changes.
KEY STRATEGIES • Catalogue and publicize new and existing family caregiver supports so that families can easily
identify and access them. Many local resources are known only to a small set of residents who happen to be connected to the involved organization. Information on local supports must be included in any information systems enhanced or designed to connect unpaid caregivers with services.
• Determine the capacity of current supports and develop a plan to quickly address shortfalls in support services. To maximize efficiency and assure that resources are targeted where they are most needed and effective, more data on current capacity and availability of supports is needed.
• Educate primary care physicians, pharmacists, home health providers, hospice agencies and others so they can better recognize physical and mental/emotional health issues arising from caregiving. Many service providers operate in silos without adequate knowledge of other supports that may be available to unpaid caregivers. Cross education among various provider types can raise the likelihood of timely and appropriate referrals for additional help.
• Create a toll-free hotline staffed by current or past family caregivers for family caregivers to have an outlet for frustrations and emotional stresses and a source for practical advice on issues they face in caregiving. Some issues and problems can be solved, or at least stress reduced, by connecting with peers who have similar experiences.
• Identify local culturally relevant resources for caregivers and publicize them through familiar social or faith-based entities, so that caregivers can get support that is sensitive to their families and communities. Caregivers expressed the need for support that also understands their culture and local customs and environment. Local input to new supports and access to information about supports from local trusted sources is key to getting the most effective assistance to unpaid caregivers.
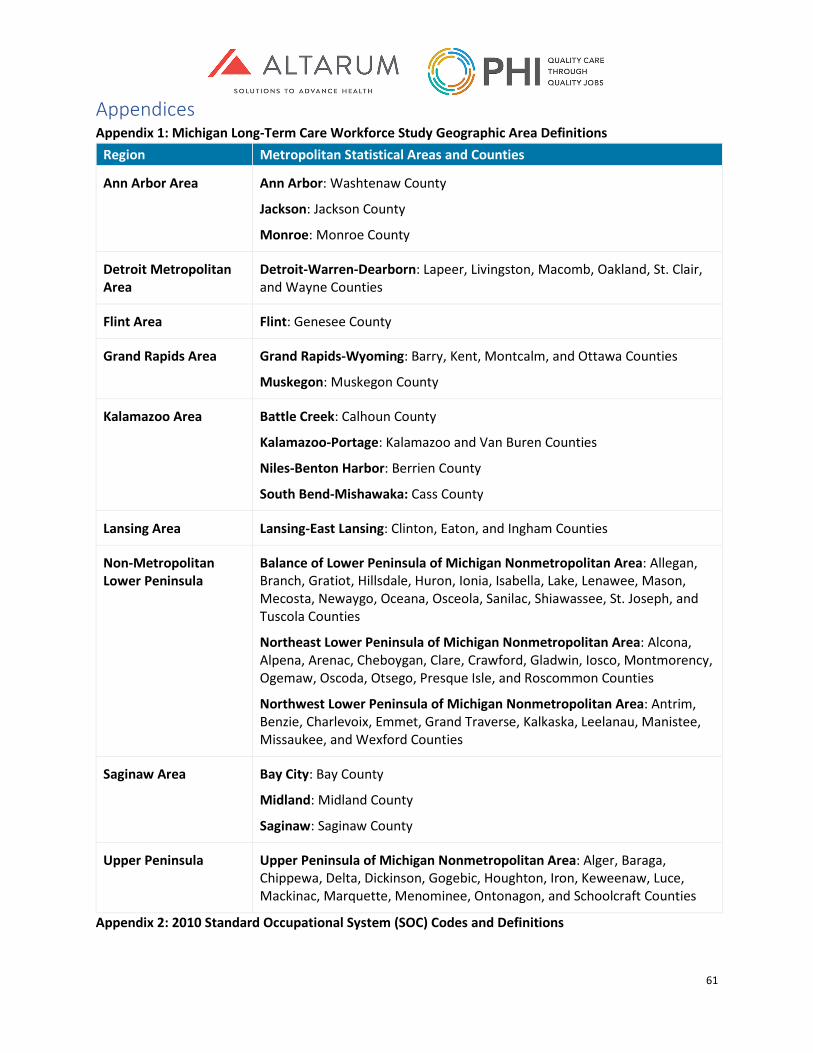
61
Appendices Appendix 1: Michigan Long-Term Care Workforce Study Geographic Area Definitions
Region Metropolitan Statistical Areas and Counties
Ann Arbor Area
Ann Arbor: Washtenaw County
Jackson: Jackson County
Monroe: Monroe County
Detroit Metropolitan Area
Detroit-Warren-Dearborn: Lapeer, Livingston, Macomb, Oakland, St. Clair, and Wayne Counties
Flint Area Flint: Genesee County
Grand Rapids Area
Grand Rapids-Wyoming: Barry, Kent, Montcalm, and Ottawa Counties
Muskegon: Muskegon County
Kalamazoo Area
Battle Creek: Calhoun County
Kalamazoo-Portage: Kalamazoo and Van Buren Counties
Niles-Benton Harbor: Berrien County
South Bend-Mishawaka: Cass County
Lansing Area
Lansing-East Lansing: Clinton, Eaton, and Ingham Counties
Non-Metropolitan Lower Peninsula
Balance of Lower Peninsula of Michigan Nonmetropolitan Area: Allegan, Branch, Gratiot, Hillsdale, Huron, Ionia, Isabella, Lake, Lenawee, Mason, Mecosta, Newaygo, Oceana, Osceola, Sanilac, Shiawassee, St. Joseph, and Tuscola Counties
Northeast Lower Peninsula of Michigan Nonmetropolitan Area: Alcona, Alpena, Arenac, Cheboygan, Clare, Crawford, Gladwin, Iosco, Montmorency, Ogemaw, Oscoda, Otsego, Presque Isle, and Roscommon Counties
Northwest Lower Peninsula of Michigan Nonmetropolitan Area: Antrim, Benzie, Charlevoix, Emmet, Grand Traverse, Kalkaska, Leelanau, Manistee, Missaukee, and Wexford Counties
Saginaw Area
Bay City: Bay County
Midland: Midland County
Saginaw: Saginaw County
Upper Peninsula
Upper Peninsula of Michigan Nonmetropolitan Area: Alger, Baraga, Chippewa, Delta, Dickinson, Gogebic, Houghton, Iron, Keweenaw, Luce, Mackinac, Marquette, Menominee, Ontonagon, and Schoolcraft Counties
Appendix 2: 2010 Standard Occupational System (SOC) Codes and Definitions
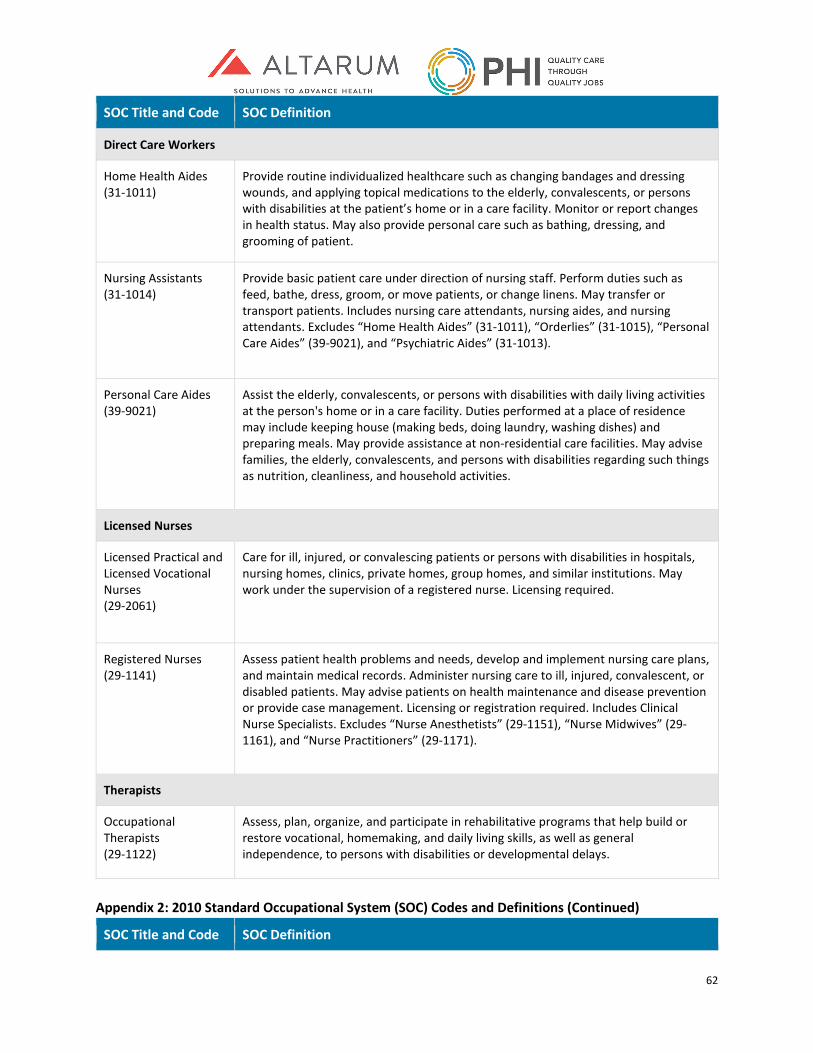
62
SOC Title and Code SOC Definition
Direct Care Workers
Home Health Aides (31-1011)
Provide routine individualized healthcare such as changing bandages and dressing wounds, and applying topical medications to the elderly, convalescents, or persons with disabilities at the patient’s home or in a care facility. Monitor or report changes in health status. May also provide personal care such as bathing, dressing, and grooming of patient.
Nursing Assistants (31-1014)
Provide basic patient care under direction of nursing staff. Perform duties such as feed, bathe, dress, groom, or move patients, or change linens. May transfer or transport patients. Includes nursing care attendants, nursing aides, and nursing attendants. Excludes “Home Health Aides” (31-1011), “Orderlies” (31-1015), “Personal Care Aides” (39-9021), and “Psychiatric Aides” (31-1013).
Personal Care Aides (39-9021)
Assist the elderly, convalescents, or persons with disabilities with daily living activities at the person's home or in a care facility. Duties performed at a place of residence may include keeping house (making beds, doing laundry, washing dishes) and preparing meals. May provide assistance at non-residential care facilities. May advise families, the elderly, convalescents, and persons with disabilities regarding such things as nutrition, cleanliness, and household activities.
Licensed Nurses
Licensed Practical and Licensed Vocational Nurses (29-2061)
Care for ill, injured, or convalescing patients or persons with disabilities in hospitals, nursing homes, clinics, private homes, group homes, and similar institutions. May work under the supervision of a registered nurse. Licensing required.
Registered Nurses (29-1141)
Assess patient health problems and needs, develop and implement nursing care plans, and maintain medical records. Administer nursing care to ill, injured, convalescent, or disabled patients. May advise patients on health maintenance and disease prevention or provide case management. Licensing or registration required. Includes Clinical Nurse Specialists. Excludes “Nurse Anesthetists” (29-1151), “Nurse Midwives” (29-1161), and “Nurse Practitioners” (29-1171).
Therapists
Occupational Therapists (29-1122)
Assess, plan, organize, and participate in rehabilitative programs that help build or restore vocational, homemaking, and daily living skills, as well as general independence, to persons with disabilities or developmental delays.
Appendix 2: 2010 Standard Occupational System (SOC) Codes and Definitions (Continued)
SOC Title and Code SOC Definition
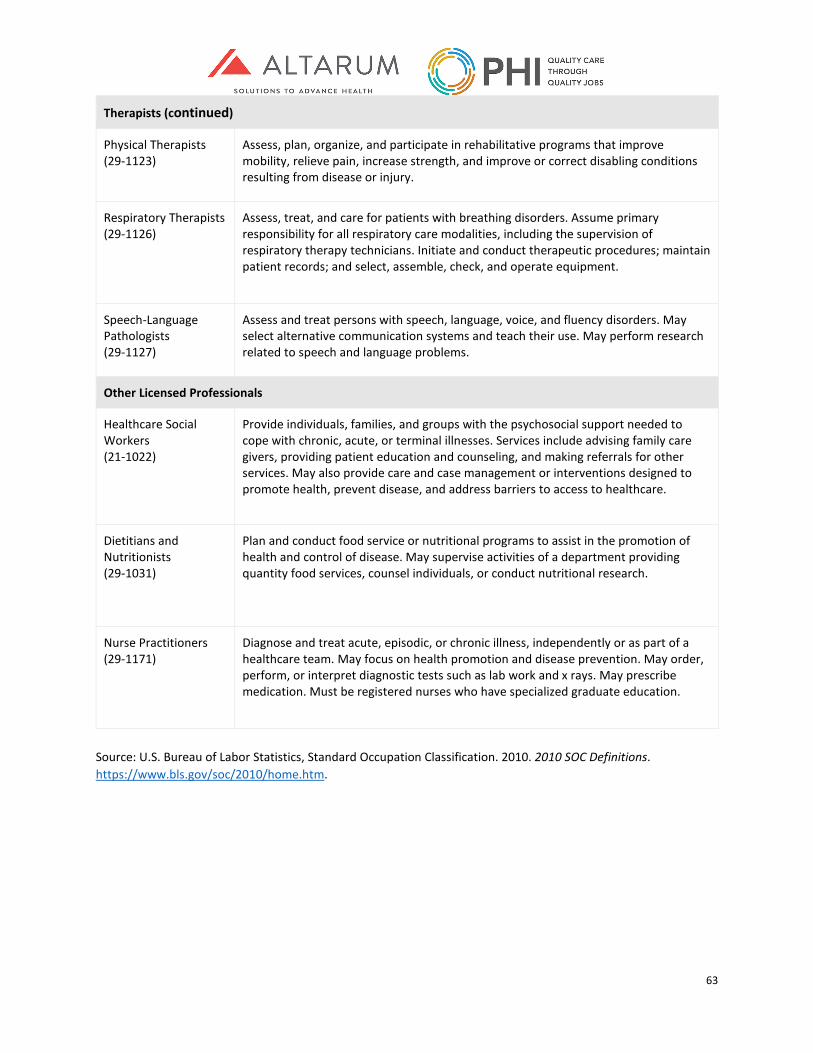
63
Therapists (continued)
Physical Therapists (29-1123)
Assess, plan, organize, and participate in rehabilitative programs that improve mobility, relieve pain, increase strength, and improve or correct disabling conditions resulting from disease or injury.
Respiratory Therapists (29-1126)
Assess, treat, and care for patients with breathing disorders. Assume primary responsibility for all respiratory care modalities, including the supervision of respiratory therapy technicians. Initiate and conduct therapeutic procedures; maintain patient records; and select, assemble, check, and operate equipment.
Speech-Language Pathologists (29-1127)
Assess and treat persons with speech, language, voice, and fluency disorders. May select alternative communication systems and teach their use. May perform research related to speech and language problems.
Other Licensed Professionals
Healthcare Social Workers (21-1022)
Provide individuals, families, and groups with the psychosocial support needed to cope with chronic, acute, or terminal illnesses. Services include advising family care givers, providing patient education and counseling, and making referrals for other services. May also provide care and case management or interventions designed to promote health, prevent disease, and address barriers to access to healthcare.
Dietitians and Nutritionists (29-1031)
Plan and conduct food service or nutritional programs to assist in the promotion of health and control of disease. May supervise activities of a department providing quantity food services, counsel individuals, or conduct nutritional research.
Nurse Practitioners (29-1171)
Diagnose and treat acute, episodic, or chronic illness, independently or as part of a healthcare team. May focus on health promotion and disease prevention. May order, perform, or interpret diagnostic tests such as lab work and x rays. May prescribe medication. Must be registered nurses who have specialized graduate education.
Source: U.S. Bureau of Labor Statistics, Standard Occupation Classification. 2010. 2010 SOC Definitions. https://www.bls.gov/soc/2010/home.htm.
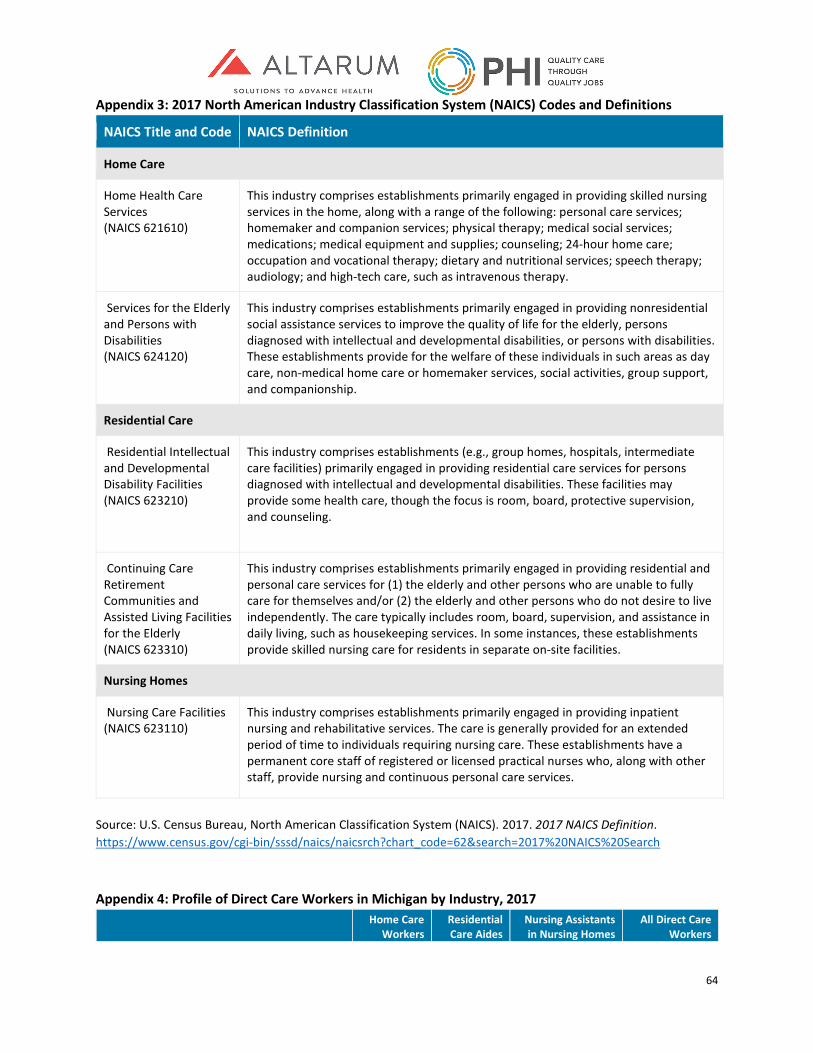
64
Appendix 3: 2017 North American Industry Classification System (NAICS) Codes and Definitions
NAICS Title and Code NAICS Definition
Home Care
Home Health Care Services (NAICS 621610)
This industry comprises establishments primarily engaged in providing skilled nursing services in the home, along with a range of the following: personal care services; homemaker and companion services; physical therapy; medical social services; medications; medical equipment and supplies; counseling; 24-hour home care; occupation and vocational therapy; dietary and nutritional services; speech therapy; audiology; and high-tech care, such as intravenous therapy.
Services for the Elderly and Persons with Disabilities (NAICS 624120)
This industry comprises establishments primarily engaged in providing nonresidential social assistance services to improve the quality of life for the elderly, persons diagnosed with intellectual and developmental disabilities, or persons with disabilities. These establishments provide for the welfare of these individuals in such areas as day care, non-medical home care or homemaker services, social activities, group support, and companionship.
Residential Care
Residential Intellectual and Developmental Disability Facilities (NAICS 623210)
This industry comprises establishments (e.g., group homes, hospitals, intermediate care facilities) primarily engaged in providing residential care services for persons diagnosed with intellectual and developmental disabilities. These facilities may provide some health care, though the focus is room, board, protective supervision, and counseling.
Continuing Care Retirement Communities and Assisted Living Facilities for the Elderly (NAICS 623310)
This industry comprises establishments primarily engaged in providing residential and personal care services for (1) the elderly and other persons who are unable to fully care for themselves and/or (2) the elderly and other persons who do not desire to live independently. The care typically includes room, board, supervision, and assistance in daily living, such as housekeeping services. In some instances, these establishments provide skilled nursing care for residents in separate on-site facilities.
Nursing Homes
Nursing Care Facilities (NAICS 623110)
This industry comprises establishments primarily engaged in providing inpatient nursing and rehabilitative services. The care is generally provided for an extended period of time to individuals requiring nursing care. These establishments have a permanent core staff of registered or licensed practical nurses who, along with other staff, provide nursing and continuous personal care services.
Source: U.S. Census Bureau, North American Classification System (NAICS). 2017. 2017 NAICS Definition. https://www.census.gov/cgi-bin/sssd/naics/naicsrch?chart_code=62&search=2017%20NAICS%20Search Appendix 4: Profile of Direct Care Workers in Michigan by Industry, 2017
Home Care
Workers Residential Care Aides
Nursing Assistants in Nursing Homes
All Direct Care Workers
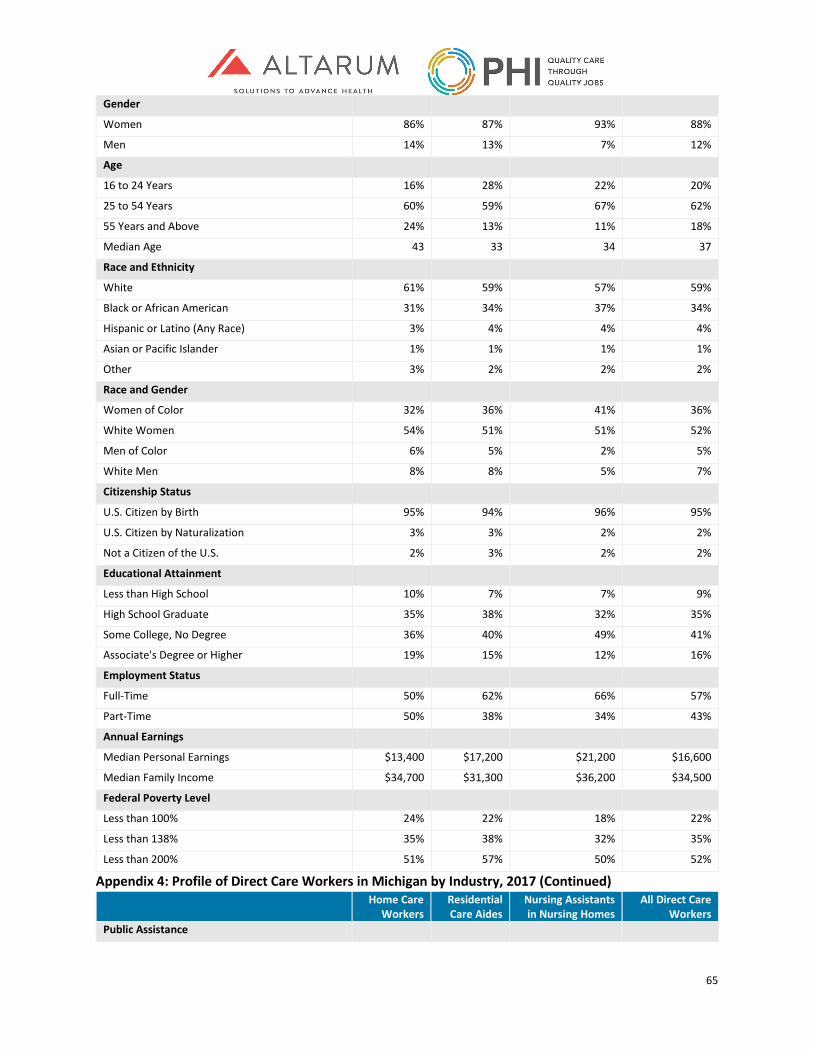
65
Gender
Women 86% 87% 93% 88%
Men 14% 13% 7% 12%
Age
16 to 24 Years 16% 28% 22% 20%
25 to 54 Years 60% 59% 67% 62%
55 Years and Above 24% 13% 11% 18%
Median Age 43 33 34 37
Race and Ethnicity
White 61% 59% 57% 59%
Black or African American 31% 34% 37% 34%
Hispanic or Latino (Any Race) 3% 4% 4% 4%
Asian or Pacific Islander 1% 1% 1% 1%
Other 3% 2% 2% 2%
Race and Gender
Women of Color 32% 36% 41% 36%
White Women 54% 51% 51% 52%
Men of Color 6% 5% 2% 5%
White Men 8% 8% 5% 7%
Citizenship Status
U.S. Citizen by Birth 95% 94% 96% 95%
U.S. Citizen by Naturalization 3% 3% 2% 2%
Not a Citizen of the U.S. 2% 3% 2% 2%
Educational Attainment
Less than High School 10% 7% 7% 9%
High School Graduate 35% 38% 32% 35%
Some College, No Degree 36% 40% 49% 41%
Associate's Degree or Higher 19% 15% 12% 16%
Employment Status
Full-Time 50% 62% 66% 57%
Part-Time 50% 38% 34% 43%
Annual Earnings
Median Personal Earnings $13,400 $17,200 $21,200 $16,600
Median Family Income $34,700 $31,300 $36,200 $34,500
Federal Poverty Level
Less than 100% 24% 22% 18% 22%
Less than 138% 35% 38% 32% 35%
Less than 200% 51% 57% 50% 52%
Appendix 4: Profile of Direct Care Workers in Michigan by Industry, 2017 (Continued) Home Care
Workers Residential Care Aides
Nursing Assistants in Nursing Homes
All Direct Care Workers
Public Assistance
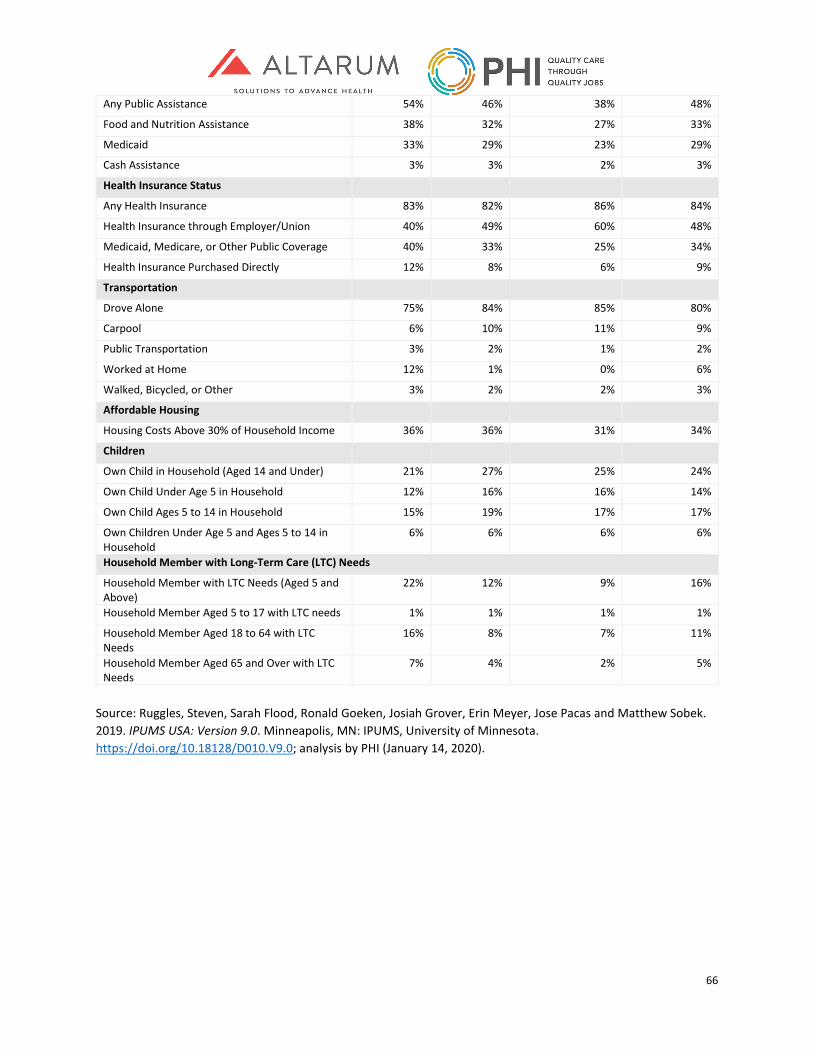
66
Any Public Assistance 54% 46% 38% 48%
Food and Nutrition Assistance 38% 32% 27% 33%
Medicaid 33% 29% 23% 29%
Cash Assistance 3% 3% 2% 3%
Health Insurance Status
Any Health Insurance 83% 82% 86% 84%
Health Insurance through Employer/Union 40% 49% 60% 48%
Medicaid, Medicare, or Other Public Coverage 40% 33% 25% 34%
Health Insurance Purchased Directly 12% 8% 6% 9%
Transportation
Drove Alone 75% 84% 85% 80%
Carpool 6% 10% 11% 9%
Public Transportation 3% 2% 1% 2%
Worked at Home 12% 1% 0% 6%
Walked, Bicycled, or Other 3% 2% 2% 3%
Affordable Housing
Housing Costs Above 30% of Household Income 36% 36% 31% 34%
Children
Own Child in Household (Aged 14 and Under) 21% 27% 25% 24%
Own Child Under Age 5 in Household 12% 16% 16% 14%
Own Child Ages 5 to 14 in Household 15% 19% 17% 17%
Own Children Under Age 5 and Ages 5 to 14 in Household
6% 6% 6% 6%
Household Member with Long-Term Care (LTC) Needs
Household Member with LTC Needs (Aged 5 and Above)
22% 12% 9% 16%
Household Member Aged 5 to 17 with LTC needs 1% 1% 1% 1%
Household Member Aged 18 to 64 with LTC Needs
16% 8% 7% 11%
Household Member Aged 65 and Over with LTC Needs
7% 4% 2% 5%
Source: Ruggles, Steven, Sarah Flood, Ronald Goeken, Josiah Grover, Erin Meyer, Jose Pacas and Matthew Sobek. 2019. IPUMS USA: Version 9.0. Minneapolis, MN: IPUMS, University of Minnesota. https://doi.org/10.18128/D010.V9.0; analysis by PHI (January 14, 2020).
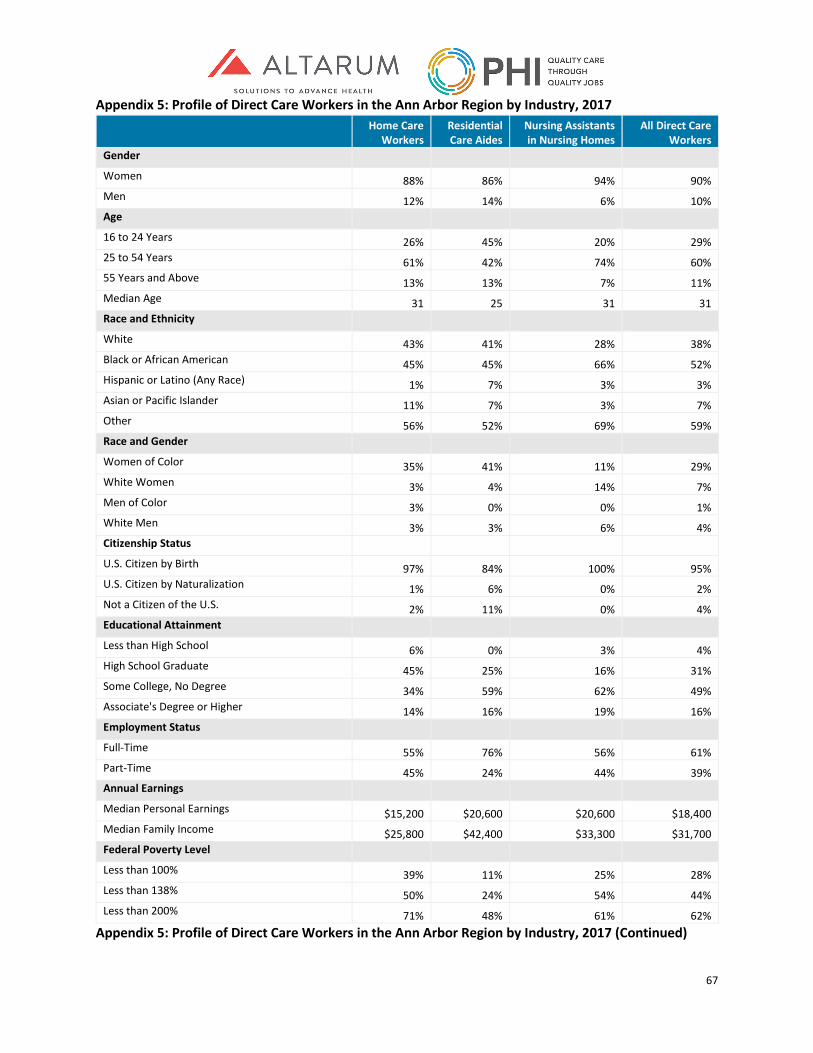
67
Appendix 5: Profile of Direct Care Workers in the Ann Arbor Region by Industry, 2017
Home Care
Workers Residential Care Aides
Nursing Assistants in Nursing Homes
All Direct Care Workers
Gender
Women 88% 86% 94% 90% Men 12% 14% 6% 10% Age 16 to 24 Years 26% 45% 20% 29% 25 to 54 Years 61% 42% 74% 60% 55 Years and Above 13% 13% 7% 11% Median Age 31 25 31 31 Race and Ethnicity White 43% 41% 28% 38% Black or African American 45% 45% 66% 52% Hispanic or Latino (Any Race) 1% 7% 3% 3% Asian or Pacific Islander 11% 7% 3% 7% Other 56% 52% 69% 59% Race and Gender Women of Color 35% 41% 11% 29% White Women 3% 4% 14% 7% Men of Color 3% 0% 0% 1% White Men 3% 3% 6% 4% Citizenship Status U.S. Citizen by Birth 97% 84% 100% 95% U.S. Citizen by Naturalization 1% 6% 0% 2% Not a Citizen of the U.S. 2% 11% 0% 4% Educational Attainment Less than High School 6% 0% 3% 4% High School Graduate 45% 25% 16% 31% Some College, No Degree 34% 59% 62% 49% Associate's Degree or Higher 14% 16% 19% 16% Employment Status Full-Time 55% 76% 56% 61% Part-Time 45% 24% 44% 39% Annual Earnings Median Personal Earnings $15,200 $20,600 $20,600 $18,400 Median Family Income $25,800 $42,400 $33,300 $31,700 Federal Poverty Level Less than 100% 39% 11% 25% 28% Less than 138% 50% 24% 54% 44% Less than 200% 71% 48% 61% 62%
Appendix 5: Profile of Direct Care Workers in the Ann Arbor Region by Industry, 2017 (Continued)
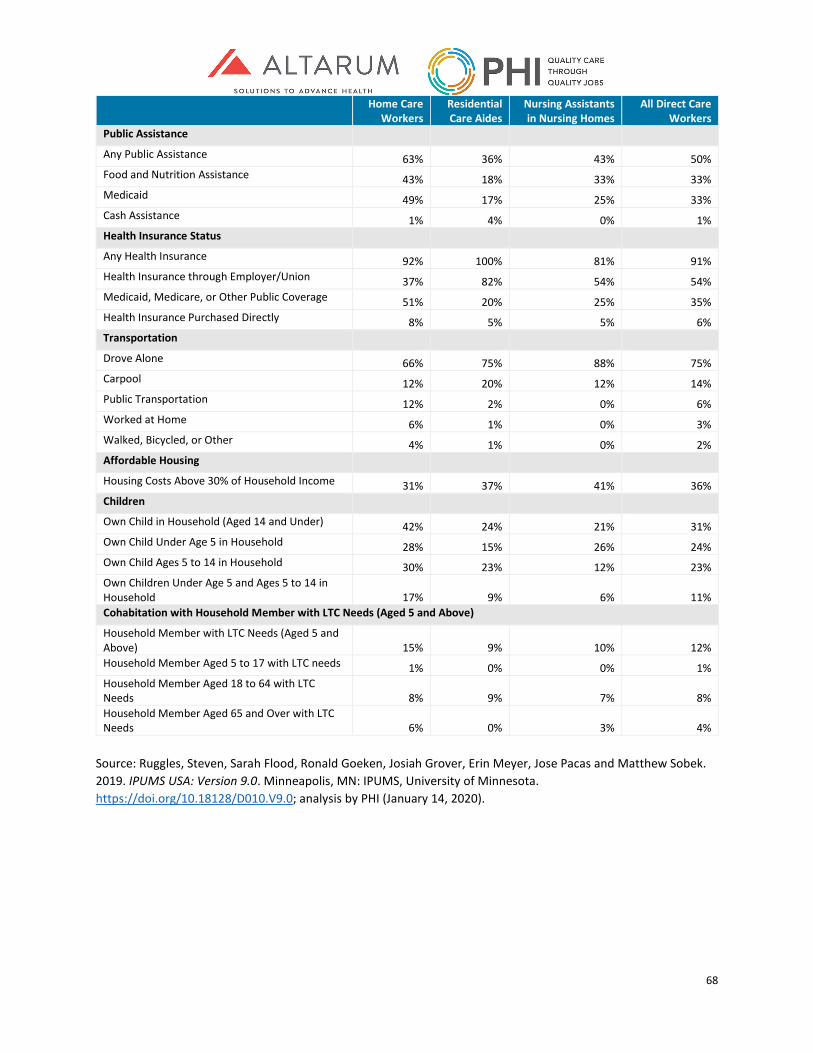
68
Home Care Workers
Residential Care Aides
Nursing Assistants in Nursing Homes
All Direct Care Workers
Public Assistance
Any Public Assistance 63% 36% 43% 50% Food and Nutrition Assistance 43% 18% 33% 33% Medicaid 49% 17% 25% 33% Cash Assistance 1% 4% 0% 1% Health Insurance Status Any Health Insurance 92% 100% 81% 91% Health Insurance through Employer/Union 37% 82% 54% 54% Medicaid, Medicare, or Other Public Coverage 51% 20% 25% 35% Health Insurance Purchased Directly 8% 5% 5% 6% Transportation Drove Alone 66% 75% 88% 75% Carpool 12% 20% 12% 14% Public Transportation 12% 2% 0% 6% Worked at Home 6% 1% 0% 3% Walked, Bicycled, or Other 4% 1% 0% 2% Affordable Housing Housing Costs Above 30% of Household Income 31% 37% 41% 36% Children Own Child in Household (Aged 14 and Under) 42% 24% 21% 31% Own Child Under Age 5 in Household 28% 15% 26% 24% Own Child Ages 5 to 14 in Household 30% 23% 12% 23% Own Children Under Age 5 and Ages 5 to 14 in Household 17% 9% 6% 11% Cohabitation with Household Member with LTC Needs (Aged 5 and Above)
Household Member with LTC Needs (Aged 5 and Above) 15% 9% 10% 12% Household Member Aged 5 to 17 with LTC needs 1% 0% 0% 1% Household Member Aged 18 to 64 with LTC Needs 8% 9% 7% 8% Household Member Aged 65 and Over with LTC Needs 6% 0% 3% 4%
Source: Ruggles, Steven, Sarah Flood, Ronald Goeken, Josiah Grover, Erin Meyer, Jose Pacas and Matthew Sobek. 2019. IPUMS USA: Version 9.0. Minneapolis, MN: IPUMS, University of Minnesota. https://doi.org/10.18128/D010.V9.0; analysis by PHI (January 14, 2020).
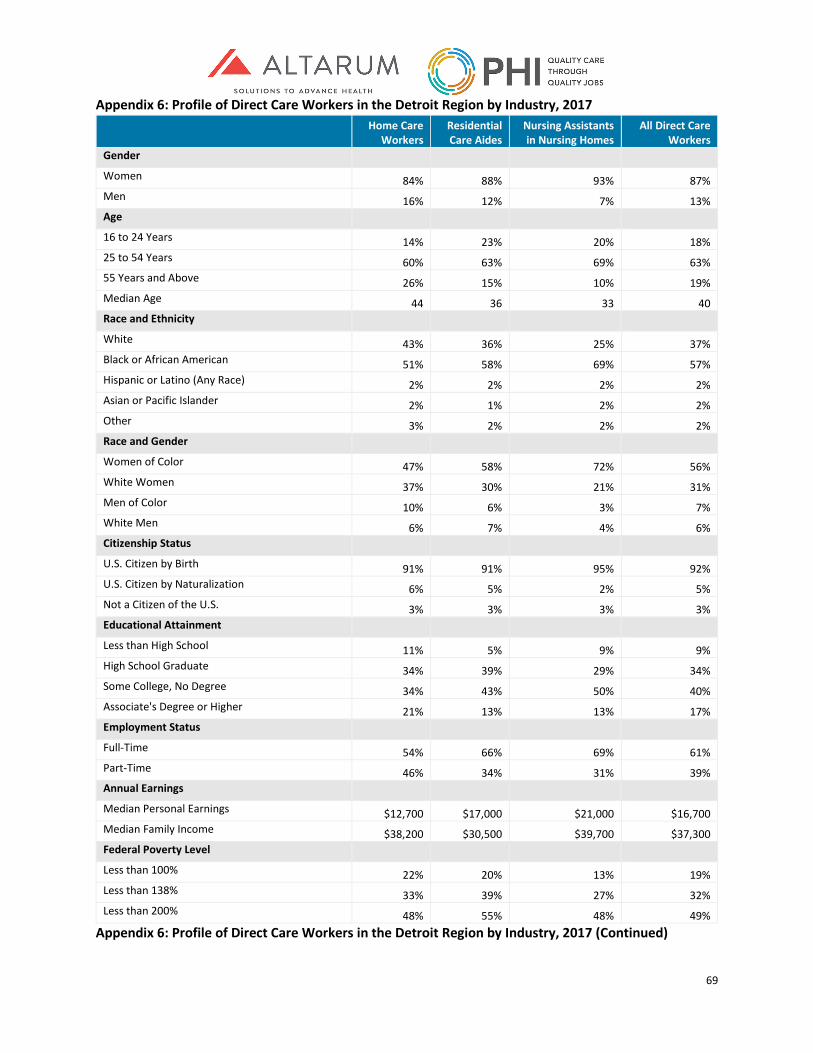
69
Appendix 6: Profile of Direct Care Workers in the Detroit Region by Industry, 2017
Home Care
Workers Residential Care Aides
Nursing Assistants in Nursing Homes
All Direct Care Workers
Gender
Women 84% 88% 93% 87% Men 16% 12% 7% 13% Age 16 to 24 Years 14% 23% 20% 18% 25 to 54 Years 60% 63% 69% 63% 55 Years and Above 26% 15% 10% 19% Median Age 44 36 33 40 Race and Ethnicity White 43% 36% 25% 37% Black or African American 51% 58% 69% 57% Hispanic or Latino (Any Race) 2% 2% 2% 2% Asian or Pacific Islander 2% 1% 2% 2% Other 3% 2% 2% 2% Race and Gender Women of Color 47% 58% 72% 56% White Women 37% 30% 21% 31% Men of Color 10% 6% 3% 7% White Men 6% 7% 4% 6% Citizenship Status U.S. Citizen by Birth 91% 91% 95% 92% U.S. Citizen by Naturalization 6% 5% 2% 5% Not a Citizen of the U.S. 3% 3% 3% 3% Educational Attainment Less than High School 11% 5% 9% 9% High School Graduate 34% 39% 29% 34% Some College, No Degree 34% 43% 50% 40% Associate's Degree or Higher 21% 13% 13% 17% Employment Status Full-Time 54% 66% 69% 61% Part-Time 46% 34% 31% 39% Annual Earnings Median Personal Earnings $12,700 $17,000 $21,000 $16,700 Median Family Income $38,200 $30,500 $39,700 $37,300 Federal Poverty Level Less than 100% 22% 20% 13% 19% Less than 138% 33% 39% 27% 32% Less than 200% 48% 55% 48% 49%
Appendix 6: Profile of Direct Care Workers in the Detroit Region by Industry, 2017 (Continued)

70
Home Care Workers
Residential Care Aides
Nursing Assistants in Nursing Homes
All Direct Care Workers
Public Assistance
Any Public Assistance 55% 44% 45% 50% Food and Nutrition Assistance 43% 29% 31% 37% Medicaid 31% 30% 28% 30% Cash Assistance 3% 2% 2% 3% Health Insurance Status Any Health Insurance 81% 77% 89% 82% Health Insurance through Employer/Union 40% 44% 61% 46% Medicaid, Medicare, or Other Public Coverage 37% 33% 30% 34% Health Insurance Purchased Directly 11% 5% 4% 8% Transportation
Drove Alone 72% 79% 82% 77% Carpool 6% 13% 12% 9% Public Transportation 4% 5% 3% 4% Worked at Home 14% 2% 0% 8% Walked, Bicycled, or Other 3% 1% 3% 2% Affordable Housing Housing Costs Above 30% of Household Income 40% 36% 37% 39% Children Own Child in Household (Aged 14 and Under) 16% 25% 24% 20% Own Child Under Age 5 in Household 10% 17% 13% 12% Own Child Ages 5 to 14 in Household 12% 14% 16% 13% Own Children Under Age 5 and Ages 5 to 14 in Household 4% 4% 3% 4% Cohabitation with Household Member with Long-Term Care (LTC) Needs
Household Member with LTC Needs (Aged 5 and Above) 25% 12% 9% 18% Household Member Aged 5 to 17 with LTC needs 1% 1% 1% 1% Household Member Aged 18 to 64 with LTC Needs 18% 8% 6% 13% Household Member Aged 65 and Over with LTC Needs 9% 5% 3% 7%
Source: Ruggles, Steven, Sarah Flood, Ronald Goeken, Josiah Grover, Erin Meyer, Jose Pacas and Matthew Sobek. 2019. IPUMS USA: Version 9.0. Minneapolis, MN: IPUMS, University of Minnesota. https://doi.org/10.18128/D010.V9.0; analysis by PHI (January 14, 2020).
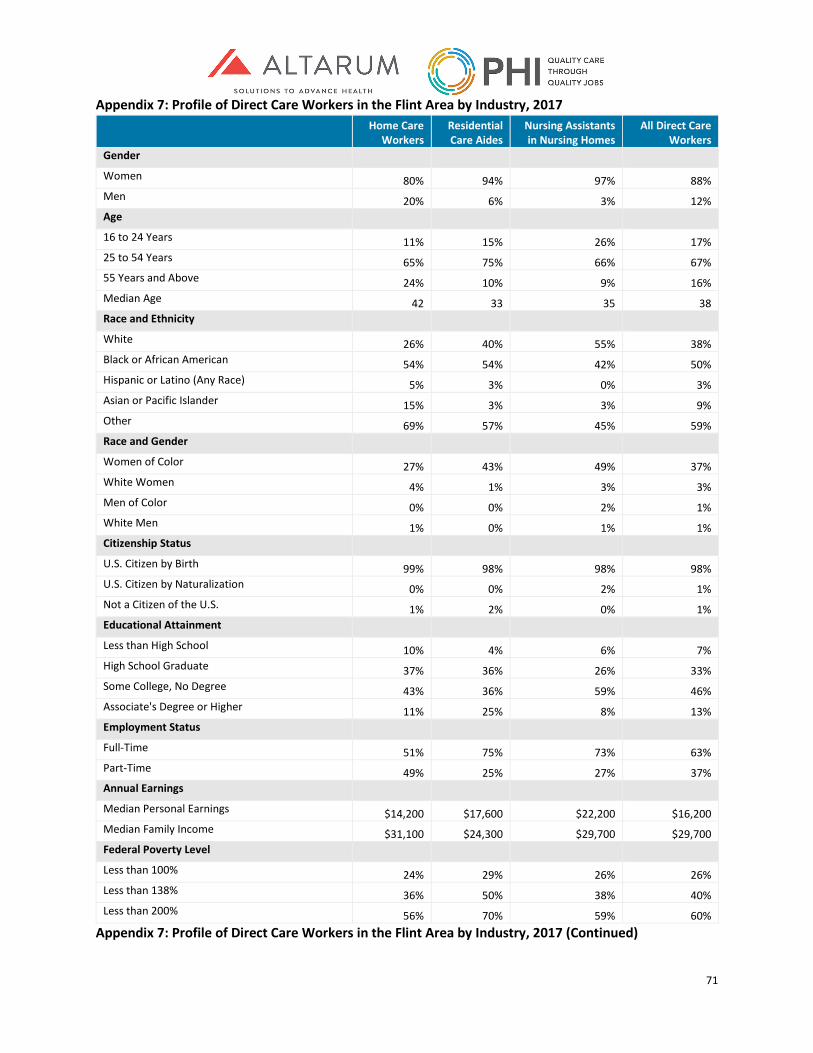
71
Appendix 7: Profile of Direct Care Workers in the Flint Area by Industry, 2017
Home Care
Workers Residential Care Aides
Nursing Assistants in Nursing Homes
All Direct Care Workers
Gender Women 80% 94% 97% 88% Men 20% 6% 3% 12% Age 16 to 24 Years 11% 15% 26% 17% 25 to 54 Years 65% 75% 66% 67% 55 Years and Above 24% 10% 9% 16% Median Age 42 33 35 38 Race and Ethnicity White 26% 40% 55% 38% Black or African American 54% 54% 42% 50% Hispanic or Latino (Any Race) 5% 3% 0% 3% Asian or Pacific Islander 15% 3% 3% 9% Other 69% 57% 45% 59% Race and Gender
Women of Color 27% 43% 49% 37% White Women 4% 1% 3% 3% Men of Color 0% 0% 2% 1% White Men 1% 0% 1% 1% Citizenship Status U.S. Citizen by Birth 99% 98% 98% 98% U.S. Citizen by Naturalization 0% 0% 2% 1% Not a Citizen of the U.S. 1% 2% 0% 1% Educational Attainment Less than High School 10% 4% 6% 7% High School Graduate 37% 36% 26% 33% Some College, No Degree 43% 36% 59% 46% Associate's Degree or Higher 11% 25% 8% 13% Employment Status Full-Time 51% 75% 73% 63% Part-Time 49% 25% 27% 37% Annual Earnings Median Personal Earnings $14,200 $17,600 $22,200 $16,200 Median Family Income $31,100 $24,300 $29,700 $29,700 Federal Poverty Level Less than 100% 24% 29% 26% 26% Less than 138% 36% 50% 38% 40% Less than 200% 56% 70% 59% 60%
Appendix 7: Profile of Direct Care Workers in the Flint Area by Industry, 2017 (Continued)
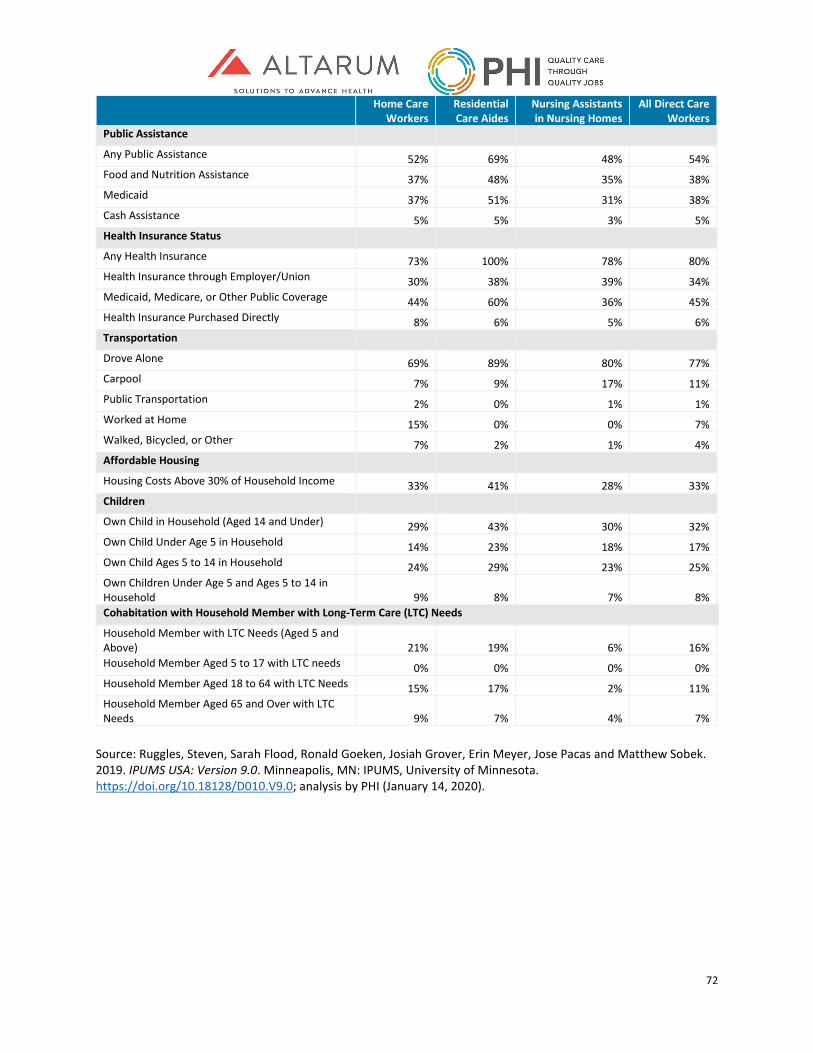
72
Home Care Workers
Residential Care Aides
Nursing Assistants in Nursing Homes
All Direct Care Workers
Public Assistance
Any Public Assistance 52% 69% 48% 54% Food and Nutrition Assistance 37% 48% 35% 38% Medicaid 37% 51% 31% 38% Cash Assistance 5% 5% 3% 5% Health Insurance Status Any Health Insurance 73% 100% 78% 80% Health Insurance through Employer/Union 30% 38% 39% 34% Medicaid, Medicare, or Other Public Coverage 44% 60% 36% 45% Health Insurance Purchased Directly 8% 6% 5% 6% Transportation Drove Alone 69% 89% 80% 77% Carpool 7% 9% 17% 11% Public Transportation 2% 0% 1% 1% Worked at Home 15% 0% 0% 7% Walked, Bicycled, or Other 7% 2% 1% 4% Affordable Housing Housing Costs Above 30% of Household Income 33% 41% 28% 33% Children Own Child in Household (Aged 14 and Under) 29% 43% 30% 32% Own Child Under Age 5 in Household 14% 23% 18% 17% Own Child Ages 5 to 14 in Household 24% 29% 23% 25% Own Children Under Age 5 and Ages 5 to 14 in Household 9% 8% 7% 8% Cohabitation with Household Member with Long-Term Care (LTC) Needs
Household Member with LTC Needs (Aged 5 and Above) 21% 19% 6% 16% Household Member Aged 5 to 17 with LTC needs 0% 0% 0% 0% Household Member Aged 18 to 64 with LTC Needs 15% 17% 2% 11% Household Member Aged 65 and Over with LTC Needs 9% 7% 4% 7%
Source: Ruggles, Steven, Sarah Flood, Ronald Goeken, Josiah Grover, Erin Meyer, Jose Pacas and Matthew Sobek. 2019. IPUMS USA: Version 9.0. Minneapolis, MN: IPUMS, University of Minnesota. https://doi.org/10.18128/D010.V9.0; analysis by PHI (January 14, 2020).

73
Appendix 8: Profile of Direct Care Workers in the Grand Rapids Region by Industry, 2017
Home Care
Workers Residential Care Aides
Nursing Assistants in Nursing Homes
All Direct Care Workers
Gender Women 91% 91% 91% 91% Men 9% 9% 9% 9% Age 16 to 24 Years 12% 25% 27% 19% 25 to 54 Years 63% 64% 62% 63% 55 Years and Above 25% 11% 11% 18% Median Age 39 32 34 37 Race and Ethnicity White 30% 25% 31% 29% Black or African American 62% 66% 61% 62% Hispanic or Latino (Any Race) 6% 1% 4% 4% Asian or Pacific Islander 3% 8% 5% 4% Other 64% 74% 65% 67% Race and Gender Women of Color 24% 22% 25% 24% White Women 9% 4% 4% 7% Men of Color 0% 0% 4% 1% White Men 2% 0% 2% 2% Citizenship Status U.S. Citizen by Birth 98% 98% 93% 96% U.S. Citizen by Naturalization 2% 0% 7% 3% Not a Citizen of the U.S. 0% 2% 0% 1% Educational Attainment Less than High School 18% 8% 4% 12% High School Graduate 28% 39% 36% 33% Some College, No Degree 31% 38% 46% 37% Associate's Degree or Higher 22% 15% 15% 18% Employment Status Full-Time 46% 66% 51% 52% Part-Time 54% 34% 49% 48% Annual Earnings Median Personal Earnings $12,500 $19,200 $20,900 $15,900 Median Family Income $43,500 $30,700 $41,800 $38,400 Federal Poverty Level Less than 100% 17% 24% 19% 19% Less than 138% 31% 31% 32% 31% Less than 200% 39% 59% 44% 45%
Appendix 8: Profile of Direct Care Workers in the Grand Rapids Region by Industry, 2017 (Continued)
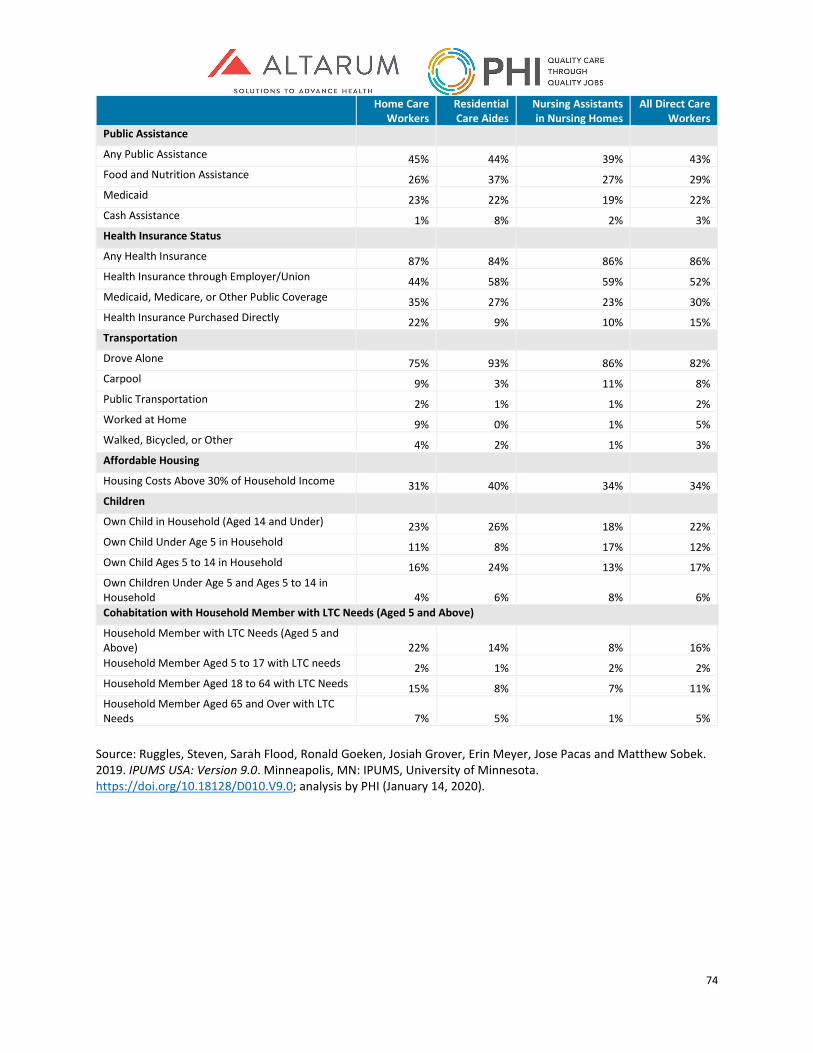
74
Home Care Workers
Residential Care Aides
Nursing Assistants in Nursing Homes
All Direct Care Workers
Public Assistance
Any Public Assistance 45% 44% 39% 43% Food and Nutrition Assistance 26% 37% 27% 29% Medicaid 23% 22% 19% 22% Cash Assistance 1% 8% 2% 3% Health Insurance Status Any Health Insurance 87% 84% 86% 86% Health Insurance through Employer/Union 44% 58% 59% 52% Medicaid, Medicare, or Other Public Coverage 35% 27% 23% 30% Health Insurance Purchased Directly 22% 9% 10% 15% Transportation Drove Alone 75% 93% 86% 82% Carpool 9% 3% 11% 8% Public Transportation 2% 1% 1% 2% Worked at Home 9% 0% 1% 5% Walked, Bicycled, or Other 4% 2% 1% 3% Affordable Housing Housing Costs Above 30% of Household Income 31% 40% 34% 34% Children Own Child in Household (Aged 14 and Under) 23% 26% 18% 22% Own Child Under Age 5 in Household 11% 8% 17% 12% Own Child Ages 5 to 14 in Household 16% 24% 13% 17% Own Children Under Age 5 and Ages 5 to 14 in Household 4% 6% 8% 6% Cohabitation with Household Member with LTC Needs (Aged 5 and Above)
Household Member with LTC Needs (Aged 5 and Above) 22% 14% 8% 16% Household Member Aged 5 to 17 with LTC needs 2% 1% 2% 2% Household Member Aged 18 to 64 with LTC Needs 15% 8% 7% 11% Household Member Aged 65 and Over with LTC Needs 7% 5% 1% 5%
Source: Ruggles, Steven, Sarah Flood, Ronald Goeken, Josiah Grover, Erin Meyer, Jose Pacas and Matthew Sobek. 2019. IPUMS USA: Version 9.0. Minneapolis, MN: IPUMS, University of Minnesota. https://doi.org/10.18128/D010.V9.0; analysis by PHI (January 14, 2020).

75
Appendix 9: Profile of Direct Care Workers in the Kalamazoo Region by Industry, 2017
Home Care
Workers Residential Care Aides
Nursing Assistants in Nursing Homes
All Direct Care Workers
Gender Women 87% 88% 85% 87% Men 13% 12% 15% 13% Age 16 to 24 Years 16% 34% 4% 17% 25 to 54 Years 55% 58% 80% 62% 55 Years and Above 29% 9% 16% 21% Median Age 45 29 38 40 Race and Ethnicity White 41% 17% 27% 32% Black or African American 46% 70% 58% 55% Hispanic or Latino (Any Race) 7% 6% 3% 6% Asian or Pacific Islander 6% 6% 12% 7% Other 51% 76% 70% 62% Race and Gender Women of Color 41% 20% 24% 31% White Women 0% 4% 5% 2% Men of Color 1% 0% 0% 0% White Men 7% 0% 1% 4% Citizenship Status U.S. Citizen by Birth 98% 98% 90% 96% U.S. Citizen by Naturalization 0% 2% 0% 1% Not a Citizen of the U.S. 2% 0% 10% 4% Educational Attainment Less than High School 7% 8% 7% 7% High School Graduate 34% 49% 39% 39% Some College, No Degree 38% 33% 33% 35% Associate's Degree or Higher 22% 10% 22% 19% Employment Status Full-Time 45% 55% 54% 50% Part-Time 55% 45% 46% 50% Annual Earnings Median Personal Earnings $13,400 $15,700 $24,300 $17,600 Median Family Income $30,600 $20,200 $35,900 $31,100 Federal Poverty Level Less than 100% 26% 32% 8% 23% Less than 138% 42% 53% 19% 39% Less than 200% 59% 68% 42% 57%
Appendix 9: Profile of Direct Care Workers in the Kalamazoo Region by Industry, 2017 (Continued)
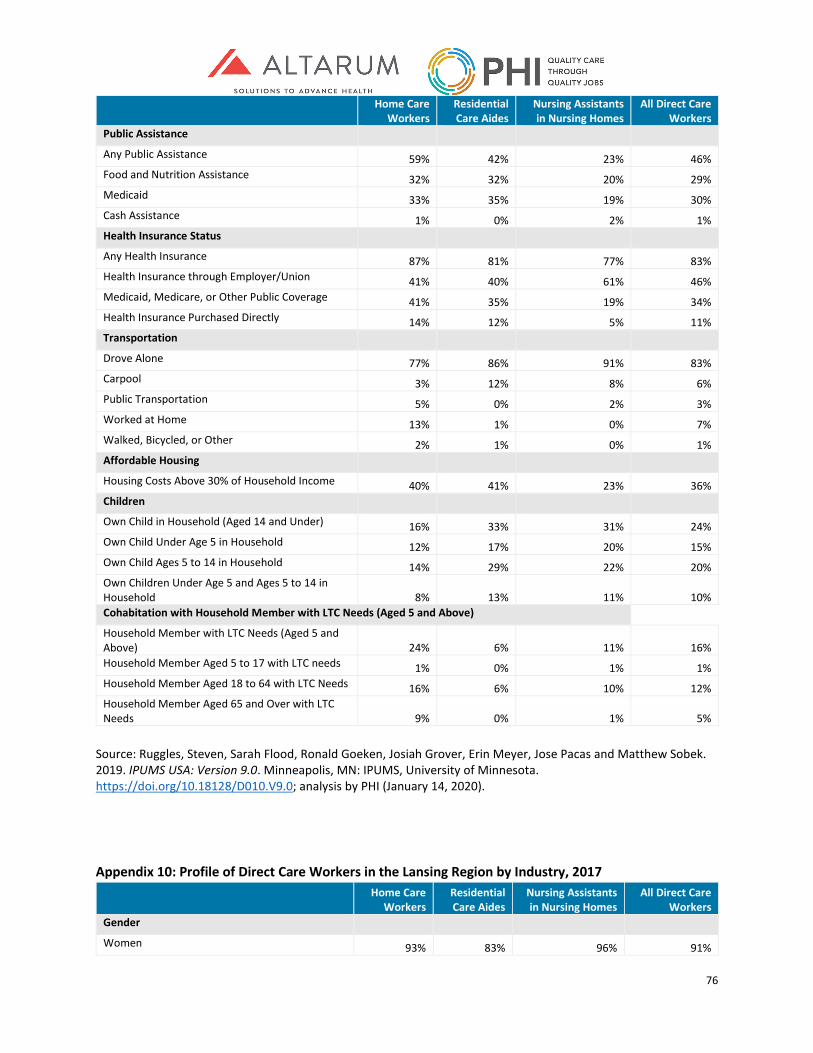
76
Home Care Workers
Residential Care Aides
Nursing Assistants in Nursing Homes
All Direct Care Workers
Public Assistance
Any Public Assistance 59% 42% 23% 46% Food and Nutrition Assistance 32% 32% 20% 29% Medicaid 33% 35% 19% 30% Cash Assistance 1% 0% 2% 1% Health Insurance Status Any Health Insurance 87% 81% 77% 83% Health Insurance through Employer/Union 41% 40% 61% 46% Medicaid, Medicare, or Other Public Coverage 41% 35% 19% 34% Health Insurance Purchased Directly 14% 12% 5% 11% Transportation Drove Alone 77% 86% 91% 83% Carpool 3% 12% 8% 6% Public Transportation 5% 0% 2% 3% Worked at Home 13% 1% 0% 7% Walked, Bicycled, or Other 2% 1% 0% 1% Affordable Housing Housing Costs Above 30% of Household Income 40% 41% 23% 36% Children Own Child in Household (Aged 14 and Under) 16% 33% 31% 24% Own Child Under Age 5 in Household 12% 17% 20% 15% Own Child Ages 5 to 14 in Household 14% 29% 22% 20% Own Children Under Age 5 and Ages 5 to 14 in Household 8% 13% 11% 10% Cohabitation with Household Member with LTC Needs (Aged 5 and Above)
Household Member with LTC Needs (Aged 5 and Above) 24% 6% 11% 16% Household Member Aged 5 to 17 with LTC needs 1% 0% 1% 1% Household Member Aged 18 to 64 with LTC Needs 16% 6% 10% 12% Household Member Aged 65 and Over with LTC Needs 9% 0% 1% 5%
Source: Ruggles, Steven, Sarah Flood, Ronald Goeken, Josiah Grover, Erin Meyer, Jose Pacas and Matthew Sobek. 2019. IPUMS USA: Version 9.0. Minneapolis, MN: IPUMS, University of Minnesota. https://doi.org/10.18128/D010.V9.0; analysis by PHI (January 14, 2020).
Appendix 10: Profile of Direct Care Workers in the Lansing Region by Industry, 2017
Home Care
Workers Residential Care Aides
Nursing Assistants in Nursing Homes
All Direct Care Workers
Gender Women 93% 83% 96% 91%

77
Men 7% 17% 4% 9% Age 16 to 24 Years 13% 33% 65% 29% 25 to 54 Years 56% 63% 28% 52% 55 Years and Above 31% 4% 7% 19% Median Age 45 27 24 32 Race and Ethnicity White 27% 14% 14% 21% Black or African American 66% 69% 82% 70% Hispanic or Latino (Any Race) 7% 14% 0% 7% Asian or Pacific Islander 0% 3% 4% 2% Other 66% 72% 86% 71% Race and Gender Women of Color 9% 18% 14% 13% White Women 15% 10% 0% 11% Men of Color 10% 0% 0% 5% White Men 0% 0% 0% 0% Citizenship Status U.S. Citizen by Birth 90% 96% 100% 94% U.S. Citizen by Naturalization 1% 4% 0% 2% Not a Citizen of the U.S. 9% 0% 0% 5% Educational Attainment Less than High School 13% 7% 0% 9% High School Graduate 36% 28% 14% 29% Some College, No Degree 30% 39% 86% 44% Associate's Degree or Higher 22% 27% 0% 18% Employment Status Full-Time 44% 41% 79% 50% Part-Time 56% 59% 21% 50% Annual Earnings Median Personal Earnings $10,600 $11,100 $23,900 $12,100 Median Family Income $41,100 $23,500 $30,300 $33,400 Federal Poverty Level Less than 100% 26% 47% 26% 31% Less than 138% 35% 52% 26% 37% Less than 200% 55% 60% 51% 55%
Appendix 10: Profile of Direct Care Workers in the Lansing Region by Industry, 2017 (Continued) Home Care
Workers Residential Care Aides
Nursing Assistants in Nursing Homes
All Direct Care Workers
Public Assistance
Any Public Assistance 58% 48% 26% 49% Food and Nutrition Assistance 37% 40% 21% 35%
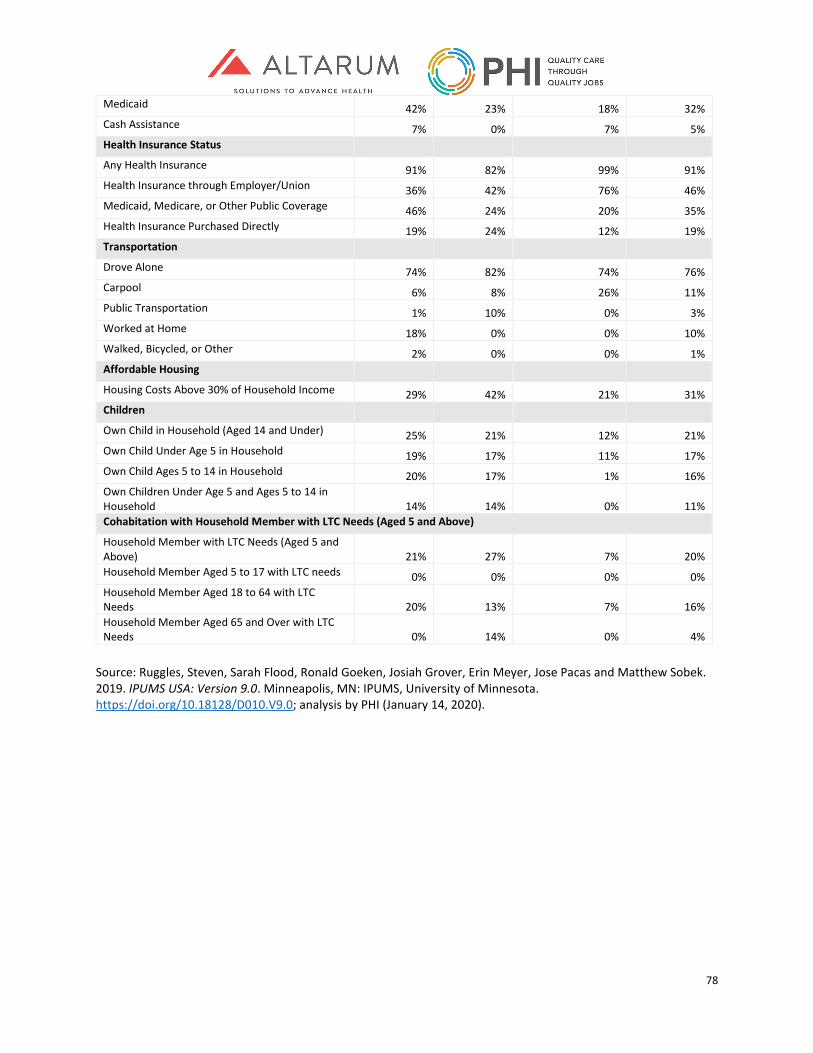
78
Medicaid 42% 23% 18% 32% Cash Assistance 7% 0% 7% 5% Health Insurance Status Any Health Insurance 91% 82% 99% 91% Health Insurance through Employer/Union 36% 42% 76% 46% Medicaid, Medicare, or Other Public Coverage 46% 24% 20% 35% Health Insurance Purchased Directly 19% 24% 12% 19% Transportation Drove Alone 74% 82% 74% 76% Carpool 6% 8% 26% 11% Public Transportation 1% 10% 0% 3% Worked at Home 18% 0% 0% 10% Walked, Bicycled, or Other 2% 0% 0% 1% Affordable Housing Housing Costs Above 30% of Household Income 29% 42% 21% 31% Children Own Child in Household (Aged 14 and Under) 25% 21% 12% 21% Own Child Under Age 5 in Household 19% 17% 11% 17% Own Child Ages 5 to 14 in Household 20% 17% 1% 16% Own Children Under Age 5 and Ages 5 to 14 in Household 14% 14% 0% 11% Cohabitation with Household Member with LTC Needs (Aged 5 and Above)
Household Member with LTC Needs (Aged 5 and Above) 21% 27% 7% 20% Household Member Aged 5 to 17 with LTC needs 0% 0% 0% 0% Household Member Aged 18 to 64 with LTC Needs 20% 13% 7% 16% Household Member Aged 65 and Over with LTC Needs 0% 14% 0% 4%
Source: Ruggles, Steven, Sarah Flood, Ronald Goeken, Josiah Grover, Erin Meyer, Jose Pacas and Matthew Sobek. 2019. IPUMS USA: Version 9.0. Minneapolis, MN: IPUMS, University of Minnesota. https://doi.org/10.18128/D010.V9.0; analysis by PHI (January 14, 2020).
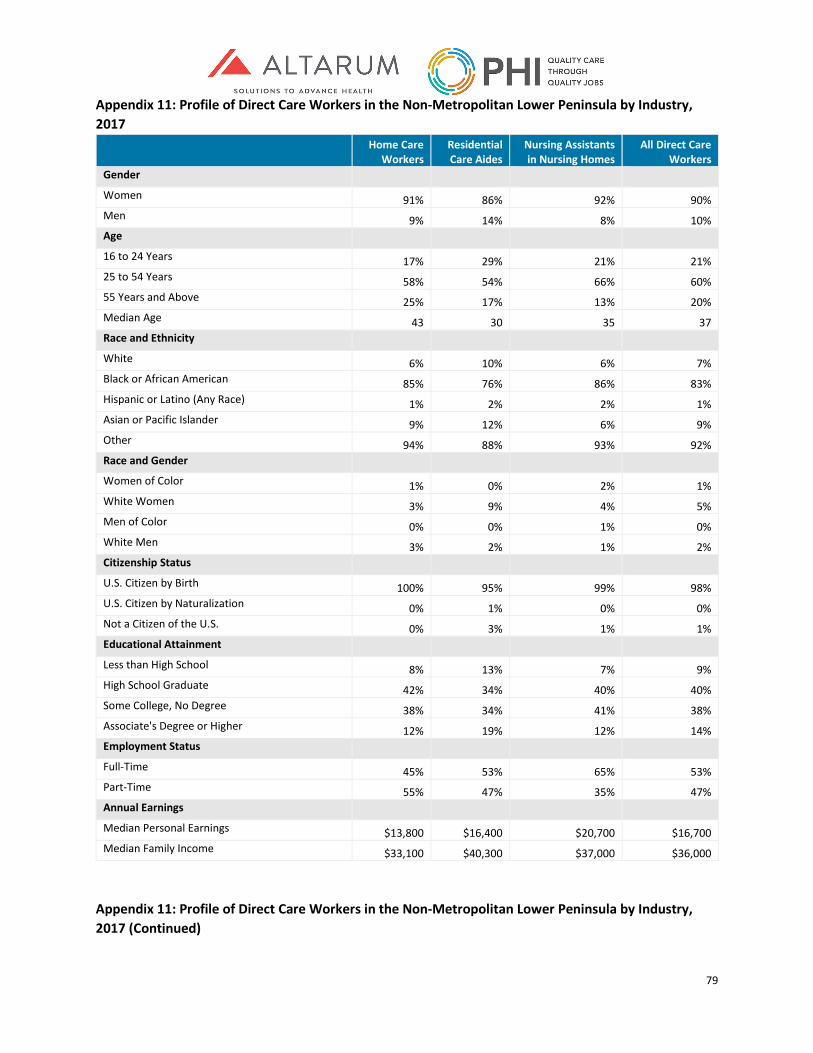
79
Appendix 11: Profile of Direct Care Workers in the Non-Metropolitan Lower Peninsula by Industry, 2017
Home Care
Workers Residential Care Aides
Nursing Assistants in Nursing Homes
All Direct Care Workers
Gender Women 91% 86% 92% 90% Men 9% 14% 8% 10% Age 16 to 24 Years 17% 29% 21% 21% 25 to 54 Years 58% 54% 66% 60% 55 Years and Above 25% 17% 13% 20% Median Age 43 30 35 37 Race and Ethnicity White 6% 10% 6% 7% Black or African American 85% 76% 86% 83% Hispanic or Latino (Any Race) 1% 2% 2% 1% Asian or Pacific Islander 9% 12% 6% 9% Other 94% 88% 93% 92% Race and Gender Women of Color 1% 0% 2% 1% White Women 3% 9% 4% 5% Men of Color 0% 0% 1% 0% White Men 3% 2% 1% 2% Citizenship Status U.S. Citizen by Birth 100% 95% 99% 98% U.S. Citizen by Naturalization 0% 1% 0% 0% Not a Citizen of the U.S. 0% 3% 1% 1% Educational Attainment Less than High School 8% 13% 7% 9% High School Graduate 42% 34% 40% 40% Some College, No Degree 38% 34% 41% 38% Associate's Degree or Higher 12% 19% 12% 14% Employment Status Full-Time 45% 53% 65% 53% Part-Time 55% 47% 35% 47% Annual Earnings Median Personal Earnings $13,800 $16,400 $20,700 $16,700 Median Family Income $33,100 $40,300 $37,000 $36,000
Appendix 11: Profile of Direct Care Workers in the Non-Metropolitan Lower Peninsula by Industry, 2017 (Continued)
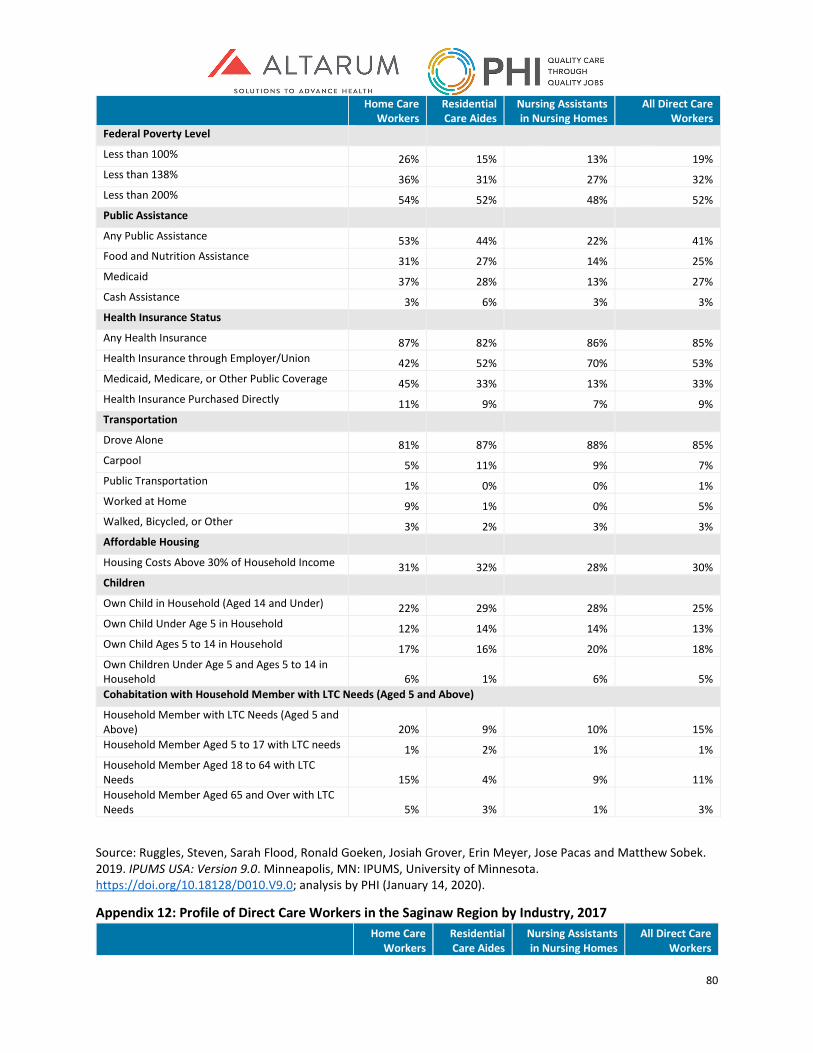
80
Home Care Workers
Residential Care Aides
Nursing Assistants in Nursing Homes
All Direct Care Workers
Federal Poverty Level Less than 100% 26% 15% 13% 19% Less than 138% 36% 31% 27% 32% Less than 200% 54% 52% 48% 52% Public Assistance
Any Public Assistance 53% 44% 22% 41% Food and Nutrition Assistance 31% 27% 14% 25% Medicaid 37% 28% 13% 27% Cash Assistance 3% 6% 3% 3% Health Insurance Status Any Health Insurance 87% 82% 86% 85% Health Insurance through Employer/Union 42% 52% 70% 53% Medicaid, Medicare, or Other Public Coverage 45% 33% 13% 33% Health Insurance Purchased Directly 11% 9% 7% 9% Transportation Drove Alone 81% 87% 88% 85% Carpool 5% 11% 9% 7% Public Transportation 1% 0% 0% 1% Worked at Home 9% 1% 0% 5% Walked, Bicycled, or Other 3% 2% 3% 3% Affordable Housing Housing Costs Above 30% of Household Income 31% 32% 28% 30% Children Own Child in Household (Aged 14 and Under) 22% 29% 28% 25% Own Child Under Age 5 in Household 12% 14% 14% 13% Own Child Ages 5 to 14 in Household 17% 16% 20% 18% Own Children Under Age 5 and Ages 5 to 14 in Household 6% 1% 6% 5% Cohabitation with Household Member with LTC Needs (Aged 5 and Above)
Household Member with LTC Needs (Aged 5 and Above) 20% 9% 10% 15% Household Member Aged 5 to 17 with LTC needs 1% 2% 1% 1% Household Member Aged 18 to 64 with LTC Needs 15% 4% 9% 11% Household Member Aged 65 and Over with LTC Needs 5% 3% 1% 3%
Source: Ruggles, Steven, Sarah Flood, Ronald Goeken, Josiah Grover, Erin Meyer, Jose Pacas and Matthew Sobek. 2019. IPUMS USA: Version 9.0. Minneapolis, MN: IPUMS, University of Minnesota. https://doi.org/10.18128/D010.V9.0; analysis by PHI (January 14, 2020).
Appendix 12: Profile of Direct Care Workers in the Saginaw Region by Industry, 2017
Home Care
Workers Residential Care Aides
Nursing Assistants in Nursing Homes
All Direct Care Workers
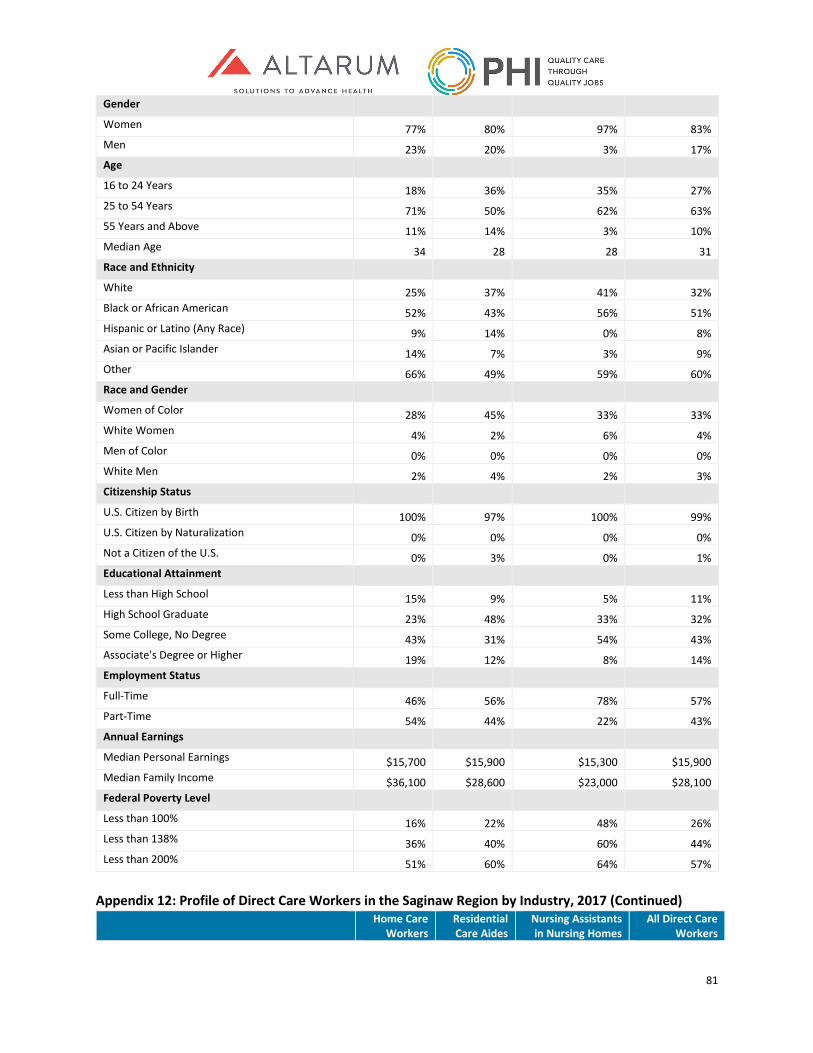
81
Gender Women 77% 80% 97% 83% Men 23% 20% 3% 17% Age 16 to 24 Years 18% 36% 35% 27% 25 to 54 Years 71% 50% 62% 63% 55 Years and Above 11% 14% 3% 10% Median Age 34 28 28 31 Race and Ethnicity White 25% 37% 41% 32% Black or African American 52% 43% 56% 51% Hispanic or Latino (Any Race) 9% 14% 0% 8% Asian or Pacific Islander 14% 7% 3% 9% Other 66% 49% 59% 60% Race and Gender Women of Color 28% 45% 33% 33% White Women 4% 2% 6% 4% Men of Color 0% 0% 0% 0% White Men 2% 4% 2% 3% Citizenship Status U.S. Citizen by Birth 100% 97% 100% 99% U.S. Citizen by Naturalization 0% 0% 0% 0% Not a Citizen of the U.S. 0% 3% 0% 1% Educational Attainment Less than High School 15% 9% 5% 11% High School Graduate 23% 48% 33% 32% Some College, No Degree 43% 31% 54% 43% Associate's Degree or Higher 19% 12% 8% 14% Employment Status Full-Time 46% 56% 78% 57% Part-Time 54% 44% 22% 43% Annual Earnings Median Personal Earnings $15,700 $15,900 $15,300 $15,900 Median Family Income $36,100 $28,600 $23,000 $28,100 Federal Poverty Level Less than 100% 16% 22% 48% 26% Less than 138% 36% 40% 60% 44% Less than 200% 51% 60% 64% 57%
Appendix 12: Profile of Direct Care Workers in the Saginaw Region by Industry, 2017 (Continued)
Home Care Workers
Residential Care Aides
Nursing Assistants in Nursing Homes
All Direct Care Workers

82
Public Assistance
Any Public Assistance 50% 65% 52% 55% Food and Nutrition Assistance 41% 49% 49% 45% Medicaid 33% 33% 29% 32% Cash Assistance 3% 6% 1% 3% Health Insurance Status Any Health Insurance 84% 76% 83% 82% Health Insurance through Employer/Union 42% 42% 44% 43% Medicaid, Medicare, or Other Public Coverage 36% 36% 30% 35% Health Insurance Purchased Directly 7% 4% 3% 5% Transportation Drove Alone 87% 86% 95% 89% Carpool 8% 6% 5% 7% Public Transportation 0% 0% 0% 0% Worked at Home 3% 2% 0% 2% Walked, Bicycled, or Other 2% 7% 0% 2% Affordable Housing Housing Costs Above 30% of Household Income 26% 27% 21% 25% Children Own Child in Household (Aged 14 and Under) 24% 26% 41% 29% Own Child Under Age 5 in Household 14% 22% 41% 23% Own Child Ages 5 to 14 in Household 18% 14% 23% 18% Own Children Under Age 5 and Ages 5 to 14 in Household 7% 10% 22% 12% Cohabitation with Household Member with LTC Needs (Aged 5 and Above)
Household Member with LTC Needs (Aged 5 and Above) 9% 12% 13% 11% Household Member Aged 5 to 17 with LTC needs 1% 0% 3% 1% Household Member Aged 18 to 64 with LTC Needs 7% 12% 10% 9% Household Member Aged 65 and Over with LTC Needs 2% 0% 0% 1%
Source: Ruggles, Steven, Sarah Flood, Ronald Goeken, Josiah Grover, Erin Meyer, Jose Pacas and Matthew Sobek. 2019. IPUMS USA: Version 9.0. Minneapolis, MN: IPUMS, University of Minnesota. https://doi.org/10.18128/D010.V9.0; analysis by PHI (January 14, 2020).
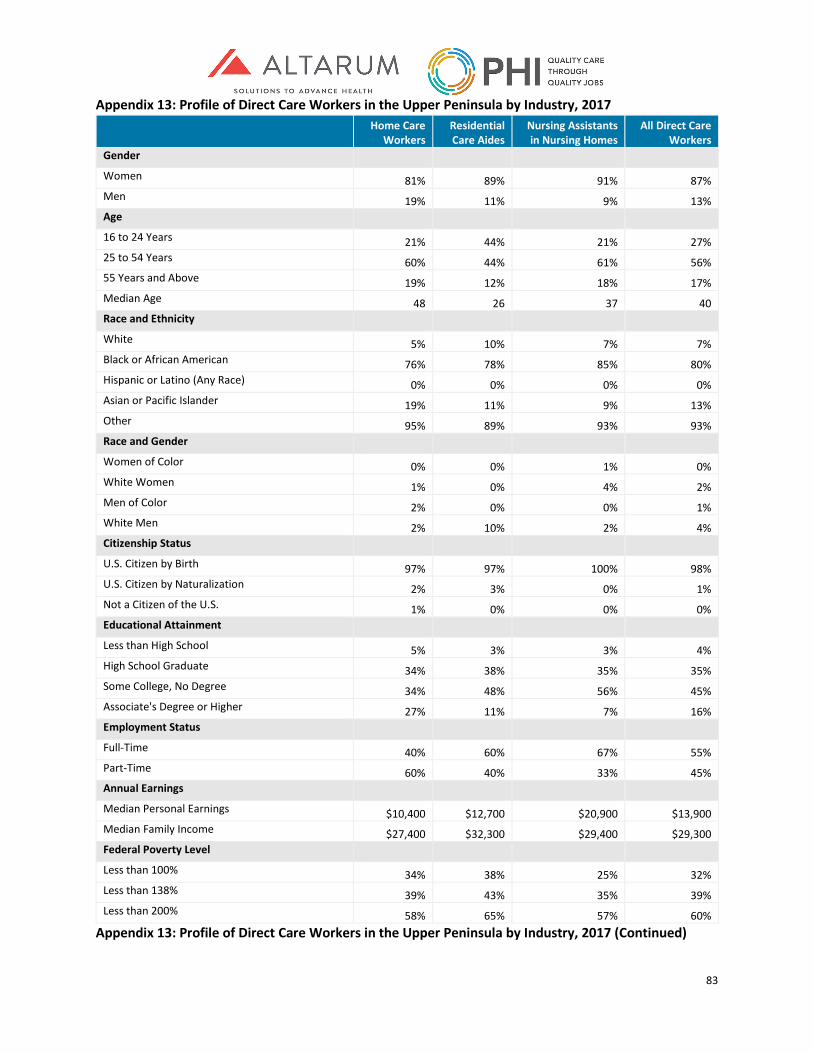
83
Appendix 13: Profile of Direct Care Workers in the Upper Peninsula by Industry, 2017
Home Care
Workers Residential Care Aides
Nursing Assistants in Nursing Homes
All Direct Care Workers
Gender Women 81% 89% 91% 87% Men 19% 11% 9% 13% Age 16 to 24 Years 21% 44% 21% 27% 25 to 54 Years 60% 44% 61% 56% 55 Years and Above 19% 12% 18% 17% Median Age 48 26 37 40 Race and Ethnicity White 5% 10% 7% 7% Black or African American 76% 78% 85% 80% Hispanic or Latino (Any Race) 0% 0% 0% 0% Asian or Pacific Islander 19% 11% 9% 13% Other 95% 89% 93% 93% Race and Gender Women of Color 0% 0% 1% 0% White Women 1% 0% 4% 2% Men of Color 2% 0% 0% 1% White Men 2% 10% 2% 4% Citizenship Status U.S. Citizen by Birth 97% 97% 100% 98% U.S. Citizen by Naturalization 2% 3% 0% 1% Not a Citizen of the U.S. 1% 0% 0% 0% Educational Attainment Less than High School 5% 3% 3% 4% High School Graduate 34% 38% 35% 35% Some College, No Degree 34% 48% 56% 45% Associate's Degree or Higher 27% 11% 7% 16% Employment Status Full-Time 40% 60% 67% 55% Part-Time 60% 40% 33% 45% Annual Earnings Median Personal Earnings $10,400 $12,700 $20,900 $13,900 Median Family Income $27,400 $32,300 $29,400 $29,300 Federal Poverty Level Less than 100% 34% 38% 25% 32% Less than 138% 39% 43% 35% 39% Less than 200% 58% 65% 57% 60%
Appendix 13: Profile of Direct Care Workers in the Upper Peninsula by Industry, 2017 (Continued)
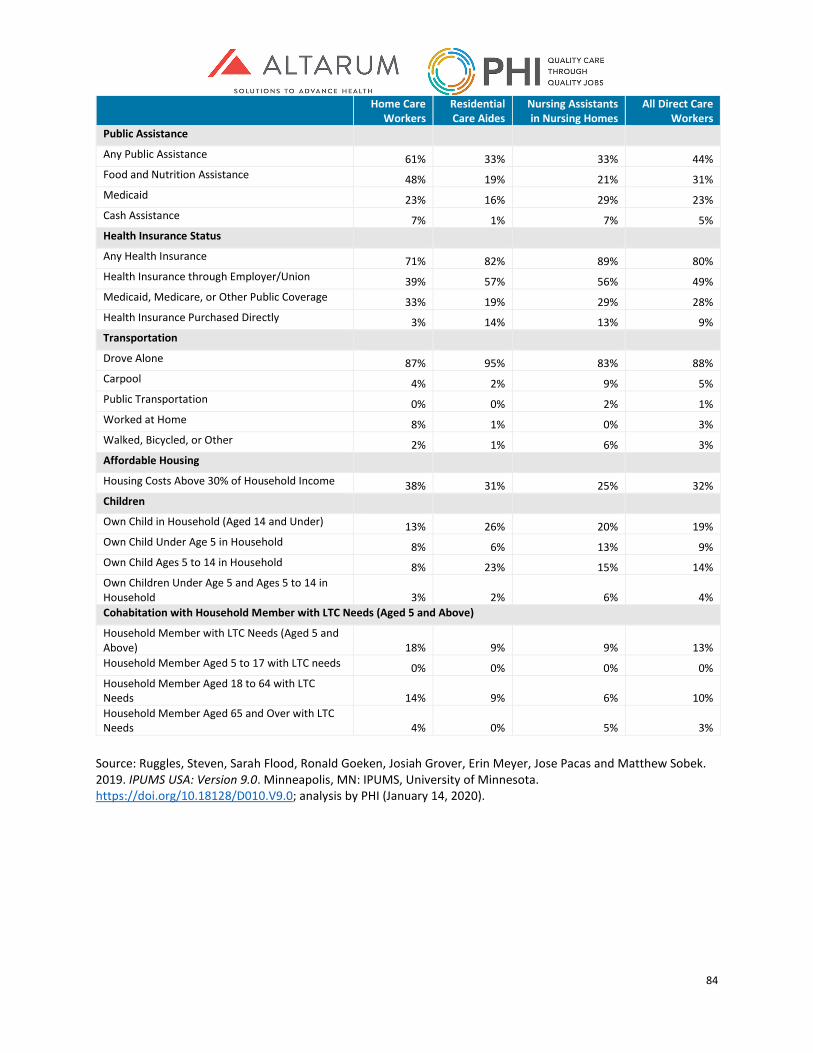
84
Home Care Workers
Residential Care Aides
Nursing Assistants in Nursing Homes
All Direct Care Workers
Public Assistance
Any Public Assistance 61% 33% 33% 44% Food and Nutrition Assistance 48% 19% 21% 31% Medicaid 23% 16% 29% 23% Cash Assistance 7% 1% 7% 5% Health Insurance Status Any Health Insurance 71% 82% 89% 80% Health Insurance through Employer/Union 39% 57% 56% 49% Medicaid, Medicare, or Other Public Coverage 33% 19% 29% 28% Health Insurance Purchased Directly 3% 14% 13% 9% Transportation Drove Alone 87% 95% 83% 88% Carpool 4% 2% 9% 5% Public Transportation 0% 0% 2% 1% Worked at Home 8% 1% 0% 3% Walked, Bicycled, or Other 2% 1% 6% 3% Affordable Housing Housing Costs Above 30% of Household Income 38% 31% 25% 32% Children Own Child in Household (Aged 14 and Under) 13% 26% 20% 19% Own Child Under Age 5 in Household 8% 6% 13% 9% Own Child Ages 5 to 14 in Household 8% 23% 15% 14% Own Children Under Age 5 and Ages 5 to 14 in Household 3% 2% 6% 4% Cohabitation with Household Member with LTC Needs (Aged 5 and Above)
Household Member with LTC Needs (Aged 5 and Above) 18% 9% 9% 13% Household Member Aged 5 to 17 with LTC needs 0% 0% 0% 0% Household Member Aged 18 to 64 with LTC Needs 14% 9% 6% 10% Household Member Aged 65 and Over with LTC Needs 4% 0% 5% 3%
Source: Ruggles, Steven, Sarah Flood, Ronald Goeken, Josiah Grover, Erin Meyer, Jose Pacas and Matthew Sobek. 2019. IPUMS USA: Version 9.0. Minneapolis, MN: IPUMS, University of Minnesota. https://doi.org/10.18128/D010.V9.0; analysis by PHI (January 14, 2020).
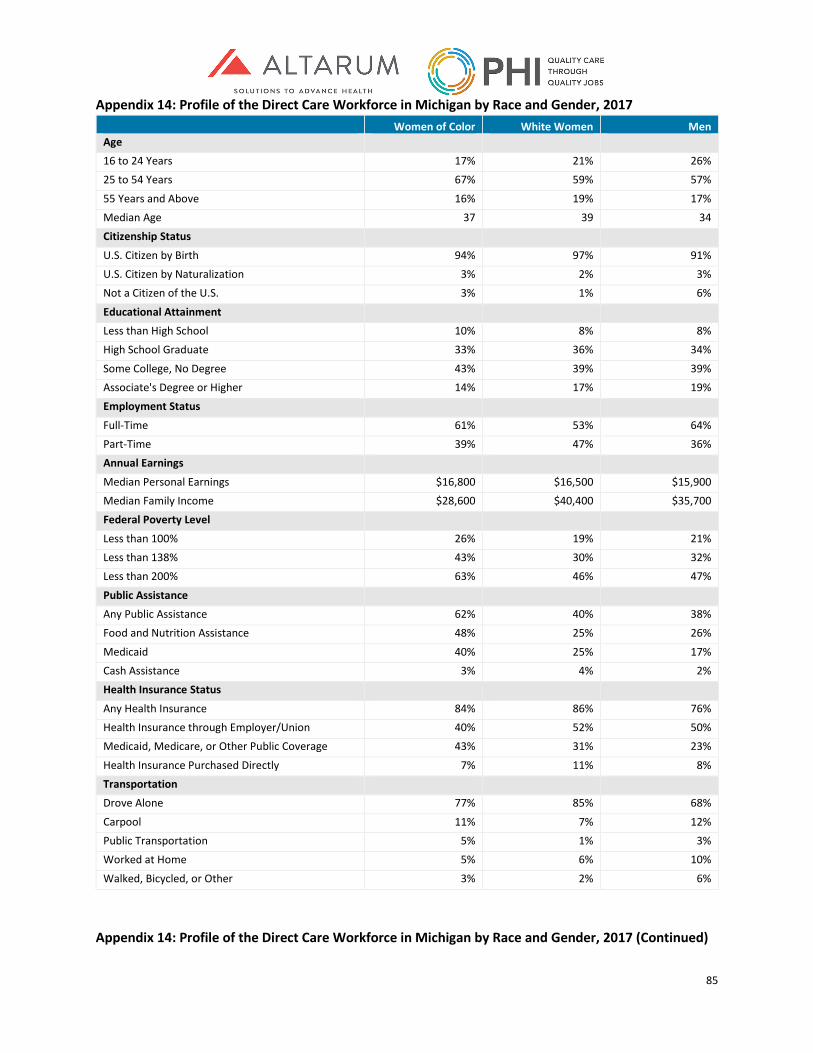
85
Appendix 14: Profile of the Direct Care Workforce in Michigan by Race and Gender, 2017 Women of Color White Women Men
Age 16 to 24 Years 17% 21% 26% 25 to 54 Years 67% 59% 57%
55 Years and Above 16% 19% 17% Median Age 37 39 34 Citizenship Status
U.S. Citizen by Birth 94% 97% 91% U.S. Citizen by Naturalization 3% 2% 3% Not a Citizen of the U.S. 3% 1% 6%
Educational Attainment Less than High School 10% 8% 8% High School Graduate 33% 36% 34%
Some College, No Degree 43% 39% 39% Associate's Degree or Higher 14% 17% 19% Employment Status
Full-Time 61% 53% 64% Part-Time 39% 47% 36% Annual Earnings
Median Personal Earnings $16,800 $16,500 $15,900 Median Family Income $28,600 $40,400 $35,700 Federal Poverty Level
Less than 100% 26% 19% 21% Less than 138% 43% 30% 32% Less than 200% 63% 46% 47%
Public Assistance Any Public Assistance 62% 40% 38% Food and Nutrition Assistance 48% 25% 26%
Medicaid 40% 25% 17% Cash Assistance 3% 4% 2% Health Insurance Status
Any Health Insurance 84% 86% 76% Health Insurance through Employer/Union 40% 52% 50% Medicaid, Medicare, or Other Public Coverage 43% 31% 23%
Health Insurance Purchased Directly 7% 11% 8% Transportation Drove Alone 77% 85% 68%
Carpool 11% 7% 12% Public Transportation 5% 1% 3% Worked at Home 5% 6% 10%
Walked, Bicycled, or Other 3% 2% 6%
Appendix 14: Profile of the Direct Care Workforce in Michigan by Race and Gender, 2017 (Continued)
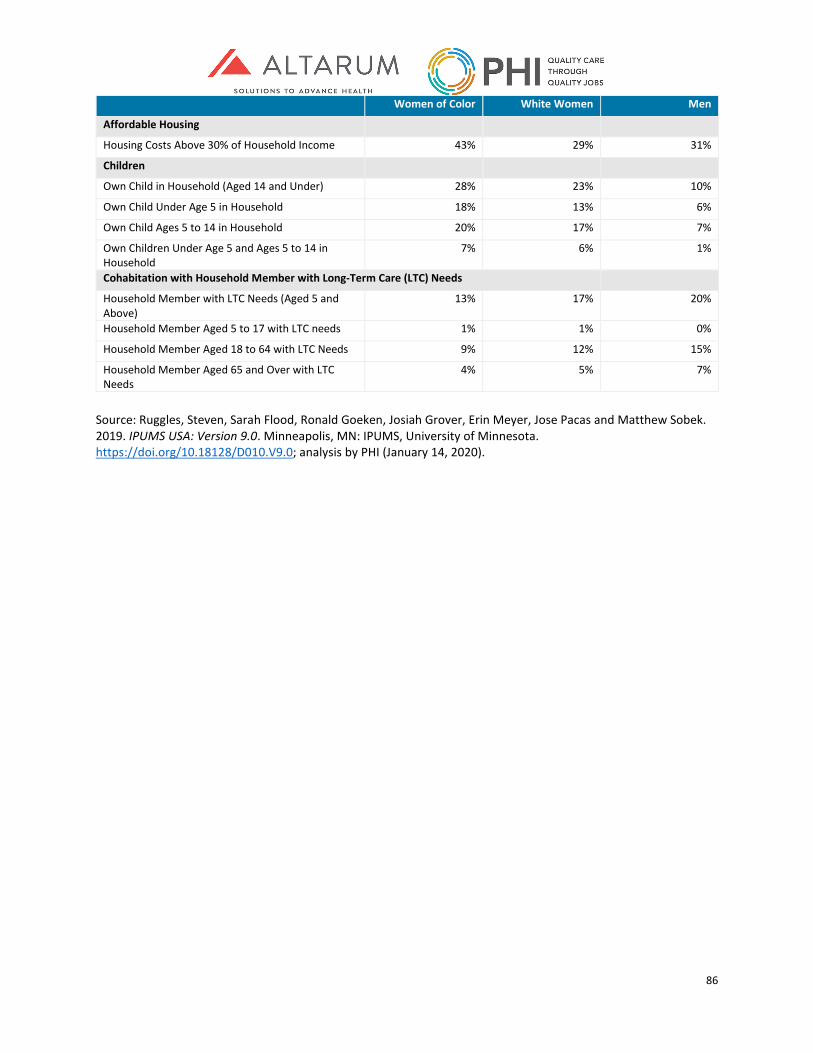
86
Women of Color White Women Men
Affordable Housing
Housing Costs Above 30% of Household Income 43% 29% 31%
Children
Own Child in Household (Aged 14 and Under) 28% 23% 10%
Own Child Under Age 5 in Household 18% 13% 6%
Own Child Ages 5 to 14 in Household 20% 17% 7%
Own Children Under Age 5 and Ages 5 to 14 in Household
7% 6% 1%
Cohabitation with Household Member with Long-Term Care (LTC) Needs
Household Member with LTC Needs (Aged 5 and Above)
13% 17% 20%
Household Member Aged 5 to 17 with LTC needs 1% 1% 0%
Household Member Aged 18 to 64 with LTC Needs 9% 12% 15%
Household Member Aged 65 and Over with LTC Needs
4% 5% 7%
Source: Ruggles, Steven, Sarah Flood, Ronald Goeken, Josiah Grover, Erin Meyer, Jose Pacas and Matthew Sobek. 2019. IPUMS USA: Version 9.0. Minneapolis, MN: IPUMS, University of Minnesota. https://doi.org/10.18128/D010.V9.0; analysis by PHI (January 14, 2020).
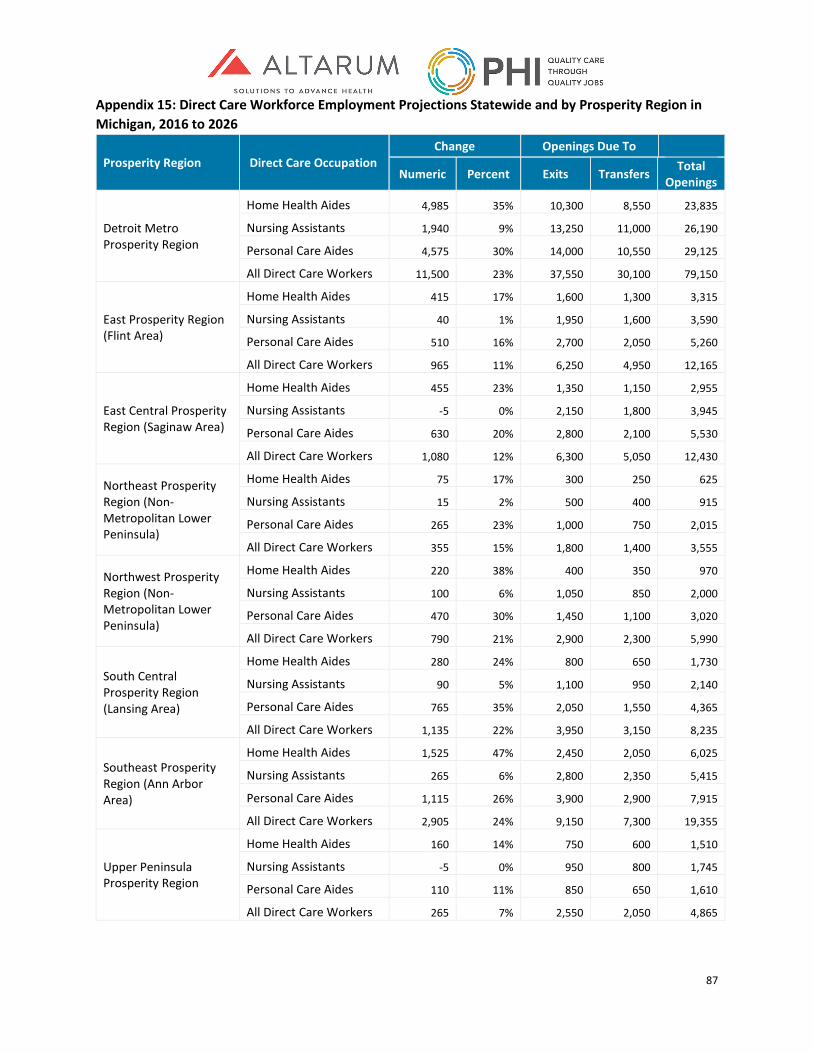
87
Appendix 15: Direct Care Workforce Employment Projections Statewide and by Prosperity Region in Michigan, 2016 to 2026
Prosperity Region Direct Care Occupation Change Openings Due To
Numeric Percent Exits Transfers Total Openings
Detroit Metro Prosperity Region
Home Health Aides 4,985 35% 10,300 8,550 23,835
Nursing Assistants 1,940 9% 13,250 11,000 26,190
Personal Care Aides 4,575 30% 14,000 10,550 29,125
All Direct Care Workers 11,500 23% 37,550 30,100 79,150
East Prosperity Region (Flint Area)
Home Health Aides 415 17% 1,600 1,300 3,315
Nursing Assistants 40 1% 1,950 1,600 3,590
Personal Care Aides 510 16% 2,700 2,050 5,260
All Direct Care Workers 965 11% 6,250 4,950 12,165
East Central Prosperity Region (Saginaw Area)
Home Health Aides 455 23% 1,350 1,150 2,955
Nursing Assistants -5 0% 2,150 1,800 3,945
Personal Care Aides 630 20% 2,800 2,100 5,530
All Direct Care Workers 1,080 12% 6,300 5,050 12,430
Northeast Prosperity Region (Non-Metropolitan Lower Peninsula)
Home Health Aides 75 17% 300 250 625
Nursing Assistants 15 2% 500 400 915
Personal Care Aides 265 23% 1,000 750 2,015
All Direct Care Workers 355 15% 1,800 1,400 3,555
Northwest Prosperity Region (Non-Metropolitan Lower Peninsula)
Home Health Aides 220 38% 400 350 970
Nursing Assistants 100 6% 1,050 850 2,000
Personal Care Aides 470 30% 1,450 1,100 3,020
All Direct Care Workers 790 21% 2,900 2,300 5,990
South Central Prosperity Region (Lansing Area)
Home Health Aides 280 24% 800 650 1,730
Nursing Assistants 90 5% 1,100 950 2,140
Personal Care Aides 765 35% 2,050 1,550 4,365
All Direct Care Workers 1,135 22% 3,950 3,150 8,235
Southeast Prosperity Region (Ann Arbor Area)
Home Health Aides 1,525 47% 2,450 2,050 6,025
Nursing Assistants 265 6% 2,800 2,350 5,415
Personal Care Aides 1,115 26% 3,900 2,900 7,915
All Direct Care Workers 2,905 24% 9,150 7,300 19,355
Upper Peninsula Prosperity Region
Home Health Aides 160 14% 750 600 1,510
Nursing Assistants -5 0% 950 800 1,745
Personal Care Aides 110 11% 850 650 1,610
All Direct Care Workers 265 7% 2,550 2,050 4,865
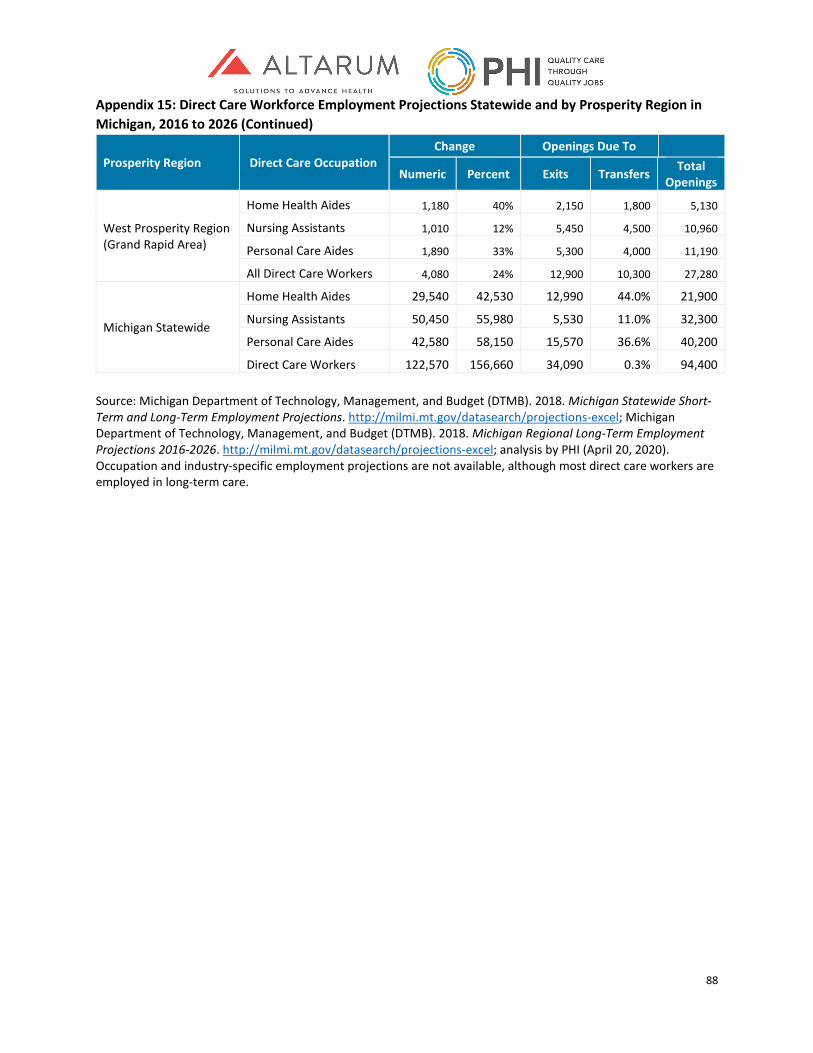
88
Appendix 15: Direct Care Workforce Employment Projections Statewide and by Prosperity Region in Michigan, 2016 to 2026 (Continued)
Prosperity Region Direct Care Occupation Change Openings Due To
Numeric Percent Exits Transfers Total Openings
West Prosperity Region (Grand Rapid Area)
Home Health Aides 1,180 40% 2,150 1,800 5,130
Nursing Assistants 1,010 12% 5,450 4,500 10,960
Personal Care Aides 1,890 33% 5,300 4,000 11,190
All Direct Care Workers 4,080 24% 12,900 10,300 27,280
Michigan Statewide
Home Health Aides 29,540 42,530 12,990 44.0% 21,900
Nursing Assistants 50,450 55,980 5,530 11.0% 32,300
Personal Care Aides 42,580 58,150 15,570 36.6% 40,200
Direct Care Workers 122,570 156,660 34,090 0.3% 94,400 Source: Michigan Department of Technology, Management, and Budget (DTMB). 2018. Michigan Statewide Short-Term and Long-Term Employment Projections. http://milmi.mt.gov/datasearch/projections-excel; Michigan Department of Technology, Management, and Budget (DTMB). 2018. Michigan Regional Long-Term Employment Projections 2016-2026. http://milmi.mt.gov/datasearch/projections-excel; analysis by PHI (April 20, 2020). Occupation and industry-specific employment projections are not available, although most direct care workers are employed in long-term care.
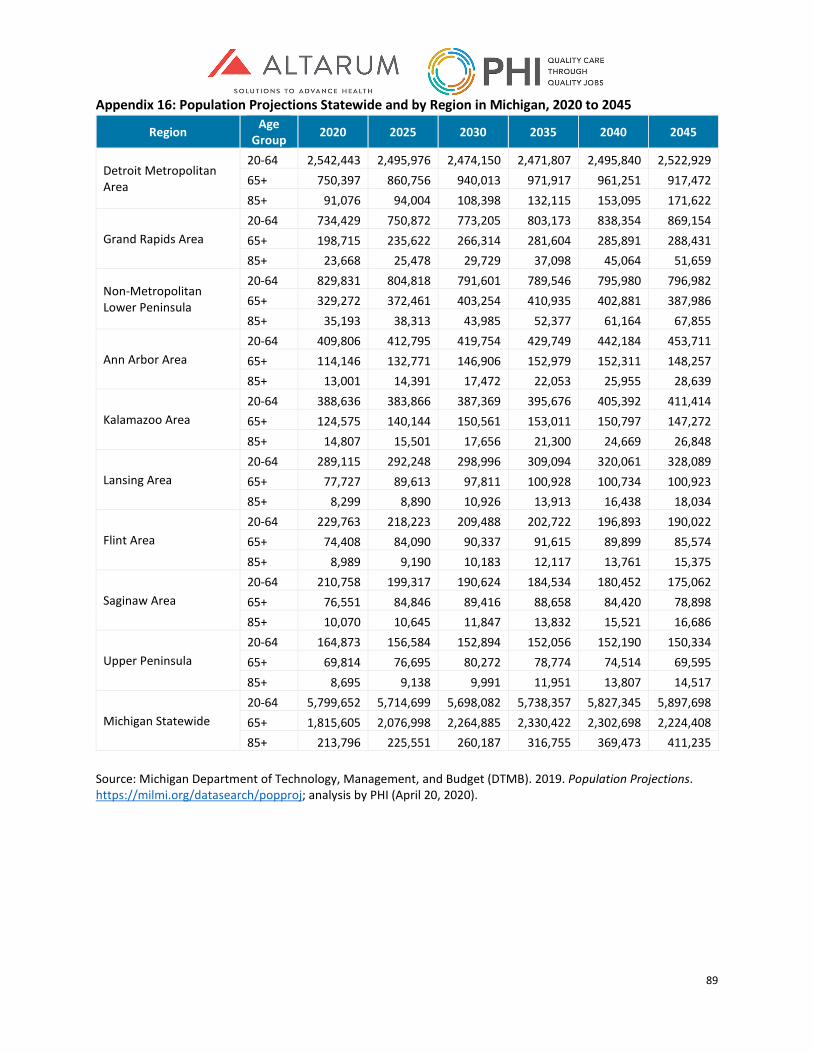
89
Appendix 16: Population Projections Statewide and by Region in Michigan, 2020 to 2045
Region Age Group 2020 2025 2030 2035 2040 2045
Detroit Metropolitan Area
20-64 2,542,443 2,495,976 2,474,150 2,471,807 2,495,840 2,522,929 65+ 750,397 860,756 940,013 971,917 961,251 917,472 85+ 91,076 94,004 108,398 132,115 153,095 171,622
Grand Rapids Area 20-64 734,429 750,872 773,205 803,173 838,354 869,154 65+ 198,715 235,622 266,314 281,604 285,891 288,431 85+ 23,668 25,478 29,729 37,098 45,064 51,659
Non-Metropolitan Lower Peninsula
20-64 829,831 804,818 791,601 789,546 795,980 796,982 65+ 329,272 372,461 403,254 410,935 402,881 387,986 85+ 35,193 38,313 43,985 52,377 61,164 67,855
Ann Arbor Area 20-64 409,806 412,795 419,754 429,749 442,184 453,711 65+ 114,146 132,771 146,906 152,979 152,311 148,257 85+ 13,001 14,391 17,472 22,053 25,955 28,639
Kalamazoo Area 20-64 388,636 383,866 387,369 395,676 405,392 411,414 65+ 124,575 140,144 150,561 153,011 150,797 147,272 85+ 14,807 15,501 17,656 21,300 24,669 26,848
Lansing Area 20-64 289,115 292,248 298,996 309,094 320,061 328,089 65+ 77,727 89,613 97,811 100,928 100,734 100,923 85+ 8,299 8,890 10,926 13,913 16,438 18,034
Flint Area 20-64 229,763 218,223 209,488 202,722 196,893 190,022 65+ 74,408 84,090 90,337 91,615 89,899 85,574 85+ 8,989 9,190 10,183 12,117 13,761 15,375
Saginaw Area 20-64 210,758 199,317 190,624 184,534 180,452 175,062 65+ 76,551 84,846 89,416 88,658 84,420 78,898 85+ 10,070 10,645 11,847 13,832 15,521 16,686
Upper Peninsula 20-64 164,873 156,584 152,894 152,056 152,190 150,334 65+ 69,814 76,695 80,272 78,774 74,514 69,595 85+ 8,695 9,138 9,991 11,951 13,807 14,517
Michigan Statewide 20-64 5,799,652 5,714,699 5,698,082 5,738,357 5,827,345 5,897,698 65+ 1,815,605 2,076,998 2,264,885 2,330,422 2,302,698 2,224,408 85+ 213,796 225,551 260,187 316,755 369,473 411,235
Source: Michigan Department of Technology, Management, and Budget (DTMB). 2019. Population Projections. https://milmi.org/datasearch/popproj; analysis by PHI (April 20, 2020).
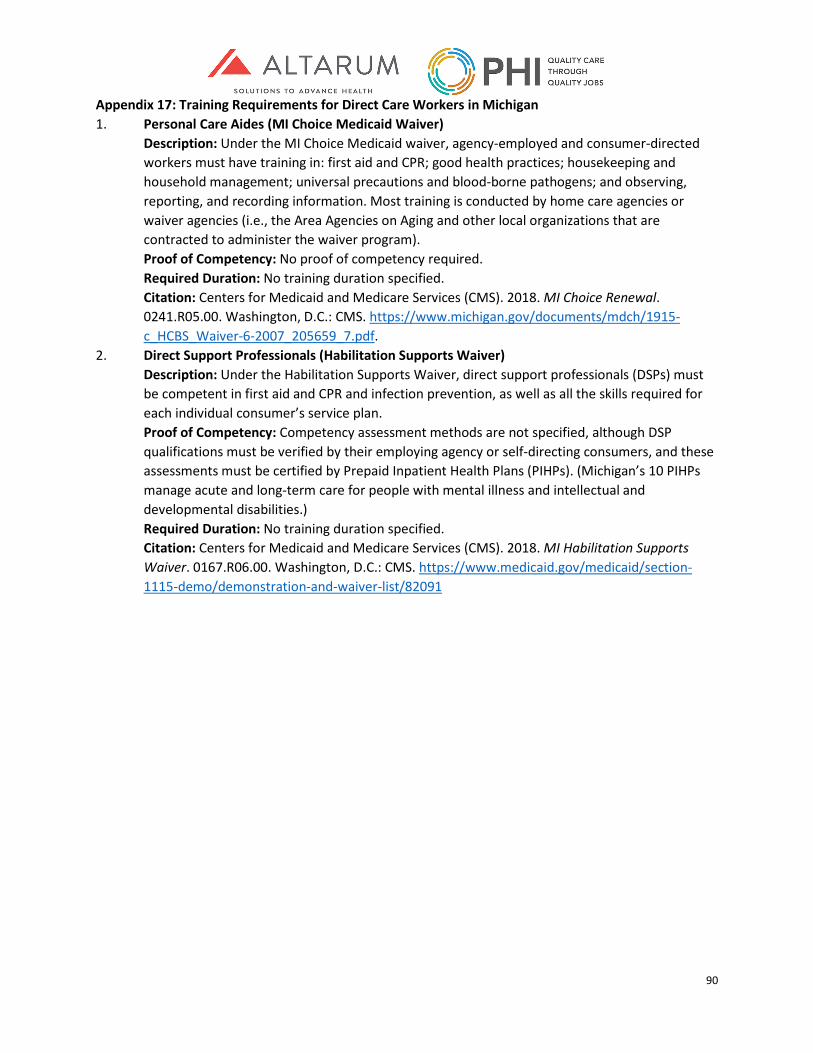
90
Appendix 17: Training Requirements for Direct Care Workers in Michigan 1. Personal Care Aides (MI Choice Medicaid Waiver)
Description: Under the MI Choice Medicaid waiver, agency-employed and consumer-directed workers must have training in: first aid and CPR; good health practices; housekeeping and household management; universal precautions and blood-borne pathogens; and observing, reporting, and recording information. Most training is conducted by home care agencies or waiver agencies (i.e., the Area Agencies on Aging and other local organizations that are contracted to administer the waiver program). Proof of Competency: No proof of competency required. Required Duration: No training duration specified. Citation: Centers for Medicaid and Medicare Services (CMS). 2018. MI Choice Renewal. 0241.R05.00. Washington, D.C.: CMS. https://www.michigan.gov/documents/mdch/1915-c_HCBS_Waiver-6-2007_205659_7.pdf.
2. Direct Support Professionals (Habilitation Supports Waiver) Description: Under the Habilitation Supports Waiver, direct support professionals (DSPs) must be competent in first aid and CPR and infection prevention, as well as all the skills required for each individual consumer’s service plan. Proof of Competency: Competency assessment methods are not specified, although DSP qualifications must be verified by their employing agency or self-directing consumers, and these assessments must be certified by Prepaid Inpatient Health Plans (PIHPs). (Michigan’s 10 PIHPs manage acute and long-term care for people with mental illness and intellectual and developmental disabilities.) Required Duration: No training duration specified. Citation: Centers for Medicaid and Medicare Services (CMS). 2018. MI Habilitation Supports Waiver. 0167.R06.00. Washington, D.C.: CMS. https://www.medicaid.gov/medicaid/section-1115-demo/demonstration-and-waiver-list/82091
91
Appendix 17: Training Requirements for Direct Care Workers in Michigan (Continued) 3. Home Health Aides
Description: Michigan follows federal training requirements for home health aides. Under these requirements, home health aides must complete training in 15 broad topics. Training must be provided by a registered nurse or a licensed practical nurse who is under the supervision of a registered nurse. Proof of Competency: Home health aides must complete a written assessment as well as demonstrate their skills in front of a registered nurse (on the job or in a training classroom). Worker competency must be verified by a registered nurse. Required Duration: 75 hours, including 16 hours of hands-on practical training. Citation: Code of Federal Regulations. 2001. Condition of Participation: Home Health Services. 42 CFR §484.36. https://www.law.cornell.edu/cfr/text/42/484.36; Michigan Department of Licensing and Regulatory Affairs. “Home Health Agencies.” Last updated April 22, 2020. https://www.michigan.gov/lara/0,4601,7-154-89334_63294_72971_75375---,00.html.
4. Residential Care Aides (Homes for the Aged) Description: Homes for the Aged are residential care homes that serve 21 or more people aged 55 and above. In these settings, residential care aides must demonstrate competency in seven areas: reporting requirements and documentation; first aid and CPR; personal care; resident rights and responsibilities; safety and fire prevention; the prevention and containment of infectious disease and standard precautions; and medication administration (if applicable). They must also receive training in the skills required to execute each resident’s individual plan of care. Proof of Competency: Employers must ensure worker competency, but assessment methods are not specified by the regulations. Required Duration: No training duration specified. Citation: National Center for Assisted Living (NCAL). 2019. 2019 Assisted Living State Regulatory Review. Washington, D.C.: NCAL. https://www.ahcancal.org/ncal/advocacy/regs/Documents/2019_reg_review.pdf.
92
Appendix 17: Training Requirements for Direct Care Workers in Michigan (Continued) 5. Residential Care Aides (Adult Foster Care Homes)
Description: Adult foster care homes are residential care homes that serve 20 or fewer older adults, people with mental illness, or people with intellectual and development disabilities. Residential care aides in these settings must demonstrate their competency in: reporting requirements and documentation; first aid and CPR; personal care; supervision and protection of residents; resident rights; safety and fire prevention; and the prevention and containment of infectious disease and standard precautions. Also, direct support professionals who work in adult foster care homes that serve people with intellectual and developmental disabilities must complete training that uses a state-sponsored curriculum, “Providing Residential Services in Community Settings: A Training Guide,” or an equivalent, state-approved curriculum. This state-sponsored curriculum covers the required topics for all residential care aides in adult foster care homes, as well as additional topics, including human needs and values. Proof of Competency: Employers must ensure worker competency, but assessment methods are not specified by the regulations. Required Duration: No training duration specified. Citation: National Center for Assisted Living (NCAL). 2019. 2019 Assisted Living State Regulatory Review. Washington, D.C.: NCAL. https://www.ahcancal.org/ncal/advocacy/regs/Documents/2019_reg_review.pdf; Michigan Department of Licensing and Regulatory Affairs. “Direct Care Staff Training for Certified Facilities.” Last updated October 17, 2019. https://www.michigan.gov/lara/0,4601,7-154-89334_63294_27717-224979--,00.html.
6. Nursing Assistants Description: Nursing assistants must complete training according to a state-sponsored curriculum called the “State of Michigan Nurse Aide Training Curriculum Model.” This curriculum follows federal standards for nursing assistants, which stipulate seven detailed topics. Training must be provided by a registered nurse with at least two years of experience, including one year in long-term care. Proof of Competency: Nursing assistants must pass a written or oral exam and demonstrate their skills in front of a registered nurse. Required Duration: 75 hours, including 16 hours of hands-on practical training. Citation: Michigan Department of Licensing and Regulatory Affairs (LARA). “Nurse Aide Training Program.” Last updated April 18, 2020. https://www.michigan.gov/lara/0,4601,7-154-89334_63294_74190---,00.html; Code of Federal Regulations. 1991. Requirements That Must Be Met by States and State Agencies: Nurse Aide Training and Competency Evaluation, and Paid Feeding Assistants. 42 CFR Subpart D. https://www.law.cornell.edu/cfr/text/42/part-483/subpart-D.
154
Findings and Recommendations MDHHS has no preconceived expectations for this study. It is to guide, not determine future system design. Through past work the department has articulated some common themes around what values should be considered in future designs. While not a comprehensive list, these values include:
• Person-centered – LTSS must be person-centered and that is a core value that needs to be firmly established at the beginning.
• Not predicated on program eligibility – LTSS must be predicated on the needs of each individual and not solely driven whether the individual qualifies for Medicaid.
• Cultural competency and sensitivity – Programs and services must be sensitive to the needs of persons of varying cultures and backgrounds. They should recognize and help solve existing system inequities and biases.
• Dynamic interviewing – Personal interactions should focus on conversation as opposed to assessment.
• Carefully crafted quality metrics – Following the maxim that “you drive behavior by what you measure,” performance and quality measures should be considered in the design phase of programs as opposed to a post-implementation reaction.
• Personalized transitions rather than referrals – Given the vulnerable nature of LTSS participants, it is important that individuals are provided assistance in navigating the system rather than simply being directed through it.
• There is no default option – The proper selection of long-term supports and services is too personal to allow for a default or fallback option. In the past, if all else failed, people were put into nursing facilities and that is unacceptable.
With these values as a guide, it is impossible to append the recommendations cited in each report.