recreation demand and user preference analysis
TRANSCRIPT

Technical Series No TS-YSS-10
Recreation Demand and User Preference Analysis A component of Yakima River Basin Water Storage Feasibility Study Washington Pacific Northwest Region
Keechelus Bumping Lake Kachess
US Department of the Interior Bureau of Reclamation Denver Colorado February 2007
Mission Statements
The mission of the Department of the Interior is to protect and provide access to our Nationrsquos natural and cultural heritage and honor our trust responsibilities to Indian Tribes and our commitments to island communities
The mission of the Bureau of Reclamation is to manage develop and protect water and related resources in an environmentally and economically sound manner in the interest of the American public
Technical Series No TS-YSS-10
Recreation Demand and User Preference Analysis Yakima River Basin Water Storage Feasibility Study Washington Pacific Northwest Region
Prepared by
Bureau of Reclamation Technical Service Center Economics and Resource Planning Group Darrell Welch Outdoor Recreation Planner
Aukerman and Haas Associates LLC Dr Glenn Haas
Prepared for
Bureau of Reclamation Upper Columbia Area Office 1917 Marsh Road Yakima Washington 98901-2058
US Department of the Interior Bureau of Reclamation Denver Colorado February 2007
Contents
Page
Introduction 1 Study Authority 2 Structure of Analysis Report 4 Purpose and Objectives 5 Scope and Methodology 6
Scope 6 Methodology for Determining Demand and User Preferences 8 Level 1 Analysis 9 Regional Scale 10 Key Water-Related Recreation Activities 10 Existing I nformation and Expert Opinion 11 WROS Inventory System 11 Sound Professional Judgment 12 Findings of Analysis 12 Overview of the Study Area 12 Recreation Setting 13 Demographic Change 16 Population Growth 16 Ethnicity 18
Age 18 Income 20 Issues Concerns and Observations 20 General Issues Concerns and Observations 21 Yakima River Basin Issues Concerns and Observations 22 Recreation Trends Influencing Water-Based Recreation 24 National Recreation Providers 25 Federal 26
State 26 Local 26
Private 27 Washington State Recreation Providers 27 Recreation Participation Levels 28 National Participation Levels 28 Pacific Coast Participation Levels 34 Washington State Participation Levels 36 Local Recreation Environment 39 Water Recreation Opportunity Spectrum Inventory and Existing Conditions 43 Setting Attributes Considerations 46 Local Carrying Capacity Considerations 48
iii
Contents (continued) Page
Water Quality Considerations 50 Recreation Water Quality Considerations 51 Projections of Recreation Demand and User Preference 52
Key Factors Influencing Future Projections 52 Projected Recreation Demand for Key Activities 54
References Cited 57
Appendices
Appendix A ndash WROS Executive Summary Appendix B ndash Black Rock Dam and Reservoir Recreation Needs Assessment Appendix C ndash River Flow Hydrographs Appendix D ndash Whitewater Classification from American Whitewater Appendix E ndash WROS Zone Descriptions Appendix F ndash WROS Inventory Maps
Tables
Table Page
1 Comparison of Counties in Yakima River Basin by Selected Demographic Factors from the State of Washington
Office of Financial Management 17 2 Comparison of Percentages of Three Segments of the United States Population Participating in Land-Based Outdoor Activities 2000ndash04 19 3 Percent and Number of People 16 Years and Older in the United States Participating in 12 Types of Outdoor Recreational Activities 1999ndash2000 29 4 Percent and Number of People 16 Years and Older in the
United States Participating in Land-Resource-Based Outdoor Activities 1999ndash2000 30 5 Percent and Number of People 16 Years and Older in the
United States Participating in Water-Resource-Based Outdoor Activities 1999ndash2000 31 6 National Participation Trends from 1994ndash95 and 2000ndash02 32 7 Participation Rates for Outdoor Activities in 2004 33 8 Estimates as a Percent of Change in the Number of People Participating in the Future Compared to Current Levels 40 9 Inventory of the Current Supply of Water Recreation Opportunities
Based upon the WROS System 45
iv
Contents (continued)
Tables (continued) Table Page
10 Percent of Population over the Age of 15 Indicating the Importance of Recreation Site Attributes as They Contribute to Making the Site an Ideal Recreation Setting by Level of Importance and by FS RPA Region
1994ndash95 49 11 Projected Percentage Change in Recreation Participation for the 20-Year Period from the Base Year of 2005 Through 2025 55 Figures Figure Page
1 Yakima River Basin location 3 2 Yakima River Basin features 7 3 Sliding scale of analysis 9 4 A regional scale of focus 10 5 Yakima River Basin recreation access points and recreation areas 15 6 Percent of participation in viewing activities by region 34 7 Percent of participation in camping activities by region 35 8 Percent of participation in hunting and fishing by region 36 9 Percent of participation in boating by region 36 10 Recreation participation by activity category 37 11 Participation in general recreation categories as a percent of State populations 38 12 Participation in water activities as a percent of the Statersquos
population 39 13 Demand in Region 3 by activity 43
v
Acronyms Analysis Report Recreation Demand and User Preference Analysis
BLM Bureau of Land Management
cfs cubic feet per second
Corps US Army Corps of Engineers
EIS environmental impact statement
FS US Forest Service
IAC Interagency Committee for Outdoor Recreation
NPS National Park Service
NSRE National Survey on Recreation and the Environment
NVUM National Visitor Use Monitoring Project
Reclamation Bureau of Reclamation
RPA Regional Planning Act Assessment
RV recreational vehicle
SCORP State Comprehensive Outdoor Recreation Plan
Service US Fish and Wildlife Service
TVA Tennessee Valley Authority
USDA US Department of Agriculture
WDFW Washington Department of Fish and Wildlife
WROS Water Recreation Opportunity Spectrum
vii
Introduction The mission of the Bureau of Reclamation (Reclamation) is to manage develop and protect water and related resources in an environmentally and economically sound manner in the interest of the American public Reclamation was established by the Reclamation Act of 1902 to develop water resources in the 17 Western States Over the years Reclamation has gravitated from development of single-purpose agricultural projects toward a multipurpose approach to water resource development Reclamation administers more than 8 million acres of land and water 288 Federal lakes and more than 300 developed recreation areas Federal and non-Federal partnerships have and will continue to be the primary providers of recreation and concession-managed activities on land and water areas under Reclamation jurisdiction About 70 non-Federal partners mostly States and cities manage about 200 of Reclamationrsquos recreation areas Reclamation retains management responsibilities for recreation at 51 projects1 Many of the other recreation areas are managed by other Federal agencies such as the National Park Service (NPS) or US Forest Service (FS) In some instances existing Reclamation legislation supports development and management of recreation resources on its lands by non-Federal partners but prevents Reclamation from providing the same services in lieu of managing partners In other instances Reclamation has specific authority to plan develop and maintain recreation resources on its lands
Today water for recreation is in relatively static supply because large-scale Federal water development in the United States is essentially complete Currently Reclamation the US Army Corps of Engineers (Corps) and Tennessee Valley Authority (TVA) reservoirs accommodate one-third of the total visitation to the Federal estate but these same agencies administer only 2 percent of the total Federal estate acreage Approximately 90 million people visit Reclamationrsquos designated recreation areas annually Visitation is increasing at an average rate of 12 million visitors per year and over 100 million people are projected to visit these recreation areas by early in the 21st century Reclamation projects stimulate an estimated $24 billion in economic activity each year Benefits in agriculture recreation hydropower municipal and industrial water service and other related areas including the construction industry are the direct result of Reclamationrsquos management of a limited natural water supply These multipurpose benefits result in about $5 billion in State and Federal tax revenues An estimated 700000 person years of employment are produced each year by Reclamation2
1 National Recreation Lakes Study Commission June 1999 2 Recreation Challenges of the Twenty-First Century Bureau of Reclamation February 1998
1
Nationwide recreation use of available sites will continue to increase over time This is a reflection of the ldquobaby boomerrdquo generation increased leisure time new recreation technologies and increased public information about recreation opportunities in rural communities It has been estimated that there will be a 50- to 100-percent increase in public demand for water-based recreation opportunities at State and Federal facilities over the next 20 years Without major changes in infrastructure and management programs the health and safety of the visiting public and the integrity of the natural environment may be compromised3 4
Across the United States about 161 million acres 7 percent of the countryrsquos total land area is covered by water mostly freshwater Streams rivers natural lakes ponds reservoirs and other forms of water cover are not only essential for aquatic microbiota aquatic and terrestrial wildlife household consumption agriculture and manufacturing but they are also important and highly valued as recreation
5resources
Reclamation is currently preparing a Yakima River Basin Water Storage Feasibility Study to examine the feasibility and acceptability of storage augmentation for the benefit of fish irrigation and the municipal water supply within the Yakima River basin in two respects (1) diversion of Columbia River water to the potential Black Rock Reservoir for further water transfer to irrigation entities in the lower Yakima River basin as an exchange supply thereby reducing irrigation demand on Yakima River water and improving Yakima Project stored water supplies and (2) creation of additional storage within the Yakima River basin In considering the benefits of additional storage in the Yakima basin the objectives are to improve anadromous fish habitat assure a more reliable water supply for proratable (junior) irrigation water rights holders and provide for future municipal needs Refer to figure 1 for the location map of the Yakima River basin
This Recreation Demand and User Preference Analysis (Analysis Report) is one integral part of that overall feasibility study
Study Authority Feasibility studies are detailed investigations specifically authorized by law to determine the desirability of seeking congressional authorization for implementation of a preferred alternative Feasibility studies include additional
3 National Recreation Lakes Study Commission 1999 4 Bureau of Reclamation Recreation Management Condition Assessment Clark Canyon
Reservoir and Barretts Diversion Dam Pick-Sloan Missouri River Basin Program August 2002 5 Cordell et al Outdoor Recreation for the 21st Century America A Report to the Nation
The National Survey on Recreation and the Environment 2004
2
3
data collection and analysis and consider a reasonable range of alternatives Feasibility studies must be consistent with the Economic and Environmental Principles and Guidelines for Water and Related Resources Implementation Studies
Section 214 of the Act of February 20 2003 (Public Law 108-7) states that
The Secretary of the Interior acting through the Bureau of Reclamation shall conduct a feasibility study of options for additional water storage in the Yakima River Basin Washington with emphasis on the feasibility of storage of the Columbia River water in the potential Black Rock Reservoir and the benefit of additional storage to endangered and threatened fish irrigated agriculture and municipal water supply There are authorized to be appropriated such sums as may be necessary to carry out this Act
Structure of Analysis Report The following briefly describes by section the structure of the Analysis Report
Introduction ndash Provides an overview of Reclamationrsquos water-related recreation program discusses water-based recreation on a national level and briefly describes Reclamationrsquos Yakima River Basin Water Storage Feasibility Study
Study Authority ndash States Reclamationrsquos authority to prepare the Yakima River Basin Water Storage Feasibility Study
Structure of Analysis Report ndash Briefly describes by section the structure of this Recreation Demand and User Preference Analysis
Purpose and Objectives ndash Details the primary purpose of the Analysis Report and key objectives for its preparation
Scope and Methodology ndash Briefly describes what items the Analysis Report addresses and what it does not address Describes the level of analysis regional focus of the Analysis Report key water-related recreation activities and how professional judgment existing information expert opinion and Reclamationrsquos Water Recreation Opportunity Spectrum (WROS) were used in preparing the Analysis Report
Findings of Analysis ndash Provides an overview of the study area describes the recreation setting and discusses national regional and Washington State recreation participation levels and demand
4
projections The Analysis Report describes the issues concerns observations and trends influencing water-based recreation Demographic characteristics and setting attributes contributing to user satisfaction of a recreation site are also discussed
Projections of Recreation Demand and User Preference ndash Provides recommendations and projections on the types of recreation activities needed in the Yakima River basin to meet existing and future demand and user expectations
Purpose and Objectives The primary purpose of this Analysis Report is to determine recreation demand and user preferences within the Yakima River basin The information will assist Reclamation and its partners in determining a viable recreation strategy within the alternatives that may be contemplated in the storage study feasibility environmental impact statement (EIS) A secondary purpose of this report is to collect existing data that can provide a baseline for assessing the potential impacts to recreation resources for each of the EIS alternatives
The key objectives of the Analysis Report are to
Identify the significant recreation issues concerns and observations within the Yakima River basin
Present results of a literature search of planning documents such as the Washington State Comprehensive Outdoor Recreation Plan State and local tourism studies and brochures and research studies from a variety of universities Federal agencies and other sources
Present recreation participation and trend data from local State and Federal agencies and private tourism resort and special interest groups (eg fishing clubs) in the area
Present a current recreation visitor profile for the Yakima River basin in terms of population age structure urban versus rural residence types and frequency of participation in recreation activities preferred settings preferred experiences and visitation characteristics
Complete a WROS inventory of seven primary reservoirs and five primary rivers in the Yakima River basin The primary lakes inventoried were Cle Elum Kachess Keechelus Bumping Clear Easton and Rimrock The five primary rivers inventoried were the Naches Yakima Cle Elum Bumping and Tieton Rivers These primary reservoirs and rivers were selected because they will be the water bodies most likely
5
affected by the yet-to-be selected preferred Yakima Storage Study alternative Refer to figure 2 for locations of the rivers and lakes within the Yakima River basin that are mentioned above
Complete a WROS inventory of flat water reservoir and river comparables outside the Yakima River basin area to get a more accurate picture of the supply of recreational opportunities in the area and to help assess the demand for certain types of recreational opportunities within the basin
Develop projections to determine likely population and significant social economic or demographic changes that may affect recreation demand within the Yakima River basin (eg population changes ethnicity major industry changes population density age structure changes transportation linkages migration and immigration patterns and resident and nonresident tourism patterns)
Present a compilation of developed recreation demand projections for the key recreation activities and WROS classes within the Yakima River basin These projections are essential for measuring the economic value of recreation and the quality of the recreation experience for each alternative that may be considered in the EIS and other planning documents
Present a profile of important attributes and conditions that define a special and attractive recreation destination
Fulfill a need identified by Reclamation and the State of Washington to assess the demand for recreation opportunities in the Yakima River basin
Scope and Methodology Scope
The Analysis Report deals primarily with the
Assessment of the current water-based recreation supply within the Yakima River basin and for comparison purposes and on a limited basis the supply of water-based recreation opportunities immediately east of the Yakima River basin
Assessment of future demand for water-based recreation activities within the Yakima River basin based on available trend projections
Identification of existing issues and concerns related to recreation management
6
7
Analysis of existing recreation information from a variety of sources
Water-based recreation opportunities that occur on or adjacent to rivers and reservoirs
The Analysis Report does not
Identify a preferred recreation development strategy
Identify a recreation implementation and monitoring strategy
Quantify the number of recreation facilities needed and locations where facilities may be provided
Include a discussion of demand or supply of recreation opportunities that are dependent on a municipal water supply (ie water needed for golf courses soccer and baseball fields city parks and greenways)
Address the potential recreation impacts of Yakima River basin storage alternatives
Address the economic value of recreation to the Yakima River basin
Describe the long-term social or economic benefits that the potential Black Rock Reservoir might have to the local economy
Address potential changes in land uses or potential developments on private property within the Yakima River basin (eg report does not consider possible subdivision development or resorts as a result of Yakima River basin storage alternatives that may be selected in the future)
Utilize any form of general public or recreation user survey instrument to measure recreation demand and user preference in the Yakima River basin
Methodology for Determining Demand and User Preference
The Recreation Demand and User Preference Analysis for the Yakima River Basin used what is considered in the recreation profession as a Level 1 and regional-scale water-related recreation analysis This section describes each of the major components
8
Level 1 Analysis It is common in public resource planning and management to use a sliding scale rule of analysis The sliding scale rule states that the level of analysis should be commensurate with the potential consequences of the decision or action to be taken Typically three levels of analysis are considered slight ordinary and extraordinary The levels of analysis differ by the (1) level and type of information necessary (2) tools and techniques used (3) time and effort required (4) level of certainty and risk and (5) level of scientific basis Figure 3 depicts the sliding scale of analysis
Level 3 Analysis
Level 2 Analysis
Level 1 Analysis
3 Significant changes or consequences
2 Minor changes or consequences
1 General inventory administrative record
Slight Ordinary Extraordinary
Degree of Time Effort and Certainty
Figure 3mdashSliding scale of analysis
In this Analysis Report a Level 1 analysis was used to address recreation demand and user preference This Analysis Report is part of a feasibility study that may lead to more intensive Level 2 or 3 analyses The output of this analysis is a set of percentages that reflect the anticipated increase or decrease in the demand for the key water-related recreation opportunities in the basin This information will provide decisionmakers with a sense of the magnitude of recreation demand value and benefits that might accrue from any water storage or diversion option
9
Regional Scale The scale or geographic area of analysis was the Yakima River basin The key question being addressed in this analysis is ldquoWhat is the recreation demand and user preference for the Yakima River basin and not for any specific site or facilityrdquo
Figure 4 serves two purposes First it shows that the analysis considered recreation demand and preference information from the perspective of a nation State and region within the State Second it depicts that the level and focus of analysis was on the basin and not the potential sites for water alterations (eg Black Rock Wymer)
Region
Site
State
Yakima River Basin Recreation Demand Projections
Nation
Figure 4mdashA regional scale of focus
Key Water-Related Recreation Activities For the benefit of the local community land and water resource managers and decisionmakers the section of the Analysis Report entitled ldquoFindings of Analysisrdquo describes trends and participation levels for a variety of outdoor recreation activities However recommendations concerning what outdoor recreation activities are needed in the Yakima River basin to meet future demand and public expectations were narrowed to those activities that are popularly associated with reservoirs rivers and lakes in the basin More specifically the recommendations section only considered the most significant popular activities
10
that take place on the water or closely associated with the water resource (eg camping hiking picnicking) The key water-related recreation activities included were fishing waterfowl hunting raftingkayaking water skiing motorboating developed camping rusticprimitive camping hiking jet skiing wildlife viewing picnicking bicycling swimming and sailing
Existing Information and Expert Opinion Typical of a Level 1 analysis the assessment of recreation demand and user preference relied on existing information (eg data reports applications environmental documents national and State studies agency plans and informal expert interviews) No original data were collected through surveys or systematic public interviews
Approximately 15 agency officialsmdashvery experienced with the tourism and outdoor recreation situation in the basinmdashwere interviewed in the course of the field work The primary purpose of the expert interviews was to get a better understanding of the existing information and to identify any trends or changes taking place in terms of recreation use visitation patterns visitor demographics equipment and other factors
WROS Inventory System Reclamation in collaboration with other Federal and State water resource agencies has recently developed a new tool called the Water Recreation Opportunity Spectrum System (Reclamation July 2004) The WROS Executive Summary is included in appendix A and the complete Userrsquos Guidebook can be downloaded from ltwwwusbrgovpmtsplanningwrosindexhtmlgt
WROS is a national interagency tool that provides planners and managers with a framework and procedure for making better decisions for conserving a spectrum of high quality and diverse water recreation opportunities In this analysis WROS was used to inventory (ie map) the current supply of water recreation opportunities within the Yakima River basin and to develop a regional profile of the current gross water surface acreage of WROS zones commonly referred to as urban suburban rural developed rural natural semiprimitive and primitive
WROS was also applied to key ldquocomparablerdquo reservoirs and river segments outside the Yakima River basin which are identified later in this report Reclamation selected comparables east of the basin that were similar in terms of geography topography climate ecotype elevation vegetation and recreation use
By inventorying what recreation opportunities already exist within the basin and across the comparables in a designated area (ie the current supply) and having information about the type and amount of recreation visitation (ie current
11
demand) decisionmakers are better able to understand current demand and to estimate future demand for new water storage or diversion options including different types of recreation activities and settings
Sound Professional Judgment There is no formula or way to scientifically determine with a high level of certainty the future of any human endeavor including future outdoor recreation demand or preference Thus based upon the (1) available information (2) WROS inventory and (3) expert interviews the principal investigators used sound professional judgment to estimate future recreation demand and user preference for the Yakima River basin A low and high range of percentage increase or decrease was provided for each of the key activities
Findings of Analysis Overview of the Study Area
The Yakima River flows for over 200 miles through south-central Washington and with its tributaries drains about 6150 square miles or 4 million acres Refer to figure 5 for the main features within the basin The river originates in Kittitas County from Keechelus and Kachess Lakes on the east side of the Cascade Mountains near Snoqualmie Pass The Yakima River flows southeast through the Kittitas and Yakima Valleys ultimately discharging into the Columbia River near Richland Tributaries include the Cle Elum Teanaway and Naches Rivers as well as numerous creeks and irrigation returns The confluence of the Yakima and Naches Rivers at the city of Yakima divides the Yakima River into ldquoupperrdquo and ldquolowerrdquo portions Much of the water is diverted for irrigation in the Yakima Valley but some is recovered through surface and subsurface routes
The Yakima River basin is bounded on the west by the Cascade Range on the north by the Wenatchee Mountains on the east by the Columbia River and on the south by the Horse Heaven Hills Elevations in the basin range from 8184 feet above mean sea level in the Cascades to 340 feet at the confluence of the Yakima River and the Columbia River
Average annual precipitation ranges in the Yakima River basin vary widely from 91 inches annually at Snoqualmie Pass (at the headwaters of the Yakima River in the Cascade Range) to 8 inches annually in the city of Yakima Most of the water in the Yakima River comes from snowmelt and is caught in a series of reservoirs to ensure sufficient water supply later throughout the irrigation season From 50-100 percent of the water delivered to the lower basin from the Naches River and upper Yakima River is diverted for irrigation and hydropower generation during the irrigation season
12
About one-half of the Yakima River basin is within and occupies most of Yakima County The upper part of the basin lies in Kittitas County and occupies most of that county The southeastern part of the basin occupies about one-half of Benton County and the southern part of the basin extends slightly into Klickitat County
The entire basin lies within areas either ceded to the United States by the Yakama Nation or areas reserved for the use of the Yakama Nation The Yakama Reservation occupies about 40 percent of Yakima County and about 15 percent of the basin
Nearly 40 percent of the basin is forested another 40 percent is rangeland 15 percent cropland and the remaining acreage includes other land uses including lands uses associated with river corridors and flat water reservoirs and lakes The single largest landowner is the US Government with 15 million acres or 38 percent of the land areas Much of the forested land is Federal land within the Wenatchee National Forest Other large Federal landholdings include the Yakima Training Center the Hanford Nuclear Reservation and the Bureau of Land Management (BLM) lands Other public ownerships (State county and local governments) total over 400000 acres Lands owned by Native Americans total about 800000 acres Private ownership totals nearly 17 million acres
Irrigated agriculture the main economy of the basin occupies about 1000 square miles Cattle grazing is the main use of 2900 square miles of rangeland Timber harvest cattle grazing and recreation are the major uses of the 2200 square miles in the forested areas of the basin to the north and west About one-fourth of the forested area is designated as wilderness
The economy of the basin is tied most directly to agricultural production Cereal crops irrigated pasture and hay production predominate in Kittitas County while Yakima and Benton Counties produce fruits vegetables grapes and other specialty crops such as hops and mint In fact Yakima County ranks near the top of the Nation in production of many fruits vegetables and specialty crops Another significant agricultural commodity is cattle including both dairies and beef production Manufacturing processes associated with agriculture also contribute substantially to the economic base Services trade transportation and forestry are important elements of the economy as well6
Recreation Setting
The recreation setting of the Yakima River basin varies from designated wilderness areas to urban greenways Features of the Yakima River basin are mainly situated in roaded natural settings Interagency Committee for Outdoor
6 wwwaccesswagov
13
Recreation surveys indicate the number one preferred recreation setting is water oriented Public demand for access to rivers streams and reservoirs continues to increase yearly Major recreation access points and developed recreation areas within the Yakima River basin are depicted in figure 5
Recreationists are attracted to the basin by the quality of the scenery water and recreation opportunities Primary recreation activities include fishing the reservoirs and rivers for cold water sport species whitewater boating and kayaking motorized boating and other related activities such as camping hiking picnicking and wildlife viewing
Bumping Rimrock and Clear Lakes are in the Snoqualmie National Forest The rugged mountain terrain surrounded by coniferous forests creates magnificent scenic settings Cabins camping boating and fishing are available at Bumping Lake Much of the shoreland at Clear Lake is reserved for group camp use
Rimrock Lake is used intensively by fishermen and other recreationists There are private cabins and several campgrounds Good fishing is available in the reservoir for rainbow and other trout and in the stream below the dam for rainbow trout and whitefish
Cle Elum Kachess and Keechelus Reservoirs are in the Wenatchee National Forest Cabins camping swimming boating picnicking and fishing for some species primarily for trout and freshwater ling are available at all three reservoirs Since construction of the dams fishing has improved greatly in the streams below the dams
Sunnyside Prosser Roza and Easton Diversion Dams on the Yakima River have recreation associated with their impoundments Sunnyside is limited to sightseeing and fishing Prosser and Roza diversions both provide excellent fisheries and Roza also has boat launching facilities
The Easton Diversion Dam area is much larger than the other three as it has 112 acres of land and 240 acres of water surface There is a State park that provides facilities for camping swimming and boat launching and mooring Recreational use is heavy The reservoir also has a good fishery7
Construction of the dams and other developments is generally accepted as causing a decline in the number of salmon and bull trout in the basin Two species of salmonmdashspring Chinook and steelheadmdashare listed as endangered and one resident bull trout is listed as threatened Salmon fishing is also a recreational activity in the Yakima basin with varying amounts of participation depending on the type of water year
7 httpwwwusbrgovdataweb
14
15
The larger cities of Yakima Ellensburg and the Tri-Cities (Richland Kennewick and Pasco) in the basin offer the typical types of urban recreation opportunities such as hiking bicycling walking for pleasure family gatherings golfing and field-oriented activities (soccer baseball football etc) These cities and other urban areas in the basin supply these activities through a variety of developments throughout the Yakima River basin (ie greenways trails golf courses city parks sport complexes etc) The quality of many of these recreation opportunities are enhanced by the rivers that flow through these metropolitan areas
Demographic Change
Recreation demand and user preferences will change over time due to many factors One large category affecting change is that of demographic trends in our society In Plan 2015 A Blueprint for Yakima County Progress the following was reported
It is apparent that some fairly significant change in community demographics is underway Age sex race ethnic background educational level and income of county residents is changing in ways that could have implications for how we plan (pg V-2 May 1997)
This section identifies several trends that were discernible from existing information sources
Population Growth It is commonly acknowledged in the outdoor recreation profession that population growth is one of the most significant variables affecting change to recreation demand and user preferences It is not only change in population growth within a particular area such as the Yakima River basin but also change in the population in the locales of the visiting recreationists Below are some key population change trends
Population growth in the United States from 1990ndash1999 was 96 percent The western region led the Nation with a 15-percent population increase during this time period
People recreating in Washington primarily reside in Washington and Oregon The percentage of population growth in these States from 1990ndash1999 was 183 percent and 167 percent respectively
Washington and Oregon rank 13th and 14th respectively in the Nation for projected population growth from 1995ndash2025 The population in
16
Washington is projected to increase by 438 percent and the population in Oregon is projected to increase by 385 percent
Some people recreating in Washington reside in California and Idaho California is ranked first for largest projected population growth from 1995ndash2025 (55 percent) and Idaho is ranked seventh (49 percent)8
The population increase in Washington from 2005ndash2015 is projected to be 116 percent and from 2015ndash2025 it is projected to be 248 percent9
It is anticipated that the greatest population growth in Washington by 2025 will take place in metropolitan counties counties within a reasonable commute time to metropolitan areas and those areas that combine important services with recreation opportunities10
Table 1 provides a comparison of the counties in the Yakima River basin Population growth from 1990ndash2005 has ranged from a 14-percent average annual increase for Yakima County to a 27-percent average annual increase for Benton County
Table 1mdashComparison of Counties in Yakima River Basin by Selected Demographic Factors from the State of Washingtonrsquos Office of Financial Management (April 1 2005)
Comparison Factors Kittitas County Yakima County Benton County
2005 population
Percent population change from 2000ndash2005
Percent population change from 1990ndash2005
2005 median age
2001 per capita income
35200
+97 (19 avg per year)
+37 (25 avg per year)
32 years
$21728
226000
+30 (06 avg per year)
+21 (14 avg per year)
32 years
$22872
151600
+109 (22 avg per year)
+40 (27 avg per year)
35 years
$27454
Several other population-related observations were made from interviews conducted during this project although without support of any data or documentation There is an increasing number of ldquometro commuterrdquo families moving into Kittitas County along the portions of Interstate 90 Development and population growth along portions of Interstate 82 in Yakima is increasing Yakima County is becoming a popular retirement area because of its climate road system services and recreation opportunities (Greater Yakima Chamber of Commerce)
8 US Census Bureau 9 Hall and Kruger 1994 10 Johnson and Beale 1994
17
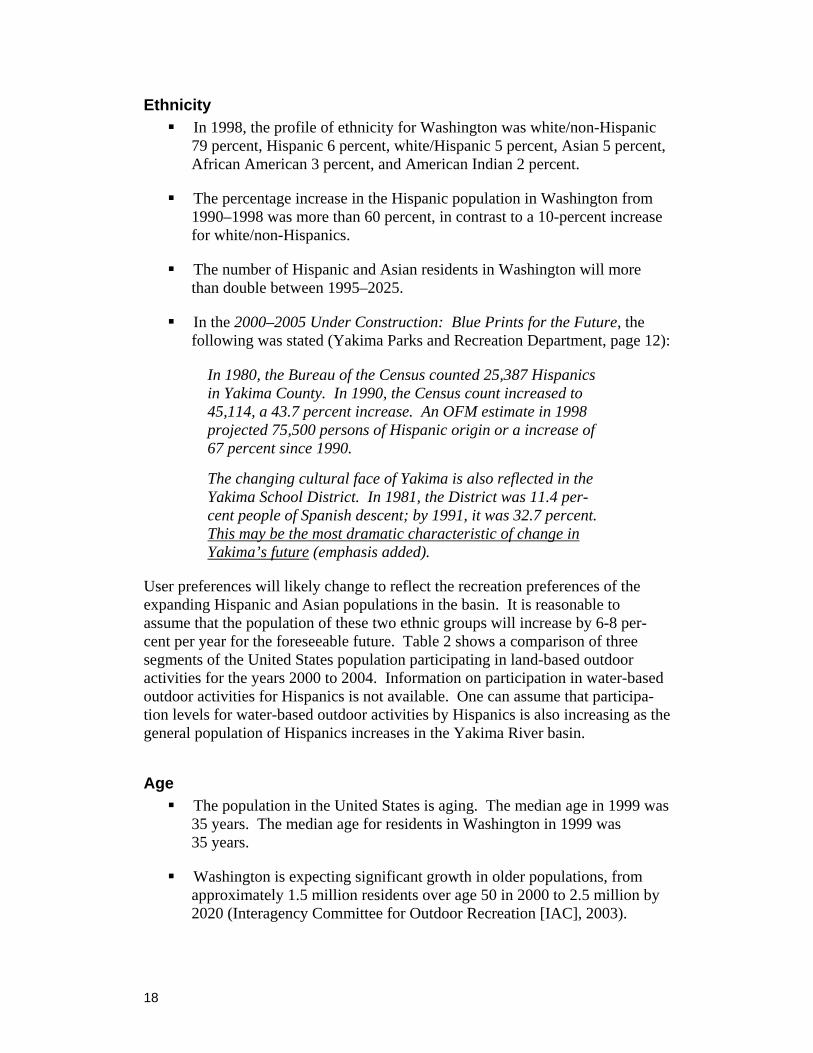
Ethnicity In 1998 the profile of ethnicity for Washington was whitenon-Hispanic
79 percent Hispanic 6 percent whiteHispanic 5 percent Asian 5 percent African American 3 percent and American Indian 2 percent
The percentage increase in the Hispanic population in Washington from 1990ndash1998 was more than 60 percent in contrast to a 10-percent increase for whitenon-Hispanics
The number of Hispanic and Asian residents in Washington will more than double between 1995ndash2025
In the 2000ndash2005 Under Construction Blue Prints for the Future the following was stated (Yakima Parks and Recreation Department page 12)
In 1980 the Bureau of the Census counted 25387 Hispanics in Yakima County In 1990 the Census count increased to 45114 a 437 percent increase An OFM estimate in 1998 projected 75500 persons of Hispanic origin or a increase of 67 percent since 1990
The changing cultural face of Yakima is also reflected in the Yakima School District In 1981 the District was 114 per-cent people of Spanish descent by 1991 it was 327 percent This may be the most dramatic characteristic of change in Yakimarsquos future (emphasis added)
User preferences will likely change to reflect the recreation preferences of the expanding Hispanic and Asian populations in the basin It is reasonable to assume that the population of these two ethnic groups will increase by 6-8 per-cent per year for the foreseeable future Table 2 shows a comparison of three segments of the United States population participating in land-based outdoor activities for the years 2000 to 2004 Information on participation in water-based outdoor activities for Hispanics is not available One can assume that participa-tion levels for water-based outdoor activities by Hispanics is also increasing as the general population of Hispanics increases in the Yakima River basin
Age The population in the United States is aging The median age in 1999 was
35 years The median age for residents in Washington in 1999 was 35 years
Washington is expecting significant growth in older populations from approximately 15 million residents over age 50 in 2000 to 25 million by 2020 (Interagency Committee for Outdoor Recreation [IAC] 2003)
18
Table 2mdashComparison of Percentages of Three Segments of the United States Population Participating in Land-Based Outdoor Activities 2000ndash2004
Type of Activity
Whites Not of Hispanic
Origin
Hispanics of Mexican Origin
Hispanics Not of Mexican
Origin
Walking for pleasure 855 620 746
Family gatherings 751 680 682
Gardening or landscaping for pleasure 702 450 458
Driving for pleasure 591 283 346
Picnicking 567 491 453
Yard games (eg horseshoes) 458 173 232
Attending outdoor concerts plays etc 444 230 349
Bicycling 406 337 351
Visiting a wilderness or primitive area 376 212 223
Day hiking 344 493 415
Visiting a farm or agricultural setting 319 169 191
Developed camping 307 191 192
Mountain biking 231 185 180
Driving off-road 211 109 123
Primitive camping 194 90 98
Hunting 140 50 53
Backpacking 118 83 102
Horseback riding on trails 110 52 57
Big game hunting 110 29 30
Small game hunting 91 21 29
Horseback riding (general) 89 80 79
Mountain climbing 69 42 45
Rock climbing 49 39 25
Migratory bird hunting 30 07 11
Orienteering 21 08 06
Source Recreation Statistics Update Update Report No 4 November 2004 Hispanic Participation in Land-Based Outdoor Recreation Activities FS 2005 Forest and Rangeland Renewable Resources Assessment Update Report
19
Kittitas and Yakima Counties had an average age of 32 years in 2005 while Benton County had an average age of 35 years in 2005
Yakima County had a younger population base than most of Washington with a median age of 32 years largely due to the median age of Hispanics being 203 years and American Indians being 237
The city of Yakima estimated in 2000 that 292 percent of its residents were 19 years or younger and 278 percent were 50 years or older (Yakima Parks and Recreation Department)
Income The median income of Washington residents increased slightly between
1984 and 1994 but a significant increase occurred in 1996 through 1998 The median income in 1998 was almost $48000
Table 1 indicates that the average per capita annual income in Kittitas County is $21728 in Yakima County it is $22872 and in Benton County it is $27454
The city of Yakima estimated in 2000 that 489 percent of its families had an annual income of less than $25000 and 173 percent had an annual income of more than $50000 (Yakima Parks and Recreation Department)
The key demographic drivers shaping the change in the Yakima River basin will be the above-national average increase in population growth and Hispanic ethnicity Recreation demand will increase not only because of an increase of population growth due to migration to the area and births among residents in the basin but also from the adjacent States from where many of Washington tourists reside It is reasonable to assume that the population in the Yakima River basin will increase 20 percent per year for the foreseeable future
Issues Concerns and Observations
Certain issues concerns and observations can be made that should assist reservoir and river managers in formulating future recreation management strategies Some observations indicate that specific actions would not compromise other nonrecreational uses and other observations may lead managers to alter site attributes to increase user satisfaction levels or alter streamflows and reservoir elevations to enhance visitor experiences Several key issues concerns and observations which have been taken from several sources are paraphrased below
20
General Issues Concerns and Observations There is a water level that may be too low at which river access fisheries
habitat aesthetics backwater areas wildlife boating and visitation are negatively affected This water level would result in an associated decrease in recreation satisfaction and values
There is also a water level that may be too high at which recreational fishing shoreline stability turbidity water quality public safety facilities beaches habitat and visitation are negatively affected This water level would result in an associated decrease in recreation satisfaction and values
Recreation participation is experiencing growth in all types of settings with multiple activities often occurring in the same setting This often results in conflicts requiring carefully considered management strategies
Recreationists are more often participating in multiple activities during their leisure time rather than in a single activity The number of trips is increasing as are the number of days spent participating in recreation activities
Decreasing public funding for outdoor recreation access service and facility development and maintenance will represent major long-term challenges for managers
There is a point during river and reservoir operations where the level of recreation satisfaction will decline and recreationists will move to other areas or participate in other recreation or nonrecreation activities
There is a belief that with increasing dialogue among water users a broader societal perspective among decisionmakers and more flexible and creative lakereservoir operations ldquomajor improvements can be accomplished without abandoning any water resource purpose or benefitrdquo11
More diversity in terms of race culture age income and other factors will change the demand for outdoor recreation but should not diminish the size of the overall market Diversity will result in different preferences expectations and ways of seeking and participating in recreation activities
Nationwide recreation use of available sites will continue to increase This is a result of the effect of the ldquobaby boomerrdquo generation increased leisure time new recreation technologies and increased public information about recreation opportunities in rural and urban
11 LaGrassa 1991
21
communities Increased demands on existing public lands forests and parks will necessitate creative solutions and partnerships to keep up with demand
Without major changes in infrastructure and recreation management programs the health and safety of visitors and the integrity of the natural environment may be compromised12
Heavy pressures are likely to continue at water settings that have always been a major attraction for a wide variety of outdoor recreation activities
There is a trend in protecting agricultural lands in and around urban areas for open space and parklands The addition of recreation values to agricultural lands (eg fee hunting) irrigation ditches reservoirs etc is helping to justify protective farmland easements and other land and water conservation methods
As recreation demand increases major outdoor recreation providers must continue to provide traditional outdoor opportunities closer to urban areas where most of the people seeking the activity live
As recreation demand increases development and the extraction of resources may increasingly be viewed as conflicting with recreation and conservation interests
As public agencies continue to open the planning process to public involvement organized groups representing specific outdoor recreation interests will become more involved in the decisionmaking process
If recreationists are dissatisfied with a recreation site in a particular area and newer facilities are constructed at an alternate site those recreationists will likely migrate to the newer site if other site attributes are favorable
Yakima River Basin Issues Concerns and Observations Increased interest in promoting and marketing recreation opportunities
will attract new visitors and most likely result in repeat visitation with associated benefits to the local economy
Tourism is maturing and becoming recognized in the Yakima River basin as a major economic force The tourism industry both Statewide and in the basin is improving its marketing and visibility The Yakima Valley Visitorrsquos and Convention Bureau and the Greater Yakima Chamber of Commerce are taking steps that will
12 National Recreation Lakes Study Commission 1999
22
increase Statewide recognition and recreation visitation to the area The promotion of the area for its vineyards is an excellent example of success
The arearsquos mild climate days of sunshine excellent roads rural atmosphere numerous attractions diverse special events and food and lodging are major factors that will increase nature-based tourism in the future
The numerous special designations in or near the Yakima River basin are important to a vibrant and diverse nature-based tourism industry For example designations such as national park State parks wildlife refuges scenic byways trails wilderness areas open space bike ways and historic sites all work together to comprise the tourism system in the basin
Agricultural products orchards vineyards and fruit stands are also recreation resources and an attraction to water-based recreationists
The Columbia Riverrsquos recreational access points facilities and boat launch lanes are few and modest in development and thus likely impacts both local and nonlocal visitation
Warm water fishing in the lakes east of the Yakima River basin and downstream on the Yakima River is very popular with Washington residents
There appears to be an unmet demand for boat storage modern recreation vehicle (RV) camping marina services and boat rentals floating campsites group areas for day use and camping beaches and motorized trail activities
Reservoir levels will likely affect recreation by changing the type of use taking place (eg water skiing to canoeing more shoreline beach activities) the origin of visitors (eg fewer nonlocal visitors) and the number of visitors This change and fluctuation is not necessarily negative because different types of people and uses can be served at different times of the year
It is likely that using the Yakima River for fly fishing and rafting kayaking will continue to grow At some point in time it may be necessary and prudent to regulate recreational use on the river to prevent user conflicts and decrease pressure on the fish from overuse
The measurement of current recreation visitation (demand) to the water resources in the Yakima River basin is weak Surveys of public prefer-ences for future recreation activities and settings economic values and future participation patterns do not exist for the basin Managing agencies do not have the resources for a site-level recreation monitoring program
23
Recreation Trends Influencing Water-Based Recreation Water resource managers need to understand that recreation-related trends might influence future demand for creation of new or different types of public outdoor recreation opportunities A lack of understanding of current and anticipated water-related recreation use trends hampers a water resource managerrsquos ability to effectively manage recreation The trends dealing with specific activities listed below focus on projected future participation levels The number of trips and days spent on trips by recreation users for the selected activities are not discussed here although that information is available Following are several key trends related to participation levels that may influence future water recreation management
Urban Recreation Activities ndash As society becomes more urbanized travel patterns (including length of stay repeat visitation and distance traveled) will be increasingly dependent on the quality of the recreation opportu-nities and the recreation settings provided13 Urban residents typically have fewer outdoor recreation opportunities than rural residents which results in increased demand for outdoor recreation opportunities and activities closer to urban areas
Trail Street and Road Activities ndash Activities occurring on trails streets and roads continue to be popular Walking hiking running jogging and bicycling outdoors can be done in a rural setting but are most often done in an urban environment
Water-Based Recreation Activities ndash Projections for many water-based activities such as visiting beaches or water areas canoeing motorboating nonpool swimming and rafting show increases over projected population growth through the year 2050
Consumptive Wildlife-Related Activities ndash Hunting is expected to decline in popularity from 19 million to 165 million participants over the next 50 years The National Survey of Fishing Hunting and Wildlife Associated Recreation reported a 4-percent decline in anglers nationwide from 1991 to 2001 (a 3-percent decline from 1996 to 2001) This reflects a trend but not a significant14 one
Nonconsumptive Wildlife Activities ndash Nonconsumptive wildlife activities such as birdwatching photography and other types of wildlife viewing are projected to increase more than the population growth through the year 2050 The largest factor contributing to the increase in nonconsumptive wildlife recreation seems to be the increasing age of the general
13 Tarrant Michael A et al 1999 as cited in US Department of Agriculture (USDA) 2003 14 Statistical comparisons are made at the 5-percent level This means that for 95 percent of
all possible samples the estimate for 1991 cannot be shown to be different from the estimate of 2001
24
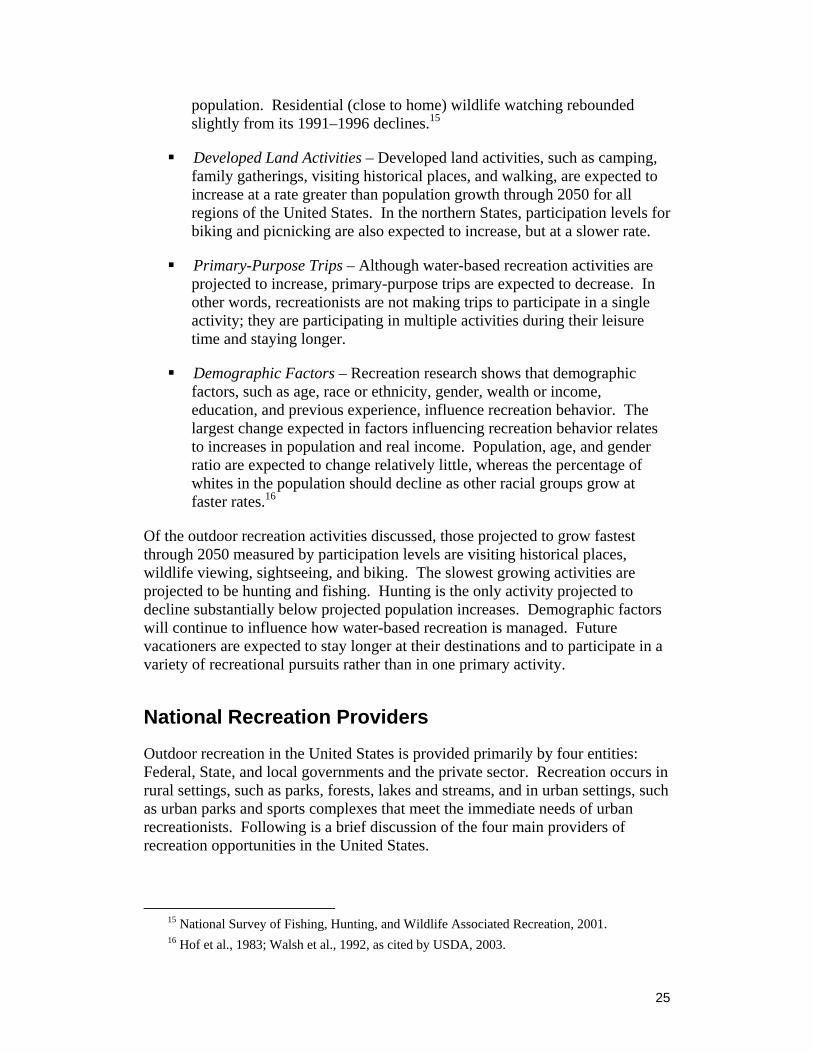
population Residential (close to home) wildlife watching rebounded slightly from its 1991ndash1996 declines15
Developed Land Activities ndash Developed land activities such as camping family gatherings visiting historical places and walking are expected to increase at a rate greater than population growth through 2050 for all regions of the United States In the northern States participation levels for biking and picnicking are also expected to increase but at a slower rate
Primary-Purpose Trips ndash Although water-based recreation activities are projected to increase primary-purpose trips are expected to decrease In other words recreationists are not making trips to participate in a single activity they are participating in multiple activities during their leisure time and staying longer
Demographic Factors ndash Recreation research shows that demographic factors such as age race or ethnicity gender wealth or income education and previous experience influence recreation behavior The largest change expected in factors influencing recreation behavior relates to increases in population and real income Population age and gender ratio are expected to change relatively little whereas the percentage of whites in the population should decline as other racial groups grow at faster rates16
Of the outdoor recreation activities discussed those projected to grow fastest through 2050 measured by participation levels are visiting historical places wildlife viewing sightseeing and biking The slowest growing activities are projected to be hunting and fishing Hunting is the only activity projected to decline substantially below projected population increases Demographic factors will continue to influence how water-based recreation is managed Future vacationers are expected to stay longer at their destinations and to participate in a variety of recreational pursuits rather than in one primary activity
National Recreation Providers
Outdoor recreation in the United States is provided primarily by four entities Federal State and local governments and the private sector Recreation occurs in rural settings such as parks forests lakes and streams and in urban settings such as urban parks and sports complexes that meet the immediate needs of urban recreationists Following is a brief discussion of the four main providers of recreation opportunities in the United States
15 National Survey of Fishing Hunting and Wildlife Associated Recreation 2001 16 Hof et al 1983 Walsh et al 1992 as cited by USDA 2003
25
Federal The Federal Government is the largest provider of public outdoor recreation providing approximately 650 million acres (about 28 percent of the total land area of the lower 48 contiguous States) Most Federal land management agencies offer recreation that is primarily land based rather than water based However those land management agencies the BLM FS and US Fish and Wildlife Service (Service) also manage recreation facilities and opportunities near streams rivers and lakes Water management agencies such as Reclamation the Corps and TVA primarily focus on managing water-based and water-related recreation activities The NPS manages not only land-based recreation facilities and opportunities but also activities that focus on water resources at national rivers national seashores and national lakeshores National recreation areas and national Wild and Scenic Rivers are managed by a variety of agencies
State State acres available for recreation include State park lands (118 million acres) State forest lands (5028 million acres) State wilderness lands (167 mil-lion acres) and State fish and wildlife lands (116 million acres)17 Recreation facilities and opportunities provided by States are typically provided at larger State park areas and smaller historical sites Areas provided in the State park system are typically smaller than the federally managed parks and somewhat larger than the more intensely developed local parks State governments also play a significant role in conserving and managing the Statersquos wildlife populations State fish and wildlife lands tend to provide more primitive opportunities and more dispersed settings than those found in State park systems State forests offer outdoor recreation opportunities that are typically more primitive and dispersed However the recreation aspects of State forests are not often known because management of State forests usually focuses on timber production and other timber-related activities Like State forest and fish and wildlife lands State wilderness areas offer more primitive and dispersed recreation opportunities than State park systems
Local The total number of acres available for recreation by local entities throughout the United States is unknown Refer to sections below for a breakdown of acres within the Yakima River basin that are in local ownership and that could be available for recreation purposes Because the recreation areas provided by local and municipal entities are small compared with State-managed areas the acreage for recreation provided by local and municipal entities is probably significantly less than that provided by State governments Nevertheless the Presidentrsquos
18 The 116 million acres estimated for State fish and wildlife lands is an average of two reports each reporting different estimates A 1995 BLM report estimated 93 million acres and a 1989 Recreation and Park Association assessment estimated 14 million acres as documented by USDA 1999
26
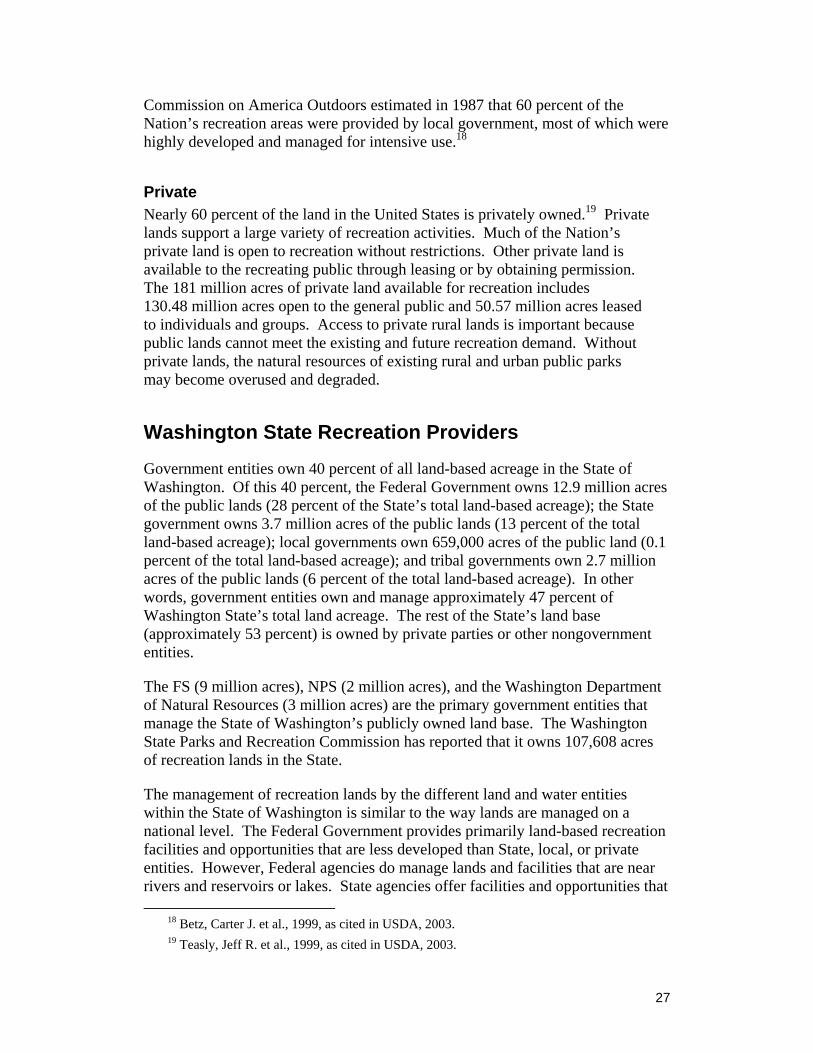
Commission on America Outdoors estimated in 1987 that 60 percent of the Nationrsquos recreation areas were provided by local government most of which were highly developed and managed for intensive use18
Private Nearly 60 percent of the land in the United States is privately owned19 Private lands support a large variety of recreation activities Much of the Nationrsquos private land is open to recreation without restrictions Other private land is available to the recreating public through leasing or by obtaining permission The 181 million acres of private land available for recreation includes 13048 million acres open to the general public and 5057 million acres leased to individuals and groups Access to private rural lands is important because public lands cannot meet the existing and future recreation demand Without private lands the natural resources of existing rural and urban public parks may become overused and degraded
Washington State Recreation Providers
Government entities own 40 percent of all land-based acreage in the State of Washington Of this 40 percent the Federal Government owns 129 million acres of the public lands (28 percent of the Statersquos total land-based acreage) the State government owns 37 million acres of the public lands (13 percent of the total land-based acreage) local governments own 659000 acres of the public land (01 percent of the total land-based acreage) and tribal governments own 27 million acres of the public lands (6 percent of the total land-based acreage) In other words government entities own and manage approximately 47 percent of Washington Statersquos total land acreage The rest of the Statersquos land base (approximately 53 percent) is owned by private parties or other nongovernment entities
The FS (9 million acres) NPS (2 million acres) and the Washington Department of Natural Resources (3 million acres) are the primary government entities that manage the State of Washingtonrsquos publicly owned land base The Washington State Parks and Recreation Commission has reported that it owns 107608 acres of recreation lands in the State
The management of recreation lands by the different land and water entities within the State of Washington is similar to the way lands are managed on a national level The Federal Government provides primarily land-based recreation facilities and opportunities that are less developed than State local or private entities However Federal agencies do manage lands and facilities that are near rivers and reservoirs or lakes State agencies offer facilities and opportunities that
18 Betz Carter J et al 1999 as cited in USDA 2003 19 Teasly Jeff R et al 1999 as cited in USDA 2003
27
are typically smaller than federally managed parks and somewhat larger than the more intensely developed local parks Local parks are intensely developed and managed for intensive use Private lands offer recreational opportunities that are typically leased to individuals or groups for recreational purposes
Recreation Participation Levels
Information pertaining to the types of existing recreation facilities and opportunities future trends and recreation participation levels can assist in establishing a baseline for assessing future recreation demand in the Yakima River basin The principal recreation providers (ie Federal State local and private) can also be used to describe the recreation environment By documenting the existing national Pacific Coast and Washington State recreation participation levels and subsequently identifying future trends user preferences and other factors land and water resource managers can focus their efforts on establishing the appropriate types and quantities of recreation facilities and opportunities These facilities and opportunities could be provided in concert with an appropriate water supply to provide the public with a variety of quality recreation experiences within the Yakima River basin
Comparisons are made between national State and regional participation and trend information to validate the demand decisions identified in this Analysis Report However one should keep in mind that certain activity participation and trend information cannot be readily compared with a high level of certainty due to the way information was collected and documented In some instances certain activities may be grouped into specific categories and in other instances the activity may be addressed separately (eg sailing motor and nonmotorized boating for pleasure may have been grouped into a boating category in one instance but reported as separate activities in other instances)
National Participation Levels Identifying recreation participation levels is important for effective management of the natural environment for recreation purposes It can help land and water management agencies forecast changes that may be required to meet demand
A 1999 national survey identified swimming fishing and boating as the three most popular water-based activities with swimming and fishing among the top five most popular outdoor recreation activities overall20
Table 3 shows the percent and number of people 16 years and older in United States participating in 12 types of outdoor recreation activities in 1999ndash2000 As
20 Recreation Roundtable 2000 as cited in USDA 2003
28
Table 3mdashPercent and Number of People 16 Years and Older in the United States Participating in 12 Types of Outdoor Recreational Activities 1999ndash2000
Type of Outdoor Activity
Percent of Population 16
and Older Number
in Millions Participated in any type of activity 975 2021
Trailstreetroad activities 888 1841 Traditional social activities 816 1692 Viewing and photographing activities1 768 1592 Viewing and learning activities 703 1457 Driving for pleasure activities 661 1370 Swimming activities 631 1308 Outdoor adventure activities 573 1188 Boatingfloatingsailing activities 407 844 Fishing 370 767 Snow and ice activities 272 565 Outdoor team sports 210 435 Hunting 142 294
1 Estimates for this category of activities were adjusted (by +1751) to compensate for a problem with a screener question
Source 1999ndash2000 National Survey on Recreation and the Environment FS and the University of Tennessee Knoxville Tennessee
the table states 975 percent of those individuals 16 and older participated in some sort of outdoor recreation activity Most of those activities are available within the Yakima River basin
Table 4 shows the results of a 1999ndash2000 national survey that identified the percent and number of people 16 years and older in the United States that participated in land-based outdoor activities Trailstreetroad team sports backpacking and camping viewing and learning viewing and photographing hunting driving for pleasure and sightseeing and traditional social activities are described in table 4 The percentages do not total 100 percent because recreationists often participate in more than one activity on a particular visittrip Many of those activities such as camping hiking walking bicycling viewing natural scenery backpacking etc are greatly enhanced by the presence of a reservoir or river water source
The same 1999ndash2000 national survey also identified people 16 and older that participated in water-based outdoor activities Boating floating fishing and swimming activities are the types of water-based activities identified in table 5 These types of activities are more dependent on a reliable water supply throughout a recreation season than those depicted in above-mentioned table 4
29
Table 4mdashPercent and Number of People 16 Years and Older in the United States Participating in Land-Resource-Based Outdoor Activities 1999ndash2000
Activity
Percent of Population 16
and Older Number
in Millions
Trailstreetroad activities
Bicycling 392 813
Mountain biking 203 421
Walking 818 1696
Horse riding and equestrian 107 222
Hiking 323 669
Team sport activities
Softball soccer baseball etc 225 466
Backpacking and camping activities
Backpacking 126 261
Developed camping 195 404
Primitive camping 122 253
Visiting a wilderness or primitive area 334 692
Gather mushrooms berries or other natural products 262 543
Viewing and learning activities
Visiting a nature center nature trail or zoo 562 1165
Visiting a prehistoric or archaeological site 197 408
Visiting a historic site 451 935
Viewing and photographing activities
Bird watching 328 679
Viewing other wildlife 428 887
Viewing wildflowers and natural vegetation 452 937
Viewing natural scenery 548 1136
Hunting
Big game 77 159
Small game 74 153
Waterfowl 23 48
Driving for pleasure and sightseeing
Sightseeing 522 1082
Driving for pleasure through natural scenery 525 1088
Off-road 4-wheel driving all terrain vehicle or motorcycle 166 344
Traditional social activities
Family gathering 731 1515
Picnicking 558 1157
Source 1999ndash2000 National Survey on Recreation and the Environment FS and the University of Tennessee Knoxville Tennessee
30
Table 5mdashPercent and Number of People 16 Years and Older in the United States Participating in Water-Resource-Based Outdoor Activities 1999ndash2000
Activity Percent of Population
16 and Older Number
in Millions
Boatingfloatingsailing Sailing 48 99Canoeing 93 193Kayaking 31 64Rowing 45 93Motorboating 232 481Water skiing 79 164 Jet skiing 91 189 Floating rafting 96 199 Sailboardingwindsurfing 08 17Surfing 16 33
Fishing Fresh water 291 603 Cold water 129 267 Warm water 226 468 Salt water 93 193 Migratory ocean-to-fresh water 37 78
Swimming Swimminglake river ocean 432 896 Swimming in fresh water 291 603 Swimming in salt water 242 502 Snorkeling 64 133Scuba 15 31Visiting a beach 372 771 Visiting a waterside 257 533
Source 1999ndash2000 National Survey on Recreation and the Environment FS and the University of Tennessee Knoxville Tennessee
An additional study completed by the FS as part of The National Survey on Recreation and the Environment (NSRE) 2000 identified the percent change in participation for certain outdoor recreation activities One should keep in mind that the population of the United States has increased substantially since 1994 That would account for more individuals participating in a certain activity however the percent of people participating in certain activities increased substantially beyond what an increase in the total population would account for Table 6 shows the participation trends from 1994ndash95 and 2000ndash02
31
Table 6mdashNational Participation Trends from 1994ndash95 and 2000ndash02
Resource Base Activity
1994ndash95 Participants (in Millions)
2000ndash02 Participants (in Millions)
Percent Change 1995ndash2002
Land Resource Based Activities Bird watching 541 69 275
Hiking 478 709 483Backpacking 152 228 500Primitive camping 280 341 218 Off-road driving 279 373 337 Walking 1337 1769 323Sightseeing 1134 1104 -26Developed camping 415 563 357 Picnicking 983 1161 181Bicycling 574 842 467Horseback riding 143 207 448 Hunting 186 241 296
Water Resource Based Activities Motorboating 470 519 104Swimming (river lake 781 891 141 ocean) Water skiing 179 173 -34 Fishing 578 727 258Sailing 96 109 134Source FS RPA Assessment 2000 as cited in Colorado State Comprehensive Outdoor Recreation Plan 2003
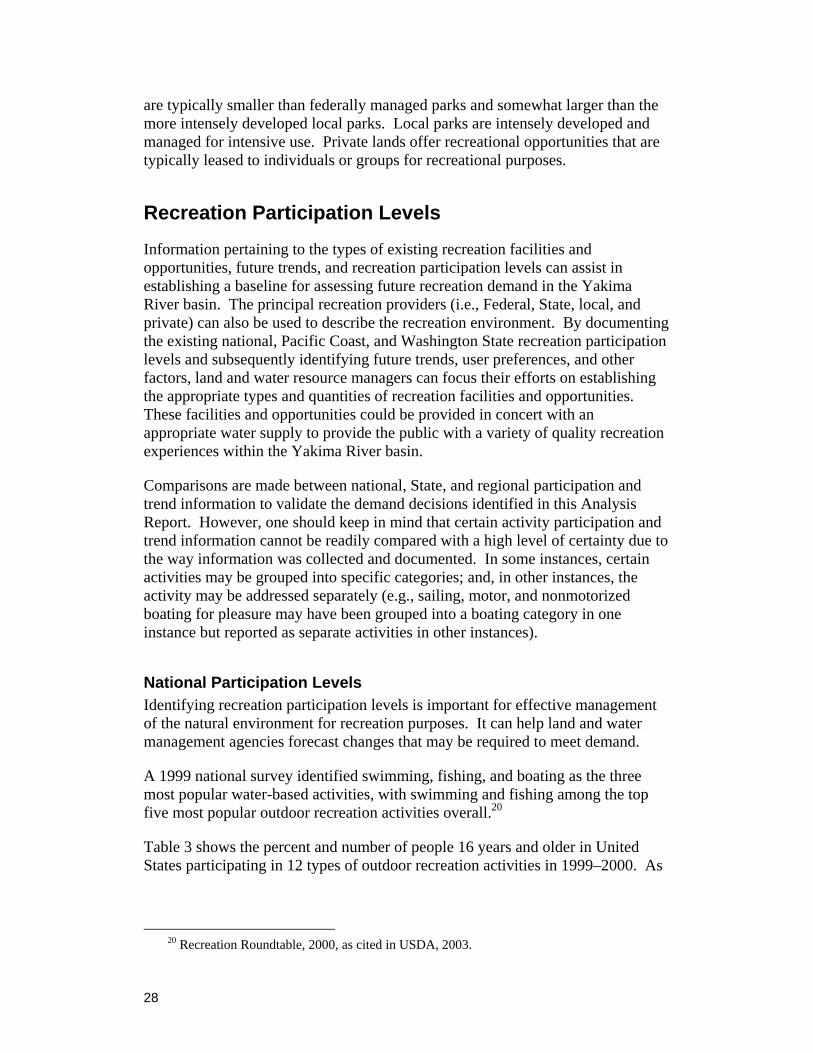
Table 7 shows the most current information available related to participation percentages in the United States for outdoor recreation activities for the year 2004 Comparing table 7 with tables 4 5 and 6 can provide some insight as to the trends in outdoor recreation participation that one can assume will continue into the first part of the 21st century
Overall most of the outdoor recreation activities experienced an increase in participation from 1995 to 2004 as indicated from tables 4 5 6 and 7 The only activities showing a decrease in participation were sightseeing and water skiing although the change is not major Activities such as hiking walking and bicycling have been the fastest growing activities over the years These activities are easier to do and less expensive Except for water skiing all water-based recreation participation levels have increased significantly from 1995 to 2004
32
Table 7mdashParticipation Rates for Outdoor Activities in 2004
Type of Activity Percent
Participating Participants
(Millions) Viewingphotographing natural scenery 706 1512 Visiting nature centers etc 635 1359 Driving for pleasure 612 1309 Viewingphotographing other wildlife 582 1246 Viewingphotographing wildflowers trees etc 570 1220 Visiting beach 569 1218 Swimming in lakes streams etc 542 1161 Visiting historic sites 531 1136 Picnicking 524 1121 Boating 442 946 Viewingphotographing birds 398 852 Day hiking 380 813 Bicycling 376 805 Fishing 375 803 Visiting a wilderness or primitive area 336 719 Viewingphotographing fish 321 687 Developed camping 311 665 Freshwater fishing 309 661 Motorboating 303 649 Snowice activities 292 624 Driving off-road (defined as off of paved or graveled roads) 225 481 Visiting prehistoricarcheological sites 216 462 Mountain biking 198 425 Primitive camping 155 331 Rafting 155 331 Jet skiing 134 287 Hunting 131 281 Cold water fishing 130 277 Canoeing 126 269 Backpacking 121 258 Horseback riding (general) 89 191 Horseback riding on trails 71 152 Kayaking 70 150 Downhill skiing 68 145 Snowmobiling 63 135 Snowboarding 59 126 Cross-country skiing 27 57 Source Recreation Statistics Update Report No 1 August 2005 FS 2005 Forest and Rangeland Renewable Resources Assessment
33
Pacific Coast Participation Levels The following figures show the results of participation levels for certain outdoor recreation activities in specific regions of the United States The regions defined are FS Resource Planning Act Assessment (RPA) regions The figures reflect information taken from the National Survey on Recreation and the Environment 2000 The States within the Pacific Coast Region include the entire States of Washington Oregon California Nevada Hawaii and Alaska The different regions differ in climate topography and culture that lead to regional variations in outdoor recreation use patterns The regions also differ in population The North has about 92 million people 16 and older the South has 62 million the Rocky Mountains has 15 million and the Pacific Coast has 31 million21
Figure 6 shows the participation percentages in viewing activities Viewing activities can include among other things visiting a nature center visiting a prehistoric site bird watching wildlife viewing and studying nature Regional participation in one or more viewing activities ranged from 74 to 80 percent However variations for individual activities between regions can be greater As an example studying nature near a water area was lowest in the Rocky Mountains (25 percent) and highest in the Pacific Coast (66 percent) Even with the variations in opportunities to participate in different activities across regions the regional percentages for viewing nature are very similar
North
South
Rocky Mountain View ing
Pacif ic Coast
0 20 40 60 80 100
Source USDA Forest Service RPA Assessment 2000
Figure 6mdashPercent of participation in viewing activities by region
Developed camping participation levels in the Pacific Coast (34 percent) and Rocky Mountain Region (38 percent) are greater than the participation levels for the other two regions (South 23 percent and North 24 percent) The same can be said of primitive camping (ie more people participate in primitive camping in the western two regions) This variation may be because there are more public lands available for camping in the Western United States Figure 7 shows the percent of participation in camping activities by regions in the United States
21 FS Report on National Survey on Recreation and the Environment 2000
34
North
South
Rocky Mountain
Pacific Coast
0 10 20 30 40
Developed Camping
Primitive Camping
Source USDA Forest Service RPA Assessment 2000
Figure 7mdashPercent of participation in camping activities by region
Hunting participation levels are greatest in the Rocky Mountains (13 percent) and in the South (11 percent) compared to the Pacific Coast (5 percent) which had the lowest participation level for hunting The regional differences may be due to cultural differences as well as the availability of public land for hunting Large amounts of public lands are available in the Rocky Mountains for hunting while hunting often occurs on private lands in the other regions The low percentages for hunting in the Pacific Coast are likely related to scarce opportunities as well as cultural differences Of the 212 million people in the United States 6 percent of the total population went hunting Participation rates ranged from a high of 12 percent in the West North Central Region to 2 percent in the Pacific Coast Region which includes the State of Washington22
Regional participation levels for fishing range from 24 percent in the Pacific Coast to 32 percent in the South Figure 8 shows the percent of participation in hunting and fishing by regions within the United States In 2001 212 million people 16 years or older lived in the United States The national participation rate for fishing was 16 percent One out of every six people went fishing The participation rate for fishing in the Nation ranged from a high of 27 percent in the West North Central Region to a low of 11 percent in the Middle Atlantic Region
The participation rate for fishing in the Pacific Coast Region which includes the State of Washington was 12 percent23
Boating participation levels range from 26 percent in the Rocky Mountain Region to 30 percent in the North Region Motorboating is the most popular of any of the
22 Service National Survey of Fishing Hunting and Wildlife-Associated Recreation 2001 23 Ibid
35
Pacif ic Coast
Rocky Mountain
South
North
Hunting
Fishing
0 5 10 15 20 25 30 35
Source USDA Forest Service RPA Assessment 2000
Figure 8mdashPercent of participation in hunting and fishing by region
boating activities included in the group of activities About 25 percent of the people in the South and 20 percent in the Pacific Coast Regions participate in motorboating The most popular nonmotorized boating activity reported was canoeing (4 percent) and rowing (3 percent) and occurred in the Pacific Coast Region Figure 9 shows the percent of participation for boating activities by regions of the United States
Pacif ic Coast
Rocky Mountain
South
North
Boating
0 10 20 30 40
Source USDA Forest Service RPA Assessment 2000
Figure 9mdashPercent of participation in boating by region
Washington State Participation Levels Information pertaining to the existing State recreation environment participation and future demand is available primarily from three sources (1) the 2002ndash2005 Washington State Comprehensive Outdoor Recreation Plan (2) the IAC for
36
Outdoor Recreation Washington Outdoors Assessment and Policy Plan 1990ndash 1995 and (3) IAC Estimates of Future Participation in Outdoor Recreation in the State of Washington An Addendum to the State Comprehensive Outdoor Recreation Plan SCORP March 2003
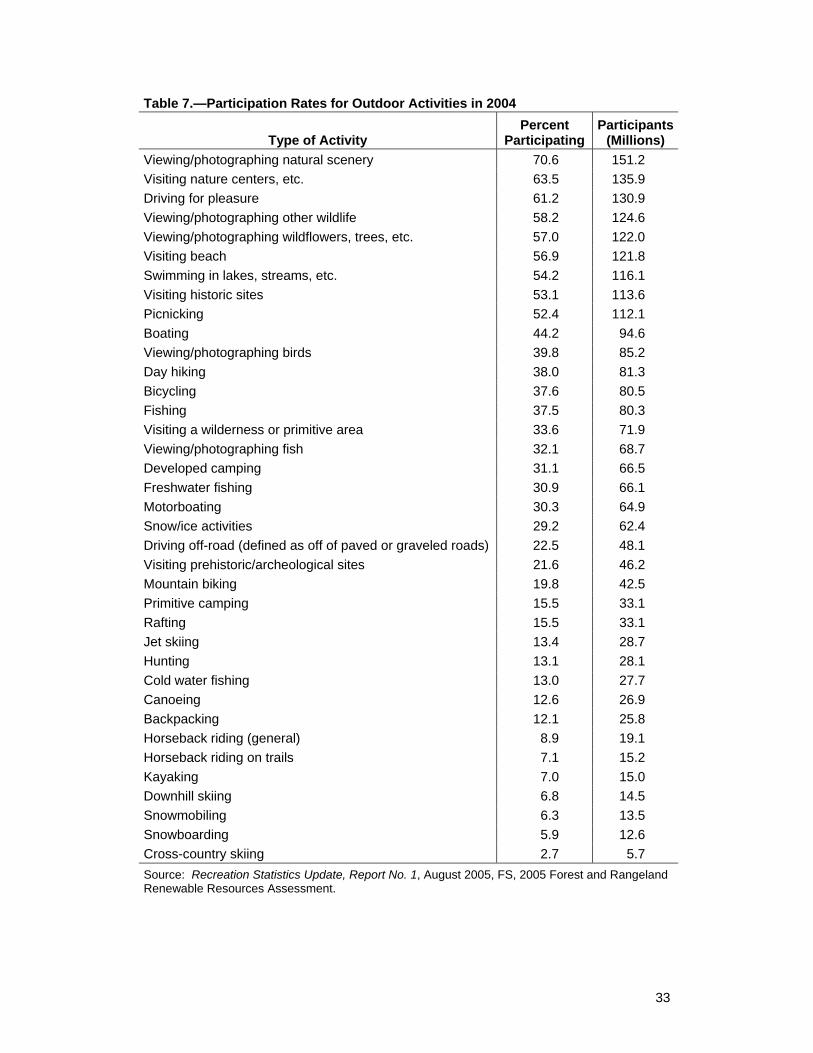
IAC identified 11 generalized recreation activity categories to determine participation levels of State households surveyed The most popular activity categories were sightseeingpicnicking hikingwalking sportsgamesother and water activities Refer to figure 10 for participation levels for the 11 recreation categories as a percent of the total State population
As part of the effort to determine actual public behavior as opposed to public preference the IAC contracted for the design and implementation of a Statewide outdoor recreation survey to determine the participation levels as a percent of the State population Figure 11 reveals that most people in the State pursue close-to-home low-cost activities such as walkinghiking outdoor team sports nature activities sightseeing and bicycling
37
Fishing
Water Activities
Nature Study
Hiking Walking
Camping
Snow Activities
Motorized ORV Riding
Nonmotorized Riding
Sightseeing Picnicking
Hunting Shooting
Sports Games Other 760
260
480
260
530
550
760
530
720
570
890
Source Interagency Committee for Outdoor Recreation Washington Outdoors Assessment and Policy Plan 1990-1995
Figure 10mdashRecreation participation by activity category
WalkingHiking 530
448Outdoor Team and Individual Sports
Nature Activities 430
230Sightseeing
Bicycle Riding 210
Indoor 205
Picnicking 200
Water Activities 190
180SnowIce Activities
Camping 130
Fishing 130
Off-Road Vehicles 89
HuntingShooting 61 Percent of State Population 30Equestrian Activities
Air Activities 17
Source Interagency Committee for Outdoor Recreation Estimates of Future Participation in Outdoor Recreation in Washington State March 2003 Addendum to the State Comprehensive Outdoor Recreation Plan
Figure 11mdashParticipation in general recreation categories as a percent of State populations
A further breakdown of water-based recreation participation levels as a percent of the Statersquos population is found in the March 2003 addendum to the 2002ndash2005 SCORP Figure 12 shows 12 water-based recreation activities and their participation levels
A further breakdown of water-based recreation participation levels as a percent of the Statersquos population is found in the March 2003 addendum to the 2002ndash2005 SCORP Figure 12 shows 12 water-based recreation activities and their participation levels
The IAC projected the State of Washingtonrsquos future participation levels in outdoor recreation for a 10- and 20-year period The 22 outdoor activities selected by the IAC are listed in table 8 Walking nature activities bicycle riding canoeingkayaking nonpool swimming and visiting a beach were the activities that are projected to grow the fastest over the 20-year period Hunting and fishing appear to be on the decline in the State of Washington The decline in hunting and fishing appears to be the norm within the United States although in some States the number of people hunting and fishing is growing but it is not
38
Swimming or Wading
Motor Boating
Beachcombing
Hand Power Canoe - Kayak-Rowboat
Water Skiing
Inner Tubing - Floating
Personal Watercraft
Sail Boating
Scuba - Skin Diving
White Water Rafting
Wind Surfing
Surfboarding
Percent of State Population
00 20 40 60 80 100
Source Interagency Committee for Outdoor Recreation Estimates of Future Participation in Outdoor Recreation in Washington State March 2003 Addendum to the State Comprehensive
Outdoor Recreation Plan
Figure 12mdashParticipation in water activities as a percent of the Statersquos population
keeping up with population growth within those States Table 8 shows the estimated participation changes for certain recreation activities in Washington over a 10- and 20-year period
Local Recreation Environment
Information concerning local outdoor recreation trends participation percentage levels and factors that may influence future recreation development activities is very limited for the Yakima River basin For the purposes of this report it is assumed that trends in outdoor recreation and participation levels for the United States Pacific Coast Region and the State of Washington also apply to the basin This section briefly describes the existing recreation opportunities that are located near or adjacent to flat water reservoirs or lakes and the major rivers within the basin The current recreation environment or supply is discussed in more detail in the Black Rock Dam and Reservoir Recreation Needs Assessment attached as appendix B In addition the ldquoIssues Concerns and Observationsrdquo section of this report can be used to describe the recreationtourism environment within the basin
39
Table 8mdashEstimates as a Percent of Change in the Number of People Participating in the Future Compared to Current Levels
Type of Activity
Estimated 10-Year Change
(2003-2013)
Estimated 20-Year Change
(2003-2023)
Walking
Hiking
Outdoor team and individual sports
Nature activities
Sightseeing
Bicycle riding
Picnicking
Motor boating
Nonpool swimming
Visiting a beach
Canoeingkayaking
Downhill skiing
Cross-country skiing
Snowmobile riding
Fishing
Camping ndash primitive dispersed
Camping ndash backpacking
Camping ndash developed (RV style)
Off-road vehicle riding
Hunting-shooting
Equestrian
Air activities
+23
+10
+6
+23
+10
+19
+20
+10
+19
+21
+21
+21
+23
+42
-5
+5
+5
+10
+10
-15
+5
No estimate
+34
+20
+12
+37
+20
+29
+31
No estimate
+29
+33
+30
No estimate
No estimate
No estimate
-10
No estimate
+8
+20
+20
-21
+8
No estimate
Source IAC March 2003 Estimates of Future Participation in Outdoor Recreation in the Washington State an Addendum to the SCORP
The Yakima River basin is within easy access of millions of residents from Oregon and Washington for day-use weekend and longer visitation It is also a major passthrough area for potential recreationists traveling the interstate highway system The Yakima River basin supplies a variety of quality water-based recreation opportunities in a variety of outdoor settings (ie urban types of settings to rural developed and natural settings) Flat-water recreation is primarily available in the western and northern portion of the basin at Cle Elum Reservoir Bumping Lake Kachess Reservoir Keechelus Reservoir Clear Lake Easton
40
Lake and Rimrock Reservoir The five primary rivers discussed within the basin that supply recreation opportunities are the Tieton Naches Cle Elum Bumping and Yakima Rivers Although there are other smaller flat water reservoirs or lakes and rivers in the basin that offer similar types of water-based recreation activities the only water bodies discussed in this section and this report are the ones specifically mentioned above
The Yakima River basin has a national reputation for its high quality fly fishing primarily on the Yakima River Fly fishing is one of the fastest growing activities on the Yakima River otherwise known as the place to ldquoChase Rainbowsrdquo The Yakima River is what anglers in Washington State call a ldquoblue ribbonrdquo trout stream (Yakima Valley Visitors Guide Yakima Valley Visitors and Convention Bureau 2005) The prime periods for fishing the river are February through May and September and October although fishing occurs on the river throughout the year Spring fishing is the best time to fish the Yakima River because water levels are low and the fish have been less active and are ready to eat insects starting their annual hatch Fishing the Yakima River in September and October is also good due to the low water levels (personal communication Gary Fairfield June 8 2005) Refer to the Yakima River streamflow hydrographs in appendix C
Spiking of streamflows negatively affects fishing for the short term (ie 1 or 2 days) Flows of 680 cubic feet per second (cfs) at Ellensburg are considered low water and flows of 2000 cfs or below are considered good for wading for fish (personal communication Dan Snyder local fly fisher June 9 2005) Streamflows of 800 cfs are ideal for fishing and flows of 4000 cfs are considered raging water (personal communication Robert Cooper local fly fisher June 9 2005)
During the summer recreation season the quality of the fishing experience is affected by other types of recreational use such as tubing and rafting for pleasure (personal communication Gary Fairfield local angler June 8 2005 Dan Snyder local angler June 9 2005) The peak rafting season on the Yakima River occurs in late June until September due to the warmer temperatures and summer vacation for students
The Yakima River below the city of Yakima to the Tri-Cities is great for small-mouth bass fishing in the spring (personal communication Dan Snyder June 9 2005)
Fishing in the Tieton River is not as good as fishing in the Yakima and Naches Rivers due to the small stream size fast water wood debris and cloudiness of the water (personal communication Gary Fairfield June 8 2005) The Tieton River is not good due to angry water and white coloration (personal communication Robert Cooper local fly fisher June 9 2005) River rafting is best during a 3-week period in September when Reclamation releases stored water in Rimrock Lake for downstream beneficial uses The rapids during that time are rated as a
41
Class III Refer to appendix D for a description of the different white water classes Also refer to appendix C for streamflow hydrographs
Fishing the Naches River is not as good as fishing in the Yakima River and there is very little rafting The lands adjacent to the river are privately owned which limits access and put in and take out sites along the river corridor
The 8-mile section of the Cle Elum River below the dam is a tributary to the Yakima River This section is bordered by private land a county road small local businesses and the small community of Roslyn The area is also the location of the large resort development of Suncadia with 3000 planned residential units and 3 golf courses Public access to the Cle Elum River is very limited because of the private land and development There are no public or private campgrounds and no public access launch sites so recreation demand is limited to fishing and boating by local residents Estimates of the amount of recreation use of the river are not available The Cle Elum River below the dam is used as an educational opportunity to teach elementary and high school students and their teachers about salmon and their life stages The salmon come to this reach of the river to spawn and the physical setting is naturally adaptable to seeing the salmon spawn mainly in the fall (September and October)
The Yakima River basin also has a Pacific Northwest regional reputation for motorized recreation opportunities associated with trail bikes all-terrain vehicles jeeps and snowmobiles primarily on FS lands on the west side of the basin National Forest managers report increased participation in RV camping off-highway activities driving for pleasure jet skiing and snowmobiling Also reported is an increase in the number of Hispanic outdoor recreation participants particularly on the Naches Ranger District adjacent to the city of Yakima (personal communication Mike Rowan and staff FS Naches Ranger District June 10 2005) Picnic sites and campgrounds are close to or exceeding capacity on summer weekends and exceed capacity on holiday weekends Recreation demand slows during the week but can reach 50- to 75-percent capacity depending on the weather (personal communication Pam Novitsky FS Cle Elum Ranger District June 9 2005)
To compare the recreation participation that is generated (origin of demand) and the recreation participation it accommodates (destination of demand) the IAC divided the State into four regions The Yakima River basin lies primarily within Region 3 as described by the IAC Region 3 satisfies a demand from other regions in the State for all activities reported in figure 13
Region 3 seems to be a destination area for recreationists from other more populated regions within the State As stated earlier the State of Washingtonrsquos population is expected to increase by 116 percent from 2005 to 2015 and 248 percent from 2015 from 2025 Accommodating and satisfying the Statersquos demand for outdoor recreation activities within the Yakima River basin is an important factor in the regionrsquos overall economy
42
Camping
Fishing
Hiking Walking
Hunting Shooting
Motorized ORV Riding
Nature Study
Nonmotorized Riding
Sightseeing Picnicking
Snow Activities
Sports Games other
Water Activities
Destination Origin
0 20 40
Source Interagency Committee for Outdoor Recreation (IAC) Washington Outdoors Assessment and Policy Plan 1990-1995
Figure 13mdashDemand in Region 3 by activity
The types of recreation activities that are popular on a national and regional scale are also the types that occur on or adjacent to the water bodies in the Yakima River basin The State of Washington and local and Federal Government agencies currently supply the facilities opportunities and infrastructure necessary to accommodate the most popular recreation activities However as the population increases and the recreation participation levels increase for many outdoor activities over the next half century many of the existing recreation sites may experience overuse and degradation unless additional facilities and opportunities are provided to meet demand and public expectations To accommodate future demand recreation providers will have to cooperate to provide the necessary and appropriate facilities and opportunities
Water Recreation Opportunity Spectrum Inventory and Existing Conditions As previously stated in the ldquoMethodology for Determining Demand and User Preferencerdquo section of this report WROS is a national interagency tool that provides planners and managers with a framework and procedure for making better decisions for conserving a spectrum of high quality and diverse water recreation opportunities As stated earlier the ldquoExecutive Summaryrdquo from the WROS Userrsquos Guidebook provides more details and is included in appendix A and the complete Userrsquos Guidebook can be downloaded from ltwwwusbrgovpmtsplanningwrosindexhtmlgt
In this Level 1 analysis WROS was used to inventory (ie map) the current supply of water recreation opportunities and to develop a regional profile of the water resources across the spectrum of six WROS zones named
43
urban suburban rural developed rural natural semiprimitive and primitive Refer to appendix E for a brief description of each WROS zone
It is typical in recreation resource planning to examine ldquocomparablesrdquo to help project demand and user preference The criteria used to select comparables in this analysis were (1) the major existing reservoirs and rivers in the Yakima River basin and (2) other water resources near the basin that were similar in terms of geography topography climate ecotype elevation vegetation and recreation use The latter criteria allowed for the inclusion of the Columbia River from the Tri-Cities to Wenatchee as well as Wanapum and Pot Holes State Parks and Moses Lake
By having an inventory of the existing recreation experiences in the area (ie the current supply) and having information about the type and amount of recreation visitation (ie current demand) decisionmakers are better able to understand current demand and to estimate future demand for new water storage or diversion options The information from the WROS inventory can be very useful in developing future development and management alternatives including different packages of appropriate recreation activities facilities infrastructure programs and regulations
Table 9 displays the current supply of water-based recreation opportunities in the Yakima River basin study area across the six WROS classes For the nine comparable lakes and six comparable rivers the number of ldquowater surface acresrdquo and ldquoriver milesrdquo by WROS class is presented respectively The percentage distribution of total water surface acres and river miles by WROS class is also presented Maps for each comparable that depict the location of each WROS class are included in appendix F
A total of 36235 water surface acres and 413 miles of rivers were included in the Level I WROS inventory conducted in this project The inventory indicates that the current supply of water recreation opportunities is primarily rural developed and rural natural
Over half (533 percent) of the water surface acreage on the comparable lakes are providing rural developed recreation opportunities followed by rural natural (373 percent) and suburban (94 percent) None of the lakes provide urban semiprimitive or primitive recreation opportunities
Similarly over half of the river miles (596 percent) are providing rural developed recreation opportunities followed by rural natural (269 percent) and suburban (104 percent) Three percent of the river miles provide urban recreation opportunities None of the river miles provide semiprimitive or primitive recreation opportunities
One driving factor defining these opportunities was the level of development such as major highways (eg Keechelus Moses Lake Yakima River) residential
44
Table 9mdashInventory of the Current Supply of Water Recreation Opportunities Based upon the WROS System
Water Resources Urban Suburban
Rural Developed
Rural Natural
Semi primitive Primitive
LAKES Water surface acres by WROS Class
Keechelus Lake 2360 acres
Kachess Lake 1684 acres 2595 acres
Cle Elum Lake 4478 acres
Lake Easton 205 acres
Rimrock Lake 2351 acres
Bumping Lake 472 acres 849 acres
Clear Lake 231 acres
Moses Lake 3417 acres 2551 acres 760 acres
Potholes Lake 5220 acres 9062 acres
Total water surface acres
3417 acres 19321 acres 13497 acres
( of total) (94) (533) (373)
RIVERS River miles by WROS Class
Yakima River 29 miles 144 miles 30 miles
Columbia River1 13 miles 11 miles 54 miles 42 miles
Bumping River 3 miles 13 miles
Tieton River 1 mile 20 miles
Naches River 3 miles 36 miles 6 miles
Cle Elum River 8 miles
Total river miles 13 miles 43 miles 246 miles 111 miles
( of total) (31) (104) (596) (269) 1 The Columbia River surface acres available for recreation for each of the WROS classes identified in the
inventory are also displayed in the legend on the Columbia River Map in appendix F There are a total of 34050 acres of flat water between Wenatchee and the Tri Cities that are available for recreational purposes
areas (eg Moses Lake Cle Elum Tri-Cities) recreation facilities such as campgrounds and boat launches (eg all lakes Wanapum) and smaller roads paralleling the shoreline (eg Rimrock Columbia River)
A second driving factor was the level of recreation use Washington State Parks reported that for the parks within the project area the annual visitation was slightly greater than 10 percent from 1997 through 2002 that is the annual visitation to State parks increased an average of 2 percent annually over the last 5 years
45
While the annual visitation to each lake within the study area is not measured by the FS interviews were conducted with five district recreation staff Based upon their expert opinion the FS managers indicated that the level of recreation demand is approaching or at capacity (ie 75ndash100 percent of capacity) during the summer weekends and with a few exceptions considerably less during the weekdays and shoulder seasons (ie 25ndash50 percent of capacity) There may also be situations on major holidays or during special events when the level of boating demand (ie the number of boats on the lake at one time) is exceeding the supply of boating opportunities It was also learned from the managers that in their opinion recreation demand has been increasing over recent years (personal communication with recreation staff at the FSrsquos Cle Elum and Naches Ranger Districts 2005)
In summary there are five findings from the WROS analysis
1 The current supply of water recreation opportunities in the Yakima River study area is predominantly rural developed and rural natural
2 There are no semiprimitive or primitive water recreation opportunities and relatively few urban and suburban opportunities
3 The level of recreation demand (ie visitation) continues to increase each year for this current supply of opportunities
4 The current visitation indicates a user preference for rural natural and rural developed opportunities as well as an apparent level of visitor satisfaction supported by finding number 3 above
5 There are times and locations during the peak recreation season when recreation demand approaches or exceeds the recreation capacity or available supply of opportunities
Setting Attribute Considerations Attributes that influence recreation such as water quality and streamflows are important aspects of the existing and future recreation environment Recreation setting or site attributes24 are usually specific to a type of recreation area To adequately satisfy the long-term demand for outdoor recreation managers must supply and properly maintain the natural and manmade site attributes that are important to the recreation users The following discussion concentrates on the public satisfaction levels with certain attributes associated with a particular recreation setting If users are not happy with a particular attribute they are likely to seek alternative sites or substitute activities The following are setting attributes that might contribute to user satisfaction of a site
24 For the purposes of this document an attribute is defined as a site condition users consider important for a quality recreation experience and will result in return visits to the site (eg solitude scenery adequate riverflow or reservoir elevation shower restroom and boat ramp)
46
Fees ndash Fees charged for the use of a site and its facilities should be reasonable and commensurate with the services provided
Carrying Capacity ndash The physical25 social26 environmental27 and facility28 capacities should not be exceeded
Public Information ndash Appropriate information should be provided in the form of brochures pamphlets identification and location of emergency services clear directional signs and up-to-date Web sites which can provide information about the site prior to the visit and the opportunity to make reservations
Access ndash Appropriate public access should be provided to the site or river segment and within the site (eg access for persons with disabilities boat ramps trails parking)
StreamflowsReservoir Levels ndash Appropriate streamflows and reservoir water elevations should be provided for activities within a recreation setting keeping in mind that different activities may require different streamflows and reservoir elevations
Water Quality ndash Appropriate Federal State and local water quality standards should be met The following factors should be monitored to maintain user satisfaction levels (1) hygienic factors such as bacteria (total bacteria fecal coliform bacteria ecoli enterococci) toxic substances etc (2) aesthetic factors such as color turbiditysuspended solids (algae oil and grease content) odor temperature and acidity (ph and alkalinity levels) and (3) indirect factors that stimulate undesirable aquatic plant growth (eg ammonia phosphorus and nitrogen levels) (Reclamation 2002)
Health and Safety ndash The recreation setting should be free of manmade hazards natural hazards should be identified in accordance with all legal requirements and appropriate sanitation facilities should be provided
Facilities ndash The appropriate quantity and types of amenities that complement the recreation setting should be provided For example at an urban or suburban type of setting amenities might include restrooms
25 Physical carrying capacity can be described as the area that is available to a recreation user
for participating in a specific recreation activity 26 Social carrying capacity can be described as the impacts that resource users have on one
another The number type and location of recreation users encountered by other resource users sometimes affect the recreation experience one is seeking to enjoy
27 Environmental or ecological carrying capacity can be described as the impacts that a level of recreation use will have on plants animals soils water air etc
28 Facility carrying capacity can be described as the ability of an existing facility to accommodate the current level of recreation use
47
potable water fire pits picnic tables and shelters electrical hookups telephones camp hosts law enforcement personnel adequate parking and interpretive services In addition facilities should be clean and well maintained
Scenic and Visual Qualities ndash Unique scenic and visual qualities available within a particular recreation setting should be protected to ensure that the public can continue to use and enjoy the surrounding environment and to ensure repeat visitation to the site
Diversity of Opportunities ndash Multiple types of recreation opportunities should be available within the site or immediate vicinity to allow families and groups to participate in a variety of activities during their visit
Table 10 contains examples of additional site attributes that are important to recreational users
The setting attributes mentioned above contribute to user satisfaction with a particular recreation site Maintaining these attributes will increase the quality of the experience for users and result in return visits to the recreation site and increased benefits to local economy Managers should concentrate their time and funding resources on providing attributes that would have high visitor satisfaction In addition as the United States population becomes more ethnically socially and economically diverse recreation managers will have to modify the attributes of many outdoor settings to accommodate new demands and user preferences
Local Carrying Capacity Considerations Carrying capacity is the ability of a recreational resource to support a user population at a measurable threshold based on specific goals and objectives (Pfhister and Frenkel 1974) Carrying capacity will vary with the amount of instream flows in a river or water elevations of a reservoir The volume and velocity of flows as well as the amount of usable water surface acreage of a reservoir are important in sustaining a quality recreation experience over an extended period of time The amounts timing and duration of flows in the river or water elevations at a reservoir needed to conduct a certain type recreation activity differ among the many recreation users Optimum flows or reservoir elevation required for a quality recreation experience for one recreation activity is not necessarily optimum for another (eg optimum flows for river rafting are not necessarily optimum for swimming or fishing) Ideally instream flows and reservoir water elevations could be established that benefit the greatest number of recreation users at any one time while not negatively impacting environmental resources One can assume that bankfull flows and reservoir full pools would benefit most of the water-related recreation activities Following are some observations dealing with social physical environmental and facility types of carrying capacities as described earlier
48
Table 10mdashPercent of Population over the Age of 15 Indicating the Importance of Recreation Site Attributes as They Contribute to Making the Site an Ideal
Recreation Setting by Level of Importance and by the FS RPA Region 1994ndash95 Site Attribute and
Level of Importance Pacific Coast Region
Nearness to Home Not important 129
Moderately important 489 Very to extremely important 382 Good Roads and Parking at the Area
Not important 63 Moderately important 379 Very to extremely important 557
Cleanliness of Restrooms Facilities and Grounds at the Area Not important 16
Moderately important 213 Very to extremely important 772 Helpfulness of Area Employees
Not important 56 Moderately important 391 Very to extremely important 553
Safety and Security at the Area Not important 31
Moderately important 221 Very to extremely important 747
Quality of Scenery at the Recreation Area Not important 11
Moderately important 223 Very to extremely important 766
Reasonable Fees for Use of the Area Not important 35
Moderately important 324 Very to extremely important 641
Map Informational Signs and Bulletin Boards at the Area Not important 56
Moderately important 405 Very to extremely important 539
Opportunity to Bring Pets into the Area Not important 446
Moderately important 327 Very to extremely important 226
Source National Survey of Recreation and the Environment FS 1994-95
49
Social carrying capacity differs among users and depends on the type of experience being sought and the tolerance of the individuals or groups using the resource Flows in the river system and water elevations in a reservoir may affect the social carrying capacity of that water body If the usable surface acres of a river or reservoir increase the ability of the recreationists to tolerate the presence of another user also increases Likewise if usable surface acres are decreased the water body will not socially accommodate as many recreation users If use increases over time and the river and reservoir acres remain constant the river and reservoir will eventually reach its social capacity limit (ie recreationists will not tolerate the sights and sounds of other users)
Physical carrying capacity of a water body can be increased or decreased by regulating flows that pass through the system (ie the usable acres available to a recreation user to participate in a specific activity can be increased or decreased by regulating the volume of water released into the system)
Environmental carrying capacity limits can be affected by the volume of water in a river or a reservoir and the timing of water releases into or out of the system High volumes of water or in some instances low volumes may negatively affect fish habitat and waterfowl nesting areas High streamflows or reservoir elevations combined with excessive bank fishing over extended periods of time may cause unnecessary bank erosion In addition recreation activities may affect fish and wildlife in a variety of ways such as disruption of waterfowl nesting and feeding areas alteration of waterfowl flight patterns destruction of aquatic vegetation and increased pollution from boat motors and human litter and waste
Facility carrying capacity can be affected by increasing streamflows or reservoir water elevations (eg if streamflows were optimized to enhance boating activities over extended periods of time existing use of limited launch sites and support facilities may increase This may cause overuse and deterioration of existing facilities
Water Quantity Considerations As discussed earlier adequate streamflows and water reservoir elevations are setting attributes that can determine user satisfaction with a particular recreation site Sufficient streamflows and water elevations increase the quality of the experience for users participating in water-based recreation activities Different recreation activities require different flows within different river segments and different reservoir water elevations (eg it is important to manage river segments according to streamflows access points types of use and physiography of the river)
50
The quality of the recreation experience for most activities will be affected by streamflows and reservoir water elevations that are available during the different types of water years (ie wet average or dry) As an example under existing conditions the quality of a rafting experience and the months available to the users to achieve that experience in a wet year may be greater for the entire recreation season than in an average or dry year If seasonal instream flows and reservoir elevations are greater than historic conditions the opportunities for achieving a favorable recreation experience may be enhanced
Under normal circumstances if flows and reservoir elevations are maintained at a level that typically represents bankfull flows and reservoir full pools throughout the summer recreation season the majority of water-based recreation activities will be enhanced Maintaining consistent flows and reservoir elevations will increase the quality of the recreation experience for most users The quality of the recreation experience will be impacted the most during dry and severely dry water years
Recreation Water Quality Considerations As discussed earlier water quality can be considered a recreation setting attribute that can be used to measure user satisfaction within a particular site Water-based recreation activities such as swimming are directly impacted by water quality and should not be permitted if public health standards are not maintained Water-related activities such as camping hiking bicycling etc are indirectly impacted by water quality and are usually discussed in terms of visual effects such as algae growth and clarity or the impact of odors encountered by a user
Monitoring for water quality is an important aspect for long-term management of water resources Often recreationists do not know there is a water quality problem until it has degraded to a point that an area is closed to the public At that point user satisfaction with the site declines and visitation decreases Unless efforts are immediately initiated to correct the problem and those efforts routinely reported to the public the public will have a tendency to avoid the site Closing a recreation area because of poor water quality conditions can be avoided by initiating a water quality monitoring program
Following are the water quality factors that should be monitored
Hygienic factors such as bacteria (total bacteria fecal coliform bacteria ecoli enterococci) toxic substances etc
Aesthetic factors such as color turbiditysuspended solids (algae oil and grease content) odor temperature and acidity (ph and alkalinity levels)
Indirect factors that stimulate undesirable aquatic plant growth (eg ammonia phosphorus and nitrogen levels)
51
Projections of Recreation Demand and User Preference Yakima River basin rivers and reservoirs continue to be important to residents and nonresidents who participate in water-based recreational activities Water resource managers need to consider future recreation trends and how these trends might influence future demand for creation of new or different types of water-based outdoor recreation facilities and opportunities Decisionmakers also need to understand the different attributes that make a particular recreation site appealing to a recreation user Streamflows water surface elevations capacity limitations and water quality are some of the most important attributes that can contribute to a userrsquos satisfaction of a water recreation site
The primary purpose of this Recreation Demand and User Preference Analysis was to estimate the future outdoor recreation demand and user preference for the Yakima River basin to assist Reclamation and its partners in determining viable recreation strategies within the alternatives that may be contemplated in the Storage Study Based upon a Level 1 analysis (eg based upon existing information and expert opinion) this section identifies those key factors that the investigators believe will significantly influence future recreation demand and user preference in the Yakima River basin Table 11 (shown later in this report) provides a set of estimates for the projected percentage change in recreation participation over the 20 years from 2005 through 2025
Key Factors Influencing Future Projections
This report identifies many factors that will influence the future recreation demand and user preferences in the Yakima River basin Those deemed most significant are listed here
Regional State and local area population growth will continue at a 15- to 25-percent annual increase The increase in population within the prime recreation market area of the Yakima River basin (ie Washington Oregon Idaho British Columbia and California) will be greater than national averages and ensure continued increases in outdoor recreation participation on public lands and waters
Hispanic and Asian populations in the basin will continue to grow much faster than non-Hispanicwhite populations Participation in outdoor recreation by these populations will also increase faster than non-Hispanic white populations
Senior populations will continue to grow in the basin given the arearsquos climate roads services agricultural and open space setting and outdoor recreation opportunities Senior populations have above average leisure
52
time and discretionary income and thus will help to increase local recreation participation Seniors will increase the demand for recreation settings with comforts security and conveniences
Tourism development and visitation will grow significantly in the Yakima River basin (ie nature-based agricultural-based historical- and cultural-based tourism) The popularity and recognition of the Yakima River basin as an attractive destination will significantly increase among Pacific Northwest and national travelers
The arearsquos reputation for blue-ribbon river fishing summer and winter off-highway vehicle use and special land use designations such as Wild and Scenic Rivers State and national parks and scenic byways will significantly help to increase public awareness and the popularity of the area
Nonconsumptive wildlife activities such as birdwatching photography and other types of wildlife viewing are projected to increase
Developed land activities such as camping family gatherings visiting historical places and sightseeing are expected to grow faster than the population
Although water-related activities and length of stay are projected to increase primary purpose trips are expected to decrease
The current supply of rural developed and rural natural recreation opportunities will continue to have increased visitation Increased visitation and a greater variety of recreation activities being accommodated at any one location will tend to reduce the percent of rural natural recreation opportunities in the basin and increase the rural developed recreation opportunities in some instances this will lead to a more suburban type setting
The current supply of recreation facilities (eg campgrounds marinas launches) is not expected to increase in number to any extent nor will the projected State and Federal budgets be sufficient to maintain the quality of the current recreation facilities That is it is likely that the current supply of public recreation and facilities will continue to age and decline in condition
National regional State and local participation rates in outdoor recreation will continue to increase among all ages income and ethnic groups State park visitation in eastern Washington has witnessed a 2-percent annual increase on average from 2000 to 2005
Energy costs will influence people to take fewer trips travel fewer miles from home and to stay longer at prime destinations Given the population
53
base within the recreation market area for the Yakima River basin energy costs would not be expected to decrease visitation and actually may well increase visitation by encouraging the Pacific Northwest travelers to stay within the region and not travel beyond (ie may reduce recreational leakage both in terms of participation and economics)
Water resources will continue to be a prime attraction for day-use and overnight outdoor recreation participants People will continue to seek opportunities to enjoy the outdoors and to experience a natural setting in contrast to their daily work and living environs
Projected Recreation Demand for Key Activities
There is no formula or way to scientifically determine with a high level of certainty the future of any human endeavor including the future of recreation demand and preference Thus based upon a 6-month Level 1 analysis of the Yakima River basin with due consideration of (1) the existing available information (2) the WROS inventory of comparables and (3) informal interviews with local experts the investigators used sound professional judgment to estimate future recreation demand
Table 11 includes a low and high range of projections for the key outdoor recreation activities in the Yakima River basin
In terms of the recreation settings that these activities will take place in it is projected that the diversity or spectrum of recreation opportunities will be reduced over the next 20 years That is it is projected that the amount of water surface acres and river miles providing rural natural recreation opportunities in the Yakima River basin will decrease in the future and shift to suburban and rural developed recreation settings The likely causes of this change will include increased population growth increased urbanization and development increased visitation causing occasional crowding and conflicts and the lack of coordinated interagency regional recreation planning and management
This evolution of the water resources in the Yakima River basin from being rural natural to rural developed and suburban is not necessarily negative or undesirable but should be planned for and the impact should be carefully examined This change will be attractive to some people and not attractive to others For example many recreationists traveling from the Puget Sound area likely want to ldquoget awayrdquo and visit a rural natural or even semiprimitive setting so the loss of rural natural recreation opportunities will displace these visitors to another area outside the basin Conversely some local people might prefer the more developed recreation settings and participate more
54
Table 11mdashProjected Percentage Change in Recreation Participation for the 20-Year Period from the Base Year of 2005 Through 20251
Key Activities in the Yakima River basin
Low-Range Estimate of the Percentage Change
in Participation over 20 years
High-Range Estimate of the Percentage Change
in Participation over 20 years
Picnicking +20 +30
Walking for pleasureday hiking +25 +35
Rusticprimitive camping +10 +15
Developedfull-service camping +20 +30
Fishing +5 +15
Bicycle riding +25 +30
Motorboating +20 +25
Beach swimming +20 +30
Raftingkayaking +25 +35
Sailing +30 +40
Waterfowl hunting -10 -20
Wildlife viewing +35 +50
Personal water craft +10 +20
Water skiing +5 +10 1 The predominant factors influencing the estimated 20-year recreation projections for the
Yakima River basin included popular growth increase in the number of retirees and Hispanic families the national reputation of a blue-ribbon fishery increasing residential development and metro commuters from the Puget Sound area and a developing tourism industry in the basin which will attract tourists and recreationists from Washington and the surrounding States
In the case of waterfowl hunting in addition to the factors mentioned above the increase in development urbanization and loss of waterfowl habitat will also contribute to a decline in waterfowl hunting participation
Projections of the net effect of these changes in the recreation settings on visitation travel patterns and the tourism economy are beyond the scope of this analysis but suffice it to say that a change in recreation settings will change the level of recreation demand and the clientele who are attracted to the basin
In conclusion it is reasonable to project a 2- to 3-percent average annual increase in outdoor recreation demand for the Yakima River basin over the next 20 years due to a variety of factors discussed earlier Of course the amount of growth will vary by key activities popular in the basin For example the projected change in participation may range from a 35-percent increase in walking for pleasurehiking to a 20-percent reduction in waterfowl hunting It is also projected that the water resources will become more developed and urbanized in the next 20 years and that there will be a shift in the supply and amount of recreation opportunities from
55
rural natural to rural developed and suburban This shift is likely to have a longer-term effect (ie beyond 20 years) on the recreation demand and the clientele who are attracted to the basin
Federal county and city governments need to cooperate in providing the appropriate number and types of recreation facilities and opportunities to meet future recreation demand in the Yakima River basin A particular recreation site or area cannot be all things to all people Decisionmakers should cooperate in providing a wide variety of recreational opportunities on a regionwide basis Increased dialog among water users a broader societal perspective among decisionmakers and more flexible and creative river and lake operations can result in major improvements to the recreation environment within the Yakima River basin without abandoning existing water resource purposes
56
References Cited Betz CJ et al 2003 As cited in US Department on Agricultural
lthttpwwwsrsfsusdagovpubsabstractviewpubjspgt
Bureau of Reclamation 1998 Office of Program and Policy Services Denver Colorado Recreation Challenges of the 21st Century
_______ Recreation Management Condition Assessment 2002 Clark Canyon Reservoir and Barretts Diversion Dam Pick-Sloan Missouri Basin Project
Cooper R 2005 Local fly fisher (personal communication) June 9 2005
Cordell KH and JC Bergstrom 1993 ldquoComparison of Recreation Use Values Among Alternative Reservoir Water Level Management Scenariosrdquo Water Resources Research Vol 29 No 2 pp 247-258
Cordell KH et al 2004 Outdoor Recreation for the 21st Century America A Report to the Nation The National Survey on Recreation and the Environment
Fairfield G 2005 Local fly fisher and business man (personal communication) June 8 2005
Greater Yakima Chamber of Commerce 2003 Facts Folder Yakima Washington
Haas G R Aukerman V Lovejoy D Welch 2004 Water Recreation Opportunity Spectrum (WROS) Userrsquos Guidebook Bureau of Reclamation Office of Program and Policy Services Denver Colorado
Hall TE and L Kruger 2004 (Draft) Understanding Recreation Trends in the Pacific Northwest State of Knowledge and Managerrsquos Needs November 29 University of Idaho Moscow Idaho
Hof JG and HF Kaiser 1983 ldquoLong-term Outdoor Recreation Participation Projections for Public Land Management Agenciesrdquo Journal of Leisure Research 15(1) 1-14 as cited in US Department of Agriculture 2003 lthttpwwwsrsfsusdagovpubsabstractviewpubjspgt
Interagency Committee for Outdoor Recreation Washington Outdoors Assessment and Policy Plan 1990ndash1995
______ 2003 Estimates of Future Participation in Outdoor Recreation in the State of Washington An Addendum to the State Comprehensive Outdoor Recreation Plan 2002ndash2005
57
Johnson KL and CJ Beale 1994 ldquoThe Recent Revival of Widespread Population Growth in Non-metropolitan Areas of the United States 1980ndash 1990rdquo Rural Sociology 59(94)655-667
LaGrassa G 1991 ldquoTempest at Glen Canyon a Case Study of Conflicts Involving Hydropowerrdquo Independent Energy Vol 21 No 1 pp 42-47
National Recreation Lakes Study Commission 1999 Reservoirs of Opportunity
Novitsky P 2005 US Forest Service Cle Elum Ranger District (personal communication) June 9 2005
Piper S and J Platt 2002 The Influence of Water Quality on Recreation Use and Economic Benefits
Recreation Roundtable 2000 ldquoOutdoor Recreation in America 1999rdquo The family and the environment Prepared for the Recreation Roundtable Washington DC as cited in US Department of Agriculture 2003 lthttpwwwsrsfsusdagovpubsabstractviewpubjspgt
Rowan M and staff 2005 US Forest Service Naches Ranger District (personal communication) June 10 2005
State of Washington 2001 Washington State Data Book County Profiles and Recreation Sections ltwwwofmwagovdatabook gt
Snyder D 2005 Local fly fisher (personal communication) June 9 2005
Tarrant MA E Smith and KH Cordell 1999 Recreation visitor preferences for and perceptions of outdoor recreation setting attributes Overview of visitor satisfactions with and preferences for attributes of outdoor recreation settings US Forest Service Southern Research Station as cited by US Department of Agriculture 2003 lthttpwwwsrsfsusdagovpubsabstractviewpubjspgt
Teasly RJ JC Bergstrom KH Cordell 1999 Private lands and outdoor recreation in the United States A national assessment of demand and supply trends US Forest Service Southern Research Station as cited in US Department of Agriculture 2003 lthttpwwwsrsfsusdagovpubsabstractviewpubjspgt
US Census Bureau 2000 State of Washington Profile US Department of Commerce
US Department of Agriculture US Forest Service 1994ndash95 National Survey of Recreation and the Environment
_______ 1999 CJ Betz D English DBK English and KH Cordell Southern Research Station Outdoor Recreation Resources Examination of recreation resources and opportunities by the four types of providers
58
_______ 2000 Forest Service RPA Assessment as cited in Colorado State Comprehensive Outdoor Recreation Plan 2003
_______ 2005 Forest and Rangeland Renewable Resources Assessment Report No 4 November 2004 Hispanic Participation in Land-based Outdoor Recreation Activities
_______ 2005 Forest and Rangeland Renewable Resources Assessment Recreation Statistics Update Report No 1
US Department of Agriculture US Forest Service and University of Tennessee Knoxville Tennessee 2000 National Survey on the Recreation and Environment Americarsquos Participation in Outdoor Recreation
US Department of Agriculture US Forest Service National Survey on the Recreation and Environment 2000 Americarsquos Participation in Outdoor Recreation ltwwwsrsfsusdagovtrendsfsch4pdfgt August 8 2005
US Fish and Wildlife Service 2001 National S urvey of Fishing Hunting and Wildlife Associated Recreation
Washington State Comprehensive Outdoor Recreation Plan 2002ndash2005 An Assessment of Outdoor Recreation in Washington State
Yakima Parks and Recreation 2000 Under Construction Blue Prints for the Future Yakima Parks and Recreation Five-Year Comprehensive Plan 2000ndash2005 Yakima Washington
59
Appendix A
WROS Executive Summary
Water Recreation Opportunity Spectrum (WROS)
Diversity is an asset in America From our work forces and financial portfolios to our natural resources and recreation opportunities there is strength in conserving diversity
Half a century ago when people said they were going camping fishing or boating it was clear what they intended Today due to many factors such as new technology and equipment more facilities and diverse public tastes and preferences there are many types of camping fishing and boating The outdoor recreation industry and profession have become much more complex and sophisticated
Research has shown that recreationists not only seek to participate in recreation activities but also seek specific recreation settings in order to enjoy a special kind of recreation experience and subsequent benefits These four components (ie activities settings experience benefits) constitute a recreation opportunity that is the opportunity for a person to participate in a particular recreation activity in a specific setting in order to enjoy a particular recreation experience and the benefits this affords For example one family might desire camping in a modern full service campground on a reservoir in order to spend quality time with the family to rest and relax and to see naturersquos beauty Another family might desire camping in a rural location where they can test their fishing skills enjoy solitude and see naturersquos beauty Both families want to go camping but in very different settings leading to different kinds of experiences and benefits that is they are seeking different kinds of recreation opportunities
A-1
Recreation + Setting = Experience gtgtgt Benefits Activity many activities physical attributes many dimensions individual
managerial attributes multiple senses community social attributes economic
environmental Managers Manage Recreationists Society Gains
Consume
The preceding insert depicts the linkage of the four components that define a recreation opportunity It also conveys that a manager manages recreation activities and settings while a recreationist consumes a recreation experience and society benefits from an active outdoor public
The Water Recreation Opportunity Spectrum (WROS) is a tool to understand the type and location of six types of water related recreation opportunities otherwise known as WROS classes The six WROS classes range across a spectrum of Urban Suburban Rural Developed Rural Natural Semiprimitive and Primitive classes Each WROS class is defined by a particular ldquopackagerdquo of activities setting attributes experiences and benefits
WROS enables the six recreation opportunity classes to be inventoried and mapped by using ex pert opinion and an inventory protocol to assess the physical managerial and social attributes of the setting The attributes that differentiate the WROS classes include
Physical attributes Managerial attributes Social attributes
Degree of development Degree of management presence
Degree of visitor presence
Sense of closeness to Degree of public access Degree of urban setting facilities nonrecreational use Degree of resource Degree of developed Degree of visitor modification recreation facilities concentration Distance to development on or adjacent to a water resource
Degree of visitor services and conveniences
Degree of diverse recreation activities
Degree of natural Degree of visitor ambiance comforts Degree of
solituderemoteness WROS is also adaptive and flexible For example WROS allows for special local attributes to be considered in the inventory stage or for a manager to divide the WROS classes into subclasses or units
The overarching goal of WROS is to provide planners and managers with a framework and procedure for making better decisions for conserving a spectrum of high quality and diverse water recreation opportunities WROS improves our understanding of the complexity of outdoor recreation management strengthens sound professional judgment and enables a manager to make better and more defensible decisions
A-2
WROS is an indispensable tool for inventorying planning and managing water resources where recreation is an important public use and benefits the local communities More specifically WROS is valuable for
Inventorying and mapping the current available recreation opportunities Helping tourists and recreationists choose where to recreate
Assessing the effects of proposed land use and water management changes
Improving public input and communication with stakeholders
Improving management efficiency and effectiveness
Improving regional interagency collaboration
Improving the defensibility of management decisions
This Usersrsquo Guidebook provides the operational details for applying WROS It is divided into four chapters Chapter 1 Introduction provides a foundation and overview of WROS and discusses the important standards for WROS decision making Chapter 2 WROS Inventory presents the steps and information needed to inventory a water resource and map the type and location of current WROS classes Chapter 3 WROS Planning discusses how WROS integrates with and supplements the key steps of a public resource planning process Chapter 4 WROS Management provides a set of guidelines for each of the six WROS classes across more than 115 setting attributes
A-3
Appendix B
Black Rock Dam and Reservoir Recreation Needs Assessment
Note The visitation use figures for this appendix are primarily from 2002 They have not been updated for inclusion into this 2006 Recreation Demand and User Preference Analysis
Black Rock Dam and Reservoir Recreation Needs Assessment1
Introduction
Black Rock dam and reservoir is one alternative to try to meet the goals of the Yakima River Basin Water Storage Feasibility Study Those goals are to improve anadromous fish habitat improve the water supply for proratable irrigation water rights in dry years and meet future municipal water supply needs Black Rock dam and reservoir would provide storage of Columbia River water until delivering the water to the irrigators in the lower Yakima Valley to the west The water currently diverted by these irrigators from the Yakima River would remain in the river to be used to improve the fish habitat in the river and reservoirs supply water to all the proratable irrigators in the Yakima River basin and supply future municipal water needs While storing this Columbia River water there would be opportunities for recreation Those opportunities could be boating swimming fishing camping and other activities as identified as needed through further investigation
The location of the potential Black Rock dam and reservoir is in the Black Rock Valley near the intersection of State Highways 24 and 241 about 30 miles east of Yakima Washington The active storage capacity is 1300000 acre-feet with a maximum water depth of about 500 feet at the face of the dam This storage capacity is more than the existing storage in the Yakima Project (table 1) At more than four times the capacity of the largest existing reservoir in the project the Black Rock reservoir would provide a surface area of about 8640 acres (about 9 miles long and 1 mile wide) with about 30 miles of shoreline and has the potential to provide recreation benefits Flat water boating fishing camping personal watercraft use and water skiing opportunities could be provided
Affected Region (Washington Counties) The purpose of this recreation needs assessment is to examine the recreation potential and need for additional recreational opportunities at the potential Black Rock reservoir The affected area for recreation is the four-county region of Benton Grant Kittitas and Yakima Counties This contiguous region contains most of the nearby flat water lakes and reservoirs that are likely to be substitutecompetition recreation sites for a reservoir in Black Rock Valley In addition the economies of these counties would be the ones most affected by any increased recreation visitation due to Black Rock
1 The primary author of the Black Rock Dam and Reservoir Recreation Needs Assessment was Rich Lichtkoppler Economist Bureau of Reclamation Technical Service Center Denver Colorado
B-1
Table 1mdashYakima Project Storage Capacity and Surface Area
Reservoir Storage Active Capacity
(acre-feet) Water Surface Area1
(acres) Cle Elum Kachess Keechelus Bumping Lake Rimrock Subtotal Black Rock Grand total
436900 239000 157800 33700
198000 1065400
21700000 2765400
4750 6535 2560 1300 2790
17935 9620
27555 1 Water surface area varies with the drawdown of water for irrigation
Source Bureau of Reclamation
2 In the feasibility planning stage only No decision has been made to develop this potential reservoir
Outdoor Recreation Needs
Conceptually recreation needs for an area are determined by examining the demand for recreation expressed in visitor days water surface area or some other measure in comparison to the supply of recreation similarly expressed Any excess demand over supply establishes a need If existing recreation sites are underutilized the current and future needs may be partially or wholly met from those sites On the other hand if existing sites are at or near full capacity then excess demand must be met by development of a new site with infrastructure to accommodate recreation use
An arearsquos excess demand establishes the ldquoceilingrdquo for benefits that can be claimed for a potential new project If projected visitation at a new site is less than or equal to the arearsquos need then the entire amount of visitation is benefit producing If the projected visitation is greater than the established need (excess demand) then the new site will be drawing visitors from other substitute sites Displacement from one site to another does not contribute to net increases in recreation or benefits
Because of budget constraints the State of Washington no longer is able to develop a State Comprehensive Outdoor Recreation Plan that provides a Demand - Supply = Needs analysis at the county or planning district level of detail (Interagency Committee for Outdoor Recreation October 2002) Their most recent effort concentrated on examining recreation participation at the State level Thus they identified current use and projected expected future patterns of recreational behavior rather than probing for recreational preferences that could be utilized to identify actual needs
People tend to use the recreation facilities and opportunities that are available to them although these choices may not necessarily reflect actual preferences In any case the Washington State Interagency Committee for Outdoor Recreation
B-2
expects motorboating to grow by 10 percent Statewide over the next 10 years (2003-2013)mdashonly about a 1-percent increase per year2 After that the demand for motorboating is expected to level off or decline during the following 10 years Hand-powered boating (canoes kayaks row boats etc) nonpool swimming and visiting beaches are water-dependent activities that are each expected to grow by about 20 percent during the next 10 years and then achieve a total growth rate of 30 percent over 20 years for each of these activities Unfortunately these are Statewide projections and are not specific to the four-county affected area under consideration here However it is assumed that this level of increased demand is similar for the four-county affected area and that increasing the supply of flat water recreational opportunities would result in some positive benefits Use of the Statewide projection is further supportable because the arearsquos current recreation sites draw visitors from across the State
Development of Black Rock dam and reservoir with recreation as an expected benefit would certainly add to the supply of flat water available for recreation in the region It may be a case of ndash if you build it they will come Informal anecdotal evidence gathered from recreation managers in the region suggests that this statement is true Agreement on whether a new reservoir is actually needed for recreation is mixed While some State wildlife refuges are reported as being under-utilized for recreation US Forest Service sites and Washington State Parks seem to be busy or near capacity for most of the summer season Recreation manager estimates of the proportion of visitors that come from outside the local region range from 40 percent to 90 percent with visitors coming from both eastern and western Washington
However the total amount of use of the potential reservoir that would represent new visitors to the region coming from outside the region is unknown at this time Thus the expected contribution to regional economic development is also unknown It is likely that if the Black Rock reservoir is built and recreation facilities are developed then some of the visitor use would be at the expense of other substitute water-oriented recreation sites within the four-county region People may seek to avoid more crowded areas and come to Black Rock reservoir The total amount of recreation use may or may not change but it is expected that a quality improvement (less crowding at least initially) would occur It is also expected that development of the recreation potential of Black Rock would contribute some positive amount of benefits to a national economic development account analysis But again some amount of the recreation benefits would probably be due to substitution effects and come at the expense of other recreation sites so that the net increase is hard to quantify without more thorough analysis
Another point to consider in estimating recreation benefits is that the potential Black Rock reservoir and probably any reservoirs contemplated in any of the storage study alternatives will be operated at least in part for irrigation demands This means that the reservoir would be drawn down many feet during the warm
2 Interagency Committee for Outdoor Recreation March 2003
B-3
summer months and such drawdowns would significantly reduce both the area and volume of water available for recreation Mudflats could be exposed and the waterrsquos edge could be far from the high water level of the reservoir Recreational facilities could end up a long way from the water reducing visitor access and desirability for recreation at this reservoir
Recreation Supply Recreation Resource Inventory (Flat Water) Alternative Sites Public sector recreation sites facilities and services are enumerated in attachment 1 More than 210 water access sites have been identified as providing public right of entry to more than 50 water bodies within or bordering the four-county area Most are managed by public agencies at the local State and national levels of government The water bodies range from small lakes and ponds consisting of a few tens of acres to large reservoirs providing tens of thousands of acres of water surface for recreation The access sites in attachment 1 offer a range of facilities and amenities but the item they all have in common is that there is a boat launching ramp providing recreational access to the water for the public Included in this supply are many of the miles of rivers reservoirs and streams that makeup the Yakima River and parts of the Columbia River watersheds In addition there is a large number of other water-oriented recreational areas throughout Washington and bordering Oregon Thus the Statewide supply is much greater than what is enumerated in attachment 1
Federal providers of recreation sites include the Bureau of Land Management (BLM) the US Army Corps of Engineers (Corps) the US Forest Service (FS) and the US Fish and Wildlife Service (Service) Washington State has by far the largest number and most widely distributed access points with the Washington State Parks providing seven parks and the Washington Department of Fish and Wildlife (WDFW) managing 85 sites Most of the WDFW sites primarily provide access for hunting and fishing via small boat (motor powered or not) on small 20- to 40-acre ponds but some sites can also be used for nonconsumptive motorboat based recreation Local county or municipal governments provided some additional access points and a few private sites open to the public on a paying basis account for the remainder of publicly available water access points in the four-county region No attempt has been made to identify other private sector sites facilities and services because these resources are generally not available to the public or provide private access to water areas also served by public facilities
B-4
Bureau of Reclamation Developed Areas Providing Recreation Opportunities Most of the reservoirs developed by Bureau of Reclamation (Reclamation) provide recreation benefits by offering recreational opportunities for a wide range of water-oriented activities Boating camping fishing hiking hunting picnicking photography water sports wildlife watching and more are available at these reservoirs But since these reservoirs are primarily operated by Reclamation to meet irrigation and power generation responsibilities lower water levels and restricted flows sometimes negatively affect recreational use of some reservoirs and streams Reclamationrsquos main areas of expertise include water management for irrigated agriculture and hydroelectric power generation Reclamation manages very few of its reservoirs for recreation Reclamation is encouraged by law to collaborate with nongovernmental entities to manage its recreation resources In partnership situations Reclamation can provide 50ndash 50 percent cost sharing for planning construction management operation and maintenance of recreation facilities and areas Partnerships with other government agencies can provide the expertise and experience in park and outdoor recreation management necessary to provide quality recreation opportunities The FS and WDFW are the primary agencies managing recreation at Reclamation developed areas Table 2 lists the main Reclamation developed areas that provide recreation opportunities in the four-county region
Banks Lake is a part of the Columbia Basin Project located in northern Grant County The Ice-Age channel (Grand Coulee) of the Columbia River was dammed at both ends and water from the Columbia River was pumped up to fill this reservoir This reservoir provides water for irrigation power generation recreation and fish and wildlife Banks Lake is well known for its fishery which is a popular recreational attraction The reservoir is 27 miles long and has about 27000 acres of water surface Fishing boating and camping are popular activities among the many available at this reservoir Steamboat Rock State Park is located on the lake Additional access is provided by the WDFW (parking and boat ramps) Coulee City (campground and marina) and a couple of private marinas Currently an environmental impact statement examining re-operation of Banks Lake to provide additional water flows to support endangered fish in the Columbia River is being completed by Reclamation A lowering of the operational range of the reservoir may affect some boating access sites but recreational use of the lake would continue
Bumping Lake is a 1300-acre water feature of the Yakima Project located in northwest Yakima County This reservoir was formed by the development of Bumping Lake Dam which is owned and operated by Reclamation Recreational opportunities include boating camping fishing hunting picnicking etc The lake is within the Naches Ranger District of the Wenatchee National Forest Recreation resources are managed by the FS Visitor use data for 2002 show that the boat launch received 2984 visits and the associated campgrounds in the area received 7723 visits In addition incidental monitoring in conjunction with
B-5
Table 2mdashBureau of Reclamation Developed Areas with Recreation Facilities Reservoir
Recreation Area Location Water
Surface Acres Managing Agency Reclamation
Project
WDFW and Washington State Parks Coulee City and Columbia
Banks Lake Grant County 27000 Private Firms
FS Wenatchee National
Basin
Bumping Lake Yakima County 1300 Forest
WDFW and Washington State
Yakima
Columbia Billy Clapp Lake Grant County 1010 Parks
Bureau of Reclamation Upper
Basin
Clear Lake Yakima County 260 Columbia Area Office
FS Wenatchee National
Yakima
Cle Elum Lake
Desert Wildlife
Kittitas County 4750 Forest Yakima
Columbia Area1
Easton Diversion
Grant County 235100 WDFW
Washington State Parks Lake
Basin
Dam
Franklin D
Kittitas County
Grant Douglas Ferry Lincoln
240 Easton State Park Yakima
Columbia Roosevelt Lake Okanogan Stevens 60000 National Park Service
FS Wenatchee National
Basin
Kachess Lake Kittitas County 6535 Forest
FS Wenatchee National
Yakima
Keechelus Lake
Potholes
Kittitas County 2560 Forest Yakima
Columbia Reservoir
Quincy Wildlife
Grant County 27800 WDFW Basin
Columbia Area3 Grant County 4 WDFW
FS Wenatchee National
Basin
Rimrock Lake
Roza Diversion
Kittitas County 2790 Forest Yakima
Dam Kittitas County 100 BLM Yakima 1 Includes Winchester Reservoir Winchester Waterway Frenchman Hills Wasteway and several small
ponds and marshes 2 = total land and water area 3 Includes Evergreen Reservoir and Babcock Ridge Burke Quincy and Stan Coffin Lakes 4 = not available
Source Reclamation
regular maintenance activities indicates that considerable numbers of visitors use the lake for day-use activities such as picnicking There is no registration or fees collected for these activities so data regarding actual visitor use are not available
Billy Clapp Lake was formed behind Pinto Dam and serves as a 6-mile-long segment of the Main Canal delivering water for irrigation to portions of the Columbia Basin Project Lands around this lake are included in a wildlife reserve
B-6
program ndash the Stratford Game Reserve The WDFW provides a boat ramp at the south end of the lake Boating fishing and hunting opportunities are available here The lake covers approximately 1010 acres and adding accompanying lands makes the total reserve 4000 acres This and other wildlife areas within the Columbia Basin are an important part of the Pacific Flyway providing feeding and breeding grounds for migrating waterfowl
Clear Lake is located on the North Fork of the Tieton River in northwest Yakima County This lake is part of the Yakima Project and is within the Naches Ranger District of Wenatchee National Forest This FS district office manages recreation Clear Lake covers 260 acres and drains into the Rimrock Reservoir Safety concerns required the draining of the lake in 1990 Public support for the recreation value of this lake resulted in the rebuilding of the dam This lake is now primarily used for recreation (boating and camping) with most of the discharge going over the spillway The Clear Lake boat launch accounted for 2920 visits and the campground produced 8589 visits in 2002
Cle Elum Lake is also part of the Yakima Project and also within the Wenatchee National Forest but it is in the Cle Elum Ranger District The lake is on the Cle Elum River which drains into the Yakima River The lake provides approximately 4750 acres of water surface at full pool Boating camping fishing picnicking and swimming are the primary recreational opportunities available Stream fishing below the dam has improved since the construction of the Cle Elum Dam Recreation is managed by the FS out of its Cle Elum Ranger District Office
Desert Wildlife Area is a 35100-acre area of desert uplands with shrub steppe vegetation and wetlands with marsh vegetation found west of the Potholes Reservoir This natural basin was a desert prior to the development of the Columbia Basin Project The area now collects irrigation wastewater from the project It is an important waterfowl breeding area which also provides good habitat for a wide range of fish mammals and other birds Winchester Reservoir Winchester Wasteway Frenchman Hills Wasteway and many small ponds and marsh areas are part of this area which is managed by the WDFW Boating camping fishing hunting and water sports are the primary recreational opportunities available here
Easton Diversion Dam impounds Lake Easton on the Yakima River Lake Easton State Park is located on this 240-acre reservoir and provides access for boating camping fishing picnicking and water sports This park is easily accessible from I-90 and reported more than 200000 day-use visits and over 30000 overnight visits in 2002
Franklin D Roosevelt Lake was formed by the building of Grand Coulee Dam on the Columbia River This dam is the principal component of the Columbia Basin Project and has created a 60000-acre reservoir with nearly 500 miles of shoreline This vast resource provides a wide range of water-oriented recreational
B-7
opportunities Recreation management of the reservoir is split between the Colville Confederated Tribes the Spokane Tribe of Indians and the National Park Service (NPS) because the reservoir lies partly within two American Indian reservations and lands administered by the NPS This National Recreation Area regularly receives between 10 and 15 million recreation visits annually
Kachess Reservoir and Dam are part of the Yakima Project This reservoir is located on the Kachess River in northwest Kittitas County Kachess Reservoir covers approximately 6535 acres and has 24 miles of shoreline Opportunities for boating fishing hunting picnicking and water sports are available The FS manages recreation out of its Cle Elum District of the Wenatchee National Forest
Keechelus Reservoir is located on the Yakima River at the site of a natural lake in northwest Kittitas County The Keechelus Dam was built at the lower end of this natural lake and it has expanded the water surface to 2560 acres Opportunities for boating fishing hunting picnicking and water sports are available here This recreation resource is also managed by the FS from its Cle Elum District of the Wenatchee National Forest Cle Elum Kachess and Keechelus Reservoirs are all accessible from I-90
Potholes Reservoir was formed by the development of the OrsquoSullivan Dam built on Crab Creek about 15 miles south of Moses Lake The reservoir covers about 27800 acres It is part of the Columbia Basin Project The dam impounds return irrigation flows from the upper portion of the basin for use in irrigating the lower part of the basin The ldquopotholesrdquo were formed during the Pleistocene flooding of the area These potholes are large depressions from 30 to 70 yards wide and 10 to 60 feet deep The building of the OrsquoSullivan Dam raised the water table in the area during the 1950rsquos and filled the depressions creating the pothole lakes Boating camping and fishing are the primary recreational opportunities at this large reservoir Potholes State Park is located on this reservoir and provides facilities for these activities
Quincy Wildlife Area is a 15266-acre land and water area managed by the WDFW It is located in west-central Grant County The area includes Evergreen Reservoir and Burke Quincy Babcock Ridge and Stan Coffin Lakes Boating camping fishing hunting picnicking and water sports are the primary recreational opportunities offered
Rimrock Lake was created in 1925 by the completion of the Tieton Dam on the Tieton River This reservoir provides about 2790 acres of water surface for recreation This Reclamation reservoir is within the Wenatchee National Forest and recreation is managed by the FS out of their Naches Ranger District office
Recreational use of the reservoir was reported as 2444 visits to the Horseshoe Cove and Rimrock boat launches and 12973 visits to the Rimrock Peninsula Area Campgrounds
B-8
Roza Diversion Dam is located in southwest Kittitas County and creates about 100 acres of water surface to divert water from the Yakima River for electric power generation and irrigation as part of Reclamationrsquos Yakima Project This relatively small lake is used for boating camping (five sites limit 7 days) fishing hunting and water sports
The BLM manages recreation on the 100-acre impoundment behind Roza Diversion Dam on the Yakima River This agency does not have the resources to accurately collect and report visitor use Anecdotal evidence indicates that the site is a popular location all summer for fishing and also is a busy take-out point for folks floating the river Regular maintenance and management activities at the site allow BLM personnel to determine that the site is very busy the entire summer season Many visitors are from the Seattle and northwest Washington environs Fishing using drift boats and fishing guides and floating the river are popular activities at this site Visitors can launch their boats at Lmuma Creek and take them out at Roza Dam
The BLM manages two other recreation sites in the Yakima River Canyon in Kittitas County south of Ellensburg ndash Umtanum and Lmuma Creek Each recreation area has a small campground (eight and seven sites respectively) and the camping stay limit is 7 days All three recreation areas support boating camping fishing and picnicking with developed picnic areas and restrooms Lmuma Creek and Roza also provide boat launches
There is a $200 per day fee for the use of the Lmuma Creek and Roza recreation sites There is no charge to use the Umtanum site
Developed Facilities for Recreation
Washington Department of Fish and Wildlife Developed facilities at the 143 WDFW recreation sites vary from site to site within the four-county area (attachment 1) These access points are found on flowing rivers natural lakes and reservoirs so both flowing water and flat water recreation opportunities are available Most sites have at least one boat launch and a parking area The boat launches can range from a natural boat launch (undeveloped) to gravel surfaced to a solid paved type Most sites have only one boat launch but there can be as many as four depending on the site Many sites only provide access to the waterrsquos edge for hunting and fishing or wildlife observation Parking lots may be a simple open area or most commonly a graveled lot Some more developed sites have paved and striped parking areas Usually a vault-type restroom is provided but more primitive locations may not have any restroom facilities Camping is permitted at many recreation sites although there may be a limit to the number of days allowed at a particular location
B-9
Contact with staff in the State office in Olympia revealed that WDFW does not have any methodology in place to count or report on visitor use of their recreation sites They are planning begin to collect this information but a lack of funding and personnel have hampered their efforts Discussions with regional staff confirmed this fact The Region 3 manager stated that a large flat water lake was needed to provide boating and other flat-water based recreational opportunities in his region (includes Benton Kittitas and Yakima Counties)1 The Region 2 manager also stated that his agency does not have the funds or personnel to collect and report visitor use at the many sites and areas in his region
Funds are limited and continued operation and maintenance is the priority He also estimated that his region receives hundreds of thousands of visits each year but this is only a guess on his part2
A vehicle use permit is required to access any of the 625 recreation sites provided and managed by WDFW The permit is good for the calendar year and allows access to the approximately 800000 acres of prime wildlife habitat owned by the State A permit is issued free with the purchase of a hunting or fishing license or available separately for $1000 Funds collected are used to operate and maintain the access sites which are currently operating at a level that represents only 34 percent of the operations and maintenance funding need
Washington State Parks There are seven Washington State Parks in the four-county region that offer flat water recreational opportunities such as motorboating and fishing (table 3) In 2002 visitation ranged from more than 130000 at Sacagawea State Park to over 938000 at Sun Lakes State Park Gingko Potholes Sacagawea and Yakima are the State Parks closest to the location for the potential Black Rock reservoir and are located north northwest southeast and west of the Black Rock reservoir site These four parks had a combined visitation of over 1390000
Ginkgo Petrified Forest State Park (includes Wanapum State Park) is located in eastern Kittitas County on the Columbia River The park encompasses 7470 acres of land and has over 5 miles of shoreline on the Wanapum Reservoir which was formed by the Wanapum Dam constructed on the Columbia River
Boating camping and picnicking are very popular activities at this park Total visitor use has ranged between 500000 to 595000 for the last 3 fiscal years On an annual basis the park has the typical head and shoulders visitation pattern ndash very heavy use in the summer season and light use in the colder months The parkrsquos day-use parking area and boat launching areas will be closed 10 to 15 days
1 Phone communication with Jerry Francisco on 9503 2 Phone communication with Kerry Taylor September 10 2003
B-10
Table 3mdashWashington State Park Visitor Use 2002
State Park 2002 Visitor Use
Gingko Petrified Forest State Park 613098
Lake Easton State Park 233530
Potholes State Park 352105
Sacagawea State Park 132265
Steamboat Rock State Park 352105
Sun Lakes State Park 938093
Yakima Sportsman State Park 295823
Total 2917019 Source Washington State Parks
each year because of exceeding their full capacity3 (Once the parking areas are 100 percent full some additional vehicles will be allowed to park along the road to the parking areas When all this space is taken the park is closed and additional vehicles have to be turned away) There are usually an additional 10 days when the parking areas come close to being 100 percent full The boat launching area (with only two ramps) is scheduled to be expanded in the near future The campgrounds (50 sites with utilities) and day-use parking area are also in need of expansion There is space to accomplish future growth but funding has not yet been secured
Lake Easton State Park is a forested park on the shore of Lake Easton in northwest Kittitas County It provides outstanding views of surrounding mountain scenery This lake and State park are downstream from Reclamationrsquos Kachess and Keechelus Lakes and is easily accessible from I-90 Camping fishing picnicking and swimming are offered at this park Boating is allowed There is one boat ramp and a small dock Motorized boating is allowed but the lake is shallow with many tree stumps near the surface so high speeds are discouraged Recreational use was more than 230000 visits in 2002
Potholes State Park is a 640-acre camping park located in southern Grant County on the shores of Potholes Reservoir the park has over 35 miles of shoreline This 27800-acre reservoir is also known as OrsquoSullivan Reservoir and is part of the Columbia Basin Project In 2002 there were more than 350000 visits to this park Water levels can vary dramatically throughout the irrigation season The pothole lakes for which the park and reservoir were named are about a frac12-hour drive from the park The Columbia National Wildlife Refuge is 2 miles east of the park and provides excellent wildlife viewing and birding opportunities
3 Phone conversation with Ginkgo Park staff Jim Mitchell September 9 2003
B-11
The park has four boat ramps and about 100 feet of dock to support all types of boating and water sports plus fishing picnicking wildlife watching etc Swimming from sand beaches is a popular activity Camping is available at 61 tent spaces and 60 additional spaces with utility hookups There is a dump station in the park The campgrounds have four restrooms and four showers
Sacagawea State Park is located near the confluence of the Columbia and Snake Rivers It a 284-acre marine day-use park with 9100 feet of shoreline There is no overnight camping but overnight moorage is allowed and visitors are allowed to stay on their boats at the 70 feet of moorage There are two boat ramps and 200 feet of dock There are extensive picnic facilities 2 large picnic shelters 7 sheltered picnic tables and 123 unsheltered picnic tables A daily permit costs $500 and allows for parking watercraft launching and trailer dumping Fees are also required for overnight moorage The park hosted over 130000 visits
Steamboat Rock State Park occupies 3522 acres on a basalt butte rising 800 feet above the water surface of Banks Lake This park is on a peninsula that juts out into Banks Lake from its northeastern shore The park has nearly 95 miles of shoreline Boating camping and fishing are the main attractions of the park but the park is also becoming more popular for its rock climbing opportunities The parkrsquos seven boat ramps and 320 feet of dock provide access to about 27000 acres of water surface Northrup Creek water access (boat ramp) is available 24 hours a day Camping facilities include 26 tent spaces 100 developed campsites with full utility hookups (1 dump station 6 restrooms and 8 showers) and 12 primitive boat-in campsites with vault toilets and drinking water There is a sandy swim beach 131 miles of hiking and biking trails and 10 miles of horse trails Steamboat Rock is a very popular park This park received over 580000 visits in 2002 Typically the park receives over one-half million visitors a year
Sun Lakes State Park is just south of Dry Falls a 400-foot-high 35-mile-wide stark cliff that once was a waterfall ten times the size of Niagara Falls Dry Falls is the location of Dry Falls Dam which is the southern boundary of Banks Lake This 4027-acre park features boating and camping opportunities There are nine lakes providing almost 14 miles of shoreline for recreational use Two boat ramps and a 20-foot dock provide boating access The park provides 162 tent camping sites and 18 sites with utility hookups There is one dump station and eight restrooms and eight showers Visitation was nearly 940000 in 2002
Yakima Sportsman State Park was first developed as a facility and natural area by and for the Yakima Sportsman Club which was a fishing hunting and shooting organization This 247-acre park was donated to Washington State Parks in 1956 Located within the Yakima River flood plain this park offers birding camping fishing and picnicking as the primary recreational activities Camping facilities include 28 tent camping sites 37 developed campsites with utility hookups a dump station 2 restrooms and 4 showers Although there are ponds and the Yakima River nearby there
B-12
are no provisions for boating The park is irrigated and supports a wide variety of vegetation including hardwoods and wildlife The park is a green oasis in an otherwise dry desert area and hosted nearly 300000 visitors in 2002
Almost 30 percent of the parkrsquos operating budget is funded through fees and permits In general fees are charged for the use of specific facilities relating to boating camping and winter use for snowmobiling and nonmotorized winter sports The Washington State Parks and Recreation Commission requires a vehicle parking permit to park in State parks Statewide The daily fee is $700 with an annual permit costing $7000 These fees were discounted to $500 and $5000 respectively until 2006 In addition there are other fees to cover the use of special facilities and services
A daily boat launching fee of $500 is charged at boat ramps An annual launching permit is $5000 There are additional charges for moorage depending on the size of the boat and length of time moored
As of 2002 camping fees were as follows standard campsite $1500 utility campsite (recreation vehicle [RV] hookups) $21 primitive campsite $1000 An additional $100 for camping is also charged at certain high-use parks between April 1 and September 30 An additional $2 per adult per night is charged when there are more than four adults per campsite maximum eight adults per campsite In addition $1000 per night is charged for a second vehicle unless it is towed by a recreational vehicle There is a $500 charge for use of the dump station unless you are camping For campers this fee is included in the camping fee Group camping facilities and group picnic facilities are available and there is a charge for their use
These are the general systemwide park fees They may vary by park depending on local conditions and services provided
National Park Service Lake Roosevelt National Recreation Area was created by the development of the Grand Coulee Dam on the Columbia River and is a major recreation resource in northeast Washington This dam impounds water on the Columbia Kettle and Spokane Rivers and has created a reservoir that has 60000 surface arcres and 500 miles of shoreline Lake Roosevelt borders the Colville Indian Reservation and the Spokane Indian Reservation and reaches almost to Canada The portions of the lake that lie within these reservations are managed by the Colville Confederated Tribes and Spokane Tribe The NPS manages the considerable remainder as Coulee Dam National Recreation Area The NPS has nearly 2 dozen developed sites providing a variety of recreation services including boat launches campgrounds and picnic areas Only a small portion of this recreation area borders the northernmost part of Grant County behind Coulee Dam Here boat access to the water is available at Crescent Bay near the town of Grand Coulee
B-13
The NPS regularly collects and reports visitor use data for Lake Roosevelt National Recreation Area The recreation area received between 11 and 15 million recreation visits annually from 1990 through 2002 Table 4 displays the recreation visits and overnight stays Except for 2001 visitation has been over 14 million recreation visits since 1997 Since 1987 use has been over one million visits each year Overnight use of the park has been over 140000 overnight stays since 1997 again except for 2001 The national emergency of September 11 2001 resulted in lower than normal visitor use for 2001
Table 4mdashLake Roosevelt National Recreation Area Visitor Use
Year Recreation Visits1 Overnight Stays2
1990 1542515 155703
1991 1771420 149476 1992 1121973 142573
1993 1198605 160747 1994 1515674 171900
1995 1341016 174263 1996 1045455 145626
1997 1431960 177360 1998 1545150 176528
1999 1403793 169679 2000 1415627 169787
2001 1252160 132070 2002 1444751 146559 1 A recreation visit is the entry of any person onto the lands or
waters administered by the National Park Service for the purpose of recreation
2 An overnight stay is one night spent within a park by a visitor A visitor is an individual who may generate one or more visits Source NPS Public Use Statistics Office
Boat launch facilities managed by the NPS have fees of $600 for a 7-day pass or $4000 for an annual pass The annual pass is discounted to $3000 if purchased from January 1 through April 30 These passes may be purchased through the mail Camping is on a first-come first-served basis at all NPS campgrounds Up to 2 vehicles and 10 people per site are allowed A camping fee of $1000 per night per site is charged A reduced cost of $500 per night is charged from October 1 through April 30
B-14
United States Army Corps of Engineers The Corps developed McNary Lock and Dam to impound the Columbia River and created Lake Wallula which extends for 46 miles up the Columbia River This reservoir has a surface area of 38800 acres with 242 miles of shoreline Approximately 16900 acres of associated public lands surround the lake and are used for public recreation wildlife habitat wildlife mitigation and water-connected industrial development About 2400 acres are leased to State or local agencies for recreational purposes Another 3500 acres are leased to the Service as part of McNary National Wildlife Refuge Public boat launching facilities are located at 17 locations and another 8 access sites are managed by private commercial concessionaires or boat clubs The recreation sites include McNary Dam Columbia Park Howard Amon Park Hover Park Leslie R Groves Park Two Rivers Park Washington Boat Launch and the Yakima River Delta Wildlife Nature Area
Situated on the Columbia River south of the Black Rock site is a park built by the Corps on property they control Until October 2002 this park was known as Crow Butte State Park and was managed by the Washington State Parks Department The visitation to Crow Butte State Park was nearly 125000 from January through September 2002 Washington State Parks ceased to operate this park due to budgetary constraints since the State did not have ownership of the land or infrastructure A nonprofit organization has recently begun to operate this park in cooperation with the Corps
There is a fee for camping at Columbia Park The charge ranges between $700 and $1100 depending on the type of campsite (tent RV etc) It costs $250 to use the dump station if the visitor is not also camping here Day-use activities and use of the boat launches at this and other Corps recreation sites are free
United States Fish and Wildlife Service Several areas are managed by the Service in the four-county region and are available for flat water recreation The largest is the Hanford Reach National MonumentSaddle Mountain National Wildlife Refuge in Benton Grant and Franklin Counties The Hanford reach is the only nontidal free-flowing stretch of the Columbia River within the United States Most of this 195000-acre monument and refuge are closed to the public or access is limited There are few visitor use facilities More open use of the monument and refuge is awaiting the completion and implementation of a comprehensive management plan
Columbia National Wildlife Refuge is on the border between Grant and Adams Counties and provides approximately 23000 acres of mixed lake grassy uplands sagebrush and canyon and butte habitat This refuge has 145 acres of ponds 841 acres of lakes and 178 miles of streams Boating fishing hiking hunting picnicking and RV use opportunities are available Camping is available at Soda Lake Campground There are boat launches at Blythe Corral Hutchinson Lower Hampton Soda and Teal Lakes
B-15
Umatilla National Wildlife Refuge consists of 29370 acres of marshes sloughs open water cropland and sagebrush uplands The refuge in located in the extreme southwest corner of Benton County along the Columbia River Boats without motors are allowed on refuge ponds Motorboating is permitted on the Columbia River portions of the refuge There are excellent opportunities for hunting (deer pheasant and waterfowl in season) fishing and wildlife observation Approximately 70000 visitors utilized the refuge for recreation in 2001
Recreational visitor use at most wildlife refuges consists mainly of fishing hunting (waterfowl upland game and big game) and wildlife observation These are the primary recreational experiences that are allowed and supported with facilities and access to the refuges Boating is usually part of one of these other activities Human-powered or low speed motor-boating are the common modes of transportation on the lakes and streams of wildlife refuges Big boats with large motors and high speeds water skiing personal watercraft (jet skis) and other water sports are inconsistent with the purposes and mission of the refuges
United States Forest Service Two of the six Ranger Districts of Wenatchee National Forest are in the four-county regionmdashCle Elum in northwest Kittitas County and Naches in northwest Yakima County There are 12 water access sites managed by the FS in the four-county area Bumping Lake Clear Lake and Rimrock Lake are located in the Naches District of Wenatchee National Forest Cle Elum Kachess and Keechelus Lakes are in the Cle Elum District of this same forest
Visitor use data for each individual recreation site (lakes ponds campgrounds trails etc) in the forest are not available due to the expense of collecting this data Empirical evidence indicates that recreational use of these lakes is very high during the summer season Prior to 1996 the FS used its Recreation Information Management System to estimate and analyze visitor use in its forests for management purposes Unfortunately this process became too great of a burden on the limited recreation funding available to monitor use and manage and maintain the recreation program and facilities
To estimate the recreational use occurring on the National Forests a nationwide program of visitation data and analysis has been implementedmdashThe National Visitor Use Monitoring Project (NVUM) Every 4 years one-quarter of the national forests implements this permanent 4-year cyclic sampling system to survey for recreational use at the forest regional and national levels Recreational visitors to Wenatchee National Forest were surveyed October 2000 through September 2001 This period was an unusual recreation year in that it was period of lower than normal snow which reduced winter use and a severe fire season which resulted in closures of parts of the forest due to major wildfires Even so the NVUM process estimated that the forest received more than
B-16
25 million National Forest visits4 The survey found that 43 percent of respondents used a boat launch within the forest
The Cle Elum Ranger District contains Cle Elum Kachess and Keechelus Lakes The FS manages recreation at these three Reclamation reservoirs and provides boating access to them
The FS has 25 campgrounds in the Cle Elum District There are group camping sites at both Kachess Lake (capacity 50 people) and Cle Elum Lake (capacity 100 people) Each lake also has another campground with individual sites (Kachess 120 sites and Cle Elum River 23 sites) Kachess Campground provides boating access to Kachess Reservoir There are four separate boat launching sites on Cle Elum Lake including the largest at Wish Poosh Campground There is a four-lane boat launch on Keechelus Reservoir Recreational use of the reservoirs of the Cle Elum District reveals that Lake Cle Elum Reservoir received 35600 visits Kachess Reservoir had 29200 visits and Keechelus Reservoir hosted 9700 visits
The Naches Ranger District includes 16 campgrounds in the Chinook Pass - Bumping Lake area Three of these campgrounds providing 80 sites are at Bumping Lake Two water access launching sites are at Bumping Lake Bumping Lake Marina and Bumping Lake Public Boat Landing At the White Pass area there are nine campgrounds Clear Lake Dog Lake and Rimrock Lake are found in this part of Naches Ranger District The first two have one boat launch each and Rimrock Lake is served by two resorts Silver Beach and The Cove which provide boating access
Recreational use of much of the National Forest lands now requires the payment of a user fee Developed areas offering camping or boating usually assess a fee of between $500 and $1000 per day depending on the forest and the facility and amenities provided Daily forest passes are available for $500 and are valid for parking for the use of many trail heads picnic areas boat launches and interpretive sites Annual forest passes allow access to these same sites cost $3000 and are good for 1 year Camping fees are usually between $1000 and $1500 per night per site depending on the level of development and amenities offered Campgrounds range from small 3-site hike-in areas that are free to large 120 site facilities that have utilities RV sites etc and cost $1400 per night Some sites require a boat launching fee or moorage charges Some concessionaire-operated sites on FS land may have higher fees
4 A National Forest visit is the entry of one person upon a National Forest to participate in recreational activities for an unspecified period of time An estimated 2532617 National Forest visits (the 80-percent confidence level is plus or minus 140 percent) occurred on the Wenatchee National Forest A National Forest visit can be composed of multiple site visits Site visits were estimated at 2726705 These values and associated error rates are reported for the 80-percent confidence level
B-17
Recreation Fees Many public agencies at all levels charge fees for access to and the use of recreational sites and facilities This practice has come about as means to help pay for the increasing operation and maintenance costs associated with providing public recreation areas and facilities In general the fees charged by pubic entities are comparable or lower than the charges found at privately provided recreation facilities of similar quality in the same market area Usually the fees charged for the use of public recreation resources and facilities are not sufficient to cover the entire cost of providing and maintaining these resources
Recreation Summary This investigation has identified 212 sites on over 5 dozen lakes reservoirs and river reaches that provide access and opportunities for boating fishing and other flat water recreational experiences within and bordering the four-county local area Available data indicate that these recreational resources are heavily used by both residents of the four-county area and by visitors from outside the local area Seven State parks alone accounted for over 29 million recreation visits in 2002 (table 3)
Reclamationrsquos 1 dozen existing reservoirs with recreation facilities provide over 74000 acres of water surface available for public recreation (table 2 not including Lake Roosevelt) The potential Black Rock reservoir is expected to add about 9620 acres of water surface (at full pool) to this supply of nearby flat water recreation areas
References
Interagency Committee for Outdoor Recreation October 2002 An Assessment of Outdoor Recreation in Washington State A State Comprehensive Outdoor Recreation Planning (SCORP) Document 2002ndash2007 Accessed on September 2 2003 lthttpwwwiacwagoviacdocshtmgt
_____ March 2003 Estimates of Future Participation in Outdoor Recreation in Washington State Accessed on September 2 2003 lthttpwwwiacwagoviacdocshtmgt
US Army Corps of Engineers McNary Dam ndash Lake Wallula Accessed on September 15 2003 lthttpwwwnwwusacearmymilcorpsoutdoorsmcnMCNDAMHTMgt
US Fish and Wildlife Service Hanford Reach National Monument Accessed on September 16 2003 lthttphanfordreachfwsgovindex-expandedhtmlgt
US Forest Service Wenatchee National Forest Accessed on Septem ber 4 2003 lthttpwwwfsfedusr6wenatcheegt
B-18
_____ National Visitor Use Monitoring Results August 2002 USDA Forest Service Region 6 Wenatchee National Forest lthttpwwwfsfedusr6gt
B-19
Attachment 1 of Appendix B
Public Access Points for Water Oriented Recreation
B-21
Site Name
Water Body
Acres of
Water Surface
Managing AgencySite
Manager Location
of Boat Launches and Type of Launch
of Loading Floats
of Car
Parking Spaces
and Type of
Lot
of RVTrailer
Parking Spaces
and Type of Lot
of Restrooms and Type of Facility
Camping ( of
Sites) Picnicking Swimming
1 Adams Road
239 Drain
Desert Wildlife
Area WDFW
Grant County
Yes
2 Adrian - North Gloyd Seeps
WDFW Grant County
3 Adrian -South
Gloyd Seeps
WDFW Grant County
4 Alkali Lake Alkali Lake WDFW Grant County
1 gravel 0 10 gravel 15 gravel 1 vault middot middot
5 Ancient Lake Ancient
Lake WDFW
Grant County
6 Ankeny 1 Banks Lake
27000 WDFW Douglas County
3 gravel - 10 gravel 15 gravel 20 vault Yes middot middot
7 Ankeny 2 Banks Lake
27000 WDFW Douglas County
2 gravel - - 25 gravel 1 vault No middot middot 8
Babcock Ridge Lake
Babcock Ridge Lake
WDFW Grant
County 1 natural 0 5 gravel 5 gravel None No middot middot
9
10
Banks Lake-Fordair
Barker Canyon -
Banks Lake 7
Banks Lake
Banks Lake
27000
27000
WDFW
WDFW
Grant County
Grant County
1 asphalt
1 concrete
plank
0
0
0
10 gravel
10 gravel
30 gravel
None
1 vault
No
Yes
middot middot
middot middot
11 Beda Lake Beda Lake WDFW Grant
County
12 Bell Property WDFW Kittitas County
13
14
Benton City
Billy Clapp Lake
Billy Clapp Lake
1010
WDFW
WDFW
Benton County
Grant County
2 concrete
solid 1
5 Paved
no striping
15 paved no striping
1 vault No middot middot
B-23
Site Name
Water Body
Acres of
Water Surface
Managing AgencySite
Manager Location
of Boat Launches and Type of Launch
of Loading Floats
of Car
Parking Spaces
and Type of
Lot
of RVTrailer
Parking Spaces
and Type of Lot
of Restrooms and Type of Facility
Camping ( of
Sites) Picnicking Swimming
1
15 Blue Lake Blue Lake WDFW Grant
County concrete plank 1
0 10
gravel 40 gravel 2 vault middot middot
gravel
16 Blue Lake
Resort Blue Lake Blue Lake Resorts
Grant County
1 gravel 0 10
gravel 10 gravel Yes and
rental cabins
middot Yes
17 Blue Lake
Resort Blue Lake WDFW
Grant County
Yes
18 Blythe Potholes
Reservoir 27800 WDFW
Grant County
2 concrete
solid 0
1 paved and
striped
140 gravel 9 paved
no striping
3 vault Yes middot middot 19 Blythe Lake
Blythe Lake
1300 Service Grant
County 1 gravel 0 0 10 gravel None No middot middot
20 Buckshot Ranch
Priest Rapids Lake
WDFW Grant
County
2 concrete
plank
60 gravel 2 vault Yes
3-day limit
middot middot 21 Buena WDFW
Yakima County
22 Bumping
Lake Marina Bumping
Lake 1300 FS
Yakima County
1 concrete
solid 1 5 gravel 5 gravel 2 vault Yes Yes No
23 Bumping
Lake Public Boat Landing
Bumping Lake
1300 FS Yakima County
1 concrete
plank 0 0 30 gravel 2 vault
Available at
Bumping Lake
No No
Marina
24 Burke Lake-
Eastside Burke Lake
WDFW Grant
County
1 concrete
plank 0 0 20 gravel 1 vault Yes middot middot
25 Burke Lake-Southwest
Burke Lake
WDFW Grant
County
1 concrete
plank 0 5 gravel 10 gravel 2 vault Yes middot middot
B-24
Site Name Water
Body
Acres of
Water Surface
Managing AgencySite
Manager Location
of Boat Launches and Type of Launch
of Loading Floats
of Car
Parking Spaces
and Type of
Lot
of RVTrailer Parking Spaces
and Type of Lot
of Restrooms and Type of Facility
Camping ( of
Sites) Picnicking Swimming
26 Burke Lake-
Westend Burke Lake
WDFW Grant
County 1 gravel 0 10
gravel 30 gravel 2 vault middot middot
27 Calache Lake
Calache Lake
WDFW Grant
County 1 natural 0 10
gravel 5 gravel 1 vault middot middot
28 Canal Lake-
Northend Canal Lake
WDFW Grant
County
2 concrete
plank 0
10 gravel 5 paved and
striped
15 gravel 1 paved
and striped
1 vault Yes middot middot
29 Cascade Park
Moses Lake
Moses Lake Parks and Rec
Dept
Grant County
2 concrete
solid 2
5 paved and
striped
32 paved and
striped 1 flush Yes Yes Yes
30 Century Landing
Yakima River
Yakima Greenway Foundation
Yakima County
1 concrete
plank 0 10
paved 0 1 vault No Yes No
4
31 Charbonneau Park
Lake Sacajawea
Corps Benton County
launches concrete solid and 51 open
1 50 gravel 54 paved
and striped
Yes flush
Yes tent and RV with full hookups
Yes Yes
moorage
32 Clear Lake Recreation
Area Clear Lake 260 FS
Yakima County
1 concrete
solid 1 5 gravel
20 gravel 3 paved
and striped
1 vault No Yes No
33 Coffin Lake Stan
Coffin Lake WDFW
Grant County
1 concrete
plank 0 5 gravel 5 gravel 1 vault Yes middot middot
145 acres
34
Columbia National Wildlife Refuge
ponds 841 acres lakes 178
miles of
986 Service Grant
County No Yes No
stream
B-25
35
36
37
Site Name
Columbia Park
Columbia Park West
Columbia Point
Water Body
Lake Wallula
Lake Wallula
Columbia River
Acres of
Water Surface
Managing AgencySite
Manager
KennewickParks and Rec
Horn Rapids Park
Richland Parks and Rec
Location
Benton County
Benton County
Benton County
of Boat Launches and Type of Launch
8 concrete
solid
3 concrete
solid
4 concrete solid and
34 moorage
of Loading Floats
2
1
3
of Car
Parking Spaces
and Type of
Lot
57
paved and
striped
65 paved
and striped
of RVTrailer Parking Spaces
and Type of Lot
120 gravel
38 paved and
striped
140 paved and
striped
of Restrooms and Type of Facility
Yes
1 flush
1 - with showers
Camping ( of
Sites)
Yes RV
Picnicking
Yes
Yes
Yes
Swimming
Yes
middot
middot 38
Corral Lake -North
Corral Lake
WDFW Grant
County 1 gravel 0 10
gravel 15 gravel 1 vault Yes middot middot
39 Corral Lake -Southwest
Corral Lake
WDFW Grant
County
40 Coulee City Community
Park
Banks Lake
27000 Coulee City
Parks and Rec Dept
Grant County
8 moorage 4 concrete
solid
3 0 60 gravel 1 flush Yes Yes Yes
41 Coulee Lodge Resort
Blue Lake Coulee Lodge
Resort Grant
County
1 concrete
solid 1 30
gravel 35 gravel
1 showers with
restrooms
Yes RV hookups
rental cabins
middot Yes
42 Coulee
Playland Resort
Banks Lake 27000
Coulee Playland Resort
Grant County
25 moorage
3 Yes RV Tent
No No
43 Crab Creek Launch
Potholes Reservoir
N 27800 WDFW
Grant County
1 gravel 0 10 gravel
10 gravel Yes RV middot middot 44 Crater Lake
Crater Lake
WDFW Grant
County cartop launch
45 Crater Slough
WDFW Grant
County
B-26
Site Name Water
Body
Acres of
Water Surface
Managing AgencySite
Manager Location
of Boat Launches and Type of Launch
of Loading Floats
of Car
Parking Spaces
and Type of
Lot
of RVTrailer
Parking Spaces
and Type of Lot
of Restrooms and Type of Facility
Camping ( of
Sites) Picnicking Swimming
46 Crescent Bar Wanapum
Lake Grant Cou nty
PUD Grant
County
2 concrete
solid 1 0 50 gravel
2 Portable san i-cans
Available across
the street middot middot
47 Crescent Bar Resort
Wanapum Lake
Crescent Bar Development
Inc
Kittitas County
40 transient
open middot middot middot middot middot middot moorage
48 Crescent Bay FD
Roosevelt Lake
60000 NPS Grant
County
1 concrete
solid 1 20
gravel 75 gravel 1 vault No middot middot
49 Craw Butte Lake
Umatilla
Corps Ownership with Mgt by Private
Concession
Benton County
1 concrete plank 2
concrete solid
middot 45
paved and
striped
56 paved and
striped middot middot middot middot
25
50 Darnells Resort Motel
Lake Chelan
Private Kittitas
County permanent
open middot middot middot middot middot middot moorage
51 Dodson Frenchmen
Desert Wildlife
Area WDFW Grant
County Yes Yes
52 Dodson Road
WDFW Grant
County Yes Yes Yes
53 Dog Lake Campground
Dog Lake FS Yakima County
1 ramp natural
0 middot 8 gravel 1 vault Yes Yes No
B-27
Site Name
Water Body
Acres of
Water Surface
Managing AgencySite
Manager Location
of Boat Launches and Type of Launch
of Loading Floats
of Car
Parking Spaces
and Type of
Lot
of RVTrailer
Parking Spaces
and Type of Lot
of Restrooms and Type of Facility
Camping ( of
Sites) Picnicking Swimming
54 Dry Creek Cle Elum
Lake FS Kittitas
County 1 gravel 0 10
gravel 5 gravel None Yes middot middot
55 Dusty Lake Dusty Lake
WDFW Grant County
Yes
56 Evergreen Reservoir
Evergreen Reservoir
WDFW Grant County
1 concrete
plank 0 0 30 gravel 2 vault Yes middot middot
57 Evergreen
Reservoir -East
Evergreen Reservoir
WDFW Grant County
1 gravel 0 0 10 gravel 1 vault Yes middot middot
58
59
60
61
Evergreen Reservoir-Northwest
Evergreen Reservoir-Southwest
Fidesco Harris - 1
Fidesco Harris - 2
Evergreen Reservoir
Evergreen Reservoir
Desert Wildlife
Area
Desert Wildlife
Area
WDFW
WDFW
WDFW
WDFW
Grant County
Grant County
Grant County
Grant County
1 concrete
plank
Yes
0 0 25 gravel 1 vault
Yes
Yes
Yes
Yes
Yes
Yes
Yes
middot middot
B-28
Site Name Water
Body
Acres of
Water Surface
Managing AgencySite
Manager Location
of Boat Launches and Type of Launch
of Loading Floats
of Car
Parking Spaces
and Type of
Lot
of RVTrailer
Parking Spaces
and Type of Lot
of Restrooms and Type of Facility
Camping ( of
Sites) Picnicking Swimming
62 Fidesco Harris - 3
Desert Wildlife
Area WDFW
Grant County Yes Yes
63 Fiorito Ponds Fiorito Ponds
WDFW Kittitas County
64 Fish Trap Lenore
WDFW Grant
County
65 Fitzsimmons Yakima River
WDFW Yakima County
1 ramp natural
0 5 gravel 15 gravel 1 vault No 66 Fordair WDFW
Grant County
Yes
67 Frenchman Hills 1
Desert Wildlife
Area WDFW
Grant County
Yes
68 Frenchman Hills 2
Desert Wildlife
Area WDFW
Grant County
Yes
69 Frenchman Hills 3
Desert Wildlife
Area WDFW
Grant County Yes
70 Frenchman Hills 4
Desert Wildlife
Area WDFW
Grant County
Yes
71 Gannon Yakima River
WDFW Yakima County
1 ramp gravel
0 5 gravel 10 gravel None No No No
72
73
Ginko Petrified
Forest State Park
Ginko State Park
Wanaapum Reservoir
Wanapum Lake
Washington State Parks
State Parks
Kittitas County
Kittitas County
2
1 asphalt
0
10 paved
no striping
5 paved no striping
Yes
None
Yes 50 RV
hookups
No
Yes
B-29
Site Name Water
Body
Acres of
Water Surface
Managing AgencySite
Manager Location
of Boat Launches and Type of Launch
of Loading Floats
of Car
Parking Spaces
and Type of
Lot
of RVTrailer
Parking Spaces
and Type of Lot
of Restrooms and Type of Facility
Camping ( of
Sites) Picnicking Swimming
74 Glen Williams
Potholes Reservoir
27800 WDFW Grant
County
2 concrete
plank 0 50
gravel 100
gravel 2 vault
75 Gloyd - Farm
Unit
Gloyd Seeps Wildlife
Area
WDFW Grant
County Yes
76 Gloyd - Loan Ranch
Gloyd Seeps Wildlife
Area
WDFW Grant County
Yes
77 Gloyd - Road
10
Gloyd Seeps Wildlife
Area
WDFW Grant
County Yes
78 Gloyd - Road
12
Gloyd Seeps Wildlife
Area
WDFW Grant
County Yes
79 Gloyd - Road
14
Gloyd Seeps Wildlife
Area
WDFW Grant
County Yes
80 Gloyd - Road 16
Gloyd Seeps Wildlife
Area
WDFW Grant County
Yes
B-30
Site Name Water
Body
Acres of
Water Surface
Managing AgencySite
Manager Location
of Boat Launches and Type of Launch
of Loading Floats
of Car
Parking Spaces
and Type of
Lot
of RVTrailer
Parking Spaces
and Type of Lot
of Restrooms and Type of Facility
Camping ( of
Sites) Picnicking Swimming
81 Gloyd - Road
7
Gloyd Seeps Wildlife
Area
WDFW Grant
County Yes
82 H Lake H Lake WDFW Grant
County Yes
83 Hammerstead
WDFW Yakima County
Hanford Reach
National
84 Monument
Saddle Mountain
Columbia River
Service Grant
County middot No No No
National Wildlife
85
86
Refuge
Harlan Landing
Heart Lake
Yakima River
Heart Lake
WDFW
WDFW
Yakima County
Grant County
1 ramp concrete
plank
1 concrete
plank
0
0
12 paved and
striped
0
17 paved and
striped
10 gravel
middot 1 vault
No
Yes
Yes
No
middot 87 Heart Lake
Heart Lake
WDFW Grant
County Yes Yes
88 Horn Rapids Park
Yakima River
Benton County Parks and Rec
Benton County
2 concrete
plank
10 gravel
25 gravel middot None middot 89 Howard
Amon Park Lake
Wallula Horn Rapids
Park Benton County
3 concrete
solid 1
47 paved and
striped
40 gravel 46 paved
and striped
Within walking distance
Yes middot
B-31
Site Name
Water Body
Acres of
Water Surface
Managing AgencySite
Manager Location
of Boat Launches and Type of Launch
of Loading Floats
of Car
Parking Spaces
and Type of
Lot
of RVTrailer
Parking Spaces
and Type of Lot
of Restrooms and Type of Facility
Camping ( of
Sites) Picnicking Swimming
90 I Road 645
Drain
Desert Wildlife
Area WDFW
Grant County
Yes Yes
91 1-82 Ponds
1 2 3 4 and 5
WDFW Yakima County
Crab
92 Jericho - Old
Bridge Creek
Wildlife Area
Yes Yes
93
Job Corps Dike -
Potholes Reservoir N
Potholes Reservoir
27800 WDFW Grant
County 3 gravel 0 0 20 gravel middot
94 Kachess
Campground Lake
Kachess 6535 FS
Kittitas County
2 concrete solid and 1 gravel
0 5 paved
and striped
8 gravel 39 paved
and striped
6 paved no striping 7 Paved
1 flush Yes
(183) Yes Yes
no striping
95 Katy Lake
Seep Lakes
Wildlife Area
WDFW Grant
County Yes
96 Keechelus
Boat Launch Lake
Keechelus 2560 FS
Kittitas County
4 asphalt 0 0 22 paved
and striped
1 vault No middot 97
King Horn Slew
WDFW Kittitas
County
98 Lake Easton State Park
Lake Easton
240 Washington State Parks
Kittitas County
1 concrete
plank 1
14 paved and
10 paved and
striped
middot Yes
B-32
Site Name
Water Body
Acres of
Water Surface
Managing AgencySite
Manager Location
of Boat Launches and Type of Launch
of Loading Floats
of Car
Parking Spaces
and Type of
Lot
of RVTrailer
Parking Spaces
and Type of Lot
of Restrooms and Type of Facility
Camping ( of
Sites) Picnicking Swimming
striped
99 Laurents
Sun Village Resort
Park Lake Laurents Sun Village Resort
Grant County
1 asphalt 0 middot middot Laurents 1 1
100 Sun Village Resort - Blue
Blue Lake Laurents Sun Village Resort
Grant County
concrete plank
3 10 gravel
10 gravel restrooms
with Yes RV Yes Yes
Lake 1 gravel showers
101 Lavendar Lake
Lavendar Lake
WDFW Kittitas
County 1 gravel 0 15
gravel 10 gravel 1 vault No middot middot
102 Lena Lake Lena Lake WDFW Grant
County Yes
103 Lenice WDFW Grant
County Yes Yes
104 Lenore Lake - North
Lake Lenore
WDFW Grant
County
105 Lenore Lake - South
Lake Lenore
WDFW Grant
County Yes Yes
106 Leslie Groves Park
Lake Wallula
Richland Parks and Rec
Benton County
4 concrete
solid 1
15 paved and
striped
50 paved and
striped
No Yes Yes
107 Lind Coulee-
East WDFW
Grant County
Yes
108 Lind Coulee - Island Site
Potholes Reservoir 27800 WDFW
Grant County
1 gravel 0 0 10 gravel 1 vault Yes middot middot 109
Lind Coulee-West
WDFW Grant
County Yes Yes Yes
110 Lmuma Creek
Yakima River
BLM Kittitas
County 1 0 1 7 Yes middot
B-33
111
Site Name
Long Lake
Water Body
Long Lake
Acres of
Water Surface
Managing AgencySite
Manager
WDFW
Location
Grant County
of Boat Launches and Type of Launch
1 gravel
of Loading Floats
0
of Car
Parking Spaces
and Type of
Lot
0
of RVTrailer
Parking Spaces
and Type of Lot
10 gravel
of Restrooms and Type of Facility
1 vault
Camping ( of
Sites)
Yes 15-day
limit
Picnicking
middot
Swimming
middot 112
Lower Goose Lake
Goose Lake
WDFW Grant
County 1 gravel 0
10 gravel
5 gravel No No middot middot 113
Lower Peninsula
Park
Moses Lake
Moses Lake P and R Dept
Grant County
2 concrete
plank 0 0
38 paved and
striped 2 vault No Yes middot
114 Marco Polo
Lake Marco Polo
Lake WDFW
Grant County
Yes
115
116
117
MarOon Resort
Martha Lake
Matton Lake
Potholes Reservoir
Martha Lake
Matton Lake
27800 Mardon Resort
WDFW
WDFW
Grant County
Grant County
Kittitas County
1 concrete
solid
1 gravel
1 concrete
plank
1
0
1
10 gravel
Yes gravel
25 gravel
10 gravel
Yes gravel
25 gravel
middot 1 vault
1 vault
Yes RV
Yes 3-day limit
Yes
Yes
middot middot
middot middot middot
118 McCabe Pond
McCabe Pond
WDFW Kittitas
County
119 McCormick WDFW Yakima County
120 McLeary WDFW Grant
County
121 McLeary Pixlee
Park Lake WDFW Grant
County 1 natural 0
15 gravel
middot middot middot 122
123
Medicare East
Mellis Road (Burke)
Potholes Reservoir
Yakima River
27800 WDFW
WDFW
Grant County
Yakima County
1 gravel
1 concrete
plank
0
0
0
10 paved
no striping
20 gravel
30 paved no striping
middot 1 vault
No
middot middot
middot middot
B-34
Site Name
Water Body
Acres of
Water Surface
Managing AgencySite
Manager Location
of Boat Launches and Type of Launch
162
of Loading Floats
of Car
Parking Spaces
and Type of
Lot
of RVTrailer Parking Spaces
and Type of Lot
of Restrooms and Type of Facility
Camping ( of
Sites) Picnicking Swimming
124
125
Metz Marina
Million Dollar North -
Banks Lake 4
Columbia River
Banks Lake
27000
Metz Marina Inc
WDFW
Benton County
Grant County
permanent moorage
32 transient moorage
1 fixed hoist
1 gravel
0
0
20 gravel
15 gravel
15 gravel
50 gravel
Yes
1 vault
middot
No
middot
middot
middot
middot 126
Million Dollar South- Banks
Lake 3
Banks Lake
27000 WDFW Grant
County 1 gravel 0
10 gravel
20 gravel 1 vault No middot middot 127
Montlake Park
Moses Lake
Moses Lake P and R Dept
Grant County
2 concrete
solid 2
4 paved and
striped
34 paved and
striped 1 flush middot Yes Yes
128 Morgan Creek
Cle Elum Lake
FS Kittitas
County 1 gravel 0
10 gravel
2 gravel None Yes
primitive middot middot 129
Moses Lake - North End
Launch
Moses Lake
Grant County WDFW
Grant County
1 concrete
plank 0 5 gravel 10 gravel 1 vault middot middot middot
130 Moses Lake
- North Outlet Potholes
Reservoir 27800 WDFW
Grant County
1 natural 0
15 paved
and striped
15 gravel 1 vault Yes
3-day limit
middot middot
131 Moses Lake
Park Moses Lake
City of Moses Lake
Grant County
Yes middot middot middot
B-35
Site Name
Water Body
Acres of
Water Surface
Managing AgencySite
Manager Location
of Boat Launches and Type of Launch
of Loading Floats
of Car
Parking Spaces
and Type of
Lot
of RVTrailer
Parking Spaces
and Type of Lot
of Restrooms and Type of Facility
Camping ( of
Sites) Picnicking Swimming
Moses Lake 132 - South Potholes
Reservoir 27800 WDFW Grant
County Yes Yes
133 Myron Lake Myron Lake
WDFW Yakima County
Naylor 134 Junction
WDFW Grant
County Yes
135 North End
North 136 McNary
Old Vantage 137 Highway
138 Osborne Bay
Lake Wallula
Columbia River
Banks Lake 27000
WDFW
Corps
WDFW
WDFW
Grant County
Benton County
Grant County
Grant County
1 concrete
solid 1
concrete plank
1 natural
0
0
0
0
15 gravel
10 gravel
75 paved and
striped
60 gravel
30 gravel
1 Portable sani-cans
None
-
-
Yes primitive
Yes
No
middot middot middot
Overlook 139 Camp
Sage Lake WDFW Grant
County
Parker 140 Parking Lot
WDFW Yakima County
141 Perch Point
Plymouth 142 Park
Potholes Reservoir
Lake Umatilla
27800 Washington State Parks
Corps
Grant County
Benton County
1 gravel
2 concrete
solid
0
3
0
0
20 gravel
18 paved and
striped
2 portable sani-cans
2 portable sani-cans
Yes
Yes
Yes
middot Yes
143 Point site Lind
Coulee WDFW
Grant County
Yes
144 Pond 1 WDFW Yakima County
145 Pond 2 WDFW Yakima County
146 Pond 3 WDFW Yakima County
B-36
Site Name
Water Body
Acres of
Water Surface
Managing AgencySite
Manager Location
of Boat Launches and Type of Launch
of Loading Floats
of Car
Parking Spaces
and Type of
Lot
of RVTrailer Parking Spaces
and Type of Lot
of Restrooms and Type of Facility
Camping ( of
Sites) Picnicking Swimming
147 Pond 4 WDFW Yakima County
148 Pond 5 WDFW Yakima County
149 Poplars
Banks Lake 5
Banks Lake
27000 WDFW Grant
County 1 natural 0
10 gravel
5 gravel middot No middot middot
150
Port of Kennewick
Public Launching
Ramp
Columbia River
Port of Kennewick
Benton County
4 concrete
solid 1 0 30 gravel None - middot middot
151
Potholes -Lind Coulee Bridge Site
West
potholes Reservoir 27800
WDFW Grant
County 2 gravel 0 0 60 gravel 1 vault middot middot middot
152 Potholes
Reservoir -K5 SE
Potholes Reservoir 27800
WDFW Grant
County 1 natural 0 0 5 gravel middot middot middot middot
153 Potholes
State Park Potholes
Reservoir 27800 WA State Parks
Grant County
4 concrete
solid 1 0 60 gravel
2 flush 1 restroom
with showers
middot middot middot
154 Quincy Lake Quincy Lake
WDFW Grant
County
1 concrete
solid 0
10 gravel
20 gravel 1 vault Yes middot middot 155
Red Rock Lake
Red Rock Lake
WDFW Grant
County 1 natural 0 0 10 gravel middot Yes middot middot
B-37
Site Name Water
Body
Acres of
Water Surface
Managing AgencySite
Manager Location
of Boat Launches and Type of Launch
of Loading Floats
of Car
Parking Spaces
and Type of
Lot
of RVTrailer Parking Spaces
and Type of Lot
of Restrooms and Type of Facility
Camping ( of
Sites) Picnicking Swimming
156 Rest Haven WDFW Yakima County
157 Richland Yacht Club
Columbia River
Benton County
112 permanent moorage
-
middot 1
158 River Campground
Priest Rapids Lake
Grant County Grant
County
concrete plank
2 concrete 1 50
gravel 100
Gravel Yes Yes middot solid
159
Riverfront Park Boat Launch
(Prosser)
Yakima River
Prosser Parks and Rec Dept
Benton County
2 concrete
solid 0
10 paved
no striping
10 paved and
striped
- Yes middot
160 Road A-Potholes
Potholes Unit
WDFW Grant County
Yes
161 Rocky Ford-Hwy17
Rocky Ford Creek
WDFW Grant County Yes
162 Rocky Ford-Lower
Rocky Ford Creek
WDFW Grant County
Yes Yes
163 Rocky Ford-
Upper Rocky
Ford Creek WDFW
Grant County
Yes Yes
164 Rowe WDFW Yakima County
165 Roza
Recreational Site
Yakima River 100 BLM
Kittitas County
2 concrete
solid 0
135 paved
and striped
21 paved and
striped 4 vault Yes Yes middot
B-38
Site Name
Water Body
Acres of
Water Surface
Managing AgencySite
Manager Location
of Boat Launches and Type of Launch
of Loading Floats
of Car
Parking Spaces
and Type of
Lot
of RVTrailer Parking Spaces
and Type of Lot
of Restrooms and Type of Facility
Camping ( of
Sites) Picnicking Swimming
Lake
166 Sam Israel Lenore Wildlife
Area
WDFW Grant
County
167 Samsons Pit
Site
Potholes Wildlife
Area WDFW
Grant County
Yes
168 Sand Dunes
Site
Potholes Wildlife
Area WDFW
Grant County
Yes
169
170
Scatter Creek
Campground
Silver Beach Resort
Cle Elum River
Rimrock Lake
2790
FS
FS
Kittitas County
Yakima County
1 natural
1 gravel
0
1
5 gravel
5 gravel
5 gravel
5 gravel
1 vault
Flush restroom
Yes
No but there is a
motel and
rental cabins
middot
middot
middot
Yes
171 Smyrna -
West
Crab Creek
Wildlife Area
WDFW Grant
County Yes
172 Soda Lake
Campground Soda Lake Service
Grant County
2 gravel 0 15
gravel 35 gravel middot Yes middot middot
173 Soda Lake
Dam Soda Lake Service Grant
County 3 gravel 0 0 10 gravel middot No middot middot 174 South
Emerald Yakima River
WDFW Yakima County
1 natural 0 0 5 gravel None - middot middot 175 South
Emerald WDFW Yakima
County
176 South Teal Lake
South Teal Lake
WDFW Grant County
1 gravel 0 0 15 gravel middot - middot middot B-39
Site Name Water Body
Acres of
Water Surface
Managing AgencySite
Manager Location
of Boat Launches and Type of Launch
of Loading Floats
of Car
Parking Spaces
and Type of
Lot
of RVTrailer Parking Spaces
and Type of Lot
of Restrooms and Type of Facility
Camping ( of
Sites) Picnicking Swimming
177 Steamboat Rock state
Park
Banks Lake
27000 Washington State Parks
Grant County
4 concrete
plank 1
120 paved
and striped
105 paved and
striped 1 flush middot middot
178 Sulfur Creek Sulfur Creek
WDFW Yakima County 1 natural 0
15 gravel
- None Yes Yes Yes
179 Sun Lakes State Park
Park Lake Washington State Parks
Grant County 2 asphalt 1
20 gravel
10 gravel 1 flush Yes middot middot 180
Sunbanks Resort
Banks Lake
Osborn Bay
27000 Sun banks
Resort Grant
County
1 concrete
plank 1 0 15 gravel
Restrooms with
showers - middot middot
181
182
Sunland Estates
Susan Lake
Wanapum Lake
Susan Lake
WDFW
WDFW
Grant County
Grant County
1 concrete
plank
2 natural
0
0
10 gravel
5 gravel
30 gravel
3 gravel
None
No
Yes limited to 15 days
middot middot
middot middot
183 Teanaway WDFW Kittitas County
184 The Cove
Resort Rimrock
Lake 2790 FS
Yakima County
1 gravel 2 0 7 gravel Yes (RV) middot middot
185 Thrall
(Ringer Road) WDFW
Kittitas County
186 Twelve West
Resort Rimrock
Lake 2790
Twelve West Resort
Yakima County
1 gravel 1 0 15 gravel 2 vaults Yes (RV) middot middot
187 Two Rivers
Park Lake
Wallula Benton City
Parks and Rec Benton County
2 concrete
solid 3
20 gravel
20 gravel 1 Portable Sani-cans
- Yes Yes
Umatilla National
188 Wildlife
Refuge -Paterson
Lake Umatilla
Service Benton County
2 natural 0 0 - None middot middot Ramp
B-40
Site Name Water
Body
Acres of
Water Surface
Managing AgencySite
Manager Location
of Boat Launches and Type of Launch
of Loading Floats
of Car
Parking Spaces
and Type of
Lot
of RVTrailer Parking Spaces
and Type of Lot
of Restrooms and Type of Facility
Camping ( of
Sites) Picnicking Swimming
189 Upper Goose Upper
Goose Lake
WDFW Grant County
1 concrete
plank 0 0 15 gravel No middot middot
Upper Goose 190 Lake 2
Upper Goose Lake
WDFW Grant County
1 natural 0 5 gravel 5 gravel middot middot Vantage
191 Boat Ramp
Columbia River
Kittitas County Public Works
Kittitas County
3 concrete
solid 1
8 paved and
striped
60 paved and
striped 2 vaults - Yes middot
Vernita 192 Bridge (north
bank)
Columbia River
WDFW Grant County
4 natural 0 0 50 gravel None - middot middot 193 Virgin Lake
Seep Lakes
Wildlife Area
WDFW Grant
County Yes
194 W-20-F1 WDFW Grant
County Yes
Wanapum 195 Dam
(downstream)
Priest Rapids Lake
Grant County PUD
Grant County
1 concrete
plank 0 0
75 gravel 16 paved
no striping
2 Portable sani-cans
- middot middot Wanapum
196 Dam (upstream)
Wanapum Lake
Grant County PUD
Grant County
1 concrete
plank 1 0 10 paved
no striping 2 Portable sani-cans
- middot middot Wanapum
197 State Park
198 Wapato Dam
Wanapum Lake
Wanapum Lake
WDFW
Kittitas County
Yakima County
2 concrete
plank 1 0
40 paved and
striped 1 flush
Yes full hookups middot middot
Warden Lake 199 - North Warden
Lake WDFW Grant
County 2 gravel 0
20 gravel paved
40 gravel 1 vault Yes middot middot B-41
Site Name Water Body
Acres of
Water Surface
Managing AgencySite
Manager Location
of Boat Launches and Type of Launch
of Loading Floats
of Car
Parking Spaces
and Type of
Lot and
striped
of RVTrailer
Parking Spaces
and Type of Lot
of Restrooms and Type of Facility
Camping ( of
Sites) Picnicking SVllimming
200
201
202
203
Warden Lake - Outfall
Warden Lake - South
WaterWorks
Wenas Lake
Warden Lake
Warden Lake
Wenas Lake
WDFW
WDFW
WDFW
WDFW
Grant County
Grant County
Yakima County
Yakima County
1 concrete
solid 0 0 30 gravel 2 vaults
Yes
Yes
WDFW middot middot 204
Winchester Lake - 1 Frontage
Road
Winchester Wasteway
1020 WDFW Grant
County 1 natural 0 5 gravel 5 gravel None
Yes limited to 15 days
middot middot
205 Winchester
Lake - 2 Off Road 2
Winchester Wasteway
1020 WDFW Grant
County 1 natural 0 0 10 gravel None
Yes limited to 15 days
middot middot
206 Winchester
Lake - 3 Off Road 3
Winchester Wasteway
1020 WDFW Grant
County 1 gravel 0 5 gravel 15 gravel 1 vault
Yes limited to 15 days
middot middot
207 Winchester
Wasteway-Dodson Road
Winchester Wasteway
1020 WDFW Grant
County 1 gravel 0
15 gravel
40 gravel middot middot
208
Wish Poosh Campground
and Picnic Area
Cle Elum Lake
FS Kittitas
County
4 concrete
solid 0 0
31 Paved and
striped 1 flush Yes Yes Yes
B-42
Site Name
Water Body
Acres of
Water Surface
Managing AgencySite
Manager Location
of Boat Launches and Type of Launch
of Loading Floats
of Car
Parking Spaces
and Type of
Lot
of RVTrailer
Parking Spaces
and Type of Lot
of Restrooms and Type of Facility
Camping ( of
Sites) Picnicking Swimming
209 Wye Park
Boat Ramp Lake
Wallula City of Richland
Benton County
2 concrete
solid 1 0 25 gravel Yes flush - Yes middot
210 Yakima River Benton City
Yakima River
WDFW Benton County
1 natural 0 15
gravel 35 gravel None - middot
211 Yakima
Sportsman State Park
Yakima River
Washington State Parks
Yakima County
None 2 and 4 showers
Yes 28 tent
37 utility Yes middot
212 Zillah Bridge Yakima River
WDFW Yakima County
1 concrete
plank 0 0 10 gravel 1 vault - middot
212 = of sites
= no facilities or no data or not applicable
Automobiles and other passenger vehicles can also use the space identified as RVTrailer parking
B-43
Appendix C
River Flow Hydrographs
Yakima Canyon near Umtanum WA Current Operations Umtanum Gauge at River Mile 1404
4500
s)
fc 4000
(ow
3500
Fl
e 3000
lint 2500 ecre 2000
Py 1500
hltn 1000 oM 500
0
tobe
r
ber
ber
ary h y
cO
D
yFe
brua
r c
Apr
il
May
June
Jul
Mar
Aug
ust
ber
vem
cem
Janu m
o e
N Sep
te
Month
50 25 75
The 1981-2003 period of record was used and the daily flows were generated from the RiverWare Model This means that if you were to compare for any given day the actual daily flow that occurred it would be somewhat different than that generated by RiverWare The difference is a reflection of differences in modeled river operations criteria to what actually occurred on that day
C-1
Tieton River near Tieton Canal Headworks Current Operations Tieton River Gauge at River Mile 209
(This gauge is used to represent discharge from the dam outlet which is located upriver at River Mile 213)
0
250
500
750
1000
1250
1500
1750
2000
Oct
ober
Nov
embe
r
Dec
embe
r
Janu
ary
Febr
uary
Mar
ch
Apr
il
May
June
July
Aug
ust
Sep
tem
ber
Month
Mon
thly
Per
cent
ile F
low
(cfs
)
50 25 75
The 1981-2003 period of record was used and the daily flows were generated from the RiverWare Model This means that if you were to compare for any given day the actual daily flow that occurred it would be somewhat different than that generated by RiverWare The difference is a reflection of differences in modeled river operations criteria to what actually occurred on that day
C-2
Naches River near Naches WA Current Operations Naches Gauge at River Mile 168
0
500
1000
1500
2000
2500
3000
3500
4000
Oct
ober
Nov
embe
r
Dec
embe
r
Janu
ary
Febr
uary
Mar
ch
Apr
il
May
June
July
Aug
ust
Sep
tem
ber
Month
Mon
thly
Per
cent
ile F
low
(cfs
)
50 25 75
The 1981-2003 period of record was used and the daily flows were generated from the RiverWare Model This means that if you were to compare for any given day the actual daily flow that occurred it would be somewhat different than that generated by RiverWare The difference is a reflection of differences in modeled river operations criteria to what actually occurred on that day
C-3
Yakima River at Cle Elum WA Current Operations Yakima River at Cle Elum Gauge at River Mile 1831
4000
) fs 3500
(cw
3000
ol F 2500
letine 2000
rce 1500
Pylth 1000
nM
o 500
0
tobe
r
ber
ber
ary y h
Apr
il
May
June yc
Jul
ber
mc Mar
O vem
cem
o e Janu
Febr
uar
Aug
ust
N D Sep
te
Month
50 25 75
The 1981-2003 period of record was used and the daily flows were generated from the RiverWare Model This means that if you were to compare for any given day the actual daily flow that occurred it would be somewhat different than that generated by RiverWare The difference is a reflection of differences in modeled river operations criteria to what actually occurred on that day
C-4
Appendix D
Whitewater Classification from American Whitewater
Whitewater Classification from American Whitewater
CLASS I Fast moving with riffles and small waves Few obstructions easily Easy avoided Low risk Easy self-rescue
Straightforward rapids wide clear channels evident without scouting CLASS II Occasional maneuvering Rocks and medium waves easily avoided Novice by trained paddlers Swimmers seldom injured
Rapids with moderate irregular waves that can swamp open canoes Strong eddies and currents Complex maneuvers and good control
CLASS III required in tight passages and around ledges Large waves or strainers Intermediate easily avoided Scouting advisable for inexperienced parties Self-
rescue usually easy group assistance may be required Injuries while swimming are rare
Powerful turbulent and predictable rapids large unavoidable waves and holes or constricted passages Fast reliable eddy turns and
precise boat handling needed to initiate maneuvers scout rapids or CLASS IV rest Rapids may require ldquomustrdquo moves above dangerous hazards Advanced Strong Eskimo roll highly recommended Scouting necessary first time Self-rescue difficult skilled group assistance often needed
Moderate to high risk of injury to swimmers
Extremely long obstructed or violent rapids with exposure to added risk Possible large unavoidable waves and holes or steep congested chutes Eddies may be small turbulent difficult to reach or non- CLASS V existent Reliable Eskimo roll proper equipment extensive Expert experience high level of fitness and practiced rescue skills essential
for survival Scouting recommended but may be difficult Swims are dangerous Difficult rescue for experts
These runs have almost never been attempted and often exemplify the CLASS VI extremes of difficulty unpredictability and danger The consequences Extreme and of errors are very severe and rescue may be impossible For teams of
Exploratory experts only at favorable water levels after close personal inspection and taking all precautions
D-1
Appendix E
WROS Zone Descriptions
Urban
Extensively developed municipal industrial commercial built structures
Modern facilities and amenities
Heavy concentration and interaction of people
Extensive management presence
City neighborhood and waterfront parks river trails and formal gardens
Mainly day use recreation
Presence of recreation and nonrecreation activities
Abundant and expansive marinas concessions and commercial services
Suburban
Landscape largely human built
Commercial and residential built structures
Modern facilities and amenities
Very prevalent management presence
Community parks greenways trails golf courses and open space
Day use with very limited overnight camping opportunities
Predominance of recreation activities with limited nonrecreation uses
Numerous marinas and concessions
Rural Developed
Widely dispersed homes farms ranches second homes lodges roads and utilities
Predominantly natural and pastoral landscapes with limited development
Balance of day use and overnight camping
Open space and pastoral setting
Obvious management presence
Limited number of marinas and concessions
Infrequent tranquility and solitude
Socialization and motorized use often more prevalent than other uses
E-1
Rural Natural
Predominantly natural landscapes with infrequent development
Rustic campgrounds with limited amenities
Marinas concessions and services nearby but outside the area
Occasional management presence
Balance motorizednonmotorized use
Occasional use of outdoor skills required
County and regional parks and open space
Outdoor recreation and agriculture are the dominant land uses
Socialization less important
Periods of solitude and tranquility possible
Semiprimitive
Large expanse of natural appearing landscapes
Socialization not important
Self-reliance risk and outdoor skills may be needed
Rustic trails camping areas trail heads and unimproved launch sites
Nonmotorized recreation often more prevalent than motorized use
Infrequent management presence
Pack it in pack it out
Frequent solitude and tranquility
Primitive
Great expanse of natural-appearing landscape
Predominantly nature-based recreation with no motorized use
Extensive risk self-reliance and outdoor skills required
Very infrequent management presence
Little evidence of human impacts and nonrecreation use
Socialization outside group is rare
Pack it in pack it out
Solitude and tranquility dominant
E-2
Appendix F
WROS Inventory Maps
- RecreationDemandpdf
-
- Recreation Demand and User Preference Analysis13
- Table of Contents13
- Introduction13
- Study Authority13
- Structure of Analysis Report13
- Purpose and Objectives13
- Scope and Methodology13
- Findings of Analysis13
- Projections of Recreation Demand and User Preference13
- References Cited13
-
- Appendix A WROS Executive Summary13
- Appendix B Black Rock Dam and Reservoir Recreation Needs Assessment13
-
- Attachment 1 of Appendix B Public Access Points for Water Oriented Recreation13
-
- Appendix C River Flow Hydrographs13
- Appendix D Whitewater Classification from American Whitewater13
- Appendix E WROS Zone Descriptions13
- Appendix F WROS Inventory Maps13
-
Mission Statements
The mission of the Department of the Interior is to protect and provide access to our Nationrsquos natural and cultural heritage and honor our trust responsibilities to Indian Tribes and our commitments to island communities
The mission of the Bureau of Reclamation is to manage develop and protect water and related resources in an environmentally and economically sound manner in the interest of the American public
Technical Series No TS-YSS-10
Recreation Demand and User Preference Analysis Yakima River Basin Water Storage Feasibility Study Washington Pacific Northwest Region
Prepared by
Bureau of Reclamation Technical Service Center Economics and Resource Planning Group Darrell Welch Outdoor Recreation Planner
Aukerman and Haas Associates LLC Dr Glenn Haas
Prepared for
Bureau of Reclamation Upper Columbia Area Office 1917 Marsh Road Yakima Washington 98901-2058
US Department of the Interior Bureau of Reclamation Denver Colorado February 2007
Contents
Page
Introduction 1 Study Authority 2 Structure of Analysis Report 4 Purpose and Objectives 5 Scope and Methodology 6
Scope 6 Methodology for Determining Demand and User Preferences 8 Level 1 Analysis 9 Regional Scale 10 Key Water-Related Recreation Activities 10 Existing I nformation and Expert Opinion 11 WROS Inventory System 11 Sound Professional Judgment 12 Findings of Analysis 12 Overview of the Study Area 12 Recreation Setting 13 Demographic Change 16 Population Growth 16 Ethnicity 18
Age 18 Income 20 Issues Concerns and Observations 20 General Issues Concerns and Observations 21 Yakima River Basin Issues Concerns and Observations 22 Recreation Trends Influencing Water-Based Recreation 24 National Recreation Providers 25 Federal 26
State 26 Local 26
Private 27 Washington State Recreation Providers 27 Recreation Participation Levels 28 National Participation Levels 28 Pacific Coast Participation Levels 34 Washington State Participation Levels 36 Local Recreation Environment 39 Water Recreation Opportunity Spectrum Inventory and Existing Conditions 43 Setting Attributes Considerations 46 Local Carrying Capacity Considerations 48
iii
Contents (continued) Page
Water Quality Considerations 50 Recreation Water Quality Considerations 51 Projections of Recreation Demand and User Preference 52
Key Factors Influencing Future Projections 52 Projected Recreation Demand for Key Activities 54
References Cited 57
Appendices
Appendix A ndash WROS Executive Summary Appendix B ndash Black Rock Dam and Reservoir Recreation Needs Assessment Appendix C ndash River Flow Hydrographs Appendix D ndash Whitewater Classification from American Whitewater Appendix E ndash WROS Zone Descriptions Appendix F ndash WROS Inventory Maps
Tables
Table Page
1 Comparison of Counties in Yakima River Basin by Selected Demographic Factors from the State of Washington
Office of Financial Management 17 2 Comparison of Percentages of Three Segments of the United States Population Participating in Land-Based Outdoor Activities 2000ndash04 19 3 Percent and Number of People 16 Years and Older in the United States Participating in 12 Types of Outdoor Recreational Activities 1999ndash2000 29 4 Percent and Number of People 16 Years and Older in the
United States Participating in Land-Resource-Based Outdoor Activities 1999ndash2000 30 5 Percent and Number of People 16 Years and Older in the
United States Participating in Water-Resource-Based Outdoor Activities 1999ndash2000 31 6 National Participation Trends from 1994ndash95 and 2000ndash02 32 7 Participation Rates for Outdoor Activities in 2004 33 8 Estimates as a Percent of Change in the Number of People Participating in the Future Compared to Current Levels 40 9 Inventory of the Current Supply of Water Recreation Opportunities
Based upon the WROS System 45
iv
Contents (continued)
Tables (continued) Table Page
10 Percent of Population over the Age of 15 Indicating the Importance of Recreation Site Attributes as They Contribute to Making the Site an Ideal Recreation Setting by Level of Importance and by FS RPA Region
1994ndash95 49 11 Projected Percentage Change in Recreation Participation for the 20-Year Period from the Base Year of 2005 Through 2025 55 Figures Figure Page
1 Yakima River Basin location 3 2 Yakima River Basin features 7 3 Sliding scale of analysis 9 4 A regional scale of focus 10 5 Yakima River Basin recreation access points and recreation areas 15 6 Percent of participation in viewing activities by region 34 7 Percent of participation in camping activities by region 35 8 Percent of participation in hunting and fishing by region 36 9 Percent of participation in boating by region 36 10 Recreation participation by activity category 37 11 Participation in general recreation categories as a percent of State populations 38 12 Participation in water activities as a percent of the Statersquos
population 39 13 Demand in Region 3 by activity 43
v
Acronyms Analysis Report Recreation Demand and User Preference Analysis
BLM Bureau of Land Management
cfs cubic feet per second
Corps US Army Corps of Engineers
EIS environmental impact statement
FS US Forest Service
IAC Interagency Committee for Outdoor Recreation
NPS National Park Service
NSRE National Survey on Recreation and the Environment
NVUM National Visitor Use Monitoring Project
Reclamation Bureau of Reclamation
RPA Regional Planning Act Assessment
RV recreational vehicle
SCORP State Comprehensive Outdoor Recreation Plan
Service US Fish and Wildlife Service
TVA Tennessee Valley Authority
USDA US Department of Agriculture
WDFW Washington Department of Fish and Wildlife
WROS Water Recreation Opportunity Spectrum
vii
Introduction The mission of the Bureau of Reclamation (Reclamation) is to manage develop and protect water and related resources in an environmentally and economically sound manner in the interest of the American public Reclamation was established by the Reclamation Act of 1902 to develop water resources in the 17 Western States Over the years Reclamation has gravitated from development of single-purpose agricultural projects toward a multipurpose approach to water resource development Reclamation administers more than 8 million acres of land and water 288 Federal lakes and more than 300 developed recreation areas Federal and non-Federal partnerships have and will continue to be the primary providers of recreation and concession-managed activities on land and water areas under Reclamation jurisdiction About 70 non-Federal partners mostly States and cities manage about 200 of Reclamationrsquos recreation areas Reclamation retains management responsibilities for recreation at 51 projects1 Many of the other recreation areas are managed by other Federal agencies such as the National Park Service (NPS) or US Forest Service (FS) In some instances existing Reclamation legislation supports development and management of recreation resources on its lands by non-Federal partners but prevents Reclamation from providing the same services in lieu of managing partners In other instances Reclamation has specific authority to plan develop and maintain recreation resources on its lands
Today water for recreation is in relatively static supply because large-scale Federal water development in the United States is essentially complete Currently Reclamation the US Army Corps of Engineers (Corps) and Tennessee Valley Authority (TVA) reservoirs accommodate one-third of the total visitation to the Federal estate but these same agencies administer only 2 percent of the total Federal estate acreage Approximately 90 million people visit Reclamationrsquos designated recreation areas annually Visitation is increasing at an average rate of 12 million visitors per year and over 100 million people are projected to visit these recreation areas by early in the 21st century Reclamation projects stimulate an estimated $24 billion in economic activity each year Benefits in agriculture recreation hydropower municipal and industrial water service and other related areas including the construction industry are the direct result of Reclamationrsquos management of a limited natural water supply These multipurpose benefits result in about $5 billion in State and Federal tax revenues An estimated 700000 person years of employment are produced each year by Reclamation2
1 National Recreation Lakes Study Commission June 1999 2 Recreation Challenges of the Twenty-First Century Bureau of Reclamation February 1998
1
Nationwide recreation use of available sites will continue to increase over time This is a reflection of the ldquobaby boomerrdquo generation increased leisure time new recreation technologies and increased public information about recreation opportunities in rural communities It has been estimated that there will be a 50- to 100-percent increase in public demand for water-based recreation opportunities at State and Federal facilities over the next 20 years Without major changes in infrastructure and management programs the health and safety of the visiting public and the integrity of the natural environment may be compromised3 4
Across the United States about 161 million acres 7 percent of the countryrsquos total land area is covered by water mostly freshwater Streams rivers natural lakes ponds reservoirs and other forms of water cover are not only essential for aquatic microbiota aquatic and terrestrial wildlife household consumption agriculture and manufacturing but they are also important and highly valued as recreation
5resources
Reclamation is currently preparing a Yakima River Basin Water Storage Feasibility Study to examine the feasibility and acceptability of storage augmentation for the benefit of fish irrigation and the municipal water supply within the Yakima River basin in two respects (1) diversion of Columbia River water to the potential Black Rock Reservoir for further water transfer to irrigation entities in the lower Yakima River basin as an exchange supply thereby reducing irrigation demand on Yakima River water and improving Yakima Project stored water supplies and (2) creation of additional storage within the Yakima River basin In considering the benefits of additional storage in the Yakima basin the objectives are to improve anadromous fish habitat assure a more reliable water supply for proratable (junior) irrigation water rights holders and provide for future municipal needs Refer to figure 1 for the location map of the Yakima River basin
This Recreation Demand and User Preference Analysis (Analysis Report) is one integral part of that overall feasibility study
Study Authority Feasibility studies are detailed investigations specifically authorized by law to determine the desirability of seeking congressional authorization for implementation of a preferred alternative Feasibility studies include additional
3 National Recreation Lakes Study Commission 1999 4 Bureau of Reclamation Recreation Management Condition Assessment Clark Canyon
Reservoir and Barretts Diversion Dam Pick-Sloan Missouri River Basin Program August 2002 5 Cordell et al Outdoor Recreation for the 21st Century America A Report to the Nation
The National Survey on Recreation and the Environment 2004
2
3
data collection and analysis and consider a reasonable range of alternatives Feasibility studies must be consistent with the Economic and Environmental Principles and Guidelines for Water and Related Resources Implementation Studies
Section 214 of the Act of February 20 2003 (Public Law 108-7) states that
The Secretary of the Interior acting through the Bureau of Reclamation shall conduct a feasibility study of options for additional water storage in the Yakima River Basin Washington with emphasis on the feasibility of storage of the Columbia River water in the potential Black Rock Reservoir and the benefit of additional storage to endangered and threatened fish irrigated agriculture and municipal water supply There are authorized to be appropriated such sums as may be necessary to carry out this Act
Structure of Analysis Report The following briefly describes by section the structure of the Analysis Report
Introduction ndash Provides an overview of Reclamationrsquos water-related recreation program discusses water-based recreation on a national level and briefly describes Reclamationrsquos Yakima River Basin Water Storage Feasibility Study
Study Authority ndash States Reclamationrsquos authority to prepare the Yakima River Basin Water Storage Feasibility Study
Structure of Analysis Report ndash Briefly describes by section the structure of this Recreation Demand and User Preference Analysis
Purpose and Objectives ndash Details the primary purpose of the Analysis Report and key objectives for its preparation
Scope and Methodology ndash Briefly describes what items the Analysis Report addresses and what it does not address Describes the level of analysis regional focus of the Analysis Report key water-related recreation activities and how professional judgment existing information expert opinion and Reclamationrsquos Water Recreation Opportunity Spectrum (WROS) were used in preparing the Analysis Report
Findings of Analysis ndash Provides an overview of the study area describes the recreation setting and discusses national regional and Washington State recreation participation levels and demand
4
projections The Analysis Report describes the issues concerns observations and trends influencing water-based recreation Demographic characteristics and setting attributes contributing to user satisfaction of a recreation site are also discussed
Projections of Recreation Demand and User Preference ndash Provides recommendations and projections on the types of recreation activities needed in the Yakima River basin to meet existing and future demand and user expectations
Purpose and Objectives The primary purpose of this Analysis Report is to determine recreation demand and user preferences within the Yakima River basin The information will assist Reclamation and its partners in determining a viable recreation strategy within the alternatives that may be contemplated in the storage study feasibility environmental impact statement (EIS) A secondary purpose of this report is to collect existing data that can provide a baseline for assessing the potential impacts to recreation resources for each of the EIS alternatives
The key objectives of the Analysis Report are to
Identify the significant recreation issues concerns and observations within the Yakima River basin
Present results of a literature search of planning documents such as the Washington State Comprehensive Outdoor Recreation Plan State and local tourism studies and brochures and research studies from a variety of universities Federal agencies and other sources
Present recreation participation and trend data from local State and Federal agencies and private tourism resort and special interest groups (eg fishing clubs) in the area
Present a current recreation visitor profile for the Yakima River basin in terms of population age structure urban versus rural residence types and frequency of participation in recreation activities preferred settings preferred experiences and visitation characteristics
Complete a WROS inventory of seven primary reservoirs and five primary rivers in the Yakima River basin The primary lakes inventoried were Cle Elum Kachess Keechelus Bumping Clear Easton and Rimrock The five primary rivers inventoried were the Naches Yakima Cle Elum Bumping and Tieton Rivers These primary reservoirs and rivers were selected because they will be the water bodies most likely
5
affected by the yet-to-be selected preferred Yakima Storage Study alternative Refer to figure 2 for locations of the rivers and lakes within the Yakima River basin that are mentioned above
Complete a WROS inventory of flat water reservoir and river comparables outside the Yakima River basin area to get a more accurate picture of the supply of recreational opportunities in the area and to help assess the demand for certain types of recreational opportunities within the basin
Develop projections to determine likely population and significant social economic or demographic changes that may affect recreation demand within the Yakima River basin (eg population changes ethnicity major industry changes population density age structure changes transportation linkages migration and immigration patterns and resident and nonresident tourism patterns)
Present a compilation of developed recreation demand projections for the key recreation activities and WROS classes within the Yakima River basin These projections are essential for measuring the economic value of recreation and the quality of the recreation experience for each alternative that may be considered in the EIS and other planning documents
Present a profile of important attributes and conditions that define a special and attractive recreation destination
Fulfill a need identified by Reclamation and the State of Washington to assess the demand for recreation opportunities in the Yakima River basin
Scope and Methodology Scope
The Analysis Report deals primarily with the
Assessment of the current water-based recreation supply within the Yakima River basin and for comparison purposes and on a limited basis the supply of water-based recreation opportunities immediately east of the Yakima River basin
Assessment of future demand for water-based recreation activities within the Yakima River basin based on available trend projections
Identification of existing issues and concerns related to recreation management
6
7
Analysis of existing recreation information from a variety of sources
Water-based recreation opportunities that occur on or adjacent to rivers and reservoirs
The Analysis Report does not
Identify a preferred recreation development strategy
Identify a recreation implementation and monitoring strategy
Quantify the number of recreation facilities needed and locations where facilities may be provided
Include a discussion of demand or supply of recreation opportunities that are dependent on a municipal water supply (ie water needed for golf courses soccer and baseball fields city parks and greenways)
Address the potential recreation impacts of Yakima River basin storage alternatives
Address the economic value of recreation to the Yakima River basin
Describe the long-term social or economic benefits that the potential Black Rock Reservoir might have to the local economy
Address potential changes in land uses or potential developments on private property within the Yakima River basin (eg report does not consider possible subdivision development or resorts as a result of Yakima River basin storage alternatives that may be selected in the future)
Utilize any form of general public or recreation user survey instrument to measure recreation demand and user preference in the Yakima River basin
Methodology for Determining Demand and User Preference
The Recreation Demand and User Preference Analysis for the Yakima River Basin used what is considered in the recreation profession as a Level 1 and regional-scale water-related recreation analysis This section describes each of the major components
8
Level 1 Analysis It is common in public resource planning and management to use a sliding scale rule of analysis The sliding scale rule states that the level of analysis should be commensurate with the potential consequences of the decision or action to be taken Typically three levels of analysis are considered slight ordinary and extraordinary The levels of analysis differ by the (1) level and type of information necessary (2) tools and techniques used (3) time and effort required (4) level of certainty and risk and (5) level of scientific basis Figure 3 depicts the sliding scale of analysis
Level 3 Analysis
Level 2 Analysis
Level 1 Analysis
3 Significant changes or consequences
2 Minor changes or consequences
1 General inventory administrative record
Slight Ordinary Extraordinary
Degree of Time Effort and Certainty
Figure 3mdashSliding scale of analysis
In this Analysis Report a Level 1 analysis was used to address recreation demand and user preference This Analysis Report is part of a feasibility study that may lead to more intensive Level 2 or 3 analyses The output of this analysis is a set of percentages that reflect the anticipated increase or decrease in the demand for the key water-related recreation opportunities in the basin This information will provide decisionmakers with a sense of the magnitude of recreation demand value and benefits that might accrue from any water storage or diversion option
9
Regional Scale The scale or geographic area of analysis was the Yakima River basin The key question being addressed in this analysis is ldquoWhat is the recreation demand and user preference for the Yakima River basin and not for any specific site or facilityrdquo
Figure 4 serves two purposes First it shows that the analysis considered recreation demand and preference information from the perspective of a nation State and region within the State Second it depicts that the level and focus of analysis was on the basin and not the potential sites for water alterations (eg Black Rock Wymer)
Region
Site
State
Yakima River Basin Recreation Demand Projections
Nation
Figure 4mdashA regional scale of focus
Key Water-Related Recreation Activities For the benefit of the local community land and water resource managers and decisionmakers the section of the Analysis Report entitled ldquoFindings of Analysisrdquo describes trends and participation levels for a variety of outdoor recreation activities However recommendations concerning what outdoor recreation activities are needed in the Yakima River basin to meet future demand and public expectations were narrowed to those activities that are popularly associated with reservoirs rivers and lakes in the basin More specifically the recommendations section only considered the most significant popular activities
10
that take place on the water or closely associated with the water resource (eg camping hiking picnicking) The key water-related recreation activities included were fishing waterfowl hunting raftingkayaking water skiing motorboating developed camping rusticprimitive camping hiking jet skiing wildlife viewing picnicking bicycling swimming and sailing
Existing Information and Expert Opinion Typical of a Level 1 analysis the assessment of recreation demand and user preference relied on existing information (eg data reports applications environmental documents national and State studies agency plans and informal expert interviews) No original data were collected through surveys or systematic public interviews
Approximately 15 agency officialsmdashvery experienced with the tourism and outdoor recreation situation in the basinmdashwere interviewed in the course of the field work The primary purpose of the expert interviews was to get a better understanding of the existing information and to identify any trends or changes taking place in terms of recreation use visitation patterns visitor demographics equipment and other factors
WROS Inventory System Reclamation in collaboration with other Federal and State water resource agencies has recently developed a new tool called the Water Recreation Opportunity Spectrum System (Reclamation July 2004) The WROS Executive Summary is included in appendix A and the complete Userrsquos Guidebook can be downloaded from ltwwwusbrgovpmtsplanningwrosindexhtmlgt
WROS is a national interagency tool that provides planners and managers with a framework and procedure for making better decisions for conserving a spectrum of high quality and diverse water recreation opportunities In this analysis WROS was used to inventory (ie map) the current supply of water recreation opportunities within the Yakima River basin and to develop a regional profile of the current gross water surface acreage of WROS zones commonly referred to as urban suburban rural developed rural natural semiprimitive and primitive
WROS was also applied to key ldquocomparablerdquo reservoirs and river segments outside the Yakima River basin which are identified later in this report Reclamation selected comparables east of the basin that were similar in terms of geography topography climate ecotype elevation vegetation and recreation use
By inventorying what recreation opportunities already exist within the basin and across the comparables in a designated area (ie the current supply) and having information about the type and amount of recreation visitation (ie current
11
demand) decisionmakers are better able to understand current demand and to estimate future demand for new water storage or diversion options including different types of recreation activities and settings
Sound Professional Judgment There is no formula or way to scientifically determine with a high level of certainty the future of any human endeavor including future outdoor recreation demand or preference Thus based upon the (1) available information (2) WROS inventory and (3) expert interviews the principal investigators used sound professional judgment to estimate future recreation demand and user preference for the Yakima River basin A low and high range of percentage increase or decrease was provided for each of the key activities
Findings of Analysis Overview of the Study Area
The Yakima River flows for over 200 miles through south-central Washington and with its tributaries drains about 6150 square miles or 4 million acres Refer to figure 5 for the main features within the basin The river originates in Kittitas County from Keechelus and Kachess Lakes on the east side of the Cascade Mountains near Snoqualmie Pass The Yakima River flows southeast through the Kittitas and Yakima Valleys ultimately discharging into the Columbia River near Richland Tributaries include the Cle Elum Teanaway and Naches Rivers as well as numerous creeks and irrigation returns The confluence of the Yakima and Naches Rivers at the city of Yakima divides the Yakima River into ldquoupperrdquo and ldquolowerrdquo portions Much of the water is diverted for irrigation in the Yakima Valley but some is recovered through surface and subsurface routes
The Yakima River basin is bounded on the west by the Cascade Range on the north by the Wenatchee Mountains on the east by the Columbia River and on the south by the Horse Heaven Hills Elevations in the basin range from 8184 feet above mean sea level in the Cascades to 340 feet at the confluence of the Yakima River and the Columbia River
Average annual precipitation ranges in the Yakima River basin vary widely from 91 inches annually at Snoqualmie Pass (at the headwaters of the Yakima River in the Cascade Range) to 8 inches annually in the city of Yakima Most of the water in the Yakima River comes from snowmelt and is caught in a series of reservoirs to ensure sufficient water supply later throughout the irrigation season From 50-100 percent of the water delivered to the lower basin from the Naches River and upper Yakima River is diverted for irrigation and hydropower generation during the irrigation season
12
About one-half of the Yakima River basin is within and occupies most of Yakima County The upper part of the basin lies in Kittitas County and occupies most of that county The southeastern part of the basin occupies about one-half of Benton County and the southern part of the basin extends slightly into Klickitat County
The entire basin lies within areas either ceded to the United States by the Yakama Nation or areas reserved for the use of the Yakama Nation The Yakama Reservation occupies about 40 percent of Yakima County and about 15 percent of the basin
Nearly 40 percent of the basin is forested another 40 percent is rangeland 15 percent cropland and the remaining acreage includes other land uses including lands uses associated with river corridors and flat water reservoirs and lakes The single largest landowner is the US Government with 15 million acres or 38 percent of the land areas Much of the forested land is Federal land within the Wenatchee National Forest Other large Federal landholdings include the Yakima Training Center the Hanford Nuclear Reservation and the Bureau of Land Management (BLM) lands Other public ownerships (State county and local governments) total over 400000 acres Lands owned by Native Americans total about 800000 acres Private ownership totals nearly 17 million acres
Irrigated agriculture the main economy of the basin occupies about 1000 square miles Cattle grazing is the main use of 2900 square miles of rangeland Timber harvest cattle grazing and recreation are the major uses of the 2200 square miles in the forested areas of the basin to the north and west About one-fourth of the forested area is designated as wilderness
The economy of the basin is tied most directly to agricultural production Cereal crops irrigated pasture and hay production predominate in Kittitas County while Yakima and Benton Counties produce fruits vegetables grapes and other specialty crops such as hops and mint In fact Yakima County ranks near the top of the Nation in production of many fruits vegetables and specialty crops Another significant agricultural commodity is cattle including both dairies and beef production Manufacturing processes associated with agriculture also contribute substantially to the economic base Services trade transportation and forestry are important elements of the economy as well6
Recreation Setting
The recreation setting of the Yakima River basin varies from designated wilderness areas to urban greenways Features of the Yakima River basin are mainly situated in roaded natural settings Interagency Committee for Outdoor
6 wwwaccesswagov
13
Recreation surveys indicate the number one preferred recreation setting is water oriented Public demand for access to rivers streams and reservoirs continues to increase yearly Major recreation access points and developed recreation areas within the Yakima River basin are depicted in figure 5
Recreationists are attracted to the basin by the quality of the scenery water and recreation opportunities Primary recreation activities include fishing the reservoirs and rivers for cold water sport species whitewater boating and kayaking motorized boating and other related activities such as camping hiking picnicking and wildlife viewing
Bumping Rimrock and Clear Lakes are in the Snoqualmie National Forest The rugged mountain terrain surrounded by coniferous forests creates magnificent scenic settings Cabins camping boating and fishing are available at Bumping Lake Much of the shoreland at Clear Lake is reserved for group camp use
Rimrock Lake is used intensively by fishermen and other recreationists There are private cabins and several campgrounds Good fishing is available in the reservoir for rainbow and other trout and in the stream below the dam for rainbow trout and whitefish
Cle Elum Kachess and Keechelus Reservoirs are in the Wenatchee National Forest Cabins camping swimming boating picnicking and fishing for some species primarily for trout and freshwater ling are available at all three reservoirs Since construction of the dams fishing has improved greatly in the streams below the dams
Sunnyside Prosser Roza and Easton Diversion Dams on the Yakima River have recreation associated with their impoundments Sunnyside is limited to sightseeing and fishing Prosser and Roza diversions both provide excellent fisheries and Roza also has boat launching facilities
The Easton Diversion Dam area is much larger than the other three as it has 112 acres of land and 240 acres of water surface There is a State park that provides facilities for camping swimming and boat launching and mooring Recreational use is heavy The reservoir also has a good fishery7
Construction of the dams and other developments is generally accepted as causing a decline in the number of salmon and bull trout in the basin Two species of salmonmdashspring Chinook and steelheadmdashare listed as endangered and one resident bull trout is listed as threatened Salmon fishing is also a recreational activity in the Yakima basin with varying amounts of participation depending on the type of water year
7 httpwwwusbrgovdataweb
14
15
The larger cities of Yakima Ellensburg and the Tri-Cities (Richland Kennewick and Pasco) in the basin offer the typical types of urban recreation opportunities such as hiking bicycling walking for pleasure family gatherings golfing and field-oriented activities (soccer baseball football etc) These cities and other urban areas in the basin supply these activities through a variety of developments throughout the Yakima River basin (ie greenways trails golf courses city parks sport complexes etc) The quality of many of these recreation opportunities are enhanced by the rivers that flow through these metropolitan areas
Demographic Change
Recreation demand and user preferences will change over time due to many factors One large category affecting change is that of demographic trends in our society In Plan 2015 A Blueprint for Yakima County Progress the following was reported
It is apparent that some fairly significant change in community demographics is underway Age sex race ethnic background educational level and income of county residents is changing in ways that could have implications for how we plan (pg V-2 May 1997)
This section identifies several trends that were discernible from existing information sources
Population Growth It is commonly acknowledged in the outdoor recreation profession that population growth is one of the most significant variables affecting change to recreation demand and user preferences It is not only change in population growth within a particular area such as the Yakima River basin but also change in the population in the locales of the visiting recreationists Below are some key population change trends
Population growth in the United States from 1990ndash1999 was 96 percent The western region led the Nation with a 15-percent population increase during this time period
People recreating in Washington primarily reside in Washington and Oregon The percentage of population growth in these States from 1990ndash1999 was 183 percent and 167 percent respectively
Washington and Oregon rank 13th and 14th respectively in the Nation for projected population growth from 1995ndash2025 The population in
16
Washington is projected to increase by 438 percent and the population in Oregon is projected to increase by 385 percent
Some people recreating in Washington reside in California and Idaho California is ranked first for largest projected population growth from 1995ndash2025 (55 percent) and Idaho is ranked seventh (49 percent)8
The population increase in Washington from 2005ndash2015 is projected to be 116 percent and from 2015ndash2025 it is projected to be 248 percent9
It is anticipated that the greatest population growth in Washington by 2025 will take place in metropolitan counties counties within a reasonable commute time to metropolitan areas and those areas that combine important services with recreation opportunities10
Table 1 provides a comparison of the counties in the Yakima River basin Population growth from 1990ndash2005 has ranged from a 14-percent average annual increase for Yakima County to a 27-percent average annual increase for Benton County
Table 1mdashComparison of Counties in Yakima River Basin by Selected Demographic Factors from the State of Washingtonrsquos Office of Financial Management (April 1 2005)
Comparison Factors Kittitas County Yakima County Benton County
2005 population
Percent population change from 2000ndash2005
Percent population change from 1990ndash2005
2005 median age
2001 per capita income
35200
+97 (19 avg per year)
+37 (25 avg per year)
32 years
$21728
226000
+30 (06 avg per year)
+21 (14 avg per year)
32 years
$22872
151600
+109 (22 avg per year)
+40 (27 avg per year)
35 years
$27454
Several other population-related observations were made from interviews conducted during this project although without support of any data or documentation There is an increasing number of ldquometro commuterrdquo families moving into Kittitas County along the portions of Interstate 90 Development and population growth along portions of Interstate 82 in Yakima is increasing Yakima County is becoming a popular retirement area because of its climate road system services and recreation opportunities (Greater Yakima Chamber of Commerce)
8 US Census Bureau 9 Hall and Kruger 1994 10 Johnson and Beale 1994
17
Ethnicity In 1998 the profile of ethnicity for Washington was whitenon-Hispanic
79 percent Hispanic 6 percent whiteHispanic 5 percent Asian 5 percent African American 3 percent and American Indian 2 percent
The percentage increase in the Hispanic population in Washington from 1990ndash1998 was more than 60 percent in contrast to a 10-percent increase for whitenon-Hispanics
The number of Hispanic and Asian residents in Washington will more than double between 1995ndash2025
In the 2000ndash2005 Under Construction Blue Prints for the Future the following was stated (Yakima Parks and Recreation Department page 12)
In 1980 the Bureau of the Census counted 25387 Hispanics in Yakima County In 1990 the Census count increased to 45114 a 437 percent increase An OFM estimate in 1998 projected 75500 persons of Hispanic origin or a increase of 67 percent since 1990
The changing cultural face of Yakima is also reflected in the Yakima School District In 1981 the District was 114 per-cent people of Spanish descent by 1991 it was 327 percent This may be the most dramatic characteristic of change in Yakimarsquos future (emphasis added)
User preferences will likely change to reflect the recreation preferences of the expanding Hispanic and Asian populations in the basin It is reasonable to assume that the population of these two ethnic groups will increase by 6-8 per-cent per year for the foreseeable future Table 2 shows a comparison of three segments of the United States population participating in land-based outdoor activities for the years 2000 to 2004 Information on participation in water-based outdoor activities for Hispanics is not available One can assume that participa-tion levels for water-based outdoor activities by Hispanics is also increasing as the general population of Hispanics increases in the Yakima River basin
Age The population in the United States is aging The median age in 1999 was
35 years The median age for residents in Washington in 1999 was 35 years
Washington is expecting significant growth in older populations from approximately 15 million residents over age 50 in 2000 to 25 million by 2020 (Interagency Committee for Outdoor Recreation [IAC] 2003)
18
Table 2mdashComparison of Percentages of Three Segments of the United States Population Participating in Land-Based Outdoor Activities 2000ndash2004
Type of Activity
Whites Not of Hispanic
Origin
Hispanics of Mexican Origin
Hispanics Not of Mexican
Origin
Walking for pleasure 855 620 746
Family gatherings 751 680 682
Gardening or landscaping for pleasure 702 450 458
Driving for pleasure 591 283 346
Picnicking 567 491 453
Yard games (eg horseshoes) 458 173 232
Attending outdoor concerts plays etc 444 230 349
Bicycling 406 337 351
Visiting a wilderness or primitive area 376 212 223
Day hiking 344 493 415
Visiting a farm or agricultural setting 319 169 191
Developed camping 307 191 192
Mountain biking 231 185 180
Driving off-road 211 109 123
Primitive camping 194 90 98
Hunting 140 50 53
Backpacking 118 83 102
Horseback riding on trails 110 52 57
Big game hunting 110 29 30
Small game hunting 91 21 29
Horseback riding (general) 89 80 79
Mountain climbing 69 42 45
Rock climbing 49 39 25
Migratory bird hunting 30 07 11
Orienteering 21 08 06
Source Recreation Statistics Update Update Report No 4 November 2004 Hispanic Participation in Land-Based Outdoor Recreation Activities FS 2005 Forest and Rangeland Renewable Resources Assessment Update Report
19
Kittitas and Yakima Counties had an average age of 32 years in 2005 while Benton County had an average age of 35 years in 2005
Yakima County had a younger population base than most of Washington with a median age of 32 years largely due to the median age of Hispanics being 203 years and American Indians being 237
The city of Yakima estimated in 2000 that 292 percent of its residents were 19 years or younger and 278 percent were 50 years or older (Yakima Parks and Recreation Department)
Income The median income of Washington residents increased slightly between
1984 and 1994 but a significant increase occurred in 1996 through 1998 The median income in 1998 was almost $48000
Table 1 indicates that the average per capita annual income in Kittitas County is $21728 in Yakima County it is $22872 and in Benton County it is $27454
The city of Yakima estimated in 2000 that 489 percent of its families had an annual income of less than $25000 and 173 percent had an annual income of more than $50000 (Yakima Parks and Recreation Department)
The key demographic drivers shaping the change in the Yakima River basin will be the above-national average increase in population growth and Hispanic ethnicity Recreation demand will increase not only because of an increase of population growth due to migration to the area and births among residents in the basin but also from the adjacent States from where many of Washington tourists reside It is reasonable to assume that the population in the Yakima River basin will increase 20 percent per year for the foreseeable future
Issues Concerns and Observations
Certain issues concerns and observations can be made that should assist reservoir and river managers in formulating future recreation management strategies Some observations indicate that specific actions would not compromise other nonrecreational uses and other observations may lead managers to alter site attributes to increase user satisfaction levels or alter streamflows and reservoir elevations to enhance visitor experiences Several key issues concerns and observations which have been taken from several sources are paraphrased below
20
General Issues Concerns and Observations There is a water level that may be too low at which river access fisheries
habitat aesthetics backwater areas wildlife boating and visitation are negatively affected This water level would result in an associated decrease in recreation satisfaction and values
There is also a water level that may be too high at which recreational fishing shoreline stability turbidity water quality public safety facilities beaches habitat and visitation are negatively affected This water level would result in an associated decrease in recreation satisfaction and values
Recreation participation is experiencing growth in all types of settings with multiple activities often occurring in the same setting This often results in conflicts requiring carefully considered management strategies
Recreationists are more often participating in multiple activities during their leisure time rather than in a single activity The number of trips is increasing as are the number of days spent participating in recreation activities
Decreasing public funding for outdoor recreation access service and facility development and maintenance will represent major long-term challenges for managers
There is a point during river and reservoir operations where the level of recreation satisfaction will decline and recreationists will move to other areas or participate in other recreation or nonrecreation activities
There is a belief that with increasing dialogue among water users a broader societal perspective among decisionmakers and more flexible and creative lakereservoir operations ldquomajor improvements can be accomplished without abandoning any water resource purpose or benefitrdquo11
More diversity in terms of race culture age income and other factors will change the demand for outdoor recreation but should not diminish the size of the overall market Diversity will result in different preferences expectations and ways of seeking and participating in recreation activities
Nationwide recreation use of available sites will continue to increase This is a result of the effect of the ldquobaby boomerrdquo generation increased leisure time new recreation technologies and increased public information about recreation opportunities in rural and urban
11 LaGrassa 1991
21
communities Increased demands on existing public lands forests and parks will necessitate creative solutions and partnerships to keep up with demand
Without major changes in infrastructure and recreation management programs the health and safety of visitors and the integrity of the natural environment may be compromised12
Heavy pressures are likely to continue at water settings that have always been a major attraction for a wide variety of outdoor recreation activities
There is a trend in protecting agricultural lands in and around urban areas for open space and parklands The addition of recreation values to agricultural lands (eg fee hunting) irrigation ditches reservoirs etc is helping to justify protective farmland easements and other land and water conservation methods
As recreation demand increases major outdoor recreation providers must continue to provide traditional outdoor opportunities closer to urban areas where most of the people seeking the activity live
As recreation demand increases development and the extraction of resources may increasingly be viewed as conflicting with recreation and conservation interests
As public agencies continue to open the planning process to public involvement organized groups representing specific outdoor recreation interests will become more involved in the decisionmaking process
If recreationists are dissatisfied with a recreation site in a particular area and newer facilities are constructed at an alternate site those recreationists will likely migrate to the newer site if other site attributes are favorable
Yakima River Basin Issues Concerns and Observations Increased interest in promoting and marketing recreation opportunities
will attract new visitors and most likely result in repeat visitation with associated benefits to the local economy
Tourism is maturing and becoming recognized in the Yakima River basin as a major economic force The tourism industry both Statewide and in the basin is improving its marketing and visibility The Yakima Valley Visitorrsquos and Convention Bureau and the Greater Yakima Chamber of Commerce are taking steps that will
12 National Recreation Lakes Study Commission 1999
22
increase Statewide recognition and recreation visitation to the area The promotion of the area for its vineyards is an excellent example of success
The arearsquos mild climate days of sunshine excellent roads rural atmosphere numerous attractions diverse special events and food and lodging are major factors that will increase nature-based tourism in the future
The numerous special designations in or near the Yakima River basin are important to a vibrant and diverse nature-based tourism industry For example designations such as national park State parks wildlife refuges scenic byways trails wilderness areas open space bike ways and historic sites all work together to comprise the tourism system in the basin
Agricultural products orchards vineyards and fruit stands are also recreation resources and an attraction to water-based recreationists
The Columbia Riverrsquos recreational access points facilities and boat launch lanes are few and modest in development and thus likely impacts both local and nonlocal visitation
Warm water fishing in the lakes east of the Yakima River basin and downstream on the Yakima River is very popular with Washington residents
There appears to be an unmet demand for boat storage modern recreation vehicle (RV) camping marina services and boat rentals floating campsites group areas for day use and camping beaches and motorized trail activities
Reservoir levels will likely affect recreation by changing the type of use taking place (eg water skiing to canoeing more shoreline beach activities) the origin of visitors (eg fewer nonlocal visitors) and the number of visitors This change and fluctuation is not necessarily negative because different types of people and uses can be served at different times of the year
It is likely that using the Yakima River for fly fishing and rafting kayaking will continue to grow At some point in time it may be necessary and prudent to regulate recreational use on the river to prevent user conflicts and decrease pressure on the fish from overuse
The measurement of current recreation visitation (demand) to the water resources in the Yakima River basin is weak Surveys of public prefer-ences for future recreation activities and settings economic values and future participation patterns do not exist for the basin Managing agencies do not have the resources for a site-level recreation monitoring program
23
Recreation Trends Influencing Water-Based Recreation Water resource managers need to understand that recreation-related trends might influence future demand for creation of new or different types of public outdoor recreation opportunities A lack of understanding of current and anticipated water-related recreation use trends hampers a water resource managerrsquos ability to effectively manage recreation The trends dealing with specific activities listed below focus on projected future participation levels The number of trips and days spent on trips by recreation users for the selected activities are not discussed here although that information is available Following are several key trends related to participation levels that may influence future water recreation management
Urban Recreation Activities ndash As society becomes more urbanized travel patterns (including length of stay repeat visitation and distance traveled) will be increasingly dependent on the quality of the recreation opportu-nities and the recreation settings provided13 Urban residents typically have fewer outdoor recreation opportunities than rural residents which results in increased demand for outdoor recreation opportunities and activities closer to urban areas
Trail Street and Road Activities ndash Activities occurring on trails streets and roads continue to be popular Walking hiking running jogging and bicycling outdoors can be done in a rural setting but are most often done in an urban environment
Water-Based Recreation Activities ndash Projections for many water-based activities such as visiting beaches or water areas canoeing motorboating nonpool swimming and rafting show increases over projected population growth through the year 2050
Consumptive Wildlife-Related Activities ndash Hunting is expected to decline in popularity from 19 million to 165 million participants over the next 50 years The National Survey of Fishing Hunting and Wildlife Associated Recreation reported a 4-percent decline in anglers nationwide from 1991 to 2001 (a 3-percent decline from 1996 to 2001) This reflects a trend but not a significant14 one
Nonconsumptive Wildlife Activities ndash Nonconsumptive wildlife activities such as birdwatching photography and other types of wildlife viewing are projected to increase more than the population growth through the year 2050 The largest factor contributing to the increase in nonconsumptive wildlife recreation seems to be the increasing age of the general
13 Tarrant Michael A et al 1999 as cited in US Department of Agriculture (USDA) 2003 14 Statistical comparisons are made at the 5-percent level This means that for 95 percent of
all possible samples the estimate for 1991 cannot be shown to be different from the estimate of 2001
24
population Residential (close to home) wildlife watching rebounded slightly from its 1991ndash1996 declines15
Developed Land Activities ndash Developed land activities such as camping family gatherings visiting historical places and walking are expected to increase at a rate greater than population growth through 2050 for all regions of the United States In the northern States participation levels for biking and picnicking are also expected to increase but at a slower rate
Primary-Purpose Trips ndash Although water-based recreation activities are projected to increase primary-purpose trips are expected to decrease In other words recreationists are not making trips to participate in a single activity they are participating in multiple activities during their leisure time and staying longer
Demographic Factors ndash Recreation research shows that demographic factors such as age race or ethnicity gender wealth or income education and previous experience influence recreation behavior The largest change expected in factors influencing recreation behavior relates to increases in population and real income Population age and gender ratio are expected to change relatively little whereas the percentage of whites in the population should decline as other racial groups grow at faster rates16
Of the outdoor recreation activities discussed those projected to grow fastest through 2050 measured by participation levels are visiting historical places wildlife viewing sightseeing and biking The slowest growing activities are projected to be hunting and fishing Hunting is the only activity projected to decline substantially below projected population increases Demographic factors will continue to influence how water-based recreation is managed Future vacationers are expected to stay longer at their destinations and to participate in a variety of recreational pursuits rather than in one primary activity
National Recreation Providers
Outdoor recreation in the United States is provided primarily by four entities Federal State and local governments and the private sector Recreation occurs in rural settings such as parks forests lakes and streams and in urban settings such as urban parks and sports complexes that meet the immediate needs of urban recreationists Following is a brief discussion of the four main providers of recreation opportunities in the United States
15 National Survey of Fishing Hunting and Wildlife Associated Recreation 2001 16 Hof et al 1983 Walsh et al 1992 as cited by USDA 2003
25
Federal The Federal Government is the largest provider of public outdoor recreation providing approximately 650 million acres (about 28 percent of the total land area of the lower 48 contiguous States) Most Federal land management agencies offer recreation that is primarily land based rather than water based However those land management agencies the BLM FS and US Fish and Wildlife Service (Service) also manage recreation facilities and opportunities near streams rivers and lakes Water management agencies such as Reclamation the Corps and TVA primarily focus on managing water-based and water-related recreation activities The NPS manages not only land-based recreation facilities and opportunities but also activities that focus on water resources at national rivers national seashores and national lakeshores National recreation areas and national Wild and Scenic Rivers are managed by a variety of agencies
State State acres available for recreation include State park lands (118 million acres) State forest lands (5028 million acres) State wilderness lands (167 mil-lion acres) and State fish and wildlife lands (116 million acres)17 Recreation facilities and opportunities provided by States are typically provided at larger State park areas and smaller historical sites Areas provided in the State park system are typically smaller than the federally managed parks and somewhat larger than the more intensely developed local parks State governments also play a significant role in conserving and managing the Statersquos wildlife populations State fish and wildlife lands tend to provide more primitive opportunities and more dispersed settings than those found in State park systems State forests offer outdoor recreation opportunities that are typically more primitive and dispersed However the recreation aspects of State forests are not often known because management of State forests usually focuses on timber production and other timber-related activities Like State forest and fish and wildlife lands State wilderness areas offer more primitive and dispersed recreation opportunities than State park systems
Local The total number of acres available for recreation by local entities throughout the United States is unknown Refer to sections below for a breakdown of acres within the Yakima River basin that are in local ownership and that could be available for recreation purposes Because the recreation areas provided by local and municipal entities are small compared with State-managed areas the acreage for recreation provided by local and municipal entities is probably significantly less than that provided by State governments Nevertheless the Presidentrsquos
18 The 116 million acres estimated for State fish and wildlife lands is an average of two reports each reporting different estimates A 1995 BLM report estimated 93 million acres and a 1989 Recreation and Park Association assessment estimated 14 million acres as documented by USDA 1999
26
Commission on America Outdoors estimated in 1987 that 60 percent of the Nationrsquos recreation areas were provided by local government most of which were highly developed and managed for intensive use18
Private Nearly 60 percent of the land in the United States is privately owned19 Private lands support a large variety of recreation activities Much of the Nationrsquos private land is open to recreation without restrictions Other private land is available to the recreating public through leasing or by obtaining permission The 181 million acres of private land available for recreation includes 13048 million acres open to the general public and 5057 million acres leased to individuals and groups Access to private rural lands is important because public lands cannot meet the existing and future recreation demand Without private lands the natural resources of existing rural and urban public parks may become overused and degraded
Washington State Recreation Providers
Government entities own 40 percent of all land-based acreage in the State of Washington Of this 40 percent the Federal Government owns 129 million acres of the public lands (28 percent of the Statersquos total land-based acreage) the State government owns 37 million acres of the public lands (13 percent of the total land-based acreage) local governments own 659000 acres of the public land (01 percent of the total land-based acreage) and tribal governments own 27 million acres of the public lands (6 percent of the total land-based acreage) In other words government entities own and manage approximately 47 percent of Washington Statersquos total land acreage The rest of the Statersquos land base (approximately 53 percent) is owned by private parties or other nongovernment entities
The FS (9 million acres) NPS (2 million acres) and the Washington Department of Natural Resources (3 million acres) are the primary government entities that manage the State of Washingtonrsquos publicly owned land base The Washington State Parks and Recreation Commission has reported that it owns 107608 acres of recreation lands in the State
The management of recreation lands by the different land and water entities within the State of Washington is similar to the way lands are managed on a national level The Federal Government provides primarily land-based recreation facilities and opportunities that are less developed than State local or private entities However Federal agencies do manage lands and facilities that are near rivers and reservoirs or lakes State agencies offer facilities and opportunities that
18 Betz Carter J et al 1999 as cited in USDA 2003 19 Teasly Jeff R et al 1999 as cited in USDA 2003
27
are typically smaller than federally managed parks and somewhat larger than the more intensely developed local parks Local parks are intensely developed and managed for intensive use Private lands offer recreational opportunities that are typically leased to individuals or groups for recreational purposes
Recreation Participation Levels
Information pertaining to the types of existing recreation facilities and opportunities future trends and recreation participation levels can assist in establishing a baseline for assessing future recreation demand in the Yakima River basin The principal recreation providers (ie Federal State local and private) can also be used to describe the recreation environment By documenting the existing national Pacific Coast and Washington State recreation participation levels and subsequently identifying future trends user preferences and other factors land and water resource managers can focus their efforts on establishing the appropriate types and quantities of recreation facilities and opportunities These facilities and opportunities could be provided in concert with an appropriate water supply to provide the public with a variety of quality recreation experiences within the Yakima River basin
Comparisons are made between national State and regional participation and trend information to validate the demand decisions identified in this Analysis Report However one should keep in mind that certain activity participation and trend information cannot be readily compared with a high level of certainty due to the way information was collected and documented In some instances certain activities may be grouped into specific categories and in other instances the activity may be addressed separately (eg sailing motor and nonmotorized boating for pleasure may have been grouped into a boating category in one instance but reported as separate activities in other instances)
National Participation Levels Identifying recreation participation levels is important for effective management of the natural environment for recreation purposes It can help land and water management agencies forecast changes that may be required to meet demand
A 1999 national survey identified swimming fishing and boating as the three most popular water-based activities with swimming and fishing among the top five most popular outdoor recreation activities overall20
Table 3 shows the percent and number of people 16 years and older in United States participating in 12 types of outdoor recreation activities in 1999ndash2000 As
20 Recreation Roundtable 2000 as cited in USDA 2003
28
Table 3mdashPercent and Number of People 16 Years and Older in the United States Participating in 12 Types of Outdoor Recreational Activities 1999ndash2000
Type of Outdoor Activity
Percent of Population 16
and Older Number
in Millions Participated in any type of activity 975 2021
Trailstreetroad activities 888 1841 Traditional social activities 816 1692 Viewing and photographing activities1 768 1592 Viewing and learning activities 703 1457 Driving for pleasure activities 661 1370 Swimming activities 631 1308 Outdoor adventure activities 573 1188 Boatingfloatingsailing activities 407 844 Fishing 370 767 Snow and ice activities 272 565 Outdoor team sports 210 435 Hunting 142 294
1 Estimates for this category of activities were adjusted (by +1751) to compensate for a problem with a screener question
Source 1999ndash2000 National Survey on Recreation and the Environment FS and the University of Tennessee Knoxville Tennessee
the table states 975 percent of those individuals 16 and older participated in some sort of outdoor recreation activity Most of those activities are available within the Yakima River basin
Table 4 shows the results of a 1999ndash2000 national survey that identified the percent and number of people 16 years and older in the United States that participated in land-based outdoor activities Trailstreetroad team sports backpacking and camping viewing and learning viewing and photographing hunting driving for pleasure and sightseeing and traditional social activities are described in table 4 The percentages do not total 100 percent because recreationists often participate in more than one activity on a particular visittrip Many of those activities such as camping hiking walking bicycling viewing natural scenery backpacking etc are greatly enhanced by the presence of a reservoir or river water source
The same 1999ndash2000 national survey also identified people 16 and older that participated in water-based outdoor activities Boating floating fishing and swimming activities are the types of water-based activities identified in table 5 These types of activities are more dependent on a reliable water supply throughout a recreation season than those depicted in above-mentioned table 4
29
Table 4mdashPercent and Number of People 16 Years and Older in the United States Participating in Land-Resource-Based Outdoor Activities 1999ndash2000
Activity
Percent of Population 16
and Older Number
in Millions
Trailstreetroad activities
Bicycling 392 813
Mountain biking 203 421
Walking 818 1696
Horse riding and equestrian 107 222
Hiking 323 669
Team sport activities
Softball soccer baseball etc 225 466
Backpacking and camping activities
Backpacking 126 261
Developed camping 195 404
Primitive camping 122 253
Visiting a wilderness or primitive area 334 692
Gather mushrooms berries or other natural products 262 543
Viewing and learning activities
Visiting a nature center nature trail or zoo 562 1165
Visiting a prehistoric or archaeological site 197 408
Visiting a historic site 451 935
Viewing and photographing activities
Bird watching 328 679
Viewing other wildlife 428 887
Viewing wildflowers and natural vegetation 452 937
Viewing natural scenery 548 1136
Hunting
Big game 77 159
Small game 74 153
Waterfowl 23 48
Driving for pleasure and sightseeing
Sightseeing 522 1082
Driving for pleasure through natural scenery 525 1088
Off-road 4-wheel driving all terrain vehicle or motorcycle 166 344
Traditional social activities
Family gathering 731 1515
Picnicking 558 1157
Source 1999ndash2000 National Survey on Recreation and the Environment FS and the University of Tennessee Knoxville Tennessee
30
Table 5mdashPercent and Number of People 16 Years and Older in the United States Participating in Water-Resource-Based Outdoor Activities 1999ndash2000
Activity Percent of Population
16 and Older Number
in Millions
Boatingfloatingsailing Sailing 48 99Canoeing 93 193Kayaking 31 64Rowing 45 93Motorboating 232 481Water skiing 79 164 Jet skiing 91 189 Floating rafting 96 199 Sailboardingwindsurfing 08 17Surfing 16 33
Fishing Fresh water 291 603 Cold water 129 267 Warm water 226 468 Salt water 93 193 Migratory ocean-to-fresh water 37 78
Swimming Swimminglake river ocean 432 896 Swimming in fresh water 291 603 Swimming in salt water 242 502 Snorkeling 64 133Scuba 15 31Visiting a beach 372 771 Visiting a waterside 257 533
Source 1999ndash2000 National Survey on Recreation and the Environment FS and the University of Tennessee Knoxville Tennessee
An additional study completed by the FS as part of The National Survey on Recreation and the Environment (NSRE) 2000 identified the percent change in participation for certain outdoor recreation activities One should keep in mind that the population of the United States has increased substantially since 1994 That would account for more individuals participating in a certain activity however the percent of people participating in certain activities increased substantially beyond what an increase in the total population would account for Table 6 shows the participation trends from 1994ndash95 and 2000ndash02
31
Table 6mdashNational Participation Trends from 1994ndash95 and 2000ndash02
Resource Base Activity
1994ndash95 Participants (in Millions)
2000ndash02 Participants (in Millions)
Percent Change 1995ndash2002
Land Resource Based Activities Bird watching 541 69 275
Hiking 478 709 483Backpacking 152 228 500Primitive camping 280 341 218 Off-road driving 279 373 337 Walking 1337 1769 323Sightseeing 1134 1104 -26Developed camping 415 563 357 Picnicking 983 1161 181Bicycling 574 842 467Horseback riding 143 207 448 Hunting 186 241 296
Water Resource Based Activities Motorboating 470 519 104Swimming (river lake 781 891 141 ocean) Water skiing 179 173 -34 Fishing 578 727 258Sailing 96 109 134Source FS RPA Assessment 2000 as cited in Colorado State Comprehensive Outdoor Recreation Plan 2003
Table 7 shows the most current information available related to participation percentages in the United States for outdoor recreation activities for the year 2004 Comparing table 7 with tables 4 5 and 6 can provide some insight as to the trends in outdoor recreation participation that one can assume will continue into the first part of the 21st century
Overall most of the outdoor recreation activities experienced an increase in participation from 1995 to 2004 as indicated from tables 4 5 6 and 7 The only activities showing a decrease in participation were sightseeing and water skiing although the change is not major Activities such as hiking walking and bicycling have been the fastest growing activities over the years These activities are easier to do and less expensive Except for water skiing all water-based recreation participation levels have increased significantly from 1995 to 2004
32
Table 7mdashParticipation Rates for Outdoor Activities in 2004
Type of Activity Percent
Participating Participants
(Millions) Viewingphotographing natural scenery 706 1512 Visiting nature centers etc 635 1359 Driving for pleasure 612 1309 Viewingphotographing other wildlife 582 1246 Viewingphotographing wildflowers trees etc 570 1220 Visiting beach 569 1218 Swimming in lakes streams etc 542 1161 Visiting historic sites 531 1136 Picnicking 524 1121 Boating 442 946 Viewingphotographing birds 398 852 Day hiking 380 813 Bicycling 376 805 Fishing 375 803 Visiting a wilderness or primitive area 336 719 Viewingphotographing fish 321 687 Developed camping 311 665 Freshwater fishing 309 661 Motorboating 303 649 Snowice activities 292 624 Driving off-road (defined as off of paved or graveled roads) 225 481 Visiting prehistoricarcheological sites 216 462 Mountain biking 198 425 Primitive camping 155 331 Rafting 155 331 Jet skiing 134 287 Hunting 131 281 Cold water fishing 130 277 Canoeing 126 269 Backpacking 121 258 Horseback riding (general) 89 191 Horseback riding on trails 71 152 Kayaking 70 150 Downhill skiing 68 145 Snowmobiling 63 135 Snowboarding 59 126 Cross-country skiing 27 57 Source Recreation Statistics Update Report No 1 August 2005 FS 2005 Forest and Rangeland Renewable Resources Assessment
33
Pacific Coast Participation Levels The following figures show the results of participation levels for certain outdoor recreation activities in specific regions of the United States The regions defined are FS Resource Planning Act Assessment (RPA) regions The figures reflect information taken from the National Survey on Recreation and the Environment 2000 The States within the Pacific Coast Region include the entire States of Washington Oregon California Nevada Hawaii and Alaska The different regions differ in climate topography and culture that lead to regional variations in outdoor recreation use patterns The regions also differ in population The North has about 92 million people 16 and older the South has 62 million the Rocky Mountains has 15 million and the Pacific Coast has 31 million21
Figure 6 shows the participation percentages in viewing activities Viewing activities can include among other things visiting a nature center visiting a prehistoric site bird watching wildlife viewing and studying nature Regional participation in one or more viewing activities ranged from 74 to 80 percent However variations for individual activities between regions can be greater As an example studying nature near a water area was lowest in the Rocky Mountains (25 percent) and highest in the Pacific Coast (66 percent) Even with the variations in opportunities to participate in different activities across regions the regional percentages for viewing nature are very similar
North
South
Rocky Mountain View ing
Pacif ic Coast
0 20 40 60 80 100
Source USDA Forest Service RPA Assessment 2000
Figure 6mdashPercent of participation in viewing activities by region
Developed camping participation levels in the Pacific Coast (34 percent) and Rocky Mountain Region (38 percent) are greater than the participation levels for the other two regions (South 23 percent and North 24 percent) The same can be said of primitive camping (ie more people participate in primitive camping in the western two regions) This variation may be because there are more public lands available for camping in the Western United States Figure 7 shows the percent of participation in camping activities by regions in the United States
21 FS Report on National Survey on Recreation and the Environment 2000
34
North
South
Rocky Mountain
Pacific Coast
0 10 20 30 40
Developed Camping
Primitive Camping
Source USDA Forest Service RPA Assessment 2000
Figure 7mdashPercent of participation in camping activities by region
Hunting participation levels are greatest in the Rocky Mountains (13 percent) and in the South (11 percent) compared to the Pacific Coast (5 percent) which had the lowest participation level for hunting The regional differences may be due to cultural differences as well as the availability of public land for hunting Large amounts of public lands are available in the Rocky Mountains for hunting while hunting often occurs on private lands in the other regions The low percentages for hunting in the Pacific Coast are likely related to scarce opportunities as well as cultural differences Of the 212 million people in the United States 6 percent of the total population went hunting Participation rates ranged from a high of 12 percent in the West North Central Region to 2 percent in the Pacific Coast Region which includes the State of Washington22
Regional participation levels for fishing range from 24 percent in the Pacific Coast to 32 percent in the South Figure 8 shows the percent of participation in hunting and fishing by regions within the United States In 2001 212 million people 16 years or older lived in the United States The national participation rate for fishing was 16 percent One out of every six people went fishing The participation rate for fishing in the Nation ranged from a high of 27 percent in the West North Central Region to a low of 11 percent in the Middle Atlantic Region
The participation rate for fishing in the Pacific Coast Region which includes the State of Washington was 12 percent23
Boating participation levels range from 26 percent in the Rocky Mountain Region to 30 percent in the North Region Motorboating is the most popular of any of the
22 Service National Survey of Fishing Hunting and Wildlife-Associated Recreation 2001 23 Ibid
35
Pacif ic Coast
Rocky Mountain
South
North
Hunting
Fishing
0 5 10 15 20 25 30 35
Source USDA Forest Service RPA Assessment 2000
Figure 8mdashPercent of participation in hunting and fishing by region
boating activities included in the group of activities About 25 percent of the people in the South and 20 percent in the Pacific Coast Regions participate in motorboating The most popular nonmotorized boating activity reported was canoeing (4 percent) and rowing (3 percent) and occurred in the Pacific Coast Region Figure 9 shows the percent of participation for boating activities by regions of the United States
Pacif ic Coast
Rocky Mountain
South
North
Boating
0 10 20 30 40
Source USDA Forest Service RPA Assessment 2000
Figure 9mdashPercent of participation in boating by region
Washington State Participation Levels Information pertaining to the existing State recreation environment participation and future demand is available primarily from three sources (1) the 2002ndash2005 Washington State Comprehensive Outdoor Recreation Plan (2) the IAC for
36
Outdoor Recreation Washington Outdoors Assessment and Policy Plan 1990ndash 1995 and (3) IAC Estimates of Future Participation in Outdoor Recreation in the State of Washington An Addendum to the State Comprehensive Outdoor Recreation Plan SCORP March 2003
IAC identified 11 generalized recreation activity categories to determine participation levels of State households surveyed The most popular activity categories were sightseeingpicnicking hikingwalking sportsgamesother and water activities Refer to figure 10 for participation levels for the 11 recreation categories as a percent of the total State population
As part of the effort to determine actual public behavior as opposed to public preference the IAC contracted for the design and implementation of a Statewide outdoor recreation survey to determine the participation levels as a percent of the State population Figure 11 reveals that most people in the State pursue close-to-home low-cost activities such as walkinghiking outdoor team sports nature activities sightseeing and bicycling
37
Fishing
Water Activities
Nature Study
Hiking Walking
Camping
Snow Activities
Motorized ORV Riding
Nonmotorized Riding
Sightseeing Picnicking
Hunting Shooting
Sports Games Other 760
260
480
260
530
550
760
530
720
570
890
Source Interagency Committee for Outdoor Recreation Washington Outdoors Assessment and Policy Plan 1990-1995
Figure 10mdashRecreation participation by activity category
WalkingHiking 530
448Outdoor Team and Individual Sports
Nature Activities 430
230Sightseeing
Bicycle Riding 210
Indoor 205
Picnicking 200
Water Activities 190
180SnowIce Activities
Camping 130
Fishing 130
Off-Road Vehicles 89
HuntingShooting 61 Percent of State Population 30Equestrian Activities
Air Activities 17
Source Interagency Committee for Outdoor Recreation Estimates of Future Participation in Outdoor Recreation in Washington State March 2003 Addendum to the State Comprehensive Outdoor Recreation Plan
Figure 11mdashParticipation in general recreation categories as a percent of State populations
A further breakdown of water-based recreation participation levels as a percent of the Statersquos population is found in the March 2003 addendum to the 2002ndash2005 SCORP Figure 12 shows 12 water-based recreation activities and their participation levels
A further breakdown of water-based recreation participation levels as a percent of the Statersquos population is found in the March 2003 addendum to the 2002ndash2005 SCORP Figure 12 shows 12 water-based recreation activities and their participation levels
The IAC projected the State of Washingtonrsquos future participation levels in outdoor recreation for a 10- and 20-year period The 22 outdoor activities selected by the IAC are listed in table 8 Walking nature activities bicycle riding canoeingkayaking nonpool swimming and visiting a beach were the activities that are projected to grow the fastest over the 20-year period Hunting and fishing appear to be on the decline in the State of Washington The decline in hunting and fishing appears to be the norm within the United States although in some States the number of people hunting and fishing is growing but it is not
38
Swimming or Wading
Motor Boating
Beachcombing
Hand Power Canoe - Kayak-Rowboat
Water Skiing
Inner Tubing - Floating
Personal Watercraft
Sail Boating
Scuba - Skin Diving
White Water Rafting
Wind Surfing
Surfboarding
Percent of State Population
00 20 40 60 80 100
Source Interagency Committee for Outdoor Recreation Estimates of Future Participation in Outdoor Recreation in Washington State March 2003 Addendum to the State Comprehensive
Outdoor Recreation Plan
Figure 12mdashParticipation in water activities as a percent of the Statersquos population
keeping up with population growth within those States Table 8 shows the estimated participation changes for certain recreation activities in Washington over a 10- and 20-year period
Local Recreation Environment
Information concerning local outdoor recreation trends participation percentage levels and factors that may influence future recreation development activities is very limited for the Yakima River basin For the purposes of this report it is assumed that trends in outdoor recreation and participation levels for the United States Pacific Coast Region and the State of Washington also apply to the basin This section briefly describes the existing recreation opportunities that are located near or adjacent to flat water reservoirs or lakes and the major rivers within the basin The current recreation environment or supply is discussed in more detail in the Black Rock Dam and Reservoir Recreation Needs Assessment attached as appendix B In addition the ldquoIssues Concerns and Observationsrdquo section of this report can be used to describe the recreationtourism environment within the basin
39
Table 8mdashEstimates as a Percent of Change in the Number of People Participating in the Future Compared to Current Levels
Type of Activity
Estimated 10-Year Change
(2003-2013)
Estimated 20-Year Change
(2003-2023)
Walking
Hiking
Outdoor team and individual sports
Nature activities
Sightseeing
Bicycle riding
Picnicking
Motor boating
Nonpool swimming
Visiting a beach
Canoeingkayaking
Downhill skiing
Cross-country skiing
Snowmobile riding
Fishing
Camping ndash primitive dispersed
Camping ndash backpacking
Camping ndash developed (RV style)
Off-road vehicle riding
Hunting-shooting
Equestrian
Air activities
+23
+10
+6
+23
+10
+19
+20
+10
+19
+21
+21
+21
+23
+42
-5
+5
+5
+10
+10
-15
+5
No estimate
+34
+20
+12
+37
+20
+29
+31
No estimate
+29
+33
+30
No estimate
No estimate
No estimate
-10
No estimate
+8
+20
+20
-21
+8
No estimate
Source IAC March 2003 Estimates of Future Participation in Outdoor Recreation in the Washington State an Addendum to the SCORP
The Yakima River basin is within easy access of millions of residents from Oregon and Washington for day-use weekend and longer visitation It is also a major passthrough area for potential recreationists traveling the interstate highway system The Yakima River basin supplies a variety of quality water-based recreation opportunities in a variety of outdoor settings (ie urban types of settings to rural developed and natural settings) Flat-water recreation is primarily available in the western and northern portion of the basin at Cle Elum Reservoir Bumping Lake Kachess Reservoir Keechelus Reservoir Clear Lake Easton
40
Lake and Rimrock Reservoir The five primary rivers discussed within the basin that supply recreation opportunities are the Tieton Naches Cle Elum Bumping and Yakima Rivers Although there are other smaller flat water reservoirs or lakes and rivers in the basin that offer similar types of water-based recreation activities the only water bodies discussed in this section and this report are the ones specifically mentioned above
The Yakima River basin has a national reputation for its high quality fly fishing primarily on the Yakima River Fly fishing is one of the fastest growing activities on the Yakima River otherwise known as the place to ldquoChase Rainbowsrdquo The Yakima River is what anglers in Washington State call a ldquoblue ribbonrdquo trout stream (Yakima Valley Visitors Guide Yakima Valley Visitors and Convention Bureau 2005) The prime periods for fishing the river are February through May and September and October although fishing occurs on the river throughout the year Spring fishing is the best time to fish the Yakima River because water levels are low and the fish have been less active and are ready to eat insects starting their annual hatch Fishing the Yakima River in September and October is also good due to the low water levels (personal communication Gary Fairfield June 8 2005) Refer to the Yakima River streamflow hydrographs in appendix C
Spiking of streamflows negatively affects fishing for the short term (ie 1 or 2 days) Flows of 680 cubic feet per second (cfs) at Ellensburg are considered low water and flows of 2000 cfs or below are considered good for wading for fish (personal communication Dan Snyder local fly fisher June 9 2005) Streamflows of 800 cfs are ideal for fishing and flows of 4000 cfs are considered raging water (personal communication Robert Cooper local fly fisher June 9 2005)
During the summer recreation season the quality of the fishing experience is affected by other types of recreational use such as tubing and rafting for pleasure (personal communication Gary Fairfield local angler June 8 2005 Dan Snyder local angler June 9 2005) The peak rafting season on the Yakima River occurs in late June until September due to the warmer temperatures and summer vacation for students
The Yakima River below the city of Yakima to the Tri-Cities is great for small-mouth bass fishing in the spring (personal communication Dan Snyder June 9 2005)
Fishing in the Tieton River is not as good as fishing in the Yakima and Naches Rivers due to the small stream size fast water wood debris and cloudiness of the water (personal communication Gary Fairfield June 8 2005) The Tieton River is not good due to angry water and white coloration (personal communication Robert Cooper local fly fisher June 9 2005) River rafting is best during a 3-week period in September when Reclamation releases stored water in Rimrock Lake for downstream beneficial uses The rapids during that time are rated as a
41
Class III Refer to appendix D for a description of the different white water classes Also refer to appendix C for streamflow hydrographs
Fishing the Naches River is not as good as fishing in the Yakima River and there is very little rafting The lands adjacent to the river are privately owned which limits access and put in and take out sites along the river corridor
The 8-mile section of the Cle Elum River below the dam is a tributary to the Yakima River This section is bordered by private land a county road small local businesses and the small community of Roslyn The area is also the location of the large resort development of Suncadia with 3000 planned residential units and 3 golf courses Public access to the Cle Elum River is very limited because of the private land and development There are no public or private campgrounds and no public access launch sites so recreation demand is limited to fishing and boating by local residents Estimates of the amount of recreation use of the river are not available The Cle Elum River below the dam is used as an educational opportunity to teach elementary and high school students and their teachers about salmon and their life stages The salmon come to this reach of the river to spawn and the physical setting is naturally adaptable to seeing the salmon spawn mainly in the fall (September and October)
The Yakima River basin also has a Pacific Northwest regional reputation for motorized recreation opportunities associated with trail bikes all-terrain vehicles jeeps and snowmobiles primarily on FS lands on the west side of the basin National Forest managers report increased participation in RV camping off-highway activities driving for pleasure jet skiing and snowmobiling Also reported is an increase in the number of Hispanic outdoor recreation participants particularly on the Naches Ranger District adjacent to the city of Yakima (personal communication Mike Rowan and staff FS Naches Ranger District June 10 2005) Picnic sites and campgrounds are close to or exceeding capacity on summer weekends and exceed capacity on holiday weekends Recreation demand slows during the week but can reach 50- to 75-percent capacity depending on the weather (personal communication Pam Novitsky FS Cle Elum Ranger District June 9 2005)
To compare the recreation participation that is generated (origin of demand) and the recreation participation it accommodates (destination of demand) the IAC divided the State into four regions The Yakima River basin lies primarily within Region 3 as described by the IAC Region 3 satisfies a demand from other regions in the State for all activities reported in figure 13
Region 3 seems to be a destination area for recreationists from other more populated regions within the State As stated earlier the State of Washingtonrsquos population is expected to increase by 116 percent from 2005 to 2015 and 248 percent from 2015 from 2025 Accommodating and satisfying the Statersquos demand for outdoor recreation activities within the Yakima River basin is an important factor in the regionrsquos overall economy
42
Camping
Fishing
Hiking Walking
Hunting Shooting
Motorized ORV Riding
Nature Study
Nonmotorized Riding
Sightseeing Picnicking
Snow Activities
Sports Games other
Water Activities
Destination Origin
0 20 40
Source Interagency Committee for Outdoor Recreation (IAC) Washington Outdoors Assessment and Policy Plan 1990-1995
Figure 13mdashDemand in Region 3 by activity
The types of recreation activities that are popular on a national and regional scale are also the types that occur on or adjacent to the water bodies in the Yakima River basin The State of Washington and local and Federal Government agencies currently supply the facilities opportunities and infrastructure necessary to accommodate the most popular recreation activities However as the population increases and the recreation participation levels increase for many outdoor activities over the next half century many of the existing recreation sites may experience overuse and degradation unless additional facilities and opportunities are provided to meet demand and public expectations To accommodate future demand recreation providers will have to cooperate to provide the necessary and appropriate facilities and opportunities
Water Recreation Opportunity Spectrum Inventory and Existing Conditions As previously stated in the ldquoMethodology for Determining Demand and User Preferencerdquo section of this report WROS is a national interagency tool that provides planners and managers with a framework and procedure for making better decisions for conserving a spectrum of high quality and diverse water recreation opportunities As stated earlier the ldquoExecutive Summaryrdquo from the WROS Userrsquos Guidebook provides more details and is included in appendix A and the complete Userrsquos Guidebook can be downloaded from ltwwwusbrgovpmtsplanningwrosindexhtmlgt
In this Level 1 analysis WROS was used to inventory (ie map) the current supply of water recreation opportunities and to develop a regional profile of the water resources across the spectrum of six WROS zones named
43
urban suburban rural developed rural natural semiprimitive and primitive Refer to appendix E for a brief description of each WROS zone
It is typical in recreation resource planning to examine ldquocomparablesrdquo to help project demand and user preference The criteria used to select comparables in this analysis were (1) the major existing reservoirs and rivers in the Yakima River basin and (2) other water resources near the basin that were similar in terms of geography topography climate ecotype elevation vegetation and recreation use The latter criteria allowed for the inclusion of the Columbia River from the Tri-Cities to Wenatchee as well as Wanapum and Pot Holes State Parks and Moses Lake
By having an inventory of the existing recreation experiences in the area (ie the current supply) and having information about the type and amount of recreation visitation (ie current demand) decisionmakers are better able to understand current demand and to estimate future demand for new water storage or diversion options The information from the WROS inventory can be very useful in developing future development and management alternatives including different packages of appropriate recreation activities facilities infrastructure programs and regulations
Table 9 displays the current supply of water-based recreation opportunities in the Yakima River basin study area across the six WROS classes For the nine comparable lakes and six comparable rivers the number of ldquowater surface acresrdquo and ldquoriver milesrdquo by WROS class is presented respectively The percentage distribution of total water surface acres and river miles by WROS class is also presented Maps for each comparable that depict the location of each WROS class are included in appendix F
A total of 36235 water surface acres and 413 miles of rivers were included in the Level I WROS inventory conducted in this project The inventory indicates that the current supply of water recreation opportunities is primarily rural developed and rural natural
Over half (533 percent) of the water surface acreage on the comparable lakes are providing rural developed recreation opportunities followed by rural natural (373 percent) and suburban (94 percent) None of the lakes provide urban semiprimitive or primitive recreation opportunities
Similarly over half of the river miles (596 percent) are providing rural developed recreation opportunities followed by rural natural (269 percent) and suburban (104 percent) Three percent of the river miles provide urban recreation opportunities None of the river miles provide semiprimitive or primitive recreation opportunities
One driving factor defining these opportunities was the level of development such as major highways (eg Keechelus Moses Lake Yakima River) residential
44
Table 9mdashInventory of the Current Supply of Water Recreation Opportunities Based upon the WROS System
Water Resources Urban Suburban
Rural Developed
Rural Natural
Semi primitive Primitive
LAKES Water surface acres by WROS Class
Keechelus Lake 2360 acres
Kachess Lake 1684 acres 2595 acres
Cle Elum Lake 4478 acres
Lake Easton 205 acres
Rimrock Lake 2351 acres
Bumping Lake 472 acres 849 acres
Clear Lake 231 acres
Moses Lake 3417 acres 2551 acres 760 acres
Potholes Lake 5220 acres 9062 acres
Total water surface acres
3417 acres 19321 acres 13497 acres
( of total) (94) (533) (373)
RIVERS River miles by WROS Class
Yakima River 29 miles 144 miles 30 miles
Columbia River1 13 miles 11 miles 54 miles 42 miles
Bumping River 3 miles 13 miles
Tieton River 1 mile 20 miles
Naches River 3 miles 36 miles 6 miles
Cle Elum River 8 miles
Total river miles 13 miles 43 miles 246 miles 111 miles
( of total) (31) (104) (596) (269) 1 The Columbia River surface acres available for recreation for each of the WROS classes identified in the
inventory are also displayed in the legend on the Columbia River Map in appendix F There are a total of 34050 acres of flat water between Wenatchee and the Tri Cities that are available for recreational purposes
areas (eg Moses Lake Cle Elum Tri-Cities) recreation facilities such as campgrounds and boat launches (eg all lakes Wanapum) and smaller roads paralleling the shoreline (eg Rimrock Columbia River)
A second driving factor was the level of recreation use Washington State Parks reported that for the parks within the project area the annual visitation was slightly greater than 10 percent from 1997 through 2002 that is the annual visitation to State parks increased an average of 2 percent annually over the last 5 years
45
While the annual visitation to each lake within the study area is not measured by the FS interviews were conducted with five district recreation staff Based upon their expert opinion the FS managers indicated that the level of recreation demand is approaching or at capacity (ie 75ndash100 percent of capacity) during the summer weekends and with a few exceptions considerably less during the weekdays and shoulder seasons (ie 25ndash50 percent of capacity) There may also be situations on major holidays or during special events when the level of boating demand (ie the number of boats on the lake at one time) is exceeding the supply of boating opportunities It was also learned from the managers that in their opinion recreation demand has been increasing over recent years (personal communication with recreation staff at the FSrsquos Cle Elum and Naches Ranger Districts 2005)
In summary there are five findings from the WROS analysis
1 The current supply of water recreation opportunities in the Yakima River study area is predominantly rural developed and rural natural
2 There are no semiprimitive or primitive water recreation opportunities and relatively few urban and suburban opportunities
3 The level of recreation demand (ie visitation) continues to increase each year for this current supply of opportunities
4 The current visitation indicates a user preference for rural natural and rural developed opportunities as well as an apparent level of visitor satisfaction supported by finding number 3 above
5 There are times and locations during the peak recreation season when recreation demand approaches or exceeds the recreation capacity or available supply of opportunities
Setting Attribute Considerations Attributes that influence recreation such as water quality and streamflows are important aspects of the existing and future recreation environment Recreation setting or site attributes24 are usually specific to a type of recreation area To adequately satisfy the long-term demand for outdoor recreation managers must supply and properly maintain the natural and manmade site attributes that are important to the recreation users The following discussion concentrates on the public satisfaction levels with certain attributes associated with a particular recreation setting If users are not happy with a particular attribute they are likely to seek alternative sites or substitute activities The following are setting attributes that might contribute to user satisfaction of a site
24 For the purposes of this document an attribute is defined as a site condition users consider important for a quality recreation experience and will result in return visits to the site (eg solitude scenery adequate riverflow or reservoir elevation shower restroom and boat ramp)
46
Fees ndash Fees charged for the use of a site and its facilities should be reasonable and commensurate with the services provided
Carrying Capacity ndash The physical25 social26 environmental27 and facility28 capacities should not be exceeded
Public Information ndash Appropriate information should be provided in the form of brochures pamphlets identification and location of emergency services clear directional signs and up-to-date Web sites which can provide information about the site prior to the visit and the opportunity to make reservations
Access ndash Appropriate public access should be provided to the site or river segment and within the site (eg access for persons with disabilities boat ramps trails parking)
StreamflowsReservoir Levels ndash Appropriate streamflows and reservoir water elevations should be provided for activities within a recreation setting keeping in mind that different activities may require different streamflows and reservoir elevations
Water Quality ndash Appropriate Federal State and local water quality standards should be met The following factors should be monitored to maintain user satisfaction levels (1) hygienic factors such as bacteria (total bacteria fecal coliform bacteria ecoli enterococci) toxic substances etc (2) aesthetic factors such as color turbiditysuspended solids (algae oil and grease content) odor temperature and acidity (ph and alkalinity levels) and (3) indirect factors that stimulate undesirable aquatic plant growth (eg ammonia phosphorus and nitrogen levels) (Reclamation 2002)
Health and Safety ndash The recreation setting should be free of manmade hazards natural hazards should be identified in accordance with all legal requirements and appropriate sanitation facilities should be provided
Facilities ndash The appropriate quantity and types of amenities that complement the recreation setting should be provided For example at an urban or suburban type of setting amenities might include restrooms
25 Physical carrying capacity can be described as the area that is available to a recreation user
for participating in a specific recreation activity 26 Social carrying capacity can be described as the impacts that resource users have on one
another The number type and location of recreation users encountered by other resource users sometimes affect the recreation experience one is seeking to enjoy
27 Environmental or ecological carrying capacity can be described as the impacts that a level of recreation use will have on plants animals soils water air etc
28 Facility carrying capacity can be described as the ability of an existing facility to accommodate the current level of recreation use
47
potable water fire pits picnic tables and shelters electrical hookups telephones camp hosts law enforcement personnel adequate parking and interpretive services In addition facilities should be clean and well maintained
Scenic and Visual Qualities ndash Unique scenic and visual qualities available within a particular recreation setting should be protected to ensure that the public can continue to use and enjoy the surrounding environment and to ensure repeat visitation to the site
Diversity of Opportunities ndash Multiple types of recreation opportunities should be available within the site or immediate vicinity to allow families and groups to participate in a variety of activities during their visit
Table 10 contains examples of additional site attributes that are important to recreational users
The setting attributes mentioned above contribute to user satisfaction with a particular recreation site Maintaining these attributes will increase the quality of the experience for users and result in return visits to the recreation site and increased benefits to local economy Managers should concentrate their time and funding resources on providing attributes that would have high visitor satisfaction In addition as the United States population becomes more ethnically socially and economically diverse recreation managers will have to modify the attributes of many outdoor settings to accommodate new demands and user preferences
Local Carrying Capacity Considerations Carrying capacity is the ability of a recreational resource to support a user population at a measurable threshold based on specific goals and objectives (Pfhister and Frenkel 1974) Carrying capacity will vary with the amount of instream flows in a river or water elevations of a reservoir The volume and velocity of flows as well as the amount of usable water surface acreage of a reservoir are important in sustaining a quality recreation experience over an extended period of time The amounts timing and duration of flows in the river or water elevations at a reservoir needed to conduct a certain type recreation activity differ among the many recreation users Optimum flows or reservoir elevation required for a quality recreation experience for one recreation activity is not necessarily optimum for another (eg optimum flows for river rafting are not necessarily optimum for swimming or fishing) Ideally instream flows and reservoir water elevations could be established that benefit the greatest number of recreation users at any one time while not negatively impacting environmental resources One can assume that bankfull flows and reservoir full pools would benefit most of the water-related recreation activities Following are some observations dealing with social physical environmental and facility types of carrying capacities as described earlier
48
Table 10mdashPercent of Population over the Age of 15 Indicating the Importance of Recreation Site Attributes as They Contribute to Making the Site an Ideal
Recreation Setting by Level of Importance and by the FS RPA Region 1994ndash95 Site Attribute and
Level of Importance Pacific Coast Region
Nearness to Home Not important 129
Moderately important 489 Very to extremely important 382 Good Roads and Parking at the Area
Not important 63 Moderately important 379 Very to extremely important 557
Cleanliness of Restrooms Facilities and Grounds at the Area Not important 16
Moderately important 213 Very to extremely important 772 Helpfulness of Area Employees
Not important 56 Moderately important 391 Very to extremely important 553
Safety and Security at the Area Not important 31
Moderately important 221 Very to extremely important 747
Quality of Scenery at the Recreation Area Not important 11
Moderately important 223 Very to extremely important 766
Reasonable Fees for Use of the Area Not important 35
Moderately important 324 Very to extremely important 641
Map Informational Signs and Bulletin Boards at the Area Not important 56
Moderately important 405 Very to extremely important 539
Opportunity to Bring Pets into the Area Not important 446
Moderately important 327 Very to extremely important 226
Source National Survey of Recreation and the Environment FS 1994-95
49
Social carrying capacity differs among users and depends on the type of experience being sought and the tolerance of the individuals or groups using the resource Flows in the river system and water elevations in a reservoir may affect the social carrying capacity of that water body If the usable surface acres of a river or reservoir increase the ability of the recreationists to tolerate the presence of another user also increases Likewise if usable surface acres are decreased the water body will not socially accommodate as many recreation users If use increases over time and the river and reservoir acres remain constant the river and reservoir will eventually reach its social capacity limit (ie recreationists will not tolerate the sights and sounds of other users)
Physical carrying capacity of a water body can be increased or decreased by regulating flows that pass through the system (ie the usable acres available to a recreation user to participate in a specific activity can be increased or decreased by regulating the volume of water released into the system)
Environmental carrying capacity limits can be affected by the volume of water in a river or a reservoir and the timing of water releases into or out of the system High volumes of water or in some instances low volumes may negatively affect fish habitat and waterfowl nesting areas High streamflows or reservoir elevations combined with excessive bank fishing over extended periods of time may cause unnecessary bank erosion In addition recreation activities may affect fish and wildlife in a variety of ways such as disruption of waterfowl nesting and feeding areas alteration of waterfowl flight patterns destruction of aquatic vegetation and increased pollution from boat motors and human litter and waste
Facility carrying capacity can be affected by increasing streamflows or reservoir water elevations (eg if streamflows were optimized to enhance boating activities over extended periods of time existing use of limited launch sites and support facilities may increase This may cause overuse and deterioration of existing facilities
Water Quantity Considerations As discussed earlier adequate streamflows and water reservoir elevations are setting attributes that can determine user satisfaction with a particular recreation site Sufficient streamflows and water elevations increase the quality of the experience for users participating in water-based recreation activities Different recreation activities require different flows within different river segments and different reservoir water elevations (eg it is important to manage river segments according to streamflows access points types of use and physiography of the river)
50
The quality of the recreation experience for most activities will be affected by streamflows and reservoir water elevations that are available during the different types of water years (ie wet average or dry) As an example under existing conditions the quality of a rafting experience and the months available to the users to achieve that experience in a wet year may be greater for the entire recreation season than in an average or dry year If seasonal instream flows and reservoir elevations are greater than historic conditions the opportunities for achieving a favorable recreation experience may be enhanced
Under normal circumstances if flows and reservoir elevations are maintained at a level that typically represents bankfull flows and reservoir full pools throughout the summer recreation season the majority of water-based recreation activities will be enhanced Maintaining consistent flows and reservoir elevations will increase the quality of the recreation experience for most users The quality of the recreation experience will be impacted the most during dry and severely dry water years
Recreation Water Quality Considerations As discussed earlier water quality can be considered a recreation setting attribute that can be used to measure user satisfaction within a particular site Water-based recreation activities such as swimming are directly impacted by water quality and should not be permitted if public health standards are not maintained Water-related activities such as camping hiking bicycling etc are indirectly impacted by water quality and are usually discussed in terms of visual effects such as algae growth and clarity or the impact of odors encountered by a user
Monitoring for water quality is an important aspect for long-term management of water resources Often recreationists do not know there is a water quality problem until it has degraded to a point that an area is closed to the public At that point user satisfaction with the site declines and visitation decreases Unless efforts are immediately initiated to correct the problem and those efforts routinely reported to the public the public will have a tendency to avoid the site Closing a recreation area because of poor water quality conditions can be avoided by initiating a water quality monitoring program
Following are the water quality factors that should be monitored
Hygienic factors such as bacteria (total bacteria fecal coliform bacteria ecoli enterococci) toxic substances etc
Aesthetic factors such as color turbiditysuspended solids (algae oil and grease content) odor temperature and acidity (ph and alkalinity levels)
Indirect factors that stimulate undesirable aquatic plant growth (eg ammonia phosphorus and nitrogen levels)
51
Projections of Recreation Demand and User Preference Yakima River basin rivers and reservoirs continue to be important to residents and nonresidents who participate in water-based recreational activities Water resource managers need to consider future recreation trends and how these trends might influence future demand for creation of new or different types of water-based outdoor recreation facilities and opportunities Decisionmakers also need to understand the different attributes that make a particular recreation site appealing to a recreation user Streamflows water surface elevations capacity limitations and water quality are some of the most important attributes that can contribute to a userrsquos satisfaction of a water recreation site
The primary purpose of this Recreation Demand and User Preference Analysis was to estimate the future outdoor recreation demand and user preference for the Yakima River basin to assist Reclamation and its partners in determining viable recreation strategies within the alternatives that may be contemplated in the Storage Study Based upon a Level 1 analysis (eg based upon existing information and expert opinion) this section identifies those key factors that the investigators believe will significantly influence future recreation demand and user preference in the Yakima River basin Table 11 (shown later in this report) provides a set of estimates for the projected percentage change in recreation participation over the 20 years from 2005 through 2025
Key Factors Influencing Future Projections
This report identifies many factors that will influence the future recreation demand and user preferences in the Yakima River basin Those deemed most significant are listed here
Regional State and local area population growth will continue at a 15- to 25-percent annual increase The increase in population within the prime recreation market area of the Yakima River basin (ie Washington Oregon Idaho British Columbia and California) will be greater than national averages and ensure continued increases in outdoor recreation participation on public lands and waters
Hispanic and Asian populations in the basin will continue to grow much faster than non-Hispanicwhite populations Participation in outdoor recreation by these populations will also increase faster than non-Hispanic white populations
Senior populations will continue to grow in the basin given the arearsquos climate roads services agricultural and open space setting and outdoor recreation opportunities Senior populations have above average leisure
52
time and discretionary income and thus will help to increase local recreation participation Seniors will increase the demand for recreation settings with comforts security and conveniences
Tourism development and visitation will grow significantly in the Yakima River basin (ie nature-based agricultural-based historical- and cultural-based tourism) The popularity and recognition of the Yakima River basin as an attractive destination will significantly increase among Pacific Northwest and national travelers
The arearsquos reputation for blue-ribbon river fishing summer and winter off-highway vehicle use and special land use designations such as Wild and Scenic Rivers State and national parks and scenic byways will significantly help to increase public awareness and the popularity of the area
Nonconsumptive wildlife activities such as birdwatching photography and other types of wildlife viewing are projected to increase
Developed land activities such as camping family gatherings visiting historical places and sightseeing are expected to grow faster than the population
Although water-related activities and length of stay are projected to increase primary purpose trips are expected to decrease
The current supply of rural developed and rural natural recreation opportunities will continue to have increased visitation Increased visitation and a greater variety of recreation activities being accommodated at any one location will tend to reduce the percent of rural natural recreation opportunities in the basin and increase the rural developed recreation opportunities in some instances this will lead to a more suburban type setting
The current supply of recreation facilities (eg campgrounds marinas launches) is not expected to increase in number to any extent nor will the projected State and Federal budgets be sufficient to maintain the quality of the current recreation facilities That is it is likely that the current supply of public recreation and facilities will continue to age and decline in condition
National regional State and local participation rates in outdoor recreation will continue to increase among all ages income and ethnic groups State park visitation in eastern Washington has witnessed a 2-percent annual increase on average from 2000 to 2005
Energy costs will influence people to take fewer trips travel fewer miles from home and to stay longer at prime destinations Given the population
53
base within the recreation market area for the Yakima River basin energy costs would not be expected to decrease visitation and actually may well increase visitation by encouraging the Pacific Northwest travelers to stay within the region and not travel beyond (ie may reduce recreational leakage both in terms of participation and economics)
Water resources will continue to be a prime attraction for day-use and overnight outdoor recreation participants People will continue to seek opportunities to enjoy the outdoors and to experience a natural setting in contrast to their daily work and living environs
Projected Recreation Demand for Key Activities
There is no formula or way to scientifically determine with a high level of certainty the future of any human endeavor including the future of recreation demand and preference Thus based upon a 6-month Level 1 analysis of the Yakima River basin with due consideration of (1) the existing available information (2) the WROS inventory of comparables and (3) informal interviews with local experts the investigators used sound professional judgment to estimate future recreation demand
Table 11 includes a low and high range of projections for the key outdoor recreation activities in the Yakima River basin
In terms of the recreation settings that these activities will take place in it is projected that the diversity or spectrum of recreation opportunities will be reduced over the next 20 years That is it is projected that the amount of water surface acres and river miles providing rural natural recreation opportunities in the Yakima River basin will decrease in the future and shift to suburban and rural developed recreation settings The likely causes of this change will include increased population growth increased urbanization and development increased visitation causing occasional crowding and conflicts and the lack of coordinated interagency regional recreation planning and management
This evolution of the water resources in the Yakima River basin from being rural natural to rural developed and suburban is not necessarily negative or undesirable but should be planned for and the impact should be carefully examined This change will be attractive to some people and not attractive to others For example many recreationists traveling from the Puget Sound area likely want to ldquoget awayrdquo and visit a rural natural or even semiprimitive setting so the loss of rural natural recreation opportunities will displace these visitors to another area outside the basin Conversely some local people might prefer the more developed recreation settings and participate more
54
Table 11mdashProjected Percentage Change in Recreation Participation for the 20-Year Period from the Base Year of 2005 Through 20251
Key Activities in the Yakima River basin
Low-Range Estimate of the Percentage Change
in Participation over 20 years
High-Range Estimate of the Percentage Change
in Participation over 20 years
Picnicking +20 +30
Walking for pleasureday hiking +25 +35
Rusticprimitive camping +10 +15
Developedfull-service camping +20 +30
Fishing +5 +15
Bicycle riding +25 +30
Motorboating +20 +25
Beach swimming +20 +30
Raftingkayaking +25 +35
Sailing +30 +40
Waterfowl hunting -10 -20
Wildlife viewing +35 +50
Personal water craft +10 +20
Water skiing +5 +10 1 The predominant factors influencing the estimated 20-year recreation projections for the
Yakima River basin included popular growth increase in the number of retirees and Hispanic families the national reputation of a blue-ribbon fishery increasing residential development and metro commuters from the Puget Sound area and a developing tourism industry in the basin which will attract tourists and recreationists from Washington and the surrounding States
In the case of waterfowl hunting in addition to the factors mentioned above the increase in development urbanization and loss of waterfowl habitat will also contribute to a decline in waterfowl hunting participation
Projections of the net effect of these changes in the recreation settings on visitation travel patterns and the tourism economy are beyond the scope of this analysis but suffice it to say that a change in recreation settings will change the level of recreation demand and the clientele who are attracted to the basin
In conclusion it is reasonable to project a 2- to 3-percent average annual increase in outdoor recreation demand for the Yakima River basin over the next 20 years due to a variety of factors discussed earlier Of course the amount of growth will vary by key activities popular in the basin For example the projected change in participation may range from a 35-percent increase in walking for pleasurehiking to a 20-percent reduction in waterfowl hunting It is also projected that the water resources will become more developed and urbanized in the next 20 years and that there will be a shift in the supply and amount of recreation opportunities from
55
rural natural to rural developed and suburban This shift is likely to have a longer-term effect (ie beyond 20 years) on the recreation demand and the clientele who are attracted to the basin
Federal county and city governments need to cooperate in providing the appropriate number and types of recreation facilities and opportunities to meet future recreation demand in the Yakima River basin A particular recreation site or area cannot be all things to all people Decisionmakers should cooperate in providing a wide variety of recreational opportunities on a regionwide basis Increased dialog among water users a broader societal perspective among decisionmakers and more flexible and creative river and lake operations can result in major improvements to the recreation environment within the Yakima River basin without abandoning existing water resource purposes
56
References Cited Betz CJ et al 2003 As cited in US Department on Agricultural
lthttpwwwsrsfsusdagovpubsabstractviewpubjspgt
Bureau of Reclamation 1998 Office of Program and Policy Services Denver Colorado Recreation Challenges of the 21st Century
_______ Recreation Management Condition Assessment 2002 Clark Canyon Reservoir and Barretts Diversion Dam Pick-Sloan Missouri Basin Project
Cooper R 2005 Local fly fisher (personal communication) June 9 2005
Cordell KH and JC Bergstrom 1993 ldquoComparison of Recreation Use Values Among Alternative Reservoir Water Level Management Scenariosrdquo Water Resources Research Vol 29 No 2 pp 247-258
Cordell KH et al 2004 Outdoor Recreation for the 21st Century America A Report to the Nation The National Survey on Recreation and the Environment
Fairfield G 2005 Local fly fisher and business man (personal communication) June 8 2005
Greater Yakima Chamber of Commerce 2003 Facts Folder Yakima Washington
Haas G R Aukerman V Lovejoy D Welch 2004 Water Recreation Opportunity Spectrum (WROS) Userrsquos Guidebook Bureau of Reclamation Office of Program and Policy Services Denver Colorado
Hall TE and L Kruger 2004 (Draft) Understanding Recreation Trends in the Pacific Northwest State of Knowledge and Managerrsquos Needs November 29 University of Idaho Moscow Idaho
Hof JG and HF Kaiser 1983 ldquoLong-term Outdoor Recreation Participation Projections for Public Land Management Agenciesrdquo Journal of Leisure Research 15(1) 1-14 as cited in US Department of Agriculture 2003 lthttpwwwsrsfsusdagovpubsabstractviewpubjspgt
Interagency Committee for Outdoor Recreation Washington Outdoors Assessment and Policy Plan 1990ndash1995
______ 2003 Estimates of Future Participation in Outdoor Recreation in the State of Washington An Addendum to the State Comprehensive Outdoor Recreation Plan 2002ndash2005
57
Johnson KL and CJ Beale 1994 ldquoThe Recent Revival of Widespread Population Growth in Non-metropolitan Areas of the United States 1980ndash 1990rdquo Rural Sociology 59(94)655-667
LaGrassa G 1991 ldquoTempest at Glen Canyon a Case Study of Conflicts Involving Hydropowerrdquo Independent Energy Vol 21 No 1 pp 42-47
National Recreation Lakes Study Commission 1999 Reservoirs of Opportunity
Novitsky P 2005 US Forest Service Cle Elum Ranger District (personal communication) June 9 2005
Piper S and J Platt 2002 The Influence of Water Quality on Recreation Use and Economic Benefits
Recreation Roundtable 2000 ldquoOutdoor Recreation in America 1999rdquo The family and the environment Prepared for the Recreation Roundtable Washington DC as cited in US Department of Agriculture 2003 lthttpwwwsrsfsusdagovpubsabstractviewpubjspgt
Rowan M and staff 2005 US Forest Service Naches Ranger District (personal communication) June 10 2005
State of Washington 2001 Washington State Data Book County Profiles and Recreation Sections ltwwwofmwagovdatabook gt
Snyder D 2005 Local fly fisher (personal communication) June 9 2005
Tarrant MA E Smith and KH Cordell 1999 Recreation visitor preferences for and perceptions of outdoor recreation setting attributes Overview of visitor satisfactions with and preferences for attributes of outdoor recreation settings US Forest Service Southern Research Station as cited by US Department of Agriculture 2003 lthttpwwwsrsfsusdagovpubsabstractviewpubjspgt
Teasly RJ JC Bergstrom KH Cordell 1999 Private lands and outdoor recreation in the United States A national assessment of demand and supply trends US Forest Service Southern Research Station as cited in US Department of Agriculture 2003 lthttpwwwsrsfsusdagovpubsabstractviewpubjspgt
US Census Bureau 2000 State of Washington Profile US Department of Commerce
US Department of Agriculture US Forest Service 1994ndash95 National Survey of Recreation and the Environment
_______ 1999 CJ Betz D English DBK English and KH Cordell Southern Research Station Outdoor Recreation Resources Examination of recreation resources and opportunities by the four types of providers
58
_______ 2000 Forest Service RPA Assessment as cited in Colorado State Comprehensive Outdoor Recreation Plan 2003
_______ 2005 Forest and Rangeland Renewable Resources Assessment Report No 4 November 2004 Hispanic Participation in Land-based Outdoor Recreation Activities
_______ 2005 Forest and Rangeland Renewable Resources Assessment Recreation Statistics Update Report No 1
US Department of Agriculture US Forest Service and University of Tennessee Knoxville Tennessee 2000 National Survey on the Recreation and Environment Americarsquos Participation in Outdoor Recreation
US Department of Agriculture US Forest Service National Survey on the Recreation and Environment 2000 Americarsquos Participation in Outdoor Recreation ltwwwsrsfsusdagovtrendsfsch4pdfgt August 8 2005
US Fish and Wildlife Service 2001 National S urvey of Fishing Hunting and Wildlife Associated Recreation
Washington State Comprehensive Outdoor Recreation Plan 2002ndash2005 An Assessment of Outdoor Recreation in Washington State
Yakima Parks and Recreation 2000 Under Construction Blue Prints for the Future Yakima Parks and Recreation Five-Year Comprehensive Plan 2000ndash2005 Yakima Washington
59
Appendix A
WROS Executive Summary
Water Recreation Opportunity Spectrum (WROS)
Diversity is an asset in America From our work forces and financial portfolios to our natural resources and recreation opportunities there is strength in conserving diversity
Half a century ago when people said they were going camping fishing or boating it was clear what they intended Today due to many factors such as new technology and equipment more facilities and diverse public tastes and preferences there are many types of camping fishing and boating The outdoor recreation industry and profession have become much more complex and sophisticated
Research has shown that recreationists not only seek to participate in recreation activities but also seek specific recreation settings in order to enjoy a special kind of recreation experience and subsequent benefits These four components (ie activities settings experience benefits) constitute a recreation opportunity that is the opportunity for a person to participate in a particular recreation activity in a specific setting in order to enjoy a particular recreation experience and the benefits this affords For example one family might desire camping in a modern full service campground on a reservoir in order to spend quality time with the family to rest and relax and to see naturersquos beauty Another family might desire camping in a rural location where they can test their fishing skills enjoy solitude and see naturersquos beauty Both families want to go camping but in very different settings leading to different kinds of experiences and benefits that is they are seeking different kinds of recreation opportunities
A-1
Recreation + Setting = Experience gtgtgt Benefits Activity many activities physical attributes many dimensions individual
managerial attributes multiple senses community social attributes economic
environmental Managers Manage Recreationists Society Gains
Consume
The preceding insert depicts the linkage of the four components that define a recreation opportunity It also conveys that a manager manages recreation activities and settings while a recreationist consumes a recreation experience and society benefits from an active outdoor public
The Water Recreation Opportunity Spectrum (WROS) is a tool to understand the type and location of six types of water related recreation opportunities otherwise known as WROS classes The six WROS classes range across a spectrum of Urban Suburban Rural Developed Rural Natural Semiprimitive and Primitive classes Each WROS class is defined by a particular ldquopackagerdquo of activities setting attributes experiences and benefits
WROS enables the six recreation opportunity classes to be inventoried and mapped by using ex pert opinion and an inventory protocol to assess the physical managerial and social attributes of the setting The attributes that differentiate the WROS classes include
Physical attributes Managerial attributes Social attributes
Degree of development Degree of management presence
Degree of visitor presence
Sense of closeness to Degree of public access Degree of urban setting facilities nonrecreational use Degree of resource Degree of developed Degree of visitor modification recreation facilities concentration Distance to development on or adjacent to a water resource
Degree of visitor services and conveniences
Degree of diverse recreation activities
Degree of natural Degree of visitor ambiance comforts Degree of
solituderemoteness WROS is also adaptive and flexible For example WROS allows for special local attributes to be considered in the inventory stage or for a manager to divide the WROS classes into subclasses or units
The overarching goal of WROS is to provide planners and managers with a framework and procedure for making better decisions for conserving a spectrum of high quality and diverse water recreation opportunities WROS improves our understanding of the complexity of outdoor recreation management strengthens sound professional judgment and enables a manager to make better and more defensible decisions
A-2
WROS is an indispensable tool for inventorying planning and managing water resources where recreation is an important public use and benefits the local communities More specifically WROS is valuable for
Inventorying and mapping the current available recreation opportunities Helping tourists and recreationists choose where to recreate
Assessing the effects of proposed land use and water management changes
Improving public input and communication with stakeholders
Improving management efficiency and effectiveness
Improving regional interagency collaboration
Improving the defensibility of management decisions
This Usersrsquo Guidebook provides the operational details for applying WROS It is divided into four chapters Chapter 1 Introduction provides a foundation and overview of WROS and discusses the important standards for WROS decision making Chapter 2 WROS Inventory presents the steps and information needed to inventory a water resource and map the type and location of current WROS classes Chapter 3 WROS Planning discusses how WROS integrates with and supplements the key steps of a public resource planning process Chapter 4 WROS Management provides a set of guidelines for each of the six WROS classes across more than 115 setting attributes
A-3
Appendix B
Black Rock Dam and Reservoir Recreation Needs Assessment
Note The visitation use figures for this appendix are primarily from 2002 They have not been updated for inclusion into this 2006 Recreation Demand and User Preference Analysis
Black Rock Dam and Reservoir Recreation Needs Assessment1
Introduction
Black Rock dam and reservoir is one alternative to try to meet the goals of the Yakima River Basin Water Storage Feasibility Study Those goals are to improve anadromous fish habitat improve the water supply for proratable irrigation water rights in dry years and meet future municipal water supply needs Black Rock dam and reservoir would provide storage of Columbia River water until delivering the water to the irrigators in the lower Yakima Valley to the west The water currently diverted by these irrigators from the Yakima River would remain in the river to be used to improve the fish habitat in the river and reservoirs supply water to all the proratable irrigators in the Yakima River basin and supply future municipal water needs While storing this Columbia River water there would be opportunities for recreation Those opportunities could be boating swimming fishing camping and other activities as identified as needed through further investigation
The location of the potential Black Rock dam and reservoir is in the Black Rock Valley near the intersection of State Highways 24 and 241 about 30 miles east of Yakima Washington The active storage capacity is 1300000 acre-feet with a maximum water depth of about 500 feet at the face of the dam This storage capacity is more than the existing storage in the Yakima Project (table 1) At more than four times the capacity of the largest existing reservoir in the project the Black Rock reservoir would provide a surface area of about 8640 acres (about 9 miles long and 1 mile wide) with about 30 miles of shoreline and has the potential to provide recreation benefits Flat water boating fishing camping personal watercraft use and water skiing opportunities could be provided
Affected Region (Washington Counties) The purpose of this recreation needs assessment is to examine the recreation potential and need for additional recreational opportunities at the potential Black Rock reservoir The affected area for recreation is the four-county region of Benton Grant Kittitas and Yakima Counties This contiguous region contains most of the nearby flat water lakes and reservoirs that are likely to be substitutecompetition recreation sites for a reservoir in Black Rock Valley In addition the economies of these counties would be the ones most affected by any increased recreation visitation due to Black Rock
1 The primary author of the Black Rock Dam and Reservoir Recreation Needs Assessment was Rich Lichtkoppler Economist Bureau of Reclamation Technical Service Center Denver Colorado
B-1
Table 1mdashYakima Project Storage Capacity and Surface Area
Reservoir Storage Active Capacity
(acre-feet) Water Surface Area1
(acres) Cle Elum Kachess Keechelus Bumping Lake Rimrock Subtotal Black Rock Grand total
436900 239000 157800 33700
198000 1065400
21700000 2765400
4750 6535 2560 1300 2790
17935 9620
27555 1 Water surface area varies with the drawdown of water for irrigation
Source Bureau of Reclamation
2 In the feasibility planning stage only No decision has been made to develop this potential reservoir
Outdoor Recreation Needs
Conceptually recreation needs for an area are determined by examining the demand for recreation expressed in visitor days water surface area or some other measure in comparison to the supply of recreation similarly expressed Any excess demand over supply establishes a need If existing recreation sites are underutilized the current and future needs may be partially or wholly met from those sites On the other hand if existing sites are at or near full capacity then excess demand must be met by development of a new site with infrastructure to accommodate recreation use
An arearsquos excess demand establishes the ldquoceilingrdquo for benefits that can be claimed for a potential new project If projected visitation at a new site is less than or equal to the arearsquos need then the entire amount of visitation is benefit producing If the projected visitation is greater than the established need (excess demand) then the new site will be drawing visitors from other substitute sites Displacement from one site to another does not contribute to net increases in recreation or benefits
Because of budget constraints the State of Washington no longer is able to develop a State Comprehensive Outdoor Recreation Plan that provides a Demand - Supply = Needs analysis at the county or planning district level of detail (Interagency Committee for Outdoor Recreation October 2002) Their most recent effort concentrated on examining recreation participation at the State level Thus they identified current use and projected expected future patterns of recreational behavior rather than probing for recreational preferences that could be utilized to identify actual needs
People tend to use the recreation facilities and opportunities that are available to them although these choices may not necessarily reflect actual preferences In any case the Washington State Interagency Committee for Outdoor Recreation
B-2
expects motorboating to grow by 10 percent Statewide over the next 10 years (2003-2013)mdashonly about a 1-percent increase per year2 After that the demand for motorboating is expected to level off or decline during the following 10 years Hand-powered boating (canoes kayaks row boats etc) nonpool swimming and visiting beaches are water-dependent activities that are each expected to grow by about 20 percent during the next 10 years and then achieve a total growth rate of 30 percent over 20 years for each of these activities Unfortunately these are Statewide projections and are not specific to the four-county affected area under consideration here However it is assumed that this level of increased demand is similar for the four-county affected area and that increasing the supply of flat water recreational opportunities would result in some positive benefits Use of the Statewide projection is further supportable because the arearsquos current recreation sites draw visitors from across the State
Development of Black Rock dam and reservoir with recreation as an expected benefit would certainly add to the supply of flat water available for recreation in the region It may be a case of ndash if you build it they will come Informal anecdotal evidence gathered from recreation managers in the region suggests that this statement is true Agreement on whether a new reservoir is actually needed for recreation is mixed While some State wildlife refuges are reported as being under-utilized for recreation US Forest Service sites and Washington State Parks seem to be busy or near capacity for most of the summer season Recreation manager estimates of the proportion of visitors that come from outside the local region range from 40 percent to 90 percent with visitors coming from both eastern and western Washington
However the total amount of use of the potential reservoir that would represent new visitors to the region coming from outside the region is unknown at this time Thus the expected contribution to regional economic development is also unknown It is likely that if the Black Rock reservoir is built and recreation facilities are developed then some of the visitor use would be at the expense of other substitute water-oriented recreation sites within the four-county region People may seek to avoid more crowded areas and come to Black Rock reservoir The total amount of recreation use may or may not change but it is expected that a quality improvement (less crowding at least initially) would occur It is also expected that development of the recreation potential of Black Rock would contribute some positive amount of benefits to a national economic development account analysis But again some amount of the recreation benefits would probably be due to substitution effects and come at the expense of other recreation sites so that the net increase is hard to quantify without more thorough analysis
Another point to consider in estimating recreation benefits is that the potential Black Rock reservoir and probably any reservoirs contemplated in any of the storage study alternatives will be operated at least in part for irrigation demands This means that the reservoir would be drawn down many feet during the warm
2 Interagency Committee for Outdoor Recreation March 2003
B-3
summer months and such drawdowns would significantly reduce both the area and volume of water available for recreation Mudflats could be exposed and the waterrsquos edge could be far from the high water level of the reservoir Recreational facilities could end up a long way from the water reducing visitor access and desirability for recreation at this reservoir
Recreation Supply Recreation Resource Inventory (Flat Water) Alternative Sites Public sector recreation sites facilities and services are enumerated in attachment 1 More than 210 water access sites have been identified as providing public right of entry to more than 50 water bodies within or bordering the four-county area Most are managed by public agencies at the local State and national levels of government The water bodies range from small lakes and ponds consisting of a few tens of acres to large reservoirs providing tens of thousands of acres of water surface for recreation The access sites in attachment 1 offer a range of facilities and amenities but the item they all have in common is that there is a boat launching ramp providing recreational access to the water for the public Included in this supply are many of the miles of rivers reservoirs and streams that makeup the Yakima River and parts of the Columbia River watersheds In addition there is a large number of other water-oriented recreational areas throughout Washington and bordering Oregon Thus the Statewide supply is much greater than what is enumerated in attachment 1
Federal providers of recreation sites include the Bureau of Land Management (BLM) the US Army Corps of Engineers (Corps) the US Forest Service (FS) and the US Fish and Wildlife Service (Service) Washington State has by far the largest number and most widely distributed access points with the Washington State Parks providing seven parks and the Washington Department of Fish and Wildlife (WDFW) managing 85 sites Most of the WDFW sites primarily provide access for hunting and fishing via small boat (motor powered or not) on small 20- to 40-acre ponds but some sites can also be used for nonconsumptive motorboat based recreation Local county or municipal governments provided some additional access points and a few private sites open to the public on a paying basis account for the remainder of publicly available water access points in the four-county region No attempt has been made to identify other private sector sites facilities and services because these resources are generally not available to the public or provide private access to water areas also served by public facilities
B-4
Bureau of Reclamation Developed Areas Providing Recreation Opportunities Most of the reservoirs developed by Bureau of Reclamation (Reclamation) provide recreation benefits by offering recreational opportunities for a wide range of water-oriented activities Boating camping fishing hiking hunting picnicking photography water sports wildlife watching and more are available at these reservoirs But since these reservoirs are primarily operated by Reclamation to meet irrigation and power generation responsibilities lower water levels and restricted flows sometimes negatively affect recreational use of some reservoirs and streams Reclamationrsquos main areas of expertise include water management for irrigated agriculture and hydroelectric power generation Reclamation manages very few of its reservoirs for recreation Reclamation is encouraged by law to collaborate with nongovernmental entities to manage its recreation resources In partnership situations Reclamation can provide 50ndash 50 percent cost sharing for planning construction management operation and maintenance of recreation facilities and areas Partnerships with other government agencies can provide the expertise and experience in park and outdoor recreation management necessary to provide quality recreation opportunities The FS and WDFW are the primary agencies managing recreation at Reclamation developed areas Table 2 lists the main Reclamation developed areas that provide recreation opportunities in the four-county region
Banks Lake is a part of the Columbia Basin Project located in northern Grant County The Ice-Age channel (Grand Coulee) of the Columbia River was dammed at both ends and water from the Columbia River was pumped up to fill this reservoir This reservoir provides water for irrigation power generation recreation and fish and wildlife Banks Lake is well known for its fishery which is a popular recreational attraction The reservoir is 27 miles long and has about 27000 acres of water surface Fishing boating and camping are popular activities among the many available at this reservoir Steamboat Rock State Park is located on the lake Additional access is provided by the WDFW (parking and boat ramps) Coulee City (campground and marina) and a couple of private marinas Currently an environmental impact statement examining re-operation of Banks Lake to provide additional water flows to support endangered fish in the Columbia River is being completed by Reclamation A lowering of the operational range of the reservoir may affect some boating access sites but recreational use of the lake would continue
Bumping Lake is a 1300-acre water feature of the Yakima Project located in northwest Yakima County This reservoir was formed by the development of Bumping Lake Dam which is owned and operated by Reclamation Recreational opportunities include boating camping fishing hunting picnicking etc The lake is within the Naches Ranger District of the Wenatchee National Forest Recreation resources are managed by the FS Visitor use data for 2002 show that the boat launch received 2984 visits and the associated campgrounds in the area received 7723 visits In addition incidental monitoring in conjunction with
B-5
Table 2mdashBureau of Reclamation Developed Areas with Recreation Facilities Reservoir
Recreation Area Location Water
Surface Acres Managing Agency Reclamation
Project
WDFW and Washington State Parks Coulee City and Columbia
Banks Lake Grant County 27000 Private Firms
FS Wenatchee National
Basin
Bumping Lake Yakima County 1300 Forest
WDFW and Washington State
Yakima
Columbia Billy Clapp Lake Grant County 1010 Parks
Bureau of Reclamation Upper
Basin
Clear Lake Yakima County 260 Columbia Area Office
FS Wenatchee National
Yakima
Cle Elum Lake
Desert Wildlife
Kittitas County 4750 Forest Yakima
Columbia Area1
Easton Diversion
Grant County 235100 WDFW
Washington State Parks Lake
Basin
Dam
Franklin D
Kittitas County
Grant Douglas Ferry Lincoln
240 Easton State Park Yakima
Columbia Roosevelt Lake Okanogan Stevens 60000 National Park Service
FS Wenatchee National
Basin
Kachess Lake Kittitas County 6535 Forest
FS Wenatchee National
Yakima
Keechelus Lake
Potholes
Kittitas County 2560 Forest Yakima
Columbia Reservoir
Quincy Wildlife
Grant County 27800 WDFW Basin
Columbia Area3 Grant County 4 WDFW
FS Wenatchee National
Basin
Rimrock Lake
Roza Diversion
Kittitas County 2790 Forest Yakima
Dam Kittitas County 100 BLM Yakima 1 Includes Winchester Reservoir Winchester Waterway Frenchman Hills Wasteway and several small
ponds and marshes 2 = total land and water area 3 Includes Evergreen Reservoir and Babcock Ridge Burke Quincy and Stan Coffin Lakes 4 = not available
Source Reclamation
regular maintenance activities indicates that considerable numbers of visitors use the lake for day-use activities such as picnicking There is no registration or fees collected for these activities so data regarding actual visitor use are not available
Billy Clapp Lake was formed behind Pinto Dam and serves as a 6-mile-long segment of the Main Canal delivering water for irrigation to portions of the Columbia Basin Project Lands around this lake are included in a wildlife reserve
B-6
program ndash the Stratford Game Reserve The WDFW provides a boat ramp at the south end of the lake Boating fishing and hunting opportunities are available here The lake covers approximately 1010 acres and adding accompanying lands makes the total reserve 4000 acres This and other wildlife areas within the Columbia Basin are an important part of the Pacific Flyway providing feeding and breeding grounds for migrating waterfowl
Clear Lake is located on the North Fork of the Tieton River in northwest Yakima County This lake is part of the Yakima Project and is within the Naches Ranger District of Wenatchee National Forest This FS district office manages recreation Clear Lake covers 260 acres and drains into the Rimrock Reservoir Safety concerns required the draining of the lake in 1990 Public support for the recreation value of this lake resulted in the rebuilding of the dam This lake is now primarily used for recreation (boating and camping) with most of the discharge going over the spillway The Clear Lake boat launch accounted for 2920 visits and the campground produced 8589 visits in 2002
Cle Elum Lake is also part of the Yakima Project and also within the Wenatchee National Forest but it is in the Cle Elum Ranger District The lake is on the Cle Elum River which drains into the Yakima River The lake provides approximately 4750 acres of water surface at full pool Boating camping fishing picnicking and swimming are the primary recreational opportunities available Stream fishing below the dam has improved since the construction of the Cle Elum Dam Recreation is managed by the FS out of its Cle Elum Ranger District Office
Desert Wildlife Area is a 35100-acre area of desert uplands with shrub steppe vegetation and wetlands with marsh vegetation found west of the Potholes Reservoir This natural basin was a desert prior to the development of the Columbia Basin Project The area now collects irrigation wastewater from the project It is an important waterfowl breeding area which also provides good habitat for a wide range of fish mammals and other birds Winchester Reservoir Winchester Wasteway Frenchman Hills Wasteway and many small ponds and marsh areas are part of this area which is managed by the WDFW Boating camping fishing hunting and water sports are the primary recreational opportunities available here
Easton Diversion Dam impounds Lake Easton on the Yakima River Lake Easton State Park is located on this 240-acre reservoir and provides access for boating camping fishing picnicking and water sports This park is easily accessible from I-90 and reported more than 200000 day-use visits and over 30000 overnight visits in 2002
Franklin D Roosevelt Lake was formed by the building of Grand Coulee Dam on the Columbia River This dam is the principal component of the Columbia Basin Project and has created a 60000-acre reservoir with nearly 500 miles of shoreline This vast resource provides a wide range of water-oriented recreational
B-7
opportunities Recreation management of the reservoir is split between the Colville Confederated Tribes the Spokane Tribe of Indians and the National Park Service (NPS) because the reservoir lies partly within two American Indian reservations and lands administered by the NPS This National Recreation Area regularly receives between 10 and 15 million recreation visits annually
Kachess Reservoir and Dam are part of the Yakima Project This reservoir is located on the Kachess River in northwest Kittitas County Kachess Reservoir covers approximately 6535 acres and has 24 miles of shoreline Opportunities for boating fishing hunting picnicking and water sports are available The FS manages recreation out of its Cle Elum District of the Wenatchee National Forest
Keechelus Reservoir is located on the Yakima River at the site of a natural lake in northwest Kittitas County The Keechelus Dam was built at the lower end of this natural lake and it has expanded the water surface to 2560 acres Opportunities for boating fishing hunting picnicking and water sports are available here This recreation resource is also managed by the FS from its Cle Elum District of the Wenatchee National Forest Cle Elum Kachess and Keechelus Reservoirs are all accessible from I-90
Potholes Reservoir was formed by the development of the OrsquoSullivan Dam built on Crab Creek about 15 miles south of Moses Lake The reservoir covers about 27800 acres It is part of the Columbia Basin Project The dam impounds return irrigation flows from the upper portion of the basin for use in irrigating the lower part of the basin The ldquopotholesrdquo were formed during the Pleistocene flooding of the area These potholes are large depressions from 30 to 70 yards wide and 10 to 60 feet deep The building of the OrsquoSullivan Dam raised the water table in the area during the 1950rsquos and filled the depressions creating the pothole lakes Boating camping and fishing are the primary recreational opportunities at this large reservoir Potholes State Park is located on this reservoir and provides facilities for these activities
Quincy Wildlife Area is a 15266-acre land and water area managed by the WDFW It is located in west-central Grant County The area includes Evergreen Reservoir and Burke Quincy Babcock Ridge and Stan Coffin Lakes Boating camping fishing hunting picnicking and water sports are the primary recreational opportunities offered
Rimrock Lake was created in 1925 by the completion of the Tieton Dam on the Tieton River This reservoir provides about 2790 acres of water surface for recreation This Reclamation reservoir is within the Wenatchee National Forest and recreation is managed by the FS out of their Naches Ranger District office
Recreational use of the reservoir was reported as 2444 visits to the Horseshoe Cove and Rimrock boat launches and 12973 visits to the Rimrock Peninsula Area Campgrounds
B-8
Roza Diversion Dam is located in southwest Kittitas County and creates about 100 acres of water surface to divert water from the Yakima River for electric power generation and irrigation as part of Reclamationrsquos Yakima Project This relatively small lake is used for boating camping (five sites limit 7 days) fishing hunting and water sports
The BLM manages recreation on the 100-acre impoundment behind Roza Diversion Dam on the Yakima River This agency does not have the resources to accurately collect and report visitor use Anecdotal evidence indicates that the site is a popular location all summer for fishing and also is a busy take-out point for folks floating the river Regular maintenance and management activities at the site allow BLM personnel to determine that the site is very busy the entire summer season Many visitors are from the Seattle and northwest Washington environs Fishing using drift boats and fishing guides and floating the river are popular activities at this site Visitors can launch their boats at Lmuma Creek and take them out at Roza Dam
The BLM manages two other recreation sites in the Yakima River Canyon in Kittitas County south of Ellensburg ndash Umtanum and Lmuma Creek Each recreation area has a small campground (eight and seven sites respectively) and the camping stay limit is 7 days All three recreation areas support boating camping fishing and picnicking with developed picnic areas and restrooms Lmuma Creek and Roza also provide boat launches
There is a $200 per day fee for the use of the Lmuma Creek and Roza recreation sites There is no charge to use the Umtanum site
Developed Facilities for Recreation
Washington Department of Fish and Wildlife Developed facilities at the 143 WDFW recreation sites vary from site to site within the four-county area (attachment 1) These access points are found on flowing rivers natural lakes and reservoirs so both flowing water and flat water recreation opportunities are available Most sites have at least one boat launch and a parking area The boat launches can range from a natural boat launch (undeveloped) to gravel surfaced to a solid paved type Most sites have only one boat launch but there can be as many as four depending on the site Many sites only provide access to the waterrsquos edge for hunting and fishing or wildlife observation Parking lots may be a simple open area or most commonly a graveled lot Some more developed sites have paved and striped parking areas Usually a vault-type restroom is provided but more primitive locations may not have any restroom facilities Camping is permitted at many recreation sites although there may be a limit to the number of days allowed at a particular location
B-9
Contact with staff in the State office in Olympia revealed that WDFW does not have any methodology in place to count or report on visitor use of their recreation sites They are planning begin to collect this information but a lack of funding and personnel have hampered their efforts Discussions with regional staff confirmed this fact The Region 3 manager stated that a large flat water lake was needed to provide boating and other flat-water based recreational opportunities in his region (includes Benton Kittitas and Yakima Counties)1 The Region 2 manager also stated that his agency does not have the funds or personnel to collect and report visitor use at the many sites and areas in his region
Funds are limited and continued operation and maintenance is the priority He also estimated that his region receives hundreds of thousands of visits each year but this is only a guess on his part2
A vehicle use permit is required to access any of the 625 recreation sites provided and managed by WDFW The permit is good for the calendar year and allows access to the approximately 800000 acres of prime wildlife habitat owned by the State A permit is issued free with the purchase of a hunting or fishing license or available separately for $1000 Funds collected are used to operate and maintain the access sites which are currently operating at a level that represents only 34 percent of the operations and maintenance funding need
Washington State Parks There are seven Washington State Parks in the four-county region that offer flat water recreational opportunities such as motorboating and fishing (table 3) In 2002 visitation ranged from more than 130000 at Sacagawea State Park to over 938000 at Sun Lakes State Park Gingko Potholes Sacagawea and Yakima are the State Parks closest to the location for the potential Black Rock reservoir and are located north northwest southeast and west of the Black Rock reservoir site These four parks had a combined visitation of over 1390000
Ginkgo Petrified Forest State Park (includes Wanapum State Park) is located in eastern Kittitas County on the Columbia River The park encompasses 7470 acres of land and has over 5 miles of shoreline on the Wanapum Reservoir which was formed by the Wanapum Dam constructed on the Columbia River
Boating camping and picnicking are very popular activities at this park Total visitor use has ranged between 500000 to 595000 for the last 3 fiscal years On an annual basis the park has the typical head and shoulders visitation pattern ndash very heavy use in the summer season and light use in the colder months The parkrsquos day-use parking area and boat launching areas will be closed 10 to 15 days
1 Phone communication with Jerry Francisco on 9503 2 Phone communication with Kerry Taylor September 10 2003
B-10
Table 3mdashWashington State Park Visitor Use 2002
State Park 2002 Visitor Use
Gingko Petrified Forest State Park 613098
Lake Easton State Park 233530
Potholes State Park 352105
Sacagawea State Park 132265
Steamboat Rock State Park 352105
Sun Lakes State Park 938093
Yakima Sportsman State Park 295823
Total 2917019 Source Washington State Parks
each year because of exceeding their full capacity3 (Once the parking areas are 100 percent full some additional vehicles will be allowed to park along the road to the parking areas When all this space is taken the park is closed and additional vehicles have to be turned away) There are usually an additional 10 days when the parking areas come close to being 100 percent full The boat launching area (with only two ramps) is scheduled to be expanded in the near future The campgrounds (50 sites with utilities) and day-use parking area are also in need of expansion There is space to accomplish future growth but funding has not yet been secured
Lake Easton State Park is a forested park on the shore of Lake Easton in northwest Kittitas County It provides outstanding views of surrounding mountain scenery This lake and State park are downstream from Reclamationrsquos Kachess and Keechelus Lakes and is easily accessible from I-90 Camping fishing picnicking and swimming are offered at this park Boating is allowed There is one boat ramp and a small dock Motorized boating is allowed but the lake is shallow with many tree stumps near the surface so high speeds are discouraged Recreational use was more than 230000 visits in 2002
Potholes State Park is a 640-acre camping park located in southern Grant County on the shores of Potholes Reservoir the park has over 35 miles of shoreline This 27800-acre reservoir is also known as OrsquoSullivan Reservoir and is part of the Columbia Basin Project In 2002 there were more than 350000 visits to this park Water levels can vary dramatically throughout the irrigation season The pothole lakes for which the park and reservoir were named are about a frac12-hour drive from the park The Columbia National Wildlife Refuge is 2 miles east of the park and provides excellent wildlife viewing and birding opportunities
3 Phone conversation with Ginkgo Park staff Jim Mitchell September 9 2003
B-11
The park has four boat ramps and about 100 feet of dock to support all types of boating and water sports plus fishing picnicking wildlife watching etc Swimming from sand beaches is a popular activity Camping is available at 61 tent spaces and 60 additional spaces with utility hookups There is a dump station in the park The campgrounds have four restrooms and four showers
Sacagawea State Park is located near the confluence of the Columbia and Snake Rivers It a 284-acre marine day-use park with 9100 feet of shoreline There is no overnight camping but overnight moorage is allowed and visitors are allowed to stay on their boats at the 70 feet of moorage There are two boat ramps and 200 feet of dock There are extensive picnic facilities 2 large picnic shelters 7 sheltered picnic tables and 123 unsheltered picnic tables A daily permit costs $500 and allows for parking watercraft launching and trailer dumping Fees are also required for overnight moorage The park hosted over 130000 visits
Steamboat Rock State Park occupies 3522 acres on a basalt butte rising 800 feet above the water surface of Banks Lake This park is on a peninsula that juts out into Banks Lake from its northeastern shore The park has nearly 95 miles of shoreline Boating camping and fishing are the main attractions of the park but the park is also becoming more popular for its rock climbing opportunities The parkrsquos seven boat ramps and 320 feet of dock provide access to about 27000 acres of water surface Northrup Creek water access (boat ramp) is available 24 hours a day Camping facilities include 26 tent spaces 100 developed campsites with full utility hookups (1 dump station 6 restrooms and 8 showers) and 12 primitive boat-in campsites with vault toilets and drinking water There is a sandy swim beach 131 miles of hiking and biking trails and 10 miles of horse trails Steamboat Rock is a very popular park This park received over 580000 visits in 2002 Typically the park receives over one-half million visitors a year
Sun Lakes State Park is just south of Dry Falls a 400-foot-high 35-mile-wide stark cliff that once was a waterfall ten times the size of Niagara Falls Dry Falls is the location of Dry Falls Dam which is the southern boundary of Banks Lake This 4027-acre park features boating and camping opportunities There are nine lakes providing almost 14 miles of shoreline for recreational use Two boat ramps and a 20-foot dock provide boating access The park provides 162 tent camping sites and 18 sites with utility hookups There is one dump station and eight restrooms and eight showers Visitation was nearly 940000 in 2002
Yakima Sportsman State Park was first developed as a facility and natural area by and for the Yakima Sportsman Club which was a fishing hunting and shooting organization This 247-acre park was donated to Washington State Parks in 1956 Located within the Yakima River flood plain this park offers birding camping fishing and picnicking as the primary recreational activities Camping facilities include 28 tent camping sites 37 developed campsites with utility hookups a dump station 2 restrooms and 4 showers Although there are ponds and the Yakima River nearby there
B-12
are no provisions for boating The park is irrigated and supports a wide variety of vegetation including hardwoods and wildlife The park is a green oasis in an otherwise dry desert area and hosted nearly 300000 visitors in 2002
Almost 30 percent of the parkrsquos operating budget is funded through fees and permits In general fees are charged for the use of specific facilities relating to boating camping and winter use for snowmobiling and nonmotorized winter sports The Washington State Parks and Recreation Commission requires a vehicle parking permit to park in State parks Statewide The daily fee is $700 with an annual permit costing $7000 These fees were discounted to $500 and $5000 respectively until 2006 In addition there are other fees to cover the use of special facilities and services
A daily boat launching fee of $500 is charged at boat ramps An annual launching permit is $5000 There are additional charges for moorage depending on the size of the boat and length of time moored
As of 2002 camping fees were as follows standard campsite $1500 utility campsite (recreation vehicle [RV] hookups) $21 primitive campsite $1000 An additional $100 for camping is also charged at certain high-use parks between April 1 and September 30 An additional $2 per adult per night is charged when there are more than four adults per campsite maximum eight adults per campsite In addition $1000 per night is charged for a second vehicle unless it is towed by a recreational vehicle There is a $500 charge for use of the dump station unless you are camping For campers this fee is included in the camping fee Group camping facilities and group picnic facilities are available and there is a charge for their use
These are the general systemwide park fees They may vary by park depending on local conditions and services provided
National Park Service Lake Roosevelt National Recreation Area was created by the development of the Grand Coulee Dam on the Columbia River and is a major recreation resource in northeast Washington This dam impounds water on the Columbia Kettle and Spokane Rivers and has created a reservoir that has 60000 surface arcres and 500 miles of shoreline Lake Roosevelt borders the Colville Indian Reservation and the Spokane Indian Reservation and reaches almost to Canada The portions of the lake that lie within these reservations are managed by the Colville Confederated Tribes and Spokane Tribe The NPS manages the considerable remainder as Coulee Dam National Recreation Area The NPS has nearly 2 dozen developed sites providing a variety of recreation services including boat launches campgrounds and picnic areas Only a small portion of this recreation area borders the northernmost part of Grant County behind Coulee Dam Here boat access to the water is available at Crescent Bay near the town of Grand Coulee
B-13
The NPS regularly collects and reports visitor use data for Lake Roosevelt National Recreation Area The recreation area received between 11 and 15 million recreation visits annually from 1990 through 2002 Table 4 displays the recreation visits and overnight stays Except for 2001 visitation has been over 14 million recreation visits since 1997 Since 1987 use has been over one million visits each year Overnight use of the park has been over 140000 overnight stays since 1997 again except for 2001 The national emergency of September 11 2001 resulted in lower than normal visitor use for 2001
Table 4mdashLake Roosevelt National Recreation Area Visitor Use
Year Recreation Visits1 Overnight Stays2
1990 1542515 155703
1991 1771420 149476 1992 1121973 142573
1993 1198605 160747 1994 1515674 171900
1995 1341016 174263 1996 1045455 145626
1997 1431960 177360 1998 1545150 176528
1999 1403793 169679 2000 1415627 169787
2001 1252160 132070 2002 1444751 146559 1 A recreation visit is the entry of any person onto the lands or
waters administered by the National Park Service for the purpose of recreation
2 An overnight stay is one night spent within a park by a visitor A visitor is an individual who may generate one or more visits Source NPS Public Use Statistics Office
Boat launch facilities managed by the NPS have fees of $600 for a 7-day pass or $4000 for an annual pass The annual pass is discounted to $3000 if purchased from January 1 through April 30 These passes may be purchased through the mail Camping is on a first-come first-served basis at all NPS campgrounds Up to 2 vehicles and 10 people per site are allowed A camping fee of $1000 per night per site is charged A reduced cost of $500 per night is charged from October 1 through April 30
B-14
United States Army Corps of Engineers The Corps developed McNary Lock and Dam to impound the Columbia River and created Lake Wallula which extends for 46 miles up the Columbia River This reservoir has a surface area of 38800 acres with 242 miles of shoreline Approximately 16900 acres of associated public lands surround the lake and are used for public recreation wildlife habitat wildlife mitigation and water-connected industrial development About 2400 acres are leased to State or local agencies for recreational purposes Another 3500 acres are leased to the Service as part of McNary National Wildlife Refuge Public boat launching facilities are located at 17 locations and another 8 access sites are managed by private commercial concessionaires or boat clubs The recreation sites include McNary Dam Columbia Park Howard Amon Park Hover Park Leslie R Groves Park Two Rivers Park Washington Boat Launch and the Yakima River Delta Wildlife Nature Area
Situated on the Columbia River south of the Black Rock site is a park built by the Corps on property they control Until October 2002 this park was known as Crow Butte State Park and was managed by the Washington State Parks Department The visitation to Crow Butte State Park was nearly 125000 from January through September 2002 Washington State Parks ceased to operate this park due to budgetary constraints since the State did not have ownership of the land or infrastructure A nonprofit organization has recently begun to operate this park in cooperation with the Corps
There is a fee for camping at Columbia Park The charge ranges between $700 and $1100 depending on the type of campsite (tent RV etc) It costs $250 to use the dump station if the visitor is not also camping here Day-use activities and use of the boat launches at this and other Corps recreation sites are free
United States Fish and Wildlife Service Several areas are managed by the Service in the four-county region and are available for flat water recreation The largest is the Hanford Reach National MonumentSaddle Mountain National Wildlife Refuge in Benton Grant and Franklin Counties The Hanford reach is the only nontidal free-flowing stretch of the Columbia River within the United States Most of this 195000-acre monument and refuge are closed to the public or access is limited There are few visitor use facilities More open use of the monument and refuge is awaiting the completion and implementation of a comprehensive management plan
Columbia National Wildlife Refuge is on the border between Grant and Adams Counties and provides approximately 23000 acres of mixed lake grassy uplands sagebrush and canyon and butte habitat This refuge has 145 acres of ponds 841 acres of lakes and 178 miles of streams Boating fishing hiking hunting picnicking and RV use opportunities are available Camping is available at Soda Lake Campground There are boat launches at Blythe Corral Hutchinson Lower Hampton Soda and Teal Lakes
B-15
Umatilla National Wildlife Refuge consists of 29370 acres of marshes sloughs open water cropland and sagebrush uplands The refuge in located in the extreme southwest corner of Benton County along the Columbia River Boats without motors are allowed on refuge ponds Motorboating is permitted on the Columbia River portions of the refuge There are excellent opportunities for hunting (deer pheasant and waterfowl in season) fishing and wildlife observation Approximately 70000 visitors utilized the refuge for recreation in 2001
Recreational visitor use at most wildlife refuges consists mainly of fishing hunting (waterfowl upland game and big game) and wildlife observation These are the primary recreational experiences that are allowed and supported with facilities and access to the refuges Boating is usually part of one of these other activities Human-powered or low speed motor-boating are the common modes of transportation on the lakes and streams of wildlife refuges Big boats with large motors and high speeds water skiing personal watercraft (jet skis) and other water sports are inconsistent with the purposes and mission of the refuges
United States Forest Service Two of the six Ranger Districts of Wenatchee National Forest are in the four-county regionmdashCle Elum in northwest Kittitas County and Naches in northwest Yakima County There are 12 water access sites managed by the FS in the four-county area Bumping Lake Clear Lake and Rimrock Lake are located in the Naches District of Wenatchee National Forest Cle Elum Kachess and Keechelus Lakes are in the Cle Elum District of this same forest
Visitor use data for each individual recreation site (lakes ponds campgrounds trails etc) in the forest are not available due to the expense of collecting this data Empirical evidence indicates that recreational use of these lakes is very high during the summer season Prior to 1996 the FS used its Recreation Information Management System to estimate and analyze visitor use in its forests for management purposes Unfortunately this process became too great of a burden on the limited recreation funding available to monitor use and manage and maintain the recreation program and facilities
To estimate the recreational use occurring on the National Forests a nationwide program of visitation data and analysis has been implementedmdashThe National Visitor Use Monitoring Project (NVUM) Every 4 years one-quarter of the national forests implements this permanent 4-year cyclic sampling system to survey for recreational use at the forest regional and national levels Recreational visitors to Wenatchee National Forest were surveyed October 2000 through September 2001 This period was an unusual recreation year in that it was period of lower than normal snow which reduced winter use and a severe fire season which resulted in closures of parts of the forest due to major wildfires Even so the NVUM process estimated that the forest received more than
B-16
25 million National Forest visits4 The survey found that 43 percent of respondents used a boat launch within the forest
The Cle Elum Ranger District contains Cle Elum Kachess and Keechelus Lakes The FS manages recreation at these three Reclamation reservoirs and provides boating access to them
The FS has 25 campgrounds in the Cle Elum District There are group camping sites at both Kachess Lake (capacity 50 people) and Cle Elum Lake (capacity 100 people) Each lake also has another campground with individual sites (Kachess 120 sites and Cle Elum River 23 sites) Kachess Campground provides boating access to Kachess Reservoir There are four separate boat launching sites on Cle Elum Lake including the largest at Wish Poosh Campground There is a four-lane boat launch on Keechelus Reservoir Recreational use of the reservoirs of the Cle Elum District reveals that Lake Cle Elum Reservoir received 35600 visits Kachess Reservoir had 29200 visits and Keechelus Reservoir hosted 9700 visits
The Naches Ranger District includes 16 campgrounds in the Chinook Pass - Bumping Lake area Three of these campgrounds providing 80 sites are at Bumping Lake Two water access launching sites are at Bumping Lake Bumping Lake Marina and Bumping Lake Public Boat Landing At the White Pass area there are nine campgrounds Clear Lake Dog Lake and Rimrock Lake are found in this part of Naches Ranger District The first two have one boat launch each and Rimrock Lake is served by two resorts Silver Beach and The Cove which provide boating access
Recreational use of much of the National Forest lands now requires the payment of a user fee Developed areas offering camping or boating usually assess a fee of between $500 and $1000 per day depending on the forest and the facility and amenities provided Daily forest passes are available for $500 and are valid for parking for the use of many trail heads picnic areas boat launches and interpretive sites Annual forest passes allow access to these same sites cost $3000 and are good for 1 year Camping fees are usually between $1000 and $1500 per night per site depending on the level of development and amenities offered Campgrounds range from small 3-site hike-in areas that are free to large 120 site facilities that have utilities RV sites etc and cost $1400 per night Some sites require a boat launching fee or moorage charges Some concessionaire-operated sites on FS land may have higher fees
4 A National Forest visit is the entry of one person upon a National Forest to participate in recreational activities for an unspecified period of time An estimated 2532617 National Forest visits (the 80-percent confidence level is plus or minus 140 percent) occurred on the Wenatchee National Forest A National Forest visit can be composed of multiple site visits Site visits were estimated at 2726705 These values and associated error rates are reported for the 80-percent confidence level
B-17
Recreation Fees Many public agencies at all levels charge fees for access to and the use of recreational sites and facilities This practice has come about as means to help pay for the increasing operation and maintenance costs associated with providing public recreation areas and facilities In general the fees charged by pubic entities are comparable or lower than the charges found at privately provided recreation facilities of similar quality in the same market area Usually the fees charged for the use of public recreation resources and facilities are not sufficient to cover the entire cost of providing and maintaining these resources
Recreation Summary This investigation has identified 212 sites on over 5 dozen lakes reservoirs and river reaches that provide access and opportunities for boating fishing and other flat water recreational experiences within and bordering the four-county local area Available data indicate that these recreational resources are heavily used by both residents of the four-county area and by visitors from outside the local area Seven State parks alone accounted for over 29 million recreation visits in 2002 (table 3)
Reclamationrsquos 1 dozen existing reservoirs with recreation facilities provide over 74000 acres of water surface available for public recreation (table 2 not including Lake Roosevelt) The potential Black Rock reservoir is expected to add about 9620 acres of water surface (at full pool) to this supply of nearby flat water recreation areas
References
Interagency Committee for Outdoor Recreation October 2002 An Assessment of Outdoor Recreation in Washington State A State Comprehensive Outdoor Recreation Planning (SCORP) Document 2002ndash2007 Accessed on September 2 2003 lthttpwwwiacwagoviacdocshtmgt
_____ March 2003 Estimates of Future Participation in Outdoor Recreation in Washington State Accessed on September 2 2003 lthttpwwwiacwagoviacdocshtmgt
US Army Corps of Engineers McNary Dam ndash Lake Wallula Accessed on September 15 2003 lthttpwwwnwwusacearmymilcorpsoutdoorsmcnMCNDAMHTMgt
US Fish and Wildlife Service Hanford Reach National Monument Accessed on September 16 2003 lthttphanfordreachfwsgovindex-expandedhtmlgt
US Forest Service Wenatchee National Forest Accessed on Septem ber 4 2003 lthttpwwwfsfedusr6wenatcheegt
B-18
_____ National Visitor Use Monitoring Results August 2002 USDA Forest Service Region 6 Wenatchee National Forest lthttpwwwfsfedusr6gt
B-19
Attachment 1 of Appendix B
Public Access Points for Water Oriented Recreation
B-21
Site Name
Water Body
Acres of
Water Surface
Managing AgencySite
Manager Location
of Boat Launches and Type of Launch
of Loading Floats
of Car
Parking Spaces
and Type of
Lot
of RVTrailer
Parking Spaces
and Type of Lot
of Restrooms and Type of Facility
Camping ( of
Sites) Picnicking Swimming
1 Adams Road
239 Drain
Desert Wildlife
Area WDFW
Grant County
Yes
2 Adrian - North Gloyd Seeps
WDFW Grant County
3 Adrian -South
Gloyd Seeps
WDFW Grant County
4 Alkali Lake Alkali Lake WDFW Grant County
1 gravel 0 10 gravel 15 gravel 1 vault middot middot
5 Ancient Lake Ancient
Lake WDFW
Grant County
6 Ankeny 1 Banks Lake
27000 WDFW Douglas County
3 gravel - 10 gravel 15 gravel 20 vault Yes middot middot
7 Ankeny 2 Banks Lake
27000 WDFW Douglas County
2 gravel - - 25 gravel 1 vault No middot middot 8
Babcock Ridge Lake
Babcock Ridge Lake
WDFW Grant
County 1 natural 0 5 gravel 5 gravel None No middot middot
9
10
Banks Lake-Fordair
Barker Canyon -
Banks Lake 7
Banks Lake
Banks Lake
27000
27000
WDFW
WDFW
Grant County
Grant County
1 asphalt
1 concrete
plank
0
0
0
10 gravel
10 gravel
30 gravel
None
1 vault
No
Yes
middot middot
middot middot
11 Beda Lake Beda Lake WDFW Grant
County
12 Bell Property WDFW Kittitas County
13
14
Benton City
Billy Clapp Lake
Billy Clapp Lake
1010
WDFW
WDFW
Benton County
Grant County
2 concrete
solid 1
5 Paved
no striping
15 paved no striping
1 vault No middot middot
B-23
Site Name
Water Body
Acres of
Water Surface
Managing AgencySite
Manager Location
of Boat Launches and Type of Launch
of Loading Floats
of Car
Parking Spaces
and Type of
Lot
of RVTrailer
Parking Spaces
and Type of Lot
of Restrooms and Type of Facility
Camping ( of
Sites) Picnicking Swimming
1
15 Blue Lake Blue Lake WDFW Grant
County concrete plank 1
0 10
gravel 40 gravel 2 vault middot middot
gravel
16 Blue Lake
Resort Blue Lake Blue Lake Resorts
Grant County
1 gravel 0 10
gravel 10 gravel Yes and
rental cabins
middot Yes
17 Blue Lake
Resort Blue Lake WDFW
Grant County
Yes
18 Blythe Potholes
Reservoir 27800 WDFW
Grant County
2 concrete
solid 0
1 paved and
striped
140 gravel 9 paved
no striping
3 vault Yes middot middot 19 Blythe Lake
Blythe Lake
1300 Service Grant
County 1 gravel 0 0 10 gravel None No middot middot
20 Buckshot Ranch
Priest Rapids Lake
WDFW Grant
County
2 concrete
plank
60 gravel 2 vault Yes
3-day limit
middot middot 21 Buena WDFW
Yakima County
22 Bumping
Lake Marina Bumping
Lake 1300 FS
Yakima County
1 concrete
solid 1 5 gravel 5 gravel 2 vault Yes Yes No
23 Bumping
Lake Public Boat Landing
Bumping Lake
1300 FS Yakima County
1 concrete
plank 0 0 30 gravel 2 vault
Available at
Bumping Lake
No No
Marina
24 Burke Lake-
Eastside Burke Lake
WDFW Grant
County
1 concrete
plank 0 0 20 gravel 1 vault Yes middot middot
25 Burke Lake-Southwest
Burke Lake
WDFW Grant
County
1 concrete
plank 0 5 gravel 10 gravel 2 vault Yes middot middot
B-24
Site Name Water
Body
Acres of
Water Surface
Managing AgencySite
Manager Location
of Boat Launches and Type of Launch
of Loading Floats
of Car
Parking Spaces
and Type of
Lot
of RVTrailer Parking Spaces
and Type of Lot
of Restrooms and Type of Facility
Camping ( of
Sites) Picnicking Swimming
26 Burke Lake-
Westend Burke Lake
WDFW Grant
County 1 gravel 0 10
gravel 30 gravel 2 vault middot middot
27 Calache Lake
Calache Lake
WDFW Grant
County 1 natural 0 10
gravel 5 gravel 1 vault middot middot
28 Canal Lake-
Northend Canal Lake
WDFW Grant
County
2 concrete
plank 0
10 gravel 5 paved and
striped
15 gravel 1 paved
and striped
1 vault Yes middot middot
29 Cascade Park
Moses Lake
Moses Lake Parks and Rec
Dept
Grant County
2 concrete
solid 2
5 paved and
striped
32 paved and
striped 1 flush Yes Yes Yes
30 Century Landing
Yakima River
Yakima Greenway Foundation
Yakima County
1 concrete
plank 0 10
paved 0 1 vault No Yes No
4
31 Charbonneau Park
Lake Sacajawea
Corps Benton County
launches concrete solid and 51 open
1 50 gravel 54 paved
and striped
Yes flush
Yes tent and RV with full hookups
Yes Yes
moorage
32 Clear Lake Recreation
Area Clear Lake 260 FS
Yakima County
1 concrete
solid 1 5 gravel
20 gravel 3 paved
and striped
1 vault No Yes No
33 Coffin Lake Stan
Coffin Lake WDFW
Grant County
1 concrete
plank 0 5 gravel 5 gravel 1 vault Yes middot middot
145 acres
34
Columbia National Wildlife Refuge
ponds 841 acres lakes 178
miles of
986 Service Grant
County No Yes No
stream
B-25
35
36
37
Site Name
Columbia Park
Columbia Park West
Columbia Point
Water Body
Lake Wallula
Lake Wallula
Columbia River
Acres of
Water Surface
Managing AgencySite
Manager
KennewickParks and Rec
Horn Rapids Park
Richland Parks and Rec
Location
Benton County
Benton County
Benton County
of Boat Launches and Type of Launch
8 concrete
solid
3 concrete
solid
4 concrete solid and
34 moorage
of Loading Floats
2
1
3
of Car
Parking Spaces
and Type of
Lot
57
paved and
striped
65 paved
and striped
of RVTrailer Parking Spaces
and Type of Lot
120 gravel
38 paved and
striped
140 paved and
striped
of Restrooms and Type of Facility
Yes
1 flush
1 - with showers
Camping ( of
Sites)
Yes RV
Picnicking
Yes
Yes
Yes
Swimming
Yes
middot
middot 38
Corral Lake -North
Corral Lake
WDFW Grant
County 1 gravel 0 10
gravel 15 gravel 1 vault Yes middot middot
39 Corral Lake -Southwest
Corral Lake
WDFW Grant
County
40 Coulee City Community
Park
Banks Lake
27000 Coulee City
Parks and Rec Dept
Grant County
8 moorage 4 concrete
solid
3 0 60 gravel 1 flush Yes Yes Yes
41 Coulee Lodge Resort
Blue Lake Coulee Lodge
Resort Grant
County
1 concrete
solid 1 30
gravel 35 gravel
1 showers with
restrooms
Yes RV hookups
rental cabins
middot Yes
42 Coulee
Playland Resort
Banks Lake 27000
Coulee Playland Resort
Grant County
25 moorage
3 Yes RV Tent
No No
43 Crab Creek Launch
Potholes Reservoir
N 27800 WDFW
Grant County
1 gravel 0 10 gravel
10 gravel Yes RV middot middot 44 Crater Lake
Crater Lake
WDFW Grant
County cartop launch
45 Crater Slough
WDFW Grant
County
B-26
Site Name Water
Body
Acres of
Water Surface
Managing AgencySite
Manager Location
of Boat Launches and Type of Launch
of Loading Floats
of Car
Parking Spaces
and Type of
Lot
of RVTrailer
Parking Spaces
and Type of Lot
of Restrooms and Type of Facility
Camping ( of
Sites) Picnicking Swimming
46 Crescent Bar Wanapum
Lake Grant Cou nty
PUD Grant
County
2 concrete
solid 1 0 50 gravel
2 Portable san i-cans
Available across
the street middot middot
47 Crescent Bar Resort
Wanapum Lake
Crescent Bar Development
Inc
Kittitas County
40 transient
open middot middot middot middot middot middot moorage
48 Crescent Bay FD
Roosevelt Lake
60000 NPS Grant
County
1 concrete
solid 1 20
gravel 75 gravel 1 vault No middot middot
49 Craw Butte Lake
Umatilla
Corps Ownership with Mgt by Private
Concession
Benton County
1 concrete plank 2
concrete solid
middot 45
paved and
striped
56 paved and
striped middot middot middot middot
25
50 Darnells Resort Motel
Lake Chelan
Private Kittitas
County permanent
open middot middot middot middot middot middot moorage
51 Dodson Frenchmen
Desert Wildlife
Area WDFW Grant
County Yes Yes
52 Dodson Road
WDFW Grant
County Yes Yes Yes
53 Dog Lake Campground
Dog Lake FS Yakima County
1 ramp natural
0 middot 8 gravel 1 vault Yes Yes No
B-27
Site Name
Water Body
Acres of
Water Surface
Managing AgencySite
Manager Location
of Boat Launches and Type of Launch
of Loading Floats
of Car
Parking Spaces
and Type of
Lot
of RVTrailer
Parking Spaces
and Type of Lot
of Restrooms and Type of Facility
Camping ( of
Sites) Picnicking Swimming
54 Dry Creek Cle Elum
Lake FS Kittitas
County 1 gravel 0 10
gravel 5 gravel None Yes middot middot
55 Dusty Lake Dusty Lake
WDFW Grant County
Yes
56 Evergreen Reservoir
Evergreen Reservoir
WDFW Grant County
1 concrete
plank 0 0 30 gravel 2 vault Yes middot middot
57 Evergreen
Reservoir -East
Evergreen Reservoir
WDFW Grant County
1 gravel 0 0 10 gravel 1 vault Yes middot middot
58
59
60
61
Evergreen Reservoir-Northwest
Evergreen Reservoir-Southwest
Fidesco Harris - 1
Fidesco Harris - 2
Evergreen Reservoir
Evergreen Reservoir
Desert Wildlife
Area
Desert Wildlife
Area
WDFW
WDFW
WDFW
WDFW
Grant County
Grant County
Grant County
Grant County
1 concrete
plank
Yes
0 0 25 gravel 1 vault
Yes
Yes
Yes
Yes
Yes
Yes
Yes
middot middot
B-28
Site Name Water
Body
Acres of
Water Surface
Managing AgencySite
Manager Location
of Boat Launches and Type of Launch
of Loading Floats
of Car
Parking Spaces
and Type of
Lot
of RVTrailer
Parking Spaces
and Type of Lot
of Restrooms and Type of Facility
Camping ( of
Sites) Picnicking Swimming
62 Fidesco Harris - 3
Desert Wildlife
Area WDFW
Grant County Yes Yes
63 Fiorito Ponds Fiorito Ponds
WDFW Kittitas County
64 Fish Trap Lenore
WDFW Grant
County
65 Fitzsimmons Yakima River
WDFW Yakima County
1 ramp natural
0 5 gravel 15 gravel 1 vault No 66 Fordair WDFW
Grant County
Yes
67 Frenchman Hills 1
Desert Wildlife
Area WDFW
Grant County
Yes
68 Frenchman Hills 2
Desert Wildlife
Area WDFW
Grant County
Yes
69 Frenchman Hills 3
Desert Wildlife
Area WDFW
Grant County Yes
70 Frenchman Hills 4
Desert Wildlife
Area WDFW
Grant County
Yes
71 Gannon Yakima River
WDFW Yakima County
1 ramp gravel
0 5 gravel 10 gravel None No No No
72
73
Ginko Petrified
Forest State Park
Ginko State Park
Wanaapum Reservoir
Wanapum Lake
Washington State Parks
State Parks
Kittitas County
Kittitas County
2
1 asphalt
0
10 paved
no striping
5 paved no striping
Yes
None
Yes 50 RV
hookups
No
Yes
B-29
Site Name Water
Body
Acres of
Water Surface
Managing AgencySite
Manager Location
of Boat Launches and Type of Launch
of Loading Floats
of Car
Parking Spaces
and Type of
Lot
of RVTrailer
Parking Spaces
and Type of Lot
of Restrooms and Type of Facility
Camping ( of
Sites) Picnicking Swimming
74 Glen Williams
Potholes Reservoir
27800 WDFW Grant
County
2 concrete
plank 0 50
gravel 100
gravel 2 vault
75 Gloyd - Farm
Unit
Gloyd Seeps Wildlife
Area
WDFW Grant
County Yes
76 Gloyd - Loan Ranch
Gloyd Seeps Wildlife
Area
WDFW Grant County
Yes
77 Gloyd - Road
10
Gloyd Seeps Wildlife
Area
WDFW Grant
County Yes
78 Gloyd - Road
12
Gloyd Seeps Wildlife
Area
WDFW Grant
County Yes
79 Gloyd - Road
14
Gloyd Seeps Wildlife
Area
WDFW Grant
County Yes
80 Gloyd - Road 16
Gloyd Seeps Wildlife
Area
WDFW Grant County
Yes
B-30
Site Name Water
Body
Acres of
Water Surface
Managing AgencySite
Manager Location
of Boat Launches and Type of Launch
of Loading Floats
of Car
Parking Spaces
and Type of
Lot
of RVTrailer
Parking Spaces
and Type of Lot
of Restrooms and Type of Facility
Camping ( of
Sites) Picnicking Swimming
81 Gloyd - Road
7
Gloyd Seeps Wildlife
Area
WDFW Grant
County Yes
82 H Lake H Lake WDFW Grant
County Yes
83 Hammerstead
WDFW Yakima County
Hanford Reach
National
84 Monument
Saddle Mountain
Columbia River
Service Grant
County middot No No No
National Wildlife
85
86
Refuge
Harlan Landing
Heart Lake
Yakima River
Heart Lake
WDFW
WDFW
Yakima County
Grant County
1 ramp concrete
plank
1 concrete
plank
0
0
12 paved and
striped
0
17 paved and
striped
10 gravel
middot 1 vault
No
Yes
Yes
No
middot 87 Heart Lake
Heart Lake
WDFW Grant
County Yes Yes
88 Horn Rapids Park
Yakima River
Benton County Parks and Rec
Benton County
2 concrete
plank
10 gravel
25 gravel middot None middot 89 Howard
Amon Park Lake
Wallula Horn Rapids
Park Benton County
3 concrete
solid 1
47 paved and
striped
40 gravel 46 paved
and striped
Within walking distance
Yes middot
B-31
Site Name
Water Body
Acres of
Water Surface
Managing AgencySite
Manager Location
of Boat Launches and Type of Launch
of Loading Floats
of Car
Parking Spaces
and Type of
Lot
of RVTrailer
Parking Spaces
and Type of Lot
of Restrooms and Type of Facility
Camping ( of
Sites) Picnicking Swimming
90 I Road 645
Drain
Desert Wildlife
Area WDFW
Grant County
Yes Yes
91 1-82 Ponds
1 2 3 4 and 5
WDFW Yakima County
Crab
92 Jericho - Old
Bridge Creek
Wildlife Area
Yes Yes
93
Job Corps Dike -
Potholes Reservoir N
Potholes Reservoir
27800 WDFW Grant
County 3 gravel 0 0 20 gravel middot
94 Kachess
Campground Lake
Kachess 6535 FS
Kittitas County
2 concrete solid and 1 gravel
0 5 paved
and striped
8 gravel 39 paved
and striped
6 paved no striping 7 Paved
1 flush Yes
(183) Yes Yes
no striping
95 Katy Lake
Seep Lakes
Wildlife Area
WDFW Grant
County Yes
96 Keechelus
Boat Launch Lake
Keechelus 2560 FS
Kittitas County
4 asphalt 0 0 22 paved
and striped
1 vault No middot 97
King Horn Slew
WDFW Kittitas
County
98 Lake Easton State Park
Lake Easton
240 Washington State Parks
Kittitas County
1 concrete
plank 1
14 paved and
10 paved and
striped
middot Yes
B-32
Site Name
Water Body
Acres of
Water Surface
Managing AgencySite
Manager Location
of Boat Launches and Type of Launch
of Loading Floats
of Car
Parking Spaces
and Type of
Lot
of RVTrailer
Parking Spaces
and Type of Lot
of Restrooms and Type of Facility
Camping ( of
Sites) Picnicking Swimming
striped
99 Laurents
Sun Village Resort
Park Lake Laurents Sun Village Resort
Grant County
1 asphalt 0 middot middot Laurents 1 1
100 Sun Village Resort - Blue
Blue Lake Laurents Sun Village Resort
Grant County
concrete plank
3 10 gravel
10 gravel restrooms
with Yes RV Yes Yes
Lake 1 gravel showers
101 Lavendar Lake
Lavendar Lake
WDFW Kittitas
County 1 gravel 0 15
gravel 10 gravel 1 vault No middot middot
102 Lena Lake Lena Lake WDFW Grant
County Yes
103 Lenice WDFW Grant
County Yes Yes
104 Lenore Lake - North
Lake Lenore
WDFW Grant
County
105 Lenore Lake - South
Lake Lenore
WDFW Grant
County Yes Yes
106 Leslie Groves Park
Lake Wallula
Richland Parks and Rec
Benton County
4 concrete
solid 1
15 paved and
striped
50 paved and
striped
No Yes Yes
107 Lind Coulee-
East WDFW
Grant County
Yes
108 Lind Coulee - Island Site
Potholes Reservoir 27800 WDFW
Grant County
1 gravel 0 0 10 gravel 1 vault Yes middot middot 109
Lind Coulee-West
WDFW Grant
County Yes Yes Yes
110 Lmuma Creek
Yakima River
BLM Kittitas
County 1 0 1 7 Yes middot
B-33
111
Site Name
Long Lake
Water Body
Long Lake
Acres of
Water Surface
Managing AgencySite
Manager
WDFW
Location
Grant County
of Boat Launches and Type of Launch
1 gravel
of Loading Floats
0
of Car
Parking Spaces
and Type of
Lot
0
of RVTrailer
Parking Spaces
and Type of Lot
10 gravel
of Restrooms and Type of Facility
1 vault
Camping ( of
Sites)
Yes 15-day
limit
Picnicking
middot
Swimming
middot 112
Lower Goose Lake
Goose Lake
WDFW Grant
County 1 gravel 0
10 gravel
5 gravel No No middot middot 113
Lower Peninsula
Park
Moses Lake
Moses Lake P and R Dept
Grant County
2 concrete
plank 0 0
38 paved and
striped 2 vault No Yes middot
114 Marco Polo
Lake Marco Polo
Lake WDFW
Grant County
Yes
115
116
117
MarOon Resort
Martha Lake
Matton Lake
Potholes Reservoir
Martha Lake
Matton Lake
27800 Mardon Resort
WDFW
WDFW
Grant County
Grant County
Kittitas County
1 concrete
solid
1 gravel
1 concrete
plank
1
0
1
10 gravel
Yes gravel
25 gravel
10 gravel
Yes gravel
25 gravel
middot 1 vault
1 vault
Yes RV
Yes 3-day limit
Yes
Yes
middot middot
middot middot middot
118 McCabe Pond
McCabe Pond
WDFW Kittitas
County
119 McCormick WDFW Yakima County
120 McLeary WDFW Grant
County
121 McLeary Pixlee
Park Lake WDFW Grant
County 1 natural 0
15 gravel
middot middot middot 122
123
Medicare East
Mellis Road (Burke)
Potholes Reservoir
Yakima River
27800 WDFW
WDFW
Grant County
Yakima County
1 gravel
1 concrete
plank
0
0
0
10 paved
no striping
20 gravel
30 paved no striping
middot 1 vault
No
middot middot
middot middot
B-34
Site Name
Water Body
Acres of
Water Surface
Managing AgencySite
Manager Location
of Boat Launches and Type of Launch
162
of Loading Floats
of Car
Parking Spaces
and Type of
Lot
of RVTrailer Parking Spaces
and Type of Lot
of Restrooms and Type of Facility
Camping ( of
Sites) Picnicking Swimming
124
125
Metz Marina
Million Dollar North -
Banks Lake 4
Columbia River
Banks Lake
27000
Metz Marina Inc
WDFW
Benton County
Grant County
permanent moorage
32 transient moorage
1 fixed hoist
1 gravel
0
0
20 gravel
15 gravel
15 gravel
50 gravel
Yes
1 vault
middot
No
middot
middot
middot
middot 126
Million Dollar South- Banks
Lake 3
Banks Lake
27000 WDFW Grant
County 1 gravel 0
10 gravel
20 gravel 1 vault No middot middot 127
Montlake Park
Moses Lake
Moses Lake P and R Dept
Grant County
2 concrete
solid 2
4 paved and
striped
34 paved and
striped 1 flush middot Yes Yes
128 Morgan Creek
Cle Elum Lake
FS Kittitas
County 1 gravel 0
10 gravel
2 gravel None Yes
primitive middot middot 129
Moses Lake - North End
Launch
Moses Lake
Grant County WDFW
Grant County
1 concrete
plank 0 5 gravel 10 gravel 1 vault middot middot middot
130 Moses Lake
- North Outlet Potholes
Reservoir 27800 WDFW
Grant County
1 natural 0
15 paved
and striped
15 gravel 1 vault Yes
3-day limit
middot middot
131 Moses Lake
Park Moses Lake
City of Moses Lake
Grant County
Yes middot middot middot
B-35
Site Name
Water Body
Acres of
Water Surface
Managing AgencySite
Manager Location
of Boat Launches and Type of Launch
of Loading Floats
of Car
Parking Spaces
and Type of
Lot
of RVTrailer
Parking Spaces
and Type of Lot
of Restrooms and Type of Facility
Camping ( of
Sites) Picnicking Swimming
Moses Lake 132 - South Potholes
Reservoir 27800 WDFW Grant
County Yes Yes
133 Myron Lake Myron Lake
WDFW Yakima County
Naylor 134 Junction
WDFW Grant
County Yes
135 North End
North 136 McNary
Old Vantage 137 Highway
138 Osborne Bay
Lake Wallula
Columbia River
Banks Lake 27000
WDFW
Corps
WDFW
WDFW
Grant County
Benton County
Grant County
Grant County
1 concrete
solid 1
concrete plank
1 natural
0
0
0
0
15 gravel
10 gravel
75 paved and
striped
60 gravel
30 gravel
1 Portable sani-cans
None
-
-
Yes primitive
Yes
No
middot middot middot
Overlook 139 Camp
Sage Lake WDFW Grant
County
Parker 140 Parking Lot
WDFW Yakima County
141 Perch Point
Plymouth 142 Park
Potholes Reservoir
Lake Umatilla
27800 Washington State Parks
Corps
Grant County
Benton County
1 gravel
2 concrete
solid
0
3
0
0
20 gravel
18 paved and
striped
2 portable sani-cans
2 portable sani-cans
Yes
Yes
Yes
middot Yes
143 Point site Lind
Coulee WDFW
Grant County
Yes
144 Pond 1 WDFW Yakima County
145 Pond 2 WDFW Yakima County
146 Pond 3 WDFW Yakima County
B-36
Site Name
Water Body
Acres of
Water Surface
Managing AgencySite
Manager Location
of Boat Launches and Type of Launch
of Loading Floats
of Car
Parking Spaces
and Type of
Lot
of RVTrailer Parking Spaces
and Type of Lot
of Restrooms and Type of Facility
Camping ( of
Sites) Picnicking Swimming
147 Pond 4 WDFW Yakima County
148 Pond 5 WDFW Yakima County
149 Poplars
Banks Lake 5
Banks Lake
27000 WDFW Grant
County 1 natural 0
10 gravel
5 gravel middot No middot middot
150
Port of Kennewick
Public Launching
Ramp
Columbia River
Port of Kennewick
Benton County
4 concrete
solid 1 0 30 gravel None - middot middot
151
Potholes -Lind Coulee Bridge Site
West
potholes Reservoir 27800
WDFW Grant
County 2 gravel 0 0 60 gravel 1 vault middot middot middot
152 Potholes
Reservoir -K5 SE
Potholes Reservoir 27800
WDFW Grant
County 1 natural 0 0 5 gravel middot middot middot middot
153 Potholes
State Park Potholes
Reservoir 27800 WA State Parks
Grant County
4 concrete
solid 1 0 60 gravel
2 flush 1 restroom
with showers
middot middot middot
154 Quincy Lake Quincy Lake
WDFW Grant
County
1 concrete
solid 0
10 gravel
20 gravel 1 vault Yes middot middot 155
Red Rock Lake
Red Rock Lake
WDFW Grant
County 1 natural 0 0 10 gravel middot Yes middot middot
B-37
Site Name Water
Body
Acres of
Water Surface
Managing AgencySite
Manager Location
of Boat Launches and Type of Launch
of Loading Floats
of Car
Parking Spaces
and Type of
Lot
of RVTrailer Parking Spaces
and Type of Lot
of Restrooms and Type of Facility
Camping ( of
Sites) Picnicking Swimming
156 Rest Haven WDFW Yakima County
157 Richland Yacht Club
Columbia River
Benton County
112 permanent moorage
-
middot 1
158 River Campground
Priest Rapids Lake
Grant County Grant
County
concrete plank
2 concrete 1 50
gravel 100
Gravel Yes Yes middot solid
159
Riverfront Park Boat Launch
(Prosser)
Yakima River
Prosser Parks and Rec Dept
Benton County
2 concrete
solid 0
10 paved
no striping
10 paved and
striped
- Yes middot
160 Road A-Potholes
Potholes Unit
WDFW Grant County
Yes
161 Rocky Ford-Hwy17
Rocky Ford Creek
WDFW Grant County Yes
162 Rocky Ford-Lower
Rocky Ford Creek
WDFW Grant County
Yes Yes
163 Rocky Ford-
Upper Rocky
Ford Creek WDFW
Grant County
Yes Yes
164 Rowe WDFW Yakima County
165 Roza
Recreational Site
Yakima River 100 BLM
Kittitas County
2 concrete
solid 0
135 paved
and striped
21 paved and
striped 4 vault Yes Yes middot
B-38
Site Name
Water Body
Acres of
Water Surface
Managing AgencySite
Manager Location
of Boat Launches and Type of Launch
of Loading Floats
of Car
Parking Spaces
and Type of
Lot
of RVTrailer Parking Spaces
and Type of Lot
of Restrooms and Type of Facility
Camping ( of
Sites) Picnicking Swimming
Lake
166 Sam Israel Lenore Wildlife
Area
WDFW Grant
County
167 Samsons Pit
Site
Potholes Wildlife
Area WDFW
Grant County
Yes
168 Sand Dunes
Site
Potholes Wildlife
Area WDFW
Grant County
Yes
169
170
Scatter Creek
Campground
Silver Beach Resort
Cle Elum River
Rimrock Lake
2790
FS
FS
Kittitas County
Yakima County
1 natural
1 gravel
0
1
5 gravel
5 gravel
5 gravel
5 gravel
1 vault
Flush restroom
Yes
No but there is a
motel and
rental cabins
middot
middot
middot
Yes
171 Smyrna -
West
Crab Creek
Wildlife Area
WDFW Grant
County Yes
172 Soda Lake
Campground Soda Lake Service
Grant County
2 gravel 0 15
gravel 35 gravel middot Yes middot middot
173 Soda Lake
Dam Soda Lake Service Grant
County 3 gravel 0 0 10 gravel middot No middot middot 174 South
Emerald Yakima River
WDFW Yakima County
1 natural 0 0 5 gravel None - middot middot 175 South
Emerald WDFW Yakima
County
176 South Teal Lake
South Teal Lake
WDFW Grant County
1 gravel 0 0 15 gravel middot - middot middot B-39
Site Name Water Body
Acres of
Water Surface
Managing AgencySite
Manager Location
of Boat Launches and Type of Launch
of Loading Floats
of Car
Parking Spaces
and Type of
Lot
of RVTrailer Parking Spaces
and Type of Lot
of Restrooms and Type of Facility
Camping ( of
Sites) Picnicking Swimming
177 Steamboat Rock state
Park
Banks Lake
27000 Washington State Parks
Grant County
4 concrete
plank 1
120 paved
and striped
105 paved and
striped 1 flush middot middot
178 Sulfur Creek Sulfur Creek
WDFW Yakima County 1 natural 0
15 gravel
- None Yes Yes Yes
179 Sun Lakes State Park
Park Lake Washington State Parks
Grant County 2 asphalt 1
20 gravel
10 gravel 1 flush Yes middot middot 180
Sunbanks Resort
Banks Lake
Osborn Bay
27000 Sun banks
Resort Grant
County
1 concrete
plank 1 0 15 gravel
Restrooms with
showers - middot middot
181
182
Sunland Estates
Susan Lake
Wanapum Lake
Susan Lake
WDFW
WDFW
Grant County
Grant County
1 concrete
plank
2 natural
0
0
10 gravel
5 gravel
30 gravel
3 gravel
None
No
Yes limited to 15 days
middot middot
middot middot
183 Teanaway WDFW Kittitas County
184 The Cove
Resort Rimrock
Lake 2790 FS
Yakima County
1 gravel 2 0 7 gravel Yes (RV) middot middot
185 Thrall
(Ringer Road) WDFW
Kittitas County
186 Twelve West
Resort Rimrock
Lake 2790
Twelve West Resort
Yakima County
1 gravel 1 0 15 gravel 2 vaults Yes (RV) middot middot
187 Two Rivers
Park Lake
Wallula Benton City
Parks and Rec Benton County
2 concrete
solid 3
20 gravel
20 gravel 1 Portable Sani-cans
- Yes Yes
Umatilla National
188 Wildlife
Refuge -Paterson
Lake Umatilla
Service Benton County
2 natural 0 0 - None middot middot Ramp
B-40
Site Name Water
Body
Acres of
Water Surface
Managing AgencySite
Manager Location
of Boat Launches and Type of Launch
of Loading Floats
of Car
Parking Spaces
and Type of
Lot
of RVTrailer Parking Spaces
and Type of Lot
of Restrooms and Type of Facility
Camping ( of
Sites) Picnicking Swimming
189 Upper Goose Upper
Goose Lake
WDFW Grant County
1 concrete
plank 0 0 15 gravel No middot middot
Upper Goose 190 Lake 2
Upper Goose Lake
WDFW Grant County
1 natural 0 5 gravel 5 gravel middot middot Vantage
191 Boat Ramp
Columbia River
Kittitas County Public Works
Kittitas County
3 concrete
solid 1
8 paved and
striped
60 paved and
striped 2 vaults - Yes middot
Vernita 192 Bridge (north
bank)
Columbia River
WDFW Grant County
4 natural 0 0 50 gravel None - middot middot 193 Virgin Lake
Seep Lakes
Wildlife Area
WDFW Grant
County Yes
194 W-20-F1 WDFW Grant
County Yes
Wanapum 195 Dam
(downstream)
Priest Rapids Lake
Grant County PUD
Grant County
1 concrete
plank 0 0
75 gravel 16 paved
no striping
2 Portable sani-cans
- middot middot Wanapum
196 Dam (upstream)
Wanapum Lake
Grant County PUD
Grant County
1 concrete
plank 1 0 10 paved
no striping 2 Portable sani-cans
- middot middot Wanapum
197 State Park
198 Wapato Dam
Wanapum Lake
Wanapum Lake
WDFW
Kittitas County
Yakima County
2 concrete
plank 1 0
40 paved and
striped 1 flush
Yes full hookups middot middot
Warden Lake 199 - North Warden
Lake WDFW Grant
County 2 gravel 0
20 gravel paved
40 gravel 1 vault Yes middot middot B-41
Site Name Water Body
Acres of
Water Surface
Managing AgencySite
Manager Location
of Boat Launches and Type of Launch
of Loading Floats
of Car
Parking Spaces
and Type of
Lot and
striped
of RVTrailer
Parking Spaces
and Type of Lot
of Restrooms and Type of Facility
Camping ( of
Sites) Picnicking SVllimming
200
201
202
203
Warden Lake - Outfall
Warden Lake - South
WaterWorks
Wenas Lake
Warden Lake
Warden Lake
Wenas Lake
WDFW
WDFW
WDFW
WDFW
Grant County
Grant County
Yakima County
Yakima County
1 concrete
solid 0 0 30 gravel 2 vaults
Yes
Yes
WDFW middot middot 204
Winchester Lake - 1 Frontage
Road
Winchester Wasteway
1020 WDFW Grant
County 1 natural 0 5 gravel 5 gravel None
Yes limited to 15 days
middot middot
205 Winchester
Lake - 2 Off Road 2
Winchester Wasteway
1020 WDFW Grant
County 1 natural 0 0 10 gravel None
Yes limited to 15 days
middot middot
206 Winchester
Lake - 3 Off Road 3
Winchester Wasteway
1020 WDFW Grant
County 1 gravel 0 5 gravel 15 gravel 1 vault
Yes limited to 15 days
middot middot
207 Winchester
Wasteway-Dodson Road
Winchester Wasteway
1020 WDFW Grant
County 1 gravel 0
15 gravel
40 gravel middot middot
208
Wish Poosh Campground
and Picnic Area
Cle Elum Lake
FS Kittitas
County
4 concrete
solid 0 0
31 Paved and
striped 1 flush Yes Yes Yes
B-42
Site Name
Water Body
Acres of
Water Surface
Managing AgencySite
Manager Location
of Boat Launches and Type of Launch
of Loading Floats
of Car
Parking Spaces
and Type of
Lot
of RVTrailer
Parking Spaces
and Type of Lot
of Restrooms and Type of Facility
Camping ( of
Sites) Picnicking Swimming
209 Wye Park
Boat Ramp Lake
Wallula City of Richland
Benton County
2 concrete
solid 1 0 25 gravel Yes flush - Yes middot
210 Yakima River Benton City
Yakima River
WDFW Benton County
1 natural 0 15
gravel 35 gravel None - middot
211 Yakima
Sportsman State Park
Yakima River
Washington State Parks
Yakima County
None 2 and 4 showers
Yes 28 tent
37 utility Yes middot
212 Zillah Bridge Yakima River
WDFW Yakima County
1 concrete
plank 0 0 10 gravel 1 vault - middot
212 = of sites
= no facilities or no data or not applicable
Automobiles and other passenger vehicles can also use the space identified as RVTrailer parking
B-43
Appendix C
River Flow Hydrographs
Yakima Canyon near Umtanum WA Current Operations Umtanum Gauge at River Mile 1404
4500
s)
fc 4000
(ow
3500
Fl
e 3000
lint 2500 ecre 2000
Py 1500
hltn 1000 oM 500
0
tobe
r
ber
ber
ary h y
cO
D
yFe
brua
r c
Apr
il
May
June
Jul
Mar
Aug
ust
ber
vem
cem
Janu m
o e
N Sep
te
Month
50 25 75
The 1981-2003 period of record was used and the daily flows were generated from the RiverWare Model This means that if you were to compare for any given day the actual daily flow that occurred it would be somewhat different than that generated by RiverWare The difference is a reflection of differences in modeled river operations criteria to what actually occurred on that day
C-1
Tieton River near Tieton Canal Headworks Current Operations Tieton River Gauge at River Mile 209
(This gauge is used to represent discharge from the dam outlet which is located upriver at River Mile 213)
0
250
500
750
1000
1250
1500
1750
2000
Oct
ober
Nov
embe
r
Dec
embe
r
Janu
ary
Febr
uary
Mar
ch
Apr
il
May
June
July
Aug
ust
Sep
tem
ber
Month
Mon
thly
Per
cent
ile F
low
(cfs
)
50 25 75
The 1981-2003 period of record was used and the daily flows were generated from the RiverWare Model This means that if you were to compare for any given day the actual daily flow that occurred it would be somewhat different than that generated by RiverWare The difference is a reflection of differences in modeled river operations criteria to what actually occurred on that day
C-2
Naches River near Naches WA Current Operations Naches Gauge at River Mile 168
0
500
1000
1500
2000
2500
3000
3500
4000
Oct
ober
Nov
embe
r
Dec
embe
r
Janu
ary
Febr
uary
Mar
ch
Apr
il
May
June
July
Aug
ust
Sep
tem
ber
Month
Mon
thly
Per
cent
ile F
low
(cfs
)
50 25 75
The 1981-2003 period of record was used and the daily flows were generated from the RiverWare Model This means that if you were to compare for any given day the actual daily flow that occurred it would be somewhat different than that generated by RiverWare The difference is a reflection of differences in modeled river operations criteria to what actually occurred on that day
C-3
Yakima River at Cle Elum WA Current Operations Yakima River at Cle Elum Gauge at River Mile 1831
4000
) fs 3500
(cw
3000
ol F 2500
letine 2000
rce 1500
Pylth 1000
nM
o 500
0
tobe
r
ber
ber
ary y h
Apr
il
May
June yc
Jul
ber
mc Mar
O vem
cem
o e Janu
Febr
uar
Aug
ust
N D Sep
te
Month
50 25 75
The 1981-2003 period of record was used and the daily flows were generated from the RiverWare Model This means that if you were to compare for any given day the actual daily flow that occurred it would be somewhat different than that generated by RiverWare The difference is a reflection of differences in modeled river operations criteria to what actually occurred on that day
C-4
Appendix D
Whitewater Classification from American Whitewater
Whitewater Classification from American Whitewater
CLASS I Fast moving with riffles and small waves Few obstructions easily Easy avoided Low risk Easy self-rescue
Straightforward rapids wide clear channels evident without scouting CLASS II Occasional maneuvering Rocks and medium waves easily avoided Novice by trained paddlers Swimmers seldom injured
Rapids with moderate irregular waves that can swamp open canoes Strong eddies and currents Complex maneuvers and good control
CLASS III required in tight passages and around ledges Large waves or strainers Intermediate easily avoided Scouting advisable for inexperienced parties Self-
rescue usually easy group assistance may be required Injuries while swimming are rare
Powerful turbulent and predictable rapids large unavoidable waves and holes or constricted passages Fast reliable eddy turns and
precise boat handling needed to initiate maneuvers scout rapids or CLASS IV rest Rapids may require ldquomustrdquo moves above dangerous hazards Advanced Strong Eskimo roll highly recommended Scouting necessary first time Self-rescue difficult skilled group assistance often needed
Moderate to high risk of injury to swimmers
Extremely long obstructed or violent rapids with exposure to added risk Possible large unavoidable waves and holes or steep congested chutes Eddies may be small turbulent difficult to reach or non- CLASS V existent Reliable Eskimo roll proper equipment extensive Expert experience high level of fitness and practiced rescue skills essential
for survival Scouting recommended but may be difficult Swims are dangerous Difficult rescue for experts
These runs have almost never been attempted and often exemplify the CLASS VI extremes of difficulty unpredictability and danger The consequences Extreme and of errors are very severe and rescue may be impossible For teams of
Exploratory experts only at favorable water levels after close personal inspection and taking all precautions
D-1
Appendix E
WROS Zone Descriptions
Urban
Extensively developed municipal industrial commercial built structures
Modern facilities and amenities
Heavy concentration and interaction of people
Extensive management presence
City neighborhood and waterfront parks river trails and formal gardens
Mainly day use recreation
Presence of recreation and nonrecreation activities
Abundant and expansive marinas concessions and commercial services
Suburban
Landscape largely human built
Commercial and residential built structures
Modern facilities and amenities
Very prevalent management presence
Community parks greenways trails golf courses and open space
Day use with very limited overnight camping opportunities
Predominance of recreation activities with limited nonrecreation uses
Numerous marinas and concessions
Rural Developed
Widely dispersed homes farms ranches second homes lodges roads and utilities
Predominantly natural and pastoral landscapes with limited development
Balance of day use and overnight camping
Open space and pastoral setting
Obvious management presence
Limited number of marinas and concessions
Infrequent tranquility and solitude
Socialization and motorized use often more prevalent than other uses
E-1
Rural Natural
Predominantly natural landscapes with infrequent development
Rustic campgrounds with limited amenities
Marinas concessions and services nearby but outside the area
Occasional management presence
Balance motorizednonmotorized use
Occasional use of outdoor skills required
County and regional parks and open space
Outdoor recreation and agriculture are the dominant land uses
Socialization less important
Periods of solitude and tranquility possible
Semiprimitive
Large expanse of natural appearing landscapes
Socialization not important
Self-reliance risk and outdoor skills may be needed
Rustic trails camping areas trail heads and unimproved launch sites
Nonmotorized recreation often more prevalent than motorized use
Infrequent management presence
Pack it in pack it out
Frequent solitude and tranquility
Primitive
Great expanse of natural-appearing landscape
Predominantly nature-based recreation with no motorized use
Extensive risk self-reliance and outdoor skills required
Very infrequent management presence
Little evidence of human impacts and nonrecreation use
Socialization outside group is rare
Pack it in pack it out
Solitude and tranquility dominant
E-2
Appendix F
WROS Inventory Maps
- RecreationDemandpdf
-
- Recreation Demand and User Preference Analysis13
- Table of Contents13
- Introduction13
- Study Authority13
- Structure of Analysis Report13
- Purpose and Objectives13
- Scope and Methodology13
- Findings of Analysis13
- Projections of Recreation Demand and User Preference13
- References Cited13
-
- Appendix A WROS Executive Summary13
- Appendix B Black Rock Dam and Reservoir Recreation Needs Assessment13
-
- Attachment 1 of Appendix B Public Access Points for Water Oriented Recreation13
-
- Appendix C River Flow Hydrographs13
- Appendix D Whitewater Classification from American Whitewater13
- Appendix E WROS Zone Descriptions13
- Appendix F WROS Inventory Maps13
-
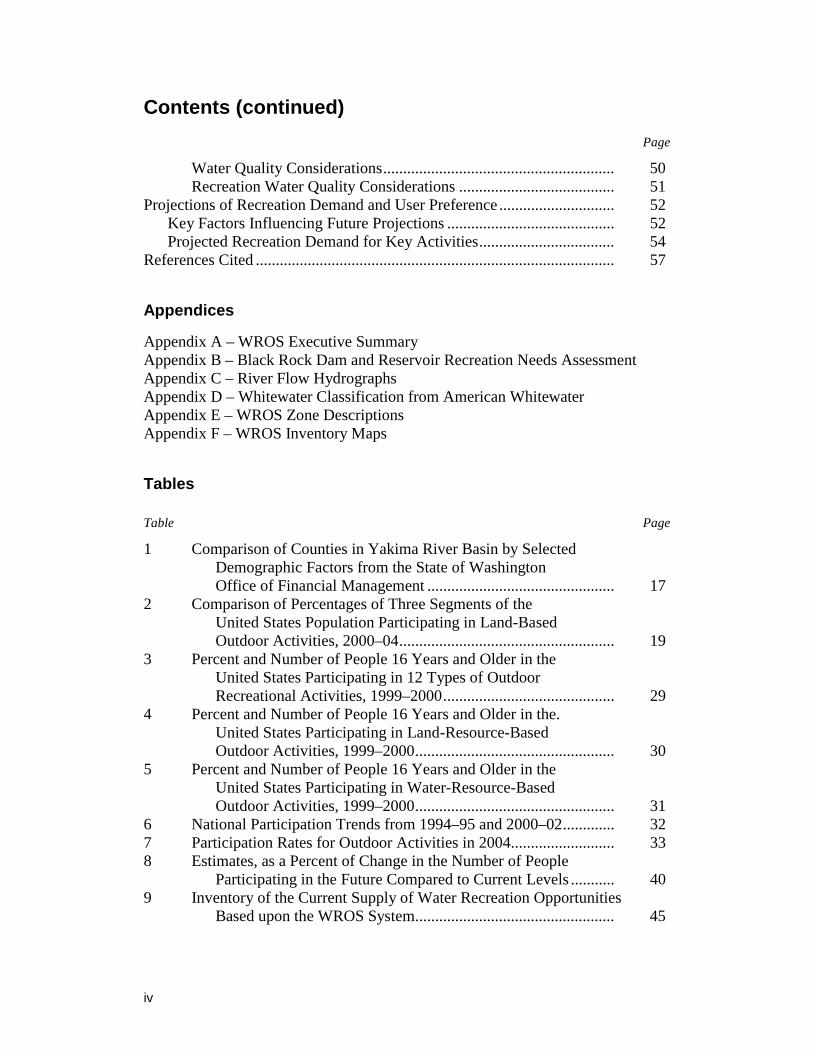