recycling of technology metals opportunities & limitationsrecycling of technology metals....
TRANSCRIPT

Recycling of technology metalsRecycling of technology metals Opportunities & limitationsOpportunities & limitations
Dr. Christian Dr. Christian HagelHagelüükenken
––
Precious Metals RefiningPrecious Metals Refining
Capital Markets Event on Recycling Capital Markets Event on Recycling ––
1818--19 Nov 201019 Nov 2010

2
Agenda
•
Technology materials scarcity
•
Urban mining
•
The recycling chain
•
Impact of legislation
•
Conclusion

Technology materials scarcity

4
What are technology metals?
H
K
Be
ScCa
Li
Na
Ti
Mg
V MnCr Fe Co CuNi Zn Ga Ge As BrSe Kr
Al Si P ClS Ar
B C N FO Ne
He
Rb YSr Zr Nb TcMo Ru Rh AgPd Cd In Sn Sb ITe Xe
Cs La-LuBa Hf Ta ReW Os Ir AuPt Hg Tl Pb Bi AtPo Rn
K Ac-LrCa Rf Db BhSg Hs Mt
Precious
metals
Rare earth
elements (REE)
Technology metals are used in a wide range of technological applications
Semiconductor
materials
EU critical
materials (RMI)
Technology
metals
Be
Sc
Li
Co Ga Ge As Se
Si
Mo Ru Rh AgPd Cd In Sn Sb Te
Re Ir AuPt BiLa-Lu
Ac-Lr
Ta
NbY Zr
Hf
Mg
W

5
Recent boom in demand for most technology metals
% mined in 1980-2010
% mined in 1900-1980
Mine production since 1980 / since 1900
0%
10%
20%
30%
40%
50%
60%
70%
80%
90%
100%
Re Ga In Ru Pd Rh Ir REE Si Pt Ta Li Se Ni Co Ge Cu Bi Ag Au
% mined in 1980-2010
% mined in 1900-1980
REE = Rare Earth Elements

6
Emerging technologies will further boost demand for technology metals
Multiple examples:
•
Electric vehicles & batteries cobalt, lithium, rare earth elements, copper
•
Fuel cells
platinum, (ruthenium, palladium, gold)
•
Photovoltaic (solar cells) silicon, silver, indium, gallium, selenium, tellurium, germanium
•
Thermo-electrics, opto-electronics, LEDs, …
bismuth, tellurium, silicon, indium, gallium, arsenic, selenium, germanium, antimony, …
•
…

7
Challenge to maintain performance which is often based on specific critical-chemical substance properties
Potential substitute often comes from same metal family
→ Substituting scarce In by scarce Ga
?
Consider side effect of substitution•
Toxicity
•
Recyclability
•
Price effects
•
Performance impact
Substitution possibilities are limited
Example: Opto-electric
applications

8
C. Hagelüken, C.E.M. Meskers: Complex lifecycles
of precious
and special metals
in Linkages
of Sustainability. Strüngmann Forum Report vol. 4. T. Graedel, E. van der Voet (eds.) Cambridge, MA, MIT Press 2009.
Technology metals mainly come as a mining by-product
Many “technology”
metals come as a by-product from primary mining for “base”
metals
Supply of many “technology metals”
is price-inelastic:•
Increased demand can only be met by primary production if demand for major metal rises accordingly
•
Short term demand surges lead to price peaks (see Ir, Ru, In)

9
The EU resources strategy•
Decoupling growth from impact
•
From protection to environment
•
From effectiveness to efficiency
EU strategy is useful & realistic for base
metals, especially if used in infrastructure
“Smarter”
growth will require more technology metals
EU resources strategy creates issues•
Technical solutions to improve resource efficiency & mitigate climate impact
rather need more than less precious/special metals (PV, EV, catalysis etc.)
•
Primary supply of by-product technology metals will drop in case of:
•
Successful decoupling for base metals (Cu, Ni, Al, Pb)
•
Improved recycling of base metals
•
Supply restrictions for lead, nickel, etc.
GDP
Resource demand
Negative impact
25 years
Source: “Next steps for EU waste and resource Policies”,
R. v.d.Vlies, DG Env., Brussels, 17/06/2009

10
Resource efficiency needed to deal with scarcity of technology metals
Demand is growing•
Global growth
•
Demand for technology metals well above GDP
•
Limited substitution possibilities
Supply is limited•
Worldwide primary supply (from mining) is limited
•
Mining possibilities limited by the coupling of technology metals with base metals
•
Mining creates geopolitical dependence
•
Short term supply often impacted by speculation on commodities
⇒
RECYCLING is essential to preserve RESOURCE EFFICIENCY

Urban mining

12
Urban mining “deposits” can be much richer than primary mining ores
Primary mining
•
~5 g/t
Au in ore
•
Similar for PGMs
Urban mining
•
200-250 g/t
Au in PC circuit boards
•
300-350 g/t
Au in cell phones
•
2000 g/t
PGM in automotive catalysts

13
a) Mobile phones
1300 million units/ yearX
250
mg
Ag
≈
325
t
Ag
X 24 mg Au ≈
31
t
Au
X 9 mg Pd ≈
12
t
Pd
X 9 g Cu ≈
12,000
t
Cu
1300 million Li-Ion batteries
X 3.8
g
Co
≈
4900
t
Co
a+b) Urban mine
Mine production / shareAg:
21,000
t/a
►
3%
Au:
2,400
t/a
►
4%
Pd:
220
t/a
►
16%
Cu:
16
Mt/a
►
<1%
Co:
75,000
t/a
►
19%
Global sales, 2009
b) PCs & laptops
300 Million units/yearX
1000
mg
Ag
≈
300
t
Ag
X
220
mg
Au
≈
66
t
Au
X 80 mg Pd ≈
24
t
Pd
X
~500
g
Cu
≈150,000t
Cu
~140 million Li-ion batteriesX 65 g Co ≈
9100
t
Co
Low loadings per unit, but volume counts Example: Metal use in electronics
Tiny metal content per piece → Significant total demand
Other electronic devices add even more to these figures

14
Large total volumes•
Global sales in 2009 of some 57 million cars
•
Current car fleet of some1.3 billion
Demand for “technology metals”
rises in modern vehicles•
Car electronics
•
EV/HEV
•
etc.
Significant amounts of metals locked up in the urban mine Example: Metal use in automotive
Metal demand in automotive
in 1000 t/a
Share of primary
production
*
Steel 100,000 10 %Al 7 300 30 %Pb** 7 000 170 %Cu 1 900 12 %Ni 140 10 %
…
Pt*** 0.12 65 %Pd*** 0.14 > 60 %Rh*** 0.03 110 %
2008 data (rounded)
*
>100% → additional supply from recycling**
Pb
use in batteries (mainly automotive)***Pt, Pd, Rh
mainly in autocatalysts

15
Cu
Co
Au
Pt
In
Sn
Ag
Pd
Ru
t CO2
/
t primary
metal *
≈
≈
10,000
200
10
0
* Source:
Ecoinvent
2.0, EMPA/ETH-Zürich, 2007
Urban mining prevents impact from non-recycling•
Hazardous emissions
•
Land use
Recycling mitigates environmental impacts of mining•
Less energy consumption/CO2
production
•
Less land & water use
•
Less pressure on ecological in sensitive areas
Recycling lowers CO2
footprint for majority of metals•
Example of gold mining in South Africa:
Concentration of 5 g/t; 3000m underground
•
Example of Umicore Hoboken:
70,000 t metals produced ≈
1M t CO2
saving potential
vs
primary metal production
Urban mining offers significant environmental advantages

16
Urban mining offers ethical sourcing possibilities
Manufacturers are explicitly looking for refiners with excellent
environmental performance
Manufacturers increasingly focus on effective and transparent recycling chains via auditing, including the end-processor
Manufacturers are increasingly concerned about preventing sourcing of metals from conflict areas, particularly Ta, Co, Sn, (Au)
Pressure from civil society increases to avoid substandard (e-scrap) recycling processes and use of metals from conflict areas
⇒
Leads to push for supply and recycling chain transparency
including the metals mining & refining sector
⇒
Urban mining responds to some of these demands

Recycling chain

18
Primary mining vs
secondary recycling
Raw materials come from ore deposits, which are large in size and geographically fixed
Mature market structure•
Stakeholders:
Usually large mining & metallurgical companies
•
Material flows:
Concentrates often shipped to smelters that source globally
•
Transparency:
High; Official business with relatively good statistical data
Ore
processing
MiningSmelting &
refining
Ore
deposits
Refined
metals
Primary mining

19
Raw materials supply is smaller in size and dissipated over many
consumers/locations
More challenging structure with needs for change •
Stakeholders:
Consumers ↔ Businesses
•
Collection, dismantling & pre-processing: Municipalities, scrap yards and dealers, waste management companies
•
Smelting & refining: Large metallurgical companies, backyard recyclers, traders and
”pseudo refiners”
•
Material flows:
Complex fractions from pre-processing partly to smelters, but often to less efficient local treatment or “backyard”
operations in developing countries
•
Transparency:
Low; Many hidden flows; Lots of informal or shady business with poor statistical data
Primary mining vs
secondary recycling
Dismantling &
pre-processing
CollectionSmelting &
refining
End-of-life
products
Recycled
metals
Secondary recycling

20
From: Disney/Pixar www.wall-e.com
Specialty metals recycling is more complex than in the movies
Technical accessibility of relevant components•
E.g. electronics in modern cars, REE-magnets
in electric motors, …
•
Need for “Design for disassembly”, sorting & “pre-shredder”
separation technologies
Thermodynamic challenges & difficult metal combinations for “trace elements”•
Laws of Nature cannot be broken
•
E.g. rare earth elements, tantalum, gallium, beryllium in electronics, lithium in batteries
•
Need for recyclability consideration in development of new material combinations
Material quality requirements need to be met

21
Bottle glass
Green glassWhite glassBrown glass
Steel scrap
+
Circuit boards Autocatalysts
• “Mono-substance”
materials without hazards
• Trace elements remain part of alloys/glass
Recycling focus on mass and costs
• ”Poly-substance”
materials, incl. hazardous elements
• Complex components as part of complex products
Recycling focus on value recovery from trace elements
Mass recycling vs
specialty metals recycling
Specialty metals PGMs

22
Recycling chain System approach is key
•
Consider the entire chain & its interdependences
•
Precious metals dominate economic & environmental value ⇒ minimise PM losses
•
Mass flows ≠
flows of technology metals
•
Success factors ⇒ interface optimisation, specialisation, economies of scale
⇒
The total recycling efficiency is determined by the weakest step
in the chain
Dismantling &
pre-processing
CollectionSmelting &
refining
50% X 33%Example: 70% X 95% =
Reuse
End-of-life
products
Final wasteSeparated components
& fractions
Recycled
metals

23
Inefficiencies severely limits recycling possibilities
⇒
Very low recycling rate
in spite of efficient technology
Bars not to scale
1
Based on 4 year life cycle (Production figures of 2005)
2
25-35% of professionally collected phones are not fit for reuse and sent directly to recycling.
3
Global quantities treated for material recovery efficiently and
environmentally sound
Not collected
Recy-
cling2
Stored “in drawer”
(potential for recycling
at later stage)
Disposed with
household waste
(unrecoverable loss)
2nd
lifeExport to deve-
loping countries
Not collected
Recycling potential in 20091
800M units x 100 g = 80,000 t
Recycling
reality in 20093
Collected
Reuse
Col-
lected
Re-exportto West
Local backyard
treatment & recycling
<20M units x 100g
= <2000 t
Example of mobile phones

24
Fotos BAN
*source: Huisman, Kühr
et. al: WEEE review report, 2007
Western recycling chain competes with inefficient backyard recycling in developing countries
Example of e-scrap
WEEE from Europe: •
60% WEEE not properly recycled, metals are lost (exports, trash bin, …)*
•
70% for IT & telecom, small household appliances*
•
Loss of metals > 5 billion US-$
Backyard “recycling“
in Asia & Africa•
High metal losses (Au-yield ≈
25%)
•
Dramatic environmental & health impact
•
Failing law enforcement

25
*Illustrative figures
Room for improvement in the recycling chain
80% X 20%50% X 50% =
50% X 12%25% X 95% =
Example of gold recycling
Figures are illustrativeAre we doing much better in “the West”
today?
Collection Dismantling & pre-processing Smelting & refining

26
Economic recycling challenges
Most precious metals containing waste materials have a positive net value•
Value of metals contained outweighs cost of recycling
Specialty metals containing waste materials may have negative net value
in the absence of certain “paying metals”
in the same metal feed•
Value/price of metal not sufficient to compensate for cost of recycling
•
Negative net value due to low critical metal concentrations in products
•
E.g. lithium in batteries, indium in LCDs & PV-modules
→ Create economic recycling incentives (subsidies) & improve technology (costs & efficiency)
Dissipative use inhibits economic recycling (regardless of price
level)•
E.g. silver in textiles or RFID chips
→ Avoid dissipative use or look for non-critical substitutes
⇒
Legislative initiatives required in certain cases

Impact of legislation

28
Criticality, a new driver for recycling?
Legislation needed for certain recycling drivers
Economic incentive e.g. : autocat, Al-wheel rim, Cu-scrap, precious metals, …
Recycling
Sustainable access
to critical metals
Value
Environment Volume
Too much to dump e.g. : household waste, debris, packaging, …
Risk for EHS (Environment, health & safety)
e.g..: asbestos, Hg, airbags, waste oil, …
Current recycling-drivers•
Value:
•
Taken care of by the market, pays for itself
•
Set EHS frame conditions!
•
EHS & volume
•
Society driven
•
Negative net value
Future recycling drivers:•
“Critical metals”
•
Macro economic significance
•
Enhanced recycling worthwhile also without volume or EHS risks
Driven by legislation

29
Waste legislation
Basel Convention•
Regulates transboundary
movement of hazardous waste
•
Implemented in the EU through the Waste Shipping Directive
European waste legislation is based on the Waste Framework Directive
(WFD)•
Contains the definitions of waste, recovery and recycling
and sets out the waste hierarchy
•
Prevention → Re-Use → Recycling → Other Recovery (e.g. energy recovery) → Disposal
•
Includes end-of-life (EoL) legislation, which regulates specific waste streams
•
WEEE
(Waste Electrical & Electronic Equipment), ELV
(EoL
Vehicles) and Battery
Directives
•
Defines producer responsibility and specifies mandatory recycling rates
In the USA, the definition of waste (RCRA) is similar to the WFD
definition, but there is a long list of exclusions, including scrap metal and shredded circuit boards.
Legislation is also implemented in other countries and regions
Umicore actively engages with authorities and other stakeholders
to make the legislative framework work more effective and efficient

30
Resource legislation Raw Materials Initiative (RMI) in the EU
The Raw Materials Initiative1)
Ensure access to raw materials
2)
Set the right framework conditions
3)
Boost overall resource efficiency and promote recycling to reduce the EU’s consumption of primary raw materials and decrease the relative import.
Recycling recommendations developed in the RMI critical metals group•
Mobilising relevant EoL products for proper collection instead of stocking, landfill or incineration
•
Improving overall organisation, logistics & efficiency of recycling chains by focusing on interfaces and system approach
•
Preventing illegal exports of relevant EoL products & increasing
transparency in flows
•
Promoting R&D on system optimisation & recycling of technically challenging products & substances
Umicore involvement•
Umicore directly participated as expert member of the critical metals work group and indirectly involved through Eurometaux RMI task force, chaired by Umicore
•
Ongoing intensive dialogue between Umicore and EU commission/parliament about RMI follow up

31
Additional/ specific recycling recommendations developed by the Eurometaux RMI task force
10 concrete proposals under 4 pillars1)
Enforcing trade-related aspects of environmental legislation
•
Customs identification of second hand goods
•
Improved enforcement of Waste Shipment Regulation
•
End-of-Waste
2)
Ensuring level playing field for processing secondary raw materials
•
Certification scheme of collection, pre-processors & refiners of
waste & secondary RM
•
Facilitate & encourage the re-shipping of complex materials to
BAT-recycling plants in Europe
3)
Improving management of raw materials and their efficient use
•
Promote the efficient collection and recycling of rechargeable batteries
•
The eco-leasing concept
•
Better recycling data
•
Research on recyclability
4)
Economic viability of recycling
Existing EU policy framework
Improving access
to secondary materials
Trad
e as
pect
s
Leve
l pla
ying
fie
ld
Raw
mat
eria
ls
man
agem
ent
and
use
Econ
omic
via
bilit
y of
re
cycl
ing

32
To what extent does current legislation help?
Legislation helps•
Awareness raising, supportive legal framework
•
Development of take-back infrastructure, collection targets, EU wide reporting
•
Resource aspect of recycling is on the radar screen now,
beyond the traditional waste/environmental aspects
Legislation can be improved•
Weak enforcement of legislation
•
Poor monitoring of end-of-life flows
•
Illegal exports
•
Collection targets not ambitious enough, collection remains well
below potential
•
Mass-based targets don’t help for technology metals (“trace elements”)
•
Neither clear definitions nor reliable supervision of recycling standards exist

Conclusion

34
Conclusions
Scarcity of technology materials is created by a number of factors
•
Urban mining offers a credible solution to the scarcity issue
Recycling of specialty metals requires a different approach than
primary refining and recycling of “mono-substance“
products
The total recycling efficiency is determined by the weakest step
in the chain
•
High-tech end–refining processes like Umicore Hoboken are of key importance
•
Successful recycling requires a sound understanding of the overall system and interdisciplinary approach
Legislation is necessary for certain recyclable materials
•
Enforcement of legislation still shows room for improvement

35
Forward-looking statements
This presentation contains forward-looking information that involves risks and uncertainties, including statements about Umicore’s plans, objectives, expectations and intentions.
Readers are cautioned that forward-looking statements include known and unknown risks and are subject to significant business, economic and competitive uncertainties and contingencies, many of which are beyond the control of Umicore.
Should one or more of these risks, uncertainties or contingencies materialize, or should any underlying assumptions prove incorrect, actual results could vary materially from those anticipated, expected, estimated or projected.
As a result, neither Umicore nor any other person assumes any responsibility for the accuracy of these forward-looking statements.
36
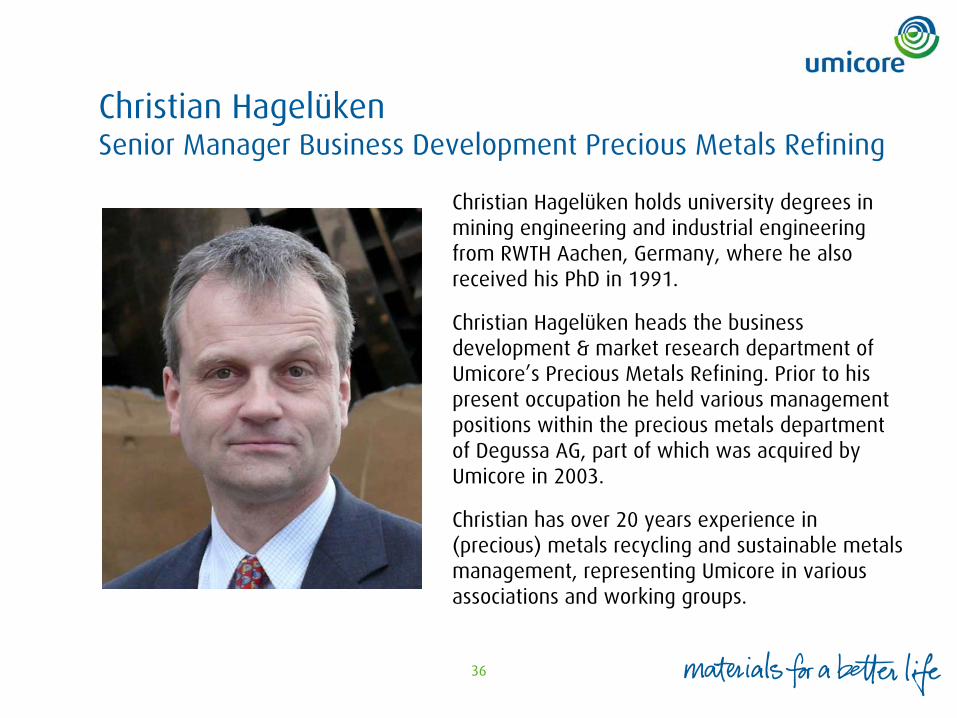
Christian Hagelüken Senior Manager Business Development Precious Metals Refining
Christian Hagelüken
holds university degrees in mining engineering and industrial engineering from RWTH Aachen, Germany, where he also received his PhD in 1991.
Christian Hagelüken
heads the business development & market research department of Umicore’s Precious Metals Refining. Prior to his present occupation he held various management positions within the precious metals department of Degussa AG, part of which was acquired by Umicore in 2003.
Christian has over 20 years experience in (precious) metals recycling and sustainable metals management, representing Umicore in various associations and working groups.