redington (india) ltd. -...
TRANSCRIPT
Redington (India) Ltd.
BUY
- 1 of 22 - Tuesday 21st July, 2015
This document is for private circulation, and must be read in conjunction with the disclaimer on the last page.
ST
OC
K P
OIN
TE
R
Target Price ₹169 CMP ₹101 FY17E PE 7.2x
Index Details Redington (India) Ltd. (Redington), which commenced operations in
1993 as a single product distributor has now evolved into an
integrated supply chain solutions provider. As of 2015, it is the
second largest distributor of IT and non-IT products in India. It has a
diversified product portfolio across 170+ brands in different
categories, with a strong distribution network spread across India,
South Asia, Middle East, Africa & Turkey supported with adequate
warehousing facilities.
We are positive on the company’s prospects given that:
The demand for PCs and Laptops is likely to stabilize after
declining in the past couple of years on the back of its
inherent utility for content creation and revival in IT spending.
Also, Redington has long-standing relationships with leading
IT vendors world-wide. Given the wide range of offerings, we
expect its IT distribution revenues to grow at a two year CAGR
of 10% to ~₹30,000 crores in FY17.
The demand for smart phones is expected to grow at a robust
pace. With other high growth product categories such as
consumer durables and digital printing press space in its kitty,
we expect non-IT distribution revenues to clock a 30% CAGR
and reach ~₹11,000 crores by FY17.
The roll-out of GST and the E-commerce boom are potential
triggers which can quickly scale up Redington’s newly
launched logistics vertical.
Revenues are expected to grow at a CAGR of 15% to ₹41,632 crore
by FY17. We expect PAT to grow at a 3 year CAGR of 21% to ₹564
crore by FY17. We initiate coverage on Redington as a BUY with a
Price Objective of ₹169, representing a potential upside of 66% over
a period of 18 months. At the CMP of ₹101, the stock is trading at
7.1x its forward earnings for FY17EPS. We have valued Redington by
assigning a PE of 12x to FY17E EPS of ₹14.1.
Sensex 28,182
Nifty 8,529
BSE 100 8,728
Industry Comm. Trading
Scrip Details
Mkt Cap (₹cr) 4,095
BVPS (₹) 59.4
O/s Shares (Cr) 39.9
Av Vol (Lacs) 0.5
52 Week H/L 147/87
Div Yield (%) 1.9
FVPS (₹) 2.0
Shareholding Pattern
Shareholders %
Promoters 13.3
DIIs 25.2
FIIs 27.2
Public 34.3
Total 100.0
Redington vs. Sensex
22000.00
23000.00
24000.00
25000.00
26000.00
27000.00
28000.00
29000.00
30000.00
31000.00
0.00
20.00
40.00
60.00
80.00
100.00
120.00
140.00
160.00
10-J
ul-1
4
31-J
ul-1
4
21-A
ug
-14
11-S
ep
-14
02-O
ct-1
4
23-O
ct-1
4
13-N
ov-1
4
04-D
ec-1
4
25-D
ec-1
4
15-J
an
-15
05-F
eb
-15
26-F
eb
-15
19-M
ar-1
5
09-A
pr-1
5
30-A
pr-1
5
21-M
ay-1
5
11-J
un
-15
02-J
ul-1
5
Redington SENSEX
Key Financials (₹ in Cr)
Y/E Mar Net
Sales EBITDA PAT
EPS
(Rs)
EPS Growth (%)
RONW (%)
ROCE (%)
P/E (x)
EV/EBITDA (x)
2014 27,944.9 661.1 336.6 8.4 4% 19.7 28.5 12.1 8.0
2015 31,554.9 700.0 386.5 9.7 15% 16.7 27.0 10.5 7.6
2016E 36,010.5 828.3 461.5 11.5 19% 16.3 26.5 8.8 6.4
2017E 41,631.9 990.6 564.0 14.1 22% 16.8 26.6 7.2 5.3
- 2 of 22- Tuesday 21st July, 2015
This document is for private circulation, and must be read in conjunction with the disclaimer on the last page.
Company Background
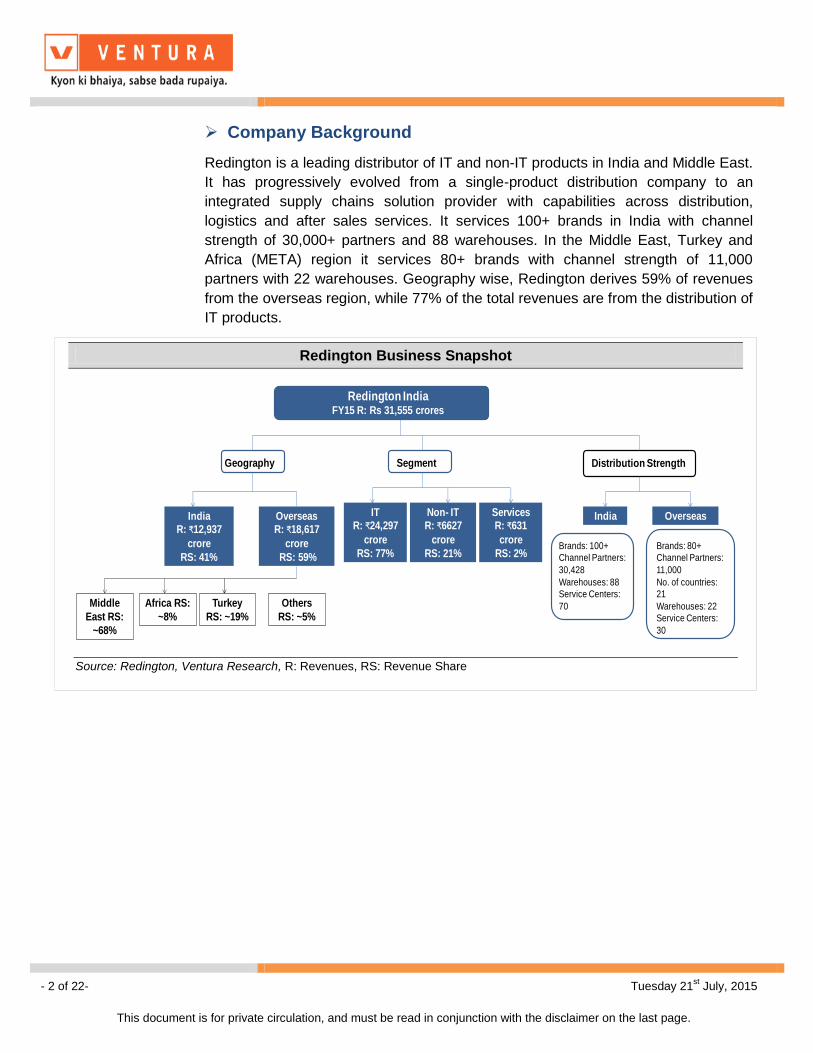
Redington is a leading distributor of IT and non-IT products in India and Middle East.
It has progressively evolved from a single-product distribution company to an
integrated supply chains solution provider with capabilities across distribution,
logistics and after sales services. It services 100+ brands in India with channel
strength of 30,000+ partners and 88 warehouses. In the Middle East, Turkey and
Africa (META) region it services 80+ brands with channel strength of 11,000
partners with 22 warehouses. Geography wise, Redington derives 59% of revenues
from the overseas region, while 77% of the total revenues are from the distribution of
IT products.
Redington Business Snapshot
Redington IndiaFY15 R: Rs 31,555 crores
Segment
India R: ₹12,937
crore
RS: 41%
OverseasR: ₹18,617
crore
RS: 59%
Middle
East RS:
~68%
Africa RS:
~8%
Turkey
RS: ~19%
Others
RS: ~5%
Geography Distribution Strength
IT R: ₹24,297
crore
RS: 77%
Non- IT R: ₹6627
crore
RS: 21%
Services R: ₹631
crore
RS: 2%
India Overseas
Brands: 100+
Channel Partners:
30,428
Warehouses: 88
Service Centers:
70
Brands: 80+
Channel Partners:
11,000
No. of countries:
21
Warehouses: 22
Service Centers:
30
Source: Redington, Ventura Research, R: Revenues, RS: Revenue Share
- 3 of 22- Tuesday 21st July, 2015
This document is for private circulation, and must be read in conjunction with the disclaimer on the last page.
Key Investment Highlights
Leading distributor of IT and non-IT products
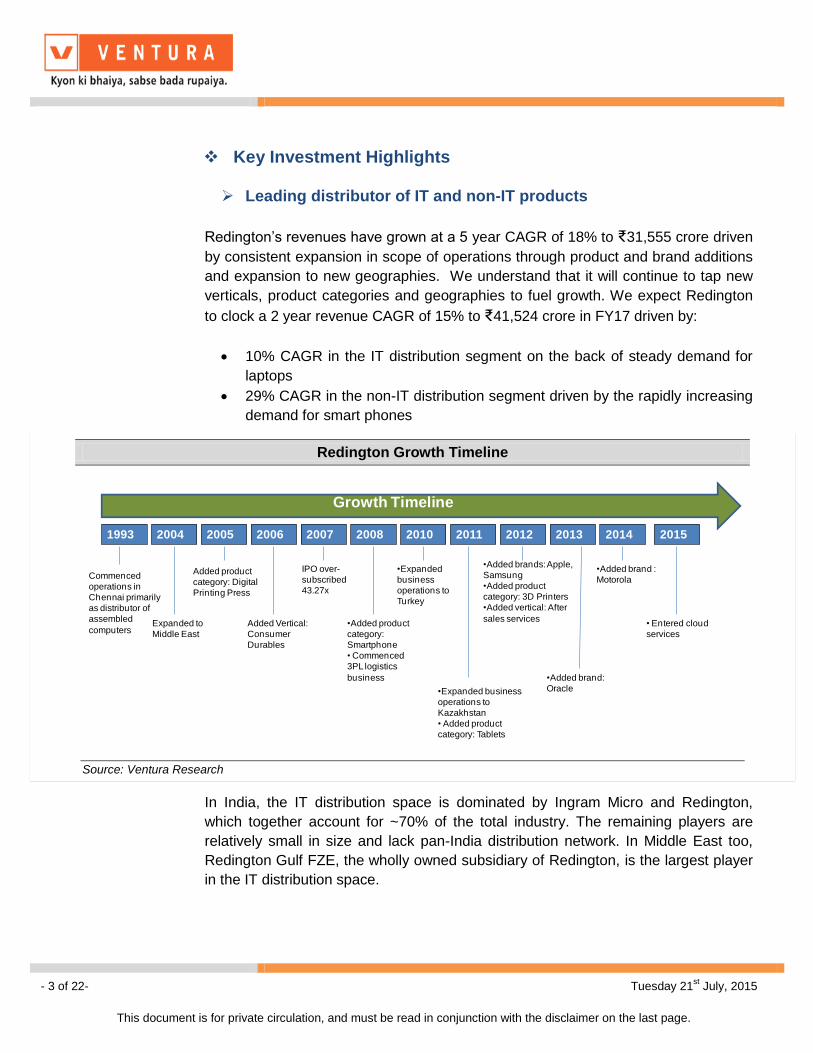
Redington’s revenues have grown at a 5 year CAGR of 18% to ₹31,555 crore driven
by consistent expansion in scope of operations through product and brand additions
and expansion to new geographies. We understand that it will continue to tap new
verticals, product categories and geographies to fuel growth. We expect Redington
to clock a 2 year revenue CAGR of 15% to ₹41,524 crore in FY17 driven by:
10% CAGR in the IT distribution segment on the back of steady demand for
laptops
29% CAGR in the non-IT distribution segment driven by the rapidly increasing
demand for smart phones
In India, the IT distribution space is dominated by Ingram Micro and Redington,
which together account for ~70% of the total industry. The remaining players are
relatively small in size and lack pan-India distribution network. In Middle East too,
Redington Gulf FZE, the wholly owned subsidiary of Redington, is the largest player
in the IT distribution space.
Redington Growth Timeline
Growth Timeline
1993 2004 2005 2006 2007 2008 2010 2011 2012 2013 2014
Commenced
operations in
Chennai primarily
as distributor of
assembled
computersExpanded to
Middle East
Added product
category: Digital
Printing Press
Added Vertical:
Consumer
Durables
IPO over-
subscribed
43.27x
•Added product
category:
Smartphone
• Commenced
3PL logistics
business
•Expanded
business
operations to
Turkey
•Expanded business
operations to
Kazakhstan
• Added product
category: Tablets
•Added brands: Apple,
Samsung
•Added product
category: 3D Printers
•Added vertical: After
sales services
•Added brand:
Oracle
•Added brand :
Motorola
2015
• Entered cloud
services
Source: Ventura Research
- 4 of 22- Tuesday 21st July, 2015
This document is for private circulation, and must be read in conjunction with the disclaimer on the last page.
IT distribution space to grow at a steady rate
Redington’s IT distribution segment includes PCs (both desktop and mobile),
peripherals, networking products, packaged software, storage products and high-
end servers, with PCs and peripherals accounting for 35-40% of total IT distribution
revenues. IT distribution revenues account for ~60% of total distribution revenues in
India and ~ 90% of total distribution revenues overseas.
We expect Redington’s IT revenues to grow at a 2 year CAGR of 10% to ₹29,667
crore by FY17. Factors driving the growth are:
i) While, global shipments of PCs and laptops are on a decline due to the
growth spurt in tablets, it does not pose a significant threat to Redington’s IT
distribution revenues. Desktop and Laptops are the primary mediums of
Redington: Vertical + Geography business Break-down
Redington IndiaFY15 R: Rs 31,555 crores
OverseasIndia
IT
RS: 60%
Non- IT
RS: 37%
Services &
Logistics
RS: 2%
IT
RS: 88%
Non- IT
RS: 10%
Services
RS: 2%
Source: Redington, Ventura Research
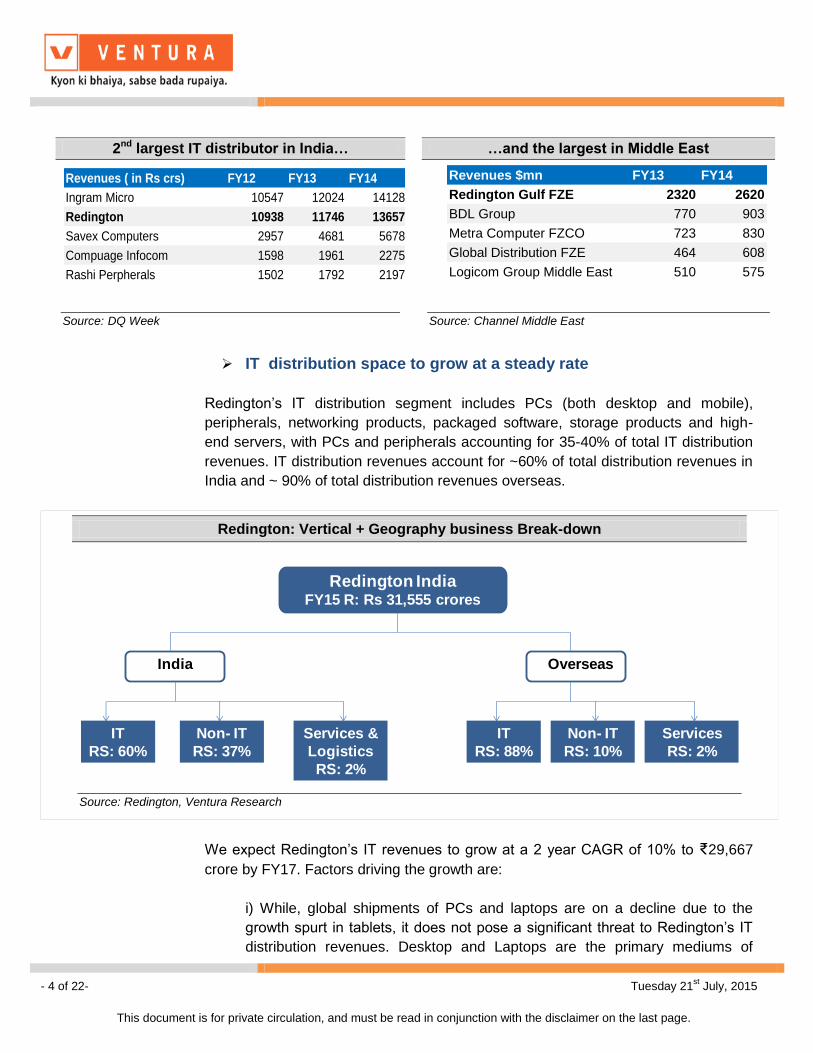
2nd largest IT distributor in India… …and the largest in Middle East
Revenues ( in Rs crs) FY12 FY13 FY14
Ingram Micro 10547 12024 14128
Redington 10938 11746 13657
Savex Computers 2957 4681 5678
Compuage Infocom 1598 1961 2275
Rashi Perpherals 1502 1792 2197
Revenues $mn FY13 FY14
Redington Gulf FZE 2320 2620
BDL Group 770 903
Metra Computer FZCO 723 830
Global Distribution FZE 464 608
Logicom Group Middle East 510 575
Source: DQ Week
Source: Channel Middle East
- 5 of 22- Tuesday 21st July, 2015
This document is for private circulation, and must be read in conjunction with the disclaimer on the last page.
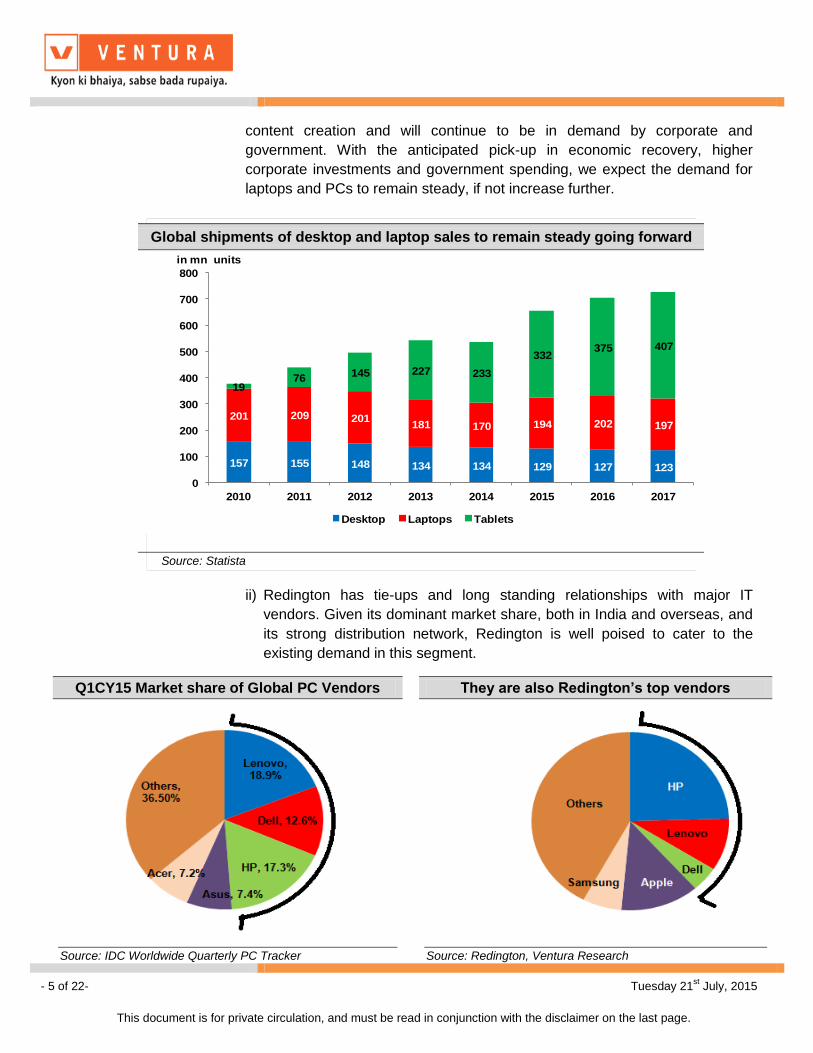
content creation and will continue to be in demand by corporate and
government. With the anticipated pick-up in economic recovery, higher
corporate investments and government spending, we expect the demand for
laptops and PCs to remain steady, if not increase further.
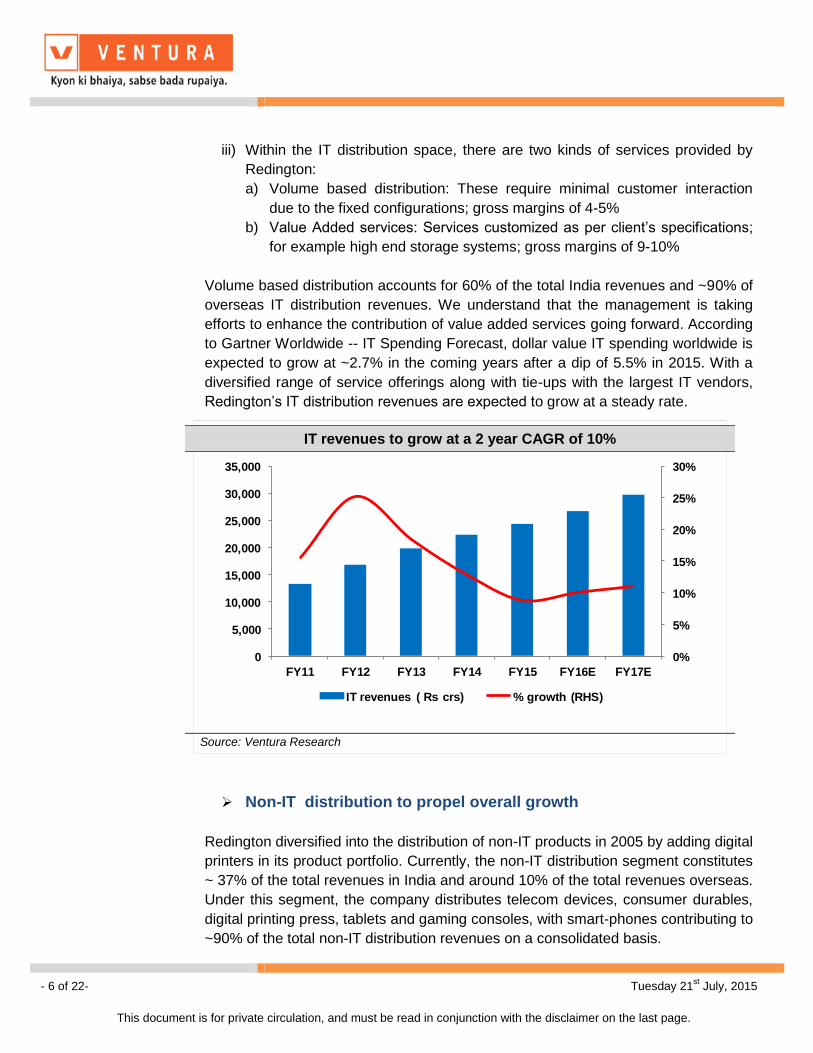
ii) Redington has tie-ups and long standing relationships with major IT
vendors. Given its dominant market share, both in India and overseas, and
its strong distribution network, Redington is well poised to cater to the
existing demand in this segment.
Q1CY15 Market share of Global PC Vendors They are also Redington’s top vendors
Source: IDC Worldwide Quarterly PC Tracker
Source: Redington, Ventura Research
Global shipments of desktop and laptop sales to remain steady going forward
157 155 148 134 134 129 127 123
201 209 201181 170 194 202 197
1976
145 227 233
332375 407
0
100
200
300
400
500
600
700
800
2010 2011 2012 2013 2014 2015 2016 2017
in mn units
Desktop Laptops Tablets
Source: Statista
- 6 of 22- Tuesday 21st July, 2015
This document is for private circulation, and must be read in conjunction with the disclaimer on the last page.
iii) Within the IT distribution space, there are two kinds of services provided by
Redington:
a) Volume based distribution: These require minimal customer interaction
due to the fixed configurations; gross margins of 4-5%
b) Value Added services: Services customized as per client’s specifications;
for example high end storage systems; gross margins of 9-10%
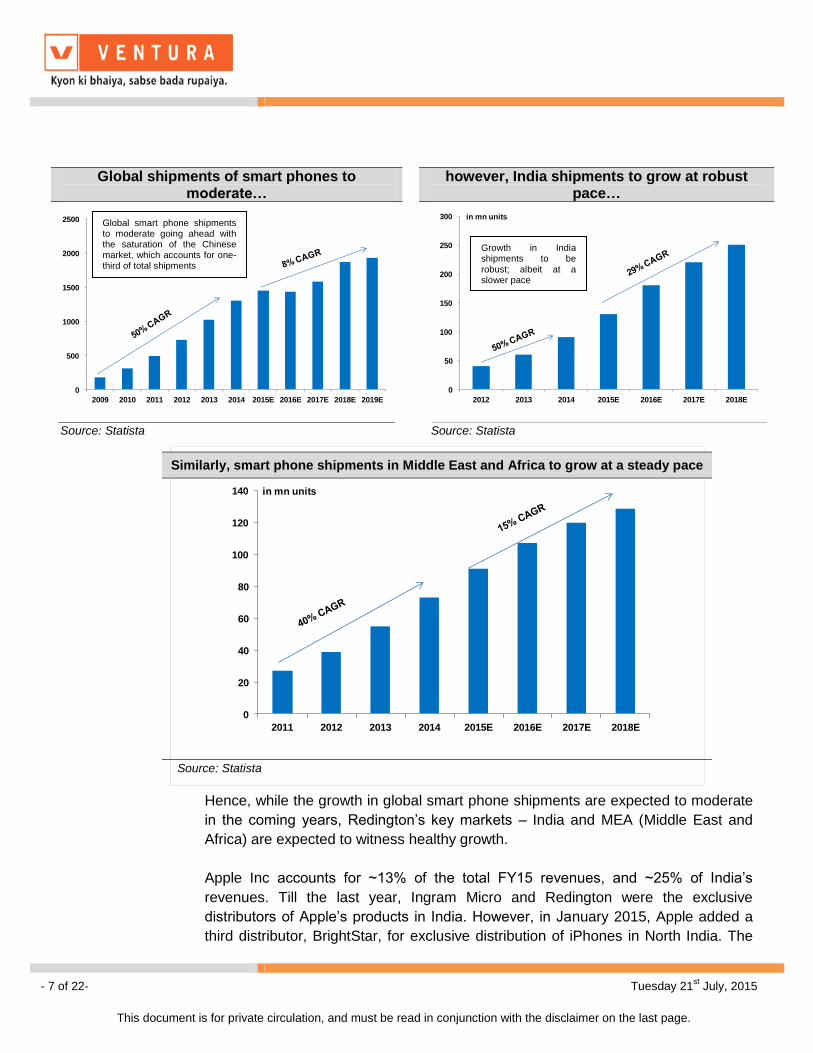
Volume based distribution accounts for 60% of the total India revenues and ~90% of
overseas IT distribution revenues. We understand that the management is taking
efforts to enhance the contribution of value added services going forward. According
to Gartner Worldwide -- IT Spending Forecast, dollar value IT spending worldwide is
expected to grow at ~2.7% in the coming years after a dip of 5.5% in 2015. With a
diversified range of service offerings along with tie-ups with the largest IT vendors,
Redington’s IT distribution revenues are expected to grow at a steady rate.
Non-IT distribution to propel overall growth
Redington diversified into the distribution of non-IT products in 2005 by adding digital
printers in its product portfolio. Currently, the non-IT distribution segment constitutes
~ 37% of the total revenues in India and around 10% of the total revenues overseas.
Under this segment, the company distributes telecom devices, consumer durables,
digital printing press, tablets and gaming consoles, with smart-phones contributing to
~90% of the total non-IT distribution revenues on a consolidated basis.
IT revenues to grow at a 2 year CAGR of 10%
0%
5%
10%
15%
20%
25%
30%
0
5,000
10,000
15,000
20,000
25,000
30,000
35,000
FY11 FY12 FY13 FY14 FY15 FY16E FY17E
IT revenues ( Rs crs) % growth (RHS)
Source: Ventura Research
- 7 of 22- Tuesday 21st July, 2015
This document is for private circulation, and must be read in conjunction with the disclaimer on the last page.
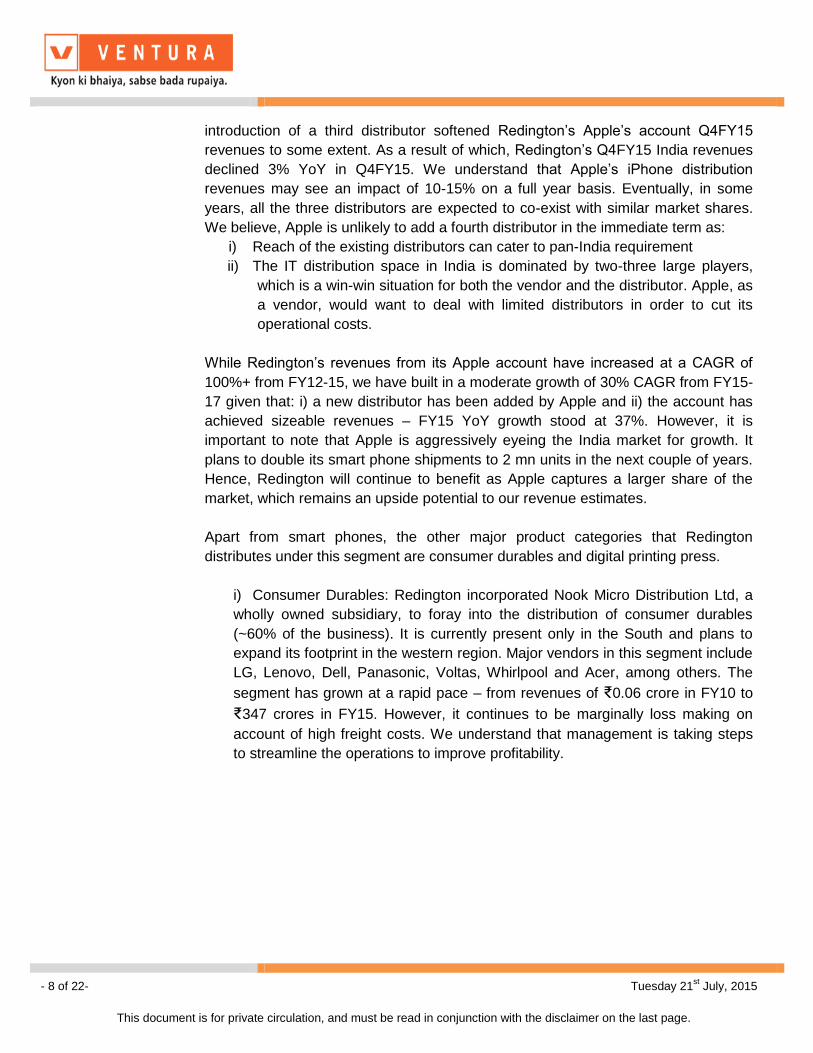
Hence, while the growth in global smart phone shipments are expected to moderate
in the coming years, Redington’s key markets – India and MEA (Middle East and
Africa) are expected to witness healthy growth.
Apple Inc accounts for ~13% of the total FY15 revenues, and ~25% of India’s
revenues. Till the last year, Ingram Micro and Redington were the exclusive
distributors of Apple’s products in India. However, in January 2015, Apple added a
third distributor, BrightStar, for exclusive distribution of iPhones in North India. The
Global shipments of smart phones to moderate…
however, India shipments to grow at robust pace…
0
500
1000
1500
2000
2500
2009 2010 2011 2012 2013 2014 2015E 2016E 2017E 2018E 2019E
in mn units
0
50
100
150
200
250
300
2012 2013 2014 2015E 2016E 2017E 2018E
in mn units
Source: Statista Source: Statista
Global smart phone shipments to moderate going ahead with the saturation of the Chinese market, which accounts for one-third of total shipments
Growth in India shipments to be robust; albeit at a slower pace
Similarly, smart phone shipments in Middle East and Africa to grow at a steady pace
0
20
40
60
80
100
120
140
2011 2012 2013 2014 2015E 2016E 2017E 2018E
in mn units
Source: Statista
- 8 of 22- Tuesday 21st July, 2015
This document is for private circulation, and must be read in conjunction with the disclaimer on the last page.
introduction of a third distributor softened Redington’s Apple’s account Q4FY15
revenues to some extent. As a result of which, Redington’s Q4FY15 India revenues
declined 3% YoY in Q4FY15. We understand that Apple’s iPhone distribution
revenues may see an impact of 10-15% on a full year basis. Eventually, in some
years, all the three distributors are expected to co-exist with similar market shares.
We believe, Apple is unlikely to add a fourth distributor in the immediate term as:
i) Reach of the existing distributors can cater to pan-India requirement
ii) The IT distribution space in India is dominated by two-three large players,
which is a win-win situation for both the vendor and the distributor. Apple, as
a vendor, would want to deal with limited distributors in order to cut its
operational costs.
While Redington’s revenues from its Apple account have increased at a CAGR of
100%+ from FY12-15, we have built in a moderate growth of 30% CAGR from FY15-
17 given that: i) a new distributor has been added by Apple and ii) the account has
achieved sizeable revenues – FY15 YoY growth stood at 37%. However, it is
important to note that Apple is aggressively eyeing the India market for growth. It
plans to double its smart phone shipments to 2 mn units in the next couple of years.
Hence, Redington will continue to benefit as Apple captures a larger share of the
market, which remains an upside potential to our revenue estimates.
Apart from smart phones, the other major product categories that Redington
distributes under this segment are consumer durables and digital printing press.
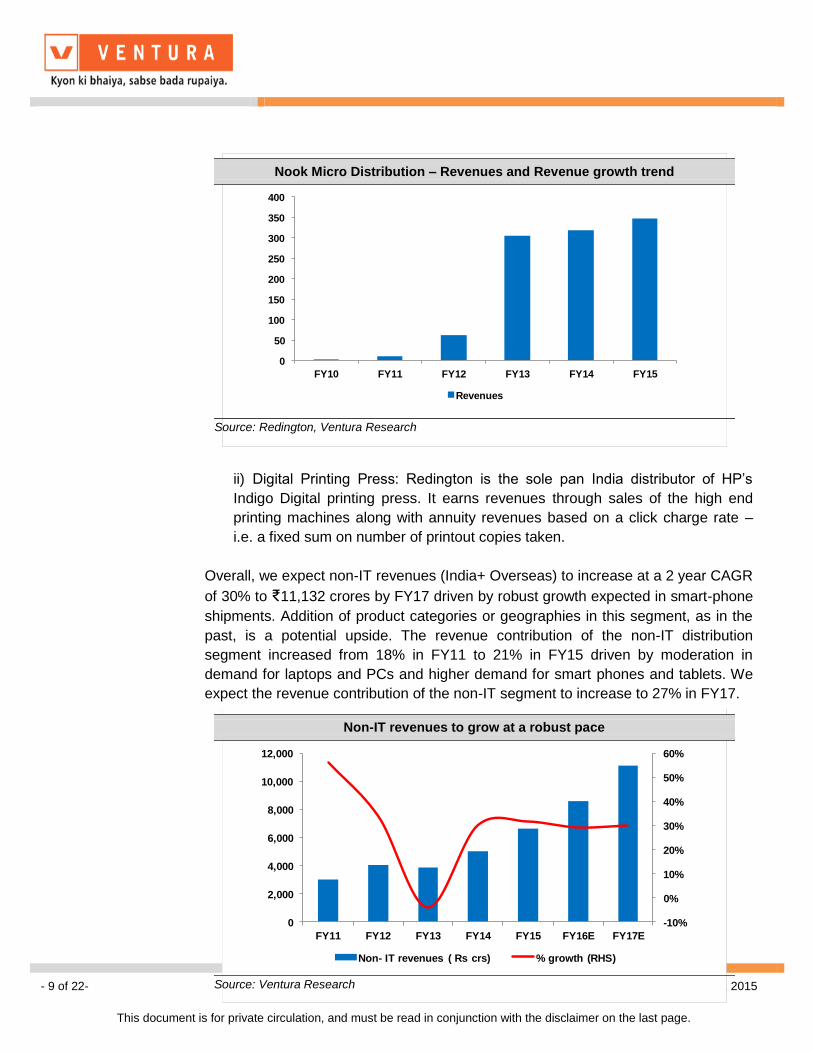
i) Consumer Durables: Redington incorporated Nook Micro Distribution Ltd, a
wholly owned subsidiary, to foray into the distribution of consumer durables
(~60% of the business). It is currently present only in the South and plans to
expand its footprint in the western region. Major vendors in this segment include
LG, Lenovo, Dell, Panasonic, Voltas, Whirlpool and Acer, among others. The
segment has grown at a rapid pace – from revenues of ₹0.06 crore in FY10 to
₹347 crores in FY15. However, it continues to be marginally loss making on
account of high freight costs. We understand that management is taking steps
to streamline the operations to improve profitability.
- 9 of 22- Tuesday 21st July, 2015
This document is for private circulation, and must be read in conjunction with the disclaimer on the last page.
ii) Digital Printing Press: Redington is the sole pan India distributor of HP’s
Indigo Digital printing press. It earns revenues through sales of the high end
printing machines along with annuity revenues based on a click charge rate –
i.e. a fixed sum on number of printout copies taken.
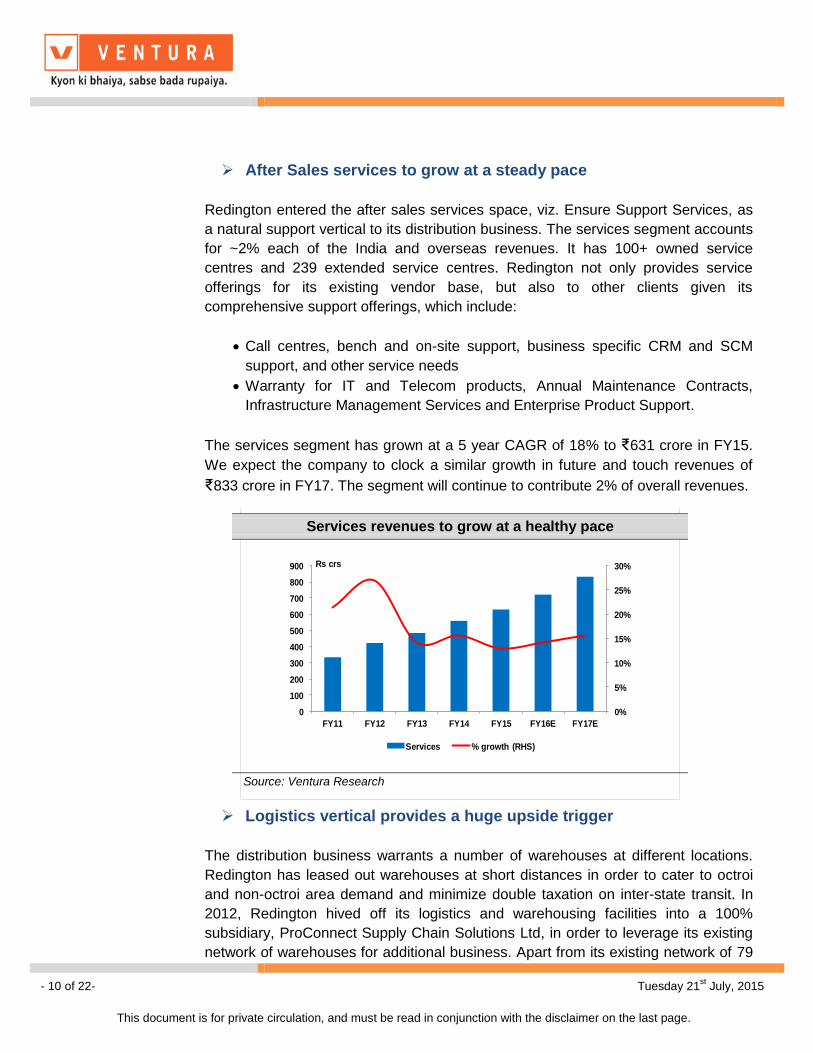
Overall, we expect non-IT revenues (India+ Overseas) to increase at a 2 year CAGR
of 30% to ₹11,132 crores by FY17 driven by robust growth expected in smart-phone
shipments. Addition of product categories or geographies in this segment, as in the
past, is a potential upside. The revenue contribution of the non-IT distribution
segment increased from 18% in FY11 to 21% in FY15 driven by moderation in
demand for laptops and PCs and higher demand for smart phones and tablets. We
expect the revenue contribution of the non-IT segment to increase to 27% in FY17.
Nook Micro Distribution – Revenues and Revenue growth trend
0
50
100
150
200
250
300
350
400
FY10 FY11 FY12 FY13 FY14 FY15
Revenues
Source: Redington, Ventura Research
Non-IT revenues to grow at a robust pace
-10%
0%
10%
20%
30%
40%
50%
60%
0
2,000
4,000
6,000
8,000
10,000
12,000
FY11 FY12 FY13 FY14 FY15 FY16E FY17E
Non- IT revenues ( Rs crs) % growth (RHS)
Source: Ventura Research
- 10 of 22- Tuesday 21st July, 2015
This document is for private circulation, and must be read in conjunction with the disclaimer on the last page.
After Sales services to grow at a steady pace
Redington entered the after sales services space, viz. Ensure Support Services, as
a natural support vertical to its distribution business. The services segment accounts
for ~2% each of the India and overseas revenues. It has 100+ owned service
centres and 239 extended service centres. Redington not only provides service
offerings for its existing vendor base, but also to other clients given its
comprehensive support offerings, which include:
Call centres, bench and on-site support, business specific CRM and SCM
support, and other service needs
Warranty for IT and Telecom products, Annual Maintenance Contracts,
Infrastructure Management Services and Enterprise Product Support.
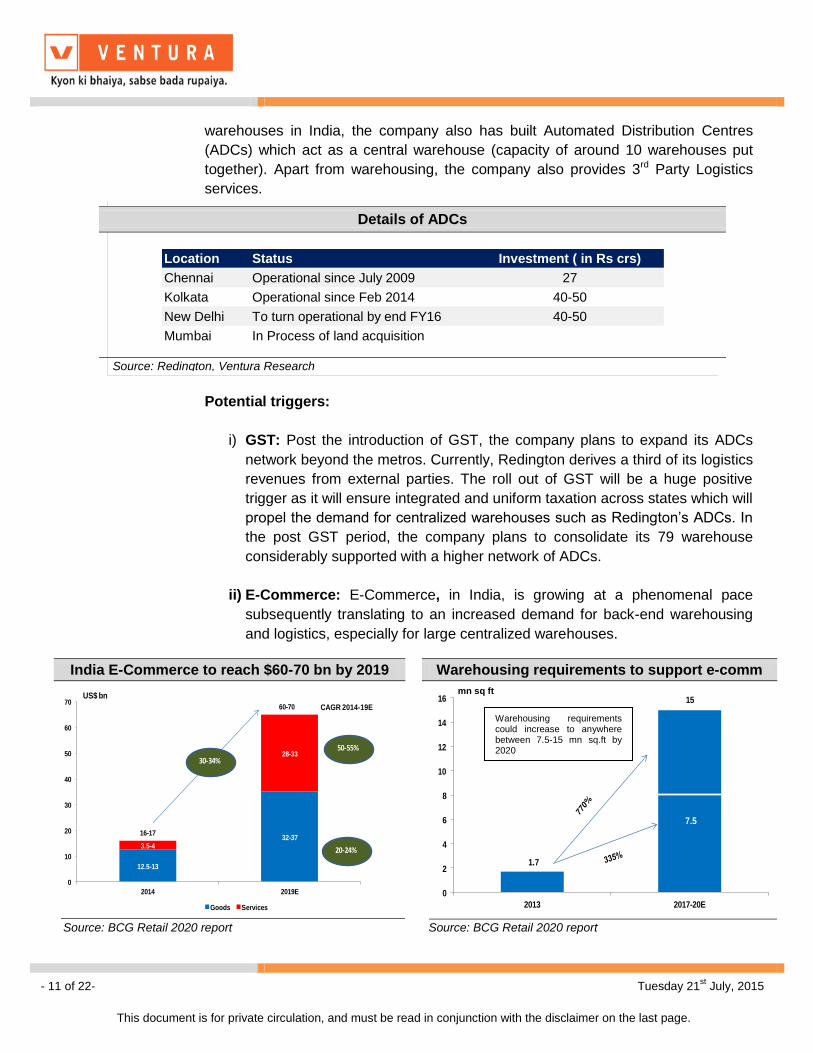
The services segment has grown at a 5 year CAGR of 18% to ₹631 crore in FY15.
We expect the company to clock a similar growth in future and touch revenues of
₹833 crore in FY17. The segment will continue to contribute 2% of overall revenues.
Logistics vertical provides a huge upside trigger
The distribution business warrants a number of warehouses at different locations.
Redington has leased out warehouses at short distances in order to cater to octroi
and non-octroi area demand and minimize double taxation on inter-state transit. In
2012, Redington hived off its logistics and warehousing facilities into a 100%
subsidiary, ProConnect Supply Chain Solutions Ltd, in order to leverage its existing
network of warehouses for additional business. Apart from its existing network of 79
Services revenues to grow at a healthy pace
0%
5%
10%
15%
20%
25%
30%
0
100
200
300
400
500
600
700
800
900
FY11 FY12 FY13 FY14 FY15 FY16E FY17E
Rs crs
Services % growth (RHS)
Source: Ventura Research
- 11 of 22- Tuesday 21st July, 2015
This document is for private circulation, and must be read in conjunction with the disclaimer on the last page.
warehouses in India, the company also has built Automated Distribution Centres
(ADCs) which act as a central warehouse (capacity of around 10 warehouses put
together). Apart from warehousing, the company also provides 3rd Party Logistics
services.
Potential triggers:
i) GST: Post the introduction of GST, the company plans to expand its ADCs
network beyond the metros. Currently, Redington derives a third of its logistics
revenues from external parties. The roll out of GST will be a huge positive
trigger as it will ensure integrated and uniform taxation across states which will
propel the demand for centralized warehouses such as Redington’s ADCs. In
the post GST period, the company plans to consolidate its 79 warehouse
considerably supported with a higher network of ADCs.
ii) E-Commerce: E-Commerce, in India, is growing at a phenomenal pace
subsequently translating to an increased demand for back-end warehousing
and logistics, especially for large centralized warehouses.
Details of ADCs
Location Status Investment ( in Rs crs)
Chennai Operational since July 2009 27
Kolkata Operational since Feb 2014 40-50
New Delhi To turn operational by end FY16 40-50
Mumbai In Process of land acquisition
Source: Redington, Ventura Research
India E-Commerce to reach $60-70 bn by 2019 Warehousing requirements to support e-comm
12.5-13
32-373.5-4
28-33
0
10
20
30
40
50
60
70
2014 2019E
Goods Services
16-17
60-70
30-34%
50-55%
20-24%
US$ bn
CAGR 2014-19E
1.7
15
0
2
4
6
8
10
12
14
16
2013 2017-20E
7.5
Source: BCG Retail 2020 report Source: BCG Retail 2020 report
Warehousing requirements could increase to anywhere between 7.5-15 mn sq.ft by 2020
mn sq ft
- 12 of 22- Tuesday 21st July, 2015
This document is for private circulation, and must be read in conjunction with the disclaimer on the last page.
While ProConnect reported revenues of ₹77 crs in FY15, or ~0.25% of total
consolidated revenues, this segment has huge potential to scale up. The roll-out of
GST and the E-commerce boom are the key triggers to unlock this potential, which
has not been factored in our projections.
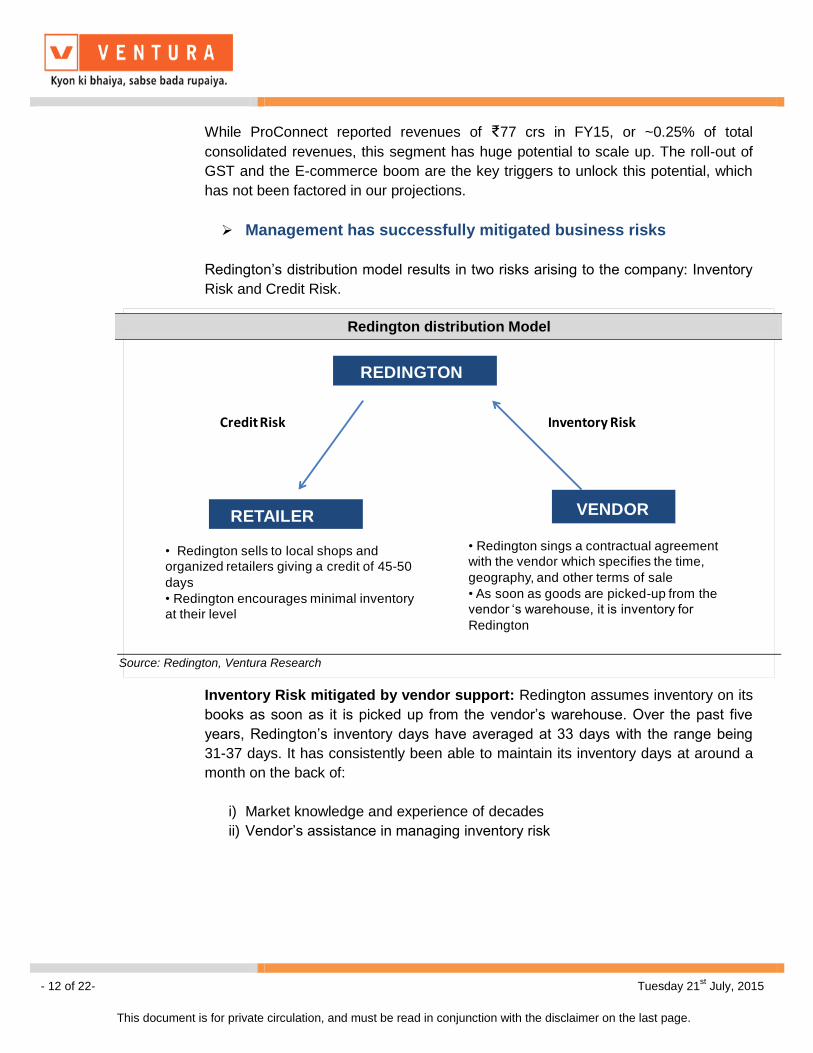
Management has successfully mitigated business risks
Redington’s distribution model results in two risks arising to the company: Inventory
Risk and Credit Risk.
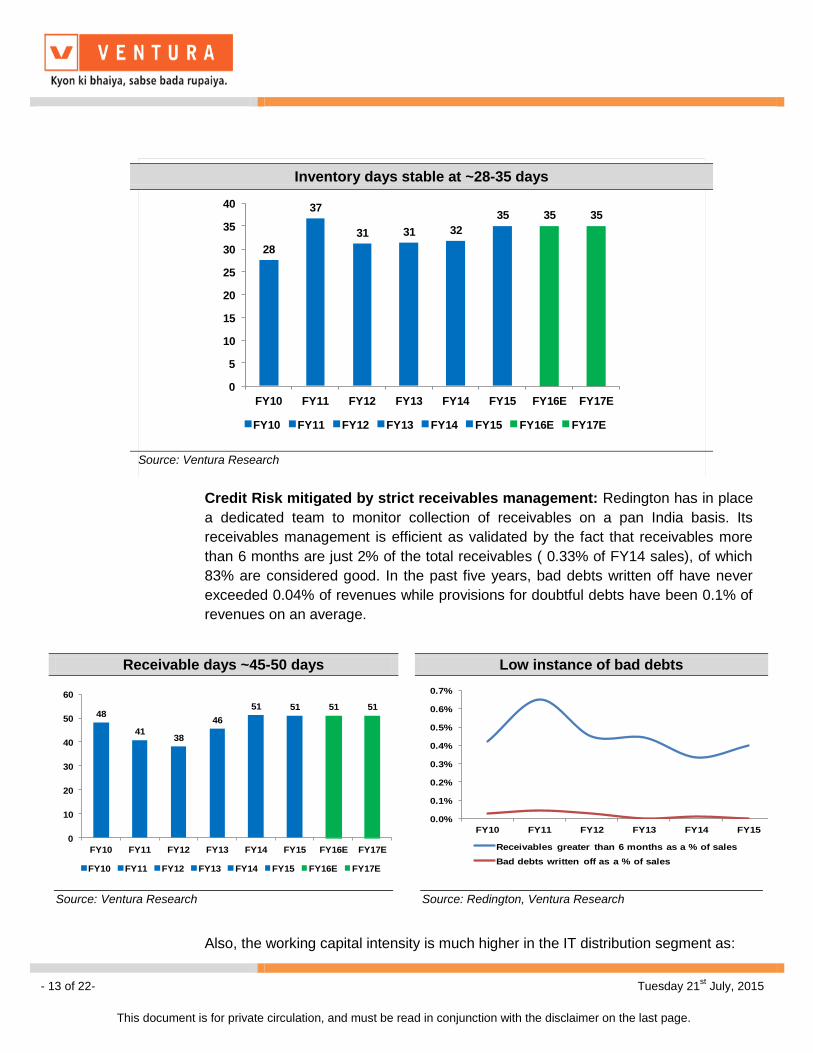
Inventory Risk mitigated by vendor support: Redington assumes inventory on its
books as soon as it is picked up from the vendor’s warehouse. Over the past five
years, Redington’s inventory days have averaged at 33 days with the range being
31-37 days. It has consistently been able to maintain its inventory days at around a
month on the back of:
i) Market knowledge and experience of decades
ii) Vendor’s assistance in managing inventory risk
Redington distribution Model
REDINGTON
• Redington sells to local shops and
organized retailers giving a credit of 45-50
days
• Redington encourages minimal inventory
at their level
• Redington sings a contractual agreement
with the vendor which specifies the time,
geography, and other terms of sale
• As soon as goods are picked-up from the
vendor ‘s warehouse, it is inventory for
Redington
VENDORRETAILER
Inventory RiskCredit Risk
Source: Redington, Ventura Research
- 13 of 22- Tuesday 21st July, 2015
This document is for private circulation, and must be read in conjunction with the disclaimer on the last page.
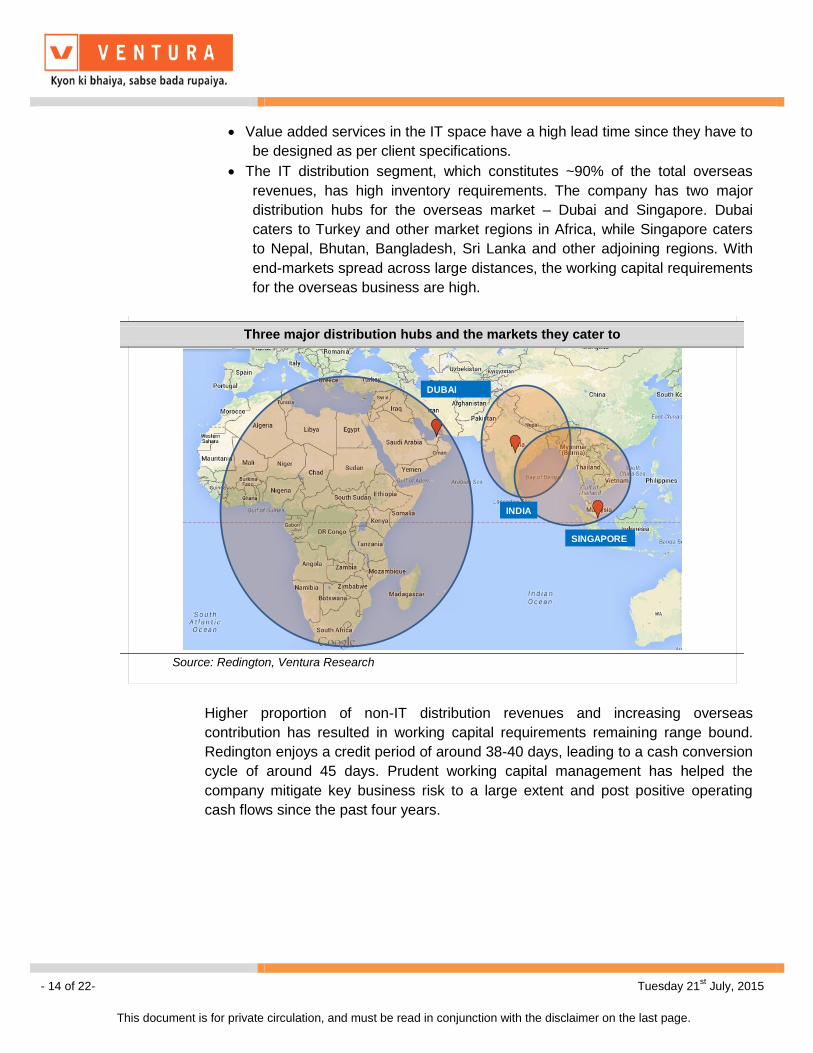
Credit Risk mitigated by strict receivables management: Redington has in place
a dedicated team to monitor collection of receivables on a pan India basis. Its
receivables management is efficient as validated by the fact that receivables more
than 6 months are just 2% of the total receivables ( 0.33% of FY14 sales), of which
83% are considered good. In the past five years, bad debts written off have never
exceeded 0.04% of revenues while provisions for doubtful debts have been 0.1% of
revenues on an average.
Also, the working capital intensity is much higher in the IT distribution segment as:
Receivable days ~45-50 days Low instance of bad debts
48
4138
46
51 51 51 51
0
10
20
30
40
50
60
FY10 FY11 FY12 FY13 FY14 FY15 FY16E FY17E
FY10 FY11 FY12 FY13 FY14 FY15 FY16E FY17E
0.0%
0.1%
0.2%
0.3%
0.4%
0.5%
0.6%
0.7%
FY10 FY11 FY12 FY13 FY14 FY15
Receivables greater than 6 months as a % of sales
Bad debts written off as a % of sales
Source: Ventura Research
Source: Redington, Ventura Research
Inventory days stable at ~28-35 days
28
37
31 31 32
35 35 35
0
5
10
15
20
25
30
35
40
FY10 FY11 FY12 FY13 FY14 FY15 FY16E FY17E
FY10 FY11 FY12 FY13 FY14 FY15 FY16E FY17E
Source: Ventura Research
- 14 of 22- Tuesday 21st July, 2015
This document is for private circulation, and must be read in conjunction with the disclaimer on the last page.
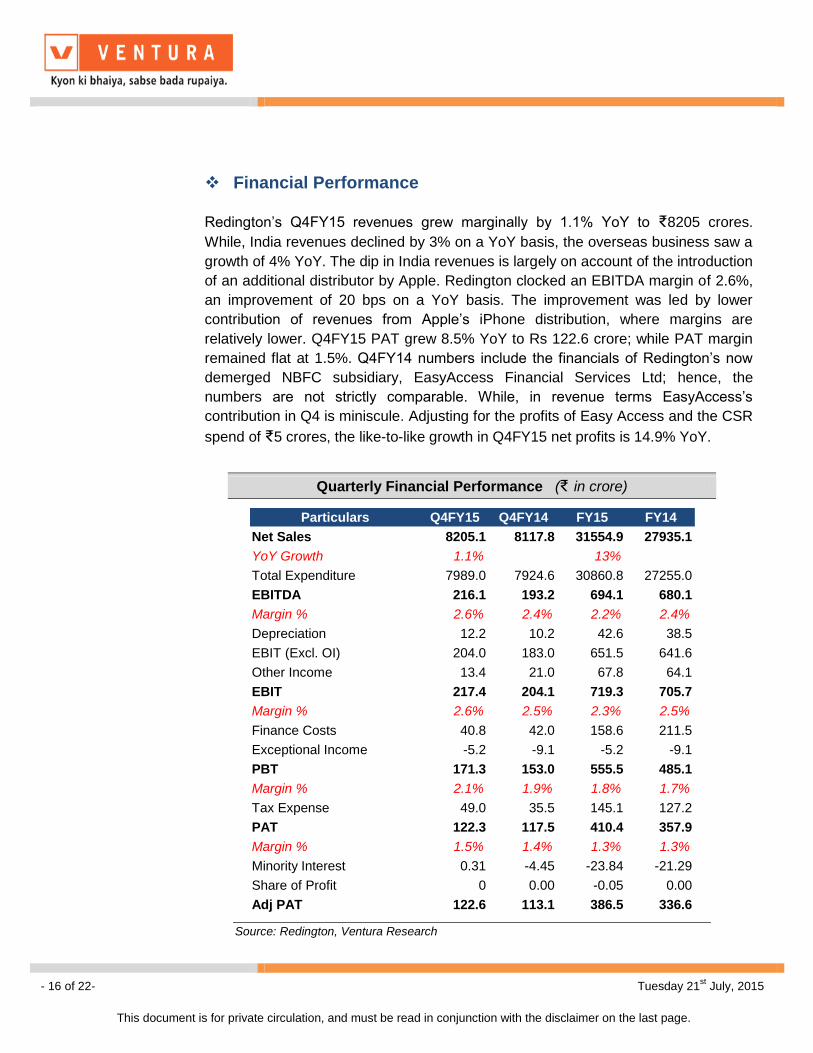
Value added services in the IT space have a high lead time since they have to
be designed as per client specifications.
The IT distribution segment, which constitutes ~90% of the total overseas
revenues, has high inventory requirements. The company has two major
distribution hubs for the overseas market – Dubai and Singapore. Dubai
caters to Turkey and other market regions in Africa, while Singapore caters
to Nepal, Bhutan, Bangladesh, Sri Lanka and other adjoining regions. With
end-markets spread across large distances, the working capital requirements
for the overseas business are high.
Higher proportion of non-IT distribution revenues and increasing overseas
contribution has resulted in working capital requirements remaining range bound.
Redington enjoys a credit period of around 38-40 days, leading to a cash conversion
cycle of around 45 days. Prudent working capital management has helped the
company mitigate key business risk to a large extent and post positive operating
cash flows since the past four years.
Three major distribution hubs and the markets they cater to
INDIA
SINGAPORE
DUBAI
Source: Redington, Ventura Research
- 15 of 22- Tuesday 21st July, 2015
This document is for private circulation, and must be read in conjunction with the disclaimer on the last page.
Key Monitorables Political turmoil in key overseas markets: Middle East and Turkey together
account for a ~85-90% of Redington’s overseas revenues. In the recent
times, the MEA and Turkey region has been plagued with Islamic extremism,
falling crude oil prices and the subsequent economic growth worries, volatile
currencies, high interest rates along with geo-polictical tensions and terrorists
attacks. If any of these challenges sustain for a prolonged period, it may
impact Redington’s business adversely.
Government inaction in India: While the BJP government has initiated a
number of growth-oriented reforms to revive the investment cycle and boost
the economy, we are yet to witness a visible pick-up in consumer spending.
Implementation delays could further slow down the economic recovery.
Inventory and Receivables risk: In the entire distribution supply chain,
Redington bears the inventory and the receivables risk. Redington relies on
vendor support to mitigate inventory risk and on its internal staff for the on-
time collection of receivables. Financial turmoil of large vendors may
adversely impact Redington’s ability to mitigate the inventory risk.
Higher competition: Introduction of an additional distributor for large
accounts could eat into the business pie of Redington. A case in point is
Apple roping in Brightstar for distribution of iPhones exclusively in North
India, which dampened Redington’s Q4FY15 revenues to a certain extent.
- 16 of 22- Tuesday 21st July, 2015
This document is for private circulation, and must be read in conjunction with the disclaimer on the last page.
Financial Performance
Redington’s Q4FY15 revenues grew marginally by 1.1% YoY to ₹8205 crores.
While, India revenues declined by 3% on a YoY basis, the overseas business saw a
growth of 4% YoY. The dip in India revenues is largely on account of the introduction
of an additional distributor by Apple. Redington clocked an EBITDA margin of 2.6%,
an improvement of 20 bps on a YoY basis. The improvement was led by lower
contribution of revenues from Apple’s iPhone distribution, where margins are
relatively lower. Q4FY15 PAT grew 8.5% YoY to Rs 122.6 crore; while PAT margin
remained flat at 1.5%. Q4FY14 numbers include the financials of Redington’s now
demerged NBFC subsidiary, EasyAccess Financial Services Ltd; hence, the
numbers are not strictly comparable. While, in revenue terms EasyAccess’s
contribution in Q4 is miniscule. Adjusting for the profits of Easy Access and the CSR
spend of ₹5 crores, the like-to-like growth in Q4FY15 net profits is 14.9% YoY.
Quarterly Financial Performance (₹ in crore)
Particulars Q4FY15 Q4FY14 FY15 FY14
Net Sales 8205.1 8117.8 31554.9 27935.1
YoY Growth 1.1% 13%
Total Expenditure 7989.0 7924.6 30860.8 27255.0
EBITDA 216.1 193.2 694.1 680.1
Margin % 2.6% 2.4% 2.2% 2.4%
Depreciation 12.2 10.2 42.6 38.5
EBIT (Excl. OI) 204.0 183.0 651.5 641.6
Other Income 13.4 21.0 67.8 64.1
EBIT 217.4 204.1 719.3 705.7
Margin % 2.6% 2.5% 2.3% 2.5%
Finance Costs 40.8 42.0 158.6 211.5
Exceptional Income -5.2 -9.1 -5.2 -9.1
PBT 171.3 153.0 555.5 485.1
Margin % 2.1% 1.9% 1.8% 1.7%
Tax Expense 49.0 35.5 145.1 127.2
PAT 122.3 117.5 410.4 357.9
Margin % 1.5% 1.4% 1.3% 1.3%
Minority Interest 0.31 -4.45 -23.84 -21.29
Share of Profit 0 0.00 -0.05 0.00
Adj PAT 122.6 113.1 386.5 336.6
Source: Redington, Ventura Research
- 17 of 22- Tuesday 21st July, 2015
This document is for private circulation, and must be read in conjunction with the disclaimer on the last page.
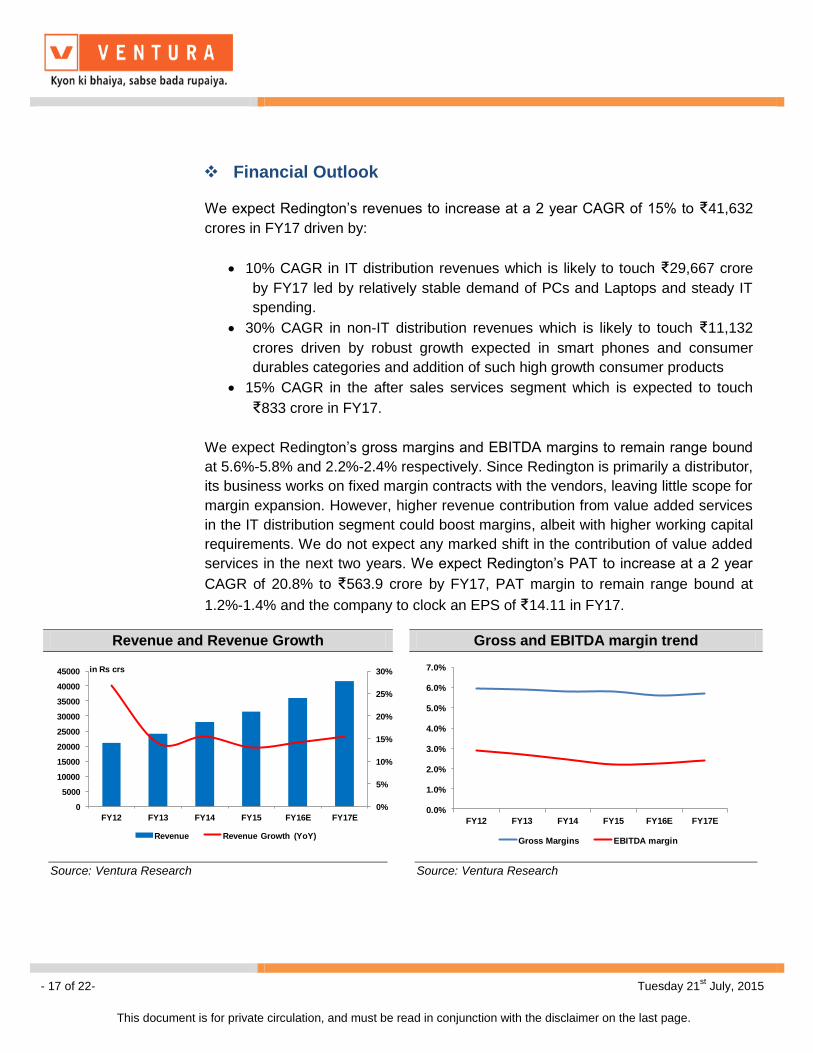
Financial Outlook
We expect Redington’s revenues to increase at a 2 year CAGR of 15% to ₹41,632
crores in FY17 driven by:
10% CAGR in IT distribution revenues which is likely to touch ₹29,667 crore
by FY17 led by relatively stable demand of PCs and Laptops and steady IT
spending.
30% CAGR in non-IT distribution revenues which is likely to touch ₹11,132
crores driven by robust growth expected in smart phones and consumer
durables categories and addition of such high growth consumer products
15% CAGR in the after sales services segment which is expected to touch
₹833 crore in FY17.
We expect Redington’s gross margins and EBITDA margins to remain range bound
at 5.6%-5.8% and 2.2%-2.4% respectively. Since Redington is primarily a distributor,
its business works on fixed margin contracts with the vendors, leaving little scope for
margin expansion. However, higher revenue contribution from value added services
in the IT distribution segment could boost margins, albeit with higher working capital
requirements. We do not expect any marked shift in the contribution of value added
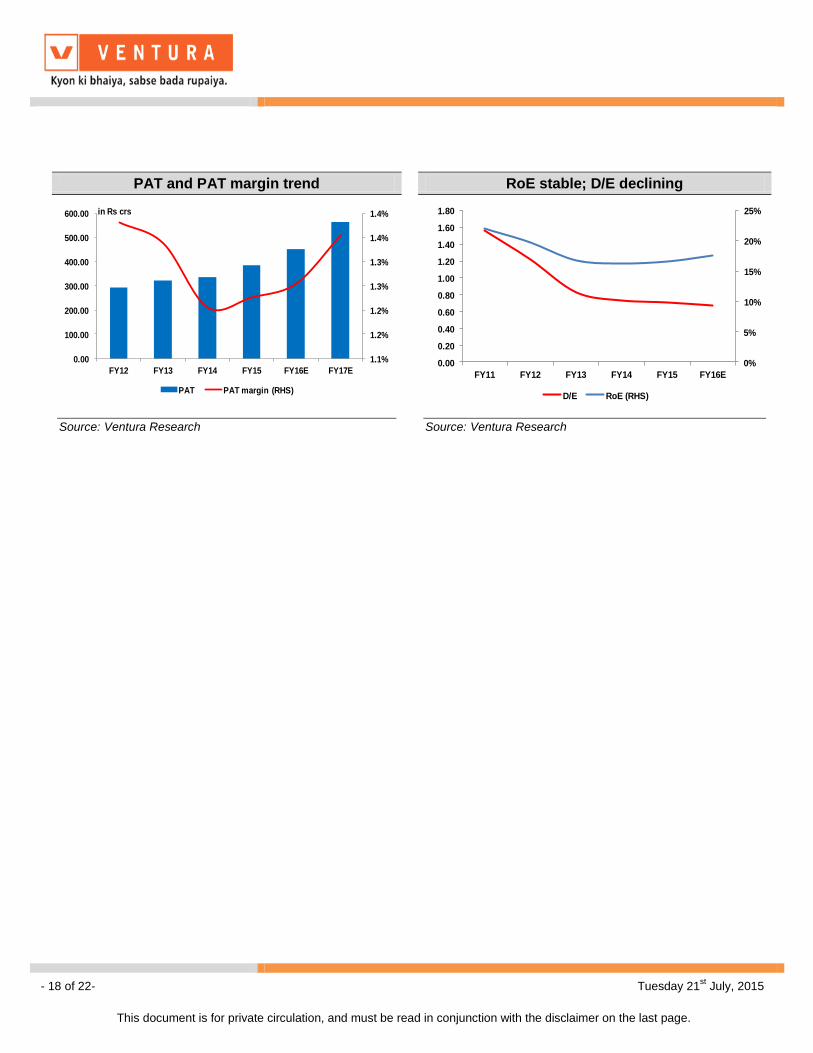
services in the next two years. We expect Redington’s PAT to increase at a 2 year
CAGR of 20.8% to ₹563.9 crore by FY17, PAT margin to remain range bound at
1.2%-1.4% and the company to clock an EPS of ₹14.11 in FY17.
Revenue and Revenue Growth Gross and EBITDA margin trend
0%
5%
10%
15%
20%
25%
30%
0
5000
10000
15000
20000
25000
30000
35000
40000
45000
FY12 FY13 FY14 FY15 FY16E FY17E
in Rs crs
Revenue Revenue Growth (YoY)
0.0%
1.0%
2.0%
3.0%
4.0%
5.0%
6.0%
7.0%
FY12 FY13 FY14 FY15 FY16E FY17E
Gross Margins EBITDA margin
Source: Ventura Research
Source: Ventura Research
- 18 of 22- Tuesday 21st July, 2015
This document is for private circulation, and must be read in conjunction with the disclaimer on the last page.
PAT and PAT margin trend RoE stable; D/E declining
1.1%
1.2%
1.2%
1.3%
1.3%
1.4%
1.4%
0.00
100.00
200.00
300.00
400.00
500.00
600.00
FY12 FY13 FY14 FY15 FY16E FY17E
in Rs crs
PAT PAT margin (RHS)
0%
5%
10%
15%
20%
25%
0.00
0.20
0.40
0.60
0.80
1.00
1.20
1.40
1.60
1.80
FY11 FY12 FY13 FY14 FY15 FY16E
D/E RoE (RHS)
Source: Ventura Research
Source: Ventura Research
- 19 of 22- Tuesday 21st July, 2015
This document is for private circulation, and must be read in conjunction with the disclaimer on the last page.
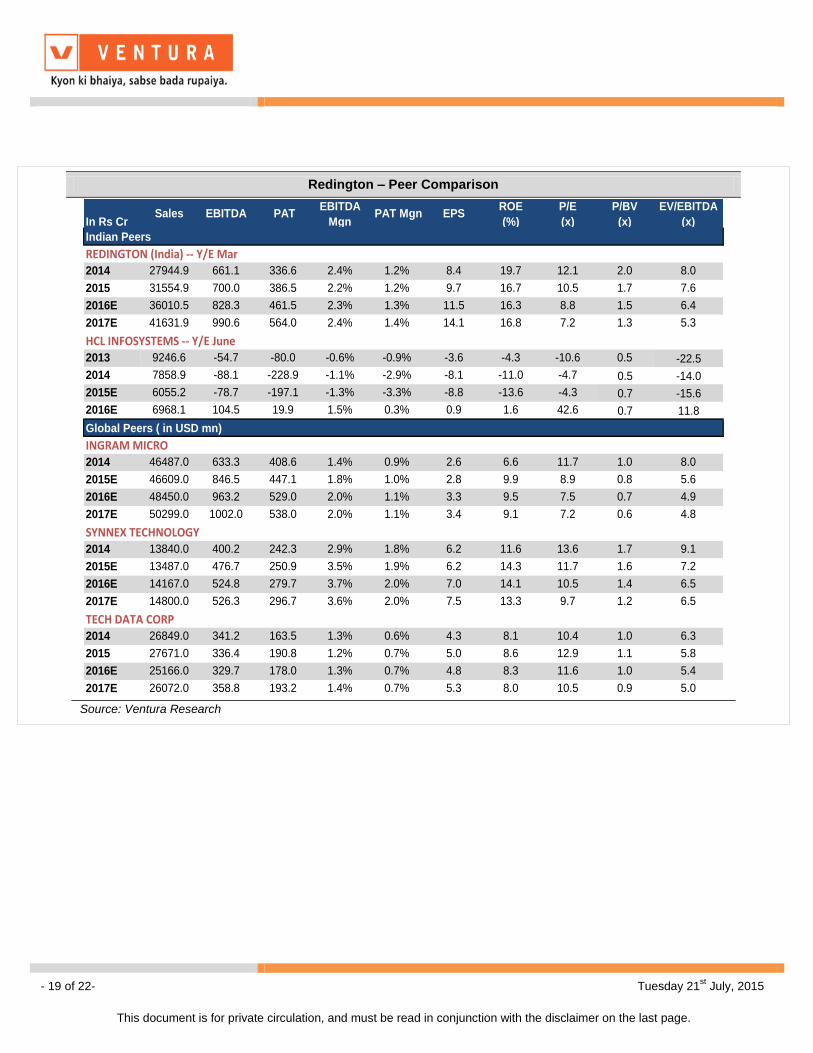
Redington – Peer Comparison
In Rs CrSales EBITDA PAT
EBITDA
Mgn PAT Mgn EPS
ROE
(%)
P/E
(x)
P/BV
(x)
EV/EBITDA
(x)
Indian Peers
REDINGTON (India) -- Y/E Mar2014 27944.9 661.1 336.6 2.4% 1.2% 8.4 19.7 12.1 2.0 8.0
2015 31554.9 700.0 386.5 2.2% 1.2% 9.7 16.7 10.5 1.7 7.6
2016E 36010.5 828.3 461.5 2.3% 1.3% 11.5 16.3 8.8 1.5 6.4
2017E 41631.9 990.6 564.0 2.4% 1.4% 14.1 16.8 7.2 1.3 5.3
HCL INFOSYSTEMS -- Y/E June2013 9246.6 -54.7 -80.0 -0.6% -0.9% -3.6 -4.3 -10.6 0.5 -22.5
2014 7858.9 -88.1 -228.9 -1.1% -2.9% -8.1 -11.0 -4.7 0.5 -14.0
2015E 6055.2 -78.7 -197.1 -1.3% -3.3% -8.8 -13.6 -4.3 0.7 -15.6
2016E 6968.1 104.5 19.9 1.5% 0.3% 0.9 1.6 42.6 0.7 11.8
Global Peers ( in USD mn)
INGRAM MICRO 2014 46487.0 633.3 408.6 1.4% 0.9% 2.6 6.6 11.7 1.0 8.0
2015E 46609.0 846.5 447.1 1.8% 1.0% 2.8 9.9 8.9 0.8 5.6
2016E 48450.0 963.2 529.0 2.0% 1.1% 3.3 9.5 7.5 0.7 4.9
2017E 50299.0 1002.0 538.0 2.0% 1.1% 3.4 9.1 7.2 0.6 4.8
SYNNEX TECHNOLOGY2014 13840.0 400.2 242.3 2.9% 1.8% 6.2 11.6 13.6 1.7 9.1
2015E 13487.0 476.7 250.9 3.5% 1.9% 6.2 14.3 11.7 1.6 7.2
2016E 14167.0 524.8 279.7 3.7% 2.0% 7.0 14.1 10.5 1.4 6.5
2017E 14800.0 526.3 296.7 3.6% 2.0% 7.5 13.3 9.7 1.2 6.5
TECH DATA CORP2014 26849.0 341.2 163.5 1.3% 0.6% 4.3 8.1 10.4 1.0 6.3
2015 27671.0 336.4 190.8 1.2% 0.7% 5.0 8.6 12.9 1.1 5.8
2016E 25166.0 329.7 178.0 1.3% 0.7% 4.8 8.3 11.6 1.0 5.4
2017E 26072.0 358.8 193.2 1.4% 0.7% 5.3 8.0 10.5 0.9 5.0
Source: Ventura Research
- 20 of 22- Tuesday 21st July, 2015
This document is for private circulation, and must be read in conjunction with the disclaimer on the last page.
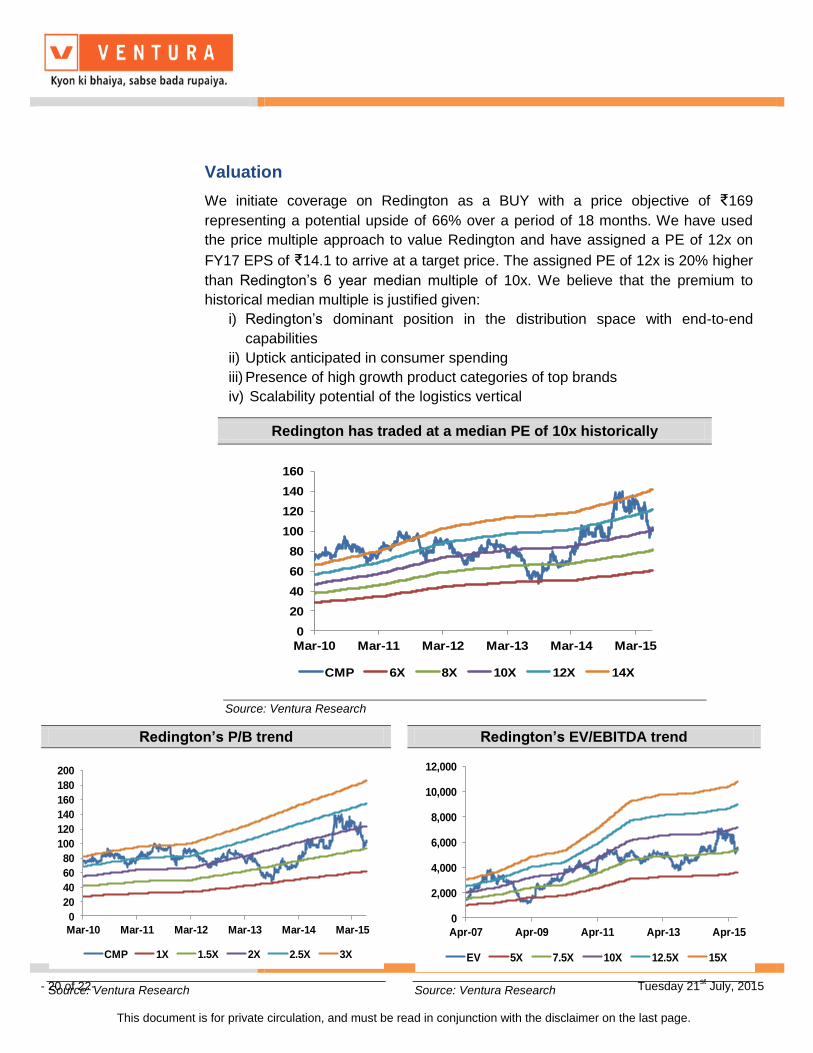
Valuation
We initiate coverage on Redington as a BUY with a price objective of ₹169
representing a potential upside of 66% over a period of 18 months. We have used
the price multiple approach to value Redington and have assigned a PE of 12x on
FY17 EPS of ₹14.1 to arrive at a target price. The assigned PE of 12x is 20% higher
than Redington’s 6 year median multiple of 10x. We believe that the premium to
historical median multiple is justified given:
i) Redington’s dominant position in the distribution space with end-to-end
capabilities
ii) Uptick anticipated in consumer spending
iii) Presence of high growth product categories of top brands
iv) Scalability potential of the logistics vertical
Redington has traded at a median PE of 10x historically
0
20
40
60
80
100
120
140
160
Mar-10 Mar-11 Mar-12 Mar-13 Mar-14 Mar-15
CMP 6X 8X 10X 12X 14X
Source: Ventura Research
Redington’s P/B trend Redington’s EV/EBITDA trend
0
20
40
60
80
100
120
140
160
180
200
Mar-10 Mar-11 Mar-12 Mar-13 Mar-14 Mar-15
CMP 1X 1.5X 2X 2.5X 3X
0
2,000
4,000
6,000
8,000
10,000
12,000
Apr-07 Apr-09 Apr-11 Apr-13 Apr-15
EV 5X 7.5X 10X 12.5X 15X
Source: Ventura Research
Source: Ventura Research
- 21 of 22- Tuesday 21st July, 2015
This document is for private circulation, and must be read in conjunction with the disclaimer on the last page.
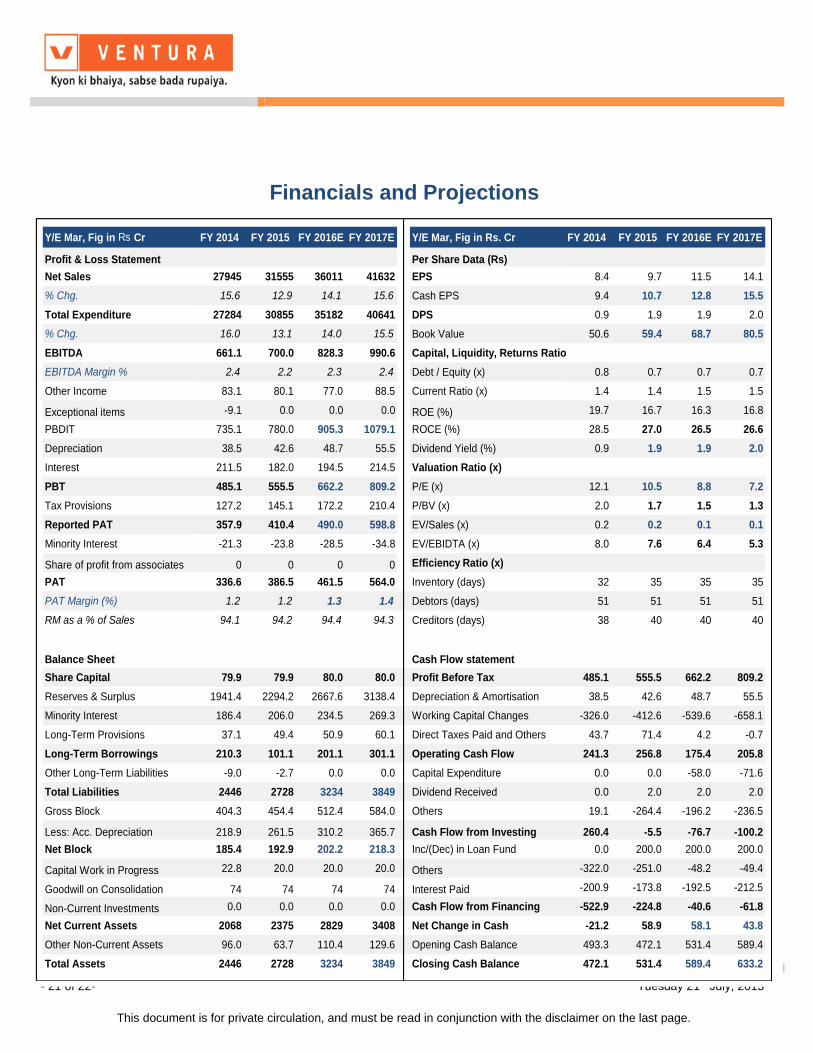
Financials and Projections
Y/E Mar, Fig in Rs Cr FY 2014 FY 2015 FY 2016E FY 2017E Y/E Mar, Fig in Rs. Cr FY 2014 FY 2015 FY 2016E FY 2017E
Profit & Loss Statement Per Share Data (Rs)
Net Sales 27945 31555 36011 41632 EPS 8.4 9.7 11.5 14.1
% Chg. 15.6 12.9 14.1 15.6 Cash EPS 9.4 10.7 12.8 15.5
Total Expenditure 27284 30855 35182 40641 DPS 0.9 1.9 1.9 2.0
% Chg. 16.0 13.1 14.0 15.5 Book Value 50.6 59.4 68.7 80.5
EBITDA 661.1 700.0 828.3 990.6 Capital, Liquidity, Returns Ratio
EBITDA Margin % 2.4 2.2 2.3 2.4 Debt / Equity (x) 0.8 0.7 0.7 0.7
Other Income 83.1 80.1 77.0 88.5 Current Ratio (x) 1.4 1.4 1.5 1.5
Exceptional items -9.1 0.0 0.0 0.0 ROE (%) 19.7 16.7 16.3 16.8
PBDIT 735.1 780.0 905.3 1079.1 ROCE (%) 28.5 27.0 26.5 26.6
Depreciation 38.5 42.6 48.7 55.5 Dividend Yield (%) 0.9 1.9 1.9 2.0
Interest 211.5 182.0 194.5 214.5 Valuation Ratio (x)
PBT 485.1 555.5 662.2 809.2 P/E (x) 12.1 10.5 8.8 7.2
Tax Provisions 127.2 145.1 172.2 210.4 P/BV (x) 2.0 1.7 1.5 1.3
Reported PAT 357.9 410.4 490.0 598.8 EV/Sales (x) 0.2 0.2 0.1 0.1
Minority Interest -21.3 -23.8 -28.5 -34.8 EV/EBIDTA (x) 8.0 7.6 6.4 5.3
Share of profit from associates 0 0 0 0 Efficiency Ratio (x)
PAT 336.6 386.5 461.5 564.0 Inventory (days) 32 35 35 35
PAT Margin (%) 1.2 1.2 1.3 1.4 Debtors (days) 51 51 51 51
RM as a % of Sales 94.1 94.2 94.4 94.3 Creditors (days) 38 40 40 40
Balance Sheet Cash Flow statement
Share Capital 79.9 79.9 80.0 80.0 Profit Before Tax 485.1 555.5 662.2 809.2
Reserves & Surplus 1941.4 2294.2 2667.6 3138.4 Depreciation & Amortisation 38.5 42.6 48.7 55.5
Minority Interest 186.4 206.0 234.5 269.3 Working Capital Changes -326.0 -412.6 -539.6 -658.1
Long-Term Provisions 37.1 49.4 50.9 60.1 Direct Taxes Paid and Others 43.7 71.4 4.2 -0.7
Long-Term Borrowings 210.3 101.1 201.1 301.1 Operating Cash Flow 241.3 256.8 175.4 205.8
Other Long-Term Liabilities -9.0 -2.7 0.0 0.0 Capital Expenditure 0.0 0.0 -58.0 -71.6
Total Liabilities 2446 2728 3234 3849 Dividend Received 0.0 2.0 2.0 2.0
Gross Block 404.3 454.4 512.4 584.0 Others 19.1 -264.4 -196.2 -236.5
Less: Acc. Depreciation 218.9 261.5 310.2 365.7 Cash Flow from Investing 260.4 -5.5 -76.7 -100.2
Net Block 185.4 192.9 202.2 218.3 Inc/(Dec) in Loan Fund 0.0 200.0 200.0 200.0
Capital Work in Progress 22.8 20.0 20.0 20.0 Others -322.0 -251.0 -48.2 -49.4
Goodwill on Consolidation 74 74 74 74 Interest Paid -200.9 -173.8 -192.5 -212.5
Non-Current Investments 0.0 0.0 0.0 0.0 Cash Flow from Financing -522.9 -224.8 -40.6 -61.8
Net Current Assets 2068 2375 2829 3408 Net Change in Cash -21.2 58.9 58.1 43.8
Other Non-Current Assets 96.0 63.7 110.4 129.6 Opening Cash Balance 493.3 472.1 531.4 589.4
Total Assets 2446 2728 3234 3849 Closing Cash Balance 472.1 531.4 589.4 633.2
- 22 of 22- Tuesday 21st July, 2015
This document is for private circulation, and must be read in conjunction with the disclaimer on the last page.
Disclosures and Disclaimer Ventura Securities Limited (VSL) is a SEBI registered intermediary offering broking, depository and portfolio management services to clients. VSL is member of BSE, NSE and MCX-SX. VSL is a depository participant of NSDL. VSL states that no disciplinary action whatsoever has been taken by SEBI against it in last five years except administrative warning issued in connection with technical and venial lapses observed while inspection of books of accounts and records. Ventura Commodities Limited, Ventura Guaranty Limited, Ventura Insurance Brokers Limited and Ventura Allied Services Private Limited are associates of VSL. Research Analyst (RA) involved in the preparation of this research report and VSL disclose that neither RA nor VSL nor its associates (i) have any financial interest in the company which is the subject matter of this research report (ii) holds ownership of one percent or more in the securities of subject company (iii) have any material conflict of interest at the time of publication of this research report (iv) have received any compensation from the subject company in the past twelve months (v) have managed or co-managed public offering of securities for the subject company in past twelve months (vi) have received any compensation for investment banking merchant banking or brokerage services from the subject company in the past twelve months (vii) have received any compensation for product or services from the subject company in the past twelve months (viii) have received any compensation or other benefits from the subject company or third party in connection with the research report. RA involved in the preparation of this research report discloses that he / she has not served as an officer, director or employee of the subject company. RA involved in the preparation of this research report and VSL discloses that they have not been engaged in the market making activity for the subject company. Our sales people, dealers, traders and other professionals may provide oral or written market commentary or trading strategies to our clients that reflect opinions that are contrary to the opinions expressed herein. We may have earlier issued or may issue in future reports on the companies covered herein with recommendations/ information inconsistent or different those made in this report. In reviewing this document, you should be aware that any or all of the foregoing, among other things, may give rise to or potential conflicts of interest. We may rely on information barriers, such as "Chinese Walls" to control the flow of information contained in one or more areas within us, or other areas, units, groups or affiliates of VSL. This report is for information purposes only and this document/material should not be construed as an offer to sell or the solicitation of an offer to buy, purchase or subscribe to any securities, and neither this document nor anything contained herein shall form the basis of or be relied upon in connection with any contract or commitment whatsoever. This document does not solicit any action based on the material contained herein. It is for the general information of the clients / prospective clients of VSL. VSL will not treat recipients as clients by virtue of their receiving this report. It does not constitute a personal recommendation or take into account the particular investment objectives, financial situations, or needs of clients / prospective clients. Similarly, this document does not have regard to the specific investment objectives, financial situation/circumstances and the particular needs of any specific person who may receive this document. The securities discussed in this report may not be suitable for all investors. The appropriateness of a particular investment or strategy will depend on an investor's individual circumstances and objectives. Persons who may receive this document should consider and independently evaluate whether it is suitable for his/ her/their particular circumstances and, if necessary, seek professional/financial advice. And such person shall be responsible for conducting his/her/their own investigation and analysis of the information contained or referred to in this document and of evaluating the merits and risks involved in the securities forming the subject matter of this document. The projections and forecasts described in this report were based upon a number of estimates and assumptions and are inherently subject to significant uncertainties and contingencies. Projections and forecasts are necessarily speculative in nature, and it can be expected that one or more of the estimates on which the projections and forecasts were based will not materialize or will vary significantly from actual results, and such variances will likely increase over time. All projections and forecasts described in this report have been prepared solely by the authors of this report independently of the Company. These projections and forecasts were not prepared with a view toward compliance with published guidelines or generally accepted accounting principles. No independent accountants have expressed an opinion or any other form of assurance on these projections or forecasts. You should not regard the inclusion of the projections and forecasts described herein as a representation or warranty by VSL, its associates, the authors of this report or any other person that these projections or forecasts or their underlying assumptions will be achieved. For these reasons, you should only consider the projections and forecasts described in this report after carefully evaluating all of the information in this report, including the assumptions underlying such projections and forecasts. The price and value of the investments referred to in this document/material and the income from them may go down as well as up, and investors may realize losses on any investments. Past performance is not a guide for future performance. Future returns are not guaranteed and a loss of original capital may occur. Actual results may differ materially from those set forth in projections. Forward-looking statements are not predictions and may be subject to change without notice. We do not provide tax advice to our clients, and all investors are strongly advised to consult regarding any potential investment. VSL, the RA involved in the preparation of this research report and its associates accept no liabilities for any loss or damage of any kind arising out of the use of this report. This report/document has been prepared by VSL, based upon information available to the public and sources, believed to be reliable. No representation or warranty, express or implied is made that it is accurate or complete. VSL has reviewed the report and, in so far as it includes current or historical information, it is believed to be reliable, although its accuracy and completeness cannot be guaranteed. The opinions expressed in this document/material are subject to change without notice and have no obligation to tell you when opinions or information in this report change. This report or recommendations or information contained herein do/does not constitute or purport to constitute investment advice in publicly accessible media and should not be reproduced, transmitted or published by the recipient. The report is for the use and consumption of the recipient only. This publication may not be distributed to the public used by the public media without the express written consent of VSL. This report or any portion hereof may not be printed, sold or distributed without the written consent of VSL. This document does not constitute an offer or invitation to subscribe for or purchase or deal in any securities and neither this document nor anything contained herein shall form the basis of any contract or commitment whatsoever. This document is strictly confidential and is being furnished to you solely for your information, may not be distributed to the press or other media and may not be reproduced or redistributed to any other person. The opinions and projections expressed herein are entirely those of the author and are given as part of the normal research activity of VSL and are given as of this date and are subject to change without notice. Any opinion estimate or projection herein constitutes a view as of the date of this report and there can be no assurance that future results or events will be consistent with any such opinions, estimate or projection. This document has not been prepared by or in conjunction with or on behalf of or at the instigation of, or by arrangement with the company or any of its directors or any other person. Information in this document must not be relied upon as having been authorized or approved by the company or its directors or any other person. Any opinions and projections contained herein are entirely those of the authors. None of the company or its directors or any other person accepts any liability whatsoever for any loss arising from any use of this document or its contents or otherwise arising in connection therewith. The information contained herein is not intended for publication or distribution or circulation in any manner whatsoever and any unauthorized reading, dissemination, distribution or copying of this communication is prohibited unless otherwise expressly authorized. Please ensure that you have read “Risk Disclosure Document for Capital Market and Derivatives Segments” as prescribed by Securities and Exchange Board of India before investing in Securities Market. Ventura Securities Limited
Corporate Office: C-112/116, Bldg No. 1, Kailash Industrial Complex, Park Site, Vikhroli (W), Mumbai – 400079