va tech wabag -...
TRANSCRIPT
VA Tech Wabag.
BUY
- 1 of 23 Tuesday 1st January, 2013
This document is for private circulation, and must be read in conjunction with the disclaimer on the last page.
ST
OC
K P
OIN
TE
R
Target Price `̀̀̀ 695 CMP `̀̀̀ 562 FY15 PE 11.3x
Index Details We initiate coverage on VA Tech Wabag Ltd as a BUY with a Price Objective of `̀̀̀695 (target 14x FY15 P/E). At the CMP of `̀̀̀ 562, the stock is trading at 16.5x, 13.5x and 11.3x its estimated earnings for FY13, FY14 & FY15 respectively, representing a potential upside of ~24% over a period of 18 months. Being a leading player in the water space with in-house technology, VA Tech Wabag is expected to be a key beneficiary of the increased opportunities in India and abroad. With improving scale there is ample scope for margin expansion driven by employee cost rationalization and higher share of O&M revenues. However we have built in a modest 100 bps EBITDA margin expansion. We expect VA Tech Wabag revenues and earnings to post a CAGR of 13.3% and 21.6% to `̀̀̀2,089 crore and `̀̀̀132 crore, respectively by FY15 driven primarily by the swelling order book (`̀̀̀5,006 crore by FY15) and ramp up in global operations.
� Technology – the key differentiator with over 100 patents The key strength of VA Tech Wabag lies in its technology wherein the company undertakes in house engineering for projects. The company outsources civil construction to third parties enabling the company to be asset light. With R & D centres in Austria, Switzerland and India, the company holds over 100 patents in water space. The technological expertise differentiates the company from its competitors and enables it to pre-qualify for certain hi-tech projects thus giving it a technological edge.
� A pure play on the opportunity in the water space
Rapidly dwindling pure water resources and the exploding population have brought “water” to the centre stage of the global economy. Both within India and abroad the size of water opportunity is huge. The Global Water market is growing at 5-6% p.a. and in countries like China, Saudi Arabia and India size of opportunity is anywhere between USD 5.9-47 billion. In India itself, the estimated size of the addressable EPC opportunity over the period 2012-2031 as per the High Powered Expert Committee (HPEC) is estimated at ~ ` 3,20,908 crore (` 16,000 crore p.a.) and the O & M (high margin) portion pegged at ` 5,46,095 crore (` 27,000 crore p.a.).
Sensex 19,581
Nifty 5,951
BSE 100 6,029
Industry CG
Scrip Details
Mkt Cap (` cr) 1,484
BVPS (`) 249.0
O/s Shares (Cr) 2.7
Av Vol (Lacs) 0.01
52 Week H/L 578/270
Div Yield (%) 1.1
FVPS (`) 2.0
Shareholding Pattern
Shareholders %
Promoters 30.9
DIIs 17.9
FIIs 31.7
Public 19.4
Total 100
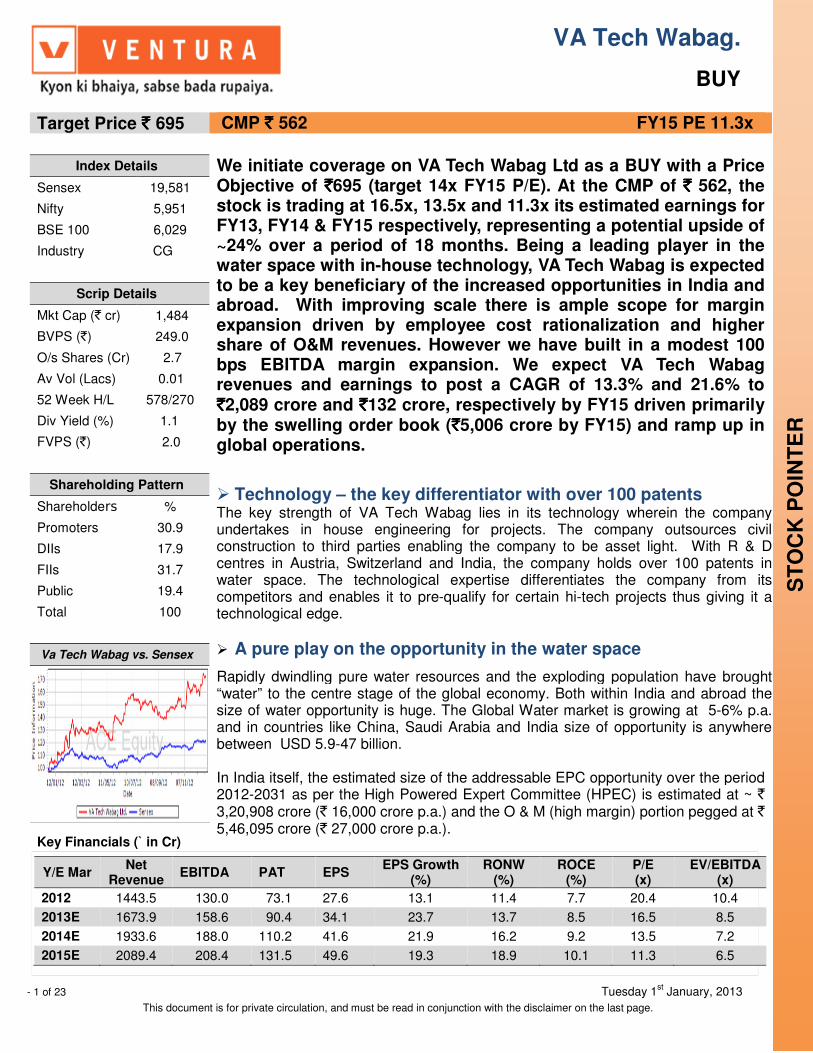
Va Tech Wabag vs. Sensex
Key Financials (` in Cr)
Y/E Mar Net
Revenue EBITDA PAT EPS
EPS Growth (%)
RONW (%)
ROCE (%)
P/E (x)
EV/EBITDA (x)
2012 1443.5 130.0 73.1 27.6 13.1 11.4 7.7 20.4 10.4
2013E 1673.9 158.6 90.4 34.1 23.7 13.7 8.5 16.5 8.5
2014E 1933.6 188.0 110.2 41.6 21.9 16.2 9.2 13.5 7.2
2015E 2089.4 208.4 131.5 49.6 19.3 18.9 10.1 11.3 6.5
- 2 of 23 - Tuesday 1st January, 2013
This document is for private circulation, and must be read in conjunction with the disclaimer on the last page.
In order to hasten and expand its global footprint, VA Tech Wabag has entered into strategic tie ups with international players of repute like Sumitomo Corporation. VATech is the technological partner in these tie ups and besides getting global recognition this enable the company to get large orders (particularly in the desalination space) in the international arena. Backed by the strong technological standing and vast experience, we believe VA Tech Wabag being the largest Indian player in this space, is expected to be one of the biggest beneficiaries.
� Order inflow to pick up from FY13E onwards
Over the last two years, VA Tech Wabag has witnessed a moderate growth in its order book. However, we expect order inflow to gain traction from FY13E under NI JNNURM schemes. These projects are driven by rapid expansion of the urban population (which has put pressure on existing water resources) and growing realization of treating waste water because of environmental concerns. Similarly in international markets the company expects orders in the desalination space to be the growth driver (particularly in countries in MENA region). YTD, the company has received orders worth `1,100 crore and we expect the company’s order inflow to grow at rate of CAGR of 18.3% to `2,906 crore over the period of FY12-FY15E. Accordingly, the company’s order book is expected to grow at a CAGR of 10.3% to `5,006 crore over the same period.
� Consistent revenue growth with scope for margin expansion
We expect revenues of the company to grow at a CAGR of 13.3% to `2,089 crore from `1443.5 crore over the period of FY12- FY15E. With O & M comprising 35% of current order book, we expect share of O & M revenues to sustain at 15-16% of the total revenues over the same period. While margins in the international business are ~3%, we believe there is scope for substantial improvement on account of employee cost rationalization as different geographies scale up. However, we have built in conservative 100 bps margin expansion (at a consolidated level) through FY15E.
� Valuation At the CMP of ` 562, VA Tech Wabag is trading at 16.5x, 13.5x and 11.3x its estimated earnings for FY13E, FY14E and FY15E, respectively. As compared to its international peers like Veolia, Acciona Suez etc. VA Tech Wabag is trading at slight discount for FY13E and FY14E earnings. However, considering the expansion in margins, focus on large orders, and improvement in order intake apart from strong cash flows, low capex and improvement in return ratios, we believe the discount is unjustified. We initiate coverage on VA Tech Wabag Ltd as a BUY with a Price Objective of `695 (target 14x FY15 P/E) representing potential upside of 24% over the next 18 months.

- 3 of 23 - Tuesday 1st January, 2013
This document is for private circulation, and must be read in conjunction with the disclaimer on the last page.
� Company Background A leading multinational player in the water treatment industry, VA Tech Wabag India provides a range of EPC and O&M solutions for treatment of sewage, processed and drinking water, effluents, sludge and desalination plants. Besides providing services to institutional clients spanning across 3 continents, it also provides solutions to corporates in infrastructure sectors such as power, steel and oil and gas etc. The company undertakes orders under two segments
1) EPC Division (84-85% of revenues): Here the company undertakes lump sum turnkey or item rate contracts for its clients for water treatment, desalination, and sewage treatment plants etc. which can also be Design, Build, Operatecontracts (DBO) or Build Own, Operate and Transfer (BOOT) contracts.
Present Management conducted a successful buy out of Vabag’s global operations from Siemens AG
Held by Deutsche Babcock (DB)
Group
Held by Deutsche Babcock (DB)
Group
Incorporation as Balcke Durr
Cooling Towers Ltd.
SolutionsNamechanged to
Balcke Durr & Wabag
Technologies Ltd
Business of Providing Cooling Tower Solutions
Austrian Group VA Tech acquired
“Wabag” part of Business from DB
in 1999
Siemens acquired VA
Tech
Held via VA Tech Wabag
(Austria)
Management Buyout of the
India Business backed by ICICI
Venture
VA Tech Wabag (India) acquires its erstwhile parent –VA Tech
Wabag (Austria) from Siemens
VA Tech Wabag(India)
Water Treatment business
represented by “Wabag” started
Name changed to VA Tech Wabag(India) in 2000
VA Tech Wabag (India)
VA Tech Wabag(India)
VA Tech Wabag
(Austria)
Emergence of Global Water Player with
focus on the emerging
markets Business
1995 1996 1999-2000 2005 (Jul)
2005 (Sept)
2007
Source: Va Tech Wabag, Ventura Research
Key Management Personnel
Promoters Designation % Stake (Q2FY13)
Rajiv Mittal Managing Director 18.1
Amit Sengupta Head of Corporate and Marketing 4.6
Varadarajan S CFO 4.1
Shiv Narayan Saraf Head of Operations 4.1
Source: VA Tech Wabag, Ventura Research
- 4 of 23 - Tuesday 1st January, 2013
This document is for private circulation, and must be read in conjunction with the disclaimer on the last page.
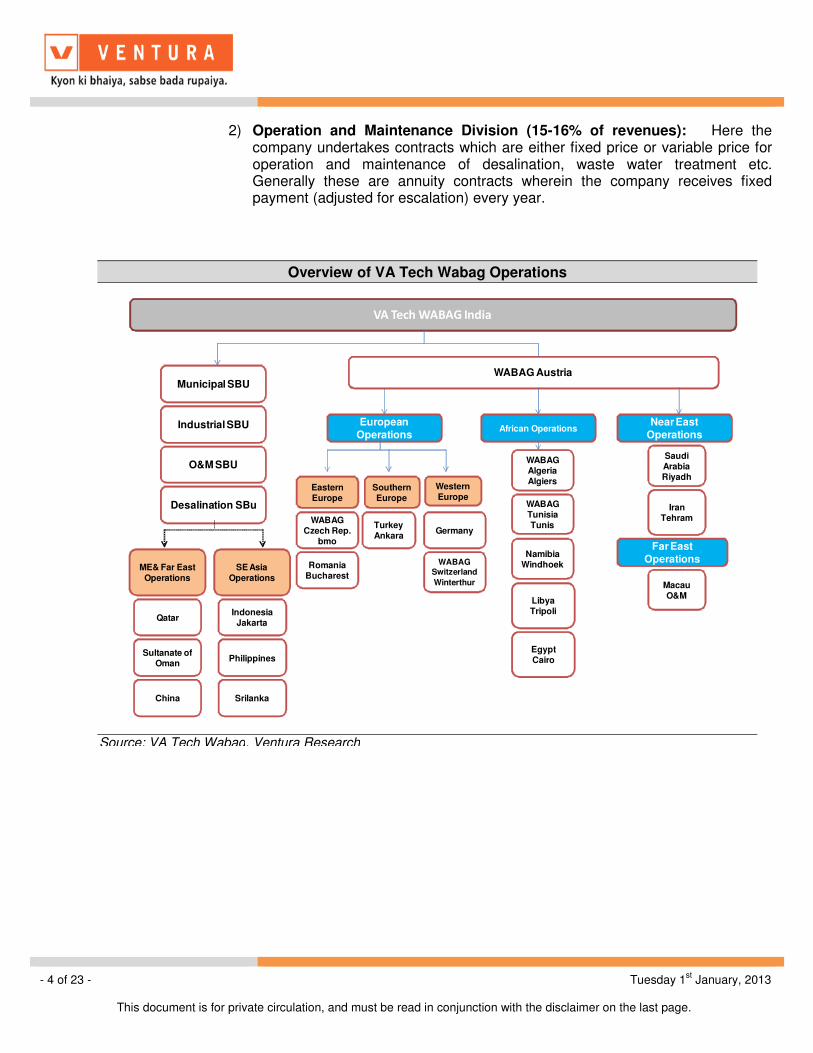
2) Operation and Maintenance Division (15-16% of revenues): Here the company undertakes contracts which are either fixed price or variable price for operation and maintenance of desalination, waste water treatment etc. Generally these are annuity contracts wherein the company receives fixed payment (adjusted for escalation) every year.
Overview of VA Tech Wabag Operations
VA Tech WABAG India
WABAG Austria
European Operations
Southern Europe
Western Europe
Eastern Europe
WABAGCzech Rep.
bmo
RomaniaBucharest
WABAGSwitzerland
Winterthur
TurkeyAnkara
Germany
WABAG AlgeriaAlgiers
LibyaTripoli
WABAG TunisiaTunis
EgyptCairo
NamibiaWindhoek
African OperationsNear East
Operations
Saudi ArabiaRiyadh
Iran Tehram
Far East Operations
MacauO&M
Municipal SBU
Industrial SBU
Desalination SBu
O&M SBU
ME& Far EastOperations
SE Asia Operations
Qatar
Sultanate ofOman
China
IndonesiaJakarta
Philippines
Srilanka
Source: VA Tech Wabag, Ventura Research

- 5 of 23 - Tuesday 1st January, 2013
This document is for private circulation, and must be read in conjunction with the disclaimer on the last page.
� Key Investment Highlights
� Technology – the key differentiator with over 100 patents The key strength of VA Tech Wabag lies in its technology wherein the company undertakes in house engineering for projects. The company outsources civil construction to third parties enabling the company to be asset light. With R & D centres in Austria, Switzerland and India, the company holds over 100 patents in water space. The technological expertise differentiates the company from its competitors and enables it to pre-qualify for certain hi-tech projects thus giving a technological edge. Technology focused company with asset light business model Unlike peers, VA Tech Wabag works on an asset light model, wherein it outsources the entire civil and plant manufacturing works. This allows the company to focus on its core strengths of design, technology and project management skills besides negating the need to necessarily invest on long cycle working capital.
Company has over 100 patents
Aligned to its technological focused patent approach, VA Tech holds around 100 patents and three major research centers in Austria, Switzerland and India. In Austria, the company’s WABAG Austria Group possesses a robust knowledge in several technologies, e.g. BIODEN, BIOPUR, FLUOPUR and MARAPUR while WABAG Switzerland works mainly on filtration for drinking water treatment.
Asset light business model
Design & Engineering
Civil Construction(Outsourced)
TechnologyOperations & Maintenance
� Critical for costOptimization
�Approvals to Match Customers Requirement
� In-house to ensure compliance with designs
� Combinations ofproprietary &Bought & Tech.
� Testing , QualityControl
� Mostly outsourcedto be dedicated Contractors
� Ensures low asset base
�Allows to focus onCore Competencies
� In-house to ensurequality PerformanceHigh Plant� Operation Efficiency� Least Downtime� High EBIDTA
Segment
Source: VA Tech Wabag, Ventura Research
- 6 of 23 - Tuesday 1st January, 2013
This document is for private circulation, and must be read in conjunction with the disclaimer on the last page.
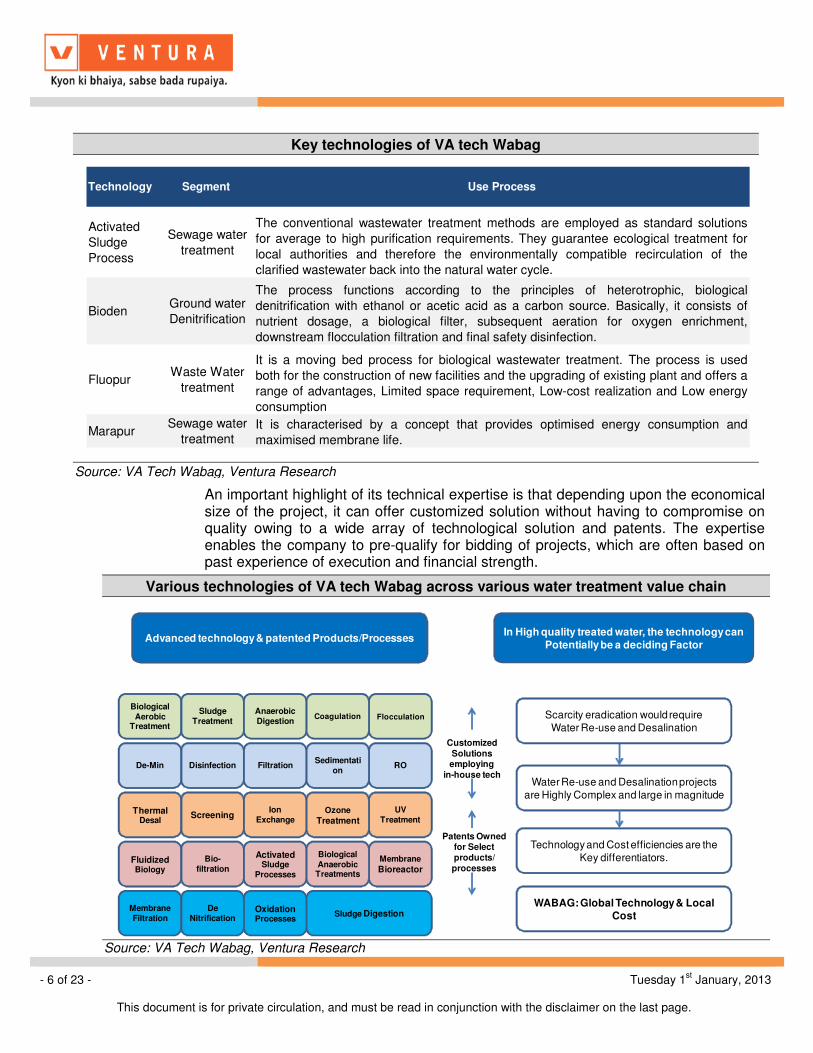
An important highlight of its technical expertise is that depending upon the economical size of the project, it can offer customized solution without having to compromise on quality owing to a wide array of technological solution and patents. The expertise enables the company to pre-qualify for bidding of projects, which are often based on past experience of execution and financial strength.
Various technologies of VA tech Wabag across various water treatment value chain
Customized Solutions employing
in-house tech
Patents Owned for Select products/ processes
Scarcity eradication would requireWater Re-use and Desalination
Water Re-use and Desalination projects are Highly Complex and large in magnitude
Technology and Cost efficiencies are the Key differentiators.
WABAG: Global Technology & Local Cost
Advanced technology & patented Products/ProcessesIn High quality treated water, the technology can
Potentially be a deciding Factor
Biological Aerobic
Treatment
Sludge Treatment
AnaerobicDigestion
Coagulation Flocculation
De-Min Disinfection FiltrationSedimentati
onRO
ThermalDesal
ScreeningIon
ExchangeOzone
Treatment
UVTreatment
Fluidized Biology
Bio-filtration
Activated Sludge
Processes
BiologicalAnaerobicTreatments
Membrane
Bioreactor
MembraneFiltration
De Nitrification
OxidationProcesses
Sludge Digestion
Source: VA Tech Wabag, Ventura Research
Key technologies of VA tech Wabag
Technology Segment Use Process
Activated
Sludge
Process
Sewage water
treatment
The conventional wastewater treatment methods are employed as standard solutions
for average to high purification requirements. They guarantee ecological treatment for
local authorities and therefore the environmentally compatible recirculation of the
clarified wastewater back into the natural water cycle.
BiodenGround water
Denitrification
The process functions according to the principles of heterotrophic, biological
denitrification with ethanol or acetic acid as a carbon source. Basically, it consists of
nutrient dosage, a biological filter, subsequent aeration for oxygen enrichment,
downstream flocculation filtration and final safety disinfection.
FluopurWaste Water
treatment
It is a moving bed process for biological wastewater treatment. The process is used
both for the construction of new facilities and the upgrading of existing plant and offers a
range of advantages, Limited space requirement, Low-cost realization and Low energy
consumption
MarapurSewage water
treatment It is characterised by a concept that provides optimised energy consumption and
maximised membrane life.
Source: VA Tech Wabag, Ventura Research
- 7 of 23 - Tuesday 1st January, 2013
This document is for private circulation, and must be read in conjunction with the disclaimer on the last page.
� A pure play on water – A growing opportunity in India and overseas
Rapidly dwindling pure water resources and the exploding population have brought “water” to the centre stage of the global economy. Both within India and abroad the size of water opportunity is huge. Global water market is growing at 5-6% p.a. and in countries like China, Saudi Arabia and India size of opportunity is anywhere between USD 5.9-47 billion. In India itself, the estimated size of the addressable EPC opportunity as per HPEC estimates is ~ `3,20,908 crore (`16,000 crore p.a.) with the O & M (high margin) portion pegged at `5,46,095 crore (`27,000 crore p.a.) over a period from 2012- 2031. In order to hasten and get sizable portion of this global opportunity, the company has entered into strategic tie ups with international players of repute like Sumitomo corporation. VA Tech is the technological partner in this tie up which would enable the company to get large orders (particularly in the desalination space) in the international arena as well as global recognition. Backed by the strong technological standing and vast experience, we believe VA Tech Wabag being the largest player in this space is expected to be the biggest beneficiary.
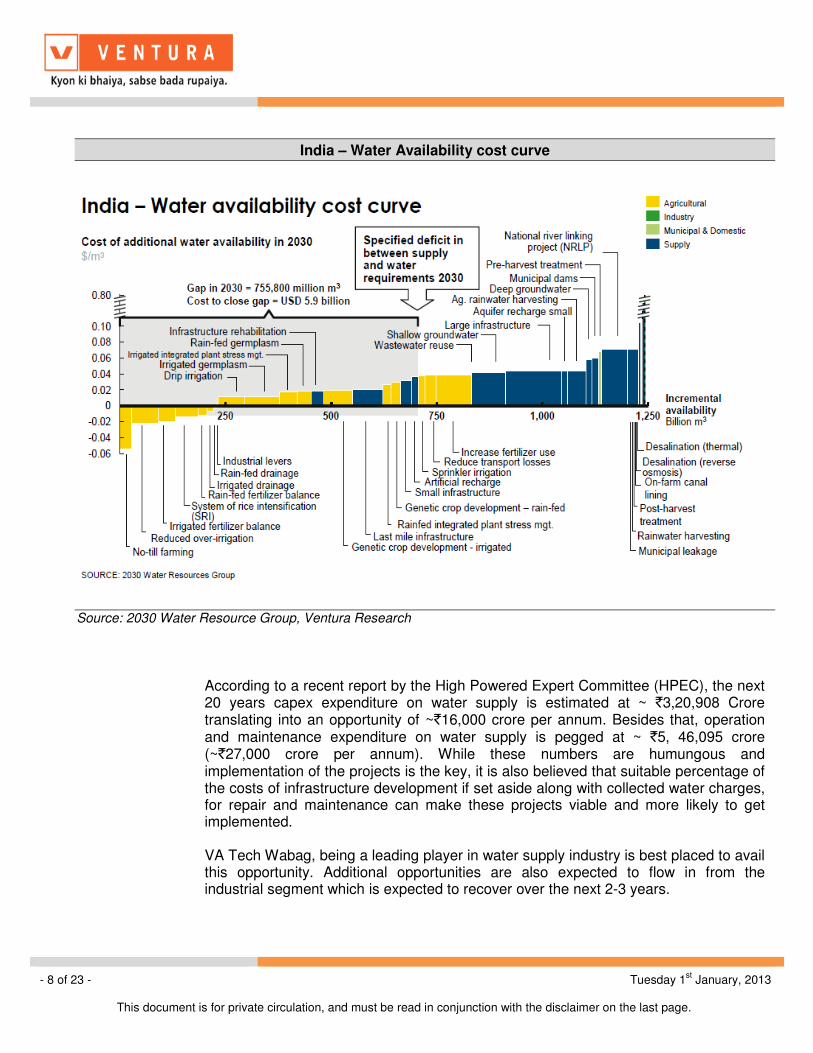
India – massive capex over next 20 years As per Global Water Resource estimates, demand for water in India is growing at 2.8% p.a. By 2030, the total demand for water in India is pegged at ~ 1498 billion cu meter while supply would account for ~ 744 billion cu meter leading to a eye popping demand supply gap of 50%. Water being a prime necessity, this demand supply gap would necessitate expenditure towards recycling of water and its re use, sewage and sludge treatment and desalination. The graphic below depicts the related increase in cost of incremental water given the demand supply gap.
- 8 of 23 - Tuesday 1st January, 2013
This document is for private circulation, and must be read in conjunction with the disclaimer on the last page.
According to a recent report by the High Powered Expert Committee (HPEC), the next 20 years capex expenditure on water supply is estimated at ~ `3,20,908 Crore translating into an opportunity of ~`16,000 crore per annum. Besides that, operation and maintenance expenditure on water supply is pegged at ~ `5, 46,095 crore (~`27,000 crore per annum). While these numbers are humungous and implementation of the projects is the key, it is also believed that suitable percentage of the costs of infrastructure development if set aside along with collected water charges, for repair and maintenance can make these projects viable and more likely to get implemented. VA Tech Wabag, being a leading player in water supply industry is best placed to avail this opportunity. Additional opportunities are also expected to flow in from the industrial segment which is expected to recover over the next 2-3 years.
India – Water Availability cost curve
Source: 2030 Water Resource Group, Ventura Research
- 9 of 23 - Tuesday 1st January, 2013
This document is for private circulation, and must be read in conjunction with the disclaimer on the last page.
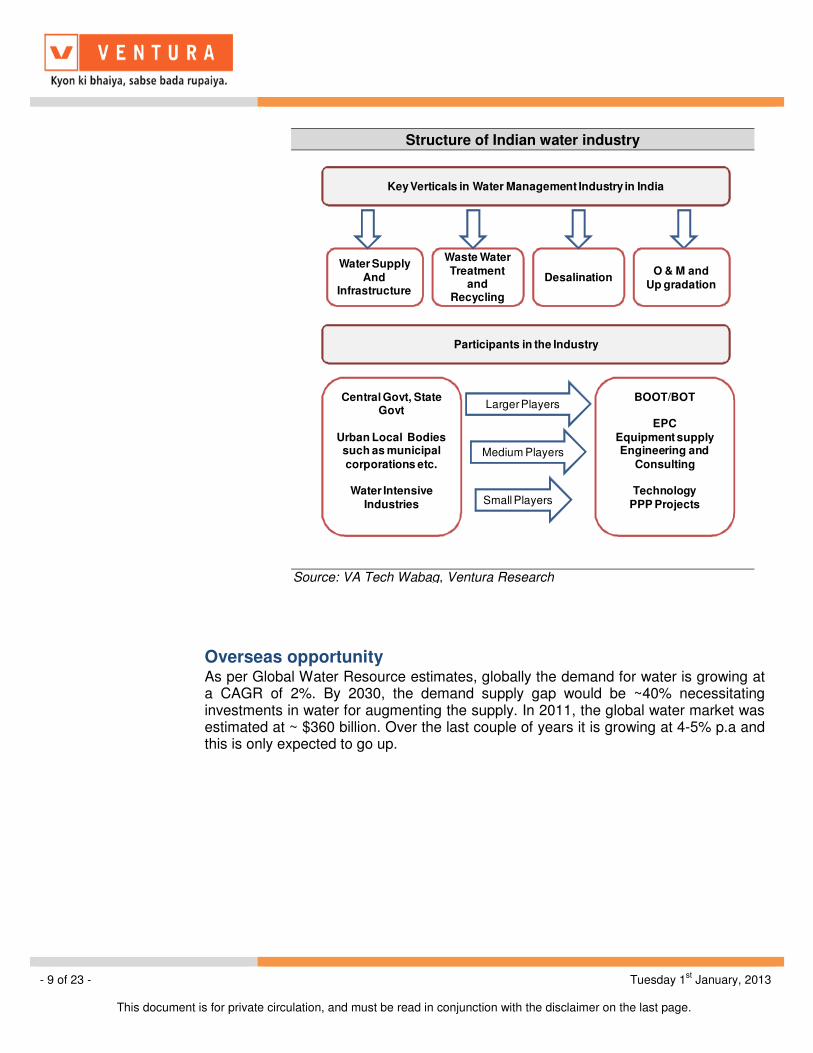
Overseas opportunity
As per Global Water Resource estimates, globally the demand for water is growing at a CAGR of 2%. By 2030, the demand supply gap would be ~40% necessitating investments in water for augmenting the supply. In 2011, the global water market was estimated at ~ $360 billion. Over the last couple of years it is growing at 4-5% p.a and this is only expected to go up.
Structure of Indian water industry
Key Verticals in Water Management Industry in India
Water SupplyAnd
InfrastructureDesalination
Waste Water Treatment
andRecycling
O & M and Up gradation
Participants in the Industry
Central Govt, State Govt
Urban Local Bodies such as municipal
corporations etc.
Water Intensive Industries
BOOT/BOT
EPC
Equipment supplyEngineering and
Consulting
TechnologyPPP Projects
Larger Players
Medium Players
Small Players
Source: VA Tech Wabag, Ventura Research
- 10 of 23 - Tuesday 1st January, 2013
This document is for private circulation, and must be read in conjunction with the disclaimer on the last page.
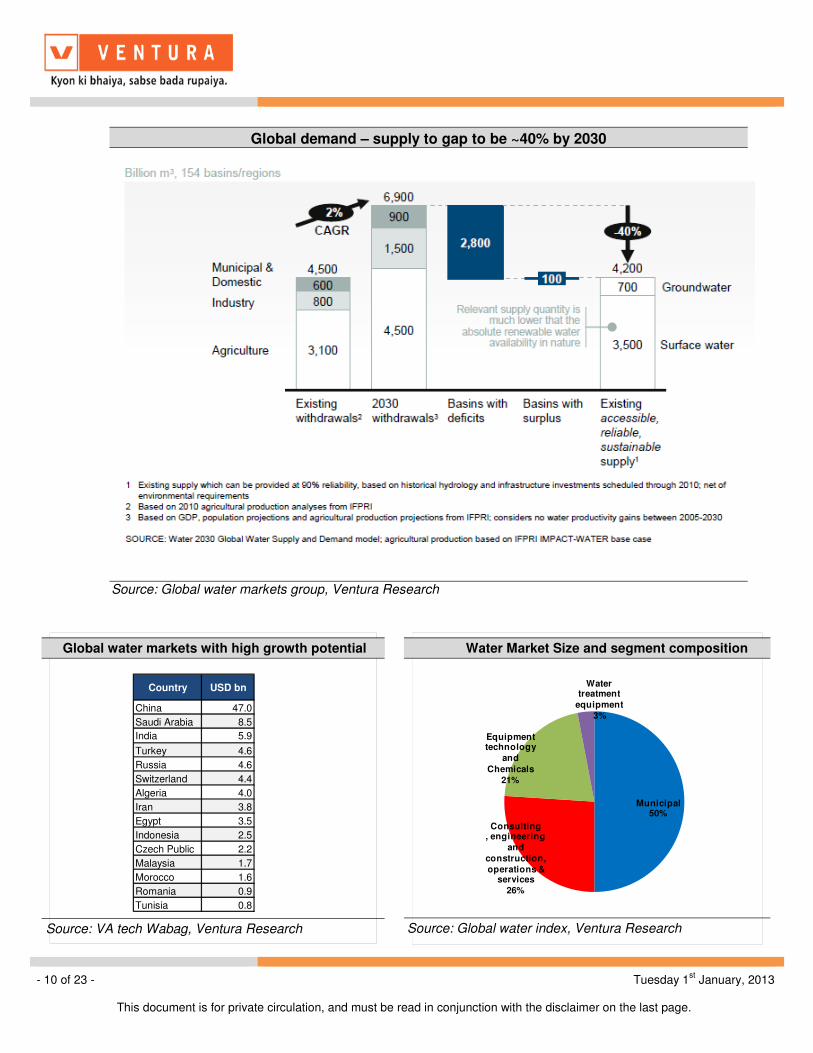
Water Market Size and segment composition
Municipal50%
Consulting , engineering
and construction,operations &
services26%
Equipment technology
and
Chemicals21%
Water treatment
equipment3%
Source: Global water index, Ventura Research
Global water markets with high growth potential
Country USD bn
China 47.0
Saudi Arabia 8.5
India 5.9
Turkey 4.6
Russia 4.6
Switzerland 4.4
Algeria 4.0
Iran 3.8
Egypt 3.5
Indonesia 2.5
Czech Public 2.2
Malaysia 1.7
Morocco 1.6
Romania 0.9
Tunisia 0.8
S Source: VA tech Wabag, Ventura Research
Global demand – supply to gap to be ~40% by 2030
Source: Global water markets group, Ventura Research
- 11 of 23 - Tuesday 1st January, 2013
This document is for private circulation, and must be read in conjunction with the disclaimer on the last page.
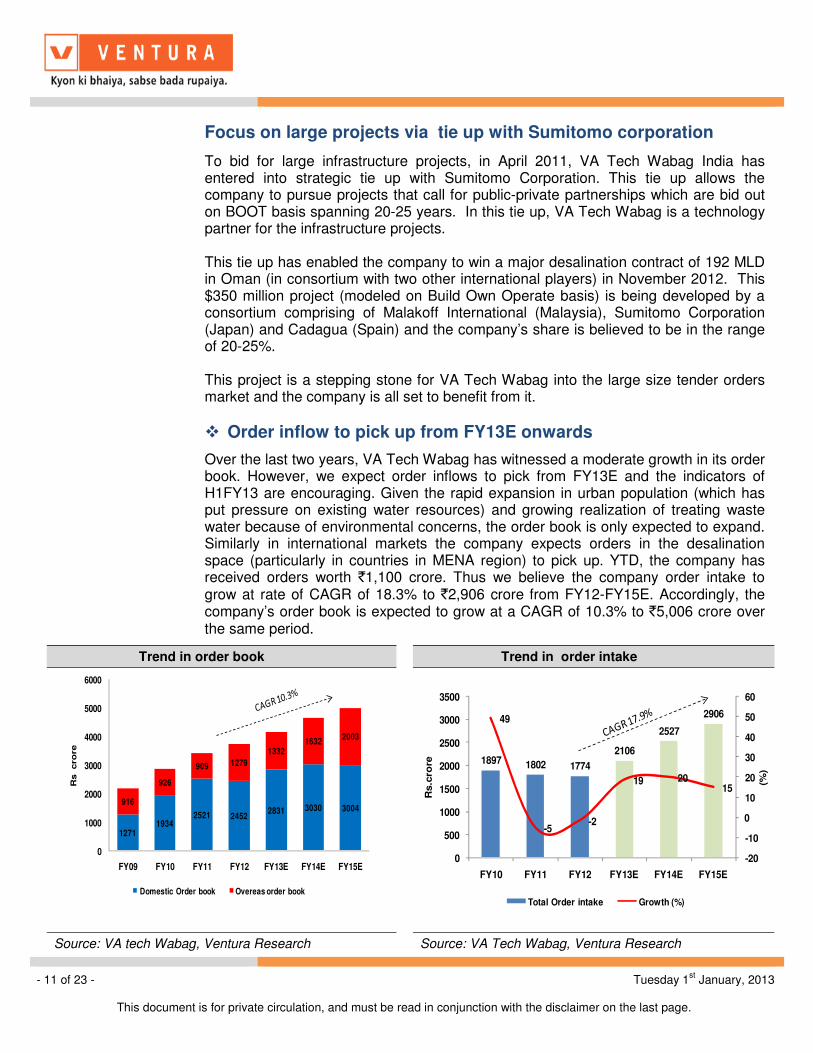
Focus on large projects via tie up with Sumitomo corporation To bid for large infrastructure projects, in April 2011, VA Tech Wabag India has entered into strategic tie up with Sumitomo Corporation. This tie up allows the company to pursue projects that call for public-private partnerships which are bid out on BOOT basis spanning 20-25 years. In this tie up, VA Tech Wabag is a technology partner for the infrastructure projects. This tie up has enabled the company to win a major desalination contract of 192 MLD in Oman (in consortium with two other international players) in November 2012. This $350 million project (modeled on Build Own Operate basis) is being developed by a consortium comprising of Malakoff International (Malaysia), Sumitomo Corporation (Japan) and Cadagua (Spain) and the company’s share is believed to be in the range of 20-25%. This project is a stepping stone for VA Tech Wabag into the large size tender orders market and the company is all set to benefit from it.
� Order inflow to pick up from FY13E onwards
Over the last two years, VA Tech Wabag has witnessed a moderate growth in its order book. However, we expect order inflows to pick from FY13E and the indicators of H1FY13 are encouraging. Given the rapid expansion in urban population (which has put pressure on existing water resources) and growing realization of treating waste water because of environmental concerns, the order book is only expected to expand. Similarly in international markets the company expects orders in the desalination space (particularly in countries in MENA region) to pick up. YTD, the company has received orders worth `1,100 crore. Thus we believe the company order intake to grow at rate of CAGR of 18.3% to `2,906 crore from FY12-FY15E. Accordingly, the company’s order book is expected to grow at a CAGR of 10.3% to `5,006 crore over the same period.
Trend in order book Trend in order intake
12711934
2521 24522831 3030 3004
916
926
909 1279
13321632
2003
0
1000
2000
3000
4000
5000
6000
FY09 FY10 FY11 FY12 FY13E FY14E FY15E
Rs cro
re
Domestic Order book Overeas order book
1897 1802 1774
2106
2527
290649
-5-2
19 2015
-20
-10
0
10
20
30
40
50
60
0
500
1000
1500
2000
2500
3000
3500
FY10 FY11 FY12 FY13E FY14E FY15E
(%)
Rs.c
rore
Total Order intake Growth (%)
Source: VA tech Wabag, Ventura Research Source: VA Tech Wabag, Ventura Research
- 12 of 23 - Tuesday 1st January, 2013
This document is for private circulation, and must be read in conjunction with the disclaimer on the last page.
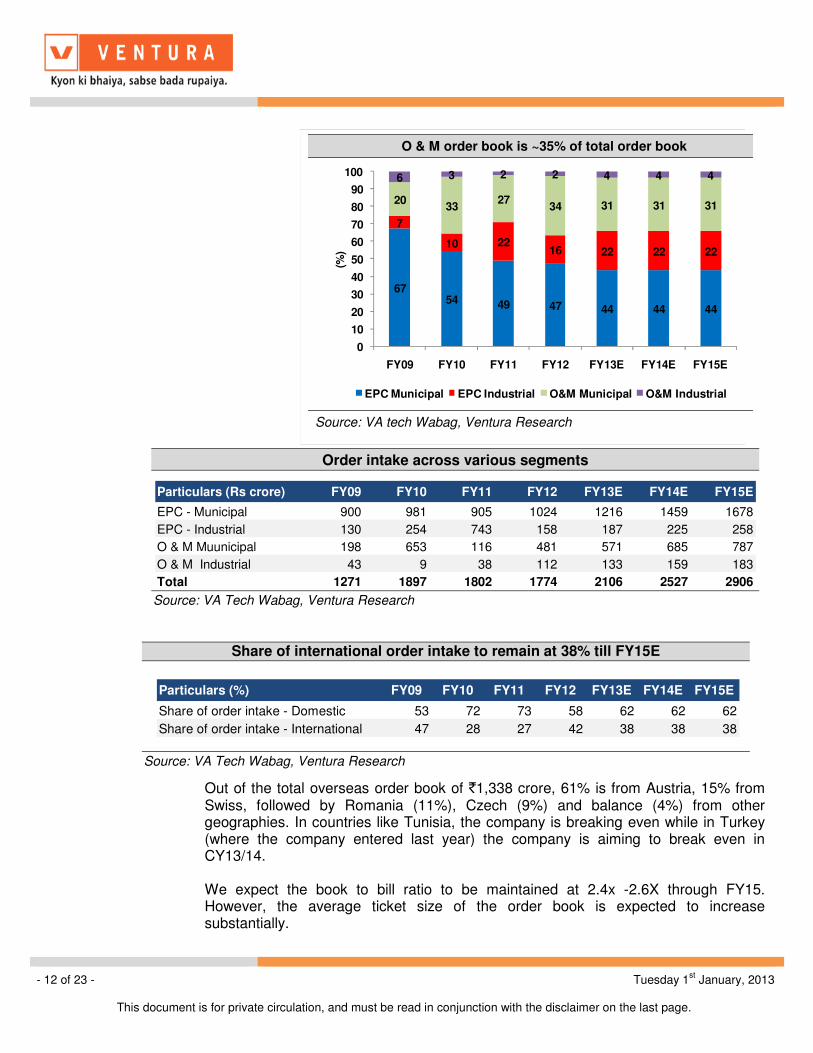
Out of the total overseas order book of `1,338 crore, 61% is from Austria, 15% from Swiss, followed by Romania (11%), Czech (9%) and balance (4%) from other geographies. In countries like Tunisia, the company is breaking even while in Turkey (where the company entered last year) the company is aiming to break even in CY13/14. We expect the book to bill ratio to be maintained at 2.4x -2.6X through FY15. However, the average ticket size of the order book is expected to increase substantially.
O & M order book is ~35% of total order book
6754 49 47 44 44 44
7
10 2216 22 22 22
2033
2734 31 31 31
6 3 2 2 4 4 4
0
10
20
30
40
50
60
70
80
90
100
FY09 FY10 FY11 FY12 FY13E FY14E FY15E
(%)
EPC Municipal EPC Industrial O&M Municipal O&M Industrial
Source: VA tech Wabag, Ventura Research
Order intake across various segments
Particulars (Rs crore) FY09 FY10 FY11 FY12 FY13E FY14E FY15E
EPC - Municipal 900 981 905 1024 1216 1459 1678
EPC - Industrial 130 254 743 158 187 225 258
O & M Muunicipal 198 653 116 481 571 685 787
O & M Industrial 43 9 38 112 133 159 183
Total 1271 1897 1802 1774 2106 2527 2906 Source: VA Tech Wabag, Ventura Research
Share of international order intake to remain at 38% till FY15E
Particulars (%) FY09 FY10 FY11 FY12 FY13E FY14E FY15E
Share of order intake - Domestic 53 72 73 58 62 62 62
Share of order intake - International 47 28 27 42 38 38 38
Source: VA Tech Wabag, Ventura Research
- 13 of 23 - Tuesday 1st January, 2013
This document is for private circulation, and must be read in conjunction with the disclaimer on the last page.
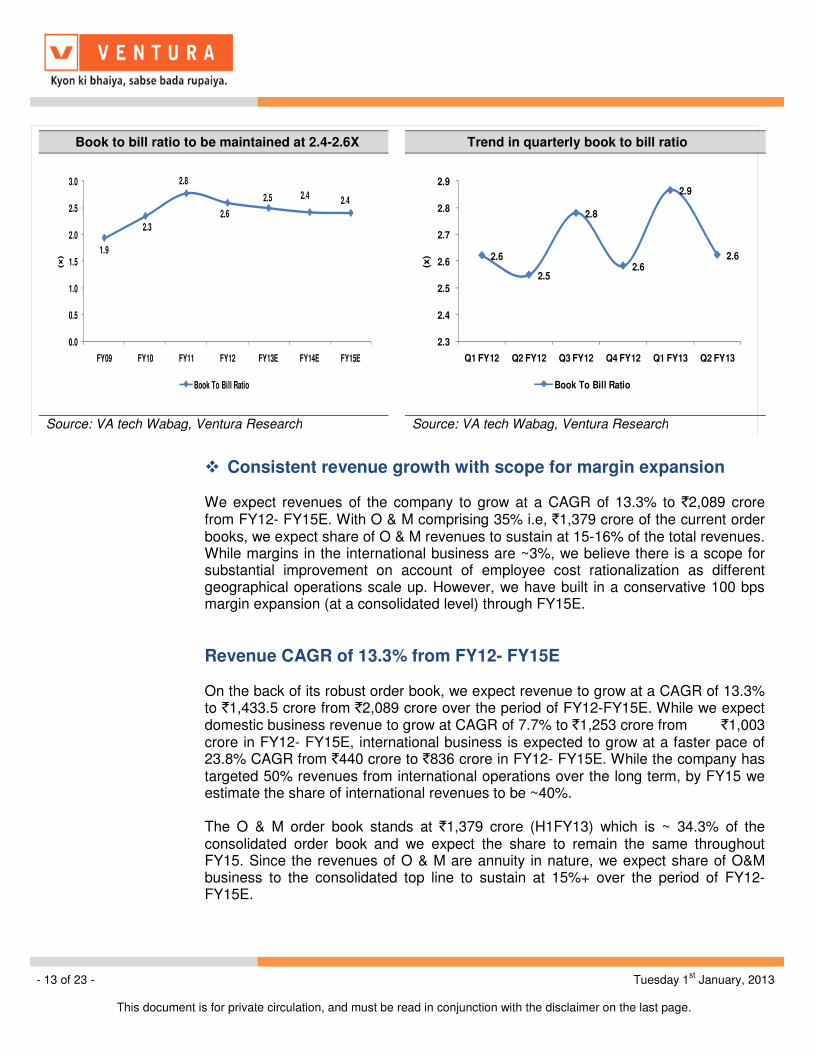
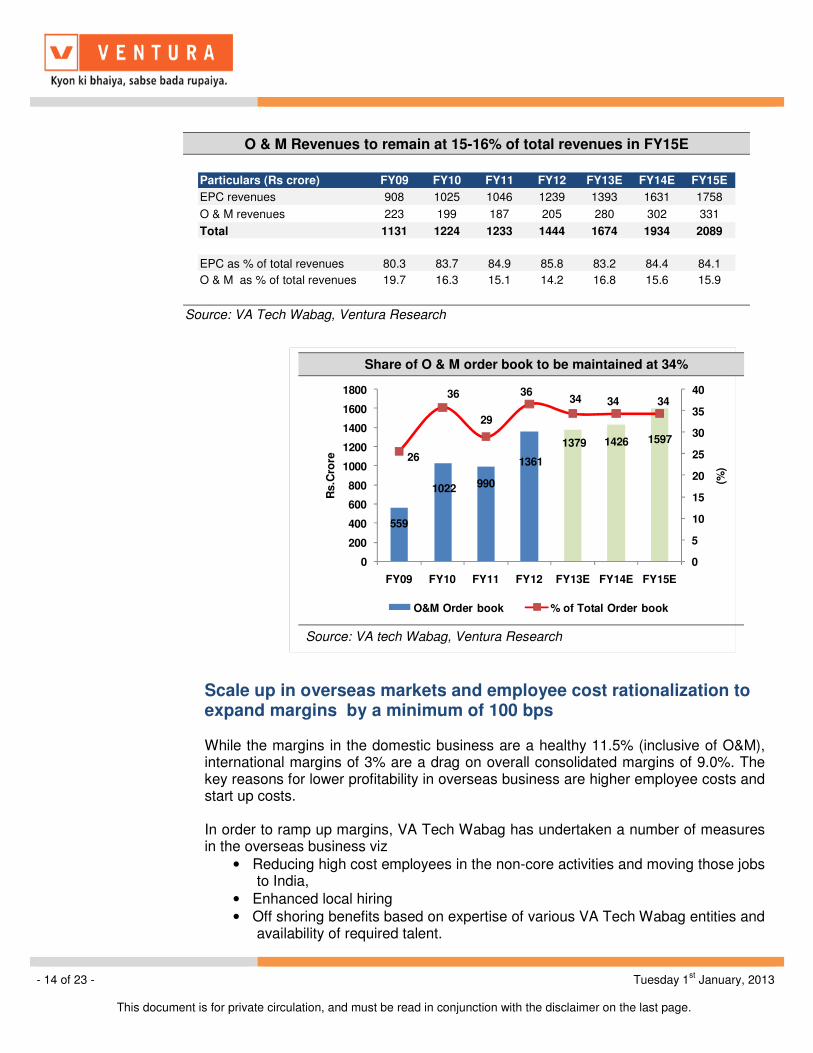
� Consistent revenue growth with scope for margin expansion We expect revenues of the company to grow at a CAGR of 13.3% to `2,089 crore from FY12- FY15E. With O & M comprising 35% i.e, `1,379 crore of the current order books, we expect share of O & M revenues to sustain at 15-16% of the total revenues. While margins in the international business are ~3%, we believe there is a scope for substantial improvement on account of employee cost rationalization as different geographical operations scale up. However, we have built in a conservative 100 bps margin expansion (at a consolidated level) through FY15E.
Revenue CAGR of 13.3% from FY12- FY15E On the back of its robust order book, we expect revenue to grow at a CAGR of 13.3% to `1,433.5 crore from `2,089 crore over the period of FY12-FY15E. While we expect domestic business revenue to grow at CAGR of 7.7% to `1,253 crore from `1,003 crore in FY12- FY15E, international business is expected to grow at a faster pace of 23.8% CAGR from `440 crore to `836 crore in FY12- FY15E. While the company has targeted 50% revenues from international operations over the long term, by FY15 we estimate the share of international revenues to be ~40%. The O & M order book stands at `1,379 crore (H1FY13) which is ~ 34.3% of the consolidated order book and we expect the share to remain the same throughout FY15. Since the revenues of O & M are annuity in nature, we expect share of O&M business to the consolidated top line to sustain at 15%+ over the period of FY12- FY15E.
Book to bill ratio to be maintained at 2.4-2.6X Trend in quarterly book to bill ratio
1.9
2.3
2.8
2.6
2.5 2.42.4
0.0
0.5
1.0
1.5
2.0
2.5
3.0
FY09 FY10 FY11 FY12 FY13E FY14E FY15E
(x)
Book To Bill Ratio
2.6
2.5
2.8
2.6
2.9
2.6
2.3
2.4
2.5
2.6
2.7
2.8
2.9
Q1 FY12 Q2 FY12 Q3 FY12 Q4 FY12 Q1 FY13 Q2 FY13
(x)
Book To Bill Ratio
Source: VA tech Wabag, Ventura Research Source: VA tech Wabag, Ventura Research
- 14 of 23 - Tuesday 1st January, 2013
This document is for private circulation, and must be read in conjunction with the disclaimer on the last page.
Scale up in overseas markets and employee cost rationalization to expand margins by a minimum of 100 bps While the margins in the domestic business are a healthy 11.5% (inclusive of O&M), international margins of 3% are a drag on overall consolidated margins of 9.0%. The key reasons for lower profitability in overseas business are higher employee costs and start up costs. In order to ramp up margins, VA Tech Wabag has undertaken a number of measures in the overseas business viz
• Reducing high cost employees in the non-core activities and moving those jobs to India,
• Enhanced local hiring • Off shoring benefits based on expertise of various VA Tech Wabag entities and
availability of required talent.
Share of O & M order book to be maintained at 34%
559
1022 990
1361
1379 1426 1597
26
36
29
3634 34 34
0
5
10
15
20
25
30
35
40
0
200
400
600
800
1000
1200
1400
1600
1800
FY09 FY10 FY11 FY12 FY13E FY14E FY15E
(%)
Rs.C
rore
O&M Order book % of Total Order book
Source: VA tech Wabag, Ventura Research
O & M Revenues to remain at 15-16% of total revenues in FY15E
Particulars (Rs crore) FY09 FY10 FY11 FY12 FY13E FY14E FY15E
EPC revenues 908 1025 1046 1239 1393 1631 1758
O & M revenues 223 199 187 205 280 302 331
Total 1131 1224 1233 1444 1674 1934 2089
EPC as % of total revenues 80.3 83.7 84.9 85.8 83.2 84.4 84.1
O & M as % of total revenues 19.7 16.3 15.1 14.2 16.8 15.6 15.9 Source: VA Tech Wabag, Ventura Research
- 15 of 23 - Tuesday 1st January, 2013
This document is for private circulation, and must be read in conjunction with the disclaimer on the last page.
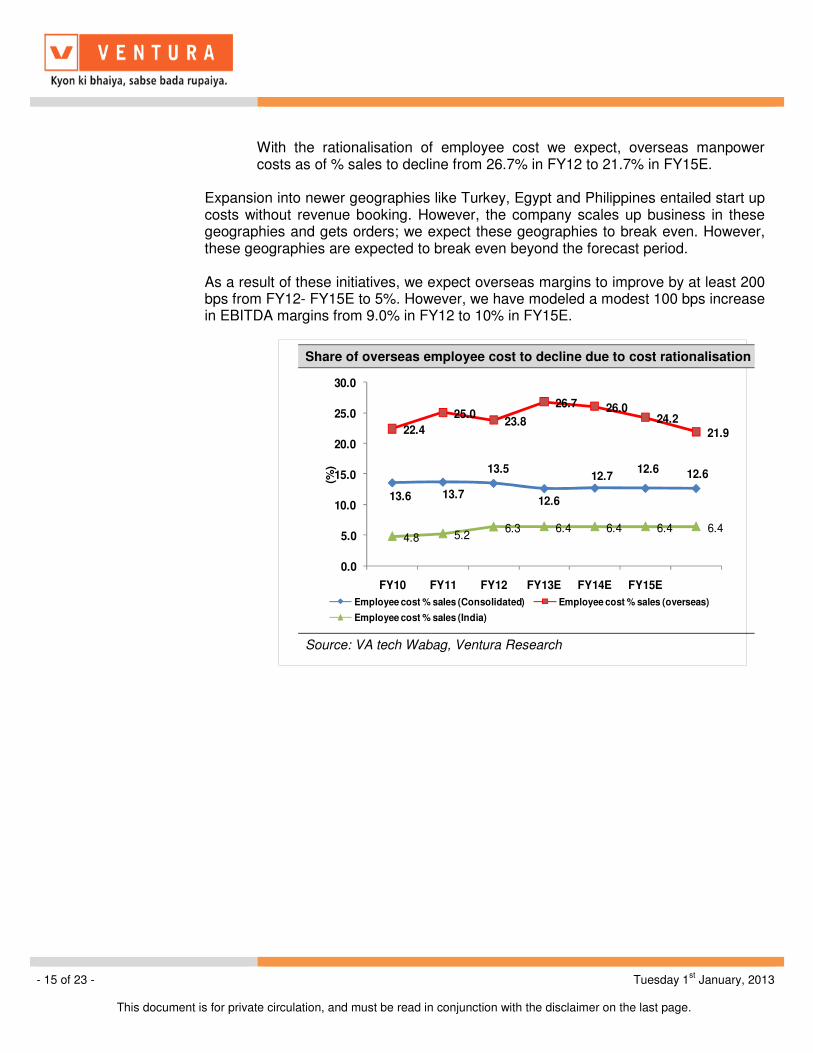
With the rationalisation of employee cost we expect, overseas manpower costs as of % sales to decline from 26.7% in FY12 to 21.7% in FY15E.
Expansion into newer geographies like Turkey, Egypt and Philippines entailed start up costs without revenue booking. However, the company scales up business in these geographies and gets orders; we expect these geographies to break even. However, these geographies are expected to break even beyond the forecast period. As a result of these initiatives, we expect overseas margins to improve by at least 200 bps from FY12- FY15E to 5%. However, we have modeled a modest 100 bps increase in EBITDA margins from 9.0% in FY12 to 10% in FY15E.
Share of overseas employee cost to decline due to cost rationalisation
13.6 13.7
13.5
12.6
12.712.6 12.6
22.4
25.023.8
26.7 26.024.2
21.9
4.8 5.26.3 6.4 6.4 6.4 6.4
0.0
5.0
10.0
15.0
20.0
25.0
30.0
FY10 FY11 FY12 FY13E FY14E FY15E
(%)
Employee cost % sales (Consolidated) Employee cost % sales (overseas)
Employee cost % sales (India)
Source: VA tech Wabag, Ventura Research
- 16 of 23 - Tuesday 1st January, 2013
This document is for private circulation, and must be read in conjunction with the disclaimer on the last page.
� Key risks
� Political risks – India and overseas can delay project orders Most of the water projects in India and overseas (Municipal) are deterministic of government decision making. As a result, political risk is the key risk to the company. In the past, political events like the Arab Spring had put the company’s business in countries like Libya, Syria, Yemen, Tunisia and Egypt on hold. If such political events replay, deferment of orders cannot be ruled out. Also delays in order finalization due to bureaucratic hurdles / red tapism can hurt order inflow.
� Competition can arrest possible expansion in margins Since the opportunity in India and International market is huge, we anticipate increasing competition going forward. This can be re-iterated from the fact that Hitachi corporation (from Japan) is expected to sign a pact with Gujarat to set up desalination plant in Dahej. The other partners in the project are Hyflux from Singapore, Japan's Itochu Corporation and the Gujarat government. There is a possibility that Indian EPC contractors may tie up with foreign technology providers to foray into the water business and bid at lower margins to get orders. This trend was observed in Transmission and distribution orders on the power sector where pre qualification norms (for companies to bid) were diluted resulting in non serious players entering the sector (with low execution capability) and wrecking margins of the incumbent operators by bidding at extremely low margins.
� Potential Tax liability of ~ `̀̀̀41 crore The Company had been claiming deduction under section 80-IA of the Income Tax Act, 1961 from FY02 as a developer of infrastructure projects in India. The Finance Act 2009 amended the provisions of Section 80-IA retrospectively with effect from 01 April 2000 to make it inapplicable for persons having a mere works contract with the government or statutory authority. The company has been contesting the charge in the High Court of Chennai. If the matter goes against the company, the company could have a tax liability of `41 crore (Income tax impact of `̀̀̀24.22 crore and `16.72 crore as interest).
- 17 of 23 - Tuesday 1st January, 2013
This document is for private circulation, and must be read in conjunction with the disclaimer on the last page.
Financial performance (consolidated)
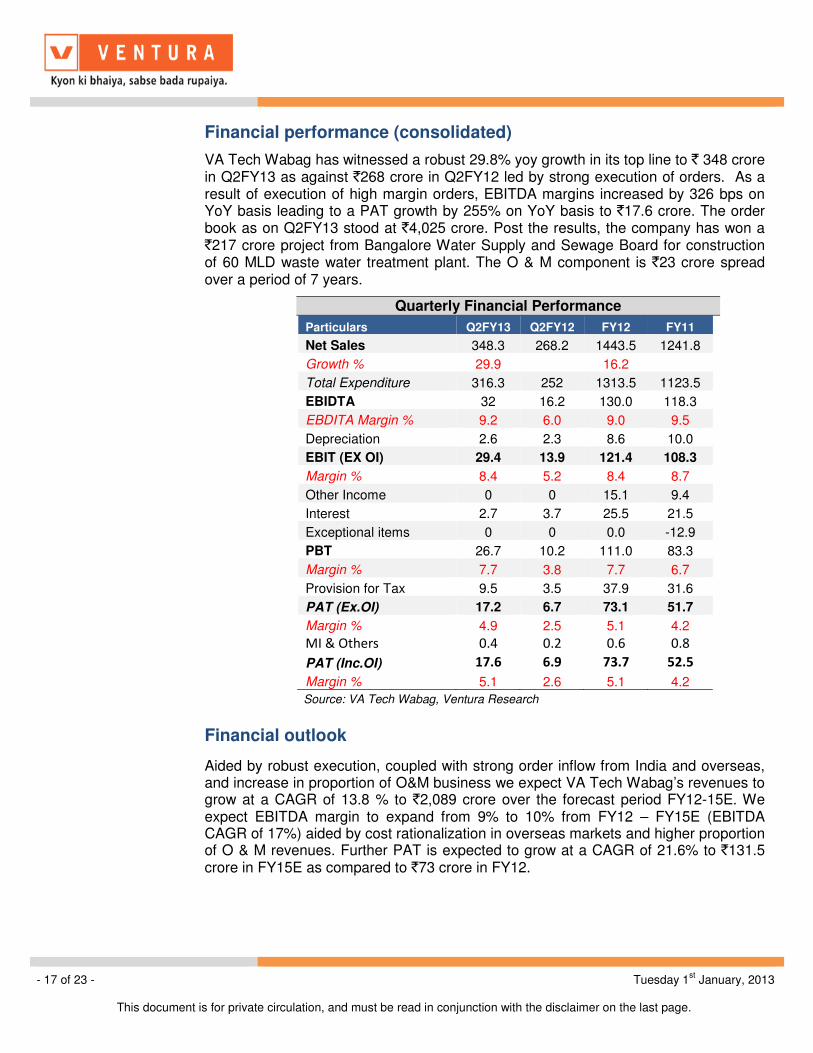
VA Tech Wabag has witnessed a robust 29.8% yoy growth in its top line to ` 348 crore in Q2FY13 as against `268 crore in Q2FY12 led by strong execution of orders. As a result of execution of high margin orders, EBITDA margins increased by 326 bps on YoY basis leading to a PAT growth by 255% on YoY basis to `17.6 crore. The order book as on Q2FY13 stood at `4,025 crore. Post the results, the company has won a `217 crore project from Bangalore Water Supply and Sewage Board for construction of 60 MLD waste water treatment plant. The O & M component is `23 crore spread over a period of 7 years.
Financial outlook
Aided by robust execution, coupled with strong order inflow from India and overseas, and increase in proportion of O&M business we expect VA Tech Wabag’s revenues to grow at a CAGR of 13.8 % to `2,089 crore over the forecast period FY12-15E. We expect EBITDA margin to expand from 9% to 10% from FY12 – FY15E (EBITDA CAGR of 17%) aided by cost rationalization in overseas markets and higher proportion of O & M revenues. Further PAT is expected to grow at a CAGR of 21.6% to `131.5 crore in FY15E as compared to `73 crore in FY12.
Quarterly Financial Performance Particulars Q2FY13 Q2FY12 FY12 FY11
Net Sales 348.3 268.2 1443.5 1241.8
Growth % 29.9 16.2
Total Expenditure 316.3 252 1313.5 1123.5
EBIDTA 32 16.2 130.0 118.3
EBDITA Margin % 9.2 6.0 9.0 9.5
Depreciation 2.6 2.3 8.6 10.0
EBIT (EX OI) 29.4 13.9 121.4 108.3
Margin % 8.4 5.2 8.4 8.7
Other Income 0 0 15.1 9.4
Interest 2.7 3.7 25.5 21.5
Exceptional items 0 0 0.0 -12.9
PBT 26.7 10.2 111.0 83.3
Margin % 7.7 3.8 7.7 6.7
Provision for Tax 9.5 3.5 37.9 31.6
PAT (Ex.OI) 17.2 6.7 73.1 51.7
Margin % 4.9 2.5 5.1 4.2
MI & Others 0.4 0.2 0.6 0.8
PAT (Inc.OI) 17.6 6.9 73.7 52.5
Margin % 5.1 2.6 5.1 4.2
Source: VA Tech Wabag, Ventura Research
- 18 of 23 - Tuesday 1st January, 2013
This document is for private circulation, and must be read in conjunction with the disclaimer on the last page.
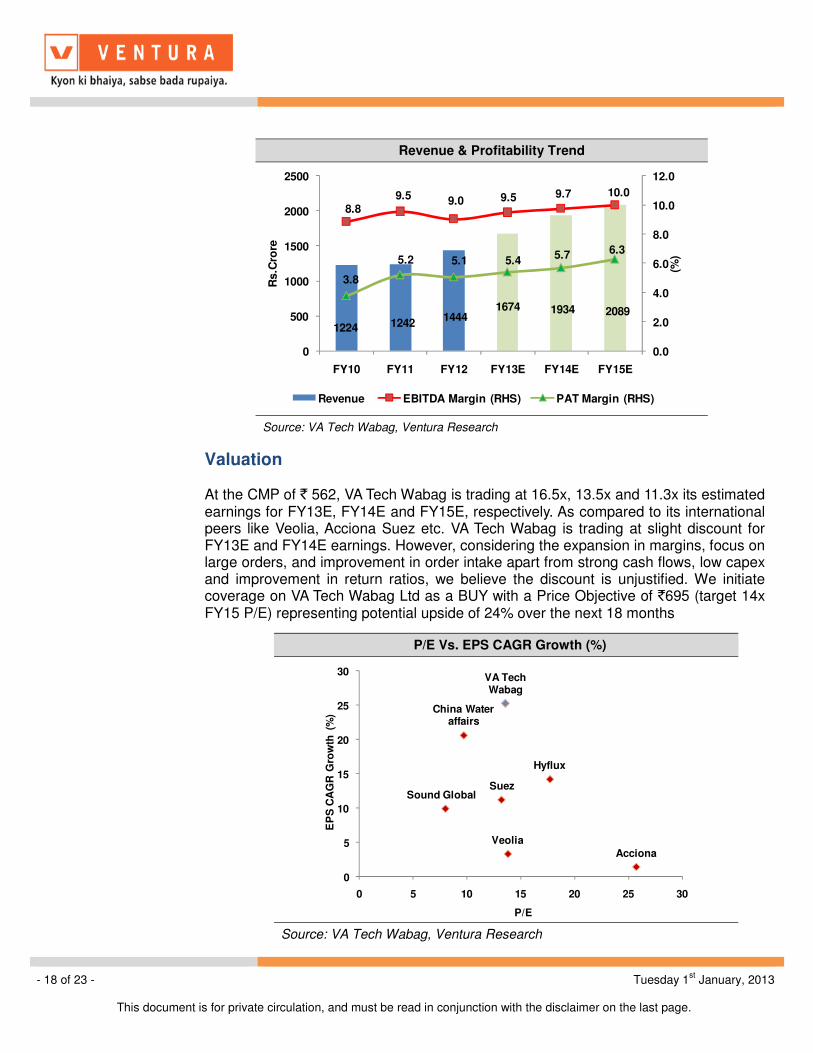
Valuation At the CMP of ` 562, VA Tech Wabag is trading at 16.5x, 13.5x and 11.3x its estimated earnings for FY13E, FY14E and FY15E, respectively. As compared to its international peers like Veolia, Acciona Suez etc. VA Tech Wabag is trading at slight discount for FY13E and FY14E earnings. However, considering the expansion in margins, focus on large orders, and improvement in order intake apart from strong cash flows, low capex and improvement in return ratios, we believe the discount is unjustified. We initiate coverage on VA Tech Wabag Ltd as a BUY with a Price Objective of `695 (target 14x FY15 P/E) representing potential upside of 24% over the next 18 months
Revenue & Profitability Trend
1224 12421444
1674 1934 2089
8.89.5 9.0 9.5 9.7 10.0
3.8
5.2 5.1 5.45.7 6.3
0.0
2.0
4.0
6.0
8.0
10.0
12.0
0
500
1000
1500
2000
2500
FY10 FY11 FY12 FY13E FY14E FY15E
(%)
Rs.C
rore
Revenue EBITDA Margin (RHS) PAT Margin (RHS)
Source: VA Tech Wabag, Ventura Research
P/E Vs. EPS CAGR Growth (%)
VA Tech Wabag
Veolia
Acciona
Suez
Hyflux
Sound Global
China Water affairs
0
5
10
15
20
25
30
0 5 10 15 20 25 30
EP
S C
AG
R G
row
th (
%)
P/E Source: VA Tech Wabag, Ventura Research
- 19 of 23 - Tuesday 1st January, 2013
This document is for private circulation, and must be read in conjunction with the disclaimer on the last page.
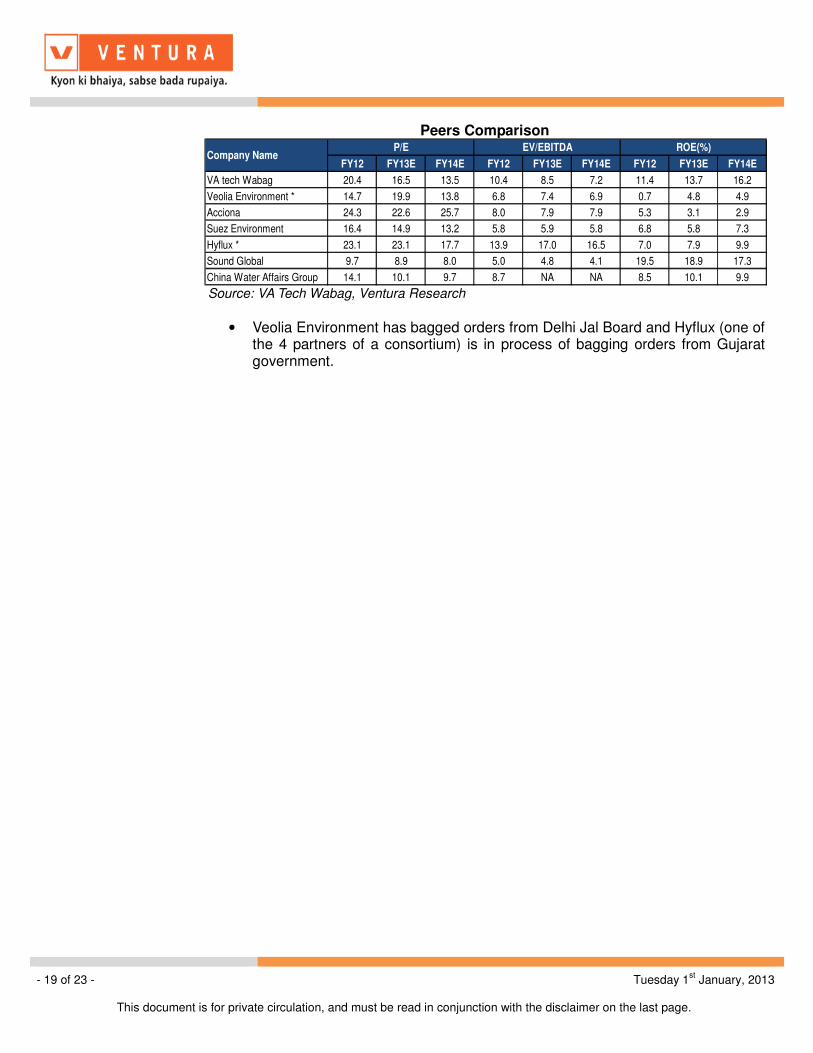
Peers Comparison
FY12 FY13E FY14E FY12 FY13E FY14E FY12 FY13E FY14E
VA tech Wabag 20.4 16.5 13.5 10.4 8.5 7.2 11.4 13.7 16.2
Veolia Environment * 14.7 19.9 13.8 6.8 7.4 6.9 0.7 4.8 4.9
Acciona 24.3 22.6 25.7 8.0 7.9 7.9 5.3 3.1 2.9
Suez Environment 16.4 14.9 13.2 5.8 5.9 5.8 6.8 5.8 7.3
Hyflux * 23.1 23.1 17.7 13.9 17.0 16.5 7.0 7.9 9.9
Sound Global 9.7 8.9 8.0 5.0 4.8 4.1 19.5 18.9 17.3
China Water Affairs Group 14.1 10.1 9.7 8.7 NA NA 8.5 10.1 9.9
P/E EV/EBITDA ROE(%)Company Name
Source: VA Tech Wabag, Ventura Research
• Veolia Environment has bagged orders from Delhi Jal Board and Hyflux (one of the 4 partners of a consortium) is in process of bagging orders from Gujarat government.
- 20 of 23 - Tuesday 1st January, 2013
This document is for private circulation, and must be read in conjunction with the disclaimer on the last page.
P/E
50
250
450
650
850
1,050
1,250
Oct-10 Mar-11 Aug-11 Jan-12 Jun-12 Nov-12
CMP 11.5X 15.52X 19.54X 23.56X 27.58X
Source: Ventura Research
P/B
150
250
350
450
550
650
750
850
Oct-10 Mar-11 Aug-11 Jan-12 Jun-12 Nov-12
CMP 1.25X 1.685X 2.12X 2.555X 2.99X
Source: Ventura Research
EV/EBITDA
200
400
600
800
1,000
1,200
1,400
1,600
1,800
2,000
Oct-10 Oct-11 Oct-12
EV 3.5X 5.485X 7.47X 9.455X 11.44X
Source: Ventura Research
- 21 of 23 - Tuesday 1st January, 2013
This document is for private circulation, and must be read in conjunction with the disclaimer on the last page.
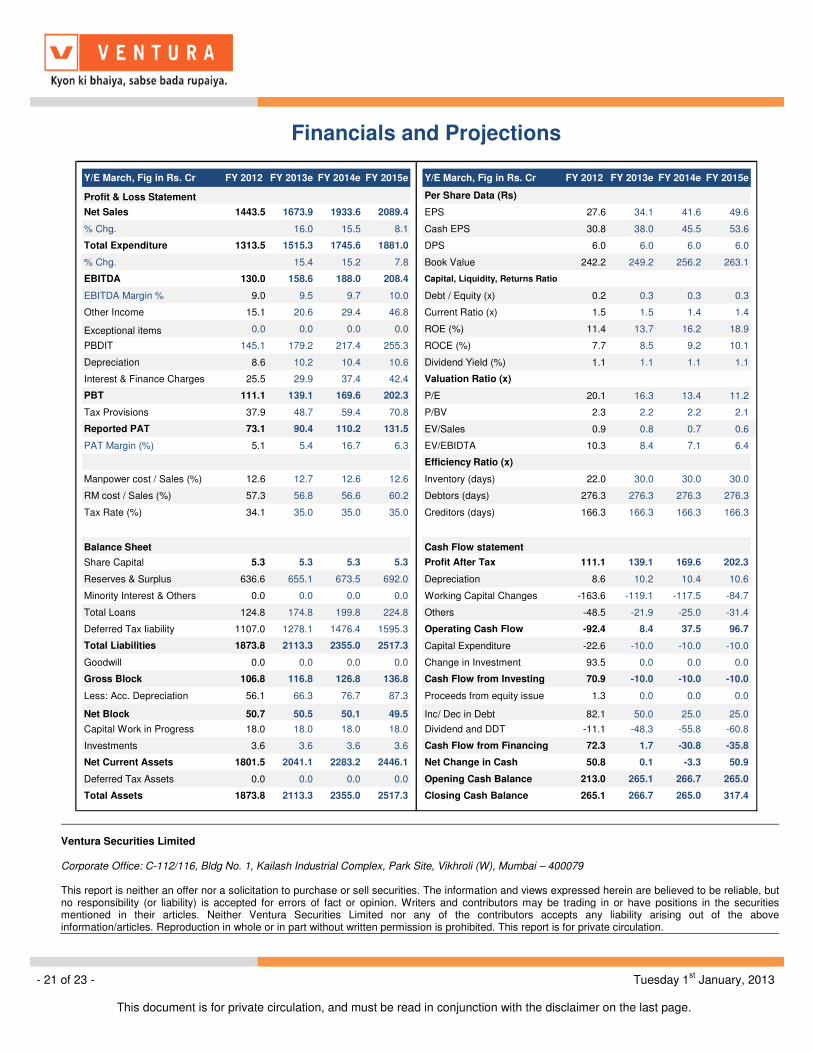
Financials and Projections
Y/E March, Fig in Rs. Cr FY 2012 FY 2013e FY 2014e FY 2015e Y/E March, Fig in Rs. Cr FY 2012 FY 2013e FY 2014e FY 2015e
Profit & Loss Statement Per Share Data (Rs)
Net Sales 1443.5 1673.9 1933.6 2089.4 EPS 27.6 34.1 41.6 49.6
% Chg. 16.0 15.5 8.1 Cash EPS 30.8 38.0 45.5 53.6
Total Expenditure 1313.5 1515.3 1745.6 1881.0 DPS 6.0 6.0 6.0 6.0
% Chg. 15.4 15.2 7.8 Book Value 242.2 249.2 256.2 263.1
EBITDA 130.0 158.6 188.0 208.4 Capital, Liquidity, Returns Ratio
EBITDA Margin % 9.0 9.5 9.7 10.0 Debt / Equity (x) 0.2 0.3 0.3 0.3
Other Income 15.1 20.6 29.4 46.8 Current Ratio (x) 1.5 1.5 1.4 1.4
Exceptional items 0.0 0.0 0.0 0.0 ROE (%) 11.4 13.7 16.2 18.9
PBDIT 145.1 179.2 217.4 255.3 ROCE (%) 7.7 8.5 9.2 10.1
Depreciation 8.6 10.2 10.4 10.6 Dividend Yield (%) 1.1 1.1 1.1 1.1
Interest & Finance Charges 25.5 29.9 37.4 42.4 Valuation Ratio (x)
PBT 111.1 139.1 169.6 202.3 P/E 20.1 16.3 13.4 11.2
Tax Provisions 37.9 48.7 59.4 70.8 P/BV 2.3 2.2 2.2 2.1
Reported PAT 73.1 90.4 110.2 131.5 EV/Sales 0.9 0.8 0.7 0.6
PAT Margin (%) 5.1 5.4 16.7 6.3 EV/EBIDTA 10.3 8.4 7.1 6.4
Efficiency Ratio (x)
Manpower cost / Sales (%) 12.6 12.7 12.6 12.6 Inventory (days) 22.0 30.0 30.0 30.0
RM cost / Sales (%) 57.3 56.8 56.6 60.2 Debtors (days) 276.3 276.3 276.3 276.3
Tax Rate (%) 34.1 35.0 35.0 35.0 Creditors (days) 166.3 166.3 166.3 166.3
Balance Sheet Cash Flow statement
Share Capital 5.3 5.3 5.3 5.3 Profit After Tax 111.1 139.1 169.6 202.3
Reserves & Surplus 636.6 655.1 673.5 692.0 Depreciation 8.6 10.2 10.4 10.6
Minority Interest & Others 0.0 0.0 0.0 0.0 Working Capital Changes -163.6 -119.1 -117.5 -84.7
Total Loans 124.8 174.8 199.8 224.8 Others -48.5 -21.9 -25.0 -31.4
Deferred Tax Iiability 1107.0 1278.1 1476.4 1595.3 Operating Cash Flow -92.4 8.4 37.5 96.7
Total Liabilities 1873.8 2113.3 2355.0 2517.3 Capital Expenditure -22.6 -10.0 -10.0 -10.0
Goodwill 0.0 0.0 0.0 0.0 Change in Investment 93.5 0.0 0.0 0.0
Gross Block 106.8 116.8 126.8 136.8 Cash Flow from Investing 70.9 -10.0 -10.0 -10.0
Less: Acc. Depreciation 56.1 66.3 76.7 87.3 Proceeds from equity issue 1.3 0.0 0.0 0.0
Net Block 50.7 50.5 50.1 49.5 Inc/ Dec in Debt 82.1 50.0 25.0 25.0
Capital Work in Progress 18.0 18.0 18.0 18.0 Dividend and DDT -11.1 -48.3 -55.8 -60.8
Investments 3.6 3.6 3.6 3.6 Cash Flow from Financing 72.3 1.7 -30.8 -35.8
Net Current Assets 1801.5 2041.1 2283.2 2446.1 Net Change in Cash 50.8 0.1 -3.3 50.9
Deferred Tax Assets 0.0 0.0 0.0 0.0 Opening Cash Balance 213.0 265.1 266.7 265.0
Total Assets 1873.8 2113.3 2355.0 2517.3 Closing Cash Balance 265.1 266.7 265.0 317.4
Ventura Securities Limited Corporate Office: C-112/116, Bldg No. 1, Kailash Industrial Complex, Park Site, Vikhroli (W), Mumbai – 400079 This report is neither an offer nor a solicitation to purchase or sell securities. The information and views expressed herein are believed to be reliable, but no responsibility (or liability) is accepted for errors of fact or opinion. Writers and contributors may be trading in or have positions in the securities mentioned in their articles. Neither Ventura Securities Limited nor any of the contributors accepts any liability arising out of the above information/articles. Reproduction in whole or in part without written permission is prohibited. This report is for private circulation.
- 22 of 23 - Tuesday 1st January, 2013
This document is for private circulation, and must be read in conjunction with the disclaimer on the last page.
Annexure
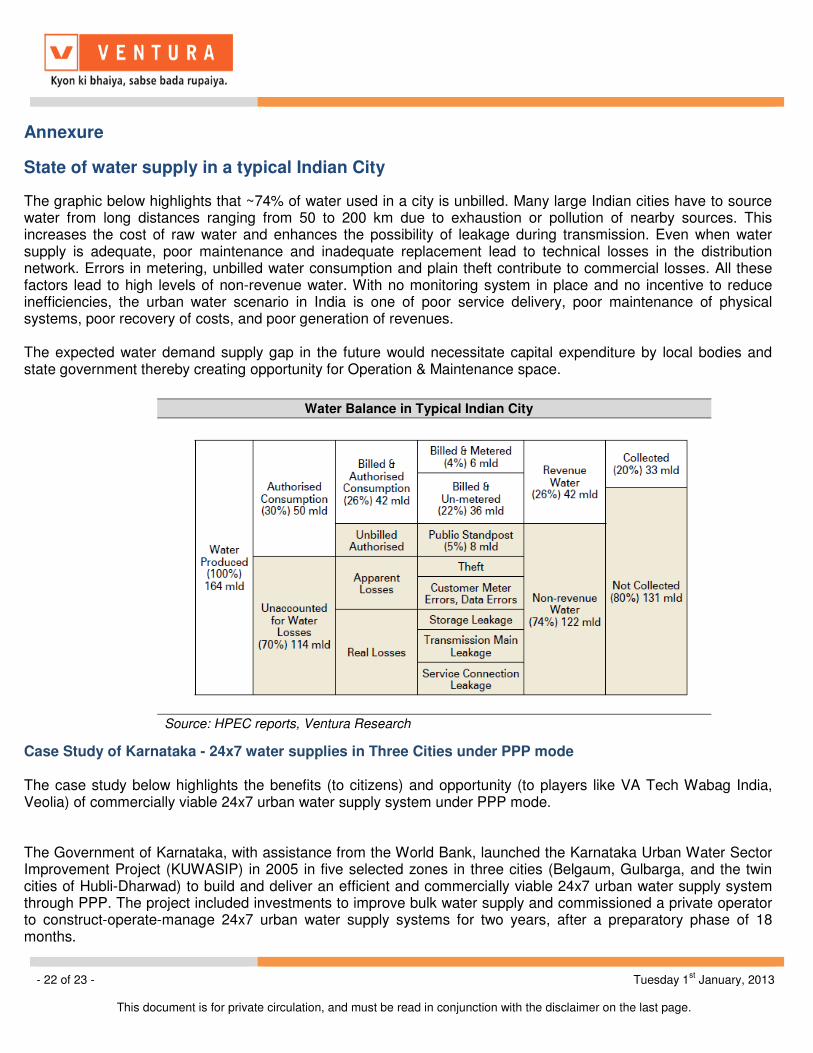
State of water supply in a typical Indian City
The graphic below highlights that ~74% of water used in a city is unbilled. Many large Indian cities have to source water from long distances ranging from 50 to 200 km due to exhaustion or pollution of nearby sources. This increases the cost of raw water and enhances the possibility of leakage during transmission. Even when water supply is adequate, poor maintenance and inadequate replacement lead to technical losses in the distribution network. Errors in metering, unbilled water consumption and plain theft contribute to commercial losses. All these factors lead to high levels of non-revenue water. With no monitoring system in place and no incentive to reduce inefficiencies, the urban water scenario in India is one of poor service delivery, poor maintenance of physical systems, poor recovery of costs, and poor generation of revenues. The expected water demand supply gap in the future would necessitate capital expenditure by local bodies and state government thereby creating opportunity for Operation & Maintenance space.
Case Study of Karnataka - 24x7 water supplies in Three Cities under PPP mode The case study below highlights the benefits (to citizens) and opportunity (to players like VA Tech Wabag India, Veolia) of commercially viable 24x7 urban water supply system under PPP mode. The Government of Karnataka, with assistance from the World Bank, launched the Karnataka Urban Water Sector Improvement Project (KUWASIP) in 2005 in five selected zones in three cities (Belgaum, Gulbarga, and the twin cities of Hubli-Dharwad) to build and deliver an efficient and commercially viable 24x7 urban water supply system through PPP. The project included investments to improve bulk water supply and commissioned a private operator to construct-operate-manage 24x7 urban water supply systems for two years, after a preparatory phase of 18 months.
Water Balance in Typical Indian City
Source: HPEC reports, Ventura Research
- 23 of 23 - Tuesday 1st January, 2013
This document is for private circulation, and must be read in conjunction with the disclaimer on the last page.
The contract was awarded to a joint venture of Compagnie Generale Des Eaux (CGE) and Veolia. The management fee of `22 crore to the private operator had a fixed component of 60%, while the remaining 40% was linked to performance. The contract also included a maximum bonus of `5.6 crore and a penalty of up to 10% in case of failure to meet the performance targets. The investment was made by the Karnataka Urban Water Supply and Drainage Board (KUWSDB) and the private operator was responsible for installation of meters, tariff collection, etc. The tariff structure was rationalised by introducing variable rates based on consumption. Significant reforms were carried out in public sector institutions such as the KUWSDB, and the Karnataka Urban Infrastructure Development and Finance Corporation. The standards of delivery were established by these institutions including pricing of services to cover the O&M cost and holding the private party accountable through the performance management contract. A proactive communications strategy involving all stakeholders at local level was rolled out to seek buy-in for the project. Losses were reduced from 50% to 7% due to improvements in the transmission and distribution network, and improved metering. Over 25,000 households now receive 24x7 water supplies. In August 2009 the project was conferred the first prize in the PPP category of the National Urban Water Awards of the Ministry of Urban Development, Government of India.