reed act study - employment and training administration
TRANSCRIPT
UNEMPLOYMENT INSURANCE: ASSESSMENT OF
THE IMPACT OF THE 2002 REED ACT DISTRIBUTION
Final Report
Qualitative and Quantitative Analysis
Washington, D.C. December 2004
This project has been funded, either wholly or in part, with Federal funds from the U.S. Department of Labor, Employment and Training Administration. The contents of this publication do not necessarily reflect the views or policies of the Department of Labor, nor does mention of trade names, commercial products, or organizations imply en-dorsement of same by the U.S. Government.

Assessment of the Impact of the 2002 Reed Act Distribution
ii
(This page intentionally left blank)
Assessment of the Impact of the 2002 Reed Act Distribution
iii
TABLE OF CONTENTS
RESEARCH PREFACE.................................................................................................. 7
RESEARCH TEAM PREFACE............................................................................................. 8 ACKNOWLEDGEMENTS .................................................................................................... 8
EXECUTIVE SUMMARY .............................................................................................. 11
EXECUTIVE SUMMARY................................................................................................... 12
SECTION I BACKGROUND................................................................................... 17
1.1 HISTORY OF THE REED ACT ............................................................................ 18 1.1.1 Before the Reed Act ......................................................................................18 1.1.2 The Reed Act.................................................................................................19 1.1.3 Reed Act Distributions ...................................................................................20
1.2 THE SOURCE OF THE 2002 SPECIAL REED ACT DISTRIBUTION........................... 23 1.2.1 Purpose of the Act .........................................................................................23 1.2.2 Genesis of the Reed Act................................................................................23
1.3 POSSIBLE STATE USE OF REED ACT FUNDS..................................................... 24 1.3.1 Using Reed Act Funds to Improve Solvency and Lower Taxes .................... 24 1.3.2 Using Reed Act Funds for Benefits ...............................................................24 1.3.3 Using Reed Act Funds for Administrative Purposes...................................... 25 1.3.4 Acquiring Real Property with Reed Act Funds ..............................................26 1.3.5 Suggested Uses of Reed Act Distributions for Administrative Purposes....... 27
1.4 FUNDING OF THIS RESEARCH EFFORT ............................................................. 28 1.5 STRUCTURE OF THIS REPORT ......................................................................... 28
SECTION II RESEARCH FINDINGS....................................................................... 29
2.1 OVERVIEW..................................................................................................... 30 2.2 SUMMARY OF KEY RESEARCH FINDINGS .......................................................... 31
2.2.1 Summary of the Qualitative Study .................................................................33 2.2.2 Summary of the Quantitative Study...............................................................33
2.3 REED ACT DISTRIBUTIONS’ IMPACT.................................................................. 35 2.3.1 Immediate fiscal impact of the distribution.....................................................35 2.3.2 Short- to intermediate-term impact of the distribution....................................38 2.3.3 The long-term impact of the distribution ........................................................39
SECTION III QUALITATIVE ANALYSIS .................................................................. 41
3.1 OVERVIEW OF QUALITATIVE ANALYSIS ............................................................. 42 3.2 PROCESS FOR SELECTING STATES AS CASE STUDIES....................................... 43
3.2.1 State Selection Criteria..................................................................................43
Assessment of the Impact of the 2002 Reed Act Distribution
iv
3.2.2 Case Study Approach....................................................................................45 3.3 THEMES AND OBSERVATIONS FROM THE STATE INTERVIEWS ............................. 47
3.3.1 Introduction....................................................................................................47 3.3.2 Summary characteristics of the states...........................................................47 3.3 3 Individual states' experiences........................................................................48
3.4 SPECIFIC QUESTIONS OF INTEREST ................................................................. 52 3.5 CONCLUSIONS OF THE QUALITATIVE STUDY...................................................... 54 3.6 COMPLETE STATE INTERVIEWS........................................................................ 56
3.6.1 Iowa ...............................................................................................................57 3.6.2 Louisiana .......................................................................................................60 3.6.3 Michigan ........................................................................................................64 3.6.4 Minnesota ......................................................................................................67 3.6.5 Montana.........................................................................................................69 3.6.6 New Jersey....................................................................................................73 3.6.7 Ohio ...............................................................................................................76 3.6.8 Virginia...........................................................................................................80 3.6.9 Washington....................................................................................................83
SECTION IV QUANTITATIVE ANALYSIS................................................................ 89
4.1 INTRODUCTION TO QUANTITATIVE ANALYSIS ..................................................... 90 4.1.1 Background and Purpose ..............................................................................90 4.1.2 Quantitative Analysis Approach.....................................................................90 4.1.3 Data limitations and other challenges............................................................91 4.1.4 Definitions of terms used in the quantitative analysis....................................92
4.2 TRENDS OF EMPLOYMENT RELATED VARIABLES FOR SELECT STATES ................ 93 4.2.1 Trends in Trust Fund Balances .....................................................................95
4.3. TRUST FUND MEASURES AND DESCRIPTIVE STATISTICS.................................... 99 4.3.1 Introduction....................................................................................................99 4.3.2 Summary of Trust Fund Measures and the Average High Cost Multiple .... 101 4.3.3 Detail of Trust Fund Measures and the Average High Cost Multiple........... 102 4.3.4 Analysis of NASWA Surveys on states' use of Reed Act funds .................. 106
4.4 SPECIFIC HYPOTHESES ABOUT USE OF REED ACT FUNDS ............................... 108 4.4.1 Introduction..................................................................................................108 4.4.2 Testing process ...........................................................................................109 4.4.3 Summary Results of Hypothesis Testing.....................................................110 4.4.4 Results of Testing Hypothesis 1 ..................................................................112 4.4.5 Results of Testing Hypothesis 2 ..................................................................115 4.4.6 Results of Testing Hypothesis 3 ..................................................................118 4.4.7 Results of Testing Hypothesis 4 ..................................................................120 4.4.8 Results of Testing Hypothesis 5 ..................................................................122 4.4.9 Results of Testing Hypothesis 6 ..................................................................126
4.5 CONCLUSIONS OF THE QUANTITATIVE STUDY ................................................. 126
SECTION V LIST OF FIGURES ............................................................................ 129
SECTION VI BIBLIOGRAPHY................................................................................ 133
Assessment of the Impact of the 2002 Reed Act Distribution
v
6.1 GOVERNMENT REPORTS............................................................................... 134 6.2 NASWA SOURCES ...................................................................................... 134 6.3 GOVERNMENT SOURCES............................................................................... 134
United States Congress.....................................................................................................134 Other U.S. Department of Labor References ....................................................................136 Other Government Sources...............................................................................................136
6.4 OTHER NON-GOVERNMENT SOURCES ........................................................... 136
SECTION VII ATTACHMENTS................................................................................ 137
ATTACHMENT A – PROCESS FOR CONDUCTING STATISTICAL ANALYSIS .......................... 138 ATTACHMENT B – NASWA SURVEYS .......................................................................... 140
B.1 Winter 2004 Survey .....................................................................................140 B.2 Fall 2003 Survey..........................................................................................150
ATTACHMENT C – ADDITIONAL DETAILS OF HYPOTHESIS TESTING.................................. 160 ATTACHMENT D – QUALITATIVE STUDY INTERVIEW GUIDE ............................................. 168 ATTACHMENT E – TRENDS IN AWBA FOR SELECTED STATES 1999.1 TO 2003.2 ............ 171
Assessment of the Impact of the 2002 Reed Act Distribution
Center for Employment Security Education and Research 6
(This page intentionally left blank)
Assessment of the Impact of the 2002 Reed Act Distribution
Center for Employment Security Education and Research 7
RESEARCH PREFACE
Assessment of the Impact of the 2002 Reed Act Distribution
Center for Employment Security Education and Research 8
RESEARCH TEAM PREFACE The “Reed Act” was once an obscure provision of the Social Security Act that had been activated only a few times since the 1950s. It provides for a distribution of federal un-employment tax funds to state unemployment insurance (UI) and employment service programs when the federal government has collected excess federal unemployment tax revenue. Because of a booming economy in the late 1990s and a substantial flow of federal unemployment taxes into the unemployment trust fund, the Secretary of Labor projected a Reed Act distribution of over $4 billion on October 1, 2002. This projection, the recession of late 2000 and early 2001, high unemployment, and a desire to stimu-late the economy led to the enactment of the “Job Creation and Worker Assistance Act,” which President Bush signed into law on March 9, 2002. This Act contained a “Special” $8 billion Reed Act distribution to states. The purpose of the study is to provide an overview of past Reed Act distributions and identify how states chose to approach the current Reed Act distribution. Because the $8 billion Reed Act distribution was enacted in an economic stimulus package, policy makers expected it to stimulate the economy. It could accomplish this through cuts in state unemployment taxes or increases in state spending on benefits, UI administration, and employment services. This study finds the $8 billion Reed Act distribution stimu-lated the economy primarily through about $4 billion in lower unemployment taxes in 2003 and 2004, but also led to some stimulating increases in spending on unemploy-ment benefits, UI administration and employment services, which could continue for some years. This study was conducted under a grant from the U.S. Department of Labor (USDOL) by the Center for Employment Security Education and Research (CESER), an affiliate of the National Association of State Workforce Agencies (NASWA. Richard A. Hobbie, Ph.D. Executive Director, NASWA December 20, 2004
ACKNOWLEDGEMENTS The Center for Employment Security Education and Research (CESER) thanks the U.S. Department of Labor (USDOL) for supporting this study. Throughout this research ef-fort, CESER received support and comments from David Balducchi, Stephen Wandner, and Allison Vitalo of the Employment and Training Administration (ETA). In addition, valuable input was provided occasionally and on the final report by Stephanie Cabell, Anthony Dais, Lissette Gean, Gay Gilbert, James Herbert, Jerry Hildebrand, Michael Miller, Lynne Webb, and Ronald Wilus.
Assessment of the Impact of the 2002 Reed Act Distribution
Center for Employment Security Education and Research 9
CESER thanks the National Association of State Workforce Agencies (NASWA) and the numerous employees of member states who provided information on how states were using Reed Act funds. Without their support, cooperation, and input through surveys conducted by NASWA for its members, this study could not have been conducted by CESER. CESER also thanks Andri Haraldsson of Decern Consulting and Anik Mehta of Booz Allen Hamilton for hard and tenacious work that resulted in the most comprehensive study of the Reed Act ever attempted or completed. Through this work, this study will be the reference source on the Reed Act for many years to come. This study was managed by Richard A. Hobbie, Curt Harris, and Brian Langley of CESER/NASWA. Any errors or omissions remaining are solely the responsibility of CESER and the authors.
Assessment of the Impact of the 2002 Reed Act Distribution
Center for Employment Security Education and Research 10
(This page intentionally left blank)
Assessment of the Impact of the 2002 Reed Act Distribution
Center for Employment Security Education and Research 11
EXECUTIVE SUMMARY
Assessment of the Impact of the 2002 Reed Act Distribution
Center for Employment Security Education and Research 12
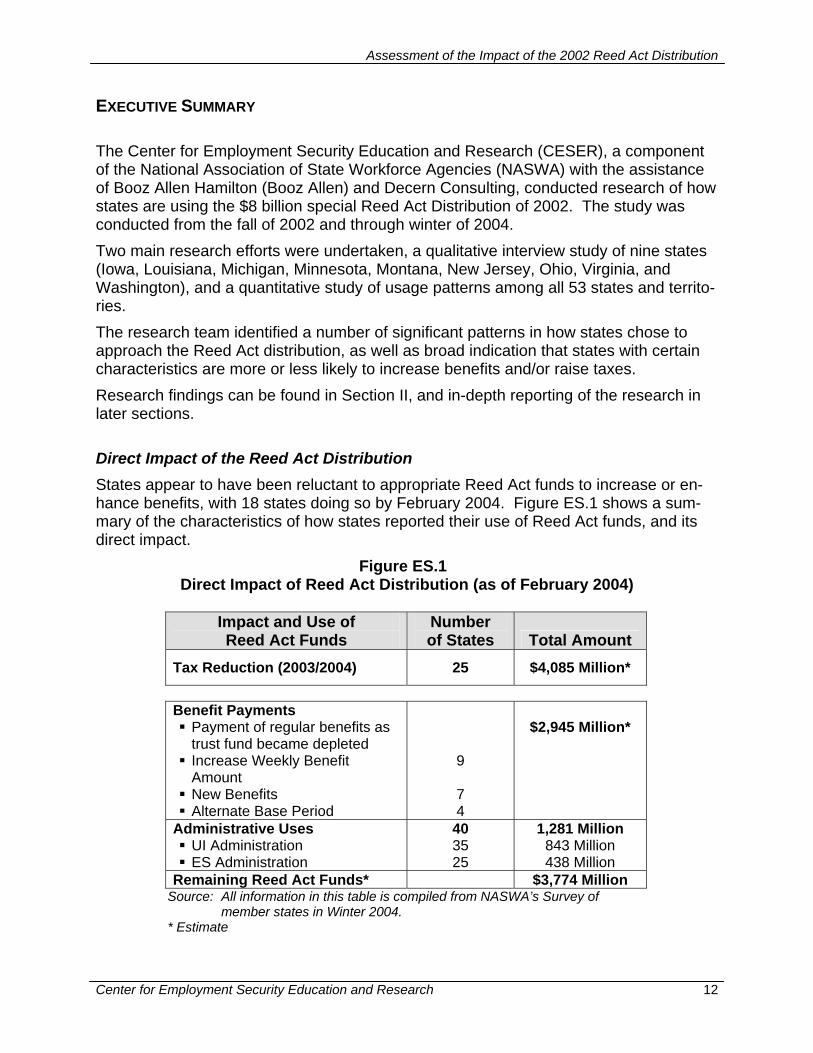
EXECUTIVE SUMMARY The Center for Employment Security Education and Research (CESER), a component of the National Association of State Workforce Agencies (NASWA) with the assistance of Booz Allen Hamilton (Booz Allen) and Decern Consulting, conducted research of how states are using the $8 billion special Reed Act Distribution of 2002. The study was conducted from the fall of 2002 and through winter of 2004. Two main research efforts were undertaken, a qualitative interview study of nine states (Iowa, Louisiana, Michigan, Minnesota, Montana, New Jersey, Ohio, Virginia, and Washington), and a quantitative study of usage patterns among all 53 states and territo-ries. The research team identified a number of significant patterns in how states chose to approach the Reed Act distribution, as well as broad indication that states with certain characteristics are more or less likely to increase benefits and/or raise taxes. Research findings can be found in Section II, and in-depth reporting of the research in later sections. Direct Impact of the Reed Act Distribution States appear to have been reluctant to appropriate Reed Act funds to increase or en-hance benefits, with 18 states doing so by February 2004. Figure ES.1 shows a sum-mary of the characteristics of how states reported their use of Reed Act funds, and its direct impact.
Figure ES.1 Direct Impact of Reed Act Distribution (as of February 2004)
Impact and Use of Reed Act Funds
Number of States Total Amount
Tax Reduction (2003/2004) 25 $4,085 Million*
Benefit Payments Payment of regular benefits as trust fund became depleted
Increase Weekly Benefit Amount
New Benefits Alternate Base Period
9
7 4
$2,945 Million*
Administrative Uses UI Administration ES Administration
40 35 25
1,281 Million 843 Million 438 Million
Remaining Reed Act Funds* $3,774 Million Source: All information in this table is compiled from NASWA’s Survey of
member states in Winter 2004. * Estimate
Assessment of the Impact of the 2002 Reed Act Distribution
Center for Employment Security Education and Research 13
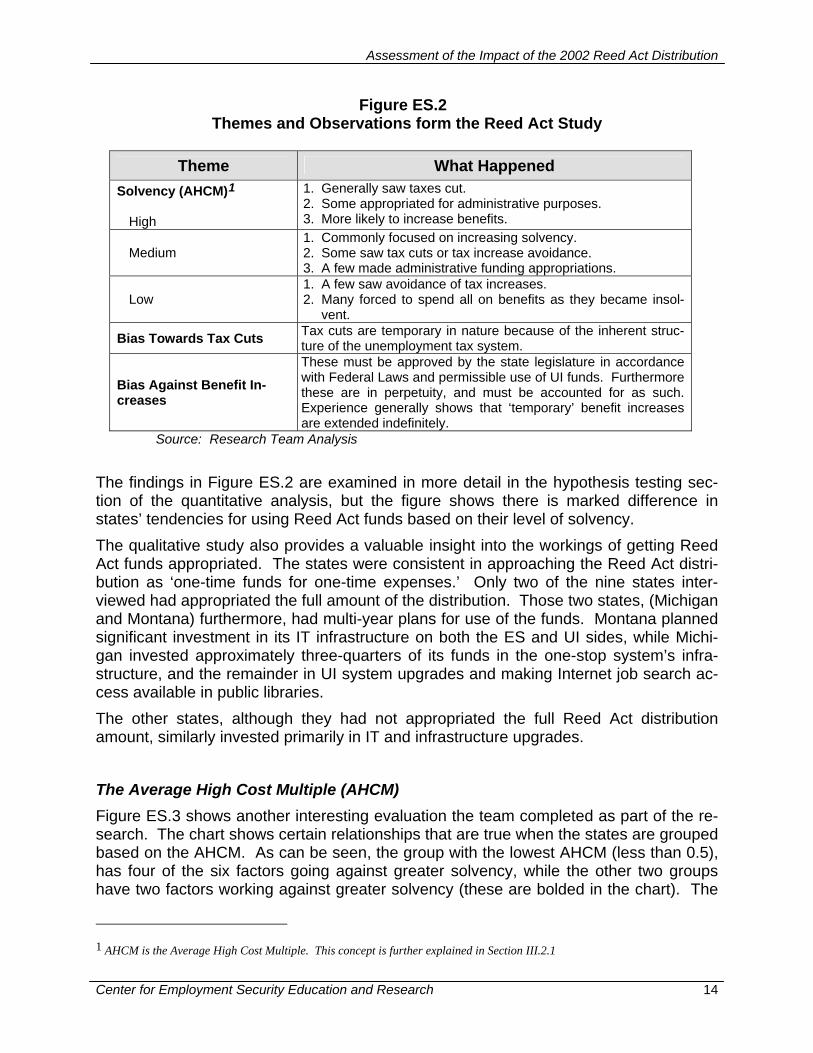
The total economic stimulus that can be attributed to the Reed Act distribution (as of February 2004), comprises the tax reduction, the expenses on administrative uses, and those new or increased benefits that resulted from the Distribution. The research indi-cates that it may range from a low equivalent to the amount of the tax reductions in 2003 and 2004, approximately $4.1 billion, to a high of over $8 billion dollars. The higher amount would indicate that states nearing or at Trust Fund insolvency would not have paid out regular benefits, or increased taxes to pay for those benefits, unless they had received the Reed Act distribution, and that all of the states’ authorized administra-tive expenses had already been incurred. Figure ES.1, shows the result of the stimulus impact of both the reduction in unemployment tax rates in the states and additional ex-penditures. It should be noted, however, that although the states have reported these amounts as potential economic stimulus, these combined amounts are an upper bound of the actual economic stimulus that would have been felt in the states. This is necessarily so as the actual expended (spent) amount always lags the amount obligated (authorized for use) by the state legislature. Thus a significant proportion of the roughly $1.3 billion desig-nated for ‘Administrative Uses’ probably has not yet been spent. For example, a multi-million dollar acquisition of IT systems takes time to prepare and execute. Furthermore, even once a contractor has been selected and starts work, the total amount of the work is usually not paid up-front at start of the work. Similarly, the estimates for ‘Benefit Payments’ are estimates of the cost of changes in the benefits, and they include both benefit increases and benefits paid from the Reed Act distribution funds in states that otherwise would have been in a shortfall situation (or who were forced to borrow funds after spending the Reed Act distribution). Thus, al-though there has been a significant economic stimulus from the Reed Act as of Febru-ary 2004, it should be cautioned that the total stimulating effect will not be felt until the remainder of the Reed Act distribution is spent. Themes and Observations Broadly, it can be observed, as Figure ES.2 shows that state solvency was highly corre-lated with certain behaviors. Furthermore, the evidence, so far, is that the Reed Act has contributed much of its economic stimulus through UI tax decreases in 2003 and 2004.
Assessment of the Impact of the 2002 Reed Act Distribution
Center for Employment Security Education and Research 14
Figure ES.2 Themes and Observations form the Reed Act Study
Theme What Happened
Solvency (AHCM)1
High
1. Generally saw taxes cut. 2. Some appropriated for administrative purposes. 3. More likely to increase benefits.
Medium 1. Commonly focused on increasing solvency. 2. Some saw tax cuts or tax increase avoidance. 3. A few made administrative funding appropriations.
Low 1. A few saw avoidance of tax increases. 2. Many forced to spend all on benefits as they became insol-
vent.
Bias Towards Tax Cuts Tax cuts are temporary in nature because of the inherent struc-ture of the unemployment tax system.
Bias Against Benefit In-creases
These must be approved by the state legislature in accordance with Federal Laws and permissible use of UI funds. Furthermore these are in perpetuity, and must be accounted for as such. Experience generally shows that ‘temporary’ benefit increases are extended indefinitely.
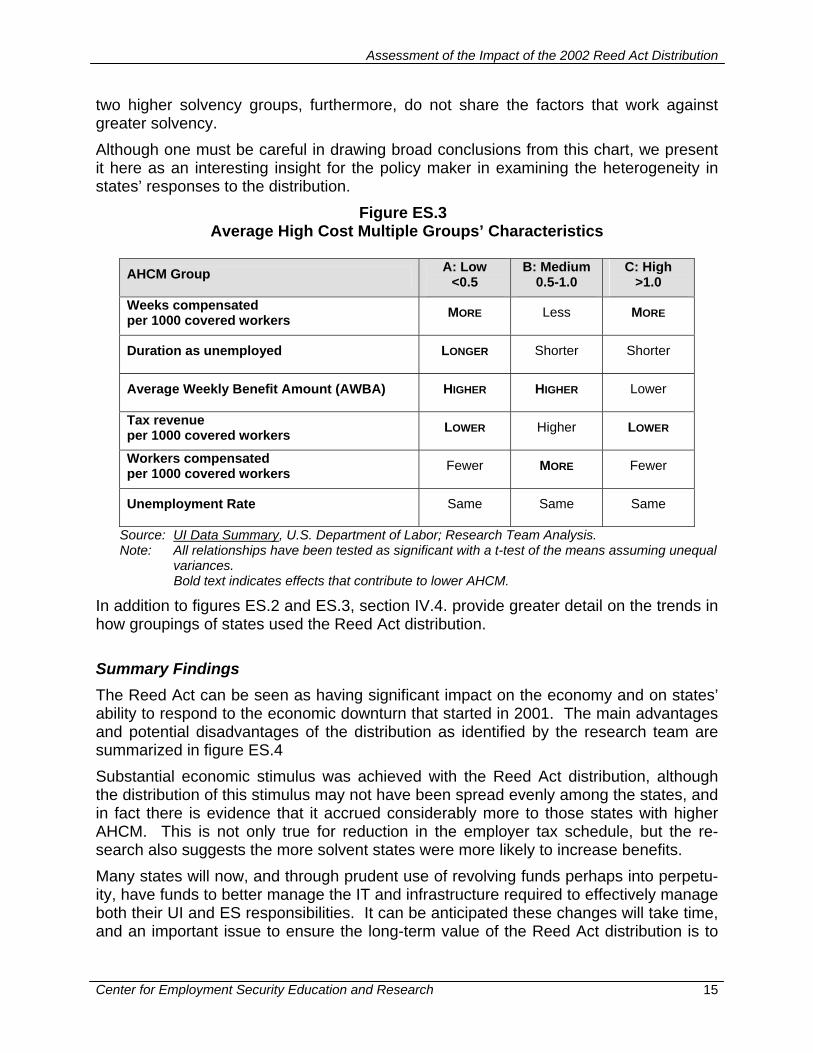
Source: Research Team Analysis The findings in Figure ES.2 are examined in more detail in the hypothesis testing sec-tion of the quantitative analysis, but the figure shows there is marked difference in states’ tendencies for using Reed Act funds based on their level of solvency. The qualitative study also provides a valuable insight into the workings of getting Reed Act funds appropriated. The states were consistent in approaching the Reed Act distri-bution as ‘one-time funds for one-time expenses.’ Only two of the nine states inter-viewed had appropriated the full amount of the distribution. Those two states, (Michigan and Montana) furthermore, had multi-year plans for use of the funds. Montana planned significant investment in its IT infrastructure on both the ES and UI sides, while Michi-gan invested approximately three-quarters of its funds in the one-stop system’s infra-structure, and the remainder in UI system upgrades and making Internet job search ac-cess available in public libraries. The other states, although they had not appropriated the full Reed Act distribution amount, similarly invested primarily in IT and infrastructure upgrades. The Average High Cost Multiple (AHCM) Figure ES.3 shows another interesting evaluation the team completed as part of the re-search. The chart shows certain relationships that are true when the states are grouped based on the AHCM. As can be seen, the group with the lowest AHCM (less than 0.5), has four of the six factors going against greater solvency, while the other two groups have two factors working against greater solvency (these are bolded in the chart). The
1 AHCM is the Average High Cost Multiple. This concept is further explained in Section III.2.1
Assessment of the Impact of the 2002 Reed Act Distribution
Center for Employment Security Education and Research 15
two higher solvency groups, furthermore, do not share the factors that work against greater solvency. Although one must be careful in drawing broad conclusions from this chart, we present it here as an interesting insight for the policy maker in examining the heterogeneity in states’ responses to the distribution.
Figure ES.3 Average High Cost Multiple Groups’ Characteristics
Source: UI Data Summary, U.S. Department of Labor; Research Team Analysis. Note: All relationships have been tested as significant with a t-test of the means assuming unequal
variances. Bold text indicates effects that contribute to lower AHCM.
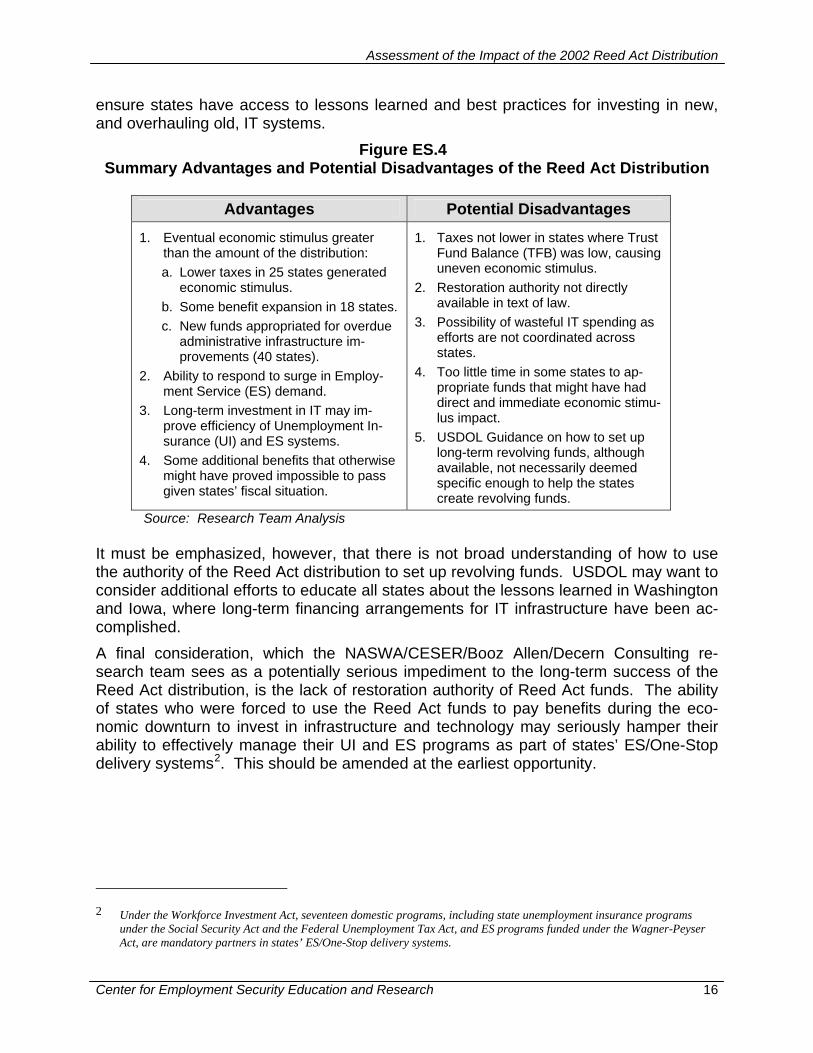
In addition to figures ES.2 and ES.3, section IV.4. provide greater detail on the trends in how groupings of states used the Reed Act distribution. Summary Findings The Reed Act can be seen as having significant impact on the economy and on states’ ability to respond to the economic downturn that started in 2001. The main advantages and potential disadvantages of the distribution as identified by the research team are summarized in figure ES.4 Substantial economic stimulus was achieved with the Reed Act distribution, although the distribution of this stimulus may not have been spread evenly among the states, and in fact there is evidence that it accrued considerably more to those states with higher AHCM. This is not only true for reduction in the employer tax schedule, but the re-search also suggests the more solvent states were more likely to increase benefits. Many states will now, and through prudent use of revolving funds perhaps into perpetu-ity, have funds to better manage the IT and infrastructure required to effectively manage both their UI and ES responsibilities. It can be anticipated these changes will take time, and an important issue to ensure the long-term value of the Reed Act distribution is to
AHCM Group A: Low <0.5
B: Medium 0.5-1.0
C: High >1.0
Weeks compensated per 1000 covered workers MORE Less MORE
Duration as unemployed LONGER Shorter Shorter
Average Weekly Benefit Amount (AWBA) HIGHER HIGHER Lower
Tax revenue per 1000 covered workers LOWER Higher LOWER
Workers compensated per 1000 covered workers Fewer MORE Fewer
Unemployment Rate Same Same Same
Assessment of the Impact of the 2002 Reed Act Distribution
Center for Employment Security Education and Research 16
ensure states have access to lessons learned and best practices for investing in new, and overhauling old, IT systems.
Figure ES.4 Summary Advantages and Potential Disadvantages of the Reed Act Distribution
Advantages Potential Disadvantages
1. Eventual economic stimulus greater than the amount of the distribution: a. Lower taxes in 25 states generated
economic stimulus. b. Some benefit expansion in 18 states. c. New funds appropriated for overdue
administrative infrastructure im-provements (40 states).
2. Ability to respond to surge in Employ-ment Service (ES) demand.
3. Long-term investment in IT may im-prove efficiency of Unemployment In-surance (UI) and ES systems.
4. Some additional benefits that otherwise might have proved impossible to pass given states’ fiscal situation.
1. Taxes not lower in states where Trust Fund Balance (TFB) was low, causing uneven economic stimulus.
2. Restoration authority not directly available in text of law.
3. Possibility of wasteful IT spending as efforts are not coordinated across states.
4. Too little time in some states to ap-propriate funds that might have had direct and immediate economic stimu-lus impact.
5. USDOL Guidance on how to set up long-term revolving funds, although available, not necessarily deemed specific enough to help the states create revolving funds.
Source: Research Team Analysis It must be emphasized, however, that there is not broad understanding of how to use the authority of the Reed Act distribution to set up revolving funds. USDOL may want to consider additional efforts to educate all states about the lessons learned in Washington and Iowa, where long-term financing arrangements for IT infrastructure have been ac-complished. A final consideration, which the NASWA/CESER/Booz Allen/Decern Consulting re-search team sees as a potentially serious impediment to the long-term success of the Reed Act distribution, is the lack of restoration authority of Reed Act funds. The ability of states who were forced to use the Reed Act funds to pay benefits during the eco-nomic downturn to invest in infrastructure and technology may seriously hamper their ability to effectively manage their UI and ES programs as part of states’ ES/One-Stop delivery systems2. This should be amended at the earliest opportunity.
2 Under the Workforce Investment Act, seventeen domestic programs, including state unemployment insurance programs
under the Social Security Act and the Federal Unemployment Tax Act, and ES programs funded under the Wagner-Peyser Act, are mandatory partners in states’ ES/One-Stop delivery systems.
Assessment of the Impact of the 2002 Reed Act Distribution
Center for Employment Security Education and Research 17
SECTION I BACKGROUND
Assessment of the Impact of the 2002 Reed Act Distribution
Center for Employment Security Education and Research 18
1.1 HISTORY OF THE REED ACT3 The term “Reed Act” refers to a part of the Employment Security Administrative Financ-ing Act of 1954. This legislation amended Titles IX and XII of the Social Security Act (SSA) and established the basic structure of the Unemployment Trust Fund (UTF). The amendments to Title IX provided for the transfer of excess funds in the Employment Se-curity Administration Account in the UTF to the individual state accounts in the UTF. These transferred funds are commonly referred to as “Reed Act” funds. Under the SSA, the primary purpose of the Reed Act funds is the payment of “cash benefits to individuals with respect to their unemployment, exclusive of expenses of administration” (Section 903 (c) (1), SSA). However, subject to conditions specified in Section 903 (c) (2), SSA, a State is permitted, at its discretion, to use Reed Act funds for the “administration of its unemployment compensation law and public employment offices.” In addition, the US Department of Labor (USDOL) has suggested certain ad-ministrative uses for Reed Act funds such as improving Unemployment Insurance (UI) claims filing and payment methods, reducing UI fraud and abuse, etc. Until recently the Reed Act authority had only been activated in the late 1950s. As the federal government approached a balanced budget in the late 1990s, Reed Act distribu-tions occurred in five consecutive years beginning in fiscal year 1998 with a $16 million distribution and culminating in the $8 billion distribution in March 2002. The following sections provide a brief history of the Reed Act.
1.1.1 Before the Reed Act The Social Security Act not only established old-age pensions, but it also created a framework for a federal-state unemployment insurance system. The federal govern-ment provided an umbrella under which states would enact their own federally-approved state UI programs. States would impose unemployment taxes on employer wages paid to employees in their states and these taxes, plus accumulated interest credited to state accounts in the UTF, would finance benefits under the state UI program. States would be required to deposit their unemployment taxes into their respective state accounts of the federal unemployment trust fund. The federal government would pay interest on state balances. States would withdraw funds to cover the cost of benefits for eligible unemployed workers. Title IX of the Social Security Act originally imposed a payroll tax on covered employers and generally provided for the funding of the federal-state UI system. States enacted their own employer taxes within the federal framework and employers received a credit against the federal tax for paying the state unemployment tax. By 1937 all states had enacted federally approved UI laws and by 1939 all states were paying UI benefits. In
3 A more detailed version of this historical background can be found in “The $8 Billion Reed Act Distribution in March 2002:
How Have States Used the Funds?” by Richard A. Hobbie Executive Director of NASWA, and Curt Harris, Congressional and Intergovernmental Affairs Director of NASWA.
Assessment of the Impact of the 2002 Reed Act Distribution
Center for Employment Security Education and Research 19
1939, the tax provisions of Title IX of the Social Security Act were moved to the Internal Revenue Code under the Federal Unemployment Tax Act (FUTA). Title III of the Social Security Act provides for federal grants to states to administer the UI system in a “proper and efficient manner” and for the provision of public employment services. With the end of World War II approaching, it became apparent that states might run out of funds in their state accounts to pay benefits if unemployment rose substantially with the return of military personnel. Congress responded to the post-war risk of high unem-ployment by creating the “George Loan Fund” in the War Mobilization Act of 1944 (Haber and Murray, 1966, pp. 385-386). This fund was named after Senator George of Georgia, Chairman of the Committee on Finance. The fund was intended to ensure UI benefits were paid even if a state temporarily ran out of funds in its account in the UTF. Because the economy was able to absorb returning service personnel after the War, the George Loan Fund was not used and Congress allowed its authority to expire on March 31, 1952. 1.1.2 The Reed Act In response to a recession, high unemployment, and high UI costs, Congress passed the Employment Security Administrative Financing Act of 1954. This Act is known as the “Reed Act” because its sponsor was Congressman Reed of New York, Chairman of the House Committee on Ways and Means. (Haber and Murray, 1966, pp. 388-390) The Reed Act earmarked excess FUTA funds to the UTF, automatically appropriated these funds to the UTF, and provided a mechanism to send surplus FUTA balances back to states in proportion to the covered wages paid in each state. Previously, these funds were deposited in the general fund and used for any federal purposes. The Act also created the Employment Security Administrative Account (ESAA) and the Federal Un-employment Account (FUA), and established ceilings on the balances in these ac-counts. The Act also limited state use of funds in excess of the ceilings, or “Reed Act funds,” to the payment of UI benefits, administrative expenditures for UI and the public employment service (ES), and certain real property purchases for UI and ES. Title IX of the Social Security Act requires the Secretary of Labor to recommend “appro-priate action” whenever the Secretary believes a Reed Act distribution will happen in the next fiscal year. A Reed Act distribution will occur if the following conditions exist in the federal accounts of the Unemployment Trust Fund (UTF):
• The balances in the Extended Unemployment Compensation Account (EUCA) and the Federal Unemployment Account (FUA) have reached their statutory ceil-ings and all general revenue advances and related interest have been repaid;
• An amount in excess of the statutory ceiling remains in the Employment Security Administration Account.
If such conditions exist, the excess amount or “Reed Act distribution” is transferred to the state accounts in the UTF at the beginning of the following fiscal year.
Assessment of the Impact of the 2002 Reed Act Distribution
Center for Employment Security Education and Research 20
The share of a Reed Act distribution that each state account receives is equal to the product of the aggregate Reed Act distribution and the proportion of total wages cov-ered by the Federal Unemployment Tax Act (FUTA) attributable to each state during the prior calendar year. The term “state” includes the fifty states and the District of Colum-bia, Puerto Rico, and the Virgin Islands. An exception to this formula occurred under the Taxpayer Relief Act of 1997 when $100 million in each of fiscal years 2000, 2001, and 2002 was distributed to states based on each state’s share of the base allocation made to states in each of these years to fund proper and efficient administration of their UI programs. Reed Act distributions may not be credited to a state account if on October 1:
• The Secretary of Labor finds the state UI program is not certified as an approved program under federal law; or
• The state has an outstanding UI loan from the federal government. If a state does not have a federally approved UI program on October 1, the state’s Reed Act distribution is held in the FUA (currently, all state UI programs are federally ap-proved). If the Secretary certifies the state UI program by the end of the year, the amount held in reserve is then credited to the state’s account. However, the state earns no interest on the amount while it is held in reserve. If the Secretary does not certify the state UI program by the end of the fiscal year, the reserved amount is no longer avail-able to the state as a Reed Act distribution. The amount is added to the balance in the FUA and is available for the intended use of the funds in the FUA, namely loans to state UI programs for the payment of benefits. If a state has an outstanding UI loan from the federal government on October 1, the Reed Act distribution to this state is reduced by the mandatory repayment of the bal-ance of the loan, but not below zero. If a state’s Reed Act distribution is not reduced to zero, the balance is transferred to the state account in the UTF. 1.1.3 Reed Act Distributions The First Reed Act Distribution The first Reed Act distributions were substantial. They occurred at the beginning of fis-cal years 1957, 1958, and 1959. The nominal amounts for these years were $33.4 mil-lion, $71 million, and $33.5 million, respectively. When adjusted to current wage levels, these amounts range from a low of about $220 million to a high of nearly $500 million today. In 1968, President Johnson ordered the creation of the unified budget, which brought together the administrative budget and the consolidated cash budget. Previously, the news media and others concerned about the federal budget tended to focus on the ad-ministrative budget and to ignore the consolidated cash budget, which was made up of all trust funds, including the UTF. The administrative budget covered all general fund spending. With the creation of the unified budget, the news media and the public began
Assessment of the Impact of the 2002 Reed Act Distribution
Center for Employment Security Education and Research 21
to take note of the effect of general and trust fund revenues and expenditures on the federal budget deficit or surplus and overall fiscal policy (Henle, July 1980). In 1970, the Extended Unemployment Compensation Act created the Federal-State Ex-tended Benefits Program, which provides up to 13 weeks of added benefits during peri-ods of high unemployment in states. The Act also created the Extended Unemployment Compensation Account (EUCA) and established a ceiling for its balance. Costs were set at 50 percent each for the federal government and state UI programs, and the FUTA taxable wage base was raised from original $3,000 to $4,200. During the early 1970s, the U.S. economy experienced “stagflation,” economic stagna-tion and inflation. The resulting high unemployment and rising nominal wage levels led to substantially higher UI benefit costs. Over half of the states had to borrow from the FUA and the UTF had to borrow from the federal general fund to cover some of the un-anticipated high costs (National Commission on Unemployment Compensation, July 1980, pp. 87-88). To repay the general fund, Congress passed a temporary 0.2 percent FUTA surtax under the Unemployment Compensation Amendments of 1976. This tem-porary surtax was scheduled to expire when the EUCA UTF had repaid the loans from the general fund. In 1981, Congress passed the Omnibus Budget Reconciliation Act. In order to discour-age further borrowing by states to cover UI benefit costs, this Act contained a provision charging interest on UI loans for the first time. A State UI program still could obtain “cash flow” loans (loans obtained January through September of the fiscal year), but in the future it would have to pay interest on loans not repaid in the fiscal year in which it obtained them. (Committee on Ways and Means, 1982, pp. 94-95) As federal spending continued growing in the early 1980s and income taxes were cut, federal unified budget deficits grew and remained stubbornly high. The federal govern-ment became more concerned about federal budget deficits and began trying to reduce the deficit by controlling spending. In 1985, Congress passed the Balanced Budget and Emergency Deficit Control Act, or so-called “Gramm-Rudman-Hollings.” This Act im-posed caps on federal discretionary spending and made it harder for Congress to ap-propriate sufficient amounts from the UTF for discretionary spending on the administra-tion of the UI and ES programs. At least in part as a result of the spending restraint im-posed by these caps, the purchasing power of ES (Wagner-Peyser Act) program budget began to shrink in the mid 1980s. (Committee on Ways and Means, 1985, pp. 719-746) With pressure mounting to reduce the federal budget deficit, Congress not only tried to cut or at least restrain spending, but it also looked for tax increases or extensions that would help hold down or reduce the federal budget deficit. In 1987, one such possible extension was the FUTA 0.2 percent surtax. The UTF had repaid the general fund early in 1987, which meant the FUTA 0.2 percent surtax would expire at the end of 1987. In-stead, Congress decided to extend the surtax three more years through 1990 to help reduce the federal budget deficit under the Omnibus Budget Reconciliation Act of 1987 (Committee on Ways and Means, 1988, p. 352). In addition, Congress raised the FUA ceiling from 0.125 to 0.625 percent so that the additional FUTA funds would remain in the UTF to cover possible loans to state UI programs in the future. If Congress had not

Assessment of the Impact of the 2002 Reed Act Distribution
Center for Employment Security Education and Research 22
raised the ceiling, substantial amounts would have automatically flowed to state UI pro-grams through the Reed Act mechanism. In 1990, Congress again turned to extending the FUTA 0.2 percent surtax to reduce the federal unified budget deficit under the Omnibus Budget Reconciliation Act of 1990 (Committee on Ways and Means, 1991, p. 504). This time, the extension was for five years through 1995. Then in 1991, Congress added another year to the extension through 1996 under The Emergency Unemployment Compensation Act of 1991 (Com-mittee on Ways and Means, 1992, p. 521), and in 1993 it added two more years to ex-tend the surtax through 1998 under the Unemployment Compensation Amendments of 1993 (Telephone call, USDOL, May, 2003). While Congress was battling the budget deficit in the early 1990s, it also struggled with policies to alleviate an economic recession and high unemployment. UI benefits were extended and funds in the EUCA were drawn down to cover benefit extensions. At the same time, states were not borrowing from the federal government at the levels they had during the 1970s and 1980s. As a result, the FUA was retaining too much and the EUCA did not have enough in reserve for extended benefits. This led to an increase in the EUCA ceiling and a cut in the FUA ceiling. Under the Emergency Unemployment Compensation Act of 1992, the FUA ceiling was cut from 0.625 percent to 0.25 percent and the EUCA ceiling was raised from 0.375 percent to 0.5 percent. A Special Reed Act Distribution By the mid 1990s, the federal government still was trying to balance the budget, but an economic boom was aiding the cause. At the same time, the federal government began funding administration of the UI program at amounts that were lower than its “cost model” estimates suggested. States bridled under this under-funding and said it was hard for them to administer their programs in a proper and efficient manner with insuffi-cient funds. Recognizing it was nearly impossible under discretionary spending caps to gain sufficient appropriations to reduce the underfunding, the federal government in-stead provided mandatory spending under the Taxpayer Relief Act of 1997 of $100 mil-lion in each of the years 1999, 2000, and 2001 through a “special Reed Act distribution.” These distributions used the basic Reed Act mechanism, but limited the distribution to $100 million for UI administration only and distributed it among the states on the basis of workload rather that total covered wages. In addition, this Act extended the FUTA 0.2 percent surtax from 1998 through 2007 to help reduce the budget deficit and dou-bled the FUA ceiling on October 1, 2001 to retain FUTA revenue for loans out of the FUA account (Telephone conversation, USDOL, May, 2003). By the end of fiscal year 1998, the economic boom of the 1990s had provided so much FUTA revenue that the three federal accounts were full. This led to a small, unantici-pated $16 million Reed Act distribution among the states at the beginning of fiscal year 1999. By the turn of the century, states were clamoring for administrative financing reform. A coalition of states made one proposal and a group comprised of business, workers, De-partment of Labor, and State representatives made another proposal. No proposals
Assessment of the Impact of the 2002 Reed Act Distribution
Center for Employment Security Education and Research 23
passed, but in the summer of 2001 it became apparent that a large Reed Act distribu-tion would occur in October 1, 2002 if the ceiling on the FUA loan did not double. Even if the ceiling did double on October 1, 2001, projections suggested there would be a substantial Reed Act distribution on October 1, 2002.
1.2 THE SOURCE OF THE 2002 SPECIAL REED ACT DISTRIBUTION 1.2.1 Purpose of the Act In response to the economic recession beginning in 2001, Congress passed and the President signed on March 9, 2002, the Job Creation and Worker Assistance Act of 2002 (P.L. 107-147). This Act aimed to stimulate the economy. It was estimated to cost the federal government about $94 billion over five years. About $13 billion of the estimated net cost of the Act over five years stemmed from a temporary extension of unemployment compensation during 2002 and an $8 billion “Special Reed Act Distribu-tion” to the state accounts of the unemployment trust fund on March 13, 2002. States may use the Special Reed Act Distribution to cover the cost of state benefits, employ-ment services, labor market information, and administration of UI programs. All 53 state and territorial programs in the unemployment insurance system received shares of the $8 billion in proportion to their shares of taxable covered wages under the FUTA in cal-endar year 2000. 1.2.2 Genesis of the Reed Act During the summer of 2001, staff of the National Association of Workforce Agencies (NASWA) worked with staff of the National Governors’ Association (NGA) to develop an “accelerated Reed Act distribution.” The idea was simple. Enact legislation that would declare a Reed Act distribution as if the FUA ceiling had not doubled as scheduled on October 1, 2001. Because the Social Security Act requires the Secretary of Labor to inform Congress when she projects a Reed Act distribution at the beginning of the next fiscal year, Secretary of Labor Chao sent a letter to Congress on October 1, 2001, in-forming it that the three accounts in the federal UTF were projected to exceed their ceil-ings by $4.3 billion on September 30, 2002 (Chao, 2001). Four days later, the NGA sent a letter to Congressional leaders requesting an “immediate transfer of $9 billion from the federal trust fund to state accounts” as a way to stimulate the economy (Sundquist and O’Bannon, 2001). Congress debated economic stimulus in the fall of 2001, but it was not until shortly after the President proposed an economic stimulus package early in 2002 that Congress passed legislation. In that package, the President not only proposed to extend unem-ployment compensation to workers who had exhausted regular state benefits, but he also proposed a special Reed Act distribution similar to what the NGA had proposed (USDOL, February 4, 2002). Ultimately, Congress passed much of the President’s pro-
Assessment of the Impact of the 2002 Reed Act Distribution
Center for Employment Security Education and Research 24
posal in the Job Creation and Worker Assistance Act of 2002. It included a slightly scaled down $8 billion Reed Act distribution and the extension of unemployment bene-fits. States were given the flexibility to use the $8 billion to improve solvency, cut taxes, avoid tax increases, or cover the cost of benefits, employment services, and UI admini-stration.
1.3 POSSIBLE STATE USE OF REED ACT FUNDS
1.3.1 Using Reed Act Funds to Improve Solvency and Lower Taxes When the federal government transfers Reed Act funds into the state accounts of the UTF, the solvency of each state UI program immediately improves. Because state UI laws relate state unemployment taxes to solvency levels, improved solvency can acti-vate lower tax schedules and lower tax rates for employers in states with improved sol-vency at the time of the state tax computation date. State tax computation dates vary, but many state tax computation dates are in the summer of each year. When improved solvency activates a lower tax schedule or tax rate, the lower taxes usually take effect at the beginning of the following calendar year. In addition, the governor and state legisla-ture also might decide to enact legislation to lower taxes as a result of improved sol-vency. 1.3.2 Using Reed Act Funds for Benefits Officials at the U.S. Department of Labor have assumed states would want to preserve Reed Act funds as long as they have funds in their respective UI accounts to cover benefit costs. Thus, the Department expects Reed Act funds to remain in state UI ac-counts as long as the balance in the state UI account (including Reed Act funds) ex-ceeds the unspent balance of Reed Act funds. If a state does not have enough funds in its UI account, it may borrow from the federal government to cover benefit costs. However, all available funds must be considered to cover benefit costs, including unobligated Reed Act funds. (The U.S. Department of Labor considers funds obligated when an order is placed, a contract is awarded, or other transactions occur that require a current or future payment.) Consequently, all of a state's unobligated Reed Act funds must be considered to cover benefit costs, even unobligated Reed Act funds that have been appropriated, but not obligated yet, for ad-ministrative purposes. (Special Reed Act distributions for fiscal years 2000, 2001, and 2002 are exceptions, however, to this general rule.) Reed Act funds that are obligated for an administrative expense before obtaining a fed-eral loan to cover benefit costs may be shielded from a requirement that they otherwise must cover benefit costs if the state sets aside such amounts in a Reed Act “subac-count.” This provision does not apply to appropriations before an obligation. The fol-lowing are the procedures for setting aside obligated amounts:

Assessment of the Impact of the 2002 Reed Act Distribution
Center for Employment Security Education and Research 25
• Review each Reed Act obligation under which there is an unspent balance and validate the date of enactment of the appropriation, the date and amount of the obligation, and the unspent balance of each obligation;
• Prepare a letter certifying the amount of unspent Reed Act obligations as of the end of the month in which the state wants to establish the initial credit for the set aside;
• Identify withdrawal amounts requested from the subaccount when requesting funds.
• Include all Reed Act subaccount transactions in Form ETA 8403 for the month in which they occurred.
When a state spends Reed Act funds, the amount available to appropriate from Reed Act funds is reduced by that amount. However, under certain conditions, a state might restore Reed Act funds used to cover benefit costs for the purpose of covering adminis-trative costs. These conditions are:
• The governor must request that the Secretary of Labor restore Reed Act funds. • The funds to be restored must have been spent to cover benefit costs. • The amount to be restored must not exceed the balance in the state account of
the UTF. • When the request is submitted, the state account must be free of federal loans to
cover benefit costs. Restoring of Reed Act funds is more restricted if the state has borrowed from the federal government to cover benefit costs. The entire state account balance in the UTF, includ-ing Reed Act funds that have not been set aside in a subaccount, must be reduced to zero to calculate the amount of a loan. Then, the balance of such Reed Act funds in the state’s account on the date in the first month a federal loan for benefit costs was used is the amount of Reed Act funds used for benefits that could be restored later. If a state wants to restore Reed Act funds that were spent on benefits, it must submit:
• Form ETA 8403 showing the date and year when the funds were used for bene-fits; and
• A letter from the governor stating the state is free of federal unemployment loan obligations and the state’s UTF account has funds at least equal to the amount to be restored.
The Secretary of labor will notify the governor that the restoration has been approved if:
• The amounts the governor requests to restore were used to cover benefit costs and they did not exceed the amount in the state’s UTF account; and
• All federal unemployment loans were repaid as of the date of the request. 1.3.3 Using Reed Act Funds for Administrative Purposes
Assessment of the Impact of the 2002 Reed Act Distribution
Center for Employment Security Education and Research 26
State legislatures must authorize the administrative use of Reed Act funds through a specific appropriation. The appropriation law must meet three conditions:
• Specify the purpose and the amount of the appropriation; • Limit the authorization of obligation of funds to a two year period starting with the
date of enactment of the law; and • Limit the amount authorized to be obligated to the balance of unobligated Reed
Act funds in the state account of the UTF. Federal law requires only that Reed Act funds be used for administrative purposes for UI or the public employment service. Unlike regular annual grants for administration of state UI programs, there is no requirement that Reed Act funds be used for expenses the Secretary of Labor finds necessary for “proper and efficient” administration of state UI programs. Interest credits on Reed Act funds in the state accounts in the UTF may not be appro-priated for administrative purposes. In other words, Reed Act funds are limited to the Reed Act distributions to state accounts in the UTF and interest on the balance does not augment the Reed Act distribution amount. In accordance with the withdrawal standard, the interest credits for the Reed Act balances in the UTF must be used to pay benefits. Except as provided under the Cash Management Improvement Act of 1990, funds that are required to be deposited by states or the federal government in state accounts of the UTF, including Reed Act funds, may not be invested by states. The U.S. Treasury credits interest on these balances as provided by federal law. 1.3.4 Acquiring Real Property with Reed Act Funds States may use Reed Act funds to purchase land or buildings for use by state UI pro-grams or the public employment service. States may lease extra space in these build-ings until it is needed for the UI program or the public employment service, but lease income must be deposited in the state account of the UTF and may not be used to augment Reed Act funds. Proceeds from the sale of unamortized real property must be deposited in the state account of the UTF and will be credited as Reed Act funds up to the amount of the original expenditure for the real property. Reimbursing Reed Act Distribution from State Administrative Grants States can reimburse Reed Act distribution amounts through amortization of:
• The cost of obtaining real property for UI program and public employment service purposes;
• Capital improvements to state-owned office buildings to the extent such buildings are used for UI program and public employment service purposes; and
• Acquisition of automatic data processing installations, including software costing $1 million or more.
Assessment of the Impact of the 2002 Reed Act Distribution
Center for Employment Security Education and Research 27
The amortization of Reed Act expenditures for purchasing real property and capital im-provements with federal administrative grant money creates “federal equity,” i.e., the federal government owns a share of the real property. The federal government “recap-tures” the federal equity when the state stops using the property for UI program and public employment service purposes. Grant funds used to reimburse a state for Reed Act expenditures are required to be deposited into the state account of the UTF and credited to Reed Act funds. The state legislature can then “reappropriate” the reim-bursed Reed Act funds for other Reed Act administrative purposes. 1.3.5 Suggested Uses of Reed Act Distributions for Administrative Purposes On May 8, 2002, the Employment and Training Administration of the USDOL issued Training and Employment Guidance Letter No. 24-01, Suggested Uses of Reed Act Dis-tribution for Administrative Purposes. The following is a summary of these suggestions:
• Use Reed Act funds to purchase computer equipment and software. The soft-ware must cost at least $1 million. States can amortize these Reed Act expendi-tures from annual grants to states for the administration of the UI program and the public employment service. The Wagner-Peyser Act, Social Security Act, federal regulations, and the allowable cost principle in OMB circular A-87 limit re-imbursements to allowable depreciation costs.
• Use Reed Act funds improve performance where problems have existed for sev-eral years. This might include evaluating the current delivery system and funding the cost of improvements.
• Use Reed Act funds to cover the costs of implementing the cross matching of claimant data with the state directory of new hires data to identify claimants who have returned to work, but have not ceased claiming UI benefits. Or, states could use the funds to link with the Social Security Administration’s data base for the purpose of verifying claimant identity and validating Social Security numbers in real time at the time of the initial claim.
• Use Reed Act funds to establish or improve remote claims filing over the internet or telephone system. For example, states could improve claimant filing to in-clude linkages with reemployment services and they could improve services to claimants with special needs, such as those with limited English proficiency. In addition, states could implement direct deposit of benefit payments, debit cards, and electronic payment of employer taxes.
• Use Reed Act funds to improve the role of the public employment service in one-stop career centers. States must take care to allocate costs properly to UI and the public employment service (ES), and not to non-UI and non-ES activities also occurring in one-stop centers. Examples include:
o Hiring and training of staff to provide employment services; o Purchasing equipment for job search resource rooms; o Paying rent, utilities, and maintenance costs in accordance with cost shar-
ing guidelines;
Assessment of the Impact of the 2002 Reed Act Distribution
Center for Employment Security Education and Research 28
o Developing job search support products, such as printed information or job bank information technology;
o Purchasing computer equipment, network equipment, telecommunications equipment, computer applications, and other information technology re-sources to support deliver of labor market information to workers, employ-ers, and the general public’
o Developing and providing outreach materials for users on one-stop cen-ters;
o Improving access to services for individuals with disabilities or limited Eng-lish proficiency (including language line services, development of forms, and automated voice messages in languages other than English);
1.4 FUNDING OF THIS RESEARCH EFFORT This CESER research was completed with funding from USDOL Employment Training Administration (ETA) with supplemental information and analysis supported by NASWA and selected state contributions. These NASWA contributions consisted of two surveys conducted in the fall of 2003, and winter of 2004. In-depth interviews with nine states were conducted during the summer of 2003.
1.5 STRUCTURE OF THIS REPORT This report consists of five sections in addition to the Executive Summary and this background section. Section II, Summary of Research Findings, provides a narrative discussion of the key findings of this research project. Section III, Qualitative Analysis, provides the first of two main analytical components undertaken. This section is a com-pilation of the information learned from case interviews with nine states, as well as the complete state profiles compiled as a result of the interviews. Section IV, Quantitative Analysis, is an attempt to conduct more rigorous numerical and econometric evaluation of the trends and patterns in use of the Reed Act funding across all 53 states and terri-tories. This section, broadly speaking, provides both descriptive statistics and charts of the trends that can be observed, as well as formal attempts to test with statistical rigor the validity of six hypotheses about how states might use the Reed Act funds. The remaining sections provide additional supporting information, including a list of all figures in this report (Section V), a bibliography (Section VI), and Attachments of rele-vant materials that did not properly fit into the main body of the report.

Assessment of the Impact of the 2002 Reed Act Distribution
Center for Employment Security Education and Research 29
SECTION II RESEARCH FINDINGS
Assessment of the Impact of the 2002 Reed Act Distribution
Center for Employment Security Education and Research 30
2.1 OVERVIEW The Process Evaluation Design completed jointly by Booz Allen and CESER in the fall of 2002, outlining the Reed Act research project, described the purpose of the study in the following manner:
“This process evaluation analyzes the [Reed Act] spending of funds by the states and the factors that drive this spending. The purpose of the process evaluation is to study the states’ implementation, policies, institutional outcomes and individual state outcomes (from existing data) and to glean federal policy consequences. The process evaluation con-sists of data collection, quantitative and qualitative analysis of the use of funds and documentation.”
This summary of research findings is intended to provide an accessible starting point for readers of the report. Each of the findings presented here can be evaluated in more de-tail in the research sections. Discussion of methods and approaches is excluded from this summary, unless deemed necessary for understanding the research findings. The context in which the Reed Act distribution took place and the research was com-pleted is an important consideration. For example, the USDOL provided specific guid-ance to the states on appropriate and acceptable uses of the Reed Act funds4. In addi-tion it must be remembered that although the Reed Act distribution represents large ab-solute amounts of money, in the context of the overall unemployment UI system the amount represents about 21% of the balance the states had in their trust funds at the time of the distribution. Put differently, the Reed Act distribution amounted to approxi-mately 38% of the $21.2 billion in revenue collected into the trust funds of all the juris-dictions in 2002, the year of the Reed Act distribution Another very important consideration is the fiscal and economic situation in the states. Many, if not most, states were experiencing severe fiscal challenges and much of the political interest in the states was in finding any means to balance their budget (as re-quired by law in most states). The economic situation is also very important to keep in mind. Although the period of contraction that marks the official recession lasted less than four quarters and ended in 2001.4, this (1) was not known until late in 2002; (2) did not mean that the economy was likely to produce a very big increase in jobs immedi-ately following the recession; and (3) forced states to consider options for dealing with the potential of large numbers of claimants that had exhausted unemployment assis-tance and extensions provided for in federal legislation. A further issue that impacted the immediate use of the Reed Act funds was the ability to produce legislation in the period immediately after the distribution was made, and prior to a recess in the state assemblies’ legislative sessions. In those states where a short session was being held, or where the state assembly meets biennially, this represented
4 Training and Employment Guidance Letters (TEGLs) Number 18-01 and 24-01. See bibliography for further information.
Assessment of the Impact of the 2002 Reed Act Distribution
Center for Employment Security Education and Research 31
a particular challenge that in some instances may have lengthened the time until Reed Act funds could be appropriated for other uses than shoring up the trust fund. And as has been noted in previous studies completed by NASWA, this was also in many cases desirable for the state economy as this had the effect of lowering the unemployment taxes that were computed for the calendar year 2003. With these considerations in mind, the summary of research findings is complemented by an examination of the immediate, short- to intermediate and long-term impact of the $8 billion Reed Act distribution disbursed in March 2002.
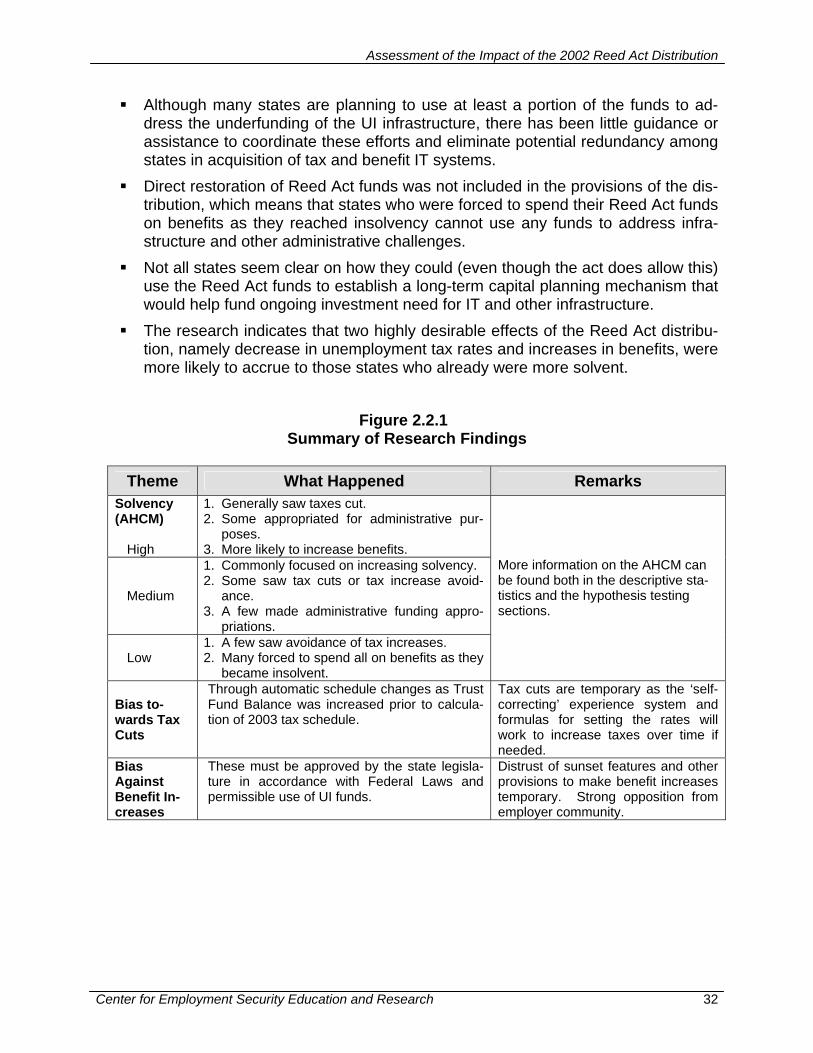
2.2 SUMMARY OF KEY RESEARCH FINDINGS The special Reed Act distribution of 2002 achieved success on a number of fronts:
1. Reduced unemployment taxes in 25 states by increasing the Trust Fund Balance used to calculate the rate schedules used by many states in 2003 and 2004.
2. Helped some states stave off insolvency for a period of time, and reduced the borrowing they needed once they reached insolvency.
3. In some cases, helped fund increases or extensions of benefits to claimants, or funded benefits to new claimants.
4. Although it is too early to state definitively, it may also help some states address long-standing underinvestment in the unemployment insurance system and em-ployment services infrastructure.
NASWA, in a survey of member states conducted in concert with this research effort, has reported an economic stimulus impact of the Reed Act distribution, through a com-bination of lower taxes (approximately $4 billion in 2003 and 2004) and increases in benefits and administrative expenditures that could have been as much as $4.3 billion (see Appendix B).
Given that over half of the Reed Act distribution still remains in the state Trust Funds5, and that at least two states (Iowa and Washington) have set up long-term revolving funds based on the Reed Act distribution, the full impact of the distribution cannot yet be determined. On a few other fronts the Reed Act distribution does not appear to have had the full im-pact that was hoped for:
The states interviewed felt that there had been insufficient time to plan for the large infusion of the Reed Act funds, and to prepare comprehensive proposals for the use of the funds
5 At the time the research team completed the research effort in early summer of 2004.
Assessment of the Impact of the 2002 Reed Act Distribution
Center for Employment Security Education and Research 32
Although many states are planning to use at least a portion of the funds to ad-dress the underfunding of the UI infrastructure, there has been little guidance or assistance to coordinate these efforts and eliminate potential redundancy among states in acquisition of tax and benefit IT systems.
Direct restoration of Reed Act funds was not included in the provisions of the dis-tribution, which means that states who were forced to spend their Reed Act funds on benefits as they reached insolvency cannot use any funds to address infra-structure and other administrative challenges.
Not all states seem clear on how they could (even though the act does allow this) use the Reed Act funds to establish a long-term capital planning mechanism that would help fund ongoing investment need for IT and other infrastructure.
The research indicates that two highly desirable effects of the Reed Act distribu-tion, namely decrease in unemployment tax rates and increases in benefits, were more likely to accrue to those states who already were more solvent.
Figure 2.2.1
Summary of Research Findings
Theme What Happened Remarks Solvency (AHCM)
High
1. Generally saw taxes cut. 2. Some appropriated for administrative pur-
poses. 3. More likely to increase benefits.
Medium
1. Commonly focused on increasing solvency. 2. Some saw tax cuts or tax increase avoid-
ance. 3. A few made administrative funding appro-
priations.
Low 1. A few saw avoidance of tax increases. 2. Many forced to spend all on benefits as they
became insolvent.
More information on the AHCM can be found both in the descriptive sta-tistics and the hypothesis testing sections.
Bias to-wards Tax Cuts
Through automatic schedule changes as Trust Fund Balance was increased prior to calcula-tion of 2003 tax schedule.
Tax cuts are temporary as the ‘self-correcting’ experience system and formulas for setting the rates will work to increase taxes over time if needed.
Bias Against Benefit In-creases
These must be approved by the state legisla-ture in accordance with Federal Laws and permissible use of UI funds.
Distrust of sunset features and other provisions to make benefit increases temporary. Strong opposition from employer community.
Assessment of the Impact of the 2002 Reed Act Distribution
Center for Employment Security Education and Research 33
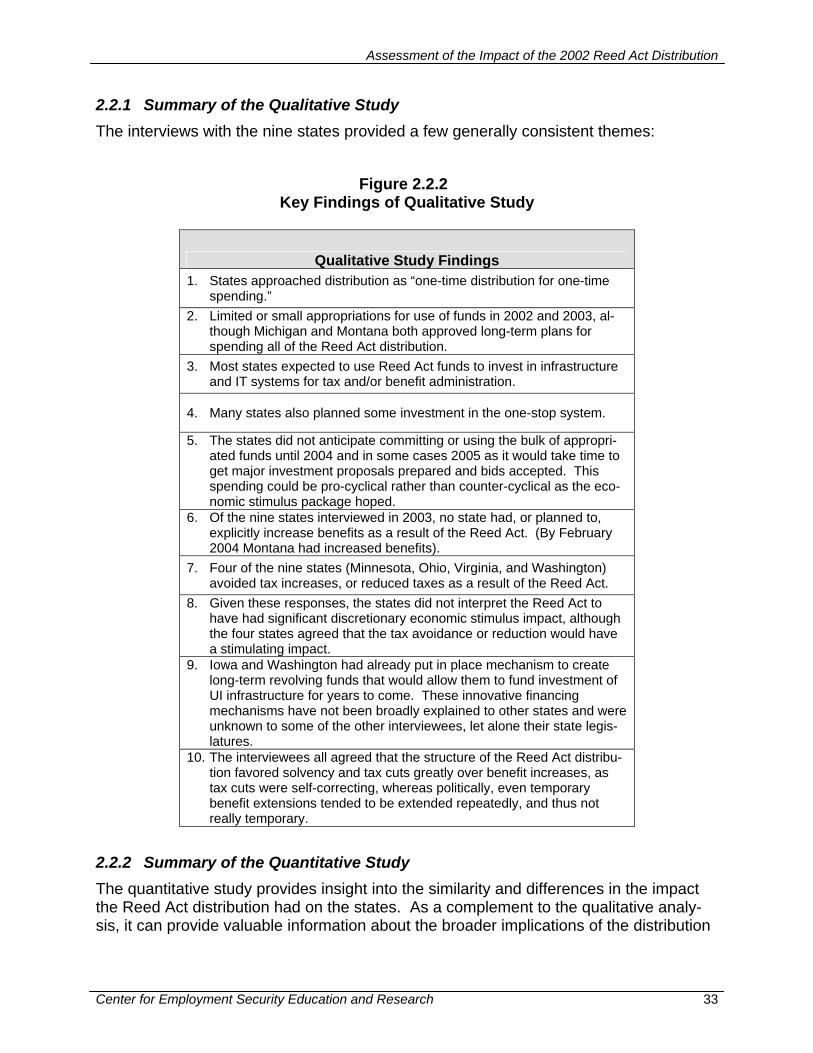
2.2.1 Summary of the Qualitative Study The interviews with the nine states provided a few generally consistent themes:
Figure 2.2.2 Key Findings of Qualitative Study
Qualitative Study Findings 1. States approached distribution as “one-time distribution for one-time
spending.” 2. Limited or small appropriations for use of funds in 2002 and 2003, al-
though Michigan and Montana both approved long-term plans for spending all of the Reed Act distribution.
3. Most states expected to use Reed Act funds to invest in infrastructure and IT systems for tax and/or benefit administration.
4. Many states also planned some investment in the one-stop system.
5. The states did not anticipate committing or using the bulk of appropri-ated funds until 2004 and in some cases 2005 as it would take time to get major investment proposals prepared and bids accepted. This spending could be pro-cyclical rather than counter-cyclical as the eco-nomic stimulus package hoped.
6. Of the nine states interviewed in 2003, no state had, or planned to, explicitly increase benefits as a result of the Reed Act. (By February 2004 Montana had increased benefits).
7. Four of the nine states (Minnesota, Ohio, Virginia, and Washington) avoided tax increases, or reduced taxes as a result of the Reed Act.
8. Given these responses, the states did not interpret the Reed Act to have had significant discretionary economic stimulus impact, although the four states agreed that the tax avoidance or reduction would have a stimulating impact.
9. Iowa and Washington had already put in place mechanism to create long-term revolving funds that would allow them to fund investment of UI infrastructure for years to come. These innovative financing mechanisms have not been broadly explained to other states and were unknown to some of the other interviewees, let alone their state legis-latures.
10. The interviewees all agreed that the structure of the Reed Act distribu-tion favored solvency and tax cuts greatly over benefit increases, as tax cuts were self-correcting, whereas politically, even temporary benefit extensions tended to be extended repeatedly, and thus not really temporary.
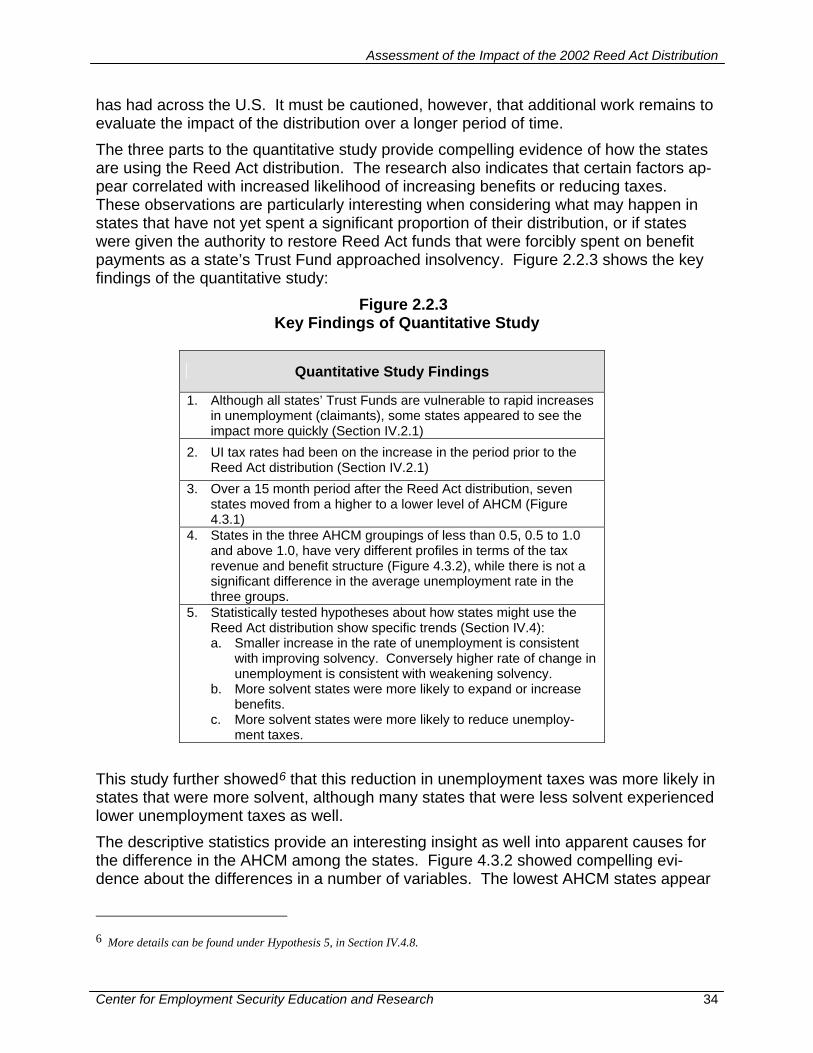
2.2.2 Summary of the Quantitative Study The quantitative study provides insight into the similarity and differences in the impact the Reed Act distribution had on the states. As a complement to the qualitative analy-sis, it can provide valuable information about the broader implications of the distribution
Assessment of the Impact of the 2002 Reed Act Distribution
Center for Employment Security Education and Research 34
has had across the U.S. It must be cautioned, however, that additional work remains to evaluate the impact of the distribution over a longer period of time. The three parts to the quantitative study provide compelling evidence of how the states are using the Reed Act distribution. The research also indicates that certain factors ap-pear correlated with increased likelihood of increasing benefits or reducing taxes. These observations are particularly interesting when considering what may happen in states that have not yet spent a significant proportion of their distribution, or if states were given the authority to restore Reed Act funds that were forcibly spent on benefit payments as a state’s Trust Fund approached insolvency. Figure 2.2.3 shows the key findings of the quantitative study:
Figure 2.2.3 Key Findings of Quantitative Study
Quantitative Study Findings
1. Although all states’ Trust Funds are vulnerable to rapid increases in unemployment (claimants), some states appeared to see the impact more quickly (Section IV.2.1)
2. UI tax rates had been on the increase in the period prior to the Reed Act distribution (Section IV.2.1)
3. Over a 15 month period after the Reed Act distribution, seven states moved from a higher to a lower level of AHCM (Figure 4.3.1)
4. States in the three AHCM groupings of less than 0.5, 0.5 to 1.0 and above 1.0, have very different profiles in terms of the tax revenue and benefit structure (Figure 4.3.2), while there is not a significant difference in the average unemployment rate in the three groups.
5. Statistically tested hypotheses about how states might use the Reed Act distribution show specific trends (Section IV.4): a. Smaller increase in the rate of unemployment is consistent
with improving solvency. Conversely higher rate of change in unemployment is consistent with weakening solvency.
b. More solvent states were more likely to expand or increase benefits.
c. More solvent states were more likely to reduce unemploy-ment taxes.
This study further showed6 that this reduction in unemployment taxes was more likely in states that were more solvent, although many states that were less solvent experienced lower unemployment taxes as well. The descriptive statistics provide an interesting insight as well into apparent causes for the difference in the AHCM among the states. Figure 4.3.2 showed compelling evi-dence about the differences in a number of variables. The lowest AHCM states appear
6 More details can be found under Hypothesis 5, in Section IV.4.8.
Assessment of the Impact of the 2002 Reed Act Distribution
Center for Employment Security Education and Research 35
to have more factors (4 of the 6 evaluated) that work to reduce the trust fund balances than the other two groups, and most notably have longer unemployment duration among the insured population. The ‘medium’ and ‘high’ AHCM each have 2 (out of 6) factors against them, but not the same ones. The ‘medium’ states have higher AWBA and compensate a higher share of workers, whereas the ‘high’ group compensates more weeks per 1000 covered workers and collects less tax per 1000 covered workers. One could infer from this the relative importance of each of these factors in determining a state’s future fiscal position, al-though such inference has not been attempted here. The testing of hypotheses is also of considerable interest. Hypothesis 4, that more sol-vent states are more likely to extend benefits, and hypothesis 5, that more solvent states are more likely to reduce taxes, are of course logical in their presentation, but have now been tested and supported using fairly robust statistical tests. Hypothesis 1, that higher unemployment rates would correspond with greater likelihood of retaining Reed Act funds in the trust fund, was not only refuted, but it was also shown that the correlation is the opposite of the hypothesis, with higher unemployment being consistent with less Reed Act funds remaining in the trust fund. The results of the hy-pothesis testing have been summarized in figure 4.5.1
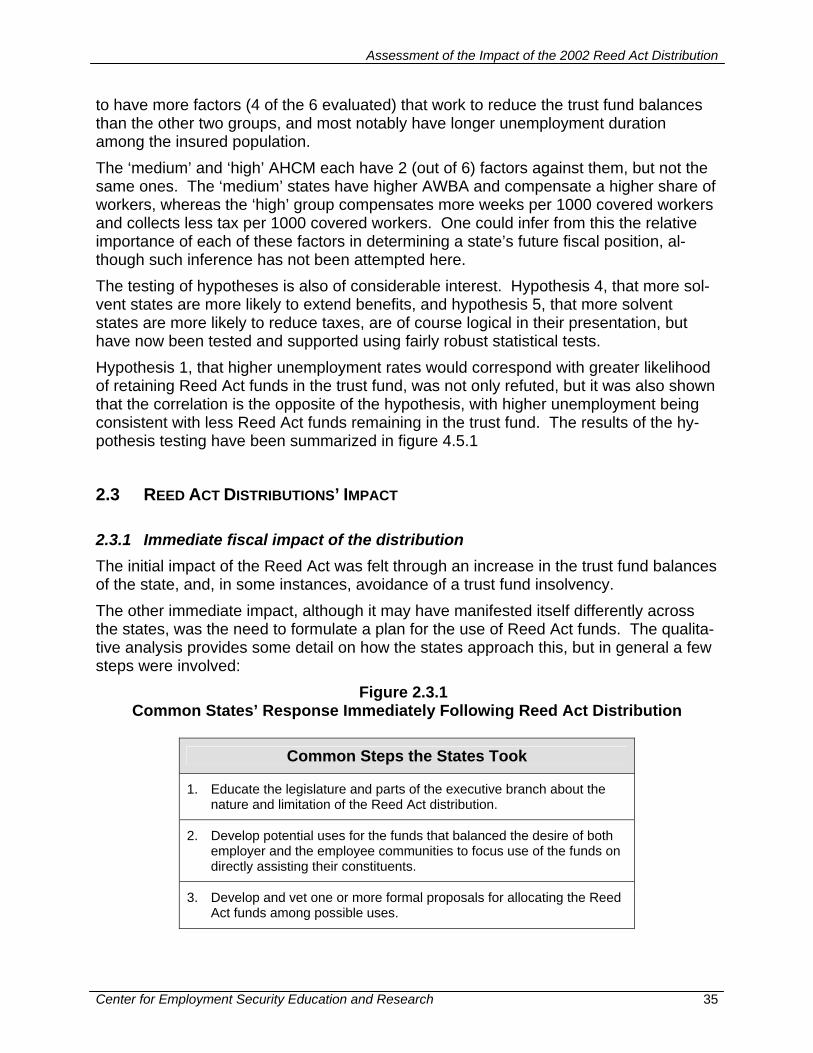
2.3 REED ACT DISTRIBUTIONS’ IMPACT 2.3.1 Immediate fiscal impact of the distribution The initial impact of the Reed Act was felt through an increase in the trust fund balances of the state, and, in some instances, avoidance of a trust fund insolvency. The other immediate impact, although it may have manifested itself differently across the states, was the need to formulate a plan for the use of Reed Act funds. The qualita-tive analysis provides some detail on how the states approach this, but in general a few steps were involved:
Figure 2.3.1 Common States’ Response Immediately Following Reed Act Distribution
Common Steps the States Took
1. Educate the legislature and parts of the executive branch about the nature and limitation of the Reed Act distribution.
2. Develop potential uses for the funds that balanced the desire of both employer and the employee communities to focus use of the funds on directly assisting their constituents.
3. Develop and vet one or more formal proposals for allocating the Reed Act funds among possible uses.
Assessment of the Impact of the 2002 Reed Act Distribution
Center for Employment Security Education and Research 36
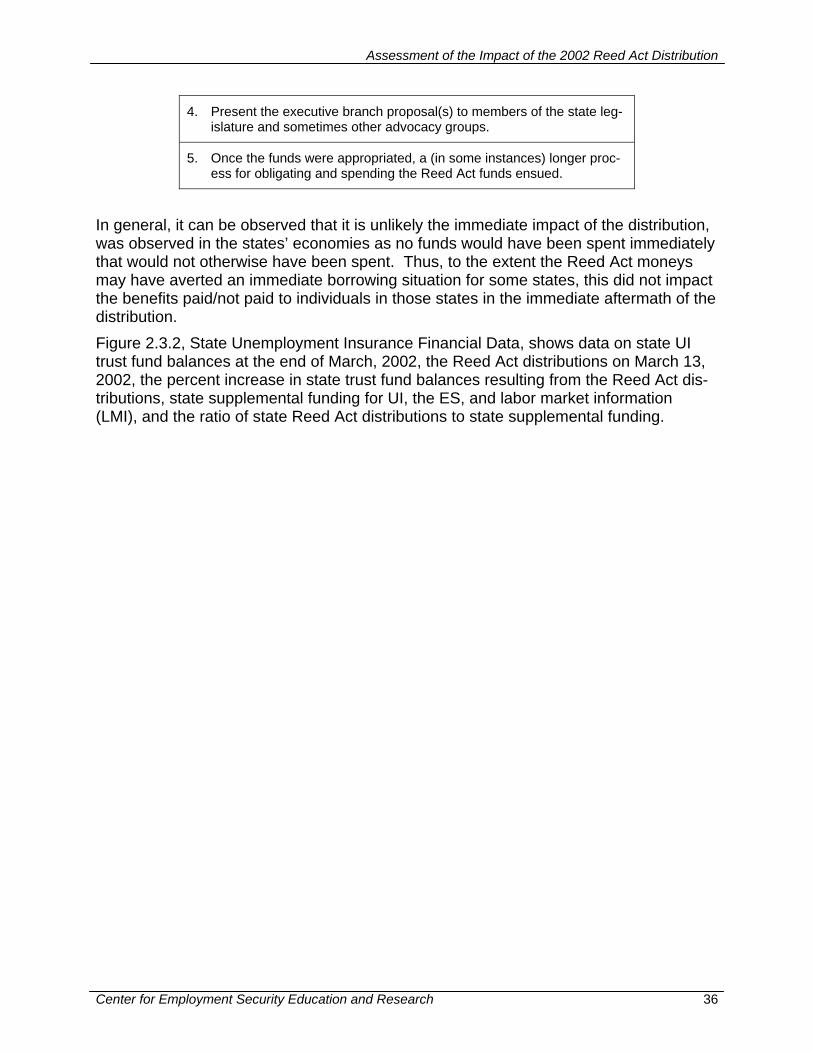
4. Present the executive branch proposal(s) to members of the state leg-islature and sometimes other advocacy groups.
5. Once the funds were appropriated, a (in some instances) longer proc-ess for obligating and spending the Reed Act funds ensued.
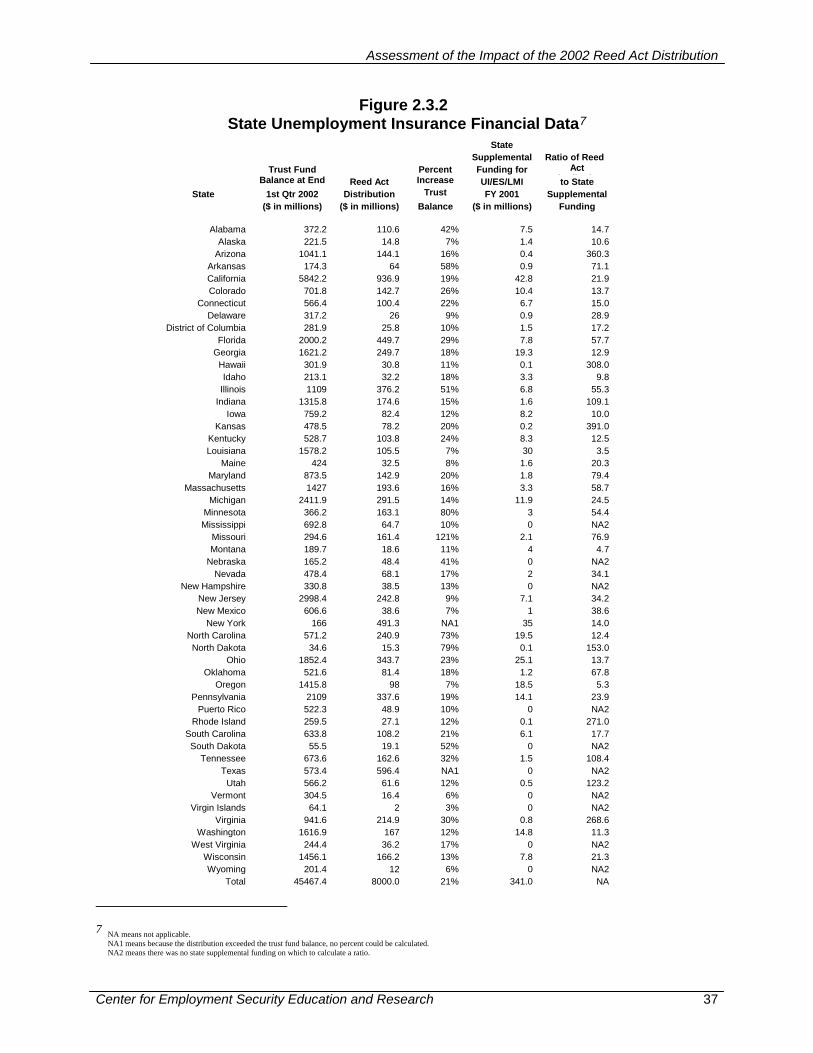
In general, it can be observed that it is unlikely the immediate impact of the distribution, was observed in the states’ economies as no funds would have been spent immediately that would not otherwise have been spent. Thus, to the extent the Reed Act moneys may have averted an immediate borrowing situation for some states, this did not impact the benefits paid/not paid to individuals in those states in the immediate aftermath of the distribution. Figure 2.3.2, State Unemployment Insurance Financial Data, shows data on state UI trust fund balances at the end of March, 2002, the Reed Act distributions on March 13, 2002, the percent increase in state trust fund balances resulting from the Reed Act dis-tributions, state supplemental funding for UI, the ES, and labor market information (LMI), and the ratio of state Reed Act distributions to state supplemental funding.
Assessment of the Impact of the 2002 Reed Act Distribution
Center for Employment Security Education and Research 37
Figure 2.3.2 State Unemployment Insurance Financial Data7
7 NA means not applicable.
NA1 means because the distribution exceeded the trust fund balance, no percent could be calculated. NA2 means there was no state supplemental funding on which to calculate a ratio.
State Supplemental Ratio of Reed Trust Fund Percent Funding for Act
Di ib i Balance at End f
Reed Act Increase i
UI/ES/LMI to State State 1st Qtr 2002 Distribution Trust
F dFY 2001 Supplemental
($ in millions) ($ in millions) Balance ($ in millions) Funding
Alabama 372.2 110.6 42% 7.5 14.7 Alaska 221.5 14.8 7% 1.4 10.6
Arizona 1041.1 144.1 16% 0.4 360.3 Arkansas 174.3 64 58% 0.9 71.1 California 5842.2 936.9 19% 42.8 21.9 Colorado 701.8 142.7 26% 10.4 13.7
Connecticut 566.4 100.4 22% 6.7 15.0 Delaware 317.2 26 9% 0.9 28.9
District of Columbia 281.9 25.8 10% 1.5 17.2 Florida 2000.2 449.7 29% 7.8 57.7
Georgia 1621.2 249.7 18% 19.3 12.9 Hawaii 301.9 30.8 11% 0.1 308.0 Idaho 213.1 32.2 18% 3.3 9.8
Illinois 1109 376.2 51% 6.8 55.3 Indiana 1315.8 174.6 15% 1.6 109.1
Iowa 759.2 82.4 12% 8.2 10.0 Kansas 478.5 78.2 20% 0.2 391.0
Kentucky 528.7 103.8 24% 8.3 12.5 Louisiana 1578.2 105.5 7% 30 3.5
Maine 424 32.5 8% 1.6 20.3 Maryland 873.5 142.9 20% 1.8 79.4
Massachusetts 1427 193.6 16% 3.3 58.7 Michigan 2411.9 291.5 14% 11.9 24.5
Minnesota 366.2 163.1 80% 3 54.4 Mississippi 692.8 64.7 10% 0 NA2
Missouri 294.6 161.4 121% 2.1 76.9 Montana 189.7 18.6 11% 4 4.7
Nebraska 165.2 48.4 41% 0 NA2 Nevada 478.4 68.1 17% 2 34.1
New Hampshire 330.8 38.5 13% 0 NA2 New Jersey 2998.4 242.8 9% 7.1 34.2 New Mexico 606.6 38.6 7% 1 38.6
New York 166 491.3 NA1 35 14.0 North Carolina 571.2 240.9 73% 19.5 12.4 North Dakota 34.6 15.3 79% 0.1 153.0
Ohio 1852.4 343.7 23% 25.1 13.7 Oklahoma 521.6 81.4 18% 1.2 67.8
Oregon 1415.8 98 7% 18.5 5.3 Pennsylvania 2109 337.6 19% 14.1 23.9
Puerto Rico 522.3 48.9 10% 0 NA2 Rhode Island 259.5 27.1 12% 0.1 271.0
South Carolina 633.8 108.2 21% 6.1 17.7 South Dakota 55.5 19.1 52% 0 NA2
Tennessee 673.6 162.6 32% 1.5 108.4 Texas 573.4 596.4 NA1 0 NA2
Utah 566.2 61.6 12% 0.5 123.2 Vermont 304.5 16.4 6% 0 NA2
Virgin Islands 64.1 2 3% 0 NA2 Virginia 941.6 214.9 30% 0.8 268.6
Washington 1616.9 167 12% 14.8 11.3 West Virginia 244.4 36.2 17% 0 NA2
Wisconsin 1456.1 166.2 13% 7.8 21.3 Wyoming 201.4 12 6% 0 NA2
Total 45467.4 8000.0 21% 341.0 NA
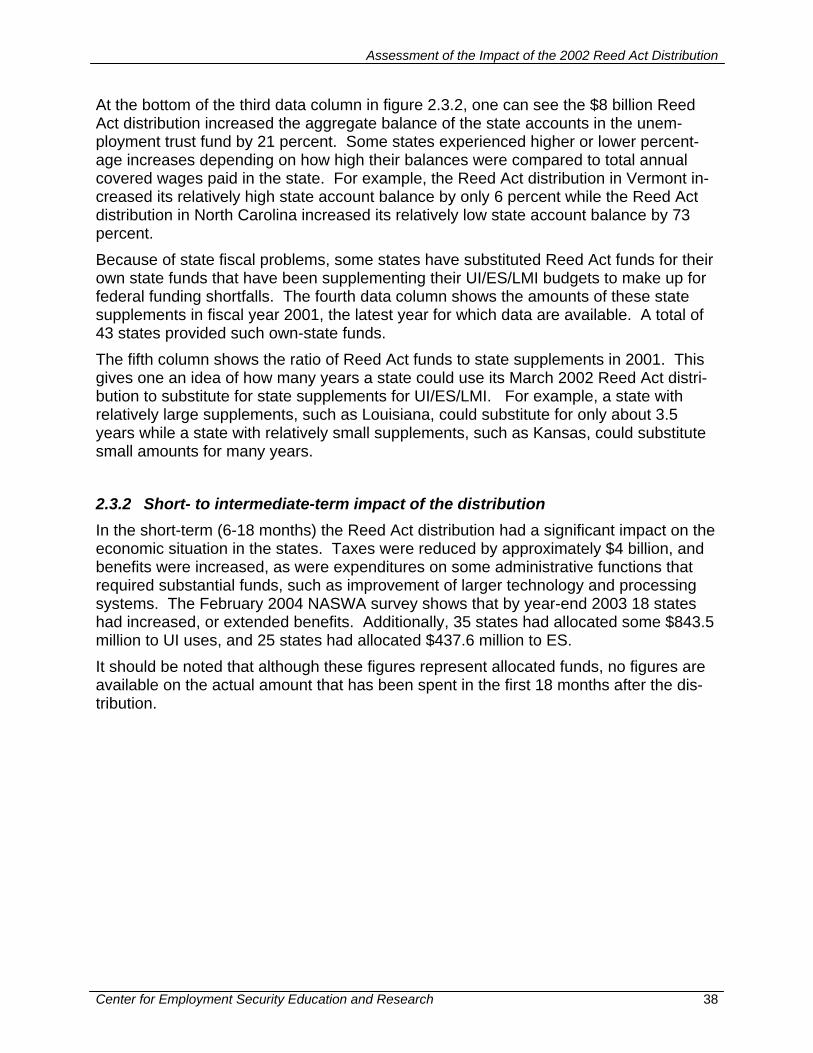
Assessment of the Impact of the 2002 Reed Act Distribution
Center for Employment Security Education and Research 38
At the bottom of the third data column in figure 2.3.2, one can see the $8 billion Reed Act distribution increased the aggregate balance of the state accounts in the unem-ployment trust fund by 21 percent. Some states experienced higher or lower percent-age increases depending on how high their balances were compared to total annual covered wages paid in the state. For example, the Reed Act distribution in Vermont in-creased its relatively high state account balance by only 6 percent while the Reed Act distribution in North Carolina increased its relatively low state account balance by 73 percent. Because of state fiscal problems, some states have substituted Reed Act funds for their own state funds that have been supplementing their UI/ES/LMI budgets to make up for federal funding shortfalls. The fourth data column shows the amounts of these state supplements in fiscal year 2001, the latest year for which data are available. A total of 43 states provided such own-state funds. The fifth column shows the ratio of Reed Act funds to state supplements in 2001. This gives one an idea of how many years a state could use its March 2002 Reed Act distri-bution to substitute for state supplements for UI/ES/LMI. For example, a state with relatively large supplements, such as Louisiana, could substitute for only about 3.5 years while a state with relatively small supplements, such as Kansas, could substitute small amounts for many years. 2.3.2 Short- to intermediate-term impact of the distribution In the short-term (6-18 months) the Reed Act distribution had a significant impact on the economic situation in the states. Taxes were reduced by approximately $4 billion, and benefits were increased, as were expenditures on some administrative functions that required substantial funds, such as improvement of larger technology and processing systems. The February 2004 NASWA survey shows that by year-end 2003 18 states had increased, or extended benefits. Additionally, 35 states had allocated some $843.5 million to UI uses, and 25 states had allocated $437.6 million to ES. It should be noted that although these figures represent allocated funds, no figures are available on the actual amount that has been spent in the first 18 months after the dis-tribution.
Assessment of the Impact of the 2002 Reed Act Distribution
Center for Employment Security Education and Research 39
Figure 2.3.3 Short- to Intermediate Term Impact of Reed Act Distribution
Short- to Intermediate Impact of Distribution
1. Tax increase avoided in many states in both 2003 and 2004.
2. Tax reduction in some states in 2003 as result of higher Trust Fund Balance.
3. Service enhancements (such as new service centers) and planned investment in IT systems.
4. Fiscal stability through reduced borrowing or avoid-ance of borrowing.
5. Calming effect on labor market as unemployment taxes in many states increased less than they other-wise would have.
2.3.3 The long-term impact of the distribution The nature of the allowable uses of the Reed Act funds have the potential to assist the states in undertaking major IT renovation and capital improvement projects (such as automated and centralized claims handling capabilities). The research, however, also suggests the Reed Act distribution is not likely to have this impact evenly across the states. Furthermore, it can be questioned whether this is at all a function of the Reed Act distribution, per se, or if it is simply a function of states now having funds they have indicated were needed for a long time. Another consideration is the uneven ability of the states to use the Reed Act funds. Some states, for reasons this project has not delved into, were forced into insolvency around the same time, or shortly after the Reed Act distribution. These states have ex-hausted their one-time funds and cannot invest in their system, because the special Reed Act distribution law did not allow such states to restore Reed Act funds after they have been spent on benefits. Substantial proportion of the special Reed Act distribution of 2002 has not been obli-gated to-date. A number of research questions remain, that would require longitudinal information not available to the research team at this time. These questions include:
Will the states be more comfortable lowering taxes with the expectation the Federal government will release funds in hard economic times?
Will the states who already had very solvent trust funds act differently than those states in the intermediate and lower solvency categories, e.g., by enhancing their
Assessment of the Impact of the 2002 Reed Act Distribution
Center for Employment Security Education and Research 40
employment services infrastructure, thereby, perhaps, improving their ability to weather a future recession?
Will the unstructured use of Reed Act funds for replacement and upgrading of both tax and service delivery systems lead to wasteful spending as insufficient plans and coordination exists across the states for managing the large amounts suddenly available for administrative improvements?
Will the Reed Act funds have the impact of further depressing funding for adminis-trative operation of the UI system, and if so, how will this be shared among the states who have, and do not have, Reed Act funds available to backfill for lowered funding levels?
These, and myriad other potential questions, will be critical in evaluating the long-term health of the UI system as more time elapses from this infusion of funds.
Assessment of the Impact of the 2002 Reed Act Distribution
Center for Employment Security Education and Research 41
SECTION III QUALITATIVE ANALYSIS
Assessment of the Impact of the 2002 Reed Act Distribution
Center for Employment Security Education and Research 42
3.1 OVERVIEW OF QUALITATIVE ANALYSIS
The qualitative analysis presented here is the counterpart to the quantitative analysis conducted by the research team. In light of the number of factors (and complicated in-teractions of these factors) that impact the decision in each state to use Reed Act funds, we have undertaken a case study analysis that presents the decision process as it un-folded in nine selected states. It should be emphasized here that this analysis presents a snapshot of information col-lected from the states in June and July of 2003. As such this information should not be relied on for actions of the states after that time. The qualitative study report is divided into four sections. Section III.2.1 provides an overview of the process that was used for selecting the states for the case studies, and it also provides a general description of the approach taken to the case interviews. Sec-tions III.3 and III.4 contain discussions of the themes and observations that the team identified during the case interviews. As such this represents the team's efforts to com-pare and contrast the activities in the states, and to present an analysis of some of the common factors that seemed to motivate the states in their approach to using Reed Act funds. Section III.5 contains the complete discussion of the case interviews of each of the nine states. Each discussion is presented in a similar manner, with a description of the process for developing proposals and communicating with state decision-makers; a dis-cussion of the use of Reed Act funds to fund investment in the employment services and unemployment insurance systems; the use of Reed Act funds on benefits, tax re-duction or solvency; and finally a discussion of the state's observations on the process and lessons learned from managing the Reed Act distribution. Attachment D provides supplemental information on the interview guide that was used.
Assessment of the Impact of the 2002 Reed Act Distribution
Center for Employment Security Education and Research 43
3.2 PROCESS FOR SELECTING STATES AS CASE STUDIES The qualitative analysis was accomplished by selecting a subset of the states for further study. Case interviews with nine selected states were used to collect qualitative infor-mation on political, economic and budgetary factors that may have determined their use of Reed Act funds. The collection and analysis of qualitative information of this nature was considered important for several reasons: It provided insight into the proposal development process for allocating the Reed Act
funds to their uses, the political mechanism governing the states’ use of Reed Act funds and the involvement of local stakeholders in the process.
It facilitated a better understanding of the spending of funds by collecting detailed information on funds allocated for improvements in Employment Services, Unem-ployment Insurance administration and IT infrastructure.
It collected information on the direct or indirect impact of the Reed Act funds on benefits, tax rates and solvency levels.
It obtained feedback from the states on the usefulness of the USDOL guidance and other policy recommendations.
3.2.1 State Selection Criteria Booz Allen and CESER met with the USDOL on April 25, 2003 to discuss the state se-lection process. Nine states were selected by the research team on the basis of criteria such as the solvency status of a state, the UI tax rate, or a combination of these and other variables. Additionally, information provided by the states was used in the deter-mination. This ensured that interesting practices adopted by states were studied and documented. The state selection criteria are discussed below. The nine states are Iowa, Louisiana, Michigan, Minnesota, Montana, New Jersey, Ohio, Virginia and Wash-ington. The states were selected for further study based on the following criteria: Are the states interesting to study? − Did they increase benefits? − Did they lower UI tax rates? − What do the UI data say about them? − Do they perform any interesting or unique functions?
Solvency level: solvency measures such as the trust fund balance provide an indica-tion of whether the states are capable of meeting financial obligations
Regional representation Population size
Analysts consider a state UI program relatively solvent when it has enough funds in its trust fund account to cover its UI benefit costs during a year in which there is an eco-
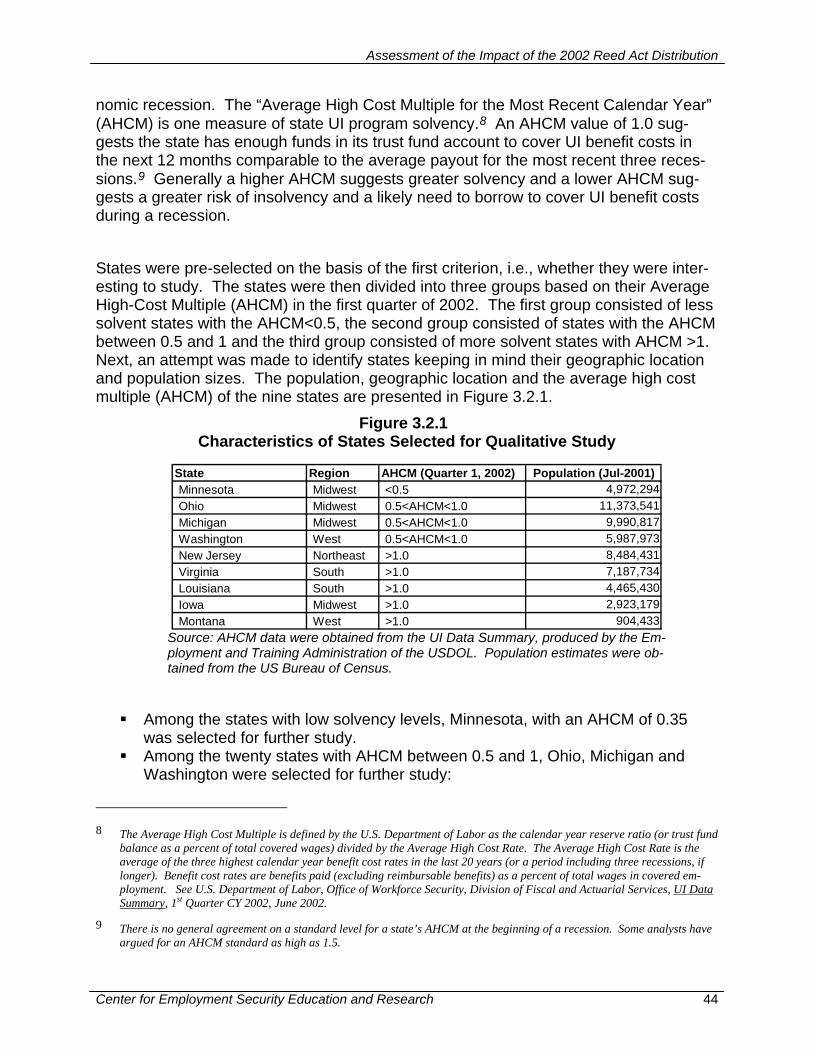
Assessment of the Impact of the 2002 Reed Act Distribution
Center for Employment Security Education and Research 44
nomic recession. The “Average High Cost Multiple for the Most Recent Calendar Year” (AHCM) is one measure of state UI program solvency.8 An AHCM value of 1.0 sug-gests the state has enough funds in its trust fund account to cover UI benefit costs in the next 12 months comparable to the average payout for the most recent three reces-sions.9 Generally a higher AHCM suggests greater solvency and a lower AHCM sug-gests a greater risk of insolvency and a likely need to borrow to cover UI benefit costs during a recession. States were pre-selected on the basis of the first criterion, i.e., whether they were inter-esting to study. The states were then divided into three groups based on their Average High-Cost Multiple (AHCM) in the first quarter of 2002. The first group consisted of less solvent states with the AHCM<0.5, the second group consisted of states with the AHCM between 0.5 and 1 and the third group consisted of more solvent states with AHCM >1. Next, an attempt was made to identify states keeping in mind their geographic location and population sizes. The population, geographic location and the average high cost multiple (AHCM) of the nine states are presented in Figure 3.2.1.
Figure 3.2.1 Characteristics of States Selected for Qualitative Study
Source: AHCM data were obtained from the UI Data Summary, produced by the Em-ployment and Training Administration of the USDOL. Population estimates were ob-tained from the US Bureau of Census.
Among the states with low solvency levels, Minnesota, with an AHCM of 0.35
was selected for further study. Among the twenty states with AHCM between 0.5 and 1, Ohio, Michigan and
Washington were selected for further study:
8 The Average High Cost Multiple is defined by the U.S. Department of Labor as the calendar year reserve ratio (or trust fund
balance as a percent of total covered wages) divided by the Average High Cost Rate. The Average High Cost Rate is the average of the three highest calendar year benefit cost rates in the last 20 years (or a period including three recessions, if longer). Benefit cost rates are benefits paid (excluding reimbursable benefits) as a percent of total wages in covered em-ployment. See U.S. Department of Labor, Office of Workforce Security, Division of Fiscal and Actuarial Services, UI Data Summary, 1st Quarter CY 2002, June 2002.
9 There is no general agreement on a standard level for a state’s AHCM at the beginning of a recession. Some analysts have argued for an AHCM standard as high as 1.5.
State Region AHCM (Quarter 1, 2002) Population (Jul-2001)Minnesota Midwest <0.5 4,972,294 Ohio Midwest 0.5<AHCM<1.0 11,373,541 Michigan Midwest 0.5<AHCM<1.0 9,990,817 Washington West 0.5<AHCM<1.0 5,987,973 New Jersey Northeast >1.0 8,484,431 Virginia South >1.0 7,187,734 Louisiana South >1.0 4,465,430 Iowa Midwest >1.0 2,923,179 Montana West >1.0 904,433
Assessment of the Impact of the 2002 Reed Act Distribution
Center for Employment Security Education and Research 45
o A detailed study of states such as Ohio was to provide valuable insight in understanding the education, community mobilization and policy implica-tions of state-level actions10. For example, elements such as the use of funds to provide additional ES (e.g., counseling, job search workshops, job developers) to UI claimants and keeping the local state workforce agency offices open within the Ohio’s one-stop delivery system were ex-amined.
o Michigan appropriated $213 million of its Reed Act funds on ES improve-ments such as investments on one-stop center operations and facilities.
o Washington decided not to spend any Reed Act funds immediately, but submitted proposals for 2003-2004. It had proposed to make sweeping changes in UI, which would change the way employers are charged un-employment insurance taxes and how claimants qualify for benefits. Washington was also characterized by high unemployment rates and general state-level budgetary challenges.
Among the twenty-three states with AHCM>1, Iowa, Virginia, Louisiana, New
Jersey and Montana were selected as case studies: o Iowa proposed to redesign its tax and benefit system and invest in its one-
stop system infrastructure. o Virginia was considered important to study because of the impact of the
terrorist attacks on September 11, 2001. Virginia retained $184 million of its $214.9 million Reed Act distribution in its trust fund account. This helped the state avoid a potential 0.2 percentage point automatic increase in its UI tax11 rate.
o Louisiana retained 65% of its Reed Act distribution in its trust fund and appropriated the rest for ES and UI administration improvements.
o New Jersey enhanced ES delivery in its one-stops and job seeking/labor market capabilities.
o Montana plans on retiring over the next five years $5.9 million in debt in-curred to modernize its UI program. It appropriated $4.6 million to substi-tute for funds that would have derived from its Administrative Fund Tax (AFT) that were reallocated to various training programs12.
The criteria for selecting these states were discussed and the list of states was made final with the USDOL meeting on April 25, 2003.
3.2.2 Case Study Approach The objective of the case studies was to gain an understanding of the impact of the Reed Act distribution by interviewing key individuals at the state workforce agencies and 10 Process Evaluation Design, prepared by Booz Allen Hamilton for CESER 11 Ibid 12 How are states using their $8 billion Reed Act Funds? Report prepared by NASWA, January 2003
Assessment of the Impact of the 2002 Reed Act Distribution
Center for Employment Security Education and Research 46
other stakeholders. The case studies were conducted by having the selected states validate our analysis13 of their use of Reed Act funds. This validation was performed via telephone interviews for each of the nine states. The interviews were conducted from June through July of 2003. The research team used a three-step process to ensure rigor and to reduce the likeli-hood of bias that a qualitative approach can introduce. In addition the team provided the states an opportunity to review and comment on the final case narratives. Our hope is that this should produce a fair and accurate representation of the issues surrounding the states' process for planning Reed Act spending. The three steps in our case study approach were as follows:
Step 1: Establishing an information base The first step was to establish an information base of the key individuals to be in-terviewed and conducting background research on each state. The specific tasks in Step 1 included:
Identifying key individuals at state workforce agencies and stakeholders. The individuals were identified with the help of the NASWA survey and by contacting the state workforce agencies
Conducting research on each state using publicly available information14 and analyzing the state’s use of its Reed Act funds
Using publicly available information, the team completed the interview guide developed for the telephone interview
Step 2: Conducting the telephone interview The second step was to collect new information from the states and have them validate the information that we provided. These interviews were conducted by telephone. The telephone interviews were held in confidence, and any informa-tion obtained through the interviewing process was treated anonymously. Step 3: Documenting information The third step consisted of documenting the information obtained from the case studies and sending it to the states for re-verification.
13 Booz Allen Hamilton and CESER’s analysis of state data based on publicly available information such as (1) the GAO
report on Unemployment Insurance, March 2003, (2) testimonies by Louisiana and Ohio on their use of Reed Act Distribu-tions, submitted to the Committee on Ways and Means, March 2003 and (3) the NASWA Survey on the Reed Act Distribu-tion, January 17, 2003
14 Publicly available information such as (1) the GAO report on Unemployment Insurance, March 2003, (2) testimonies by Louisiana and Ohio on their use of Reed Act Distributions, submitted to the Committee on Ways and Means, March 2003 and (3) the NASWA Survey on the Reed Act Distribution, January 17, 2003 is used throughout this analysis
Assessment of the Impact of the 2002 Reed Act Distribution
Center for Employment Security Education and Research 47
The information thus obtained was analyzed and a comparative analysis across states was conducted. The state level analysis includes (a) a description of how each state spent the Reed Act funds, (b) programs and policy variations across states, and (c) policy recommendations. The analysis of the case study inter-views is presented in section III, and the complete case narrative in section IV.
3.3 THEMES AND OBSERVATIONS FROM THE STATE INTERVIEWS 3.3.1 Introduction The purpose of this section is to highlight the themes and key observations that the team identified during the case interview process. As such, this section presents the analysis of the overall impact the Reed Act distribution had on these states. This com-pare and contrast approach, although it does not substitute for a thorough reading of the individual state narratives, provides the reader with a way of understanding the impact of the Reed Act distribution. The reader should be cautious in drawing broad conclusions from this qualitative evaluation about the likely impact of the Reed Act distribution in other states. However, the team anticipates that where there is great agreement among the states in their re-sponses, it may indicate a general trend that the policy maker may care to consider in future policy formulation. The interviews with the nine states introduced a number of themes. In some cases, these themes were of interest primarily to the state involved, but some have broader applicability. Among the themes that we will discuss in this section, and illustrate with specific observations and tabular or graphic analysis, is the one-time nature of the Reed Act Distribution. Also, we will examine the economic stimulus impact that states con-sidered the Reed Act Distribution to have. Other themes include an overview of how states have chosen to use the Reed Act funds, the process used for developing and in-troducing the Reed Act proposals, and the impact the distribution may have on tax schedules in states. For a more detailed treatment of individual states we have in-cluded the complete case narrative of each state below. 3.3.2 Summary characteristics of the states The nine states interviewed represent different demographic characteristics and geo-graphic locations. We also see a wide range of characteristics when we examine the states against key trust fund and other UI data. The Reed Act distribution the states received ranged from just under $19 million for Montana to $343 million for Ohio, and an average of about $181 million. The range of trust fund balances and AHCMs also differed significantly. Minnesota had the lowest AHCM of .35, while Montana had an AHCM of 1.39. Other data provide further evi-dence about the heterogeneity of the states interviewed. The Average Weekly Benefit Amount (AWBA) ranges from just under $200 in Louisiana to over $320 in Minnesota,
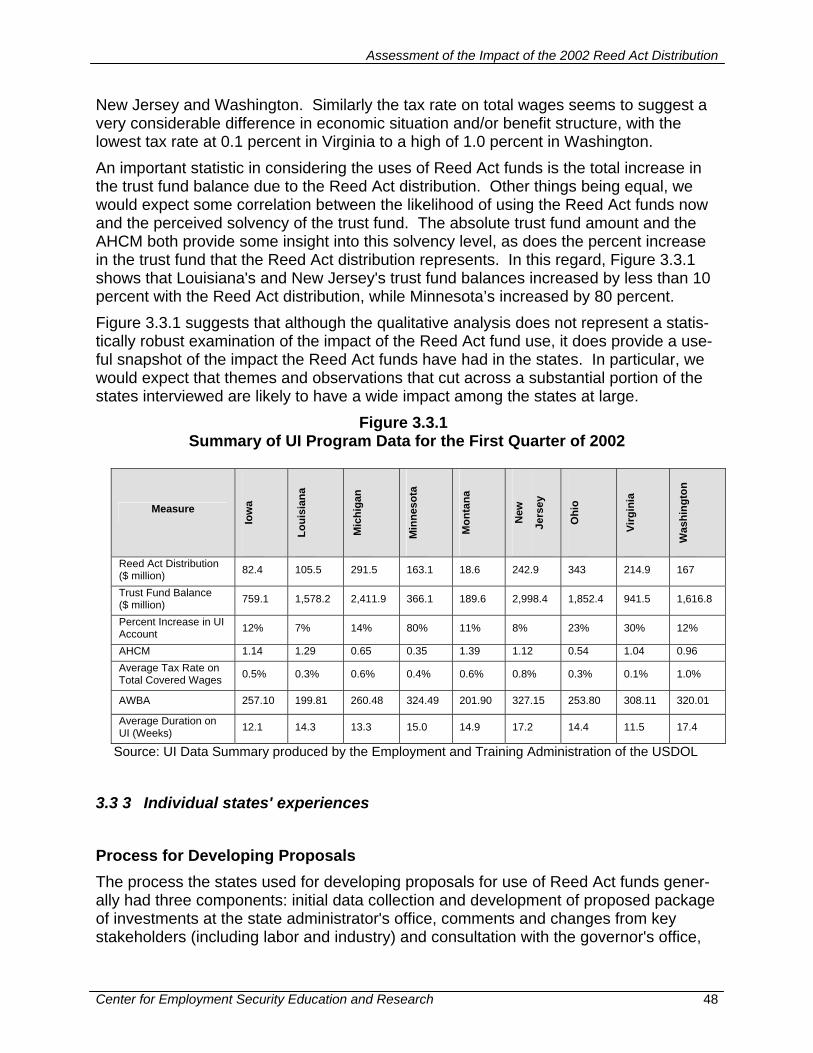
Assessment of the Impact of the 2002 Reed Act Distribution
Center for Employment Security Education and Research 48
New Jersey and Washington. Similarly the tax rate on total wages seems to suggest a very considerable difference in economic situation and/or benefit structure, with the lowest tax rate at 0.1 percent in Virginia to a high of 1.0 percent in Washington. An important statistic in considering the uses of Reed Act funds is the total increase in the trust fund balance due to the Reed Act distribution. Other things being equal, we would expect some correlation between the likelihood of using the Reed Act funds now and the perceived solvency of the trust fund. The absolute trust fund amount and the AHCM both provide some insight into this solvency level, as does the percent increase in the trust fund that the Reed Act distribution represents. In this regard, Figure 3.3.1 shows that Louisiana's and New Jersey's trust fund balances increased by less than 10 percent with the Reed Act distribution, while Minnesota’s increased by 80 percent. Figure 3.3.1 suggests that although the qualitative analysis does not represent a statis-tically robust examination of the impact of the Reed Act fund use, it does provide a use-ful snapshot of the impact the Reed Act funds have had in the states. In particular, we would expect that themes and observations that cut across a substantial portion of the states interviewed are likely to have a wide impact among the states at large.
Figure 3.3.1 Summary of UI Program Data for the First Quarter of 2002
Measure
Iow
a
Loui
sian
a
Mic
higa
n
Min
neso
ta
Mon
tana
New
Jers
ey
Ohi
o
Virg
inia
Was
hing
ton
Reed Act Distribution ($ million) 82.4 105.5 291.5 163.1 18.6 242.9 343 214.9 167
Trust Fund Balance ($ million) 759.1 1,578.2 2,411.9 366.1 189.6 2,998.4 1,852.4 941.5 1,616.8
Percent Increase in UI Account 12% 7% 14% 80% 11% 8% 23% 30% 12%
AHCM 1.14 1.29 0.65 0.35 1.39 1.12 0.54 1.04 0.96 Average Tax Rate on Total Covered Wages 0.5% 0.3% 0.6% 0.4% 0.6% 0.8% 0.3% 0.1% 1.0%
AWBA 257.10 199.81 260.48 324.49 201.90 327.15 253.80 308.11 320.01
Average Duration on UI (Weeks) 12.1 14.3 13.3 15.0 14.9 17.2 14.4 11.5 17.4
Source: UI Data Summary produced by the Employment and Training Administration of the USDOL
3.3 3 Individual states' experiences Process for Developing Proposals The process the states used for developing proposals for use of Reed Act funds gener-ally had three components: initial data collection and development of proposed package of investments at the state administrator's office, comments and changes from key stakeholders (including labor and industry) and consultation with the governor's office,
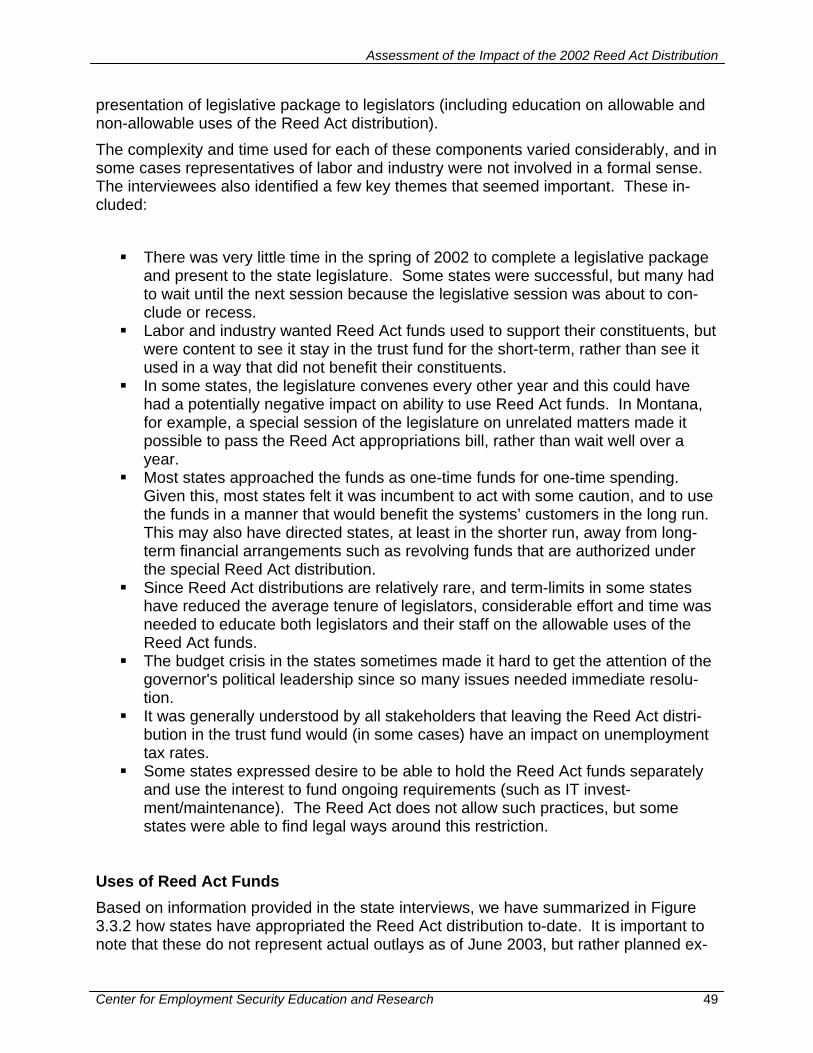
Assessment of the Impact of the 2002 Reed Act Distribution
Center for Employment Security Education and Research 49
presentation of legislative package to legislators (including education on allowable and non-allowable uses of the Reed Act distribution). The complexity and time used for each of these components varied considerably, and in some cases representatives of labor and industry were not involved in a formal sense. The interviewees also identified a few key themes that seemed important. These in-cluded:
There was very little time in the spring of 2002 to complete a legislative package and present to the state legislature. Some states were successful, but many had to wait until the next session because the legislative session was about to con-clude or recess.
Labor and industry wanted Reed Act funds used to support their constituents, but were content to see it stay in the trust fund for the short-term, rather than see it used in a way that did not benefit their constituents.
In some states, the legislature convenes every other year and this could have had a potentially negative impact on ability to use Reed Act funds. In Montana, for example, a special session of the legislature on unrelated matters made it possible to pass the Reed Act appropriations bill, rather than wait well over a year.
Most states approached the funds as one-time funds for one-time spending. Given this, most states felt it was incumbent to act with some caution, and to use the funds in a manner that would benefit the systems’ customers in the long run. This may also have directed states, at least in the shorter run, away from long-term financial arrangements such as revolving funds that are authorized under the special Reed Act distribution.
Since Reed Act distributions are relatively rare, and term-limits in some states have reduced the average tenure of legislators, considerable effort and time was needed to educate both legislators and their staff on the allowable uses of the Reed Act funds.
The budget crisis in the states sometimes made it hard to get the attention of the governor's political leadership since so many issues needed immediate resolu-tion.
It was generally understood by all stakeholders that leaving the Reed Act distri-bution in the trust fund would (in some cases) have an impact on unemployment tax rates.
Some states expressed desire to be able to hold the Reed Act funds separately and use the interest to fund ongoing requirements (such as IT invest-ment/maintenance). The Reed Act does not allow such practices, but some states were able to find legal ways around this restriction.
Uses of Reed Act Funds Based on information provided in the state interviews, we have summarized in Figure 3.3.2 how states have appropriated the Reed Act distribution to-date. It is important to note that these do not represent actual outlays as of June 2003, but rather planned ex-

Assessment of the Impact of the 2002 Reed Act Distribution
Center for Employment Security Education and Research 50
penditures (and in some cases appropriations). The obligations and outlays of funds may be subject to further state assembly or executive branch approval, and to the iden-tification of a feasible vendor to deliver the planned investment. There are two key observations that we can draw from this summary table before delv-ing more into the specifics of state plans. Every state plans to invest in the UI system, and no state plans explicit benefit enhancements as a result of the Reed Act distribu-tion. When we examined more closely what states actually said about their plans, a recurring theme was the need to replace out-dated tax and benefit systems, which in many cases date back to the 1970s. The figures that can be seen in Figure 3.3.2 represent current planned investment in UI systems, but in addition a number of states stated that this represented only the first of many planned segments in the enhancement of their UI systems.
Figure 3.3.2 Summary of the Uses of the Reed Act Distribution
(As of June 2003)
Uses of Reed Act funds
($ million)
Iow
a
Loui
sian
a
Mic
higa
n
Min
neso
ta
Mon
tana
New
Jers
ey
Ohi
o
Virg
inia
Was
hing
ton
Employment
Services
20.7
5.8
213
None
7.1
12
19
6.2
None
Unemployment
Insurance
20
20.6
75
12
11.4
24
109
24.7
19.8
Benefits Extension/ /
Enhancement
Other Uses
10
3.5
Trust Fund
40
68.5
151.1
207
216
184
147.2
Total
80.7
104.9
291.5
163.1
18.6
242.9
343
214.9
167
Source: Research Team Case Interviews Note: Numbers may not add up due to rounding errors
In seven of the nine states the planned investment in UI is focused largely on major renovation or replacement of legacy information technology systems. Washington, in addition, is working to enhance work processes in lieu of a major investment in the UI IT systems at this time.
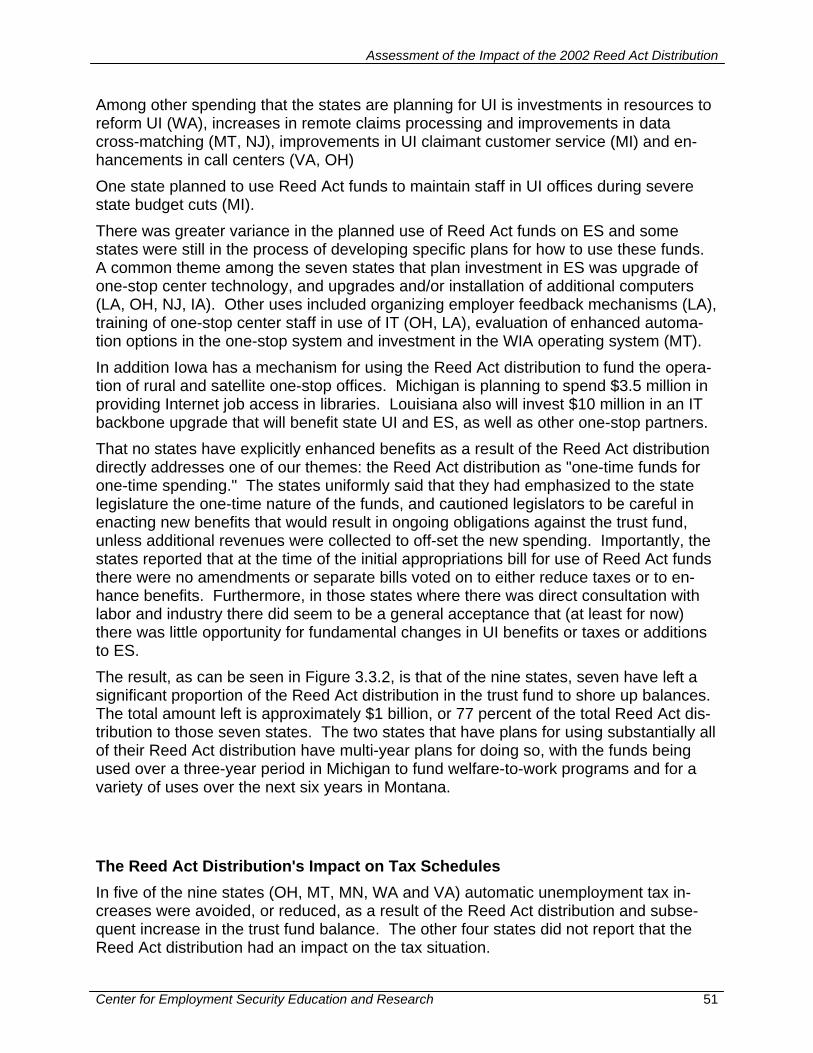
Assessment of the Impact of the 2002 Reed Act Distribution
Center for Employment Security Education and Research 51
Among other spending that the states are planning for UI is investments in resources to reform UI (WA), increases in remote claims processing and improvements in data cross-matching (MT, NJ), improvements in UI claimant customer service (MI) and en-hancements in call centers (VA, OH) One state planned to use Reed Act funds to maintain staff in UI offices during severe state budget cuts (MI). There was greater variance in the planned use of Reed Act funds on ES and some states were still in the process of developing specific plans for how to use these funds. A common theme among the seven states that plan investment in ES was upgrade of one-stop center technology, and upgrades and/or installation of additional computers (LA, OH, NJ, IA). Other uses included organizing employer feedback mechanisms (LA), training of one-stop center staff in use of IT (OH, LA), evaluation of enhanced automa-tion options in the one-stop system and investment in the WIA operating system (MT). In addition Iowa has a mechanism for using the Reed Act distribution to fund the opera-tion of rural and satellite one-stop offices. Michigan is planning to spend $3.5 million in providing Internet job access in libraries. Louisiana also will invest $10 million in an IT backbone upgrade that will benefit state UI and ES, as well as other one-stop partners. That no states have explicitly enhanced benefits as a result of the Reed Act distribution directly addresses one of our themes: the Reed Act distribution as "one-time funds for one-time spending." The states uniformly said that they had emphasized to the state legislature the one-time nature of the funds, and cautioned legislators to be careful in enacting new benefits that would result in ongoing obligations against the trust fund, unless additional revenues were collected to off-set the new spending. Importantly, the states reported that at the time of the initial appropriations bill for use of Reed Act funds there were no amendments or separate bills voted on to either reduce taxes or to en-hance benefits. Furthermore, in those states where there was direct consultation with labor and industry there did seem to be a general acceptance that (at least for now) there was little opportunity for fundamental changes in UI benefits or taxes or additions to ES. The result, as can be seen in Figure 3.3.2, is that of the nine states, seven have left a significant proportion of the Reed Act distribution in the trust fund to shore up balances. The total amount left is approximately $1 billion, or 77 percent of the total Reed Act dis-tribution to those seven states. The two states that have plans for using substantially all of their Reed Act distribution have multi-year plans for doing so, with the funds being used over a three-year period in Michigan to fund welfare-to-work programs and for a variety of uses over the next six years in Montana. The Reed Act Distribution's Impact on Tax Schedules In five of the nine states (OH, MT, MN, WA and VA) automatic unemployment tax in-creases were avoided, or reduced, as a result of the Reed Act distribution and subse-quent increase in the trust fund balance. The other four states did not report that the Reed Act distribution had an impact on the tax situation.
Assessment of the Impact of the 2002 Reed Act Distribution
Center for Employment Security Education and Research 52
The five states where taxes were impacted considered the Reed Act distribution to have an indirect economic stimulus effect as a result of the lower than expected tax rates. The total stimulus impact was believed, however, to be smaller than if the distribution had been spent on enhancing benefits. In Ohio the Reed Act distribution was estimated to have saved employers a total of $45 million in 2003. In Montana the amount was $9 million, in Minnesota it was $80 million. In Virginia, employers saved an estimated $6 per eligible employee, or about $19.3 million. In Washington, the savings per employee were estimated at $235 per employee for a total of $172 million. An interesting issue that relates to the timing of tax collection and the relation to the economic cycle arose in Minnesota. Their taxes were reduced by $80 million while at the same time the trust fund balances approached zero, necessitating the state's bor-rowing from the federal government to maintain the ability of the unemployment insur-ance program to pay benefits More detail on how each of the above issues was addressed in the states can be found in section IV of this report that presents the complete case narrative of the state case interviews.
3.4 SPECIFIC QUESTIONS OF INTEREST Figures 3.4.1 to 3.4.3 provide an insight into how the states responded to specific ques-tions that surround our discussion of the themes. In Figure 3.4.1 we see that two-thirds of the states found the USDOL guidance to be useful. One state found it to be some-what helpful, while two states did not know.
Figure 3.4.1 Value of USDOL Guidance
0 1 2 3 4 5 6 7
Yes
Somewhat
Don't know
Number of States RespondingSource: Research Team Case Interviews
Did you find the USDOL guidance useful?
Figure 3.4.2 shows that in five states there was an explicit process for consulting labor and industry representatives prior to completing the legislative proposals for appropriat-ing the Reed Act funds. Three states did not contact labor or industry, although two of
Assessment of the Impact of the 2002 Reed Act Distribution
Center for Employment Security Education and Research 53
those states said that labor and industry's positions on the issues were clear and had been communicated informally over the months preceding the Reed Act distribution.
Figure 3.4.2
Consultative Legislative Environment
0 1 2 3 4 5 6
Yes
No
Don't know
Number of States RespondingSource: Research Team Case Interviews
Were labor/industry consulted while thelegislative package was being developed?
Figure 3.4.3 shows how states responded specifically to the question of the economic stimulus effect the Reed Act distribution had in their states. Overall six of the nine states reported an economic stimulus impact. Five states responded that the distribu-tion had a non-discretionary stimulating effect in that it either directly resulted in a re-duced tax rate, or avoided an automatic increase in the tax rate as a result of a declin-ing state trust fund balance. Additionally, one state (MI) considered the funds to have had discretionary economic stimulus impact. None of the officials of the five states thought the Reed Act distribution had discretionary economic stimulus impact. In addi-tion three states said that since the Reed Act distribution did not affect the tax rate, and a substantial proportion of the funds were kept in the trust fund, there was no measur-able stimulating impact expected from the Reed Act distribution.
Figure 3.4.3 Evaluation of the impact of the Reed Act funds
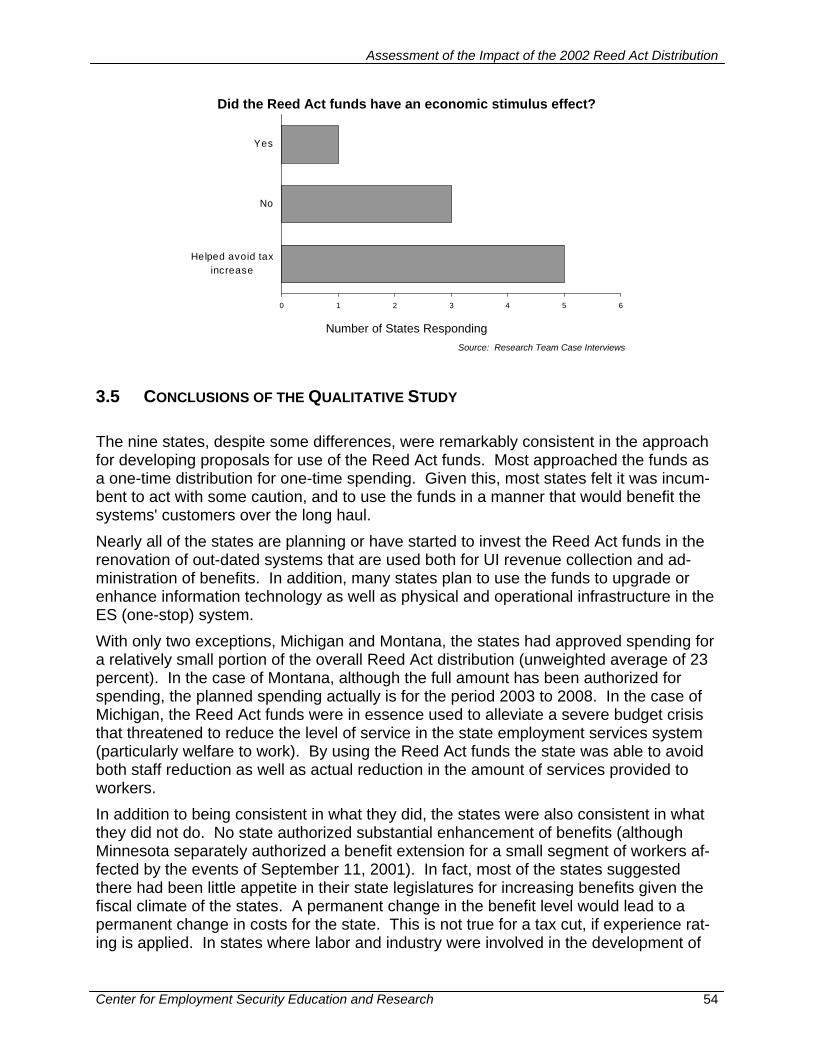
Assessment of the Impact of the 2002 Reed Act Distribution
Center for Employment Security Education and Research 54
0 1 2 3 4 5 6
Yes
No
Helped avoid taxincrease
Number of States RespondingSource: Research Team Case Interviews
Did the Reed Act funds have an economic stimulus effect?
3.5 CONCLUSIONS OF THE QUALITATIVE STUDY The nine states, despite some differences, were remarkably consistent in the approach for developing proposals for use of the Reed Act funds. Most approached the funds as a one-time distribution for one-time spending. Given this, most states felt it was incum-bent to act with some caution, and to use the funds in a manner that would benefit the systems' customers over the long haul. Nearly all of the states are planning or have started to invest the Reed Act funds in the renovation of out-dated systems that are used both for UI revenue collection and ad-ministration of benefits. In addition, many states plan to use the funds to upgrade or enhance information technology as well as physical and operational infrastructure in the ES (one-stop) system. With only two exceptions, Michigan and Montana, the states had approved spending for a relatively small portion of the overall Reed Act distribution (unweighted average of 23 percent). In the case of Montana, although the full amount has been authorized for spending, the planned spending actually is for the period 2003 to 2008. In the case of Michigan, the Reed Act funds were in essence used to alleviate a severe budget crisis that threatened to reduce the level of service in the state employment services system (particularly welfare to work). By using the Reed Act funds the state was able to avoid both staff reduction as well as actual reduction in the amount of services provided to workers. In addition to being consistent in what they did, the states were also consistent in what they did not do. No state authorized substantial enhancement of benefits (although Minnesota separately authorized a benefit extension for a small segment of workers af-fected by the events of September 11, 2001). In fact, most of the states suggested there had been little appetite in their state legislatures for increasing benefits given the fiscal climate of the states. A permanent change in the benefit level would lead to a permanent change in costs for the state. This is not true for a tax cut, if experience rat-ing is applied. In states where labor and industry were involved in the development of
Assessment of the Impact of the 2002 Reed Act Distribution
Center for Employment Security Education and Research 55
the proposals, it appeared that both stakeholders were, at this time, content to have the majority of the Reed Act funds remain in the trust fund, rather than to have it spent im-mediately on either benefit enhancements or discretionary tax reductions. Whether this comfort with having the Reed Act funds remain in the trust fund will con-tinue is hard to estimate. Some indications are, however, that further use of the funds for direct investment in the system is likely. As states have started projects to up-grade/enhance/replace their unemployment insurance legacy applications, and invest in the technology in place in the one-stop centers, it should be considered likely that these projects will require additional spending authorizations before these projects are com-pleted. In fact, some states that were interviewed were explicit in saying that the current authorized spending did not cover the full estimated cost of system renovation, but in-stead was only for an initial segment that was considered to be the greatest need. Additional pressures to spend the Reed Act funds can also be expected if the trust fund balances in the states stop their current decline as a result of improved economic condi-tions. In the event the trust funds become considerably more robust, pressures for tax reduction and/or benefit enhancements are likely to reemerge, and possibly with greater resonance in the state legislatures. Given the above conclusions, it is not surprising that the states indicated that they did not consider the Reed Act distribution had, per se, a substantial discretionary economic stimulus impact. Only Michigan (which has already appropriated its full Reed Act distri-bution) considered the distribution to have had a stimulating effect, outside of the indi-rect stimulus impact of staving off (or reducing) unemployment tax increases that was noted by five of the nine states. Another issue to consider is that it seems likely that the bulk of the Reed Act distribution will, instead of being spent as a counter-cyclical economic stimulus, be expended during years of relative solvency and stability in the trust fund. However, an unfunded policy goal of some standing, i.e., the funding of the UI and ES infrastructure systems, has been partially achieved. The tax reduction in 2003 and 2004 thus likely had a more pro-found and immediate stimulus impact than did discretionary (i.e., appropriated) spend-ing of the Reed Act distribution. This brings us to two key considerations that the team observed from the case inter-views. The first one is, the states report, that the lack of sufficient capital budgeting in the annual unemployment insurance administrative funding model is causing a wide spread lack of funding to maintain and renew the systems that are necessary to deliver unemployment insurance in today's environment. A consideration here, since substan-tially all the states used the Reed Act distribution or performance and capital improve-ment grants (PCIs) to fund IT system renovation, is whether the Reed Act mechanism is appropriate to the task of incrementally funding information technology, an item that re-quires ongoing evaluation, maintenance and upgrading. The second key consideration is how the structure of the Reed Act distribution may sys-tematically favor tax cuts over benefit increases. This follows logically from observing that a cut in the base rate of unemployment taxes will only result in a temporary rate cut if rates go below the level needed to maintain the trust fund level (i.e., the experience rating mechanism will result in a gradual increase in the tax rate to maintain trust fund
Assessment of the Impact of the 2002 Reed Act Distribution
Center for Employment Security Education and Research 56
balance). Moreover, there is no need to explicitly repeal the tax cut, as the schedules tend to adjust themselves. A benefit increase, however, is permanent and taxes will have to increase indefinitely to support it (either directly or through the solvency adjust-ment mechanism inherent in the use of escalating tax-rate tables as TFB decreases). Of course there are examples of temporary benefit extensions, however, based on the interviews with the states, there appeared to be a perception that large-scale benefit in-creases, even when initially intended to be temporary, rarely were repealed, or failed to be renewed. 3.6 COMPLETE STATE INTERVIEWS The following pages provide the complete case interviews of the nine states that the re-search team worked with. Each of these interview has been verified by the individuals interviewed. A copy of the interview guide can be found in Attachment D.
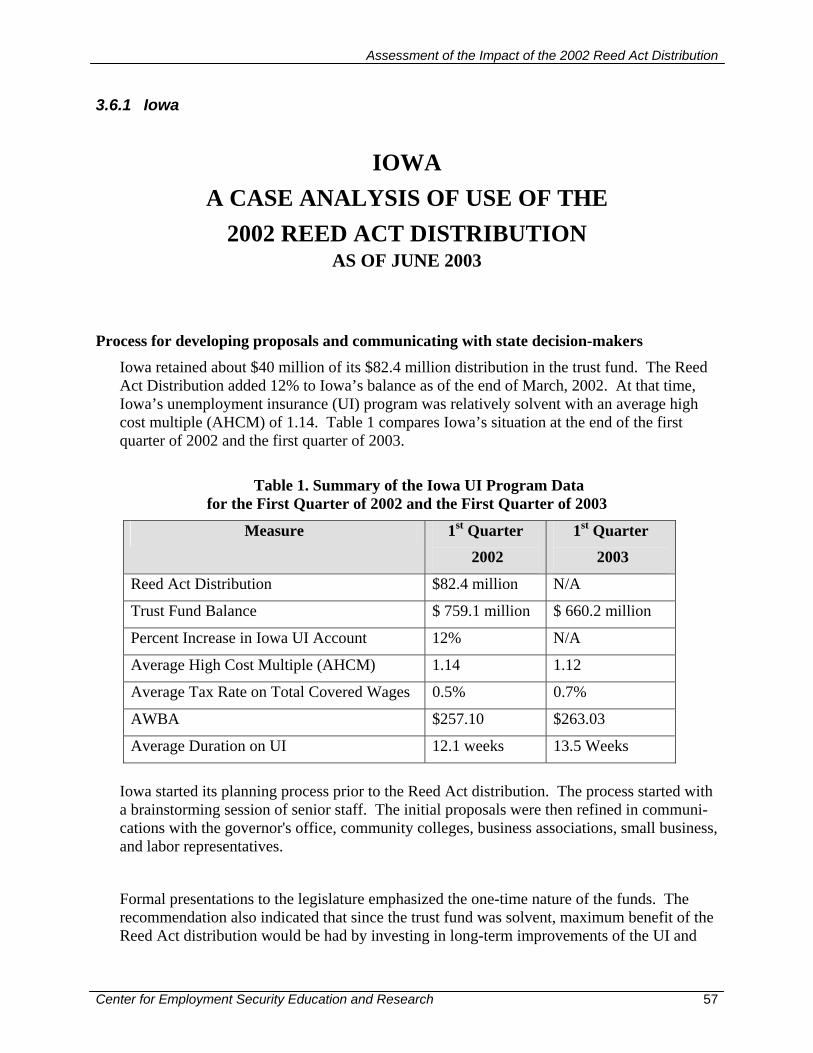
Assessment of the Impact of the 2002 Reed Act Distribution
Center for Employment Security Education and Research 57
3.6.1 Iowa
IOWA A CASE ANALYSIS OF USE OF THE
2002 REED ACT DISTRIBUTION AS OF JUNE 2003
Process for developing proposals and communicating with state decision-makers Iowa retained about $40 million of its $82.4 million distribution in the trust fund. The Reed Act Distribution added 12% to Iowa’s balance as of the end of March, 2002. At that time, Iowa’s unemployment insurance (UI) program was relatively solvent with an average high cost multiple (AHCM) of 1.14. Table 1 compares Iowa’s situation at the end of the first quarter of 2002 and the first quarter of 2003.
Table 1. Summary of the Iowa UI Program Data
for the First Quarter of 2002 and the First Quarter of 2003
Measure 1st Quarter
2002
1st Quarter
2003
Reed Act Distribution $82.4 million N/A
Trust Fund Balance $ 759.1 million $ 660.2 million
Percent Increase in Iowa UI Account 12% N/A
Average High Cost Multiple (AHCM) 1.14 1.12
Average Tax Rate on Total Covered Wages 0.5% 0.7%
AWBA $257.10 $263.03
Average Duration on UI 12.1 weeks 13.5 Weeks
Iowa started its planning process prior to the Reed Act distribution. The process started with a brainstorming session of senior staff. The initial proposals were then refined in communi-cations with the governor's office, community colleges, business associations, small business, and labor representatives.
Formal presentations to the legislature emphasized the one-time nature of the funds. The recommendation also indicated that since the trust fund was solvent, maximum benefit of the Reed Act distribution would be had by investing in long-term improvements of the UI and
Assessment of the Impact of the 2002 Reed Act Distribution
Center for Employment Security Education and Research 58
ES systems. Especially, legislators were educated about the antiquated condition of the UI tax system (which dated back to 1971).
A part of the communications process to business was to show how an investment in the in-formation technology (IT) infrastructure would provide a direct interface to the new UI tax system and a major upgrade in the infrastructure for the claims system.
Although there was pressure from the employer community to cut taxes, the solvency prob-lems of the neighboring states (such as Minnesota and Missouri), discouraged the proponents of tax cuts from pursuing them.
In general the guidance from USDOL was found to be appropriate and helpful, especially in helping focus legislators on how the Reed Act funds could be used. However, not being able to use the interest earned on the Reed Act dollars for an ongoing source of funding for IT was seen as too limiting, as such a source of revenue could help ensure IT investments were maintained at appropriate functionality and readiness levels.
Use of Reed Act funds on ES and UI Iowa appropriated approximately $20.7 million in ES and the enhanced service to claimants. The thrust of the investments is to upgrade infrastructure and enhance the IT infrastructure for one-stops centers and labor exchange services. This includes making on-line UI claims possible in the one-stops and intensive services for UI claimants in the labor exchange arena. Funds have not yet been appropriated for the labor exchange effort. In addition, staff will be provided with new computers to enhance their effectiveness in assisting clients. Overall it is expected that this investment will increase productivity, while at the same time reduce IT maintenance costs.
The Reed Act funds also served to help the state shore up funding for and maintain operation of 52 of its 71 satellite one-stop offices via a special funding arrangement. In essence, the state legislature extended a temporary employer surcharge of $7 per employee for 2 ½ years to finance Iowa’s satellite one-stop offices until a permanent working capital fund accumu-lates sufficient revenue to produce the necessary interest for operation of the satellite one-stop offices. Reed Act funds were used to leverage the arrangement by being placed in the trust fund for the payment of benefits.
The working capital fund will not be encumbered by the rules restricting the spending of in-terest that govern the Reed Act funds. Iowa officials stated that this funding mechanism has been accepted by the USDOL.
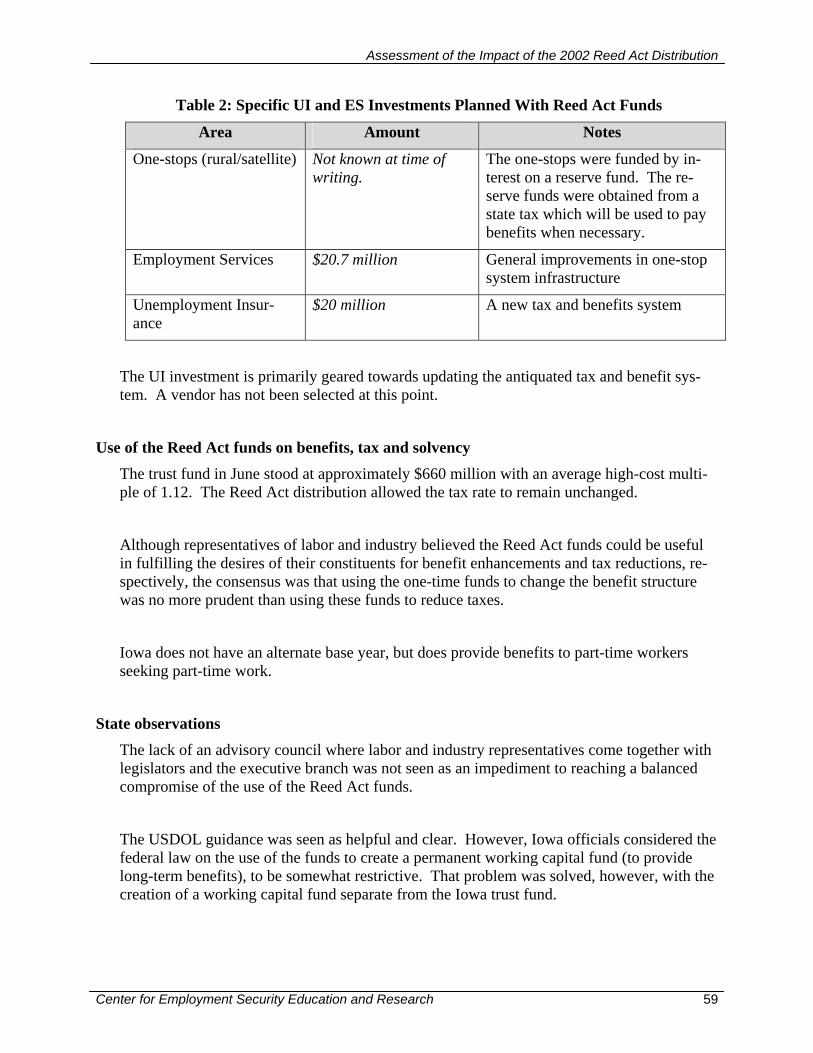
Assessment of the Impact of the 2002 Reed Act Distribution
Center for Employment Security Education and Research 59
Table 2: Specific UI and ES Investments Planned With Reed Act Funds
Area Amount Notes
One-stops (rural/satellite) Not known at time of writing.
The one-stops were funded by in-terest on a reserve fund. The re-serve funds were obtained from a state tax which will be used to pay benefits when necessary.
Employment Services $20.7 million General improvements in one-stop system infrastructure
Unemployment Insur-ance
$20 million A new tax and benefits system
The UI investment is primarily geared towards updating the antiquated tax and benefit sys-tem. A vendor has not been selected at this point.
Use of the Reed Act funds on benefits, tax and solvency The trust fund in June stood at approximately $660 million with an average high-cost multi-ple of 1.12. The Reed Act distribution allowed the tax rate to remain unchanged.
Although representatives of labor and industry believed the Reed Act funds could be useful in fulfilling the desires of their constituents for benefit enhancements and tax reductions, re-spectively, the consensus was that using the one-time funds to change the benefit structure was no more prudent than using these funds to reduce taxes.
Iowa does not have an alternate base year, but does provide benefits to part-time workers seeking part-time work.
State observations The lack of an advisory council where labor and industry representatives come together with legislators and the executive branch was not seen as an impediment to reaching a balanced compromise of the use of the Reed Act funds.
The USDOL guidance was seen as helpful and clear. However, Iowa officials considered the federal law on the use of the funds to create a permanent working capital fund (to provide long-term benefits), to be somewhat restrictive. That problem was solved, however, with the creation of a working capital fund separate from the Iowa trust fund.
Assessment of the Impact of the 2002 Reed Act Distribution
Center for Employment Security Education and Research 60
3.6.2 Louisiana
LOUISIANA A CASE ANALYSIS OF THE USE
OF THE 2002 REED ACT DISTRIBUTION AS OF JUNE 2003
Process for developing proposals and communicating with state decision-makers
Louisiana received a $105 million Reed Act Distribution. The Reed Act Distribution added 7% to Louisiana’s balance as of the end of March, 2002. At that time, Louisiana’s unem-ployment insurance (UI) program was relatively solvent, with an average high cost multiple (AHCM) of 1.29 and relatively low taxes. Table 1 compares Louisiana’s situation at the end of the first quarter of 2002 and the first quarter of 2003.
Table 1. Summary of the Louisiana UI Program Data
for the First Quarter of 2002 and the First Quarter of 2003
Measure 1st Quarter
2002
1st Quarter
2003
Reed Act Distribution $105.5 million N/A
Trust Fund Balance $1,578.2 million $1,512.3 million
Percent Increase in Louisiana UI Account 7% N/A
Average High Cost Multiple (AHCM) 1.29 1.32
Average Tax Rate on Total Covered Wages
0.3% 0.4%
AWBA $199.81 $197.04
Average Duration on UI 14.3 Weeks 16.1 Weeks
In response to the Reed Act distribution the state administrator of the Louisiana Department of Labor held a retreat with executive staff in the end of March 2002 to discuss proposals to the legislature for how to use the Reed Act funds. In lieu of final guidance from USDOL, the group used prior Reed Act guidance to develop their proposals.
Assessment of the Impact of the 2002 Reed Act Distribution
Center for Employment Security Education and Research 61
Once the initial proposals were developed, the state administrator's office reached out to key stakeholders to vet the recommendations, and to gain insight into how the employer, em-ployee and political stakeholders believed the Reed Act funds should be used. These ses-sions included representatives from Louisiana Association of Business & Industry, the AFL-CIO and the regional USDOL office. The USDOL was consulted to check whether the pro-posal was in compliance. The state administrator's office also met with key legislators.
A complicating factor in Louisiana was the pending appointment of a new state administrator on April 25th. However, the work on developing the proposals was not delayed, as staff in the office understood the importance of preparing a legislative package for Louisiana's 2002 regular legislative session (meets on even numbered years).
Once the governor's office had reviewed and agreed with the proposed legislative package, it was presented and passed by the legislature. The 60-day session adjourned on June 23rd, only a week after the final USDOL guidance on allowable uses of the Reed Act funds came out. The view of the interviewees was that with more time and a more favorable economic climate, it is likely that more heated discussion about spending of the Reed Act funds on ad-ministration would have taken place. As it was, however, there was general agreement that a substantial proportion of the distribution should stay in the trust fund.
Use of the Reed Act funds on ES and UI A total of $10 million of the Reed Act funds was used to shore up aging technology systems. Projects include replacement of about 700 computer workstations in the local offices, expan-sion of imaging system to local offices, upgrading of interactive voice response system to be web enabled, and substantial network enhancements to accommodate additional traffic.15
Louisiana invested $20.6 million in UI Administration, plus a share of this $10 million IT backbone investment. The $20.6 million is for the first useful segment of a major tax and benefit system upgrade. The primary aim of this upgrade is to improve service delivery and accountability and to enhance functionality of a system that dates from the 1970s, and was last upgraded in 1985. A much anticipated improvement is increased benefit payment accu-racy16. Louisiana’s proposal is to move to an “object oriented” programming environment and enterprise wide relational database with access through a browser or portal17.
At the time of our interview, Louisiana was working with the Information Technology Sup-port Center (ITSC) to develop an RFP for vendor selection of this multi-year undertaking.
15 Testimony on State Use of Reed Act Distributions by Dawn Romero Watson, Secretary, Louisiana Department of Labor,
March 20, 2003 16 How are States Using Their $8 Billion Reed Act Funds? Survey conducted by CESER, January 17, 2003 17 Testimony on State Use of Reed Act Distributions by Dawn Romero Watson, Secretary, Louisiana Department of Labor,
March 20, 2003
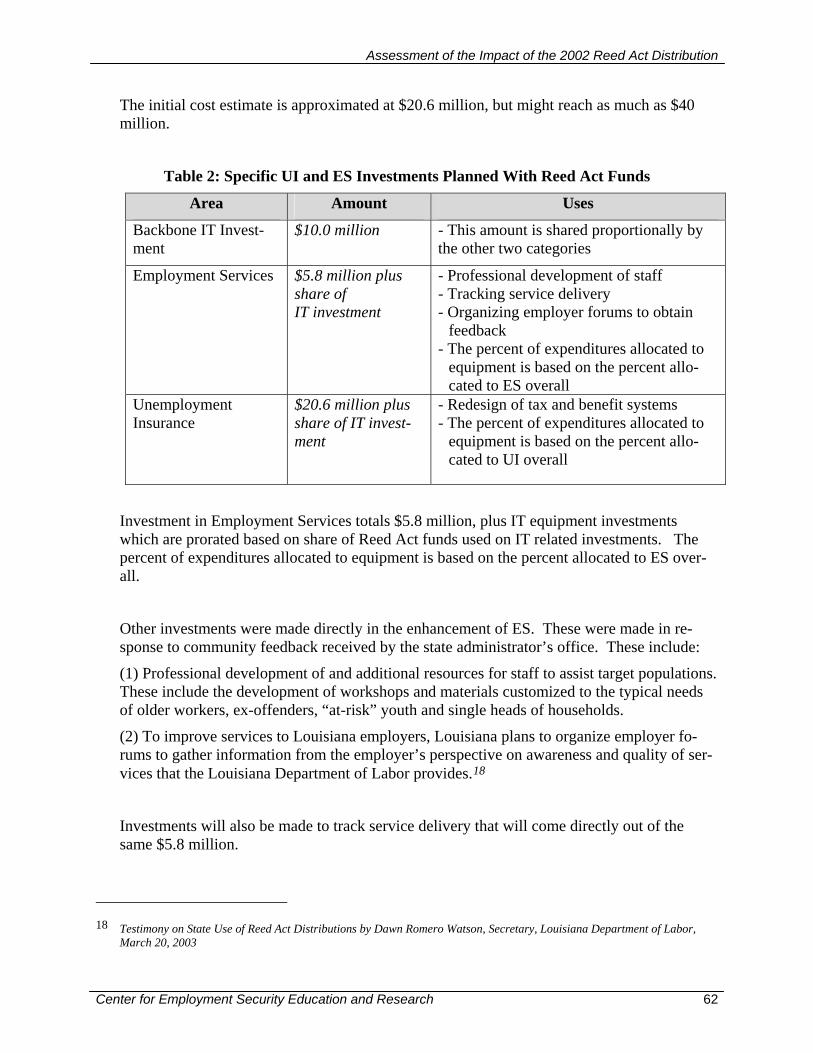
Assessment of the Impact of the 2002 Reed Act Distribution
Center for Employment Security Education and Research 62
The initial cost estimate is approximated at $20.6 million, but might reach as much as $40 million.
Table 2: Specific UI and ES Investments Planned With Reed Act Funds
Area Amount Uses
Backbone IT Invest-ment
$10.0 million - This amount is shared proportionally by the other two categories
Employment Services $5.8 million plus share of IT investment
- Professional development of staff - Tracking service delivery - Organizing employer forums to obtain
feedback - The percent of expenditures allocated to
equipment is based on the percent allo-cated to ES overall
Unemployment Insurance
$20.6 million plus share of IT invest-ment
- Redesign of tax and benefit systems - The percent of expenditures allocated to
equipment is based on the percent allo-cated to UI overall
Investment in Employment Services totals $5.8 million, plus IT equipment investments which are prorated based on share of Reed Act funds used on IT related investments. The percent of expenditures allocated to equipment is based on the percent allocated to ES over-all.
Other investments were made directly in the enhancement of ES. These were made in re-sponse to community feedback received by the state administrator’s office. These include:
(1) Professional development of and additional resources for staff to assist target populations. These include the development of workshops and materials customized to the typical needs of older workers, ex-offenders, “at-risk” youth and single heads of households.
(2) To improve services to Louisiana employers, Louisiana plans to organize employer fo-rums to gather information from the employer’s perspective on awareness and quality of ser-vices that the Louisiana Department of Labor provides.18
Investments will also be made to track service delivery that will come directly out of the same $5.8 million.
18 Testimony on State Use of Reed Act Distributions by Dawn Romero Watson, Secretary, Louisiana Department of Labor,
March 20, 2003

Assessment of the Impact of the 2002 Reed Act Distribution
Center for Employment Security Education and Research 63
Specific investments were also made in the labor exchange system. These included a direct investment in making computers and other equipment ADA19 compatible, as well as training staff in ADA compliance.
Use of the Reed Act funds on benefits, tax and solvency Louisiana's decided to keep approximately $68.5 million of the Reed Act funds in the trust fund. In part this may reflect the short time for developing proposals, and in part it may re-flect a desire to not cause either labor or industry to infer funds were being expended in favor of one stakeholder group over another. The Louisiana trust fund was robust at the time of the Reed Act distribution, with an AHCM of 1.29, and a balance of approximately $1.5 billion. However, an automatic tax increase/benefit reduction trigger is set at approximately $1.4 bil-lion. With the annual tax compilation date for the upcoming year set for June 30, leaving $68.5 million of the Reed Act distribution in the trust fund provided an extra cushion for the coming two years to guard against an automatic tax increase or benefit cut. The state esti-mated that the Reed Act distribution did not have any impact on tax rates for either tax years 2003 and 2004.
State observations The Louisiana state administrator's office noted they would have wanted more time to plan their proposal, and that it required more time to think from a long-term strategic perspective. Louisiana also noted that there was a need to think strategically to make short or long-term investments with the “one-time” dollars.
With respect to the USDOL guidance, it is important to reconsider cost allocation to IT infra-structure upgrades and the ripple effect on smaller programs. For example, small programs with a fixed budget may not be able to pay 'fair share' of IT costs agreed under the Memo-randum of Understanding (MOU) established for participation in the one-stop. This can have the effect of either pushing them out of the one-stop, or forcing them to discontinue the pro-gram's service delivery
19 Americans with Disabilities Act

Assessment of the Impact of the 2002 Reed Act Distribution
Center for Employment Security Education and Research 64
3.6.3 Michigan
MICHIGAN A CASE ANALYSIS OF THE USE OF THE
2002 REED ACT DISTRIBUTION AS OF JUNE 2003
Process for developing proposals and communicating with state decision-makers Michigan received a $291.5 million Reed Act distribution. The Reed Act Distribution added 14% to Michigan’s balance as of the end of March, 2002. At that time, Michigan’s unem-ployment insurance (UI) program had an average high cost multiple (AHCM) 0f 0.65. Table 1 compares Michigan’s situation at the end of the first quarter of 2002 and the first quarter of 2003.
Table 1. Summary of the Michigan UI Program Data for the First Quarter of 2002 and the First Quarter of 2003
Measure 1st Quarter
2002
1st Quarter
2003
Reed Act Distribution $291.5 million N/A
Trust Fund Balance $2411.9 million $1,555.3
Percent Increase in Michigan UI Account 14% N/A
Average High Cost Multiple (AHCM) 0.65 0.53
Average Tax Rate on Total Covered Wages
0.6%
Not available
AWBA $260.48 $290.18
Average Duration on UI 13.3 Weeks 14.8 Weeks
The Michigan Office of Budget examined all the Reed Act issues and the types of expendi-tures that would be allowable under the DOL guidance. It narrowed the list to the types of expenditures that could be funded as a part of a supplemental appropriation.
Steps were taken to educate stakeholders and policy makers about Reed Act funding. The Governor’s representatives were provided with information from the Act as well as the DOL

Assessment of the Impact of the 2002 Reed Act Distribution
Center for Employment Security Education and Research 65
guidance. There were a number of suggestions for improvements in services and discussions about changing the benefit structure.
A number of legislative issues were contested. There was strong support from worker advo-cates to increase benefits, while the business community wanted to retain the Reed Act dis-tribution in the trust fund to improve solvency and avoid potential tax increases. Michigan stated that the state budget crisis was the most influential factor in deciding how the Reed Act funds were appropriated.
Uses of the Reed Act funds on ES and UI Michigan appropriated $213.0 million for the ES program and $75 million for the UI pro-gram. Table 1 summarizes the uses of the Reed Act funds:
Table 2: Specific UI and ES Investments Planned With Reed Act Funds
The $213 million appropriated for ES are to be invested on one-stop center operations, facili-ties, and data system improvements, welfare-to-work job search and readiness activities, an Internet based career search portal, and software and information technology.
A total of $30 million of the $75 million UI funds are planned to substitute for Penalty & In-terest funds. The remainder will be spent on making upgrades to benefit administration, in-cluding the installation of three call centers. A portion of the Reed Act funds will be spent on rehiring some staff.
Area Amount Uses
Employment Services
Internet job access
$213.0 million
$3.5 million
One-stop center operations, welfare-to-work job search and readiness activities and infor-mation technology Internet job access in libraries
Unemployment Insurance $75.0 million
Updates to computer software to improve customer service for UI claimants and support for unemployment agency op-erations
Assessment of the Impact of the 2002 Reed Act Distribution
Center for Employment Security Education and Research 66
Use of the Reed Act funds on benefits, tax and solvency The Reed Act funds did not have any effect on UI taxes. Benefits were enhanced before the Reed Act distribution, but the distribution did not have an impact on that action as the maxi-mum weekly benefit amount increased in 2001.
The state of the economy was foremost in debate because of the recession. Services to wel-fare recipients were expanded. A total of $182 million was used to support the welfare-to-work program over 3 years.
State observations Michigan found the initial DOL guidance to be useful. However, state officials observed that federal law limits the use of the funds that could have used for other purposes and that have been allowed in the past. For example, it stated that the funds should have been allowed to provide transportation to users of the ES and one-stop services, as they were under Wagner-Peyser Act grants20.
20 USDOL has provided the clarification that there is no inherent difference between Wagner-Peyser Act funds and Reed Act
funds, and that transportation expenses are allowable only to help beneficiaries receive Wagner-Peyser services, but not for training or employment.

Assessment of the Impact of the 2002 Reed Act Distribution
Center for Employment Security Education and Research 67
3.6.4 Minnesota
MINNESOTA A CASE ANALYSIS OF USE
OF THE 2002 REED ACT DISTRIBUTION AS OF JUNE 2003
Process for developing proposals and communicating with state decision-makers
Minnesota received a $163.1 million Reed Act Distribution. The Reed Act Distribution added 45% to Minnesota’s balance as of the end of March, 2002. At that time, Minnesota had a relatively low average high cost multiple (AHCM) of 0.35. Table 1 compares Minne-sota’s situation at the end of the first quarter of 2002 and the first quarter of 2003.
Table 1. Summary of the Minnesota UI Program Data for the First Quarter of 2002 and First Quarter of 2003
Measure 1st Quarter
2002
1st Quarter
2003
Reed Act Distribution $163.1 million N/A
Trust Fund Balance $366.1 million $0.579 million
Percent Increase in Minnesota UI Account 45% N/A
Average High Cost Multiple 0.35 0.11
Average Tax Rate on Total Covered Wages
0.4% 0.6%
AWBA $324.49 $332.62
Average Duration on UI 15 Weeks 16.8 Weeks
Minnesota did not plan to allocate the Reed Act funds because the UI Trust fund was pro-jected to go into deficit in 2003. In the year prior to the Reed Act distribution, the state di-verted UI tax for UI technology improvements. This amount was expected to be approxi-mately $26-28 million over a four year period, 2002 through 2005.
In FY 2002 and 2003, Minnesota placed $12 million of the UI technology funds into the dis-located worker training fund. Minnesota has a separate dislocated worker tax (in December 2002, it was 0.07% of the taxable wage base [$22,000] or approximately $28 million a year).
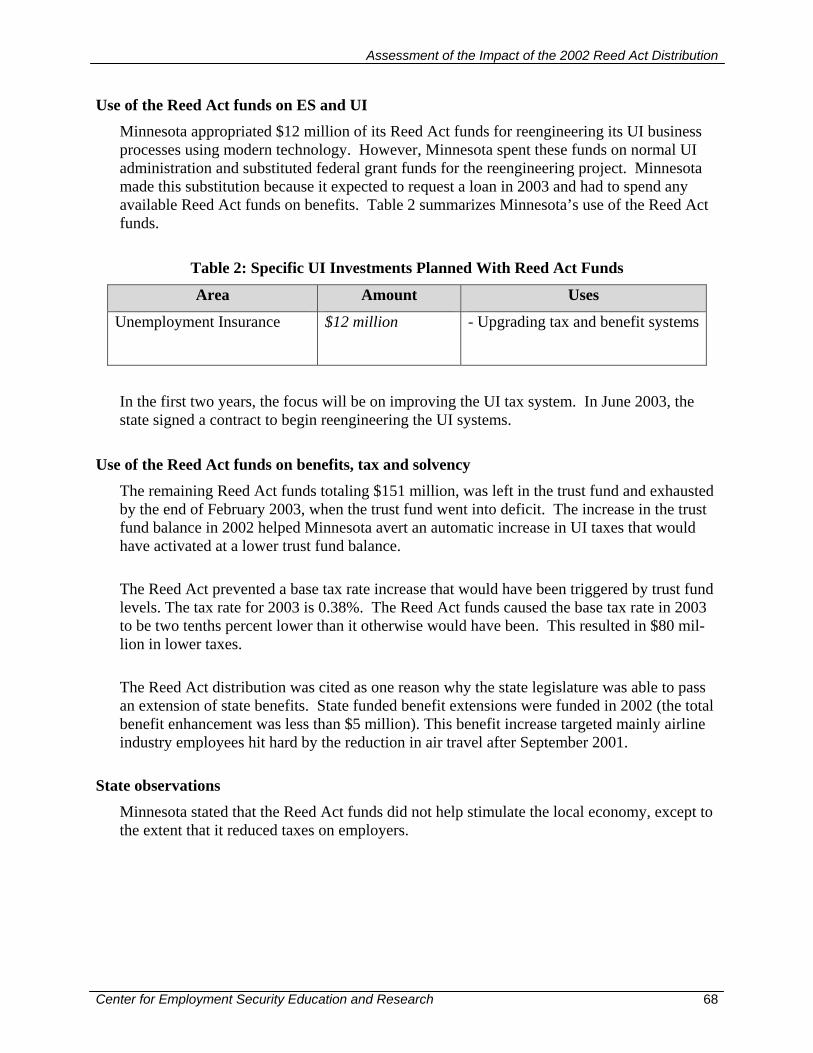
Assessment of the Impact of the 2002 Reed Act Distribution
Center for Employment Security Education and Research 68
Use of the Reed Act funds on ES and UI Minnesota appropriated $12 million of its Reed Act funds for reengineering its UI business processes using modern technology. However, Minnesota spent these funds on normal UI administration and substituted federal grant funds for the reengineering project. Minnesota made this substitution because it expected to request a loan in 2003 and had to spend any available Reed Act funds on benefits. Table 2 summarizes Minnesota’s use of the Reed Act funds.
Table 2: Specific UI Investments Planned With Reed Act Funds
Area Amount Uses
Unemployment Insurance $12 million
- Upgrading tax and benefit systems
In the first two years, the focus will be on improving the UI tax system. In June 2003, the state signed a contract to begin reengineering the UI systems.
Use of the Reed Act funds on benefits, tax and solvency
The remaining Reed Act funds totaling $151 million, was left in the trust fund and exhausted by the end of February 2003, when the trust fund went into deficit. The increase in the trust fund balance in 2002 helped Minnesota avert an automatic increase in UI taxes that would have activated at a lower trust fund balance. The Reed Act prevented a base tax rate increase that would have been triggered by trust fund levels. The tax rate for 2003 is 0.38%. The Reed Act funds caused the base tax rate in 2003 to be two tenths percent lower than it otherwise would have been. This resulted in $80 mil-lion in lower taxes. The Reed Act distribution was cited as one reason why the state legislature was able to pass an extension of state benefits. State funded benefit extensions were funded in 2002 (the total benefit enhancement was less than $5 million). This benefit increase targeted mainly airline industry employees hit hard by the reduction in air travel after September 2001.
State observations Minnesota stated that the Reed Act funds did not help stimulate the local economy, except to the extent that it reduced taxes on employers.
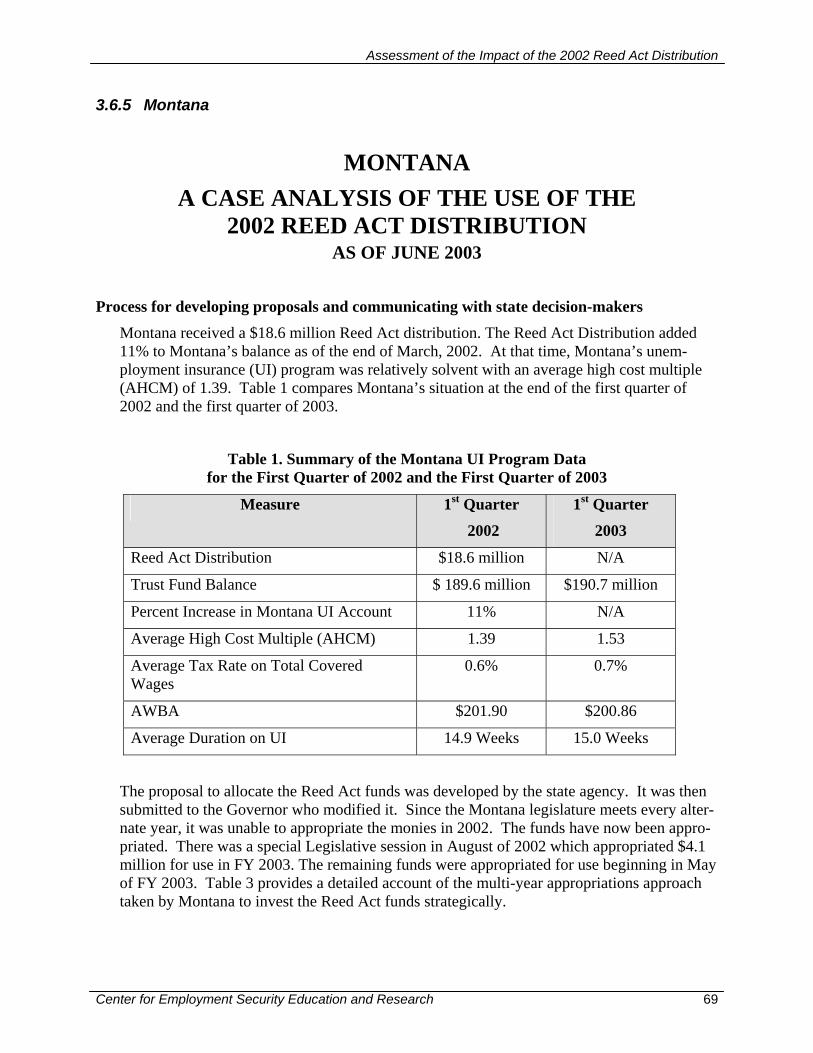
Assessment of the Impact of the 2002 Reed Act Distribution
Center for Employment Security Education and Research 69
3.6.5 Montana
MONTANA A CASE ANALYSIS OF THE USE OF THE
2002 REED ACT DISTRIBUTION AS OF JUNE 2003
Process for developing proposals and communicating with state decision-makers Montana received a $18.6 million Reed Act distribution. The Reed Act Distribution added 11% to Montana’s balance as of the end of March, 2002. At that time, Montana’s unem-ployment insurance (UI) program was relatively solvent with an average high cost multiple (AHCM) of 1.39. Table 1 compares Montana’s situation at the end of the first quarter of 2002 and the first quarter of 2003.
Table 1. Summary of the Montana UI Program Data for the First Quarter of 2002 and the First Quarter of 2003
Measure 1st Quarter
2002
1st Quarter
2003
Reed Act Distribution $18.6 million N/A
Trust Fund Balance $ 189.6 million $190.7 million
Percent Increase in Montana UI Account 11% N/A
Average High Cost Multiple (AHCM) 1.39 1.53
Average Tax Rate on Total Covered Wages
0.6% 0.7%
AWBA $201.90 $200.86
Average Duration on UI 14.9 Weeks 15.0 Weeks
The proposal to allocate the Reed Act funds was developed by the state agency. It was then submitted to the Governor who modified it. Since the Montana legislature meets every alter-nate year, it was unable to appropriate the monies in 2002. The funds have now been appro-priated. There was a special Legislative session in August of 2002 which appropriated $4.1 million for use in FY 2003. The remaining funds were appropriated for use beginning in May of FY 2003. Table 3 provides a detailed account of the multi-year appropriations approach taken by Montana to invest the Reed Act funds strategically.
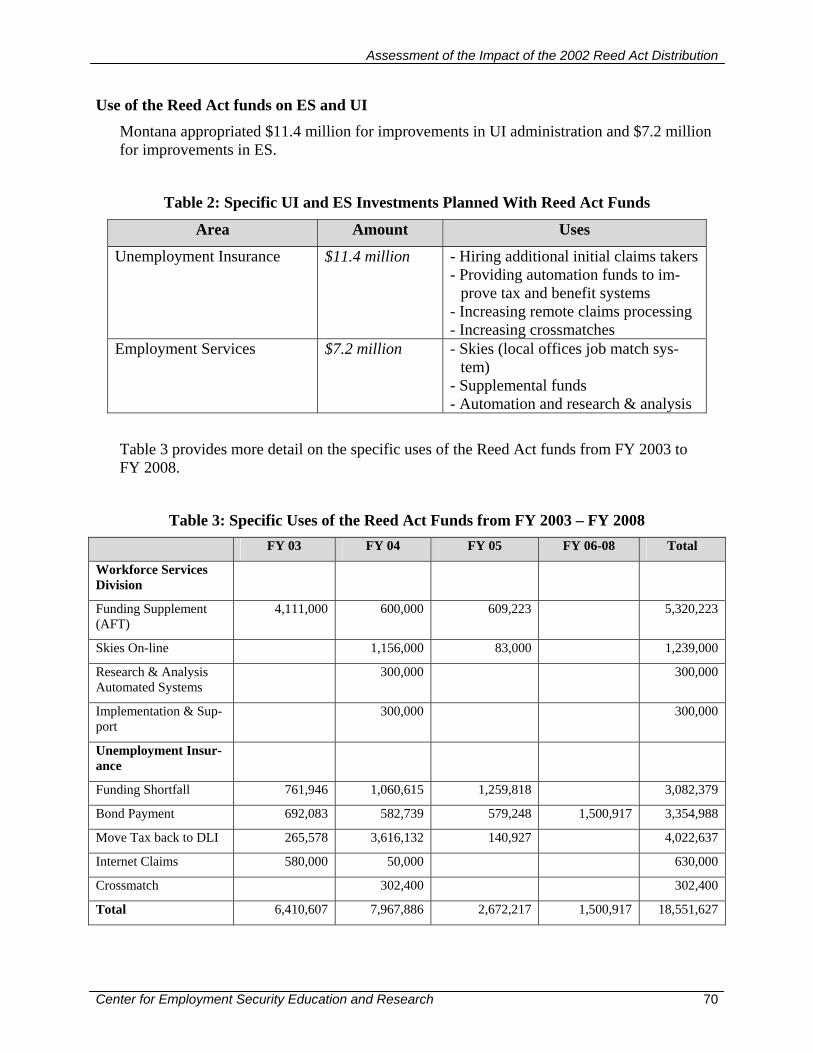
Assessment of the Impact of the 2002 Reed Act Distribution
Center for Employment Security Education and Research 70
Use of the Reed Act funds on ES and UI Montana appropriated $11.4 million for improvements in UI administration and $7.2 million for improvements in ES.
Table 2: Specific UI and ES Investments Planned With Reed Act Funds
Area Amount Uses
Unemployment Insurance $11.4 million
- Hiring additional initial claims takers - Providing automation funds to im-
prove tax and benefit systems - Increasing remote claims processing - Increasing crossmatches
Employment Services $7.2 million
- Skies (local offices job match sys-tem)
- Supplemental funds - Automation and research & analysis
Table 3 provides more detail on the specific uses of the Reed Act funds from FY 2003 to FY 2008.
Table 3: Specific Uses of the Reed Act Funds from FY 2003 – FY 2008 FY 03 FY 04 FY 05 FY 06-08 Total
Workforce Services Division
Funding Supplement (AFT)
4,111,000 600,000 609,223 5,320,223
Skies On-line 1,156,000 83,000 1,239,000
Research & Analysis Automated Systems
300,000 300,000
Implementation & Sup-port
300,000 300,000
Unemployment Insur-ance
Funding Shortfall 761,946 1,060,615 1,259,818 3,082,379
Bond Payment 692,083 582,739 579,248 1,500,917 3,354,988
Move Tax back to DLI 265,578 3,616,132 140,927 4,022,637
Internet Claims 580,000 50,000 630,000
Crossmatch 302,400 302,400
Total 6,410,607 7,967,886 2,672,217 1,500,917 18,551,627
Assessment of the Impact of the 2002 Reed Act Distribution
Center for Employment Security Education and Research 71
Before the Reed Act distribution, Montana experienced significant under-funding of ES and UI administration. For example, Montana had to suspend activities under SKIES on-line project (an overdue modernization of its labor exchange system) due to lack of sufficient funding. With the Reed Act distribution, Montana allocated $4,111,000 to ES in FY 2003 to maintain current levels. The department set aside $300,000 for Research and Analysis and $300,000 in FY 2004 for automation within the workforce services Division.
Montana had implemented an Administrative Fund Tax (AFT) in 1983 to address federal funding shortfalls in ES and to maintain delivery of ES through rural Job Service offices. The Montana Employment Security Account (ESA) is funded by an employer tax on em-ployees’ taxable wages of 0.13%. Through a one-time fund switch, $4,111,000 of Montana’s Reed Act distribution replaced ESA funds that have supported Wagner-Peyser Act activities. Through FY 2008, the legislature appropriated $5.3 million to substitute for funds that would have derived from its Administrative Fund Tax (AFT).
Investment in UI included hiring additional initial claims takers and other staff in overpay-ments and integrity areas, providing automation funds to improve tax and benefit systems, increasing crossmatches to improve program integrity and overpayment recovery, and other areas to address federal funding shortfalls. The management of the tax collection system is in the process of being moved back to the Department of Labor and Industry (DLI). Prior to this, the Department of Revenue managed the UI tax collection system, and it was experienc-ing automation and data integrity problems. The management of the UI tax collection system was moved back to the DLI because of complaints from employers that the UI tax collection system was not functioning efficiently.
The Reed Act distribution will be used to pay bond payments on bonds that had financed both benefit and tax automated reengineering efforts. This amounts to approximately $3.3 million to be paid over the next six years.
Use of Reed Act funds on benefits, tax and solvency
The Reed Act funds contributed to solvency – when the bill was passed, the trust fund had a 16.7 month reserve. Without the Reed Act, the reserves would have fallen to 15.1 months. Since Montana was relatively solvent at the time of the Reed Act distribution, (AHCM of 1.39), it plans to spend the funds on other purposes over the next few years. The Reed Act funds improved solvency to the extent that the money will be spent over a period of five years thus keeping a higher trust fund level for several years.
The Reed Act funds stalled a rate increase to Schedule 2 in Montana’s experience rating schedules - without the Reed Act Montana would have moved to Schedule 2 from Schedule 1 in January 2003. The tax rate would have increased from 1.37% to 1.57%. There was a
Assessment of the Impact of the 2002 Reed Act Distribution
Center for Employment Security Education and Research 72
$9 million reduction in UI taxes from $72 million to $63 million due to the Reed Act distri-bution.
Montana expanded benefits (estimated cost is $5 million) before the Reed Act distribution. The number of maximum benefit weeks increased from 26 to 28. The benefit amount also increased from 63% to 66.5% of average weekly wage. This benefit increase, however, was not related to the Reed Act distribution.
State observations Montana reported the DOL guidance gave an opportunity to educate legislators and employ-ers about the Reed Act distribution, but there seemed to be a greater need for educating legis-lators specifically on the uses and restrictions of the Reed Act funds. The state also reported that the Governor and the legislators would have liked to spend the funds on several uses, but were unable to, since the funds were restricted to specific uses. In the NASWA Reed Act Distribution Survey,21 Montana reported that the Reed Act funds allowed states to fund costly, necessary automation projects that it would not be able to fund within its yearly allo-cations. Montana also stated that small states faced many of the same infrastructure needs for automation as larger states, however, without the economies of scale, and that the Reed Act would help address some of their automation needs.
21 Conducted in September 2002
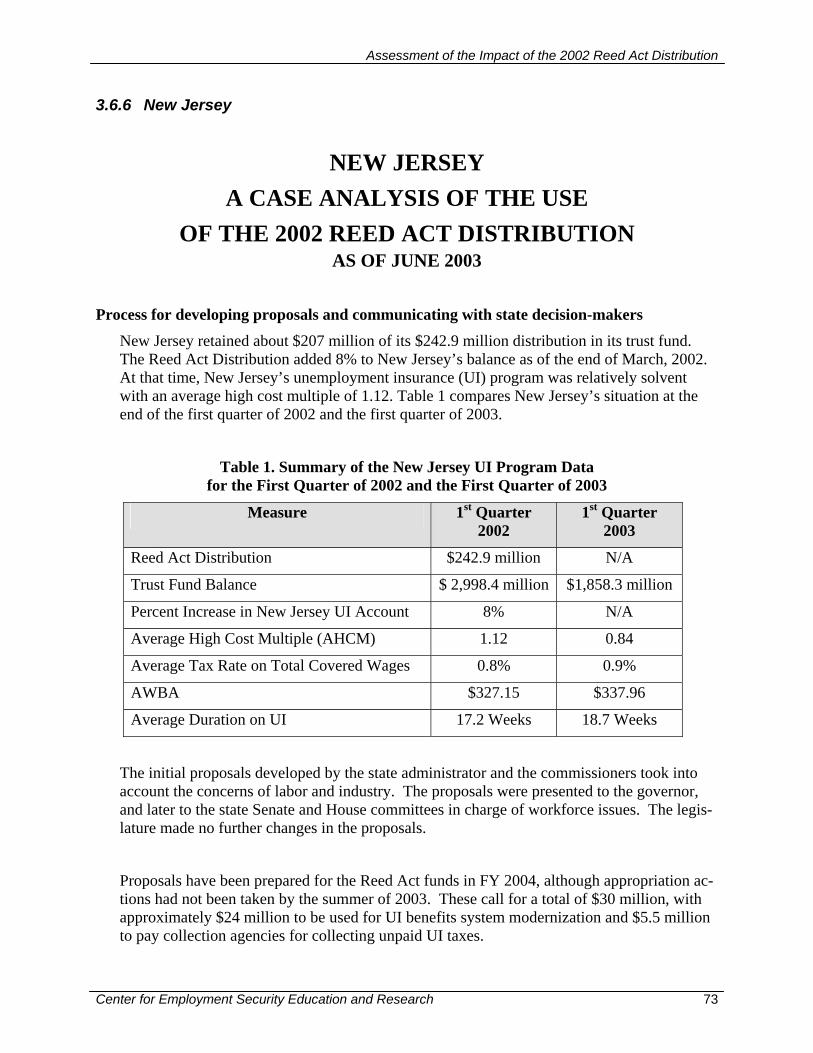
Assessment of the Impact of the 2002 Reed Act Distribution
Center for Employment Security Education and Research 73
3.6.6 New Jersey
NEW JERSEY A CASE ANALYSIS OF THE USE
OF THE 2002 REED ACT DISTRIBUTION AS OF JUNE 2003
Process for developing proposals and communicating with state decision-makers New Jersey retained about $207 million of its $242.9 million distribution in its trust fund. The Reed Act Distribution added 8% to New Jersey’s balance as of the end of March, 2002. At that time, New Jersey’s unemployment insurance (UI) program was relatively solvent with an average high cost multiple of 1.12. Table 1 compares New Jersey’s situation at the end of the first quarter of 2002 and the first quarter of 2003.
Table 1. Summary of the New Jersey UI Program Data for the First Quarter of 2002 and the First Quarter of 2003
Measure 1st Quarter 2002
1st Quarter 2003
Reed Act Distribution $242.9 million N/A
Trust Fund Balance $ 2,998.4 million $1,858.3 million
Percent Increase in New Jersey UI Account 8% N/A
Average High Cost Multiple (AHCM) 1.12 0.84
Average Tax Rate on Total Covered Wages 0.8% 0.9%
AWBA $327.15 $337.96
Average Duration on UI 17.2 Weeks 18.7 Weeks
The initial proposals developed by the state administrator and the commissioners took into account the concerns of labor and industry. The proposals were presented to the governor, and later to the state Senate and House committees in charge of workforce issues. The legis-lature made no further changes in the proposals.
Proposals have been prepared for the Reed Act funds in FY 2004, although appropriation ac-tions had not been taken by the summer of 2003. These call for a total of $30 million, with approximately $24 million to be used for UI benefits system modernization and $5.5 million to pay collection agencies for collecting unpaid UI taxes.
Assessment of the Impact of the 2002 Reed Act Distribution
Center for Employment Security Education and Research 74
Proposals for expanding benefits have been put forward in the legislature. This would in-crease benefits to part-time workers. The estimated cost of these proposals is from $15-$100 million annually (depending on economic conditions). UI taxes were cut as a health care tax equivalent to the UI tax cut was reinstituted.
It was the belief of those interviewed that the USDOL guidance as well as the restrictions set by federal law on the use of Reed Act funds were appropriate, and helped ensure the funds were used towards the UI/ES part of the workforce development system, as opposed to other workforce related uses.
Use of the Reed Act funds on ES and UI A total of $36 million was appropriated in FY 2003, and a request for a further $30 million was made for FY 2004. At the time of our interview, in June 2003, the appropriations bills had not been voted on.
The already appropriated funds in FY 2003 will be used to enhance the ES capabilities, both programmatically and by investing in information technology. The UI investment segment in 2003 was the first of three planned segments that will renovate the benefits and tax sys-tems.
A total of $ 24 million is planned in FY03 for technology improvements to the UI benefit payment system and tax system. This will include enhancements such as remote claims processing technology, continued improvements of the claims reporting and certification telephone technology, benefit-wage new hire cross match technology, appeals technology, UI legacy database modernization and employer accounts systems.
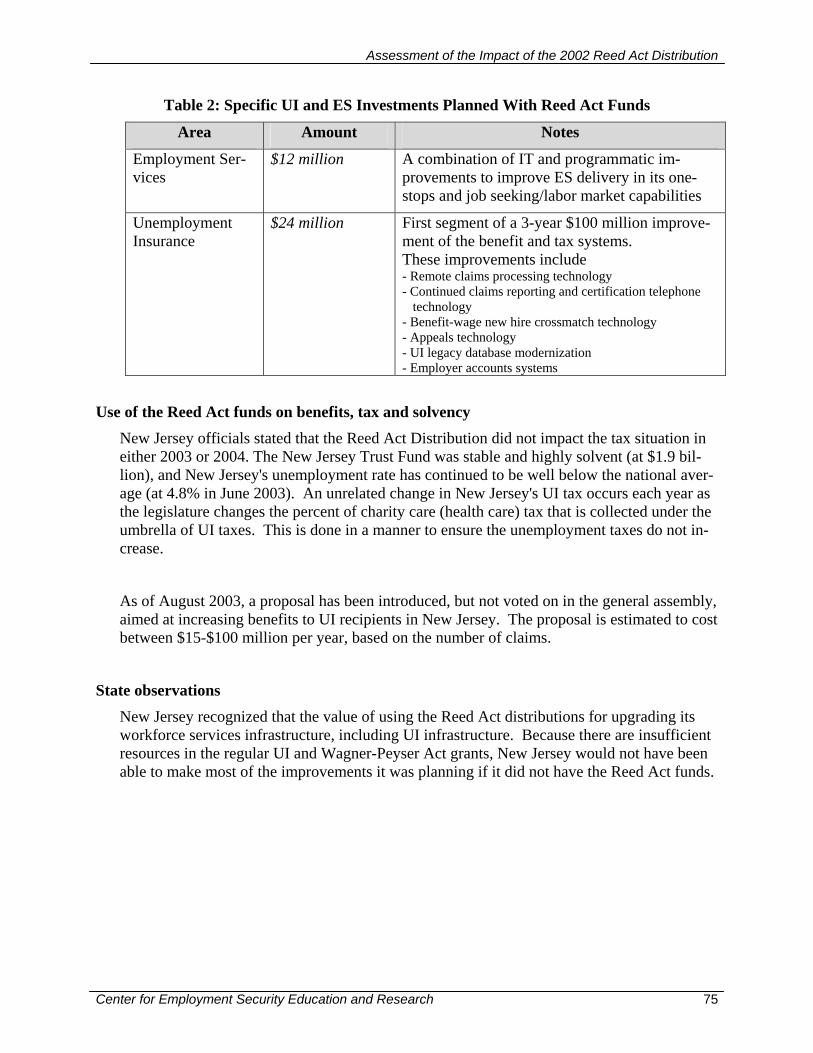
Assessment of the Impact of the 2002 Reed Act Distribution
Center for Employment Security Education and Research 75
Table 2: Specific UI and ES Investments Planned With Reed Act Funds
Area Amount Notes
Employment Ser-vices
$12 million A combination of IT and programmatic im-provements to improve ES delivery in its one-stops and job seeking/labor market capabilities
Unemployment Insurance
$24 million First segment of a 3-year $100 million improve-ment of the benefit and tax systems. These improvements include - Remote claims processing technology - Continued claims reporting and certification telephone
technology - Benefit-wage new hire crossmatch technology - Appeals technology - UI legacy database modernization - Employer accounts systems
Use of the Reed Act funds on benefits, tax and solvency New Jersey officials stated that the Reed Act Distribution did not impact the tax situation in either 2003 or 2004. The New Jersey Trust Fund was stable and highly solvent (at $1.9 bil-lion), and New Jersey's unemployment rate has continued to be well below the national aver-age (at 4.8% in June 2003). An unrelated change in New Jersey's UI tax occurs each year as the legislature changes the percent of charity care (health care) tax that is collected under the umbrella of UI taxes. This is done in a manner to ensure the unemployment taxes do not in-crease.
As of August 2003, a proposal has been introduced, but not voted on in the general assembly, aimed at increasing benefits to UI recipients in New Jersey. The proposal is estimated to cost between $15-$100 million per year, based on the number of claims.
State observations New Jersey recognized that the value of using the Reed Act distributions for upgrading its workforce services infrastructure, including UI infrastructure. Because there are insufficient resources in the regular UI and Wagner-Peyser Act grants, New Jersey would not have been able to make most of the improvements it was planning if it did not have the Reed Act funds.
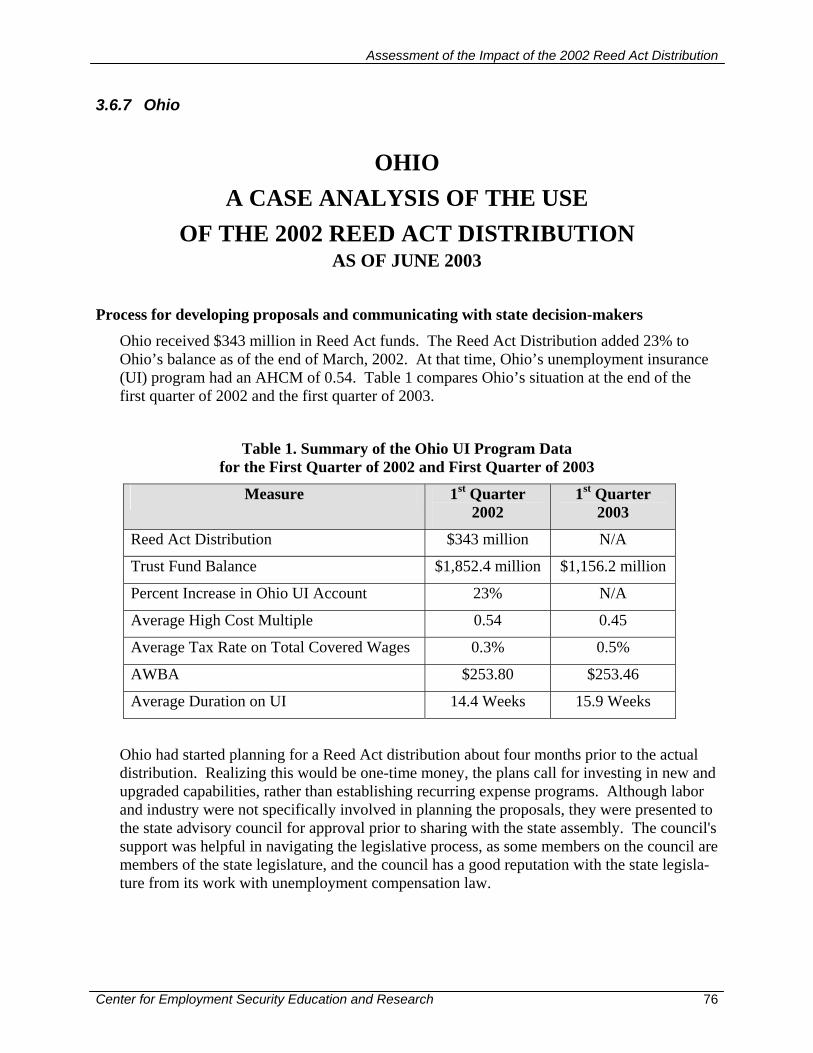
Assessment of the Impact of the 2002 Reed Act Distribution
Center for Employment Security Education and Research 76
3.6.7 Ohio
OHIO A CASE ANALYSIS OF THE USE
OF THE 2002 REED ACT DISTRIBUTION AS OF JUNE 2003
Process for developing proposals and communicating with state decision-makers Ohio received $343 million in Reed Act funds. The Reed Act Distribution added 23% to Ohio’s balance as of the end of March, 2002. At that time, Ohio’s unemployment insurance (UI) program had an AHCM of 0.54. Table 1 compares Ohio’s situation at the end of the first quarter of 2002 and the first quarter of 2003.
Table 1. Summary of the Ohio UI Program Data for the First Quarter of 2002 and First Quarter of 2003
Measure 1st Quarter 2002
1st Quarter 2003
Reed Act Distribution $343 million N/A
Trust Fund Balance $1,852.4 million $1,156.2 million
Percent Increase in Ohio UI Account 23% N/A
Average High Cost Multiple 0.54 0.45
Average Tax Rate on Total Covered Wages 0.3% 0.5%
AWBA $253.80 $253.46
Average Duration on UI 14.4 Weeks 15.9 Weeks
Ohio had started planning for a Reed Act distribution about four months prior to the actual distribution. Realizing this would be one-time money, the plans call for investing in new and upgraded capabilities, rather than establishing recurring expense programs. Although labor and industry were not specifically involved in planning the proposals, they were presented to the state advisory council for approval prior to sharing with the state assembly. The council's support was helpful in navigating the legislative process, as some members on the council are members of the state legislature, and the council has a good reputation with the state legisla-ture from its work with unemployment compensation law.
Assessment of the Impact of the 2002 Reed Act Distribution
Center for Employment Security Education and Research 77
In general the guidance from the DOL was found to be helpful, especially in helping focus legislators on the authorized uses of the Reed Act funds.
The process and proposals were to some extent geared towards using the Reed Act distribu-tion to shore up the trust fund, and thus avoid an automatic tax increase. Ohio’s original plan left $216 million of the distribution unobligated within its trust fund, which helped prevent an increase in employer taxes for 2003 and 2004. The unobligated balance has been reduced to $191 million as the state dedicated $25 million towards the transition from the current lo-cal office structure to call centers and processing centers. The Reed Act helped keep the fund balance in 2003 at a level similar to the year before, avoiding an automatic tax rate increase that would have otherwise occurred. Most of the Reed Act distribution will continue to re-main in the trust fund as cash and will not be withdrawn until obligations are due. This will maximize the solvency of the fund for tax rate purposes.
Ohio’s goal was to allocate a portion of the money to support the administration of the Un-employment Compensation and ES programs and ensure solvency. Much like other states, Ohio is under-funded by the federal government for the administration of UI and ES. This affects Ohio’s ability to operate ES and UI programs. As a result, it has been necessary for Ohio to use its General Revenue Fund and State penalty and Interest Fund dollars to make up the shortfall.
The tax rate for the coming year is calculated based on balances as of June 30. A “Minimum Safe Level” (MSL) trust fund balance is determined to avoid an automatic tax increase. This is an annual calculation of what fund balance would be required to guarantee that the fund would not become insolvent in a moderate recession for one year. If the trust fund balance is 15% below the threshold, the tax rate increases by 1/10th of a percent, avoiding a fall in the trust fund balance. There are rate increases for 30%, 45%, and 60% below the MSL.
Ohio did not expect the Reed Act distribution to have a discretionary stimulating economic impact outside of the tax avoidance and the direct expenditure of dollars on investment in the system.
Use of the Reed Act funds on ES and UI
Table 2 summarizes the planned uses of the Reed Act funds on ES and UI. The state plan called for a total of $78 million to be used for UI administration over the next 3 years to off-set state general revenue and penalty interest funds traditionally used to supplement the op-eration of the program; labor market information improvements in the amount of $3 million; $10 million for investment in certified one-stop centers; $30 million for a new UI Tax sys-tem; and $6 million for policy and program staff training and equipment.
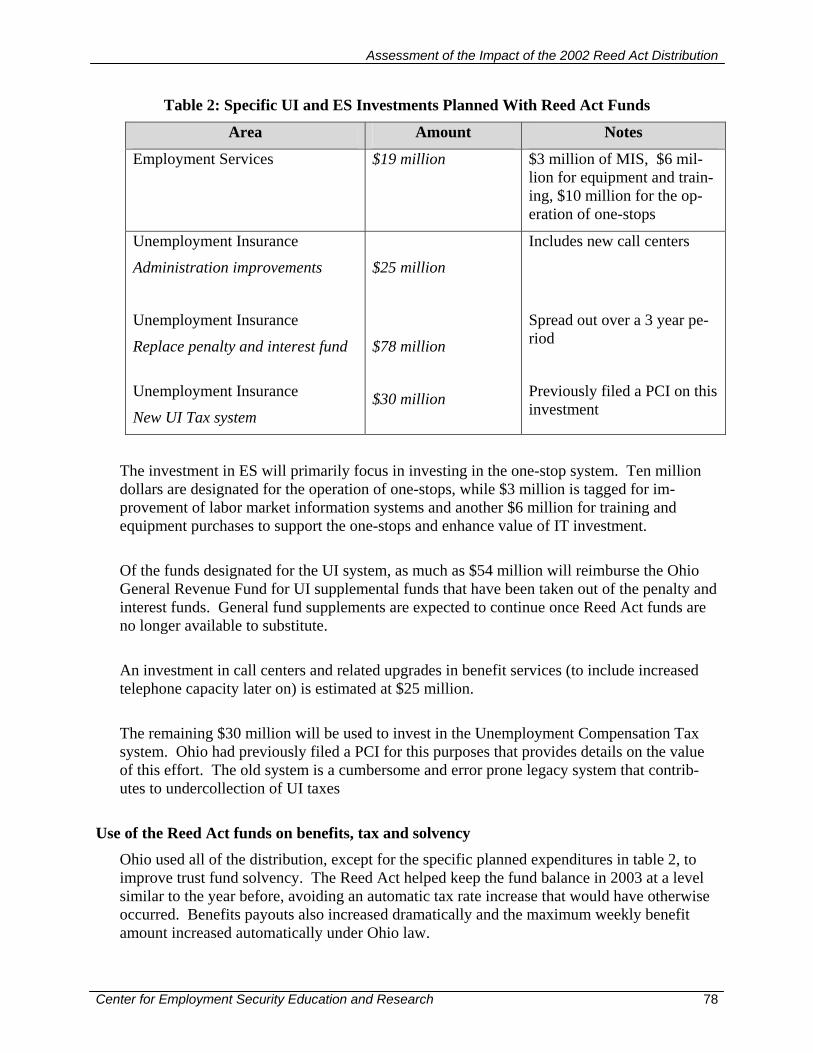
Assessment of the Impact of the 2002 Reed Act Distribution
Center for Employment Security Education and Research 78
Table 2: Specific UI and ES Investments Planned With Reed Act Funds
Area Amount Notes
Employment Services $19 million $3 million of MIS, $6 mil-lion for equipment and train-ing, $10 million for the op-eration of one-stops
Unemployment Insurance
Administration improvements
Unemployment Insurance
Replace penalty and interest fund
Unemployment Insurance
New UI Tax system
$25 million
$78 million
$30 million
Includes new call centers
Spread out over a 3 year pe-riod
Previously filed a PCI on this investment
The investment in ES will primarily focus in investing in the one-stop system. Ten million dollars are designated for the operation of one-stops, while $3 million is tagged for im-provement of labor market information systems and another $6 million for training and equipment purchases to support the one-stops and enhance value of IT investment.
Of the funds designated for the UI system, as much as $54 million will reimburse the Ohio General Revenue Fund for UI supplemental funds that have been taken out of the penalty and interest funds. General fund supplements are expected to continue once Reed Act funds are no longer available to substitute.
An investment in call centers and related upgrades in benefit services (to include increased telephone capacity later on) is estimated at $25 million.
The remaining $30 million will be used to invest in the Unemployment Compensation Tax system. Ohio had previously filed a PCI for this purposes that provides details on the value of this effort. The old system is a cumbersome and error prone legacy system that contrib-utes to undercollection of UI taxes
Use of the Reed Act funds on benefits, tax and solvency
Ohio used all of the distribution, except for the specific planned expenditures in table 2, to improve trust fund solvency. The Reed Act helped keep the fund balance in 2003 at a level similar to the year before, avoiding an automatic tax rate increase that would have otherwise occurred. Benefits payouts also increased dramatically and the maximum weekly benefit amount increased automatically under Ohio law.
Assessment of the Impact of the 2002 Reed Act Distribution
Center for Employment Security Education and Research 79
Ohio has had an alternate base period for some time as well as unemployment benefits for workers who have worked more than 20 weeks in the previous 52, or made more than $176 per week on average for the same period. It was the consensus among the state administra-tor's office and stakeholders that the one-time nature of the Reed Act distribution made it in-feasible to introduce new benefits or to make changes to the structure of existing benefits.
State observations
Ohio noted that it was necessary to communicate early in the process to the state legisla-ture22. It also noted that the Reed Act funds were “one-time monies for one-time expendi-ture”.
22 NASWA Reed Act Survey, conducted in September 2002.
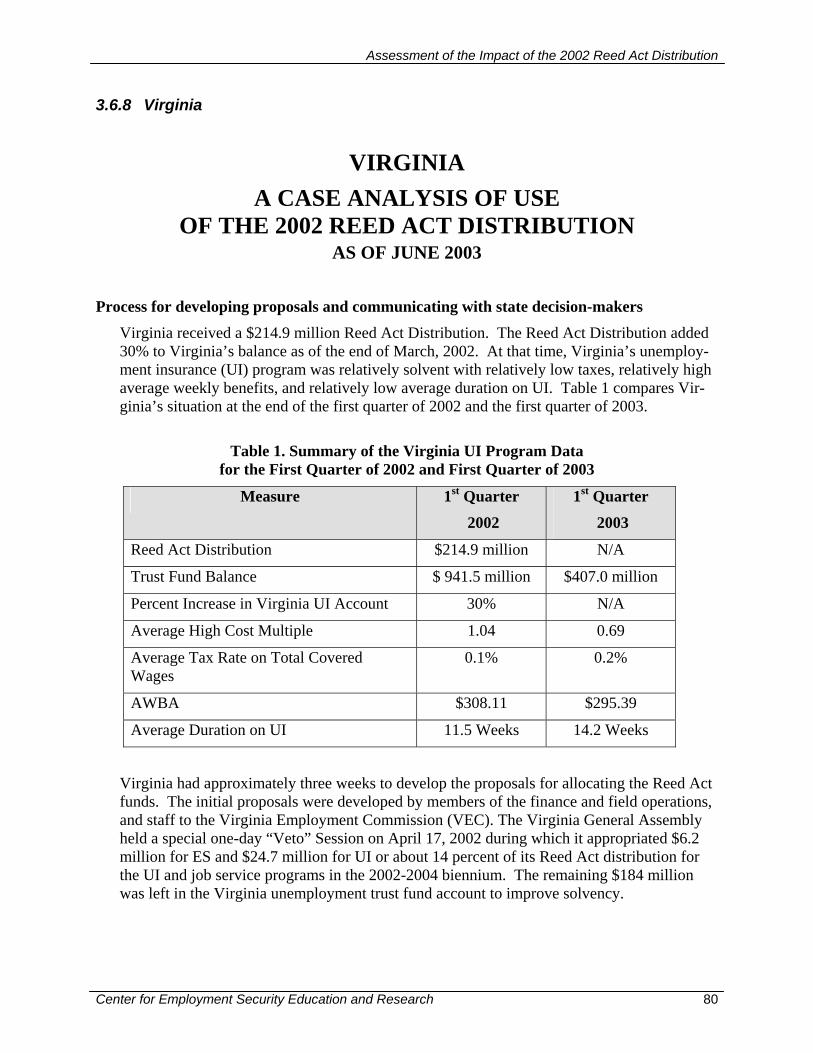
Assessment of the Impact of the 2002 Reed Act Distribution
Center for Employment Security Education and Research 80
3.6.8 Virginia
VIRGINIA A CASE ANALYSIS OF USE
OF THE 2002 REED ACT DISTRIBUTION AS OF JUNE 2003
Process for developing proposals and communicating with state decision-makers Virginia received a $214.9 million Reed Act Distribution. The Reed Act Distribution added 30% to Virginia’s balance as of the end of March, 2002. At that time, Virginia’s unemploy-ment insurance (UI) program was relatively solvent with relatively low taxes, relatively high average weekly benefits, and relatively low average duration on UI. Table 1 compares Vir-ginia’s situation at the end of the first quarter of 2002 and the first quarter of 2003.
Table 1. Summary of the Virginia UI Program Data
for the First Quarter of 2002 and First Quarter of 2003
Measure 1st Quarter
2002
1st Quarter
2003
Reed Act Distribution $214.9 million N/A
Trust Fund Balance $ 941.5 million $407.0 million
Percent Increase in Virginia UI Account 30% N/A
Average High Cost Multiple 1.04 0.69
Average Tax Rate on Total Covered Wages
0.1% 0.2%
AWBA $308.11 $295.39
Average Duration on UI 11.5 Weeks 14.2 Weeks
Virginia had approximately three weeks to develop the proposals for allocating the Reed Act funds. The initial proposals were developed by members of the finance and field operations, and staff to the Virginia Employment Commission (VEC). The Virginia General Assembly held a special one-day “Veto” Session on April 17, 2002 during which it appropriated $6.2 million for ES and $24.7 million for UI or about 14 percent of its Reed Act distribution for the UI and job service programs in the 2002-2004 biennium. The remaining $184 million was left in the Virginia unemployment trust fund account to improve solvency.

Assessment of the Impact of the 2002 Reed Act Distribution
Center for Employment Security Education and Research 81
Use of the Reed Act funds on ES and UI Virginia appropriated $6.2 million for ES and $24.7 million for UI administration. Table 2 summarizes Virginia’s use of the Reed Act funds:
Table 2: Specific UI and ES Investments Planned With Reed Act Funds
Area Amount Uses
Unemployment Insurance $24.7 million
- Upgrading tax, benefit and ac-counting systems
- Technology improvements in cus-tomer call centers
Employment Services $6.2 million
- Supporting Wagner-Peyser Act activities and providing basic lev-els of service at customer care centers
A total of $7 million of the $24.7 million was used to augment basic UI functions, such as upgrading their tax, benefit and accounting systems. A total of $17.7 million was used for improvements in the customer contact projects/call centers and other technology initiatives.
In the Employment Services area, Virginia supported Wagner-Peyser Act activities in Gov-ernor Warner’s Coordinated Economic Relief Centers, conducted operations at basic levels of service and transition to Customer Contact Centers while offsetting reductions in federal funding and increased operating costs.
The Reed Act funds were also used to substitute for state supplemental funds that were then reallocated to programs other than UI/ES. In 2002, $2 million was committed from the pen-alty and interest fund to support UI and ES, including remote claims processing.
Use of the Reed Act funds on benefits, tax and solvency The Reed Act funds helped avoid an increased tax rate. In the absence of the Reed Act, an average of $6 per employee increase would have been imposed to the employer tax. This avoidance thus saved employers in Virginia an estimated $19.3 million dollars in 2003.
The former Governor temporarily increased benefits in response to the September 11, 2001 terrorist attacks on the Pentagon in Northern Virginia. The deposit of $184 million into the UI trust fund helped to offset the cost of increased benefits to keep taxes at a lower level and to potentially avoid the imposition of a solvency surtax. The improved solvency might have
Assessment of the Impact of the 2002 Reed Act Distribution
Center for Employment Security Education and Research 82
been a factor that lead to Virginia legislative action to eliminate the Social Security benefit offset and enact an alternate base period.
State observations The DOL guidance was useful in explaining how the funds could be used. The VEC found it necessary to educate legislators on its programs and funding processes, its relationship to the DOL, and on the nature and implications of funding shortfalls.23 The VEC and the Virginia General Assembly carefully considered both the administrative needs of the VEC and the solvency requirements of the UI trust fund in determining the best use of the Reed Act Dis-tribution. Higher unemployment had a significant depleting effect on the trust fund that the infusion of the Reed Act funds has helped to alleviate.24 The VEC emphasized that the Reed Act distribution, while substantial, was not a source of limitless funding that lessens their need to continue to request adequate administrative funding and to carefully budget for its use.25
23 Reed Act Distribution Survey conducted by NASWA, September, 2002 24 Ibid. 25 Ibid.
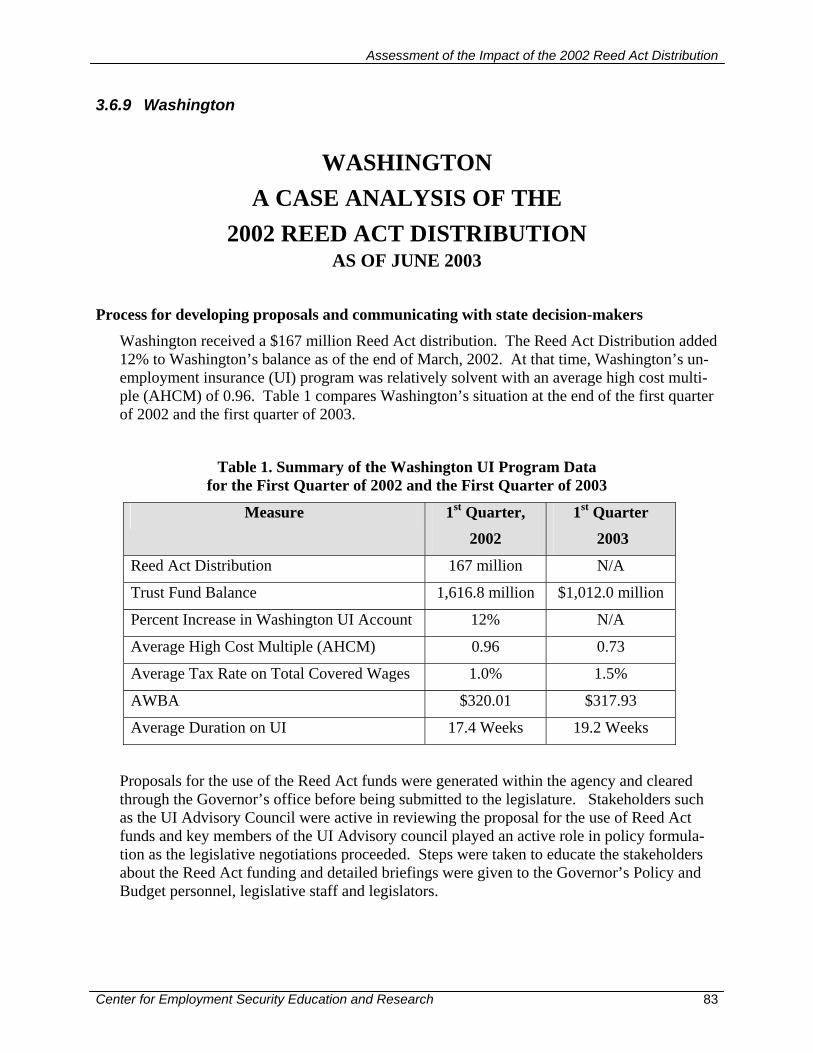
Assessment of the Impact of the 2002 Reed Act Distribution
Center for Employment Security Education and Research 83
3.6.9 Washington
WASHINGTON A CASE ANALYSIS OF THE
2002 REED ACT DISTRIBUTION AS OF JUNE 2003
Process for developing proposals and communicating with state decision-makers Washington received a $167 million Reed Act distribution. The Reed Act Distribution added 12% to Washington’s balance as of the end of March, 2002. At that time, Washington’s un-employment insurance (UI) program was relatively solvent with an average high cost multi-ple (AHCM) of 0.96. Table 1 compares Washington’s situation at the end of the first quarter of 2002 and the first quarter of 2003.
Table 1. Summary of the Washington UI Program Data for the First Quarter of 2002 and the First Quarter of 2003
Measure 1st Quarter,
2002
1st Quarter
2003
Reed Act Distribution 167 million N/A
Trust Fund Balance 1,616.8 million $1,012.0 million
Percent Increase in Washington UI Account 12% N/A
Average High Cost Multiple (AHCM) 0.96 0.73
Average Tax Rate on Total Covered Wages 1.0% 1.5%
AWBA $320.01 $317.93
Average Duration on UI 17.4 Weeks 19.2 Weeks
Proposals for the use of the Reed Act funds were generated within the agency and cleared through the Governor’s office before being submitted to the legislature. Stakeholders such as the UI Advisory Council were active in reviewing the proposal for the use of Reed Act funds and key members of the UI Advisory council played an active role in policy formula-tion as the legislative negotiations proceeded. Steps were taken to educate the stakeholders about the Reed Act funding and detailed briefings were given to the Governor’s Policy and Budget personnel, legislative staff and legislators.

Assessment of the Impact of the 2002 Reed Act Distribution
Center for Employment Security Education and Research 84
Decisions on the use of Reed Act funds for the state biennium (July 2003-June 2005) were made final on June 11, 2003 as the legislature completed its work. An amount of $8.3 mil-lion is appropriated for UI Administration and $11.5 million is appropriated for the cost of implementing sweeping unemployment insurance legislative changes, for a total of $19.8 million. The remainder of the $167 million distribution is retained in the trust fund to con-tribute to the solvency of the fund.
Use of the Reed Act funds on ES and UI Table 2 provides a breakout of the planned uses of the Reed Act funds.
Table 2: Specific UI and ES Investments Planned With Reed Act Funds Area Amount Notes
UI administration $8.3 million
- Improved data collection process for ini-tial claims
- Electronic data management system (im-aging)
- Staff retention in WorkSource offices
UI Legislative Changes $11.5 million - New calculation rates for benefits
- New employer tax mechanism
- New penalties for delinquent tax reports
ES None
No Reed Act resources were appropriated for ES. Washington had a proposal to expand a state-owned WorkSource Office’s infrastructure (for a building constructed with Reed Act funds), but this proposal was not adopted.
During FY 2003, Washington State suffered a $14 million reduction in UI funding from the federal government as a result of the US Department of Labor implementing a new way of allocating administrative funds26. Washington’s Reed Act proposals are strategic invest-ments for their UI claims telecenter operations, which are designed to not only improve cus-tomer service, but to position the agency to “weather the storm” of inadequate funding. Washington will receive $8,283,000 for UI Administration and $11.5 million to implement legislative changes in the UI system. The investments in UI include:
26 The model referred to here is the “Resource Justification Model”, or RJM.

Assessment of the Impact of the 2002 Reed Act Distribution
Center for Employment Security Education and Research 85
1) Improved and timely eligibility decisions through an electronic data management system (imaging) for adjudicators. The cost of this investment is $1,881,345 and it will be amortized using funds from future UI administration grants.
2) Improved initial claim process via collecting information from the claimant, whether on the phone or via their internet claim and passing this information to Washington’s benefit sys-tem. The benefit system will have text-based screens converted to a modern graphical user interface (GUI), so that screen data collected from the claimant can be interfaced with the automated system. The cost of this investment is $2,065,117 and it will be amortized using funds from future UI administration grants.
3) A low-income adult initiative was proposed to improve labor market outcomes, leading to improved wage progression and job stability, at a cost of $6.5 million. The legislature did not appropriate funds for this activity and instead appropriated $4,337,000 for the purpose of retaining staff in our WorkSource Offices who assist UI claimants – who otherwise would have been subject to reduction because of the funding shortfall caused by the lack of federal UI administrative funds nationally, and the implementation of the RJM.
4) A total $11.5 million has been appropriated for the two year biennium to cover the cost of implementing Second Substitute Senate Bill 6097, which makes sweeping changes in the way employers are charged unemployment insurance taxes and how claimants qualify for benefits. The combination of reduced employer taxes and benefit cuts for workers are de-signed to make Washington State more “business friendly” by reducing the costs of the un-employment insurance system to employers.
a) The Second Substitute Engrossed Bill 6097 passed the legislature and was signed by the Governor on June 20, 2003. Changes that immediately affect claimants and employers include:27
i) New calculation rates for benefits effective January 2004: The maximum weekly un-employment benefit payment increases from $496 to $510 for new claims filed be-tween July 6, 2003 and January 3, 2004, then returns to $496 thereafter
ii) New employer benefit charges: Benefits paid to claimants with irregular earnings will now be included in the employer tax calculations
iii) Certain alien workers no longer covered by UI: Employers are no longer required to report wages or pay unemployment taxes for certain temporary workers from other countries
iv) New penalties for delinquent tax reports: Employers who fail to file timely and com-plete UI tax reports can be charged a penalty of up to $250
b) Other substantial changes to the unemployment program required by the new legislation will be implemented next year.
27 http://www.wa.gov/esd/AgencyInfo/newsreleases/nr071703.pdf

Assessment of the Impact of the 2002 Reed Act Distribution
Center for Employment Security Education and Research 86
Use of the Reed Act funds on benefits, tax and solvency The $167 million Reed Act distribution was key in avoiding the movement to a higher tax schedule for employer taxes. Thus, the Reed Act distribution contributed to the solvency and Washington employers saved an estimated $172 million in unemployment taxes in 2003.
The lower tax rates were the result of the automatic application of current statutes. In 2003, the average employer tax rate increased to 2.51% (Schedule B) on a wage base of $29,700 (escalates based on average annual wages) from Schedule A in 2002, when the average em-ployer tax rate was 2.27% on a wage base of $28,500. Table 3 illustrates the change in the average employer taxes paid in 2002 and 2003.
Table 3: Employer UI taxes in 2002 and 2003
Schedule A
(In effect 2002)
Schedule C
(In effect 2003, without the Reed Act Distribution)
Schedule B
(In effect 2003)
Average employer tax rate
2.27% 2.97%. 2.51%
Wage base $28,500 $29,700 $29,700
Average employer tax per employee
$646.95 $882.09 $745.47
The average employer paid 2.27% on $28,500 or $646.95 per employee under Schedule A in 2002. In 2003 (Schedule B), the employer pays 2.51% on $29,700 or $745.47 per employee, an increase of 15.2% from 2002 (a combination of the rate increase and the higher salary base).
Without the Reed Act distribution, Washington would have been in Schedule C, with an av-erage employer tax rate of 2.97%. If Washington had gone to Schedule C, the employer would have paid 2.97% on $29,700, or $882.09 per employee, an increase of $235.14 per employee or 36.34% over 2002.
State observations A few key lessons were learned by the Washington’s state administrator's office:
• State officials reported that it was important to educate the stakeholders and authoriz-ing environment concerning the opportunities available through the Reed Act distri-bution.
Assessment of the Impact of the 2002 Reed Act Distribution
Center for Employment Security Education and Research 87
• State officials reported they may have underestimated the level of support they could garner from the authorizing environment for Reed Act investments in UI and ES
The funds were appropriated for a two-year period. Washington has no current plans for propos-als beyond that time frame.
Assessment of the Impact of the 2002 Reed Act Distribution
Center for Employment Security Education and Research 88
(This page intentionally left blank)

Assessment of the Impact of the 2002 Reed Act Distribution
Center for Employment Security Education and Research 89
SECTION IV QUANTITATIVE ANALYSIS
Assessment of the Impact of the 2002 Reed Act Distribution
Center for Employment Security Education and Research 90
4.1 INTRODUCTION TO QUANTITATIVE ANALYSIS 4.1.1 Background and Purpose The quantitative analysis presented here is consistent with the process evaluation de-sign presented jointly by CESER and Booz Allen to USDOL in the fall of 2002. The purpose was described in the process evaluation:
“This process evaluation analyzes the spending of [Reed Act] funds by the states and the factors that drive this spending. The purpose of the process evaluation is to study the states’ implementation, policies, institutional outcomes and individual state outcomes (from existing data) and to glean federal policy consequences. The process evaluation consists of data collection, quantitative and qualitative analysis of the use of funds and documentation.”
The quantitative analysis presented here shows a combination of analysis the team conducted to gain an understanding of the issues that could potentially influence states’ decisions of to use/not use the Reed Act funds. This included both an evaluation of key trends, testing of specific hypotheses, as well as evaluation of survey data collected by NASWA in two separate studies completed in January 2003 and February 2004. The quantitative analysis complements the case studies presented above, to provide a picture of the apparent motivations and political and economic issues that influence the decisions at the state level on how Reed Act funds are used. The analysis was conducted using data sets that reached back to the first quarter of 1999, and, in most cases, through the second quarter of 2003. In general there is ap-proximately 2-3 quarter lag in the availability of the data. The team therefore decided to complete the analysis once the data for the second quarter of 2003 were available in the late fall of 2003. The bulk of the quantitative analysis was thus completed in the fourth quarter of 2003 and first quarter of 2004, with some additional fact checking and validation in the early part of the second quarter of 2004. 4.1.2 Quantitative Analysis Approach The quantitative analysis was accomplished in three broad steps:
1. Establish hypotheses 2. Explore available primary and secondary data 3. Test hypotheses
The hypotheses to be tested were established in cooperation with the USDOL and were as follows:
Assessment of the Impact of the 2002 Reed Act Distribution
Center for Employment Security Education and Research 91
Hypothesis 1: High unemployment rates will lead the states to improve their solvency, rather than committing their Reed Act funds to specific uses.
Hypothesis 2: States with a high percent of labor force unionization are more likely to increase benefit payments.
Hypothesis 3: States with a higher per capita GDP and low unemployment rates are more likely to increase benefit payments.
Hypothesis 4: States that are more solvent are likely to spend their Reed Act funds on benefit expansions. States that have low solvency lev-els will not spend their Reed Act funds on benefit expansions.
Hypothesis 5: States that are more solvent are likely to spend their Reed Act funds on tax cuts. States that have low solvency levels will not spend their Reed Act funds on tax cuts.
Hypothesis 6: States with higher unemployment rates, lower GDP and higher high cost multiples are more likely to extend benefit duration or expand eligibility.
Prior to testing these hypotheses the team examined a broad array of primary and sec-ondary data that were available. This included data provided by NASWA from the sur-veys completed in the fall of 2002 and winter of 2004. It also included status reports on state spending that were produced as part of this research effort. Other secondary sources included economic and labor statistics from both the Bureau of Labor Statistics at USDOL and the Bureau of Economic Analysis at the Department of Commerce. Other research is cited as used in the analysis. The informal examination of economic variables included both charting of variables such as the Trust Fund Balance (TFB), AWBA, the unemployment rate, and evaluation of these among the groupings of states into three AHCM groups. The third step of the quantitative analysis, to formally test the hypotheses, was initially to be accomplished through multiple regression models of economic indicator data. Upon further evaluation, and after attempting to structure data sets that provided suffi-cient fidelity for hypothesis testing, the team abandoned this approach in favor of a more limited, but ultimately more successful, approach. This second phase of the hy-pothesis testing involved grouping states by a relevant variable, and then examining the difference of these groupings on the variable to be tested. The process of testing is ex-plained in more detail in section IV.4.2. The information in this quantitative section follows the approach used by the team, al-though the information presented here is shown in summary form. 4.1.3 Data limitations and other challenges
Assessment of the Impact of the 2002 Reed Act Distribution
Center for Employment Security Education and Research 92
As has been alluded to in the above sections, the research team faced a number of limi-tations in the analysis. In general these can be categorized as follows:
1. Limitations in availability of data 2. Limitations in available data 3. Consideration of the use of standard statistical techniques as the sample
used represents a census of the states 4. Lag in data availability 5. Complexity of motivations and factors influencing states’ decisions 6. The effect being measured is small compared to overall economic forces 7. Small population and/or sample, and small number of observation in each
grouping (i.e., small cell sizes) 8. Changes in baseline variables over time and the choice of base period
Each of the first three limitations are inherent in the data sources being used and cannot easily be eliminated. Thus data that have not been collected and data that have been collected, but not in a usable format are of limited value. The fact that the sample is the same as the population means we must be careful in interpreting the results of the hy-pothesis testing, although the correlation of certain groupings should be considered very sound. The remaining five challenges can and have to a certain extent be mitigated. We have for example avoided the lag complexities and the co-linearity of variables inherent in multiple regression analysis by grouping the states according to one of the variable to be tested and then comparing the groups. This approach helps mitigate the small popu-lation effect, but can increase the challenges with small sample and cell sizes. The lat-ter was on occasion dealt with by combining cells to ensure the tests yielded significant results. One issue emerges as groups are compared over time has to do with the use of moving group definitions. For example, once a threshold has been established based on a variable in a given year/quarter, a state may move from one group to an-other over time as the value of this variable changes over time. The operational ap-proach has been to allow the groupings to change to reflect most accurately what the grouping is, as opposed to what states are in each group. This definition is consistent with the testing of hypothesis about groups, as opposed to testing hypothesis about the behavior of individual states. 4.1.4 Definitions of terms used in the quantitative analysis The quantitative analysis uses a number of terms that are explained below: Hypotheses testing: The process of systematically testing predicted relationships
using common statistical methods. This study uses two
Assessment of the Impact of the 2002 Reed Act Distribution
Center for Employment Security Education and Research 93
main tests: 1) t-test of the mean assuming unequal vari-ances, and 2) z-test of two proportions.
AHCM Groups: The Average High Cost Multiple (AHCM) has been defined
in this paper, but the use of groups based on the AHCM is a further enhancement, whereby certain relationships are tested by grouping the states by their AHCM (as a proxy for solvency). This grouping method allows the research to em-ploy the statistical tests necessary for hypothesis testing.
Average of AWBA: The AWBA has been defined in the text. The Average of the AWBA is simply the average across states that have been grouped together, and over a period of time (e.g., a quarter). This is an unweighted average.
Months in Reserve: Similar to the AHCM, but the Months in Reserve, refers to the number of months a state has in reserves based on the revenue and expenses of the Trust Fund in that particular quarter.
TFB: Trust Fund Balance. Refers to a part the USDOL UI Sum-mary publication of quarterly TFB and related measures for each state and territory.
Unemployment Rate: The unemployment rate for all non-farm civilian workers (de-fined and calculated by the Bureau of Labor Statistics).
Covered employment: The number of workers covered by UI Laws. Per capita income: The mean income computed for every man, woman, and
child in a geographic area. It is derived by dividing the total income of all people 15 years old and over in a geographic area by the total population in that area.28
4.2 TRENDS OF EMPLOYMENT RELATED VARIABLES FOR SELECT STATES To gain insight into the similarities and differences in how key economic variables moved over time in different states and across the country, the team started out by charting certain key variables for the data set. The graphics presented here are de-monstrative of the type of graphics the team evaluated. The graphs shown here help illustrate two data artifacts that must be considered in the hypotheses testing:
28 Note: Income is not collected for people under 15 years old even though those people are included in the denominator of per
capita income.
Assessment of the Impact of the 2002 Reed Act Distribution
Center for Employment Security Education and Research 94
1. Unemployment trends vary greatly across the country both in absolute and relative terms
2. The relationship between unemployment and the trust fund balances, al-though always an inverse, is not equal among the states
The charts are presented below for the nine states examined in the qualitative study: Iowa, Louisiana, Michigan, Minnesota, Montana, New Jersey, Ohio, Virginia, and Wash-ington. Please note that all of the charts use the same left and right hand axis scale to ease of visual comparison. The source for all the graphs is the UI Data summary.
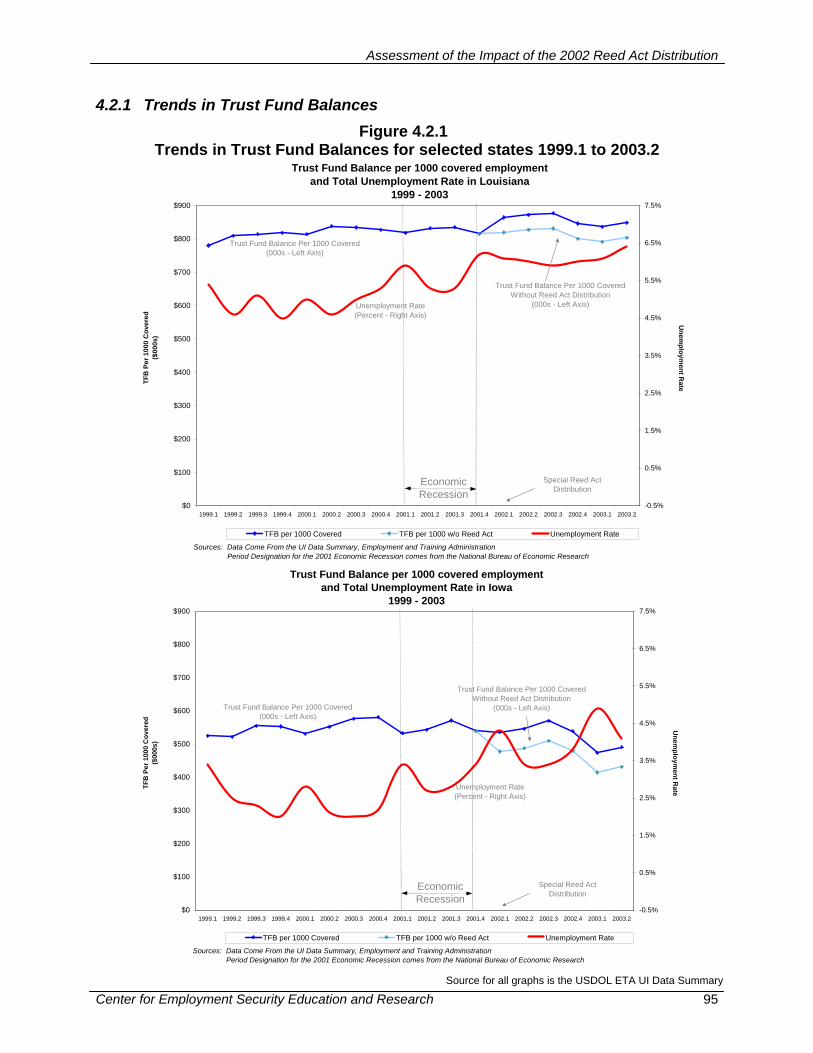
Assessment of the Impact of the 2002 Reed Act Distribution
Center for Employment Security Education and Research 95
4.2.1 Trends in Trust Fund Balances Figure 4.2.1
Trends in Trust Fund Balances for selected states 1999.1 to 2003.2
Trust Fund Balance per 1000 covered employment and Total Unemployment Rate in Louisiana
1999 - 2003
$0
$100
$200
$300
$400
$500
$600
$700
$800
$900
1999.1 1999.2 1999.3 1999.4 2000.1 2000.2 2000.3 2000.4 2001.1 2001.2 2001.3 2001.4 2002.1 2002.2 2002.3 2002.4 2003.1 2003.2-0.5%
0.5%
1.5%
2.5%
3.5%
4.5%
5.5%
6.5%
7.5%
TFB per 1000 Covered TFB per 1000 w/o Reed Act Unemployment Rate
Unem
ployment R
ate
Special Reed Act Distribution
EconomicRecession
Sources: Data Come From the UI Data Summary, Employment and Training Administration Period Designation for the 2001 Economic Recession comes from the National Bureau of Economic Research
TFB
Per
100
0 C
over
ed($
000s
)
Trust Fund Balance Per 1000 Covered (000s - Left Axis)
Unemployment Rate(Percent - Right Axis)
Trust Fund Balance Per 1000 Covered Without Reed Act Distribution
(000s - Left Axis)
Trust Fund Balance per 1000 covered employment and Total Unemployment Rate in Iowa
1999 - 2003
$0
$100
$200
$300
$400
$500
$600
$700
$800
$900
1999.1 1999.2 1999.3 1999.4 2000.1 2000.2 2000.3 2000.4 2001.1 2001.2 2001.3 2001.4 2002.1 2002.2 2002.3 2002.4 2003.1 2003.2-0.5%
0.5%
1.5%
2.5%
3.5%
4.5%
5.5%
6.5%
7.5%
TFB per 1000 Covered TFB per 1000 w/o Reed Act Unemployment Rate
Unem
ployment R
ate
Special Reed Act Distribution
EconomicRecession
Sources: Data Come From the UI Data Summary, Employment and Training Administration Period Designation for the 2001 Economic Recession comes from the National Bureau of Economic Research
TFB
Per
100
0 C
over
ed($
000s
)
Trust Fund Balance Per 1000 Covered (000s - Left Axis)
Unemployment Rate(Percent - Right Axis)
Trust Fund Balance Per 1000 Covered Without Reed Act Distribution
(000s - Left Axis)
Source for all graphs is the USDOL ETA UI Data Summary
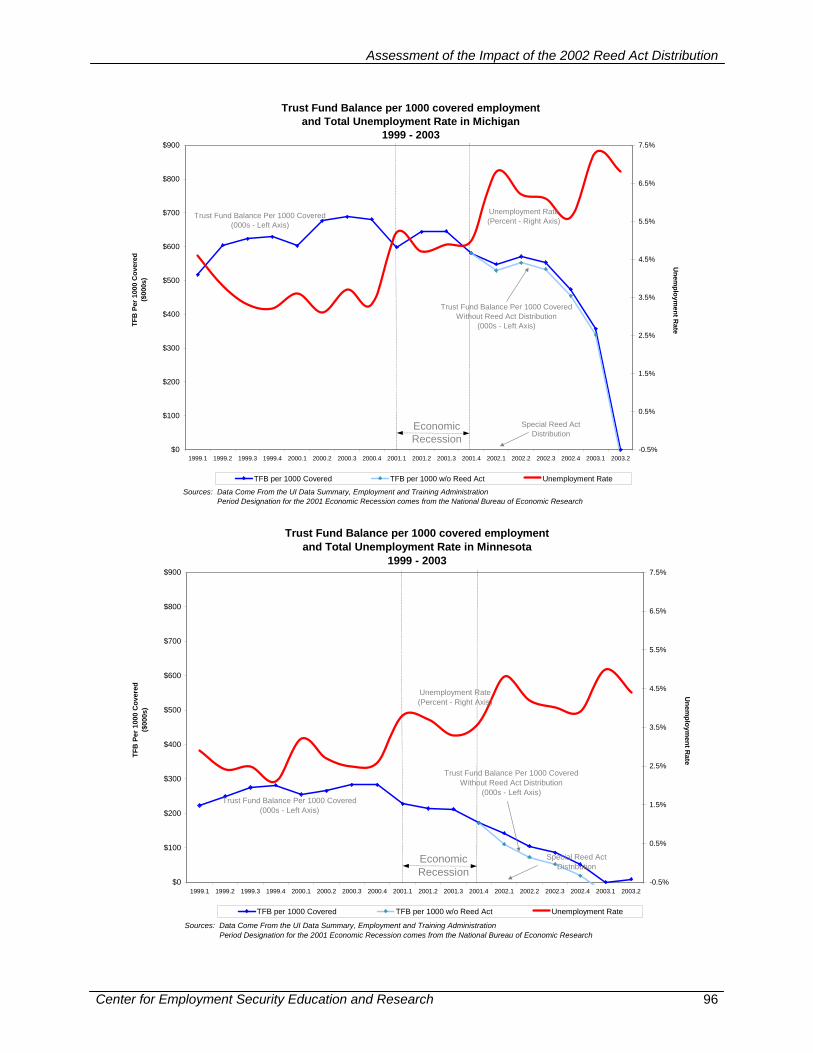
Assessment of the Impact of the 2002 Reed Act Distribution
Center for Employment Security Education and Research 96
Trust Fund Balance per 1000 covered employment and Total Unemployment Rate in Michigan
1999 - 2003
$0
$100
$200
$300
$400
$500
$600
$700
$800
$900
1999.1 1999.2 1999.3 1999.4 2000.1 2000.2 2000.3 2000.4 2001.1 2001.2 2001.3 2001.4 2002.1 2002.2 2002.3 2002.4 2003.1 2003.2-0.5%
0.5%
1.5%
2.5%
3.5%
4.5%
5.5%
6.5%
7.5%
TFB per 1000 Covered TFB per 1000 w/o Reed Act Unemployment Rate
Unem
ployment R
ate
Special Reed Act Distribution
EconomicRecession
Sources: Data Come From the UI Data Summary, Employment and Training Administration Period Designation for the 2001 Economic Recession comes from the National Bureau of Economic Research
TFB
Per
100
0 C
over
ed($
000s
)
Trust Fund Balance Per 1000 Covered (000s - Left Axis)
Unemployment Rate(Percent - Right Axis)
Trust Fund Balance Per 1000 Covered Without Reed Act Distribution
(000s - Left Axis)
Trust Fund Balance per 1000 covered employment and Total Unemployment Rate in Minnesota
1999 - 2003
$0
$100
$200
$300
$400
$500
$600
$700
$800
$900
1999.1 1999.2 1999.3 1999.4 2000.1 2000.2 2000.3 2000.4 2001.1 2001.2 2001.3 2001.4 2002.1 2002.2 2002.3 2002.4 2003.1 2003.2-0.5%
0.5%
1.5%
2.5%
3.5%
4.5%
5.5%
6.5%
7.5%
TFB per 1000 Covered TFB per 1000 w/o Reed Act Unemployment Rate
Unem
ployment R
ate
Special Reed Act Distribution
EconomicRecession
Sources: Data Come From the UI Data Summary, Employment and Training Administration Period Designation for the 2001 Economic Recession comes from the National Bureau of Economic Research
TFB
Per
100
0 C
over
ed($
000s
)
Trust Fund Balance Per 1000 Covered (000s - Left Axis)
Unemployment Rate(Percent - Right Axis)
Trust Fund Balance Per 1000 Covered Without Reed Act Distribution
(000s - Left Axis)
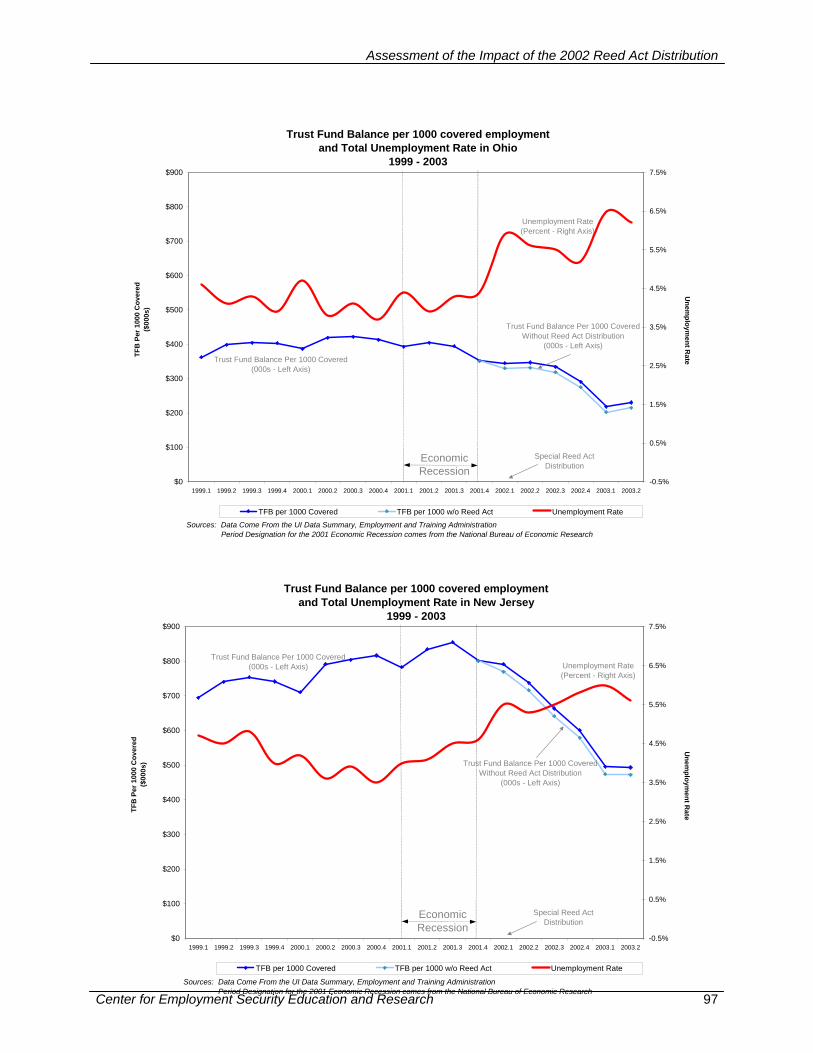
Assessment of the Impact of the 2002 Reed Act Distribution
Center for Employment Security Education and Research 97
Trust Fund Balance per 1000 covered employment and Total Unemployment Rate in New Jersey
1999 - 2003
$0
$100
$200
$300
$400
$500
$600
$700
$800
$900
1999.1 1999.2 1999.3 1999.4 2000.1 2000.2 2000.3 2000.4 2001.1 2001.2 2001.3 2001.4 2002.1 2002.2 2002.3 2002.4 2003.1 2003.2-0.5%
0.5%
1.5%
2.5%
3.5%
4.5%
5.5%
6.5%
7.5%
TFB per 1000 Covered TFB per 1000 w/o Reed Act Unemployment Rate
Unem
ployment R
ate
Special Reed Act Distribution
EconomicRecession
Sources: Data Come From the UI Data Summary, Employment and Training Administration Period Designation for the 2001 Economic Recession comes from the National Bureau of Economic Research
TFB
Per
100
0 C
over
ed($
000s
)
Trust Fund Balance Per 1000 Covered (000s - Left Axis) Unemployment Rate
(Percent - Right Axis)
Trust Fund Balance Per 1000 Covered Without Reed Act Distribution
(000s - Left Axis)
Trust Fund Balance per 1000 covered employment and Total Unemployment Rate in Ohio
1999 - 2003
$0
$100
$200
$300
$400
$500
$600
$700
$800
$900
1999.1 1999.2 1999.3 1999.4 2000.1 2000.2 2000.3 2000.4 2001.1 2001.2 2001.3 2001.4 2002.1 2002.2 2002.3 2002.4 2003.1 2003.2-0.5%
0.5%
1.5%
2.5%
3.5%
4.5%
5.5%
6.5%
7.5%
TFB per 1000 Covered TFB per 1000 w/o Reed Act Unemployment Rate
Unem
ployment R
ate
Special Reed Act Distribution
EconomicRecession
Sources: Data Come From the UI Data Summary, Employment and Training Administration Period Designation for the 2001 Economic Recession comes from the National Bureau of Economic Research
TFB
Per
100
0 C
over
ed($
000s
)
Trust Fund Balance Per 1000 Covered (000s - Left Axis)
Unemployment Rate(Percent - Right Axis)
Trust Fund Balance Per 1000 Covered Without Reed Act Distribution
(000s - Left Axis)
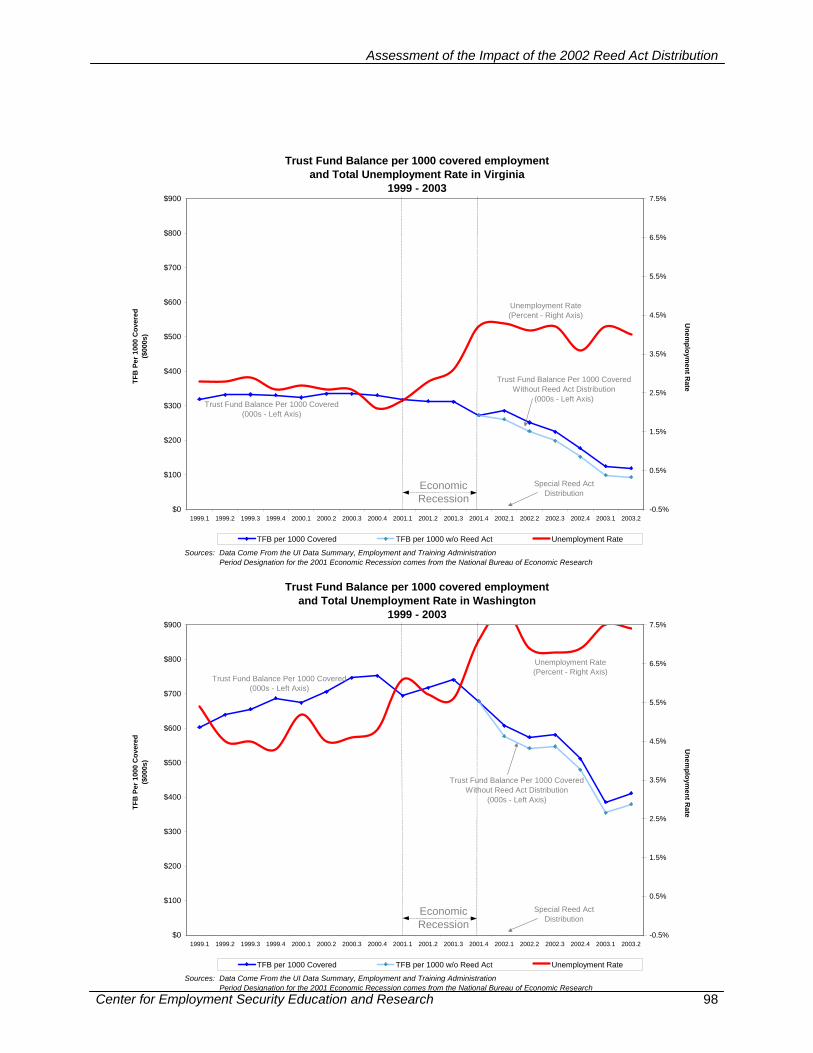
Assessment of the Impact of the 2002 Reed Act Distribution
Center for Employment Security Education and Research 98
Trust Fund Balance per 1000 covered employment and Total Unemployment Rate in Virginia
1999 - 2003
$0
$100
$200
$300
$400
$500
$600
$700
$800
$900
1999.1 1999.2 1999.3 1999.4 2000.1 2000.2 2000.3 2000.4 2001.1 2001.2 2001.3 2001.4 2002.1 2002.2 2002.3 2002.4 2003.1 2003.2-0.5%
0.5%
1.5%
2.5%
3.5%
4.5%
5.5%
6.5%
7.5%
TFB per 1000 Covered TFB per 1000 w/o Reed Act Unemployment Rate
Unem
ployment R
ate
Special Reed Act Distribution
EconomicRecession
Sources: Data Come From the UI Data Summary, Employment and Training Administration Period Designation for the 2001 Economic Recession comes from the National Bureau of Economic Research
TFB
Per
100
0 C
over
ed($
000s
)
Trust Fund Balance Per 1000 Covered (000s - Left Axis)
Unemployment Rate(Percent - Right Axis)
Trust Fund Balance Per 1000 Covered Without Reed Act Distribution
(000s - Left Axis)
Trust Fund Balance per 1000 covered employment and Total Unemployment Rate in Washington
1999 - 2003
$0
$100
$200
$300
$400
$500
$600
$700
$800
$900
1999.1 1999.2 1999.3 1999.4 2000.1 2000.2 2000.3 2000.4 2001.1 2001.2 2001.3 2001.4 2002.1 2002.2 2002.3 2002.4 2003.1 2003.2-0.5%
0.5%
1.5%
2.5%
3.5%
4.5%
5.5%
6.5%
7.5%
TFB per 1000 Covered TFB per 1000 w/o Reed Act Unemployment Rate
Unem
ployment R
ate
Special Reed Act Distribution
EconomicRecession
Sources: Data Come From the UI Data Summary, Employment and Training Administration Period Designation for the 2001 Economic Recession comes from the National Bureau of Economic Research
TFB
Per
100
0 C
over
ed($
000s
)
Trust Fund Balance Per 1000 Covered (000s - Left Axis)
Unemployment Rate(Percent - Right Axis)
Trust Fund Balance Per 1000 Covered Without Reed Act Distribution
(000s - Left Axis)
Assessment of the Impact of the 2002 Reed Act Distribution
Center for Employment Security Education and Research 99
4.3. TRUST FUND MEASURES AND DESCRIPTIVE STATISTICS29 4.3.1 Introduction This section provides a number of charts and tables that display the relationship of eco-nomic and trust fund variables. Some of these graphs use the definition of the Average High Cost Multiple (AHCM) as the basis for grouping the states, and then evaluating dif-ferences among the AHCM groupings. Analysts consider a state UI program relatively solvent when it has enough funds in its trust fund account to cover its UI benefit costs during a year in which there is an eco-nomic recession. The “Average High Cost Multiple for the Most Recent Calendar Year” (AHCM) is one measure of state UI program solvency.30 An AHCM value of 1.0 sug-gests the state has enough funds in its trust fund account to cover UI benefit costs in the next 12 months comparable to the average payout for the most recent three reces-sions.31 Generally a higher AHCM suggests greater solvency and a lower AHCM sug-gests a greater risk of insolvency and a likely need to borrow to cover UI benefit costs during a recession. Figure 4.3.1, “States Grouped by the Average High Cost Multiple,” shows which states were relatively solvent and which states were at a greater risk of insolvency at the end of March, 2002, shortly after states received their Reed Act Distri-butions. The first column shows states with an AHCM below 0.5. Other things being equal, these states face the greatest risk of insolvency during 2002 and early 2003. In fact, by the end of Q2 2003, New York already had borrowed from the federal govern-ment to cover UI benefit costs and Texas probably would have borrowed if it had not received the Reed Act distribution in March 2002. The second group of states with AHCMs from 0.5 to 1.0 is at some risk of insolvency if high unemployment continues. The third group of states with AHCMs at 1.0 or greater faces little risk of insolvency as long as the recession is not too severe or too long. This examination of the AHCM shows that although some changes occur in the group-ing over time, the grouping is relatively stable with only seven states moving down from one grouping to the next below over the period. The AHCM groupings indicated some trends in UI related variables are correlated with the trust fund balance as measured by the AHCM. However, these trends are some-what masked by potential for counterweighing factors within each of the grouping that 29 Source for all graphs in this section, unless otherwise noted, is: U.S. Department of Labor, Office of Workforce Security,
Division of Fiscal and Actuarial Services, UI Data Summary.
30 The Average High Cost Multiple is defined by the U.S. Department of Labor as the calendar year reserve ratio (or trust fund balance as a percent of total covered wages) divided by the Average High Cost Rate. The Average High Cost Rate is the average of the three highest calendar year benefit cost rates in the last 20 years (or a period including three recessions, if longer). Benefit cost rates are benefits paid (excluding reimbursable benefits) as a percent of total wages in covered em-ployment. See U.S. Department of Labor, Office of Workforce Security, Division of Fiscal and Actuarial Services, UI Data Summary, 1st Quarter CY 2002, June 2002.
31 There is no general agreement on a standard level for a state’s AHCM at the beginning of a recession. Some analysts have argued for an AHCM standard as high as 1.5.
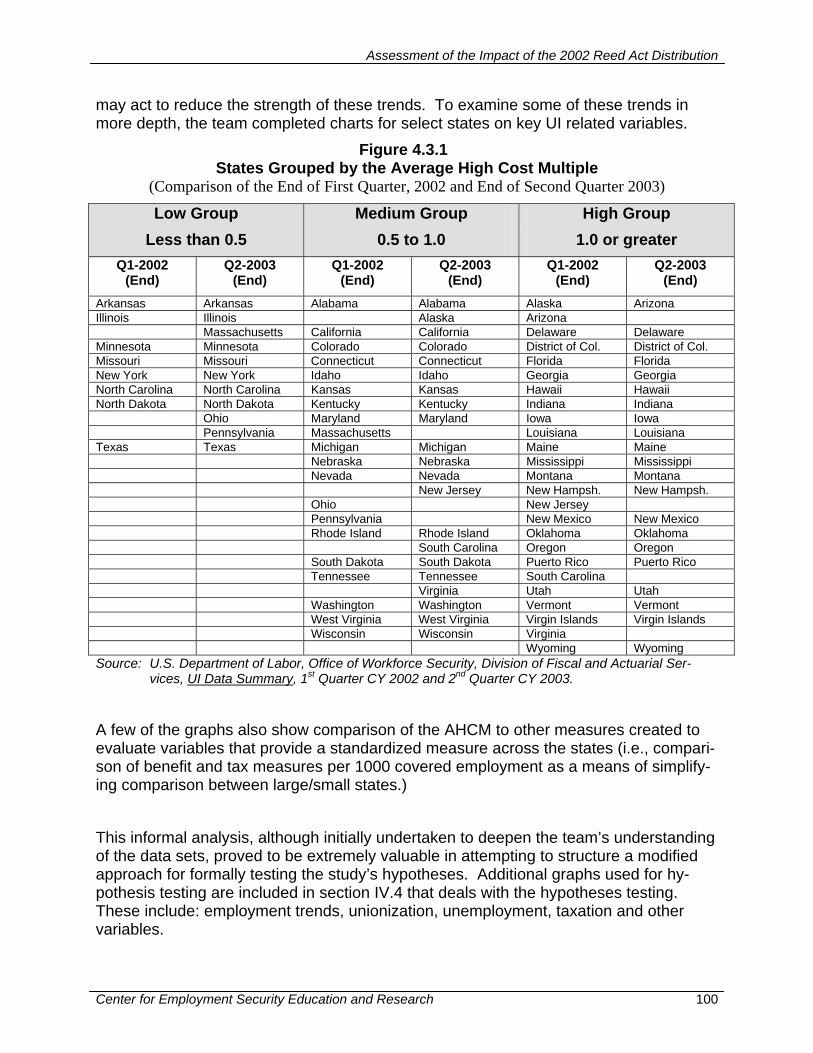
Assessment of the Impact of the 2002 Reed Act Distribution
Center for Employment Security Education and Research 100
may act to reduce the strength of these trends. To examine some of these trends in more depth, the team completed charts for select states on key UI related variables.
Figure 4.3.1 States Grouped by the Average High Cost Multiple
(Comparison of the End of First Quarter, 2002 and End of Second Quarter 2003)
Low Group Less than 0.5
Medium Group 0.5 to 1.0
High Group 1.0 or greater
Q1-2002 (End)
Q2-2003 (End)
Q1-2002 (End)
Q2-2003 (End)
Q1-2002 (End)
Q2-2003 (End)
Arkansas Arkansas Alabama Alabama Alaska Arizona Illinois Illinois Alaska Arizona Massachusetts California California Delaware Delaware Minnesota Minnesota Colorado Colorado District of Col. District of Col. Missouri Missouri Connecticut Connecticut Florida Florida New York New York Idaho Idaho Georgia Georgia North Carolina North Carolina Kansas Kansas Hawaii Hawaii North Dakota North Dakota Kentucky Kentucky Indiana Indiana Ohio Maryland Maryland Iowa Iowa Pennsylvania Massachusetts Louisiana Louisiana Texas Texas Michigan Michigan Maine Maine Nebraska Nebraska Mississippi Mississippi Nevada Nevada Montana Montana New Jersey New Hampsh. New Hampsh. Ohio New Jersey Pennsylvania New Mexico New Mexico Rhode Island Rhode Island Oklahoma Oklahoma South Carolina Oregon Oregon South Dakota South Dakota Puerto Rico Puerto Rico Tennessee Tennessee South Carolina Virginia Utah Utah Washington Washington Vermont Vermont West Virginia West Virginia Virgin Islands Virgin Islands Wisconsin Wisconsin Virginia Wyoming Wyoming Source: U.S. Department of Labor, Office of Workforce Security, Division of Fiscal and Actuarial Ser-
vices, UI Data Summary, 1st Quarter CY 2002 and 2nd Quarter CY 2003.
A few of the graphs also show comparison of the AHCM to other measures created to evaluate variables that provide a standardized measure across the states (i.e., compari-son of benefit and tax measures per 1000 covered employment as a means of simplify-ing comparison between large/small states.) This informal analysis, although initially undertaken to deepen the team’s understanding of the data sets, proved to be extremely valuable in attempting to structure a modified approach for formally testing the study’s hypotheses. Additional graphs used for hy-pothesis testing are included in section IV.4 that deals with the hypotheses testing. These include: employment trends, unionization, unemployment, taxation and other variables.
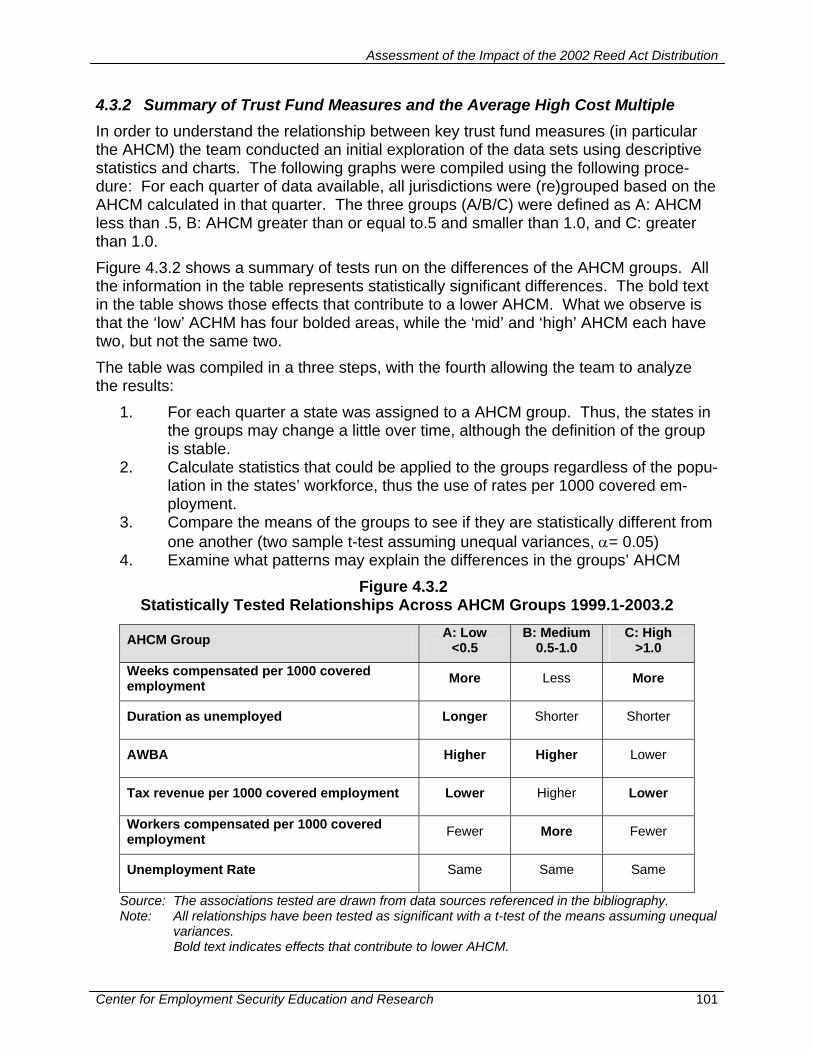
Assessment of the Impact of the 2002 Reed Act Distribution
Center for Employment Security Education and Research 101
4.3.2 Summary of Trust Fund Measures and the Average High Cost Multiple In order to understand the relationship between key trust fund measures (in particular the AHCM) the team conducted an initial exploration of the data sets using descriptive statistics and charts. The following graphs were compiled using the following proce-dure: For each quarter of data available, all jurisdictions were (re)grouped based on the AHCM calculated in that quarter. The three groups (A/B/C) were defined as A: AHCM less than .5, B: AHCM greater than or equal to.5 and smaller than 1.0, and C: greater than 1.0. Figure 4.3.2 shows a summary of tests run on the differences of the AHCM groups. All the information in the table represents statistically significant differences. The bold text in the table shows those effects that contribute to a lower AHCM. What we observe is that the ‘low’ ACHM has four bolded areas, while the ‘mid’ and ‘high’ AHCM each have two, but not the same two. The table was compiled in a three steps, with the fourth allowing the team to analyze the results:
1. For each quarter a state was assigned to a AHCM group. Thus, the states in the groups may change a little over time, although the definition of the group is stable.
2. Calculate statistics that could be applied to the groups regardless of the popu-lation in the states’ workforce, thus the use of rates per 1000 covered em-ployment.
3. Compare the means of the groups to see if they are statistically different from one another (two sample t-test assuming unequal variances, α= 0.05)
4. Examine what patterns may explain the differences in the groups’ AHCM Figure 4.3.2
Statistically Tested Relationships Across AHCM Groups 1999.1-2003.2
Source: The associations tested are drawn from data sources referenced in the bibliography. Note: All relationships have been tested as significant with a t-test of the means assuming unequal
variances. Bold text indicates effects that contribute to lower AHCM.
AHCM Group A: Low <0.5
B: Medium 0.5-1.0
C: High >1.0
Weeks compensated per 1000 covered employment More Less More
Duration as unemployed Longer Shorter Shorter
AWBA Higher Higher Lower
Tax revenue per 1000 covered employment Lower Higher Lower
Workers compensated per 1000 covered employment Fewer More Fewer
Unemployment Rate Same Same Same
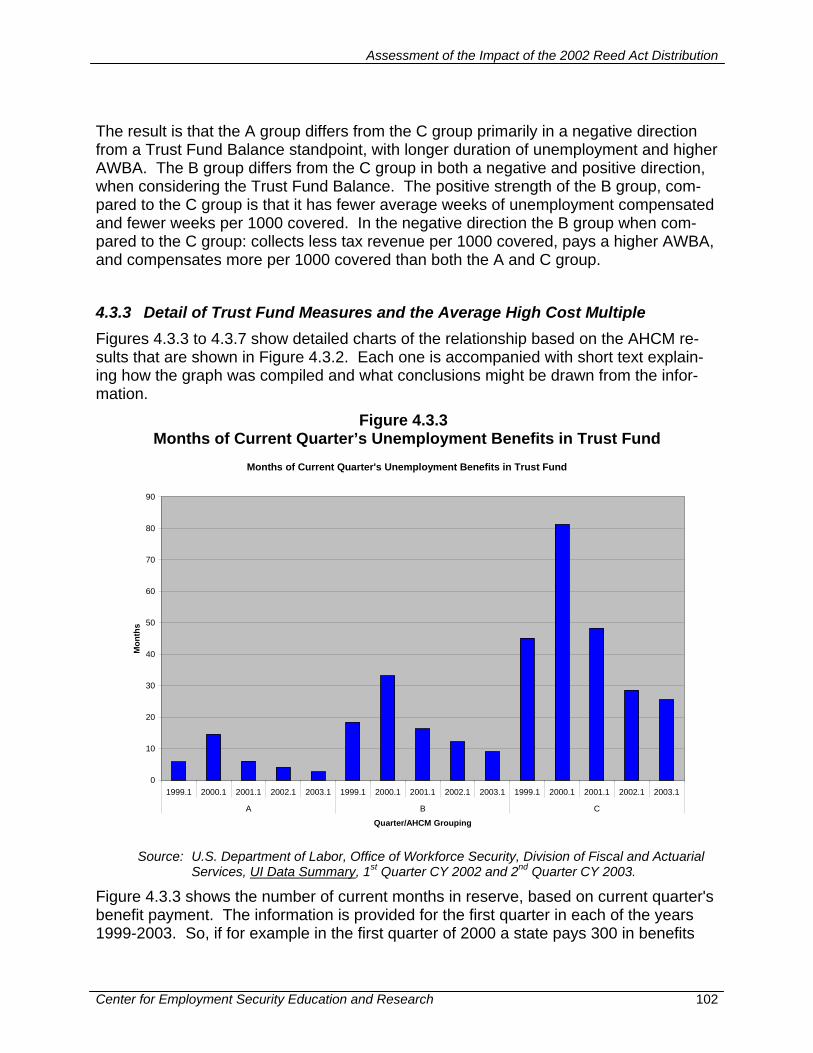
Assessment of the Impact of the 2002 Reed Act Distribution
Center for Employment Security Education and Research 102
The result is that the A group differs from the C group primarily in a negative direction from a Trust Fund Balance standpoint, with longer duration of unemployment and higher AWBA. The B group differs from the C group in both a negative and positive direction, when considering the Trust Fund Balance. The positive strength of the B group, com-pared to the C group is that it has fewer average weeks of unemployment compensated and fewer weeks per 1000 covered. In the negative direction the B group when com-pared to the C group: collects less tax revenue per 1000 covered, pays a higher AWBA, and compensates more per 1000 covered than both the A and C group. 4.3.3 Detail of Trust Fund Measures and the Average High Cost Multiple Figures 4.3.3 to 4.3.7 show detailed charts of the relationship based on the AHCM re-sults that are shown in Figure 4.3.2. Each one is accompanied with short text explain-ing how the graph was compiled and what conclusions might be drawn from the infor-mation.
Figure 4.3.3 Months of Current Quarter’s Unemployment Benefits in Trust Fund
Months of Current Quarter's Unemployment Benefits in Trust Fund
0
10
20
30
40
50
60
70
80
90
1999.1 2000.1 2001.1 2002.1 2003.1 1999.1 2000.1 2001.1 2002.1 2003.1 1999.1 2000.1 2001.1 2002.1 2003.1
A B C
Quarter/AHCM Grouping
Mon
ths
Source: U.S. Department of Labor, Office of Workforce Security, Division of Fiscal and Actuarial
Services, UI Data Summary, 1st Quarter CY 2002 and 2nd Quarter CY 2003.
Figure 4.3.3 shows the number of current months in reserve, based on current quarter's benefit payment. The information is provided for the first quarter in each of the years 1999-2003. So, if for example in the first quarter of 2000 a state pays 300 in benefits
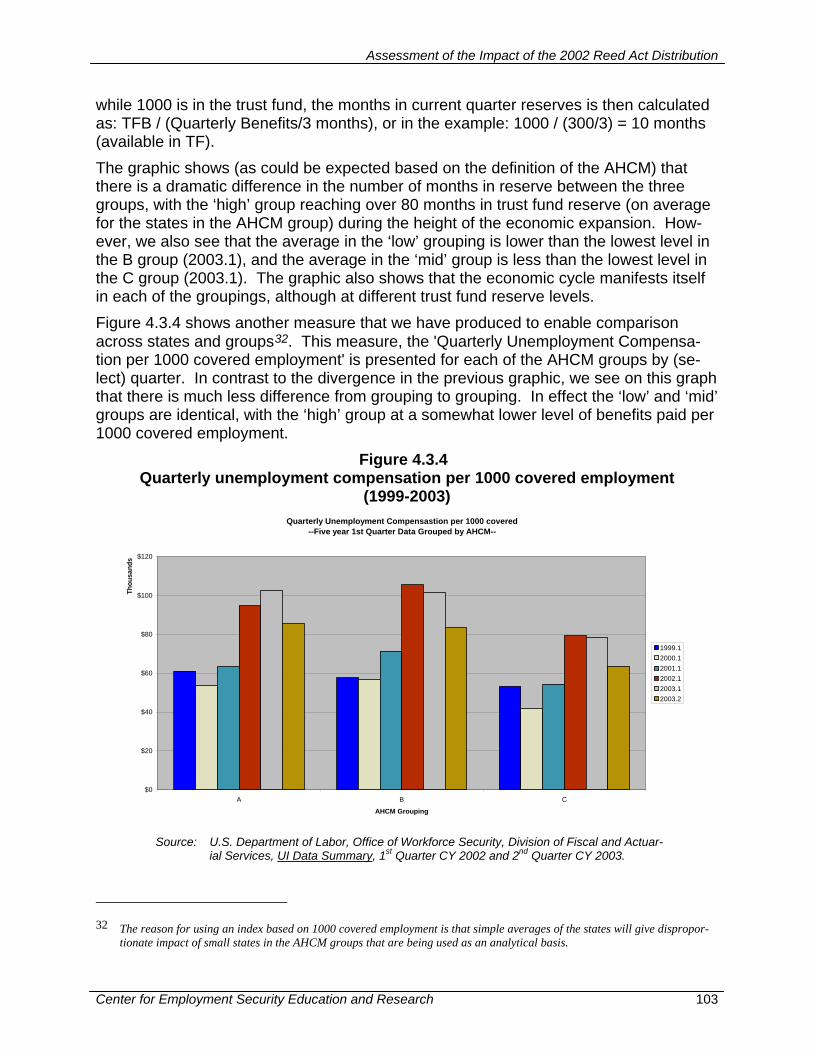
Assessment of the Impact of the 2002 Reed Act Distribution
Center for Employment Security Education and Research 103
while 1000 is in the trust fund, the months in current quarter reserves is then calculated as: TFB / (Quarterly Benefits/3 months), or in the example: 1000 / (300/3) = 10 months (available in TF). The graphic shows (as could be expected based on the definition of the AHCM) that there is a dramatic difference in the number of months in reserve between the three groups, with the ‘high’ group reaching over 80 months in trust fund reserve (on average for the states in the AHCM group) during the height of the economic expansion. How-ever, we also see that the average in the ‘low’ grouping is lower than the lowest level in the B group (2003.1), and the average in the ‘mid’ group is less than the lowest level in the C group (2003.1). The graphic also shows that the economic cycle manifests itself in each of the groupings, although at different trust fund reserve levels. Figure 4.3.4 shows another measure that we have produced to enable comparison across states and groups32. This measure, the 'Quarterly Unemployment Compensa-tion per 1000 covered employment' is presented for each of the AHCM groups by (se-lect) quarter. In contrast to the divergence in the previous graphic, we see on this graph that there is much less difference from grouping to grouping. In effect the ‘low’ and ‘mid’ groups are identical, with the ‘high’ group at a somewhat lower level of benefits paid per 1000 covered employment.
Figure 4.3.4 Quarterly unemployment compensation per 1000 covered employment
(1999-2003) Quarterly Unemployment Compensastion per 1000 covered
--Five year 1st Quarter Data Grouped by AHCM--
$0
$20
$40
$60
$80
$100
$120
A B C
Thou
sand
s
AHCM Grouping
1999.12000.12001.12002.12003.12003.2
Source: U.S. Department of Labor, Office of Workforce Security, Division of Fiscal and Actuar-
ial Services, UI Data Summary, 1st Quarter CY 2002 and 2nd Quarter CY 2003.
32 The reason for using an index based on 1000 covered employment is that simple averages of the states will give dispropor-
tionate impact of small states in the AHCM groups that are being used as an analytical basis.
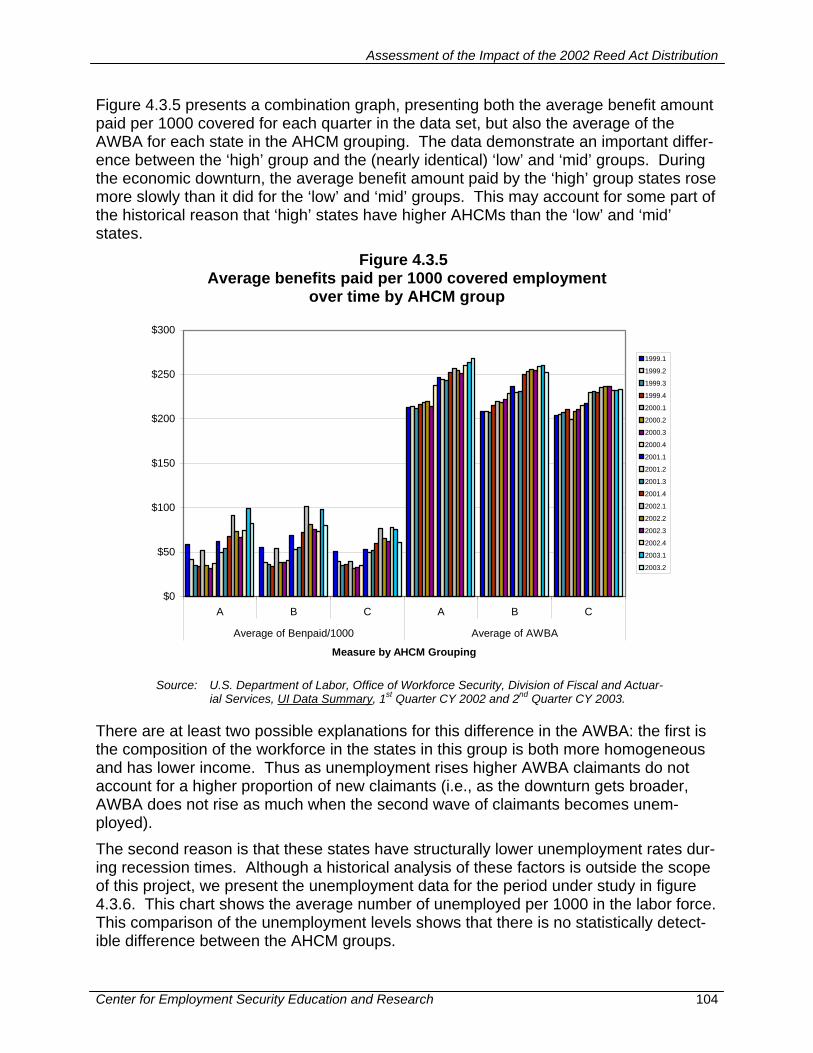
Assessment of the Impact of the 2002 Reed Act Distribution
Center for Employment Security Education and Research 104
Figure 4.3.5 presents a combination graph, presenting both the average benefit amount paid per 1000 covered for each quarter in the data set, but also the average of the AWBA for each state in the AHCM grouping. The data demonstrate an important differ-ence between the ‘high’ group and the (nearly identical) ‘low’ and ‘mid’ groups. During the economic downturn, the average benefit amount paid by the ‘high’ group states rose more slowly than it did for the ‘low’ and ‘mid’ groups. This may account for some part of the historical reason that ‘high’ states have higher AHCMs than the ‘low’ and ‘mid’ states.
Figure 4.3.5 Average benefits paid per 1000 covered employment
over time by AHCM group
$0
$50
$100
$150
$200
$250
$300
A B C A B C
Average of Benpaid/1000 Average of AWBA
Measure by AHCM Grouping
1999.1
1999.2
1999.3
1999.4
2000.1
2000.2
2000.3
2000.4
2001.1
2001.2
2001.3
2001.4
2002.1
2002.2
2002.3
2002.4
2003.1
2003.2
Source: U.S. Department of Labor, Office of Workforce Security, Division of Fiscal and Actuar-
ial Services, UI Data Summary, 1st Quarter CY 2002 and 2nd Quarter CY 2003.
There are at least two possible explanations for this difference in the AWBA: the first is the composition of the workforce in the states in this group is both more homogeneous and has lower income. Thus as unemployment rises higher AWBA claimants do not account for a higher proportion of new claimants (i.e., as the downturn gets broader, AWBA does not rise as much when the second wave of claimants becomes unem-ployed). The second reason is that these states have structurally lower unemployment rates dur-ing recession times. Although a historical analysis of these factors is outside the scope of this project, we present the unemployment data for the period under study in figure 4.3.6. This chart shows the average number of unemployed per 1000 in the labor force. This comparison of the unemployment levels shows that there is no statistically detect-ible difference between the AHCM groups.
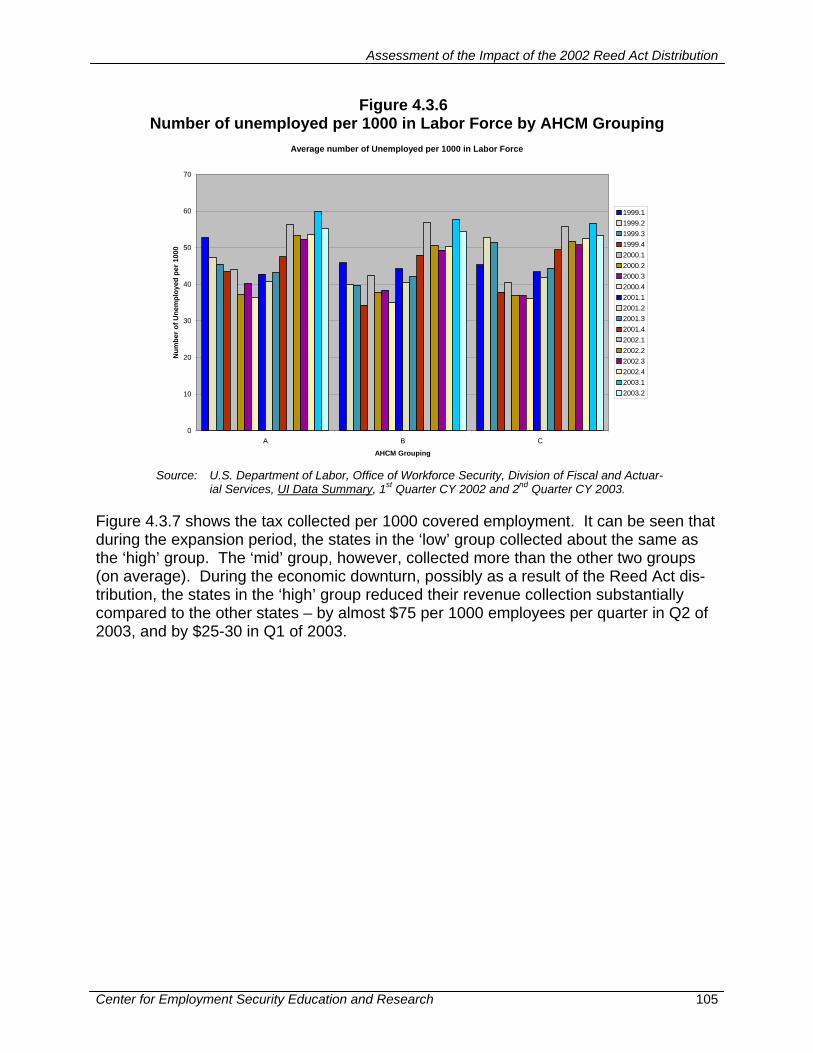
Assessment of the Impact of the 2002 Reed Act Distribution
Center for Employment Security Education and Research 105
Figure 4.3.6 Number of unemployed per 1000 in Labor Force by AHCM Grouping
Average number of Unemployed per 1000 in Labor Force
0
10
20
30
40
50
60
70
A B C
AHCM Grouping
Num
ber o
f Une
mpl
oyed
per
100
0
1999.11999.21999.31999.42000.12000.22000.32000.42001.12001.22001.32001.42002.12002.22002.32002.42003.12003.2
Source: U.S. Department of Labor, Office of Workforce Security, Division of Fiscal and Actuar-
ial Services, UI Data Summary, 1st Quarter CY 2002 and 2nd Quarter CY 2003.
Figure 4.3.7 shows the tax collected per 1000 covered employment. It can be seen that during the expansion period, the states in the ‘low’ group collected about the same as the ‘high’ group. The ‘mid’ group, however, collected more than the other two groups (on average). During the economic downturn, possibly as a result of the Reed Act dis-tribution, the states in the ‘high’ group reduced their revenue collection substantially compared to the other states – by almost $75 per 1000 employees per quarter in Q2 of 2003, and by $25-30 in Q1 of 2003.
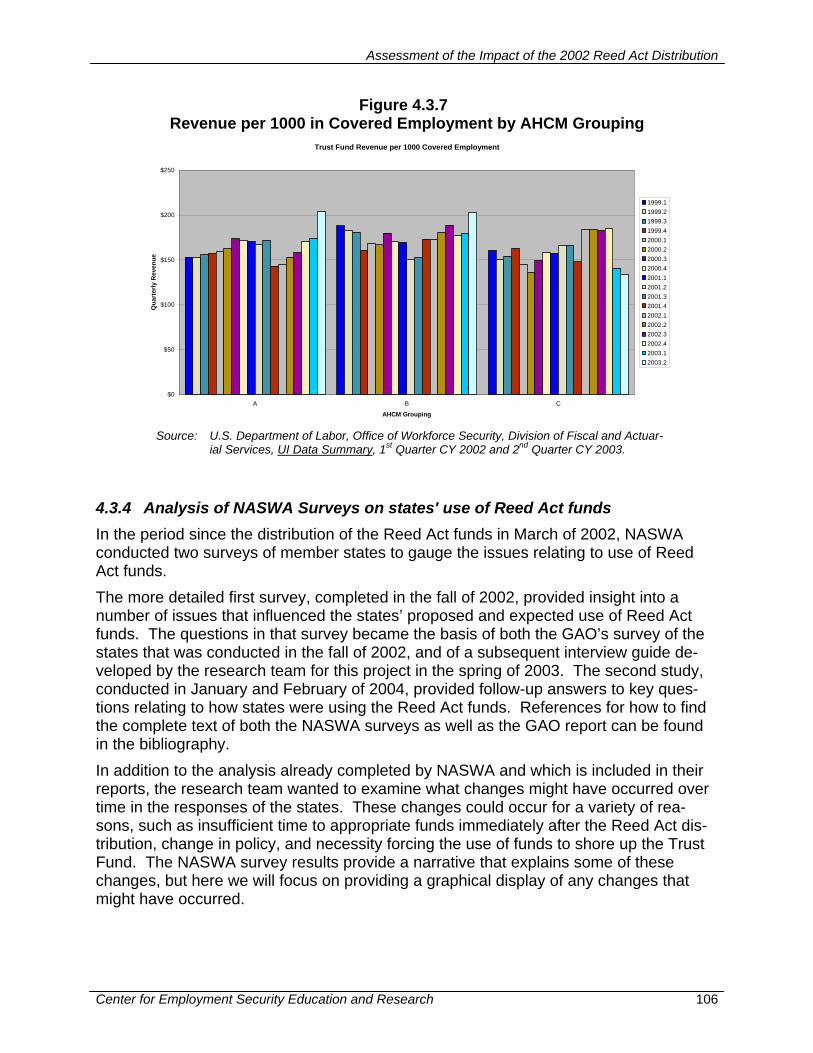
Assessment of the Impact of the 2002 Reed Act Distribution
Center for Employment Security Education and Research 106
Figure 4.3.7 Revenue per 1000 in Covered Employment by AHCM Grouping
Trust Fund Revenue per 1000 Covered Employment
$0
$50
$100
$150
$200
$250
A B C
AHCM Grouping
Qua
rter
ly R
even
ue
1999.11999.21999.31999.42000.12000.22000.32000.42001.12001.22001.32001.42002.12002.22002.32002.42003.12003.2
Source: U.S. Department of Labor, Office of Workforce Security, Division of Fiscal and Actuar-
ial Services, UI Data Summary, 1st Quarter CY 2002 and 2nd Quarter CY 2003.
4.3.4 Analysis of NASWA Surveys on states' use of Reed Act funds In the period since the distribution of the Reed Act funds in March of 2002, NASWA conducted two surveys of member states to gauge the issues relating to use of Reed Act funds. The more detailed first survey, completed in the fall of 2002, provided insight into a number of issues that influenced the states’ proposed and expected use of Reed Act funds. The questions in that survey became the basis of both the GAO’s survey of the states that was conducted in the fall of 2002, and of a subsequent interview guide de-veloped by the research team for this project in the spring of 2003. The second study, conducted in January and February of 2004, provided follow-up answers to key ques-tions relating to how states were using the Reed Act funds. References for how to find the complete text of both the NASWA surveys as well as the GAO report can be found in the bibliography. In addition to the analysis already completed by NASWA and which is included in their reports, the research team wanted to examine what changes might have occurred over time in the responses of the states. These changes could occur for a variety of rea-sons, such as insufficient time to appropriate funds immediately after the Reed Act dis-tribution, change in policy, and necessity forcing the use of funds to shore up the Trust Fund. The NASWA survey results provide a narrative that explains some of these changes, but here we will focus on providing a graphical display of any changes that might have occurred.

Assessment of the Impact of the 2002 Reed Act Distribution
Center for Employment Security Education and Research 107
Figure 4.3.8 shows a comparison of how many states indicated that they had increased benefits in the aftermath of the Reed Act distribution33 in the fall of 2002 and January of 2004. As the graphic shows, an additional 10 states had increased benefits in the pe-riod between the studies.
Figure 4.3.8 States’ increases in UI benefits (all programs)
Has or will increase benefits
0
5
10
15
20
25
30
35
40
45
50
No Yes
Response
Cou
nt o
f Sta
tes
20022004
Source: National Association of State Workforce Agencies. “State Use of the $8 Billion Reed
Act Distribution.” April 2004
A similar comparison of the remaining Reed Act funds in the trust fund indicates a simi-lar change occurred, with more states having appropriated/spent some of their Reed Act funds by the end of the second survey than at the time of the first. Figure 4.3.9 demon-strates this shift. It must be noted, however, that some states were forced to spend their Reed Act funds as a result of depleting their trust fund and entering a borrowing situation, and this accounts for some of the change.
33 It is important to note that in some cases benefits might have been increased without the Reed Act distribution.
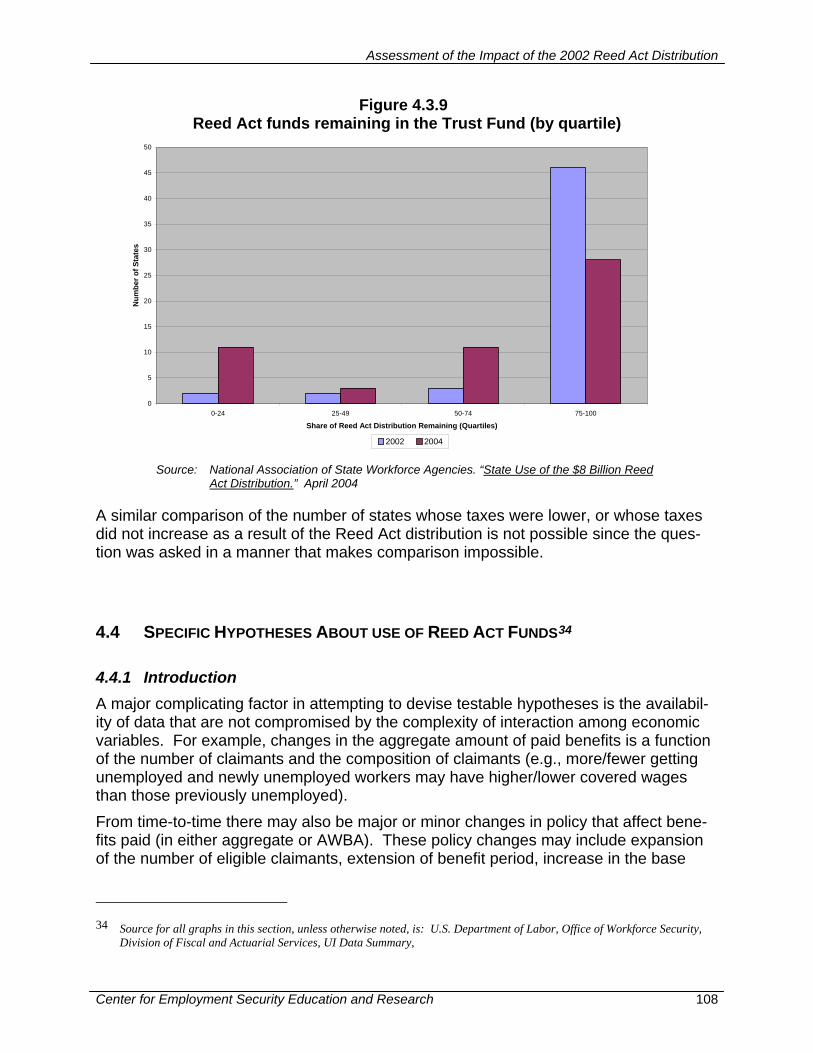
Assessment of the Impact of the 2002 Reed Act Distribution
Center for Employment Security Education and Research 108
Figure 4.3.9 Reed Act funds remaining in the Trust Fund (by quartile)
0
5
10
15
20
25
30
35
40
45
50
0-24 25-49 50-74 75-100
Share of Reed Act Distribution Remaining (Quartiles)
Num
ber o
f Sta
tes
2002 2004 Source: National Association of State Workforce Agencies. “State Use of the $8 Billion Reed
Act Distribution.” April 2004
A similar comparison of the number of states whose taxes were lower, or whose taxes did not increase as a result of the Reed Act distribution is not possible since the ques-tion was asked in a manner that makes comparison impossible.
4.4 SPECIFIC HYPOTHESES ABOUT USE OF REED ACT FUNDS34 4.4.1 Introduction A major complicating factor in attempting to devise testable hypotheses is the availabil-ity of data that are not compromised by the complexity of interaction among economic variables. For example, changes in the aggregate amount of paid benefits is a function of the number of claimants and the composition of claimants (e.g., more/fewer getting unemployed and newly unemployed workers may have higher/lower covered wages than those previously unemployed). From time-to-time there may also be major or minor changes in policy that affect bene-fits paid (in either aggregate or AWBA). These policy changes may include expansion of the number of eligible claimants, extension of benefit period, increase in the base
34 Source for all graphs in this section, unless otherwise noted, is: U.S. Department of Labor, Office of Workforce Security,
Division of Fiscal and Actuarial Services, UI Data Summary,
Assessment of the Impact of the 2002 Reed Act Distribution
Center for Employment Security Education and Research 109
used for calculating the benefit amount, direct increase in the benefit amount, or a com-bination of these. The official data collected on the number of claimants, aggregate paid benefits, AWBA and the alike do not necessarily indicate changes in policy (i.e., in eligibility require-ments and duration). Thus supplemental information on the actual changes in policy would be required (in addition to a model of the relationship of claims to unemployment rates) to attempt to understand the reasons for changes in the underlying data. A robust statistical test of the hypotheses about the impact the Reed Act distribution had on benefit payments or tax structure is thus a complicated matter. In lieu of robust sta-tistical tests, it is possible to compile a table of changes planned or enacted by the states. Thus policy changes in the benefit structure would be tracked, indicating whether there was an increase or decrease. This, approach while feasible is compro-mised by the fact that it is hard to ascertain the true reasoning behind a policy change. While it is certainly plausible that given a substantial Reed Act distribution a state might be more likely to change benefits structure by increasing benefits or expanding eligibility during an economic downturn, it is impossible to say how much of an impact the Reed Act distribution had. This is necessarily so since some states might have expanded benefits even if there was no Reed Act distribution. With this in mind we have con-ducted the broad case studies in the qualitative section, and provided a number of graphs of a descriptive nature here in this quantitative section. The actual task of test-ing the hypotheses is presented below, with an explanation of the approach, challenges and results of each hypothesis. 4.4.2 Testing process The available data for this hypothesis testing effort are limited in several respects. First, there is a considerable lag between the time when the decision to spend the Reed Act funds is made and the time when the Reed Act funds are reflected in the data. Second, the amount of data and its timeliness may sometimes be an issue. Third, a large num-ber of macroeconomic variables impact the analytical environment and cannot all be in-corporated in the analysis. Fourth, state-federal relationships are complex and difficult to capture. Fifth, the periodic nature of UI data collection and sixth, the general change in the business cycle that has occurred after the long expansionary period of the 1990s need to be considered. Finally, a further potentially complicating factor is the change in the composition of political officeholders in the 2000 elections, and the impact new po-litical leadership may have had directly or indirectly on policies adopted in the period leading up to the Reed Act distribution. All these factors limit the ability of the re-searcher to discern patterns in the data. Given these limitations, we will attempt to test the hypotheses in a manner that is as robust as possible. When we cannot state with certainty that a hypothesis is proven, it will be rejected as stated and tested, or the evi-dence will be deemed insufficient to make a determination. Initially the team had planned to use regression analysis to test the relationships of key variables. After some initial efforts to construct the appropriate data sets and applying
Assessment of the Impact of the 2002 Reed Act Distribution
Center for Employment Security Education and Research 110
statistical tests to those, it was determined that the data did not support that approach for testing. The multiple regression approach was thus abandoned, and a more limited test of means of groups was attempted. For each of the hypotheses the following 5 steps were followed:
1) Establish the base grouping of states (e.g., AHCM, unionization, unemployment) 2) Establish the statistical test to be used (two sample t-test of means assuming
unequal variances or two sample z-test of proportions). 3) Calculate the movement of change variable over time (absolute values) and the
change in the change variable over time (relative change), as appropriate. 4) Compare the means of the absolute and relative changes of the change variable
using the chosen statistical test. 5) Determine if the test provides evidence for accepting or rejecting the hypothesis
as stated and tested, or if there is insufficient evidence. The testing of correlations does not, as is usual, indicate that there is a necessary causal relationship, but only that a move in one variable is correlated with a move in the other, without any ability to determine that one causes the other, as both may in fact be caused by some other variable(s) not tested. For each of the hypotheses we present the stated hypothesis, the rationale for evaluat-ing it and the variables evaluated. We also provide a graphical reference of the underly-ing data and the conclusion of the test. 4.4.3 Summary Results of Hypothesis Testing We present the complete results of the testing of each of the hypotheses below. Figure 4.4.1 is intended to provide the reader with a brief overview of the results that are pre-sented below. In summary, hypotheses 4 and 5 are accepted as stated and tested. Hypothesis 1 is rejected as stated and tested, although the reverse relationship of what was expected is found to exist and be statistically significant. Hypotheses 2 and 3 are rejected. Hypothesis 2 shows little indication to be true, while hypothesis 3 is less clear, and information exists that supports the hypothesis as stated and tested.
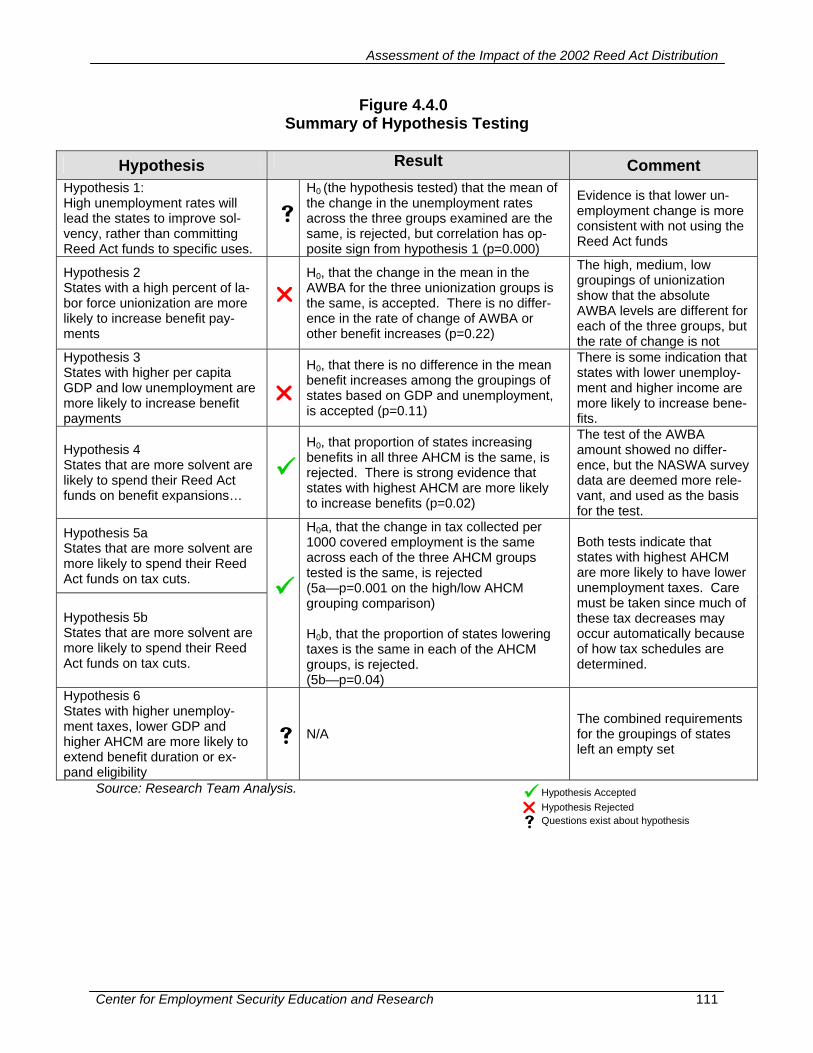
Assessment of the Impact of the 2002 Reed Act Distribution
Center for Employment Security Education and Research 111
Figure 4.4.0 Summary of Hypothesis Testing
Hypothesis Result Comment
Hypothesis 1: High unemployment rates will lead the states to improve sol-vency, rather than committing Reed Act funds to specific uses.
H0 (the hypothesis tested) that the mean of the change in the unemployment rates across the three groups examined are the same, is rejected, but correlation has op-posite sign from hypothesis 1 (p=0.000)
Evidence is that lower un-employment change is more consistent with not using the Reed Act funds
Hypothesis 2 States with a high percent of la-bor force unionization are more likely to increase benefit pay-ments
H0, that the change in the mean in the AWBA for the three unionization groups is the same, is accepted. There is no differ-ence in the rate of change of AWBA or other benefit increases (p=0.22)
The high, medium, low groupings of unionization show that the absolute AWBA levels are different for each of the three groups, but the rate of change is not
Hypothesis 3 States with higher per capita GDP and low unemployment are more likely to increase benefit payments
H0, that there is no difference in the mean benefit increases among the groupings of states based on GDP and unemployment, is accepted (p=0.11)
There is some indication that states with lower unemploy-ment and higher income are more likely to increase bene-fits.
Hypothesis 4 States that are more solvent are likely to spend their Reed Act funds on benefit expansions…
H0, that proportion of states increasing benefits in all three AHCM is the same, is rejected. There is strong evidence that states with highest AHCM are more likely to increase benefits (p=0.02)
The test of the AWBA amount showed no differ-ence, but the NASWA survey data are deemed more rele-vant, and used as the basis for the test.
Hypothesis 5a States that are more solvent are more likely to spend their Reed Act funds on tax cuts.
Hypothesis 5b States that are more solvent are more likely to spend their Reed Act funds on tax cuts.
H0a, that the change in tax collected per 1000 covered employment is the same across each of the three AHCM groups tested is the same, is rejected (5a—p=0.001 on the high/low AHCM grouping comparison) H0b, that the proportion of states lowering taxes is the same in each of the AHCM groups, is rejected. (5b—p=0.04)
Both tests indicate that states with highest AHCM are more likely to have lower unemployment taxes. Care must be taken since much of these tax decreases may occur automatically because of how tax schedules are determined.
Hypothesis 6 States with higher unemploy-ment taxes, lower GDP and higher AHCM are more likely to extend benefit duration or ex-pand eligibility
N/A The combined requirements for the groupings of states left an empty set
Source: Research Team Analysis.
Hypothesis AcceptedHypothesis RejectedQuestions exist about hypothesis
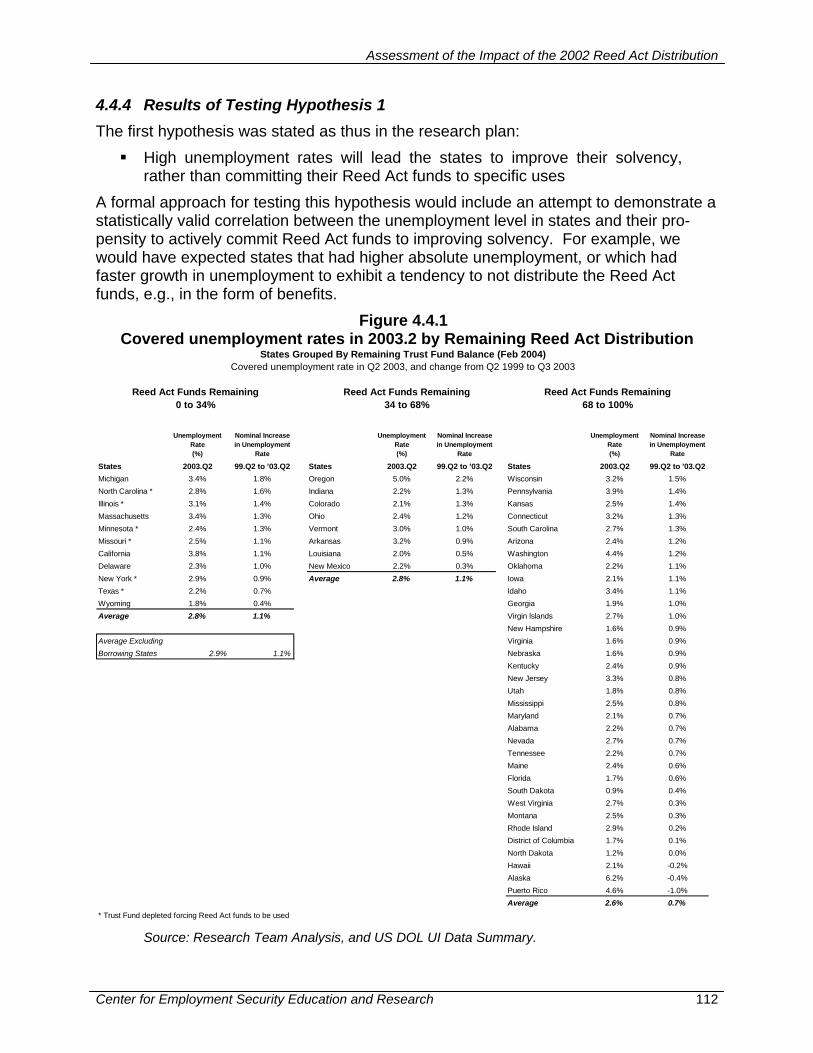
Assessment of the Impact of the 2002 Reed Act Distribution
Center for Employment Security Education and Research 112
4.4.4 Results of Testing Hypothesis 1 The first hypothesis was stated as thus in the research plan:
High unemployment rates will lead the states to improve their solvency, rather than committing their Reed Act funds to specific uses
A formal approach for testing this hypothesis would include an attempt to demonstrate a statistically valid correlation between the unemployment level in states and their pro-pensity to actively commit Reed Act funds to improving solvency. For example, we would have expected states that had higher absolute unemployment, or which had faster growth in unemployment to exhibit a tendency to not distribute the Reed Act funds, e.g., in the form of benefits.
Figure 4.4.1 Covered unemployment rates in 2003.2 by Remaining Reed Act Distribution
Unemployment Rate(%)
Nominal Increase in Unemployment
Rate
Unemployment Rate(%)
Nominal Increase in Unemployment
Rate
Unemployment Rate(%)
Nominal Increase in Unemployment
Rate
States 2003.Q2 99.Q2 to '03.Q2 States 2003.Q2 99.Q2 to '03.Q2 States 2003.Q2 99.Q2 to '03.Q2Michigan 3.4% 1.8% Oregon 5.0% 2.2% Wisconsin 3.2% 1.5%North Carolina * 2.8% 1.6% Indiana 2.2% 1.3% Pennsylvania 3.9% 1.4%Illinois * 3.1% 1.4% Colorado 2.1% 1.3% Kansas 2.5% 1.4%Massachusetts 3.4% 1.3% Ohio 2.4% 1.2% Connecticut 3.2% 1.3%Minnesota * 2.4% 1.3% Vermont 3.0% 1.0% South Carolina 2.7% 1.3%Missouri * 2.5% 1.1% Arkansas 3.2% 0.9% Arizona 2.4% 1.2%California 3.8% 1.1% Louisiana 2.0% 0.5% Washington 4.4% 1.2%Delaware 2.3% 1.0% New Mexico 2.2% 0.3% Oklahoma 2.2% 1.1%New York * 2.9% 0.9% Average 2.8% 1.1% Iowa 2.1% 1.1%Texas * 2.2% 0.7% Idaho 3.4% 1.1%Wyoming 1.8% 0.4% Georgia 1.9% 1.0%Average 2.8% 1.1% Virgin Islands 2.7% 1.0%
New Hampshire 1.6% 0.9%Average Excluding Virginia 1.6% 0.9%Borrowing States 2.9% 1.1% Nebraska 1.6% 0.9%
Kentucky 2.4% 0.9%New Jersey 3.3% 0.8%Utah 1.8% 0.8%Mississippi 2.5% 0.8%Maryland 2.1% 0.7%Alabama 2.2% 0.7%Nevada 2.7% 0.7%Tennessee 2.2% 0.7%Maine 2.4% 0.6%Florida 1.7% 0.6%South Dakota 0.9% 0.4%West Virginia 2.7% 0.3%Montana 2.5% 0.3%Rhode Island 2.9% 0.2%District of Columbia 1.7% 0.1%North Dakota 1.2% 0.0%Hawaii 2.1% -0.2%Alaska 6.2% -0.4%Puerto Rico 4.6% -1.0%Average 2.6% 0.7%
* Trust Fund depleted forcing Reed Act funds to be used
States Grouped By Remaining Trust Fund Balance (Feb 2004)Covered unemployment rate in Q2 2003, and change from Q2 1999 to Q3 2003
Reed Act Funds Remaining 34 to 68%
Reed Act Funds Remaining 68 to 100%
Reed Act Funds Remaining0 to 34%
Source: Research Team Analysis, and US DOL UI Data Summary.
Assessment of the Impact of the 2002 Reed Act Distribution
Center for Employment Security Education and Research 113
A number of factors complicate the testing of this hypothesis, and as such, each can create ‘noise’ in the data that could mask an actual trend. First, the effect of the Reed Act distribution could be overwhelmed by other external factors. An example of this is that many states were forced to spend their Reed Act distribution as the Trust Fund was depleted. Also, the number of observations is small, with only 53 jurisdictions and about 12 quarters of data. Further, there are timing considerations inherent in the data. An effect may not be known at the time the decision maker is forced to make a determina-tion on how to use the Reed Act funds, but instead relies on a forecast of likely out-comes for each of the unemployment variables. Thus, a pessimistic forecast that causes law makers and the executive branch to be very careful in their use of the Reed Act funds, but one which actually turns out to be wrong will work to skew the results. Testing Two variables are considered: the share of the Reed Act funds left in the trust fund, and the unemployment level in the state. Grouping of the states for both variables was tested, although the grouping of states by unemployment leads to problems as states with zero Reed Act funds remaining in the trust fund can skew the mean in their group. The preferred grouping by trust fund balance is presented. A two-sample t-test with assumed unequal variances is used. The change in the unem-ployment rate between 1999.2 and 2003.2 is calculated for each state in each of the groupings. The test then examines if the mean of each of the groups is the same (the null hypothesis). If the calculated test statistic is higher than the test statistic for the ap-propriate degrees of freedom (based on number of observations) the null hypothesis is rejected and the means are concluded not to be the same. The test was conducted with a two-tail risk of Type I error at α = 0.05. The unemployment rate in 2003.2 and the nominal change in the unemployment rate from 1999.2 to 2003.2 are shown in figure 4.4.1 for each of the three groups: Reed Act funding remaining 0-33.3%, 33.3% to 66.6% remaining, and 66.6% to 100% remaining. The states whose trust funds were depleted by 2003.2 are shown with an asterisk in the first column.
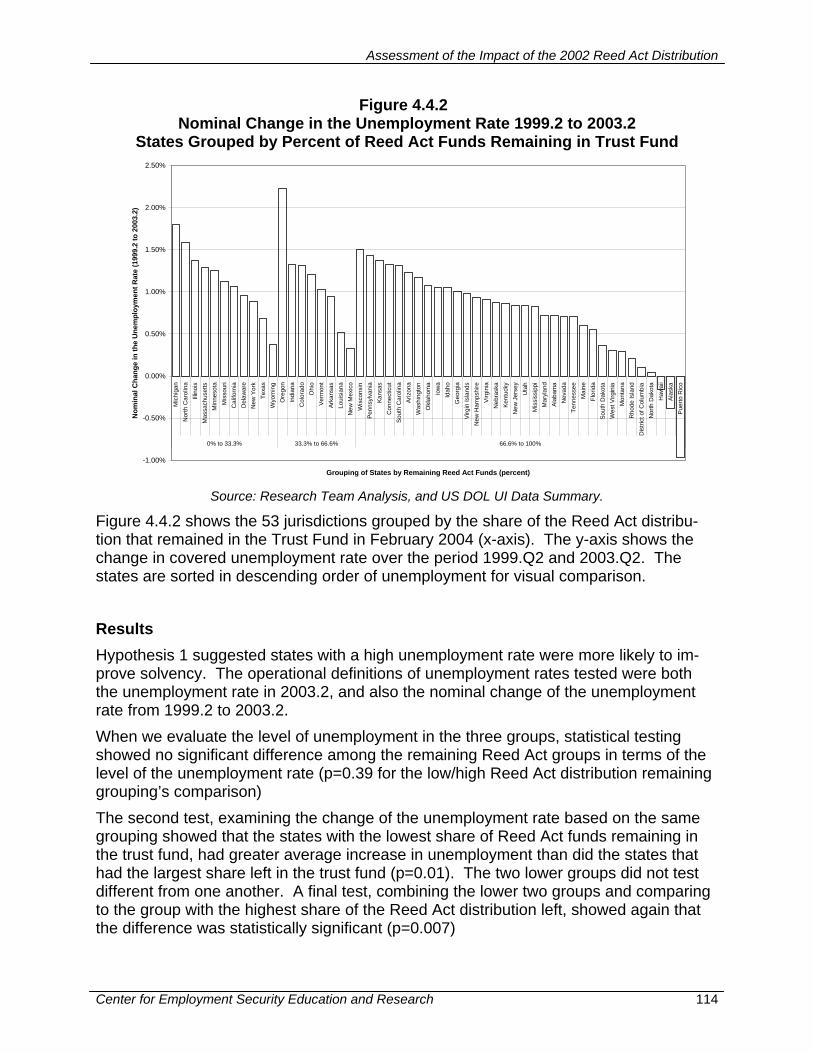
Assessment of the Impact of the 2002 Reed Act Distribution
Center for Employment Security Education and Research 114
Figure 4.4.2 Nominal Change in the Unemployment Rate 1999.2 to 2003.2
States Grouped by Percent of Reed Act Funds Remaining in Trust Fund
-1.00%
-0.50%
0.00%
0.50%
1.00%
1.50%
2.00%
2.50%M
ichi
gan
Nor
th C
arol
ina
Illin
ois
Mas
sach
uset
ts
Min
neso
ta
Mis
sour
i C
alifo
rnia
D
elaw
are
New
Yor
k Te
xas
Wyo
min
g O
rego
n In
dian
a C
olor
ado
Ohi
o Ve
rmon
t Ar
kans
as
Loui
sian
a N
ew M
exic
o W
isco
nsin
Pe
nnsy
lvan
ia
Kans
as
Con
nect
icut
So
uth
Car
olin
a Ar
izon
a W
ashi
ngto
n O
klah
oma
Iow
a Id
aho
Geo
rgia
Vi
rgin
Isla
nds
New
Ham
pshi
re
Virg
inia
N
ebra
ska
Kent
ucky
N
ew J
erse
y U
tah
Mis
siss
ippi
M
aryl
and
Alab
ama
Nev
ada
Tenn
esse
e M
aine
Fl
orid
a So
uth
Dak
ota
Wes
t Virg
inia
M
onta
na
Rho
de Is
land
D
istri
ct o
f Col
umbi
a N
orth
Dak
ota
Haw
aii
Alas
ka
Puer
to R
ico
0% to 33.3% 33.3% to 66.6% 66.6% to 100%
Grouping of States by Remaining Reed Act Funds (percent)
Nom
inal
Cha
nge
in th
e U
nem
ploy
men
t Rat
e (1
999.
2 to
200
3.2)
Source: Research Team Analysis, and US DOL UI Data Summary.
Figure 4.4.2 shows the 53 jurisdictions grouped by the share of the Reed Act distribu-tion that remained in the Trust Fund in February 2004 (x-axis). The y-axis shows the change in covered unemployment rate over the period 1999.Q2 and 2003.Q2. The states are sorted in descending order of unemployment for visual comparison. Results Hypothesis 1 suggested states with a high unemployment rate were more likely to im-prove solvency. The operational definitions of unemployment rates tested were both the unemployment rate in 2003.2, and also the nominal change of the unemployment rate from 1999.2 to 2003.2. When we evaluate the level of unemployment in the three groups, statistical testing showed no significant difference among the remaining Reed Act groups in terms of the level of the unemployment rate (p=0.39 for the low/high Reed Act distribution remaining grouping’s comparison) The second test, examining the change of the unemployment rate based on the same grouping showed that the states with the lowest share of Reed Act funds remaining in the trust fund, had greater average increase in unemployment than did the states that had the largest share left in the trust fund (p=0.01). The two lower groups did not test different from one another. A final test, combining the lower two groups and comparing to the group with the highest share of the Reed Act distribution left, showed again that the difference was statistically significant (p=0.007)
Assessment of the Impact of the 2002 Reed Act Distribution
Center for Employment Security Education and Research 115
To ensure that states that had depleted their trust funds were not unduly biasing the testing, the last test was rerun, excluding the six states that had depleted their trust funds and been forced to use the Reed Act distribution. The testing remained signifi-cant (p=0.038) In conclusion, there is evidence to reject the null hypothesis tested here, that the mean of the change in the unemployment rates across the three groups are the same. How-ever, the testing shows that the correlation is in the opposite direction of what was stated in the process evaluation, with lower remaining Reed Act funds consistent with greater change in unemployment rate. The test of the level of unemployment in 2003.2 showed no difference in the three groups. Hypothesis 1 must thus be rejected as stated and tested and concluded that although the relationship has been shown, the stated hypothesis suggest the opposite correla-tion. More detail on the statistical tests can be found in Attachment C. 4.4.5 Results of Testing Hypothesis 2 The second hypothesis was stated thus in the research plan:
States with a high percent of labor force unionization are more likely to in-crease benefit payments
A formal approach for testing this hypothesis would include an attempt to demonstrate a statistically valid correlation between the two variables named in the hypothesis. In ad-dition to the general comments highlighted in the conversation regarding hypothesis 1, the particularities of unionization may well skew the attempts to test this hypothesis. In the first place, states with higher unionization are more likely to employ a workforce in certain, union-strong, occupations that may be affected disproportionally by an eco-nomic downturn. Secondly, the average level of unionization is less than 14% percent, and thus these jobs represent only a relatively small part of the economy and the impact may not be fully measurable. Testing Two variables are considered: the level of unionization (Estimates of Union Density by State. Monthly Labor Review, July 2001) in 2000, and the change in benefit payment. The second variable is considered both by evaluating the change in the AWBA, and by using the NASWA survey data that reports if states have increased benefits. Grouping of the states by unionization was accomplished by taking all 51 jurisdictions for which unionization data are available (Puerto Rico and Virgin Islands are excluded) and divid-ing it by thirds, for a total of 17 in each of the groups (defined as ‘high’, ‘medium’ and ‘low’ levels of unionization). For testing the absolute and relative (change in) level of the AWBA a two-sample t-test with assumed unequal variances was used. The change in the AWBA between 2001.2
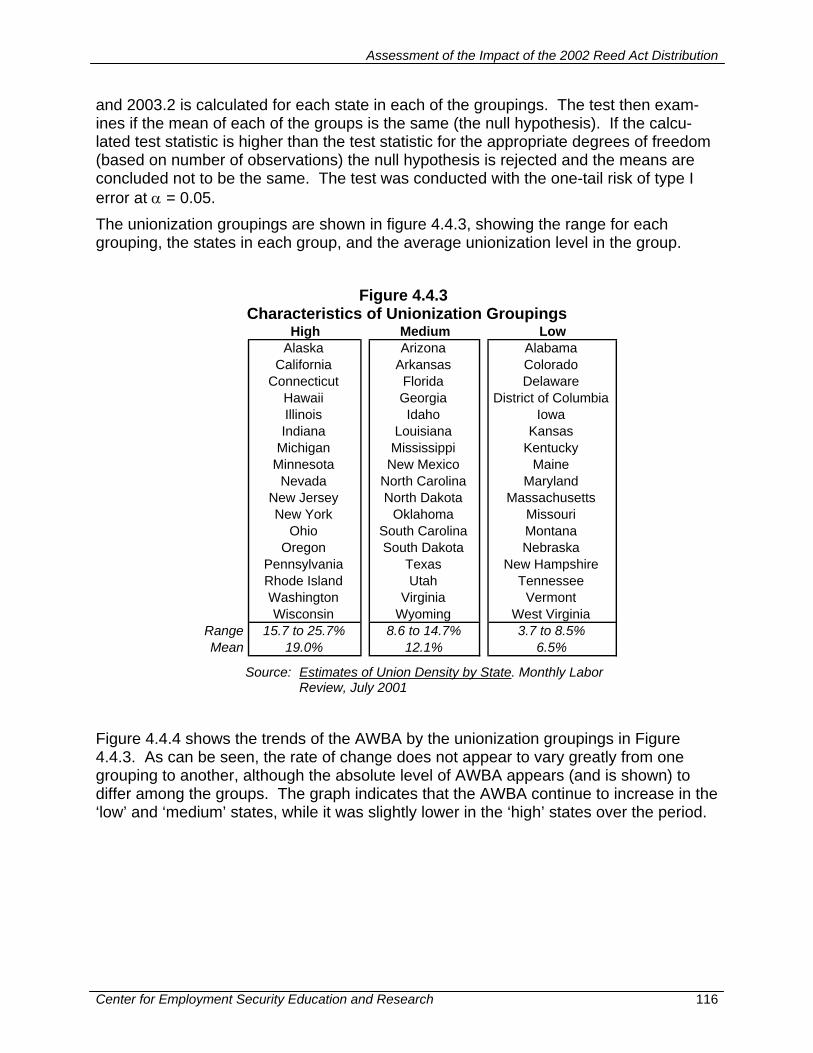
Assessment of the Impact of the 2002 Reed Act Distribution
Center for Employment Security Education and Research 116
and 2003.2 is calculated for each state in each of the groupings. The test then exam-ines if the mean of each of the groups is the same (the null hypothesis). If the calcu-lated test statistic is higher than the test statistic for the appropriate degrees of freedom (based on number of observations) the null hypothesis is rejected and the means are concluded not to be the same. The test was conducted with the one-tail risk of type I error at α = 0.05. The unionization groupings are shown in figure 4.4.3, showing the range for each grouping, the states in each group, and the average unionization level in the group.
Figure 4.4.3 Characteristics of Unionization Groupings
High Medium LowAlaska Arizona Alabama
California Arkansas Colorado Connecticut Florida Delaware
Hawaii Georgia District of Columbia Illinois Idaho Iowa Indiana Louisiana Kansas
Michigan Mississippi Kentucky Minnesota New Mexico Maine
Nevada North Carolina Maryland New Jersey North Dakota Massachusetts New York Oklahoma Missouri
Ohio South Carolina Montana Oregon South Dakota Nebraska
Pennsylvania Texas New Hampshire Rhode Island Utah Tennessee Washington Virginia Vermont Wisconsin Wyoming West Virginia
Range 15.7 to 25.7% 8.6 to 14.7% 3.7 to 8.5%Mean 19.0% 12.1% 6.5%
Source: Estimates of Union Density by State. Monthly Labor Review, July 2001
Figure 4.4.4 shows the trends of the AWBA by the unionization groupings in Figure 4.4.3. As can be seen, the rate of change does not appear to vary greatly from one grouping to another, although the absolute level of AWBA appears (and is shown) to differ among the groups. The graph indicates that the AWBA continue to increase in the ‘low’ and ‘medium’ states, while it was slightly lower in the ‘high’ states over the period.
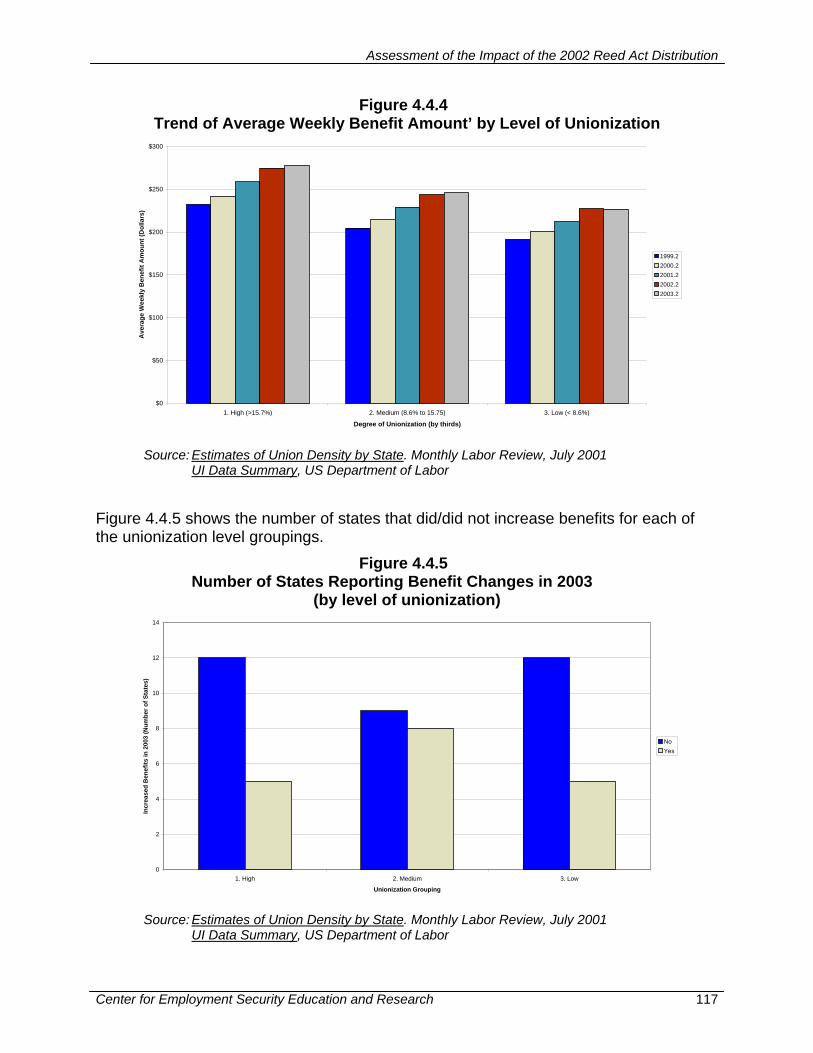
Assessment of the Impact of the 2002 Reed Act Distribution
Center for Employment Security Education and Research 117
Figure 4.4.4 Trend of Average Weekly Benefit Amount’ by Level of Unionization
$0
$50
$100
$150
$200
$250
$300
1. High (>15.7%) 2. Medium (8.6% to 15.75) 3. Low (< 8.6%)
Degree of Unionization (by thirds)
Ave
rage
Wee
kly
Ben
efit
Am
ount
(Dol
lars
)
1999.22000.22001.22002.22003.2
Source: Estimates of Union Density by State. Monthly Labor Review, July 2001
UI Data Summary, US Department of Labor
Figure 4.4.5 shows the number of states that did/did not increase benefits for each of the unionization level groupings.
Figure 4.4.5 Number of States Reporting Benefit Changes in 2003
(by level of unionization)
0
2
4
6
8
10
12
14
1. High 2. Medium 3. Low
Unionization Grouping
Incr
ease
d B
enef
its in
200
3 (N
umbe
r of S
tate
s)
NoYes
Source: Estimates of Union Density by State. Monthly Labor Review, July 2001 UI Data Summary, US Department of Labor
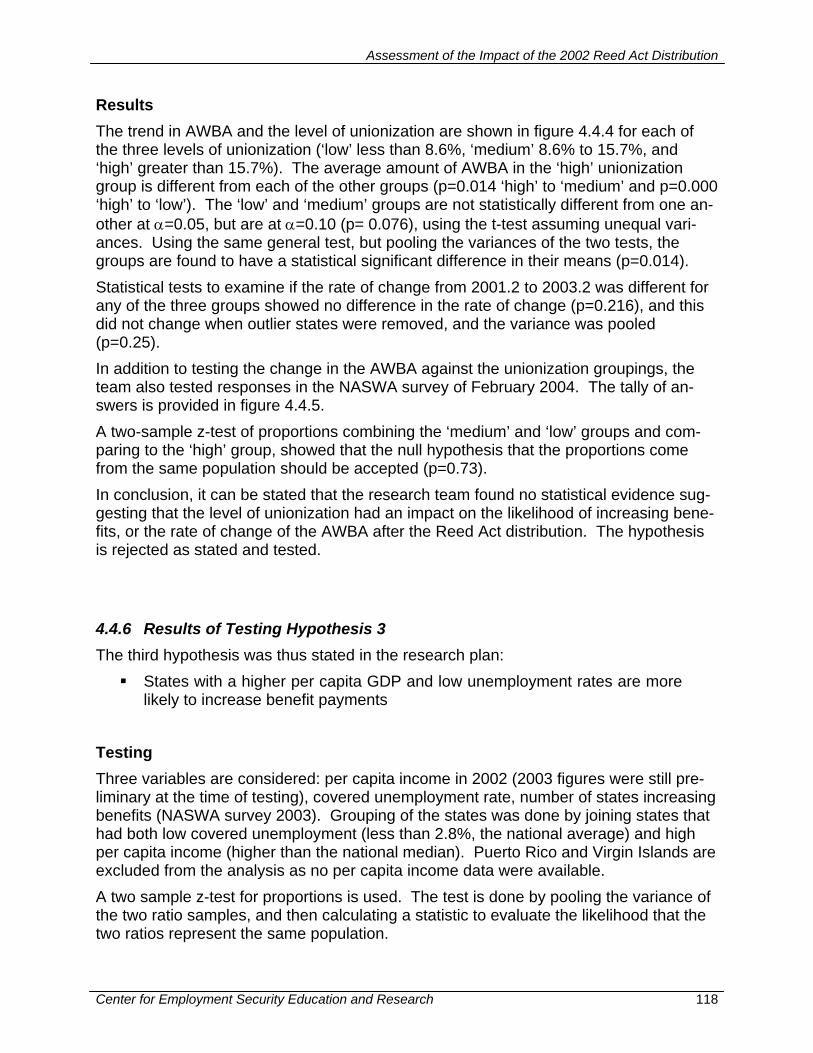
Assessment of the Impact of the 2002 Reed Act Distribution
Center for Employment Security Education and Research 118
Results The trend in AWBA and the level of unionization are shown in figure 4.4.4 for each of the three levels of unionization (‘low’ less than 8.6%, ‘medium’ 8.6% to 15.7%, and ‘high’ greater than 15.7%). The average amount of AWBA in the ‘high’ unionization group is different from each of the other groups (p=0.014 ‘high’ to ‘medium’ and p=0.000 ‘high’ to ‘low’). The ‘low’ and ‘medium’ groups are not statistically different from one an-other at α=0.05, but are at α=0.10 (p= 0.076), using the t-test assuming unequal vari-ances. Using the same general test, but pooling the variances of the two tests, the groups are found to have a statistical significant difference in their means (p=0.014). Statistical tests to examine if the rate of change from 2001.2 to 2003.2 was different for any of the three groups showed no difference in the rate of change (p=0.216), and this did not change when outlier states were removed, and the variance was pooled (p=0.25). In addition to testing the change in the AWBA against the unionization groupings, the team also tested responses in the NASWA survey of February 2004. The tally of an-swers is provided in figure 4.4.5. A two-sample z-test of proportions combining the ‘medium’ and ‘low’ groups and com-paring to the ‘high’ group, showed that the null hypothesis that the proportions come from the same population should be accepted (p=0.73). In conclusion, it can be stated that the research team found no statistical evidence sug-gesting that the level of unionization had an impact on the likelihood of increasing bene-fits, or the rate of change of the AWBA after the Reed Act distribution. The hypothesis is rejected as stated and tested. 4.4.6 Results of Testing Hypothesis 3 The third hypothesis was thus stated in the research plan:
States with a higher per capita GDP and low unemployment rates are more likely to increase benefit payments
Testing Three variables are considered: per capita income in 2002 (2003 figures were still pre-liminary at the time of testing), covered unemployment rate, number of states increasing benefits (NASWA survey 2003). Grouping of the states was done by joining states that had both low covered unemployment (less than 2.8%, the national average) and high per capita income (higher than the national median). Puerto Rico and Virgin Islands are excluded from the analysis as no per capita income data were available. A two sample z-test for proportions is used. The test is done by pooling the variance of the two ratio samples, and then calculating a statistic to evaluate the likelihood that the two ratios represent the same population.

Assessment of the Impact of the 2002 Reed Act Distribution
Center for Employment Security Education and Research 119
Figure 4.4.6 Low Unemployment Rate and High Per Capita Income Group
Compared with the Alternative
6 6
12
27
0
5
10
15
20
25
30
Yes Benefit Increase No benefit increase Yes Benefit Increase No benefit increase
Both Low Unemployment Rate and High Per Capita Income Not both Low Unemployment Rate and High Per Capita Income
Groupings Based on Hypothesis 3
Num
ber o
f Sta
tes
Source: State Per Capita Information, US Department of Commerce
UI Data Summary, US Department of Labor
Figure 4.4.6 shows the states grouped by the conditions of the hypothesis. It shows the states grouped first on the assumption to be tested in the hypothesis. The two left col-umns show the states with both low unemployment and high per capita income (below the national average in Q2, 2002 which stood at 2.8%) and which had per capita income that was above the median for all states ($29,18235). Six states increased benefits and six did not. In the other grouping there are all the other states for which the first as-sumption was not true. Among those states, 12 increased benefits while 27 did not. Results The null hypothesis, that here is no difference among the groups, must be accepted (p=0.11). Thus we cannot accept hypothesis 3, that states with lower unemployment and higher per capita income are more likely to increase benefits. In addition to the test statistic not supporting the hypothesis, there are problems with the use of the test selected. First, when the combined sample equals the population it is drawn from, it becomes hard to determine what validity standard statistical tests have. For example, the z-test for proportions assumes the two samples are independent. It is however, hard to see how two samples that combine to account for the whole popula- 35 Data from Department of Commerce, Bureau of Economic Analysis. Available upon request, or from
http://www.bea.doc.gov/bea/newsrelarchive/2004/spi0404.xls
Assessment of the Impact of the 2002 Reed Act Distribution
Center for Employment Security Education and Research 120
tion can ever be regarded as independent, even if each observation (one state’s deci-sion) is clearly independent of another observation. Further, the test is intended for samples that are randomly drawn from sufficiently ‘larger’ population, this is not the case here. A separate issue is that the test comes close to violating the sampling distri-bution requirements, and thus is on the border in applicability. Attachment C provides more detail on the test and estimates of its validity. 4.4.7 Results of Testing Hypothesis 4 The fourth hypothesis was thus stated in the research plan:
States that are more solvent are likely to spend their Reed Act funds on benefit expansions. States that have low solvency levels (AHCM) will not spend their Reed Act funds on benefit expansions
The qualitative study, as well as the NASWA surveys, have shown that most states chose to retain a substantial amount of their Reed Act distribution in the Trust Fund, at least initially, to trigger automatic reductions (or avoid automatic increases) in the state’s UI tax schedule. In addition as the research team learned from the interviews with the states in the qualitative section, there was a common perception the Reed Act distribu-tion was ‘one time funding for one time needs.’ Many states voiced a concern, both in their executive branch and their legislatures, about increasing benefits as such in-creases, although initially passed as temporary measures, were rarely temporary in ef-fect. Testing The chart shown in Figure 4.4.7 displays the number of states that had, and had not, expanded benefits in some form by February 2004, grouped by the AHCM level in Q2 of 2003. A total of 18 states had increased benefits to some degree (see detail in the NASWA Reed Act study of February 2004.). Two variables are considered: AHCM and number of states increasing benefits in 2003 (NASWA survey February 2004). Grouping of the states was done by joining states in the two lower AHCM and comparing with the highest AHCM group. A two sample z-test for proportions is used. The test is done by pooling the variance of the two ratio samples, and then calculating a statistic to evaluate the likelihood that the two ratios represent the same population. Results The null hypothesis that the two proportions come from the same population is rejected, i.e., there is a statistically measurable difference between the two groups tested (p=0.02).
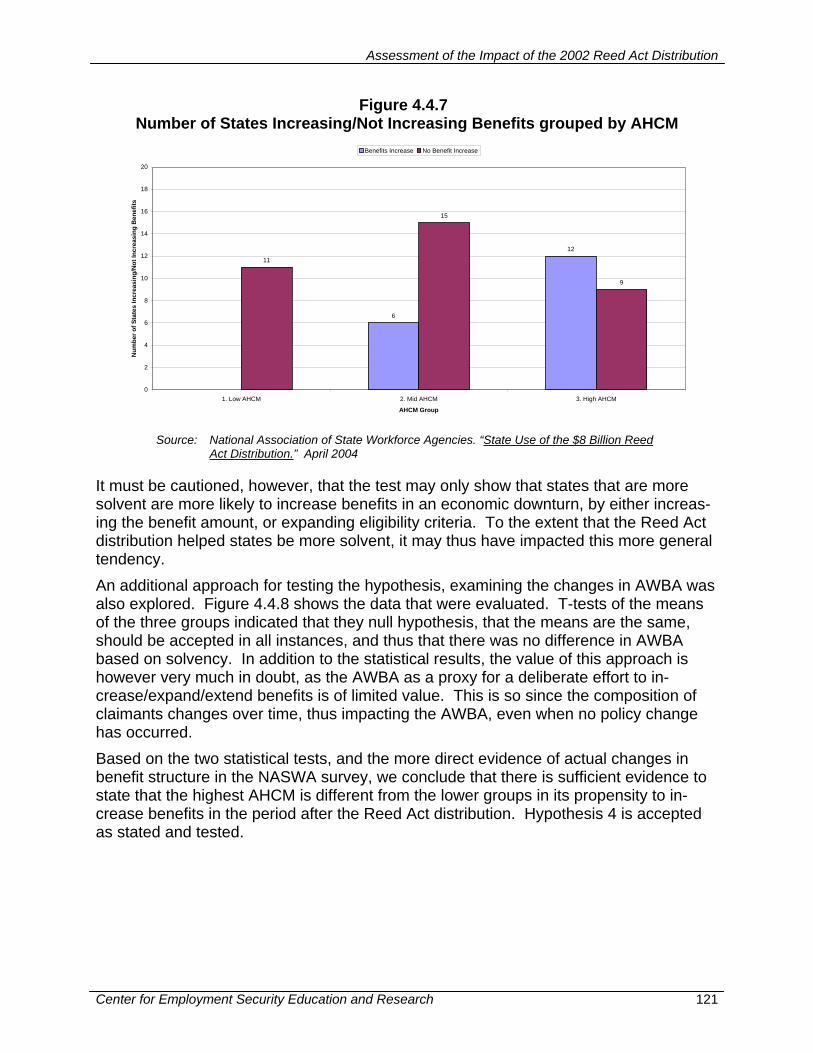
Assessment of the Impact of the 2002 Reed Act Distribution
Center for Employment Security Education and Research 121
Figure 4.4.7 Number of States Increasing/Not Increasing Benefits grouped by AHCM
6
12
11
15
9
0
2
4
6
8
10
12
14
16
18
20
1. Low AHCM 2. Mid AHCM 3. High AHCM
AHCM Group
Num
ber o
f Sta
tes
Incr
easi
ng/N
ot In
crea
sing
Ben
efits
Benefits Increase No Benefit Increase
Source: National Association of State Workforce Agencies. “State Use of the $8 Billion Reed
Act Distribution.” April 2004
It must be cautioned, however, that the test may only show that states that are more solvent are more likely to increase benefits in an economic downturn, by either increas-ing the benefit amount, or expanding eligibility criteria. To the extent that the Reed Act distribution helped states be more solvent, it may thus have impacted this more general tendency. An additional approach for testing the hypothesis, examining the changes in AWBA was also explored. Figure 4.4.8 shows the data that were evaluated. T-tests of the means of the three groups indicated that they null hypothesis, that the means are the same, should be accepted in all instances, and thus that there was no difference in AWBA based on solvency. In addition to the statistical results, the value of this approach is however very much in doubt, as the AWBA as a proxy for a deliberate effort to in-crease/expand/extend benefits is of limited value. This is so since the composition of claimants changes over time, thus impacting the AWBA, even when no policy change has occurred. Based on the two statistical tests, and the more direct evidence of actual changes in benefit structure in the NASWA survey, we conclude that there is sufficient evidence to state that the highest AHCM is different from the lower groups in its propensity to in-crease benefits in the period after the Reed Act distribution. Hypothesis 4 is accepted as stated and tested.
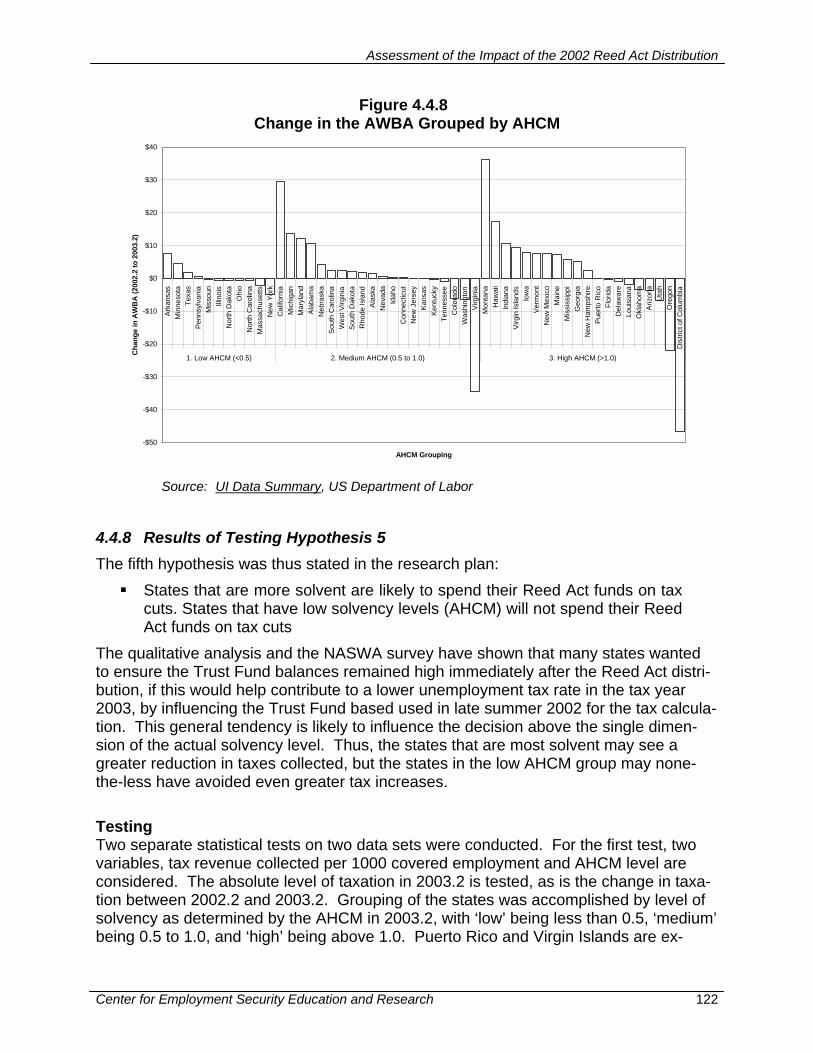
Assessment of the Impact of the 2002 Reed Act Distribution
Center for Employment Security Education and Research 122
Figure 4.4.8 Change in the AWBA Grouped by AHCM
-$50
-$40
-$30
-$20
-$10
$0
$10
$20
$30
$40
Ark
ansa
s M
inne
sota
Te
xas
Pen
nsyl
vani
a M
isso
uri
Illin
ois
Nor
th D
akot
a O
hio
Nor
th C
arol
ina
Mas
sach
uset
ts
New
Yor
k C
alifo
rnia
M
ichi
gan
Mar
ylan
d A
laba
ma
Neb
rask
a S
outh
Car
olin
a W
est V
irgin
ia
Sou
th D
akot
a R
hode
Isla
nd
Ala
ska
Nev
ada
Idah
o C
onne
ctic
ut
New
Jer
sey
Kan
sas
Ken
tuck
y Te
nnes
see
Col
orad
o W
ashi
ngto
n V
irgin
ia
Mon
tana
H
awai
i In
dian
a V
irgin
Isla
nds
Iow
a V
erm
ont
New
Mex
ico
Mai
ne
Mis
siss
ippi
G
eorg
ia
New
Ham
pshi
re
Pue
rto R
ico
Flor
ida
Del
awar
e Lo
uisi
ana
Okl
ahom
a A
rizon
a U
tah
Ore
gon
Dis
trict
of C
olum
bia
1. Low AHCM (<0.5) 2. Medium AHCM (0.5 to 1.0) 3. High AHCM (>1.0)
AHCM Grouping
Cha
nge
in A
WB
A (2
002.
2 to
200
3.2)
Source: UI Data Summary, US Department of Labor
4.4.8 Results of Testing Hypothesis 5 The fifth hypothesis was thus stated in the research plan:
States that are more solvent are likely to spend their Reed Act funds on tax cuts. States that have low solvency levels (AHCM) will not spend their Reed Act funds on tax cuts
The qualitative analysis and the NASWA survey have shown that many states wanted to ensure the Trust Fund balances remained high immediately after the Reed Act distri-bution, if this would help contribute to a lower unemployment tax rate in the tax year 2003, by influencing the Trust Fund based used in late summer 2002 for the tax calcula-tion. This general tendency is likely to influence the decision above the single dimen-sion of the actual solvency level. Thus, the states that are most solvent may see a greater reduction in taxes collected, but the states in the low AHCM group may none-the-less have avoided even greater tax increases. Testing Two separate statistical tests on two data sets were conducted. For the first test, two variables, tax revenue collected per 1000 covered employment and AHCM level are considered. The absolute level of taxation in 2003.2 is tested, as is the change in taxa-tion between 2002.2 and 2003.2. Grouping of the states was accomplished by level of solvency as determined by the AHCM in 2003.2, with ‘low’ being less than 0.5, ‘medium’ being 0.5 to 1.0, and ‘high’ being above 1.0. Puerto Rico and Virgin Islands are ex-
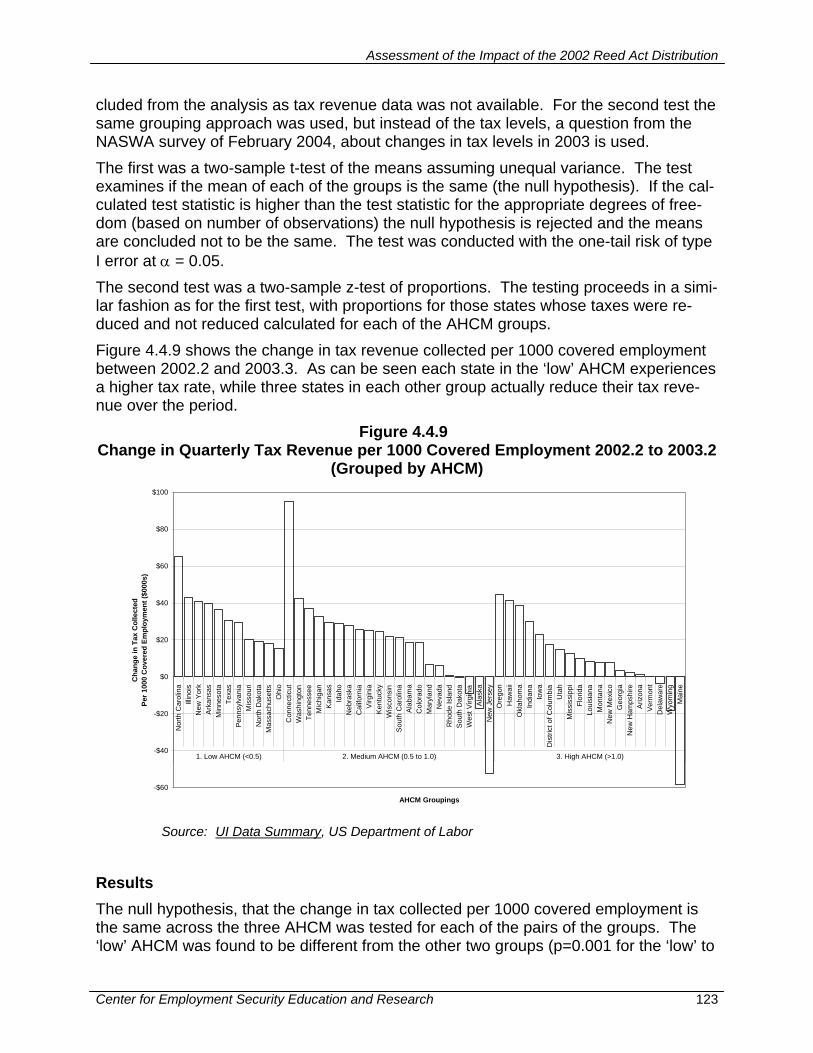
Assessment of the Impact of the 2002 Reed Act Distribution
Center for Employment Security Education and Research 123
cluded from the analysis as tax revenue data was not available. For the second test the same grouping approach was used, but instead of the tax levels, a question from the NASWA survey of February 2004, about changes in tax levels in 2003 is used. The first was a two-sample t-test of the means assuming unequal variance. The test examines if the mean of each of the groups is the same (the null hypothesis). If the cal-culated test statistic is higher than the test statistic for the appropriate degrees of free-dom (based on number of observations) the null hypothesis is rejected and the means are concluded not to be the same. The test was conducted with the one-tail risk of type I error at α = 0.05. The second test was a two-sample z-test of proportions. The testing proceeds in a simi-lar fashion as for the first test, with proportions for those states whose taxes were re-duced and not reduced calculated for each of the AHCM groups. Figure 4.4.9 shows the change in tax revenue collected per 1000 covered employment between 2002.2 and 2003.3. As can be seen each state in the ‘low’ AHCM experiences a higher tax rate, while three states in each other group actually reduce their tax reve-nue over the period.
Figure 4.4.9 Change in Quarterly Tax Revenue per 1000 Covered Employment 2002.2 to 2003.2
(Grouped by AHCM)
-$60
-$40
-$20
$0
$20
$40
$60
$80
$100
Nor
th C
arol
ina
Illin
ois
New
Yor
k A
rkan
sas
Min
neso
ta
Texa
s P
enns
ylva
nia
Mis
sour
i N
orth
Dak
ota
Mas
sach
uset
ts
Ohi
o C
onne
ctic
ut
Was
hing
ton
Tenn
esse
e M
ichi
gan
Kan
sas
Idah
o N
ebra
ska
Cal
iforn
ia
Virg
inia
K
entu
cky
Wis
cons
in
Sou
th C
arol
ina
Ala
bam
a C
olor
ado
Mar
ylan
d N
evad
a R
hode
Isla
nd
Sou
th D
akot
a W
est V
irgin
ia
Ala
ska
New
Jer
sey
Ore
gon
Haw
aii
Okl
ahom
a In
dian
a Io
wa
Dis
trict
of C
olum
bia
Uta
h M
issi
ssip
pi
Flor
ida
Loui
sian
a M
onta
na
New
Mex
ico
Geo
rgia
N
ew H
amps
hire
A
rizon
a V
erm
ont
Del
awar
e W
yom
ing
Mai
ne
1. Low AHCM (<0.5) 2. Medium AHCM (0.5 to 1.0) 3. High AHCM (>1.0)
AHCM Groupings
Cha
nge
in T
ax C
olle
cted
Pe
r 100
0 C
over
ed E
mpl
oym
ent (
$000
s)
Source: UI Data Summary, US Department of Labor
Results The null hypothesis, that the change in tax collected per 1000 covered employment is the same across the three AHCM was tested for each of the pairs of the groups. The ‘low’ AHCM was found to be different from the other two groups (p=0.001 for the ‘low’ to
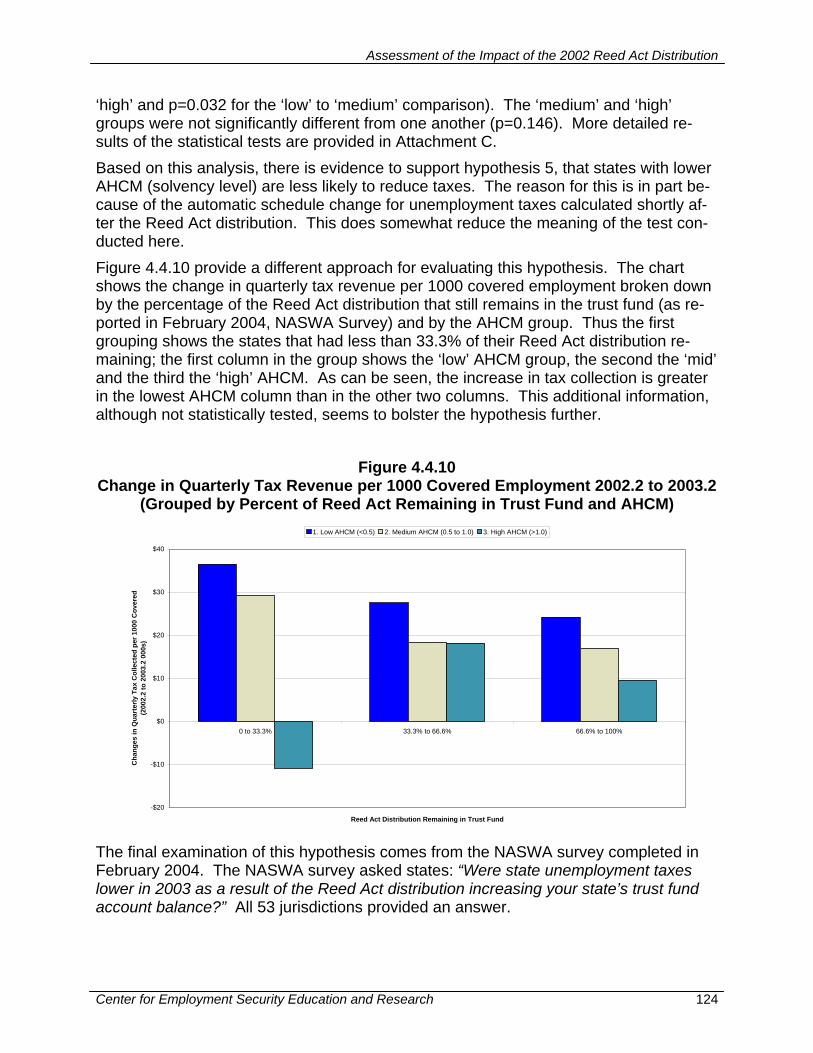
Assessment of the Impact of the 2002 Reed Act Distribution
Center for Employment Security Education and Research 124
‘high’ and p=0.032 for the ‘low’ to ‘medium’ comparison). The ‘medium’ and ‘high’ groups were not significantly different from one another (p=0.146). More detailed re-sults of the statistical tests are provided in Attachment C. Based on this analysis, there is evidence to support hypothesis 5, that states with lower AHCM (solvency level) are less likely to reduce taxes. The reason for this is in part be-cause of the automatic schedule change for unemployment taxes calculated shortly af-ter the Reed Act distribution. This does somewhat reduce the meaning of the test con-ducted here. Figure 4.4.10 provide a different approach for evaluating this hypothesis. The chart shows the change in quarterly tax revenue per 1000 covered employment broken down by the percentage of the Reed Act distribution that still remains in the trust fund (as re-ported in February 2004, NASWA Survey) and by the AHCM group. Thus the first grouping shows the states that had less than 33.3% of their Reed Act distribution re-maining; the first column in the group shows the ‘low’ AHCM group, the second the ‘mid’ and the third the ‘high’ AHCM. As can be seen, the increase in tax collection is greater in the lowest AHCM column than in the other two columns. This additional information, although not statistically tested, seems to bolster the hypothesis further.
Figure 4.4.10 Change in Quarterly Tax Revenue per 1000 Covered Employment 2002.2 to 2003.2
(Grouped by Percent of Reed Act Remaining in Trust Fund and AHCM)
-$20
-$10
$0
$10
$20
$30
$40
0 to 33.3% 33.3% to 66.6% 66.6% to 100%
Reed Act Distribution Remaining in Trust Fund
Cha
nges
in Q
uart
erly
Tax
Col
lect
ed p
er 1
000
Cov
ered
(2
002.
2 to
200
3.2
000s
)
1. Low AHCM (<0.5) 2. Medium AHCM (0.5 to 1.0) 3. High AHCM (>1.0)
The final examination of this hypothesis comes from the NASWA survey completed in February 2004. The NASWA survey asked states: “Were state unemployment taxes lower in 2003 as a result of the Reed Act distribution increasing your state’s trust fund account balance?” All 53 jurisdictions provided an answer.
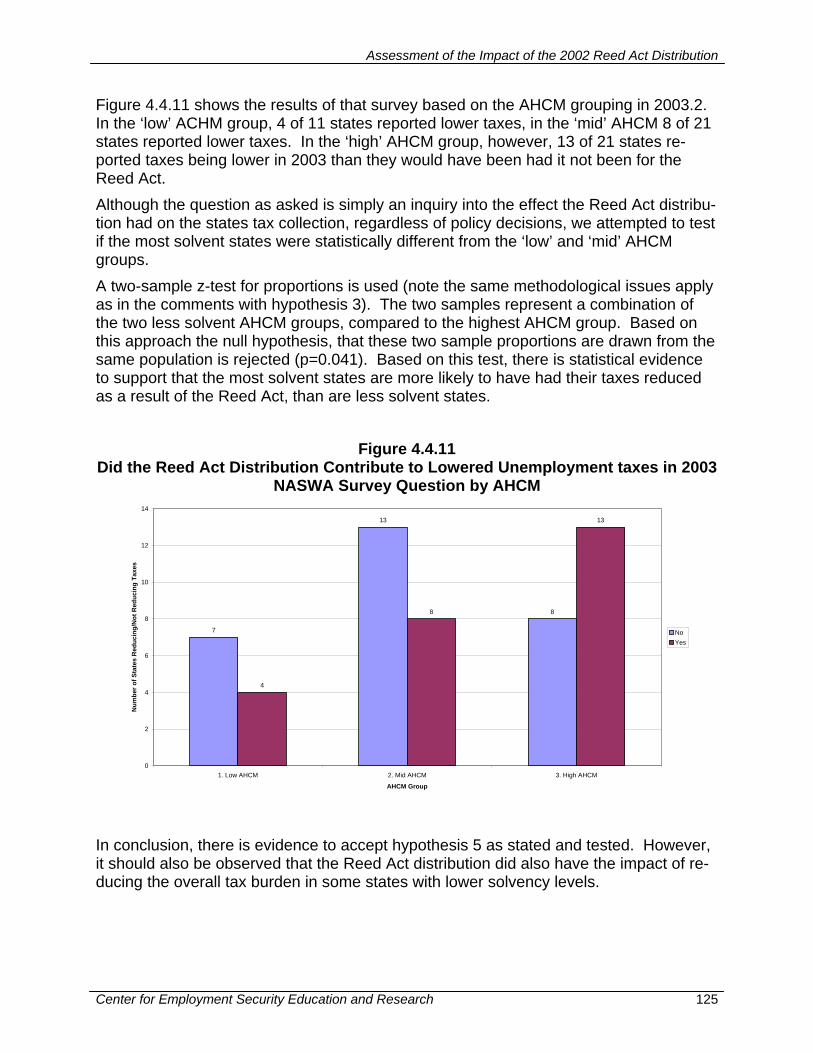
Assessment of the Impact of the 2002 Reed Act Distribution
Center for Employment Security Education and Research 125
Figure 4.4.11 shows the results of that survey based on the AHCM grouping in 2003.2. In the ‘low’ ACHM group, 4 of 11 states reported lower taxes, in the ‘mid’ AHCM 8 of 21 states reported lower taxes. In the ‘high’ AHCM group, however, 13 of 21 states re-ported taxes being lower in 2003 than they would have been had it not been for the Reed Act. Although the question as asked is simply an inquiry into the effect the Reed Act distribu-tion had on the states tax collection, regardless of policy decisions, we attempted to test if the most solvent states were statistically different from the ‘low’ and ‘mid’ AHCM groups. A two-sample z-test for proportions is used (note the same methodological issues apply as in the comments with hypothesis 3). The two samples represent a combination of the two less solvent AHCM groups, compared to the highest AHCM group. Based on this approach the null hypothesis, that these two sample proportions are drawn from the same population is rejected (p=0.041). Based on this test, there is statistical evidence to support that the most solvent states are more likely to have had their taxes reduced as a result of the Reed Act, than are less solvent states.
Figure 4.4.11 Did the Reed Act Distribution Contribute to Lowered Unemployment taxes in 2003
NASWA Survey Question by AHCM
7
13
8
4
8
13
0
2
4
6
8
10
12
14
1. Low AHCM 2. Mid AHCM 3. High AHCM
AHCM Group
Num
ber o
f Sta
tes
Red
ucin
g/N
ot R
educ
ing
Taxe
s
NoYes
In conclusion, there is evidence to accept hypothesis 5 as stated and tested. However, it should also be observed that the Reed Act distribution did also have the impact of re-ducing the overall tax burden in some states with lower solvency levels.
Assessment of the Impact of the 2002 Reed Act Distribution
Center for Employment Security Education and Research 126
4.4.9 Results of Testing Hypothesis 6 The sixth hypothesis was thus stated in the research plan:
States with higher unemployment rates, lower GDP and higher high cost multiples are more likely to extend benefit duration or expand eligibility
The general contention that is being tested is that in states where the general economic conditions are worse, and where workers on average have lower incomes, the state will be more inclined to intervene by extending benefit duration or eligibility. As before, a number of methodological issues arise. First, it must be noted that since the cost of liv-ing fluctuates to a certain extent from one state to another, per capita income rates (the intent behind the GDP statistic) are not a perfect measure of workers relative affluence. Secondly, the double contingent nature of the hypothesis as stated makes it hard to test except with a multiple regression model, that although the direction of the relationship may be validated, the strength of the association may not be accurately reflected in the coefficient of produced by the regression model (as the model will not come close to explaining the reasons for the actual movement of the dependent variable). When the research team attempted to test this hypothesis by combining all the condi-tions a further complication arose. Each of the variables excludes a set of the popula-tion (in this case only the 50 states and the District of Columbia), until only a single state remained, Oregon, that met each of the three criteria of high unemployment (above av-erage for the U.S.) low income per capita (less than median) and high AHCM (Group “C” with ACHM greater than 1). This effect persisted when the team relaxed the as-sumption on the AHCM by including both Groups “C” and “B”. At this point the testing of this hypothesis stopped since it would require broadening the definitions to where high unemployment included unemployment that was below average, and where low GDP included states that were above the median.
4.5 CONCLUSIONS OF THE QUANTITATIVE STUDY The quantitative study provides insight into the similarity and differences in the impact the Reed Act distribution had on the states. As a complement to the qualitative analy-sis, it can provide valuable information about the broader implications of the distribution has had across the U.S. A number of approaches were attempted in order to provide a picture of how the states responded to the distribution. In some instances the response was the result of an ex-plicit policy choice, in other states it may have been the result of other forces, such as insufficient time to develop concrete proposals for how best to use the funds. A few states also had previously planned benefit or tax changes, or were forced to use the Reed Act distribution as the trust fund was depleted. The economic and fiscal situation in the states also must be considered, although this is of course not a trivial matter to establish in a manner that can be evaluated in the statistical models.
Assessment of the Impact of the 2002 Reed Act Distribution
Center for Employment Security Education and Research 127
The broadest impact of the distribution is without a doubt on the immediate unemploy-ment taxes collected in 2003, and in some instances in 2004. As NASWA has clearly laid out in its study of February 2004, the overall tax reduction impact of the $8 billion distribution in 2003 and 2004, most likely exceeded $4 billion. This is so as many states either moved to a lower schedule, or avoided moving to a higher tax schedule, that would have been in effect had the Reed Act distribution not occurred. This study further showed (hypothesis 5) that this reduction in unemployment taxes was more likely in states that were more solvent, although many states that were less sol-vent experienced lower unemployment taxes as well. The descriptive statistics provide an interesting insight as well into apparent causes for the difference in the AHCM among the states. Figure 4.3.2 showed compelling evi-dence about the differences in a number of variables. The lowest AHCM states appear to have more factors (4 of the 6 evaluated) that work to reduce the trust fund balances than the other two groups, and most notably have longer unemployment duration among the insured population. The ‘medium’ and ‘high’ AHCM each have 2 (out of 6) factors against them, but not the same ones. The ‘medium’ states have higher AWBA and compensate a higher share of workers, whereas the ‘high’ group compensates more weeks per 1000 covered workers and collects less tax per 1000 covered workers. One could infer from this the relative importance of each of these factors in determining a state’s future fiscal position, al-though such inference has not been attempted here. The testing of hypotheses is also of considerable interest. Hypothesis 4, that more sol-vent states are more likely to expand benefits, and hypothesis 5, that more solvent states are more likely to reduce taxes, are of course logical in their presentation, but have now been tested and supported using fairly robust statistical tests. Hypothesis 1, that higher unemployment rates would correspond with greater likelihood of retaining Reed Act funds in the trust fund, was not only refuted, but it was also shown that the correlation is the opposite of the hypothesis, with higher unemployment being consistent with less Reed Act funds remaining in the trust fund. The results of the hy-pothesis testing have been summarized in figure 4.5.1
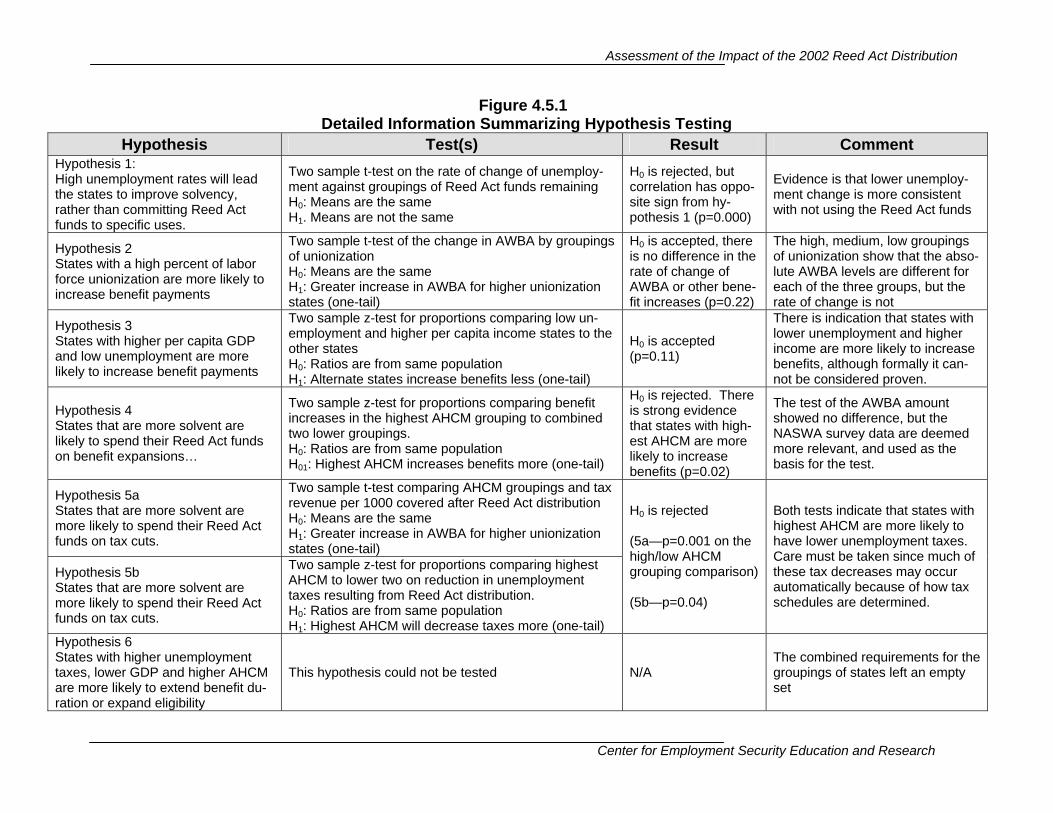
Assessment of the Impact of the 2002 Reed Act Distribution
Center for Employment Security Education and Research
Figure 4.5.1 Detailed Information Summarizing Hypothesis Testing
Hypothesis Test(s) Result Comment Hypothesis 1: High unemployment rates will lead the states to improve solvency, rather than committing Reed Act funds to specific uses.
Two sample t-test on the rate of change of unemploy-ment against groupings of Reed Act funds remaining H0: Means are the same H1. Means are not the same
H0 is rejected, but correlation has oppo-site sign from hy-pothesis 1 (p=0.000)
Evidence is that lower unemploy-ment change is more consistent with not using the Reed Act funds
Hypothesis 2 States with a high percent of labor force unionization are more likely to increase benefit payments
Two sample t-test of the change in AWBA by groupings of unionization H0: Means are the same H1: Greater increase in AWBA for higher unionization states (one-tail)
H0 is accepted, there is no difference in the rate of change of AWBA or other bene-fit increases (p=0.22)
The high, medium, low groupings of unionization show that the abso-lute AWBA levels are different for each of the three groups, but the rate of change is not
Hypothesis 3 States with higher per capita GDP and low unemployment are more likely to increase benefit payments
Two sample z-test for proportions comparing low un-employment and higher per capita income states to the other states H0: Ratios are from same population H1: Alternate states increase benefits less (one-tail)
H0 is accepted (p=0.11)
There is indication that states with lower unemployment and higher income are more likely to increase benefits, although formally it can-not be considered proven.
Hypothesis 4 States that are more solvent are likely to spend their Reed Act funds on benefit expansions…
Two sample z-test for proportions comparing benefit increases in the highest AHCM grouping to combined two lower groupings. H0: Ratios are from same population H01: Highest AHCM increases benefits more (one-tail)
H0 is rejected. There is strong evidence that states with high-est AHCM are more likely to increase benefits (p=0.02)
The test of the AWBA amount showed no difference, but the NASWA survey data are deemed more relevant, and used as the basis for the test.
Hypothesis 5a States that are more solvent are more likely to spend their Reed Act funds on tax cuts.
Two sample t-test comparing AHCM groupings and tax revenue per 1000 covered after Reed Act distribution H0: Means are the same H1: Greater increase in AWBA for higher unionization states (one-tail)
Hypothesis 5b States that are more solvent are more likely to spend their Reed Act funds on tax cuts.
Two sample z-test for proportions comparing highest AHCM to lower two on reduction in unemployment taxes resulting from Reed Act distribution. H0: Ratios are from same population H1: Highest AHCM will decrease taxes more (one-tail)
H0 is rejected (5a—p=0.001 on the high/low AHCM grouping comparison) (5b—p=0.04)
Both tests indicate that states with highest AHCM are more likely to have lower unemployment taxes. Care must be taken since much of these tax decreases may occur automatically because of how tax schedules are determined.
Hypothesis 6 States with higher unemployment taxes, lower GDP and higher AHCM are more likely to extend benefit du-ration or expand eligibility
This hypothesis could not be tested N/A The combined requirements for the groupings of states left an empty set

Assessment of the Impact of the 2002 Reed Act Distribution
Center for Employment Security Education and Research 129
SECTION V LIST OF FIGURES
Assessment of the Impact of the 2002 Reed Act Distribution
Center for Employment Security Education and Research 130
FIGURE TITLE PAGE Figure ES.1 Direct Impact of Reed Act Distribution (as of February 2004) ..............12
Figure ES.2 Themes and Observations form the Reed Act Study............................14
Figure ES.3 Average High Cost Multiple Groups’ Characteristics ............................15
Figure ES.4 Summary Advantages and Potential Disadvantages of the Reed Act Distribution .....................................................................................16
Figure 2.2.1 Summary of Research Findings ...........................................................32
Figure 2.2.2 Key Findings of Qualitative Study.........................................................33
Figure 2.2.3 Key Findings of Quantitative Study.......................................................34
Figure 2.3.1 Common States’ Response Immediately Following Reed Act Distribution ...........................................................................................35
Figure 2.3.2 State Unemployment Insurance Financial Data ...................................37
Figure 2.3.3 Short- to Intermediate Term Impact of Reed Act Distribution ...............39
Figure 3.2.1 Characteristics of States Selected for Qualitative Study.......................44
Figure 3.3.1 Summary of UI Program Data for the First Quarter of 2002 .................48
Figure 3.3.2 Summary of the Uses of the Reed Act Distribution (As of June 2003)....................................................................................................50
Figure 3.4.1 Value of USDOL Guidance...................................................................52
Figure 3.4.2 Consultative Legislative Environment...................................................53
Figure 3.4.3 Evaluation of the impact of the Reed Act funds....................................53
Figure 4.2.1 Trends in Trust Fund Balances for selected states 1999.1 to 2003.2 ..................................................................................................95
Figure 4.3.1 States Grouped by the Average High Cost Multiple ...........................100
Figure 4.3.2 Statistically Tested Relationships Across AHCM Groups 1999.1-2003.2 ................................................................................................101
Figure 4.3.3 Months of Current Quarter’s Unemployment Benefits in Trust Fund...................................................................................................102
Figure 4.3.4 Quarterly unemployment compensation per 1000 covered employment (1999-2003) ..................................................................103
Figure 4.3.5 Average benefits paid per 1000 covered employment over time by AHCM group..................................................................................104
Figure 4.3.6 Number of unemployed per 1000 in Labor Force by AHCM Grouping ............................................................................................105
Figure 4.3.7 Revenue per 1000 in Covered Employment by AHCM Grouping.......106
Figure 4.3.8 States’ increases in UI benefits (all programs) ...................................107
Assessment of the Impact of the 2002 Reed Act Distribution
Center for Employment Security Education and Research 131
Figure 4.3.9 Reed Act funds remaining in the Trust Fund (by quartile) ..................108
Figure 4.4.0 Summary of Hypothesis Testing.........................................................111
Figure 4.4.1 Covered unemployment rates in 2003.2 by Remaining Reed Act Distribution .........................................................................................112
Figure 4.4.2 Nominal Change in the Unemployment Rate 1999.2 to 2003.2 States Grouped by Percent of Reed Act Funds Remaining in Trust Fund..........................................................................................114
Figure 4.4.3 Characteristics of Unionization Groupings..........................................116
Figure 4.4.4 Trend of Average Weekly Benefit Amount’ by Level of Unionization .......................................................................................117
Figure 4.4.5 Number of States Reporting Benefit Changes in 2003 (by level of unionization).......................................................................................117
Figure 4.4.6 Low Unemployment Rate and High Per Capita Income Group Compared with the Alternative ...........................................................119
Figure 4.4.7 Number of States Increasing/Not Increasing Benefits grouped by AHCM ................................................................................................121
Figure 4.4.8 Change in the AWBA Grouped by AHCM ..........................................122
Figure 4.4.9 Change in Quarterly Tax Revenue per 1000 Covered Employment 2002.2 to 2003.2 (Grouped by AHCM)...............................................123
Figure 4.4.10 Change in Quarterly Tax Revenue per 1000 Covered Employment 2002.2 to 2003.2 (Grouped by Percent of Reed Act Remaining in Trust Fund and AHCM) ......................................................................124
Figure 4.4.11 Did the Reed Act Distribution Contribute to Lowered Unemployment taxes in 2003 NASWA Survey Question by AHCM...125
Figure 4.5.1 Detailed Information Summarizing Hypothesis Testing ......................128
Assessment of the Impact of the 2002 Reed Act Distribution
Center for Employment Security Education and Research 132
(This page intentionally left blank)
Assessment of the Impact of the 2002 Reed Act Distribution
Center for Employment Security Education and Research 133
SECTION VI BIBLIOGRAPHY

Assessment of the Impact of the 2002 Reed Act Distribution
Center for Employment Security Education and Research 134
6.1 GOVERNMENT REPORTS General Accounting Office Unemployment Insurance: States’ Use of the 2002 Reed Act Distribution, March 2003. (GAO-03-496) http://www.gao.gov/new.items/d03496.pdf
Bureau of Labor Statistics (BLS) Estimates of Union Density by State. Monthly Labor Review, July 2001. http://www.bls.gov/opub/mlr/2001/07/ressum2.pdf
6.2 NASWA SOURCES NASWA Member Surveys ”State Use of the $8 Billion Reed Act Distribution.” April 2004 ”How Are States Using Their $8 Billion Reed Act Funds?” January 2003
Other NASWA Sources Strengthening the UI Safety Net with $8 Billion in New Federal Reed Act Funding: State Findings & Recommendations. Presented at the UI Safety Net Conference, No-vember 22-23, 2002, Washington, DC The $8 Billion Reed Act Distribution in March 2002: How Have States Used the Funds?, Richard A. Hobbie and Curt Harris, March 2002 (unpublished)
6.3 GOVERNMENT SOURCES Association of State Legislatures (composition information)
Composition of State Legislatures and Governorships Department of Commerce Bureau of Economic Analysis
State Per Capita Income information http://www.bea.gov/bea/regional/statelocal.htm
United States Congress Committee on Ways and Means, U.S. House of Representatives. February 18, 1982. Background Material and Data on Major Programs within the Jurisdiction of the Com-mittee on Ways and Means, 1982 Edition. Washington, DC. Committee on Ways and Means, U.S. House of Representatives. March 3, 1986. Background Material and Data on Major Programs within the Jurisdiction of the Com-mittee on Ways and Means, 1986 edition. Washington, DC.
Assessment of the Impact of the 2002 Reed Act Distribution
Center for Employment Security Education and Research 135
Committee on Ways and Means, U.S. House of Representatives. March 24, 1988. Background Material and Data on Major Programs within the Jurisdiction of the Com-mittee on Ways and Means, 1988 edition. Washington, DC. Committee on Ways and Means, U.S. House of Representatives. March 7, 1991. Background Material and Data on Major Programs within the Jurisdiction of the Com-mittee on Ways and Means, 1991 edition. Washington, DC. Committee on Ways and Means, U.S. House of Representatives. May 15, 1992. Background Material and Data on Major Programs within the Jurisdiction of the Com-mittee on Ways and Means, 1992 edition. Washington, DC.
Transcripts of Congressional Testimony
Testimony on State Use of Reed Act Distributions by Dawn Romero Watson, Secre-tary, Louisiana Department of Labor, March 20, 2003 Testimony on State Use of Reed Act Distributions by Melissa DeLisio, Assistant Direc-tor, Ohio Department of Job and Family Services, March 20, 2003 Trust Fund Overview. Presented to the joint subcommittee studying the funding re-quirements of the Virginia Unemployment trust fund. December 19, 2002. http://www.wa.gov/esd/AgencyInfo/newsreleases/nr071703.pdf
United States Department of Labor Chao, Secretary Elaine. Letter toThe Honorable Richard B. Cheney, President of the Senate, October 1, 2001. U.S. Department of Labor, 2001. Training and Employment Guidance Letter (TEGL) 18-01 Regarding the Reed Act: http://wdr.doleta.gov/directives/corr_doc.cfm?DOCN=1377 Training and Employment Guidance Letter (TEGL) 18-01 Regarding the Reed Act (Q&A): http://wdr.doleta.gov/directives/corr_doc.cfm?DOCN=1466 UI Data Summary, published by the Employment and Training Administration of the US Department of Labor U.S. Department of Labor. 2001. Comparison of State Unemployment Insurance Laws. Washington, D.C. Employment and Training Administration. U.S. Department of Labor. 1986. Fifty Years of Unemployment Insurance -- A Legis-lative History: 1935 - 1985. Washington, DC. Employment and Training Administra-tion. U.S. Department of Labor. May 8, 2002. Suggested Uses of Reed Act Distribution for Administrative Purposes, Training and Employment Guidance Letter No. 24-01. Washington, DC. Employment and Training Administration.
Assessment of the Impact of the 2002 Reed Act Distribution
Center for Employment Security Education and Research 136
U. S. Department of Labor. September 12, 1997. The Reed Act Provisions of Title IX of the Social Security Act, Unemployment Insurance Program Letter 39-97. Washing-ton, DC. Employment and Training Administration. U.S. Department of Labor. February 4, 2002. U.S. Department of Labor’s ETA 2003 Budget Fact Sheet. Washington, DC. Employment and Training Administration.
Other U.S. Department of Labor References
Telephone conversation with Lynne Webb, May 2003 Other Government Sources
National Commission on Unemployment Compensation. July 1980. Unemployment Compensation: Final Report. Washington, DC. Sundquist, Governor Don and O’Bannon, Governor Frank. Letter to The Honorable William M. Thomas, Chairman, House Ways and Means Committee, October 4, 2001. National Governors’ Association, 2001. New Jersey Labor Commissioner Outlines Department’s Priorities for the Upcoming Year. http://www.state.nj.us/labor/press/0430SenateSpeech.htm
Michigan Unemployment Insurance at a Glance. Published by the National Employ-ment Law Project, November 2001 Record Employment Triggers Adjustment in UI Rate. www.iowaworkforce.org/news/2002/08312002.pdf
6.4 OTHER NON-GOVERNMENT SOURCES National Bureau of Economic Research
Information on the Business Cycle and Economic Recessions http://www.nber.org/cycles.html/
History of the Reed Act
Downey, Kirstin. January 30, 2003. “States Used Jobless Funds to Cut Employer Taxes.” The Washington Post, p. E2. Washington, DC. Haber, William and Merrill G. Murray. 1966. Unemployment Insurance in the Ameri-can Economy. Homewood, IL: Richard D. Irwin. Henle, Peter. July 1980. “The Federal Budget: Removal of State Unemployment Trust Funds.” In Unemployment Compensation: Studies and Research, Vol. 2, Na-tional Commission on Unemployment Compensation, Washington, DC.
Assessment of the Impact of the 2002 Reed Act Distribution
Center for Employment Security Education and Research 137
SECTION VII ATTACHMENTS
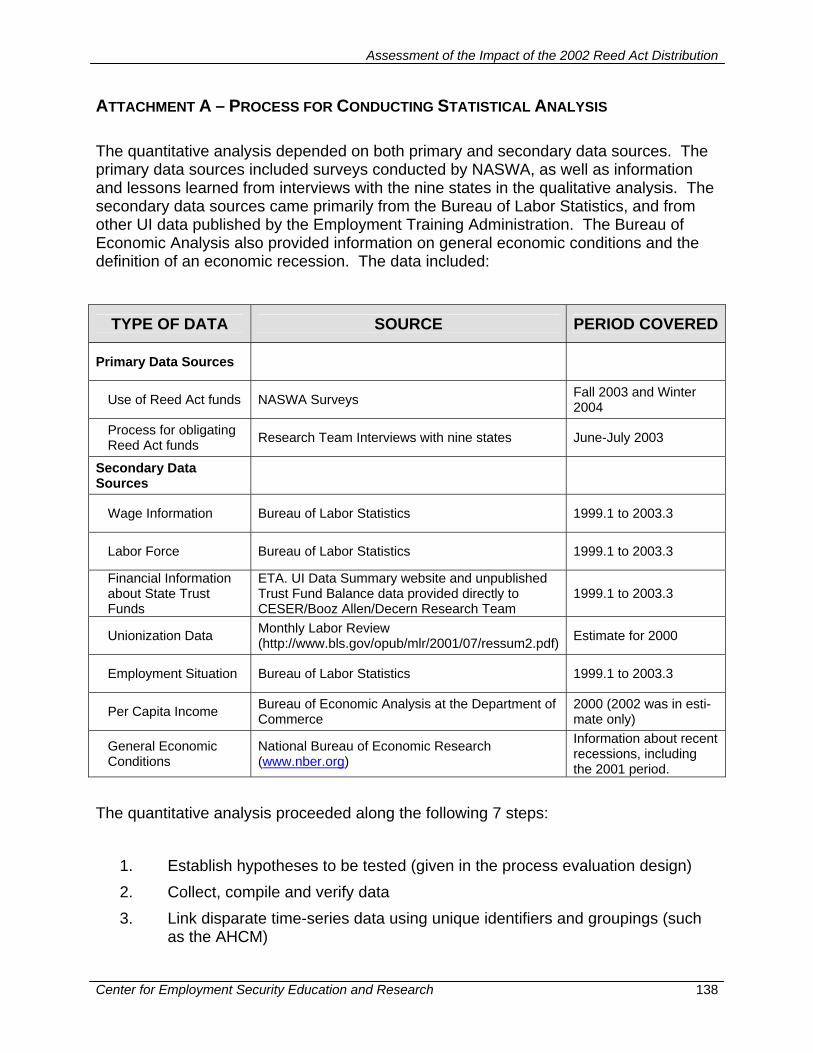
Assessment of the Impact of the 2002 Reed Act Distribution
Center for Employment Security Education and Research 138
ATTACHMENT A – PROCESS FOR CONDUCTING STATISTICAL ANALYSIS The quantitative analysis depended on both primary and secondary data sources. The primary data sources included surveys conducted by NASWA, as well as information and lessons learned from interviews with the nine states in the qualitative analysis. The secondary data sources came primarily from the Bureau of Labor Statistics, and from other UI data published by the Employment Training Administration. The Bureau of Economic Analysis also provided information on general economic conditions and the definition of an economic recession. The data included:
TYPE OF DATA SOURCE PERIOD COVERED
Primary Data Sources
Use of Reed Act funds NASWA Surveys Fall 2003 and Winter 2004
Process for obligating Reed Act funds Research Team Interviews with nine states June-July 2003
Secondary Data Sources
Wage Information Bureau of Labor Statistics 1999.1 to 2003.3
Labor Force Bureau of Labor Statistics 1999.1 to 2003.3
Financial Information about State Trust Funds
ETA. UI Data Summary website and unpublished Trust Fund Balance data provided directly to CESER/Booz Allen/Decern Research Team
1999.1 to 2003.3
Unionization Data Monthly Labor Review (http://www.bls.gov/opub/mlr/2001/07/ressum2.pdf) Estimate for 2000
Employment Situation Bureau of Labor Statistics 1999.1 to 2003.3
Per Capita Income Bureau of Economic Analysis at the Department of Commerce
2000 (2002 was in esti-mate only)
General Economic Conditions
National Bureau of Economic Research (www.nber.org)
Information about recent recessions, including the 2001 period.
The quantitative analysis proceeded along the following 7 steps:
1. Establish hypotheses to be tested (given in the process evaluation design) 2. Collect, compile and verify data 3. Link disparate time-series data using unique identifiers and groupings (such
as the AHCM)

Assessment of the Impact of the 2002 Reed Act Distribution
Center for Employment Security Education and Research 139
4. Produce pivot tables and graphs to examine relationships 5. Conduct one or more statistical tests on data sets to examine if statistical cor-
relations were identified 6. Reexamine data be excluding outlier data and/or by combining cells with few
observations with larger cells 7. Write up the findings and produce a ‘lab report’ (Attachment C) of the hy-
pothesis testing
Assessment of the Impact of the 2002 Reed Act Distribution
Center for Employment Security Education and Research 140
ATTACHMENT B – NASWA SURVEYS B.1 Winter 2004 Survey
State Use of the $8 Billion Reed Act Distribution36
Background
The “Reed Act” is a provision of the Social Security Act (SSA). Until recently, it had activated only in the late 1950s. It provides for the distribution of federal unemployment tax funds to state unemployment insurance (UI) and employment service programs in the seemingly unlikely event the federal government collected excess unemployment tax revenue. As the federal government approached a balanced budget in the late 1990s, Reed Act distributions occurred in five consecu-tive years beginning in fiscal year 1999 with a $16 million distribution and culminating in a mas-sive $8 billion distribution in March 2002.
In August, 2002, The National Association of State Workforce Agencies (NASWA) conducted a survey of state actions using the $8 billion Reed Act distribution from the federal government. The results of this survey were posted on the National Association of State Workforce Agencies’ website, the Workforce ATM, in a paper entitled, “How Are States Using Their $8 Billion Reed Act Funds?” About half of the states believed they were not solvent enough to authorize discre-tionary tax cuts or to initiate new spending, or they were planning to submit proposals to state legislatures in 2003. The other half of the states used some Reed Act funds in 2002 to allow cuts in unemployment taxes on employers. A few states used the funds to enhance UI benefits, and about one in five states used the funds to improve employment services or UI administration. However, the U.S. General Accounting Office reported states had spent only about 17 percent of the $8 billion by the end of November, 2002.37
Policy makers still are asking how states used their allocations from the $8 billion Reed Act dis-tribution. Indeed, some Members of Congress have even suggested states are “sitting on the funds.” The Administration has said states could use the remaining Reed Act funds to extend benefits in lieu of another extension of Temporary Extended Unemployment Compensation (TEUC) program. Others have suggested states ought to stop asking for increased appropriations 36 This study was completed in February of 2004. At that time, it appeared that the economic stimulus from the benefit spend-
ing was largely due to new and increased benefit expenditures. Subsequent detailed analysis of available data suggest, however, that most of this $2.9 billion in spending occurred in states that were forced to use the Reed Act funds on normal benefits prior to borrowing to remain their trust fun’s solvency. Subsequently, the majority of the estimated economic stimu-lus should not be categorized as such. The main report, of which this is an appendix, presents the later finding.
37 U.S. General Accounting Office, Unemployment Insurance: States’ Use of the 2002 Reed Act Distribution, GAO-03-496, March 2003.
Assessment of the Impact of the 2002 Reed Act Distribution
Center for Employment Security Education and Research 141
and use remaining Reed Act funds to fill in for insufficient federal funding of employment ser-vices and UI administration.
In response to the continuing questions, NASWA conducted another survey on February 18, 2004, to determine if states were “sitting on Reed Act funds.” All 53 state and territorial work-force agencies responded. The results of the survey show not only are states not “sitting on Reed Act funds,” but they are using the funds effectively to stimulate the economy and to improve the UI and employment service programs. In fact, states have taken a balanced approach to stimulat-ing the economy with the $8 billion by cutting employer-paid unemployment payroll taxes by about $4 billion and by spending over $4 billion on benefits38 and generally improving the UI and employment service programs.
The Survey The February 18, 2004 NASWA survey asked states the following questions:
1. Were state unemployment taxes lower in 2003 as a result of the Reed Act distribution in-creasing your state’s trust fund account balance? If so, by how much in total dollars were state unemployment taxes estimated to be lower in 2003 than they would have been with-out the Reed Act distribution?
2. Are state unemployment taxes lower in 2004 as a result of the Reed Act distribution in-creasing your state’s trust fund account balance? If so, by how much in total dollars were state unemployment taxes estimated to be lower in 2004 than they would have been with-out the Reed Act distribution?
3. In 2003, did your state expand coverage or eligibility, increase weekly benefits, or extend potential duration of benefits? If so, please describe these changes and indicate if this re-sulted from the availability of Reed Act funds?
4. In 2003, did your state legislature appropriate Reed Act funds for administration of the Unemployment Insurance program? If so, please provide the amount of the appropriation for each year and describe on what the appropriations will be spent.
5. In 2003, did your state legislature appropriate Reed Act funds for employment services? If so, please provide the amount of the appropriation for each year and describe on what these appropriations will be spent.
6. Does your state have an outstanding loan to cover the cost of unemployment benefits? If so, what is the dollar amount of the outstanding balance? When was the loan obtained? Was the loan from the federal government or other source? What were the terms of the loan?
7. Does your state plan to borrow again in 2004 to cover the cost of benefits? If so, what is the estimated dollar amount? When do you estimate your state would need to borrow
38 See comment in footnote 36.
Assessment of the Impact of the 2002 Reed Act Distribution
Center for Employment Security Education and Research 142
these funds? Do you plan to borrow from the federal government or another source? (We understand if you have not made an official request to borrow, you might not be able to share this information.)
Survey Results
Table 1, Estimated State UI Tax Reductions, provides state-by-state data on the $8 billion Reed Act distribution in 2002 and its estimated impact on state unemployment taxes in 2003 and 2004. In the aggregate, states estimated cuts in state unemployment taxes at over $4 billion as a result of higher balances augmented by the Reed Act distribution States estimated state unemploy-ment tax cuts of about $2.6 billion, or nearly 10 percent in 2003. In 2004, the tax reduction was estimated at about $1.5 billion. Ten states had tax cuts exceeding 20 percent of estimated annual revenue, with Georgia at 61 percent, New Hampshire at 46 percent, Maryland at 32 percent, and Utah at 30 percent.
Table 2, State Reed Act Spending and Combined State Tax Reductions, shows estimated state spending of the $8 billion Reed Act distribution as of February 27, 2004 in the last column. States spent an estimated $4.2 billion of the $8 billion Reed Act distribution. Table 2 also shows the combined 2003/2004 estimated state tax reductions totaling $4.1 billion in the fifth column. Clearly, states are not “sitting on the funds.” Instead, states have provided substantial economic stimulus of about $8.3 billion.
The estimate of the $8 billion Reed Act distribution providing more economic stimulus than $8 billion seems incredible, but it is possible. Certainly, states could have spent all of the $8 billion in the first year and that would have been the amount of economic stimulus. However, states only spent about half of these funds and retained the other half in state unemployment trust fund accounts. This does not mean they were “sitting on the funds.” Instead, the effect has not only improved unemployment trust fund solvency, but also has activated automatically lower tax rates under current state unemployment tax laws that lead to lower unemployment taxes on employers. Depending on the relationship between the trust fund balances that activate lower tax rates and the taxes collected under these tax rates, the estimated tax cuts can vary and could exceed the amount of the Reed Act distribution retained in the trust fund account. In fact, the estimated stimulus of $8.3 billion could grow beyond the year 2004 because unemployment taxes might continue to be lower than they would have been without the Reed Act distribution.
Table 3, Expanding UI Benefits, shows 8 states increased weekly benefit amounts, 17 states ex-panded coverage or eligibility, 1 stated increased the wage replacement rate, and 2 states in-creased weeks of benefits. Four states enacted alternate base periods to help low-wage workers become eligible for UI; three states provided benefits to part-time workers seeking part-time work, and three states added benefits for victims of domestic violence.
Table 4, UI Administration Purposes, shows the rich array of state spending totaling $844 mil-lion on improving UI administration. This includes spending on a new tax accounting system in Alaska, a fraud overpayment collection program in California, a tax system and upgraded com-puter equipment in Idaho, modernized automated benefit and tax systems in Indiana and Wyo-ming, new telephone claims technology in Michigan, a new tax system in Ohio, and much more.
Assessment of the Impact of the 2002 Reed Act Distribution
Center for Employment Security Education and Research 143
Table 5, Employment Service Purposes, shows spending totaling $438 million on employment services. This includes spending on upgrading of computer equipment in 23 one-stop career cen-ters in Alaska, added reemployment services in Florida, welfare-to-work services in Michigan, upgraded information technology infrastructure in one-stop career centers in New Jersey, Ameri-cans with Disabilities Act (ADA) accommodations in Tennessee, labor exchange services in Utah, Economic Relief Center services in Virginia, and upgrades in an autodialer computer sys-tem in Wyoming.
Table 6, State UI Trust Fund Loans, shows seven states currently [as of April 2004] have a total of $4.4 billion in outstanding loans, five of which are from the federal unemployment trust fund loan account. States with federal loans are Illinois at $893 million, Minnesota at $256 million, Missouri at $196 million, New York at $936 million, and North Carolina $250 million (partly funded by revenue bonds). In addition, Pennsylvania borrowed $300 million from a motor vehi-cle license fund and Texas borrowed $1.6 billion in the bond market. In addition, eight states said they might borrow amounts summing to $2.1 billion in 2004. This includes California at $1.145 billion, Massachusetts at $160 million, Minnesota at $200 million, Missouri at $325 mil-lion, and North Carolina at $285 million.
Additional Reed Act funds could help states needing loans to avoid borrowing and perhaps avoid raising taxes higher than might occur with another Reed Act distribution. However, states who borrow from the federal government must repay voluntarily within a two- or three-year period, or their federal unemployment taxes will rise automatically to repay their debts. Either way, these states probably face benefit cuts or tax increases in the near future to restore balances in their unemployment trust fund accounts.
Conclusion The February 2004 NASWA survey shows:
• States are not “sitting on the funds.” The funds have been used for their intended pur-
poses - economic stimulus, improved UI benefits and administration, and employment services.
• The $8 billion Reed Act distribution has provided effective economic stimulus through not only state spending of about $4 billion on benefits, UI administration, and employ-ment services, but also on substantial state unemployment payroll tax cuts for employers exceeding $4 billion.
• The $8 billion Reed Act distribution has improved state unemployment trust fund sol-vency, but many states are in need of loans or will be in need of loans if they do not raise taxes, cut benefits, or receive another Reed Act distribution.
• Another substantial Reed Act distribution probably would stimulate further the economy by increasing spending on benefits, employment services, and UI administration and would increase employment by cutting unemployment taxes on employer payrolls.

Assessment of the Impact of the 2002 Reed Act Distribution
Center for Employment Security Education and Research 144
Table 1 Estimated UI Tax Reduction (April 2004)
Revenue Estimated Estimated Reed Act Trust Fund Trust Fund Collected State UI Taxes Percent State UI Taxes
Distribution Balance at End of Balance at End of Past 12 months Reductions Tax Reductions March 2002 1st Qtr 2002 4th Qtr 2003 4th Qtr 2003 2003 Reduction 2004
State ($ in millions) ($ in millions) ($ in millions) ($ in millions) ($ in millions) 2003 ($ in millions)
Alabama 110.6 372.2 253.4 239.6 0.0 0% 0.0Alaska 14.8 221.5 193.0 117.6 0.0 0% 0.0Arizona 144.1 1,041.1 749.7 154.1 32.0 17% 32.0Arkansas 64.0 174.3 61.1 236.9 0.0 0% 0.0California 936.9 5,842.2 961.7 3,343.7 300.0 8% 0.0Colorado 142.7 701.8 132.0 220.1 60.0 21% 92.0Connecticut 100.4 566.4 413.2 584.2 0.0 0% 0.0Delaware 26.0 317.2 239.4 60.4 3.3 5% 3.3District of Columbia 25.8 281.9 287.0 97.9 0.1 0% 0.0Florida 449.7 2,000.2 1,373.5 712.9 175.1 20% 47.2Georgia 249.7 1,621.2 702.9 157.6 250.0 61% 250.0Hawaii 30.8 301.9 347.2 159.2 0.0 0% 47.0Idaho 32.2 213.1 127.3 110.9 0.0 0% 0.0Illinois 376.2 1,109.0 5.0 1,425.0 0.0 0% 0.0Indiana 174.6 1,315.8 758.3 360.4 55.0 13% 135.0Iowa 82.4 759.2 705.6 275.9 0.0 0% 0.0Kansas 78.2 478.5 293.9 233.3 33.6 13% 32.0Kentucky 103.8 528.7 340.0 308.1 0.0 0% 61.8Louisiana 105.5 1,578.2 1,494.2 157.0 0.0 0% 0.0Maine 32.5 424.0 438.3 89.2 26.2 23% 13.5Maryland 142.9 873.5 584.0 299.8 141.4 32% 42.0Massachusetts 193.6 1,402.3 55.2 928.4 0.0 0% 0.0Michigan 291.5 2,411.9 1,247.8 1,158.3 0.0 0% 0.0Minnesota 163.1 366.2 0.0 540.7 73.5 12% 0.0Mississippi 64.7 692.8 647.7 122.6 21.0 15% 57.0Missouri 161.4 294.6 3.7 353.0 0.0 0% 0.0Montana 18.6 189.7 196.1 65.3 0.0 0% 0.0Nebraska 48.4 165.2 142.0 116.3 14.0 11% 0.0Nevada 68.1 478.4 428.6 247.6 0.0 0% 0.0New Hampshire 38.5 330.8 226.5 40.8 34.5 46% 11.3New Jersey 242.8 2,998.4 1,513.3 1,271.9 0.0 0% 0.0New Mexico 38.6 606.6 588.8 89.1 0.0 0% 26.0New York 491.3 166.0 6.6 2,674.0 0.0 0% 0.0North Carolina 240.9 571.2 10.4 778.6 0.0 0% 0.0North Dakota 15.3 34.6 55.5 53.8 0.0 0% 0.0Ohio 343.7 1,852.4 882.6 749.3 252.0 25% 268.0Oklahoma 81.4 521.6 352.8 169.5 50.5 23% 0.0Oregon 98.0 1,415.8 1,017.2 589.3 67.8 10% 0.0Pennsylvania " 337.6 2,109.0 761.9 1,687.7 91.0 5% 73.0Puerto Rico 48.9 522.3 512.3 184.9 0.0 0% 0.0Rhode Island 27.1 259.5 203.3 146.6 0.0 0% 0.0South Carolina 108.2 633.8 373.2 238.4 0.0 0% 0.0South Dakota 19.1 55.5 38.2 16.3 0.0 0% 15.0Tennessee 162.6 673.6 499.0 448.4 97.0 18% 63.0Texas 596.4 573.4 771.8 3,086.0 ** 596.4 16% 0.0Utah 61.6 566.2 368.2 97.0 41.0 30% 12.5Vermont 16.4 304.5 248.2 45.0 7.5 14% 0.0Virgin Islands 2.0 64.1 36.5 2.0 0.0 0% 0.0Virginia 214.9 941.6 226.3 255.3 19.3 7% 0.0Washington 167.0 1,616.9 972.4 1,184.8 172.0 13% 189.2West Virginia 36.2 244.4 207.6 128.9 0.0 0% 0.0Wisconsin 166.2 1,456.1 961.7 537.9 0.0 0% 0.0Wyoming 12.0 201.4 177.6 18.1 0.0 0% 0.0Total 8,000.0$ 45,442.7$ 24,193.7$ 27,369.6$ 2,614.2$ 9% 1,470.8$
* States gave ambiguous answers to the survey by saying their tax employer rates stayed the same.** The $3,086 million includes $1,379.8 million in bond state proceeds" Pennsylvania states a $59 million benefit reduction was prevented in 2004.
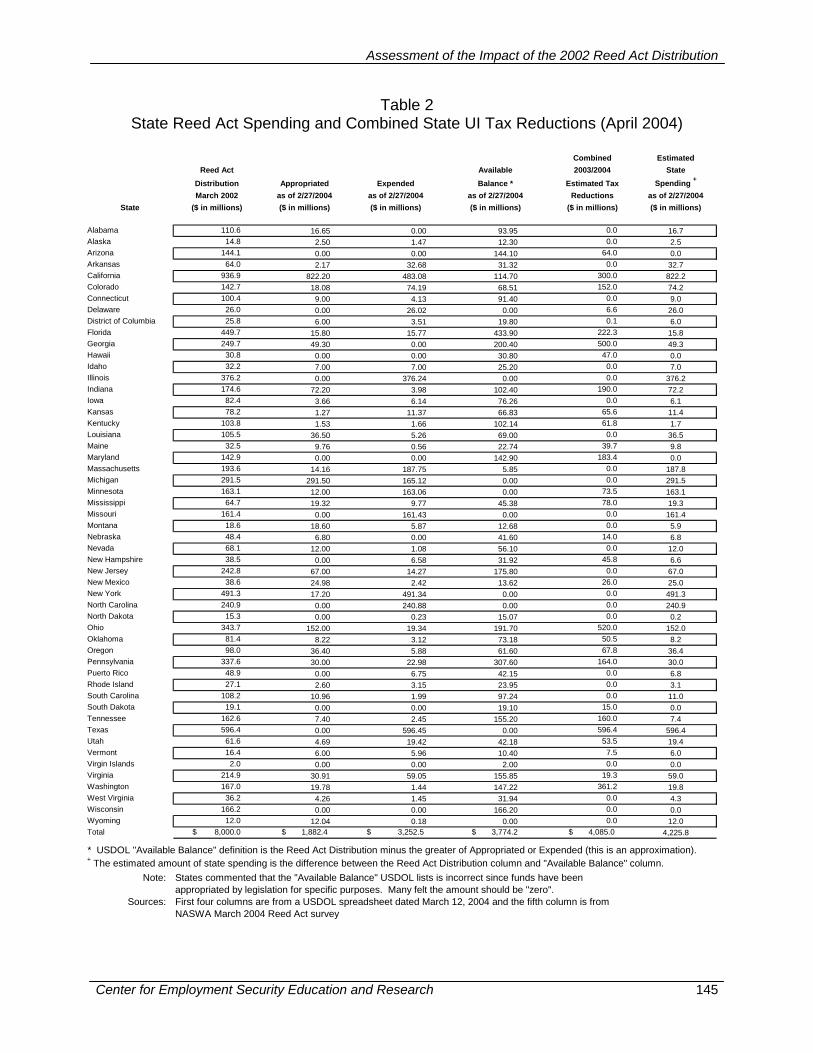
Assessment of the Impact of the 2002 Reed Act Distribution
Center for Employment Security Education and Research 145
Table 2 State Reed Act Spending and Combined State UI Tax Reductions (April 2004)
Combined EstimatedReed Act Available 2003/2004 State
Distribution Appropriated Expended Balance * Estimated Tax Spending +
March 2002 as of 2/27/2004 as of 2/27/2004 as of 2/27/2004 Reductions as of 2/27/2004State ($ in millions) ($ in millions) ($ in millions) ($ in millions) ($ in millions) ($ in millions)
Alabama 110.6 16.65 0.00 93.95 0.0 16.7Alaska 14.8 2.50 1.47 12.30 0.0 2.5Arizona 144.1 0.00 0.00 144.10 64.0 0.0Arkansas 64.0 2.17 32.68 31.32 0.0 32.7California 936.9 822.20 483.08 114.70 300.0 822.2Colorado 142.7 18.08 74.19 68.51 152.0 74.2Connecticut 100.4 9.00 4.13 91.40 0.0 9.0Delaware 26.0 0.00 26.02 0.00 6.6 26.0District of Columbia 25.8 6.00 3.51 19.80 0.1 6.0Florida 449.7 15.80 15.77 433.90 222.3 15.8Georgia 249.7 49.30 0.00 200.40 500.0 49.3Hawaii 30.8 0.00 0.00 30.80 47.0 0.0Idaho 32.2 7.00 7.00 25.20 0.0 7.0Illinois 376.2 0.00 376.24 0.00 0.0 376.2Indiana 174.6 72.20 3.98 102.40 190.0 72.2Iowa 82.4 3.66 6.14 76.26 0.0 6.1Kansas 78.2 1.27 11.37 66.83 65.6 11.4Kentucky 103.8 1.53 1.66 102.14 61.8 1.7Louisiana 105.5 36.50 5.26 69.00 0.0 36.5Maine 32.5 9.76 0.56 22.74 39.7 9.8Maryland 142.9 0.00 0.00 142.90 183.4 0.0Massachusetts 193.6 14.16 187.75 5.85 0.0 187.8Michigan 291.5 291.50 165.12 0.00 0.0 291.5Minnesota 163.1 12.00 163.06 0.00 73.5 163.1Mississippi 64.7 19.32 9.77 45.38 78.0 19.3Missouri 161.4 0.00 161.43 0.00 0.0 161.4Montana 18.6 18.60 5.87 12.68 0.0 5.9Nebraska 48.4 6.80 0.00 41.60 14.0 6.8Nevada 68.1 12.00 1.08 56.10 0.0 12.0New Hampshire 38.5 0.00 6.58 31.92 45.8 6.6New Jersey 242.8 67.00 14.27 175.80 0.0 67.0New Mexico 38.6 24.98 2.42 13.62 26.0 25.0New York 491.3 17.20 491.34 0.00 0.0 491.3North Carolina 240.9 0.00 240.88 0.00 0.0 240.9North Dakota 15.3 0.00 0.23 15.07 0.0 0.2Ohio 343.7 152.00 19.34 191.70 520.0 152.0Oklahoma 81.4 8.22 3.12 73.18 50.5 8.2Oregon 98.0 36.40 5.88 61.60 67.8 36.4Pennsylvania 337.6 30.00 22.98 307.60 164.0 30.0Puerto Rico 48.9 0.00 6.75 42.15 0.0 6.8Rhode Island 27.1 2.60 3.15 23.95 0.0 3.1South Carolina 108.2 10.96 1.99 97.24 0.0 11.0South Dakota 19.1 0.00 0.00 19.10 15.0 0.0Tennessee 162.6 7.40 2.45 155.20 160.0 7.4Texas 596.4 0.00 596.45 0.00 596.4 596.4Utah 61.6 4.69 19.42 42.18 53.5 19.4Vermont 16.4 6.00 5.96 10.40 7.5 6.0Virgin Islands 2.0 0.00 0.00 2.00 0.0 0.0Virginia 214.9 30.91 59.05 155.85 19.3 59.0Washington 167.0 19.78 1.44 147.22 361.2 19.8West Virginia 36.2 4.26 1.45 31.94 0.0 4.3Wisconsin 166.2 0.00 0.00 166.20 0.0 0.0Wyoming 12.0 12.04 0.18 0.00 0.0 12.0Total 8,000.0$ 1,882.4$ 3,252.5$ 3,774.2$ 4,085.0$ 4,225.8
* USDOL "Available Balance" definition is the Reed Act Distribution minus the greater of Appropriated or Expended (this is an approximation).+ The estimated amount of state spending is the difference between the Reed Act Distribution column and "Available Balance" column.
Note: States commented that the "Available Balance" USDOL lists is incorrect since funds have beenappropriated by legislation for specific purposes. Many felt the amount should be "zero".
Sources: First four columns are from a USDOL spreadsheet dated March 12, 2004 and the fifth column is fromNASWA March 2004 Reed Act survey
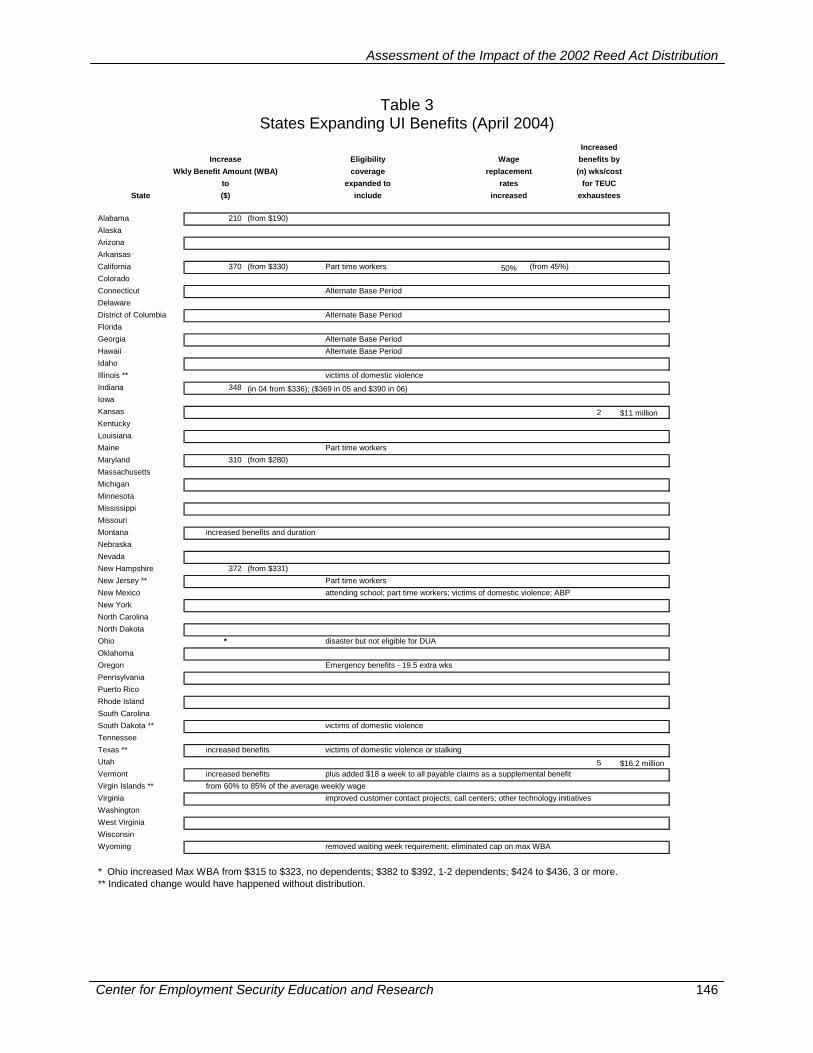
Assessment of the Impact of the 2002 Reed Act Distribution
Center for Employment Security Education and Research 146
Table 3 States Expanding UI Benefits (April 2004)
IncreasedIncrease Eligibility Wage benefits by
Wkly Benefit Amount (WBA) coverage replacement (n) wks/costto expanded to rates for TEUC
State ($) include increased exhaustees
Alabama 210 (from $190)AlaskaArizonaArkansasCalifornia 370 (from $330) Part time workers 50% (from 45%)ColoradoConnecticut Alternate Base PeriodDelawareDistrict of Columbia Alternate Base PeriodFloridaGeorgia Alternate Base PeriodHawaii Alternate Base PeriodIdahoIllinois ** victims of domestic violenceIndiana 348 (in 04 from $336); ($369 in 05 and $390 in 06)IowaKansas 2 $11 millionKentuckyLouisianaMaine Part time workersMaryland 310 (from $280)MassachusettsMichiganMinnesotaMississippiMissouriMontana increased benefits and durationNebraskaNevadaNew Hampshire 372 (from $331)New Jersey ** Part time workersNew Mexico attending school; part time workers; victims of domestic violence; ABPNew YorkNorth CarolinaNorth DakotaOhio * disaster but not eligible for DUAOklahomaOregon Emergency benefits - 19.5 extra wksPennsylvaniaPuerto RicoRhode IslandSouth CarolinaSouth Dakota ** victims of domestic violenceTennesseeTexas ** increased benefits victims of domestic violence or stalkingUtah 5 $16.2 millionVermont increased benefits plus added $18 a week to all payable claims as a supplemental benefitVirgin Islands ** from 60% to 85% of the average weekly wageVirginia improved customer contact projects; call centers; other technology initiativesWashingtonWest VirginiaWisconsinWyoming removed waiting week requirement; eliminated cap on max WBA
* Ohio increased Max WBA from $315 to $323, no dependents; $382 to $392, 1-2 dependents; $424 to $436, 3 or more.** Indicated change would have happened without distribution.

Assessment of the Impact of the 2002 Reed Act Distribution
Center for Employment Security Education and Research 147
Table 4 UI Administration Purposes (April 2004)
Funds forUI Admn Purposes
2003 State legislature appropriated Reed Act funds for administration of the UI programState ($ in millions)
Alabama 14.4 Appropriated for UI and ES future needs and state to establish a plan to spend the funds over a 4-5 year time periodAlaska 2.0 used for a new tax accounting system for employer quarterly taxes and wagesArizonaArkansas 77.6 Biennium - UI benefits, facility lease and upgrade costs, salaries, employee benefits, and staff trainingCalifornia 144.9 Fraud overpayment collection program, salary needs, maintain current operating levels, enhance UI anti-fraud measures, & automationColorado 4.6 Construction costs to house all of UI operationsConnecticut 0.5 Alternate Base Period implementation, automation and network upgrades; $2.7 million has been set aside for FY2004Delaware Delaware spent all its Reed Act funds on UI benefit paymentsDistrict of Columbia 7.6 Contractual services to maintain and enhance UC benefit system and the automated tax system; hiring of IT staffFloridaGeorgia 49.3 Facility needs, improve service delivery systems, staff training, improve information system, improve technology and upgrade equip HawaiiIdaho 7.0 Tax system upgrade, upgrade computer equipment, staff distance learning project, and invested in information technologyIllinoisIndiana 39.9 Modernize the UI tax and UI benefit computer system. A 10 year appropriation and approximately $400,000 has been spent so far.Iowa 20.0 Appropriated for technology upgrades for the UI tax and benefit systems. Authority to spend the funds over a 4-5 yr time period.Kansas 2.4 Additional staff to handle the workload in the UI operations; Treasurer Office fee of $.4 million for UI warrants. To be used for FY2004Kentucky 7.5 Appropriated through 2004. Expenditures are authorized for UI & ES; expect funds to be applied to UI only for program administration costsLouisiana 20.6 Detail use of funds was not given.Maine 9.8 IT one-time projects to improve operations and integrity, facility needs, toll-free telephone access, funds appropriated over a 5-7 time periodMaryland None of the Reed Act funds have been requested or approved for administration of UI. Funds may be requested in the future.MassachusettsMichigan 75.0 Implement technology for telephone filed claims ($13M); administration ($30M); IT modernization projects ($32M)Minnesota 12.0 Appropriated for UI administrationMississippi 19.3 Facility needs - new state office buildingMissouriMontana 10.8 Moving tax program from Revenue to Labor, bond payments, IT staff for internet claims; $4.5 of $10.8 marked for 2004 & 2005Nebraska 6.8 Write a new benefit payment computer system over the next 2 yearsNevada 15.0 Construction of an administration office building to be built between 2004 and 2007New HampshireNew Jersey 24.0 Upgrading benefit payment systemNew Mexico 19.1 Authority to spend funds thru 2007, Administer expanded coverage of benefits, Facility and equip upgrades, AS&T costs, UI automationNew YorkNorth CarolinaNorth Dakota 0.2 Authorized business case study on modernizing the UI claims and tax automated systemsOhio 129.0 UI tax system, staff training, local office transition, and supplement federal shortfalls. Appropriated thru 2005.Oklahoma 3.9 Supplemented UI program budget shortfalls through June 2004Oregon 14.5 Administration of UI program; for both normal program administration and also to allow the implementation of customer contact centersPennsylvania 8.0 $15 million was appropriated for UI and ES uses; funds were expended for UI technology system modernization efforts.Puerto Rico 23.2 For direct deposit, banking verification system, internet app, staff training, facility and equip upgrades, and AS&T costsRhode Island Appropriated for UI and ES administration use (expect to expend total appropriation for ES purposes by June 2004)South Carolina 9.7 Acquisition of land and construction of 5 local office facilities over the next 3 to 5 yearsSouth DakotaTennessee 5.8 For facility and equip upgrades, telephone claims centers, supplement funding shortfalls, staff training, ADA requirements, pay raisesTexasUtahVermontVirgin IslandsVirginia 24.7 Augment basic UI functions, improve customer contact/call centers and technology, and UI transition to customer contact centers Washington 19.6 Imaging system, improve initial claim process, staff training, implementing employment security law changes, funds marked thru 2005West Virginia 4.7 Appropriated thru 2004; facility & computer equip upgrades, and relocation to One-Stop shops; prevented staff layoffs and office closuresWisconsin Legislation is currently pending for $5 million thru 2005 to design, build, and implement a new UI benefit systemWyoming 10.1 Rewrite UI benefits and tax computer systems, implement the Wyoming Workforce Informer system (public LMI access)Total 843.5$
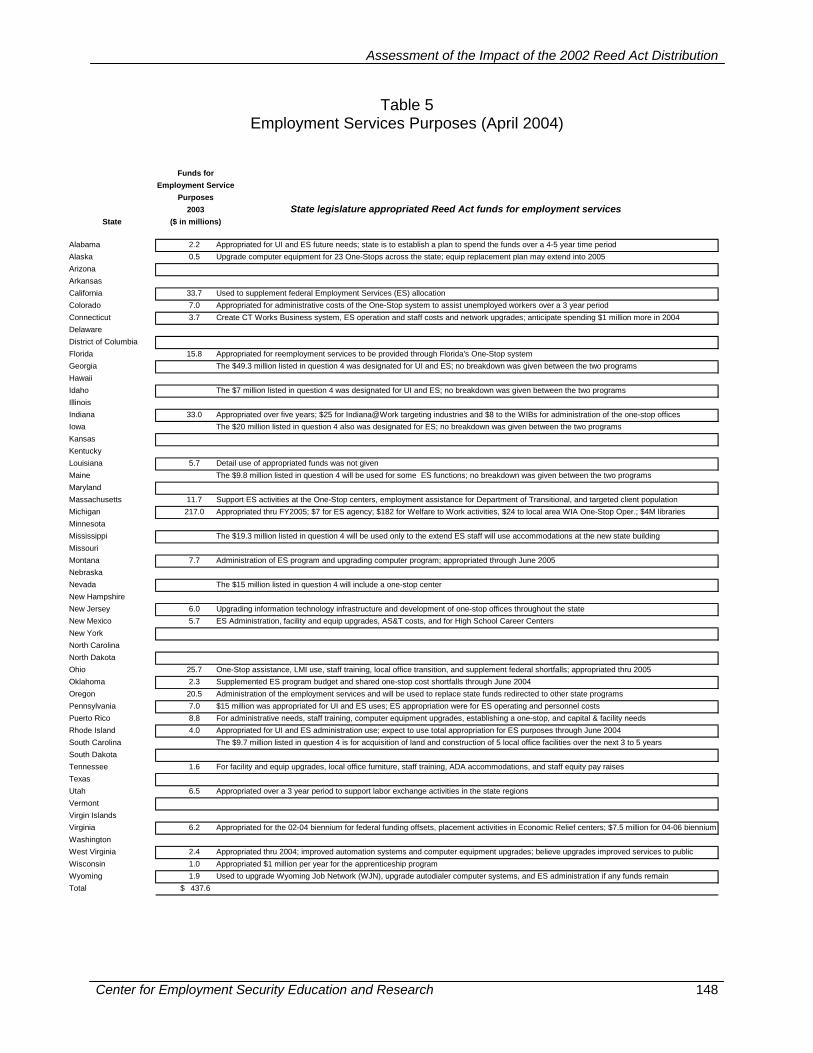
Assessment of the Impact of the 2002 Reed Act Distribution
Center for Employment Security Education and Research 148
Table 5 Employment Services Purposes (April 2004)
Funds forEmployment Service
Purposes2003 State legislature appropriated Reed Act funds for employment services
State ($ in millions)
Alabama 2.2 Appropriated for UI and ES future needs; state is to establish a plan to spend the funds over a 4-5 year time periodAlaska 0.5 Upgrade computer equipment for 23 One-Stops across the state; equip replacement plan may extend into 2005ArizonaArkansasCalifornia 33.7 Used to supplement federal Employment Services (ES) allocationColorado 7.0 Appropriated for administrative costs of the One-Stop system to assist unemployed workers over a 3 year periodConnecticut 3.7 Create CT Works Business system, ES operation and staff costs and network upgrades; anticipate spending $1 million more in 2004DelawareDistrict of ColumbiaFlorida 15.8 Appropriated for reemployment services to be provided through Florida's One-Stop systemGeorgia The $49.3 million listed in question 4 was designated for UI and ES; no breakdown was given between the two programsHawaiiIdaho The $7 million listed in question 4 was designated for UI and ES; no breakdown was given between the two programsIllinoisIndiana 33.0 Appropriated over five years; $25 for Indiana@Work targeting industries and $8 to the WIBs for administration of the one-stop officesIowa The $20 million listed in question 4 also was designated for ES; no breakdown was given between the two programsKansasKentuckyLouisiana 5.7 Detail use of appropriated funds was not givenMaine The $9.8 million listed in question 4 will be used for some ES functions; no breakdown was given between the two programsMarylandMassachusetts 11.7 Support ES activities at the One-Stop centers, employment assistance for Department of Transitional, and targeted client populationMichigan 217.0 Appropriated thru FY2005; $7 for ES agency; $182 for Welfare to Work activities, $24 to local area WIA One-Stop Oper.; $4M librariesMinnesotaMississippi The $19.3 million listed in question 4 will be used only to the extend ES staff will use accommodations at the new state buildingMissouriMontana 7.7 Administration of ES program and upgrading computer program; appropriated through June 2005NebraskaNevada The $15 million listed in question 4 will include a one-stop centerNew HampshireNew Jersey 6.0 Upgrading information technology infrastructure and development of one-stop offices throughout the stateNew Mexico 5.7 ES Administration, facility and equip upgrades, AS&T costs, and for High School Career CentersNew YorkNorth CarolinaNorth DakotaOhio 25.7 One-Stop assistance, LMI use, staff training, local office transition, and supplement federal shortfalls; appropriated thru 2005Oklahoma 2.3 Supplemented ES program budget and shared one-stop cost shortfalls through June 2004Oregon 20.5 Administration of the employment services and will be used to replace state funds redirected to other state programsPennsylvania 7.0 $15 million was appropriated for UI and ES uses; ES appropriation were for ES operating and personnel costsPuerto Rico 8.8 For administrative needs, staff training, computer equipment upgrades, establishing a one-stop, and capital & facility needsRhode Island 4.0 Appropriated for UI and ES administration use; expect to use total appropriation for ES purposes through June 2004South Carolina The $9.7 million listed in question 4 is for acquisition of land and construction of 5 local office facilities over the next 3 to 5 yearsSouth DakotaTennessee 1.6 For facility and equip upgrades, local office furniture, staff training, ADA accommodations, and staff equity pay raisesTexasUtah 6.5 Appropriated over a 3 year period to support labor exchange activities in the state regionsVermontVirgin IslandsVirginia 6.2 Appropriated for the 02-04 biennium for federal funding offsets, placement activities in Economic Relief centers; $7.5 million for 04-06 bienniumWashingtonWest Virginia 2.4 Appropriated thru 2004; improved automation systems and computer equipment upgrades; believe upgrades improved services to public Wisconsin 1.0 Appropriated $1 million per year for the apprenticeship program Wyoming 1.9 Used to upgrade Wyoming Job Network (WJN), upgrade autodialer computer systems, and ES administration if any funds remainTotal 437.6$
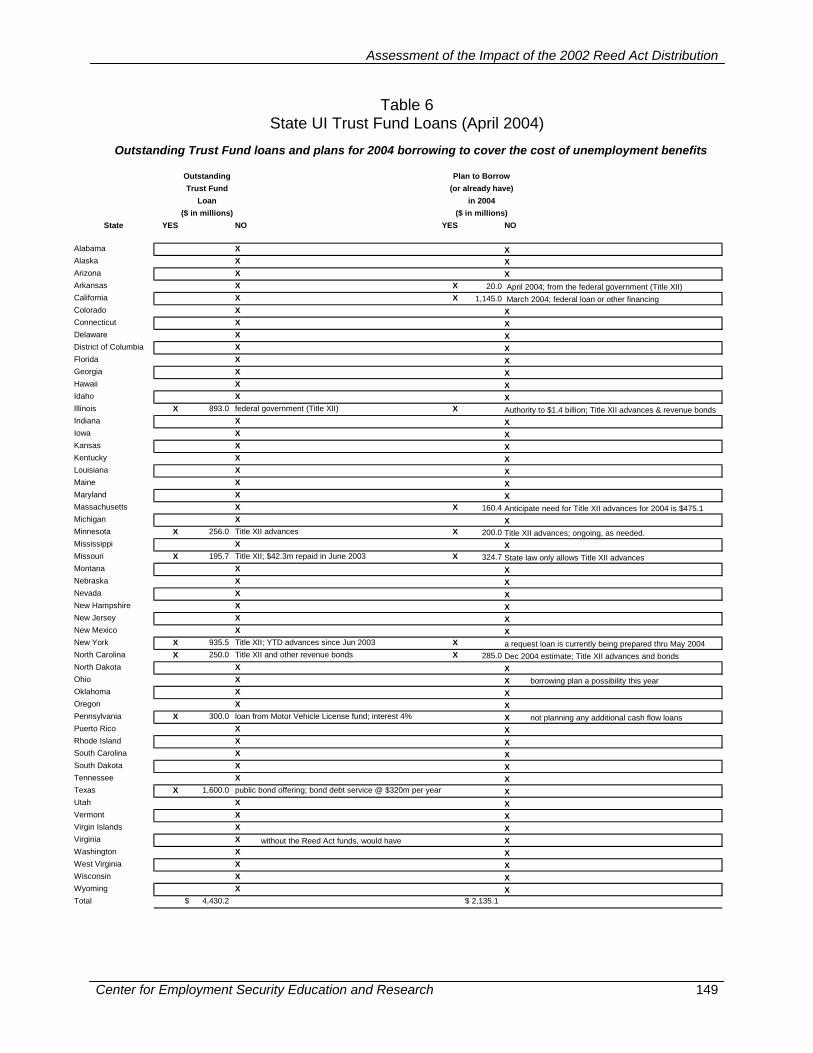
Assessment of the Impact of the 2002 Reed Act Distribution
Center for Employment Security Education and Research 149
Table 6 State UI Trust Fund Loans (April 2004)
Outstanding Trust Fund loans and plans for 2004 borrowing to cover the cost of unemployment benefits
Outstanding Plan to BorrowTrust Fund (or already have)
Loan in 2004($ in millions) ($ in millions)
State YES NO YES NO
Alabama X XAlaska X XArizona X XArkansas X X 20.0 April 2004; from the federal government (Title XII)California X X 1,145.0 March 2004; federal loan or other financingColorado X XConnecticut X XDelaware X XDistrict of Columbia X XFlorida X XGeorgia X XHawaii X XIdaho X XIllinois X 893.0 federal government (Title XII) X Authority to $1.4 billion; Title XII advances & revenue bondsIndiana X XIowa X XKansas X XKentucky X XLouisiana X XMaine X XMaryland X XMassachusetts X X 160.4 Anticipate need for Title XII advances for 2004 is $475.1Michigan X XMinnesota X 256.0 Title XII advances X 200.0 Title XII advances; ongoing, as needed.Mississippi X XMissouri X 195.7 Title XII; $42.3m repaid in June 2003 X 324.7 State law only allows Title XII advancesMontana X XNebraska X XNevada X XNew Hampshire X XNew Jersey X XNew Mexico X XNew York X 935.5 Title XII; YTD advances since Jun 2003 X a request loan is currently being prepared thru May 2004North Carolina X 250.0 Title XII and other revenue bonds X 285.0 Dec 2004 estimate; Title XII advances and bondsNorth Dakota X XOhio X X borrowing plan a possibility this yearOklahoma X XOregon X XPennsylvania X 300.0 loan from Motor Vehicle License fund; interest 4% X not planning any additional cash flow loansPuerto Rico X XRhode Island X XSouth Carolina X XSouth Dakota X XTennessee X XTexas X 1,600.0 public bond offering; bond debt service @ $320m per year XUtah X XVermont X XVirgin Islands X XVirginia X without the Reed Act funds, would have XWashington X XWest Virginia X XWisconsin X XWyoming X XTotal 4,430.2$ 2,135.1$
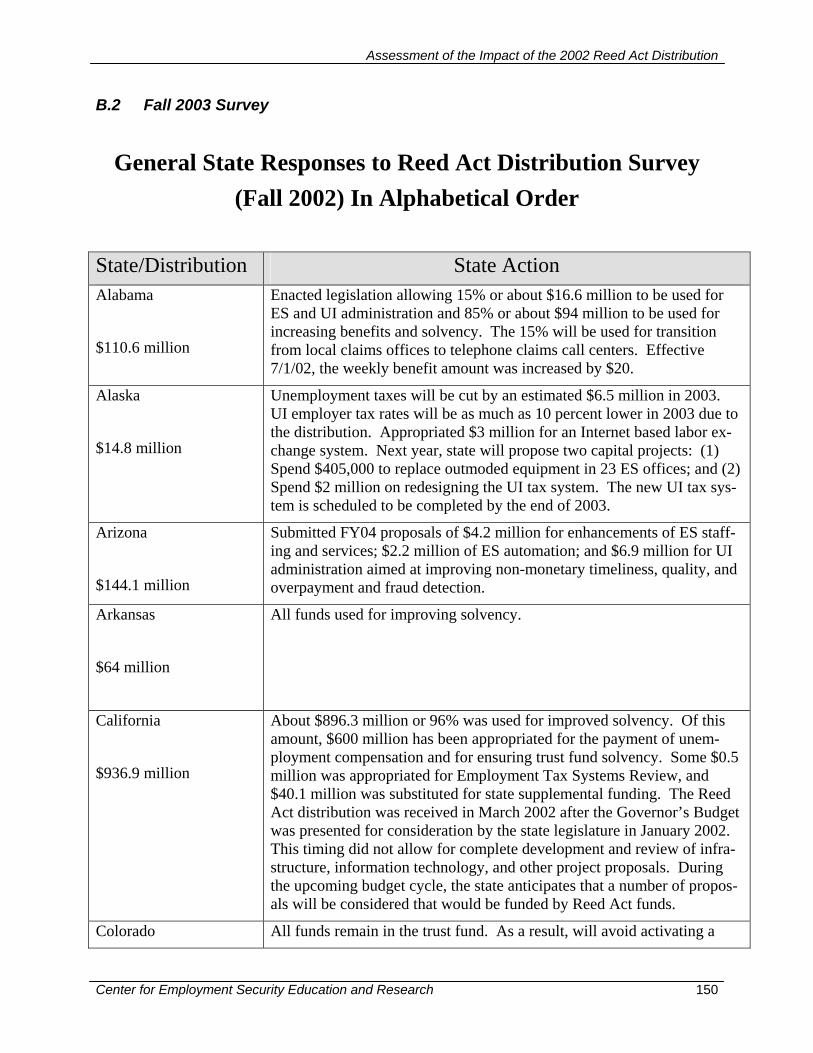
Assessment of the Impact of the 2002 Reed Act Distribution
Center for Employment Security Education and Research 150
B.2 Fall 2003 Survey
General State Responses to Reed Act Distribution Survey (Fall 2002) In Alphabetical Order
State/Distribution State Action Alabama
$110.6 million
Enacted legislation allowing 15% or about $16.6 million to be used for ES and UI administration and 85% or about $94 million to be used for increasing benefits and solvency. The 15% will be used for transition from local claims offices to telephone claims call centers. Effective 7/1/02, the weekly benefit amount was increased by $20.
Alaska
$14.8 million
Unemployment taxes will be cut by an estimated $6.5 million in 2003. UI employer tax rates will be as much as 10 percent lower in 2003 due to the distribution. Appropriated $3 million for an Internet based labor ex-change system. Next year, state will propose two capital projects: (1) Spend $405,000 to replace outmoded equipment in 23 ES offices; and (2) Spend $2 million on redesigning the UI tax system. The new UI tax sys-tem is scheduled to be completed by the end of 2003.
Arizona
$144.1 million
Submitted FY04 proposals of $4.2 million for enhancements of ES staff-ing and services; $2.2 million of ES automation; and $6.9 million for UI administration aimed at improving non-monetary timeliness, quality, and overpayment and fraud detection.
Arkansas
$64 million
All funds used for improving solvency.
California
$936.9 million
About $896.3 million or 96% was used for improved solvency. Of this amount, $600 million has been appropriated for the payment of unem-ployment compensation and for ensuring trust fund solvency. Some $0.5 million was appropriated for Employment Tax Systems Review, and $40.1 million was substituted for state supplemental funding. The Reed Act distribution was received in March 2002 after the Governor’s Budget was presented for consideration by the state legislature in January 2002. This timing did not allow for complete development and review of infra-structure, information technology, and other project proposals. During the upcoming budget cycle, the state anticipates that a number of propos-als will be considered that would be funded by Reed Act funds.
Colorado All funds remain in the trust fund. As a result, will avoid activating a
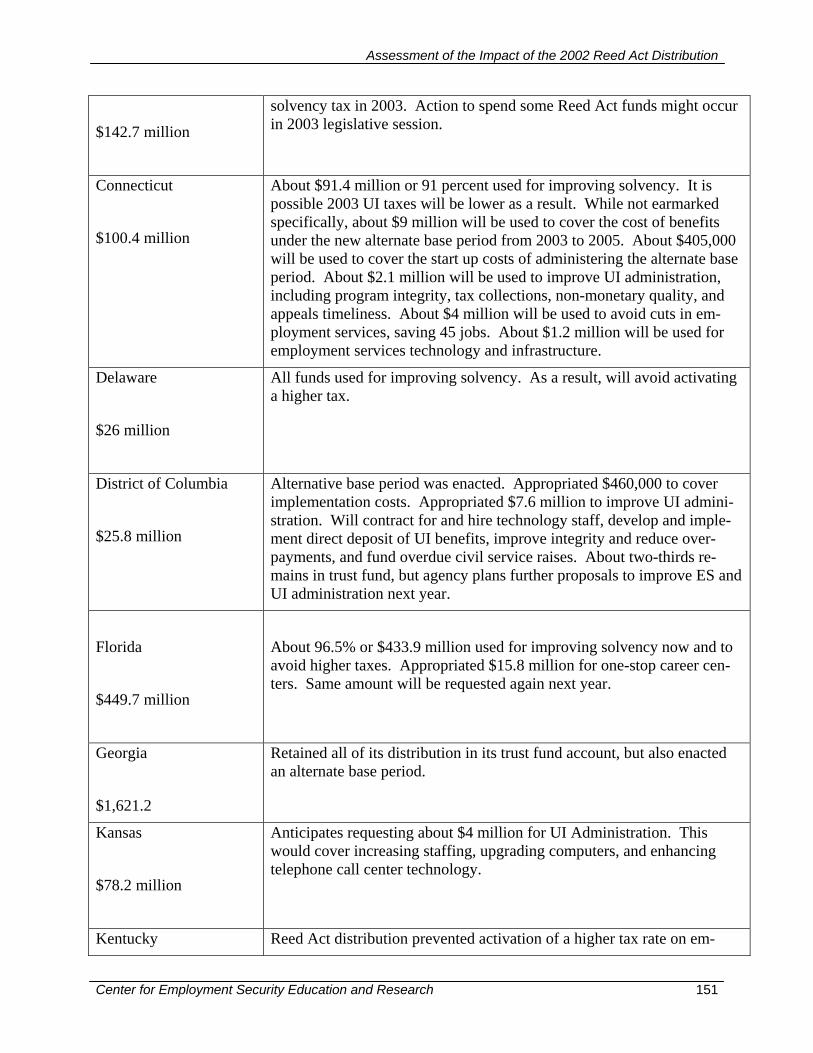
Assessment of the Impact of the 2002 Reed Act Distribution
Center for Employment Security Education and Research 151
$142.7 million
solvency tax in 2003. Action to spend some Reed Act funds might occur in 2003 legislative session.
Connecticut
$100.4 million
About $91.4 million or 91 percent used for improving solvency. It is possible 2003 UI taxes will be lower as a result. While not earmarked specifically, about $9 million will be used to cover the cost of benefits under the new alternate base period from 2003 to 2005. About $405,000 will be used to cover the start up costs of administering the alternate base period. About $2.1 million will be used to improve UI administration, including program integrity, tax collections, non-monetary quality, and appeals timeliness. About $4 million will be used to avoid cuts in em-ployment services, saving 45 jobs. About $1.2 million will be used for employment services technology and infrastructure.
Delaware
$26 million
All funds used for improving solvency. As a result, will avoid activating a higher tax.
District of Columbia
$25.8 million
Alternative base period was enacted. Appropriated $460,000 to cover implementation costs. Appropriated $7.6 million to improve UI admini-stration. Will contract for and hire technology staff, develop and imple-ment direct deposit of UI benefits, improve integrity and reduce over-payments, and fund overdue civil service raises. About two-thirds re-mains in trust fund, but agency plans further proposals to improve ES and UI administration next year.
Florida
$449.7 million
About 96.5% or $433.9 million used for improving solvency now and to avoid higher taxes. Appropriated $15.8 million for one-stop career cen-ters. Same amount will be requested again next year.
Georgia
$1,621.2
Retained all of its distribution in its trust fund account, but also enacted an alternate base period.
Kansas
$78.2 million
Anticipates requesting about $4 million for UI Administration. This would cover increasing staffing, upgrading computers, and enhancing telephone call center technology.
Kentucky Reed Act distribution prevented activation of a higher tax rate on em-
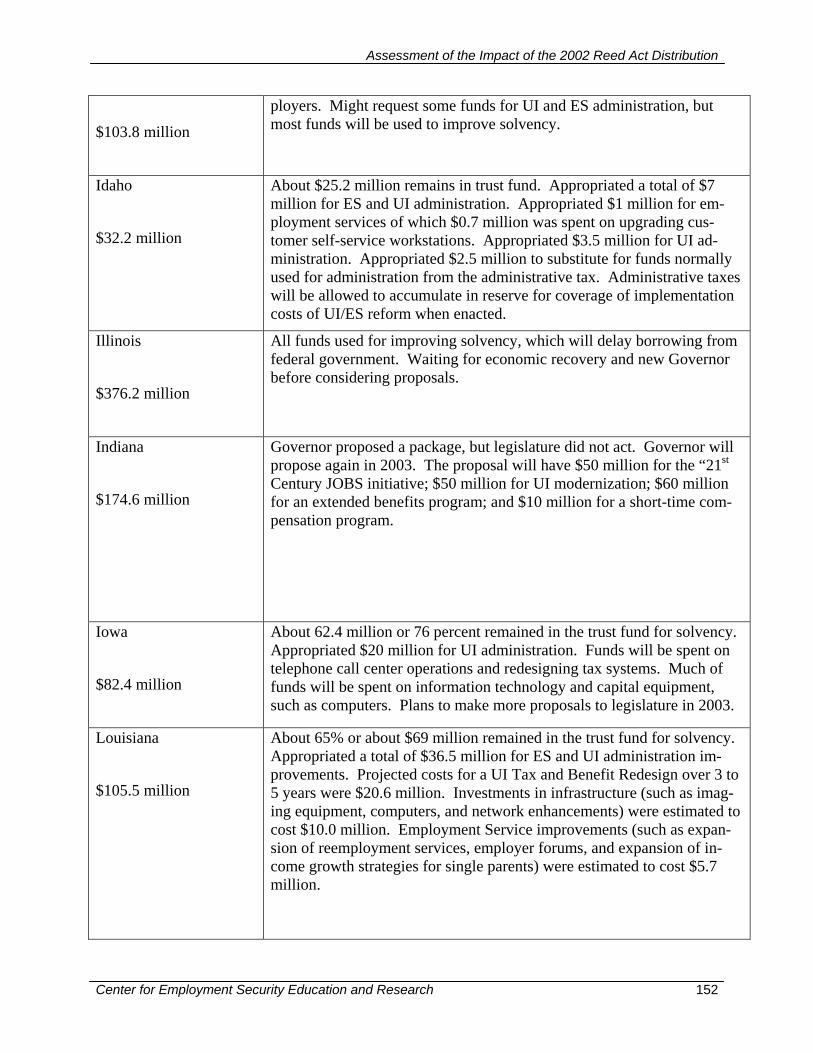
Assessment of the Impact of the 2002 Reed Act Distribution
Center for Employment Security Education and Research 152
$103.8 million
ployers. Might request some funds for UI and ES administration, but most funds will be used to improve solvency.
Idaho
$32.2 million
About $25.2 million remains in trust fund. Appropriated a total of $7 million for ES and UI administration. Appropriated $1 million for em-ployment services of which $0.7 million was spent on upgrading cus-tomer self-service workstations. Appropriated $3.5 million for UI ad-ministration. Appropriated $2.5 million to substitute for funds normally used for administration from the administrative tax. Administrative taxes will be allowed to accumulate in reserve for coverage of implementation costs of UI/ES reform when enacted.
Illinois
$376.2 million
All funds used for improving solvency, which will delay borrowing from federal government. Waiting for economic recovery and new Governor before considering proposals.
Indiana
$174.6 million
Governor proposed a package, but legislature did not act. Governor will propose again in 2003. The proposal will have $50 million for the “21st Century JOBS initiative; $50 million for UI modernization; $60 million for an extended benefits program; and $10 million for a short-time com-pensation program.
Iowa
$82.4 million
About 62.4 million or 76 percent remained in the trust fund for solvency. Appropriated $20 million for UI administration. Funds will be spent on telephone call center operations and redesigning tax systems. Much of funds will be spent on information technology and capital equipment, such as computers. Plans to make more proposals to legislature in 2003.
Louisiana
$105.5 million
About 65% or about $69 million remained in the trust fund for solvency. Appropriated a total of $36.5 million for ES and UI administration im-provements. Projected costs for a UI Tax and Benefit Redesign over 3 to 5 years were $20.6 million. Investments in infrastructure (such as imag-ing equipment, computers, and network enhancements) were estimated to cost $10.0 million. Employment Service improvements (such as expan-sion of reemployment services, employer forums, and expansion of in-come growth strategies for single parents) were estimated to cost $5.7 million.
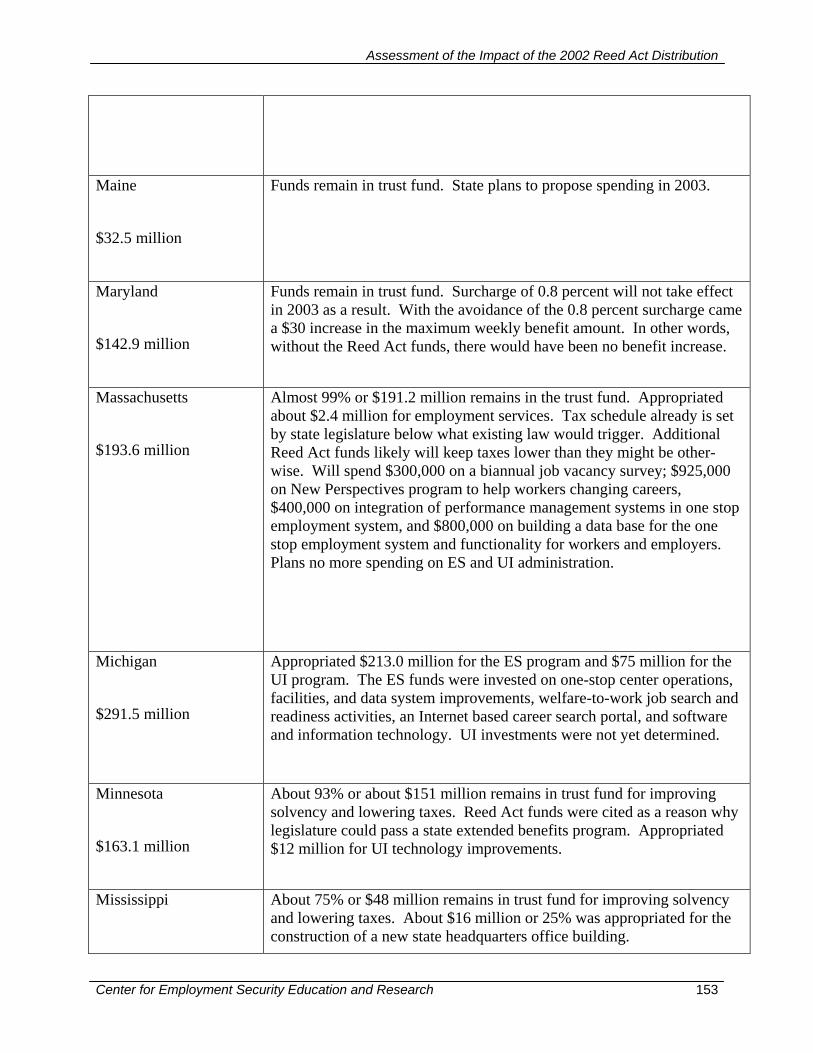
Assessment of the Impact of the 2002 Reed Act Distribution
Center for Employment Security Education and Research 153
Maine
$32.5 million
Funds remain in trust fund. State plans to propose spending in 2003.
Maryland
$142.9 million
Funds remain in trust fund. Surcharge of 0.8 percent will not take effect in 2003 as a result. With the avoidance of the 0.8 percent surcharge came a $30 increase in the maximum weekly benefit amount. In other words, without the Reed Act funds, there would have been no benefit increase.
Massachusetts
$193.6 million
Almost 99% or $191.2 million remains in the trust fund. Appropriated about $2.4 million for employment services. Tax schedule already is set by state legislature below what existing law would trigger. Additional Reed Act funds likely will keep taxes lower than they might be other-wise. Will spend $300,000 on a biannual job vacancy survey; $925,000 on New Perspectives program to help workers changing careers, $400,000 on integration of performance management systems in one stop employment system, and $800,000 on building a data base for the one stop employment system and functionality for workers and employers. Plans no more spending on ES and UI administration.
Michigan
$291.5 million
Appropriated $213.0 million for the ES program and $75 million for the UI program. The ES funds were invested on one-stop center operations, facilities, and data system improvements, welfare-to-work job search and readiness activities, an Internet based career search portal, and software and information technology. UI investments were not yet determined.
Minnesota
$163.1 million
About 93% or about $151 million remains in trust fund for improving solvency and lowering taxes. Reed Act funds were cited as a reason why legislature could pass a state extended benefits program. Appropriated $12 million for UI technology improvements.
Mississippi
About 75% or $48 million remains in trust fund for improving solvency and lowering taxes. About $16 million or 25% was appropriated for the construction of a new state headquarters office building.

Assessment of the Impact of the 2002 Reed Act Distribution
Center for Employment Security Education and Research 154
$64.7 million
Missouri
$161.4 million
All funds used for improving solvency.
Montana
$18.6 million
Funds improved solvency and delayed a tax increase. Plans on retiring $5.9 million UI debt incurred to modernize its UI program and spending on Employment Services and UI administration over the next 5 or 6 years. Appropriated $4.1 million to substitute for funds that would have come from an Administrative Fund Tax (AFT). The AFT funds were re-allocated to various training programs. Appropriated $12.6 million for UI administrative improvements. Appropriated about $280,000 to pay off part of a bond issuance used to finance UI modernization.
Nebraska
$48.4 million
Funds remain in trust fund. Will propose some ES and UI improvements in 2003.
Nevada
$68.1 million
Funds remain in trust fund to improve solvency and avoid a tax increase. Legislature meets only once every two years and did not meet in 2002. Might make a proposal to spend some funds on a building in 2003.
New Hampshire
$38.5 million
Funds left in trust fund to improve solvency. Funds helped avoid a 1.5 percentage point increase in employer tax rate and enabled the legislature to pass a significant increase in weekly benefits.
New Jersey
$242.8 million
About 85% or about $207 million remains in the trust fund. The UI tax rate dropped as a result of reintroduction of the Health Care tax on em-ployers and equivalent cut in UI taxes. The cut in UI taxes was discre-tionary. Appropriated about $36 million for ES and UI administration.
New Mexico
$38.6 million
All funds remain in trust fund. Plans to submit proposal to state legisla-ture. Draft proposal would spend around $21 million and leave about 45% or about $17 million of Reed Act funds in trust fund. Spending would be on such items as computer equipment, an imaging system, tele-communications systems to reduce long-distance phone call costs, a ficti-tious employer detection system, and capital improvements.
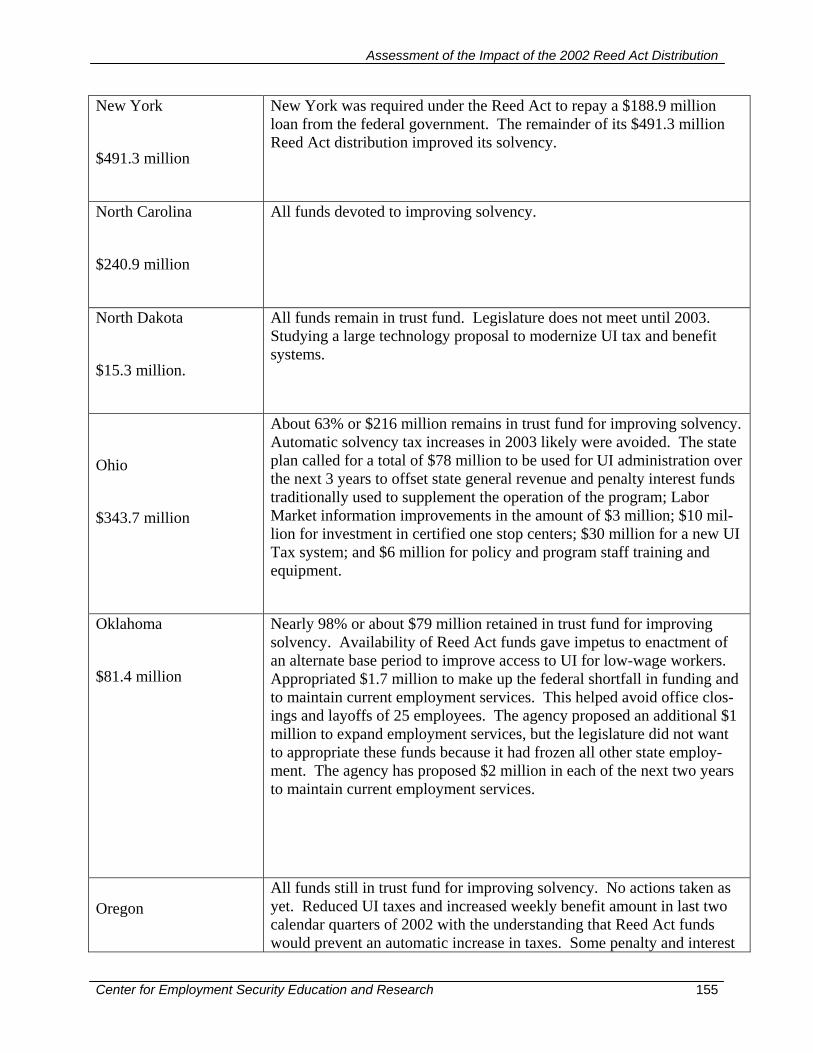
Assessment of the Impact of the 2002 Reed Act Distribution
Center for Employment Security Education and Research 155
New York
$491.3 million
New York was required under the Reed Act to repay a $188.9 million loan from the federal government. The remainder of its $491.3 million Reed Act distribution improved its solvency.
North Carolina
$240.9 million
All funds devoted to improving solvency.
North Dakota
$15.3 million.
All funds remain in trust fund. Legislature does not meet until 2003. Studying a large technology proposal to modernize UI tax and benefit systems.
Ohio
$343.7 million
About 63% or $216 million remains in trust fund for improving solvency. Automatic solvency tax increases in 2003 likely were avoided. The state plan called for a total of $78 million to be used for UI administration over the next 3 years to offset state general revenue and penalty interest funds traditionally used to supplement the operation of the program; Labor Market information improvements in the amount of $3 million; $10 mil-lion for investment in certified one stop centers; $30 million for a new UI Tax system; and $6 million for policy and program staff training and equipment.
Oklahoma
$81.4 million
Nearly 98% or about $79 million retained in trust fund for improving solvency. Availability of Reed Act funds gave impetus to enactment of an alternate base period to improve access to UI for low-wage workers. Appropriated $1.7 million to make up the federal shortfall in funding and to maintain current employment services. This helped avoid office clos-ings and layoffs of 25 employees. The agency proposed an additional $1 million to expand employment services, but the legislature did not want to appropriate these funds because it had frozen all other state employ-ment. The agency has proposed $2 million in each of the next two years to maintain current employment services.
Oregon
All funds still in trust fund for improving solvency. No actions taken as yet. Reduced UI taxes and increased weekly benefit amount in last two calendar quarters of 2002 with the understanding that Reed Act funds would prevent an automatic increase in taxes. Some penalty and interest
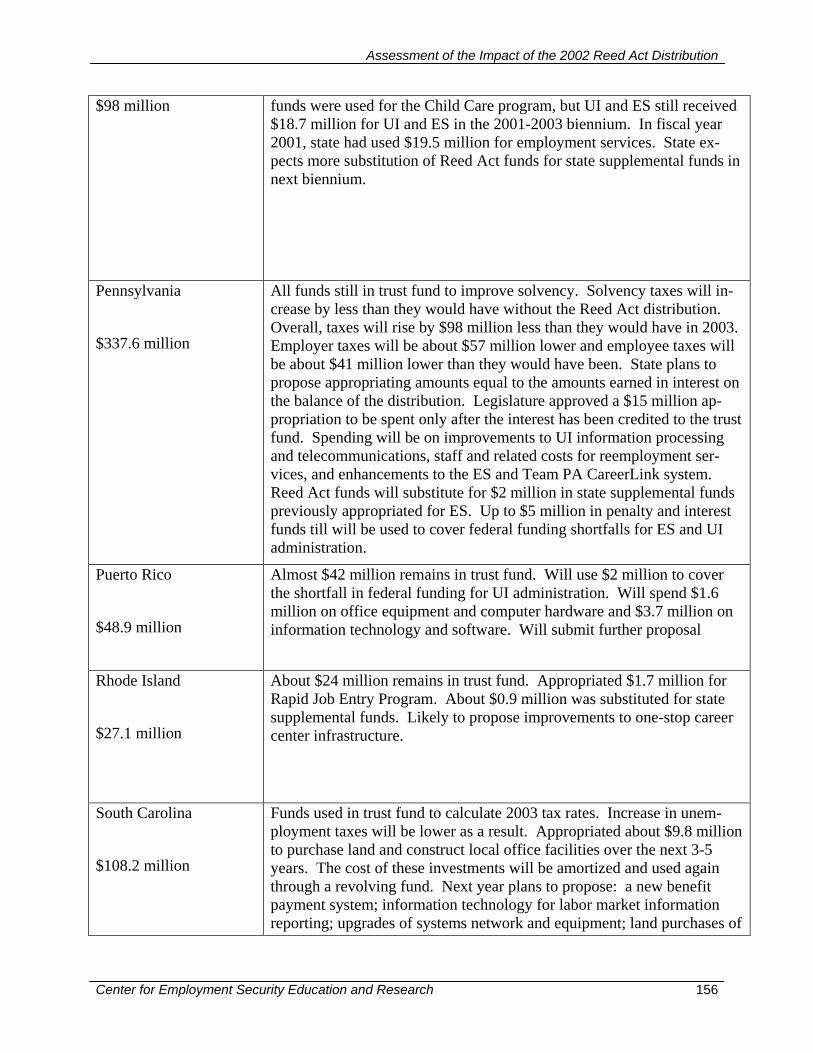
Assessment of the Impact of the 2002 Reed Act Distribution
Center for Employment Security Education and Research 156
$98 million
funds were used for the Child Care program, but UI and ES still received $18.7 million for UI and ES in the 2001-2003 biennium. In fiscal year 2001, state had used $19.5 million for employment services. State ex-pects more substitution of Reed Act funds for state supplemental funds in next biennium.
Pennsylvania
$337.6 million
All funds still in trust fund to improve solvency. Solvency taxes will in-crease by less than they would have without the Reed Act distribution. Overall, taxes will rise by $98 million less than they would have in 2003. Employer taxes will be about $57 million lower and employee taxes will be about $41 million lower than they would have been. State plans to propose appropriating amounts equal to the amounts earned in interest on the balance of the distribution. Legislature approved a $15 million ap-propriation to be spent only after the interest has been credited to the trust fund. Spending will be on improvements to UI information processing and telecommunications, staff and related costs for reemployment ser-vices, and enhancements to the ES and Team PA CareerLink system. Reed Act funds will substitute for $2 million in state supplemental funds previously appropriated for ES. Up to $5 million in penalty and interest funds till will be used to cover federal funding shortfalls for ES and UI administration.
Puerto Rico
$48.9 million
Almost $42 million remains in trust fund. Will use $2 million to cover the shortfall in federal funding for UI administration. Will spend $1.6 million on office equipment and computer hardware and $3.7 million on information technology and software. Will submit further proposal
Rhode Island
$27.1 million
About $24 million remains in trust fund. Appropriated $1.7 million for Rapid Job Entry Program. About $0.9 million was substituted for state supplemental funds. Likely to propose improvements to one-stop career center infrastructure.
South Carolina
$108.2 million
Funds used in trust fund to calculate 2003 tax rates. Increase in unem-ployment taxes will be lower as a result. Appropriated about $9.8 million to purchase land and construct local office facilities over the next 3-5 years. The cost of these investments will be amortized and used again through a revolving fund. Next year plans to propose: a new benefit payment system; information technology for labor market information reporting; upgrades of systems network and equipment; land purchases of
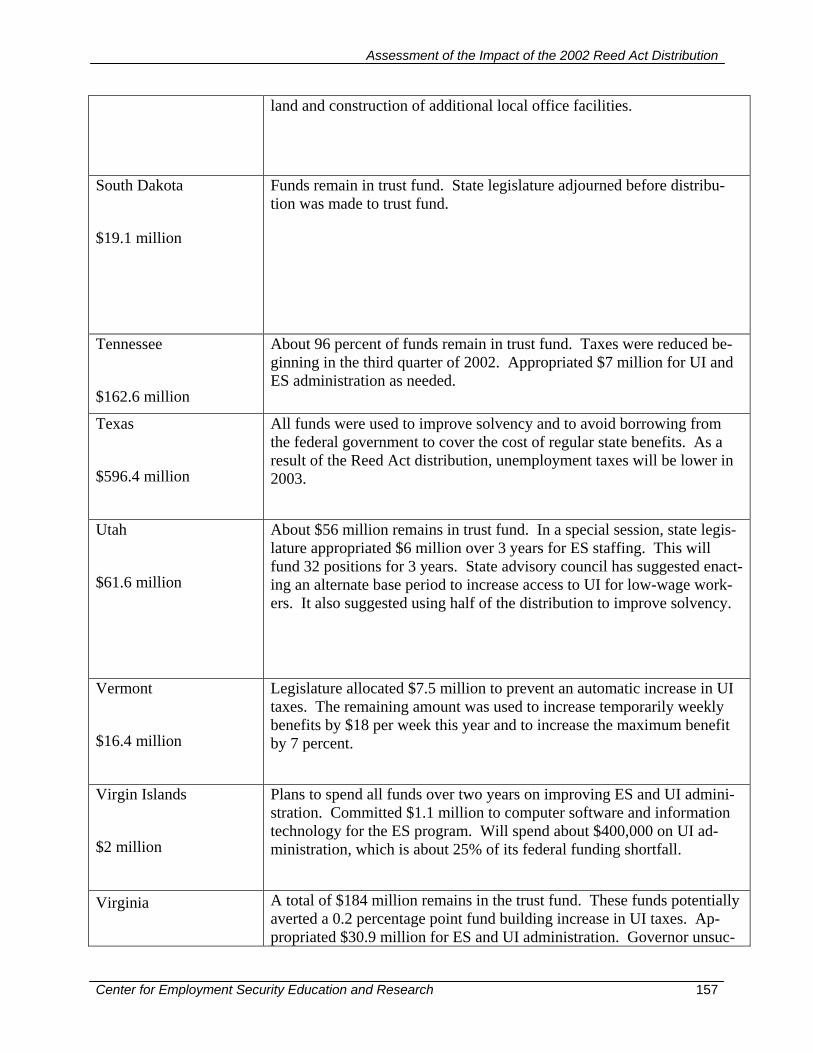
Assessment of the Impact of the 2002 Reed Act Distribution
Center for Employment Security Education and Research 157
land and construction of additional local office facilities.
South Dakota
$19.1 million
Funds remain in trust fund. State legislature adjourned before distribu-tion was made to trust fund.
Tennessee
$162.6 million
About 96 percent of funds remain in trust fund. Taxes were reduced be-ginning in the third quarter of 2002. Appropriated $7 million for UI and ES administration as needed.
Texas
$596.4 million
All funds were used to improve solvency and to avoid borrowing from the federal government to cover the cost of regular state benefits. As a result of the Reed Act distribution, unemployment taxes will be lower in 2003.
Utah
$61.6 million
About $56 million remains in trust fund. In a special session, state legis-lature appropriated $6 million over 3 years for ES staffing. This will fund 32 positions for 3 years. State advisory council has suggested enact-ing an alternate base period to increase access to UI for low-wage work-ers. It also suggested using half of the distribution to improve solvency.
Vermont
$16.4 million
Legislature allocated $7.5 million to prevent an automatic increase in UI taxes. The remaining amount was used to increase temporarily weekly benefits by $18 per week this year and to increase the maximum benefit by 7 percent.
Virgin Islands
$2 million
Plans to spend all funds over two years on improving ES and UI admini-stration. Committed $1.1 million to computer software and information technology for the ES program. Will spend about $400,000 on UI ad-ministration, which is about 25% of its federal funding shortfall.
Virginia
A total of $184 million remains in the trust fund. These funds potentially averted a 0.2 percentage point fund building increase in UI taxes. Ap-propriated $30.9 million for ES and UI administration. Governor unsuc-

Assessment of the Impact of the 2002 Reed Act Distribution
Center for Employment Security Education and Research 158
$214.9 million
cessfully proposed an extension beyond 2002 through July 2003 of the temporary 37.3% increase in benefits that would have cost about $59.9 million. Appropriated $6.2 million for the ES and $24.7 million for UI administration in the 2003/2004 biennium. Used $2 million from pen-alty and interest in 2002 to support ES and UI operations, but it is hoped the Reed Act distribution will substitute for these funds so that these funds can be used to build up a maintenance and capital building fund.
Washington
$167 million
All funds remain in the trust fund. State legislature adjourned the day after the Reed Act distribution was deposited in the trust fund. Submitted four proposals for the 2003-2004 biennial budget. All costs will be amor-tized using portions of federal grants for UI administration. The propos-als are: (1) imaging to speed adjudication of claims costing $1.9 million; (2) software to pass information collected from claimants over the tele-phone or internet to the benefit system costing $2.1 million; (3) a pro-gram to help low-income adults move up to higher-paying and more sta-ble jobs costing $6.5 million; and (5) building of a training/meeting room addition to a state-owned facility.
West Virginia
$36.2 million
About $32.4 million remains in the trust fund. Appropriated about $3.8 million for ES and UI administration in the 2003-2004 biennial budget. About $1.4 million will be used to make up for the federal funding short-fall for the ES program. About $2.4 million was appropriated for UI ad-ministration. Funds will also be spent to implement a toll-free number for filing continued claims, to improve the integrated voice response (IVR) system for continued claims, to develop a new automated system for one-stop career centers.
Wisconsin
$166.2 million
All funds remain in trust fund to improve solvency. Watching economy to determine if all funds will be needed to pay benefits.
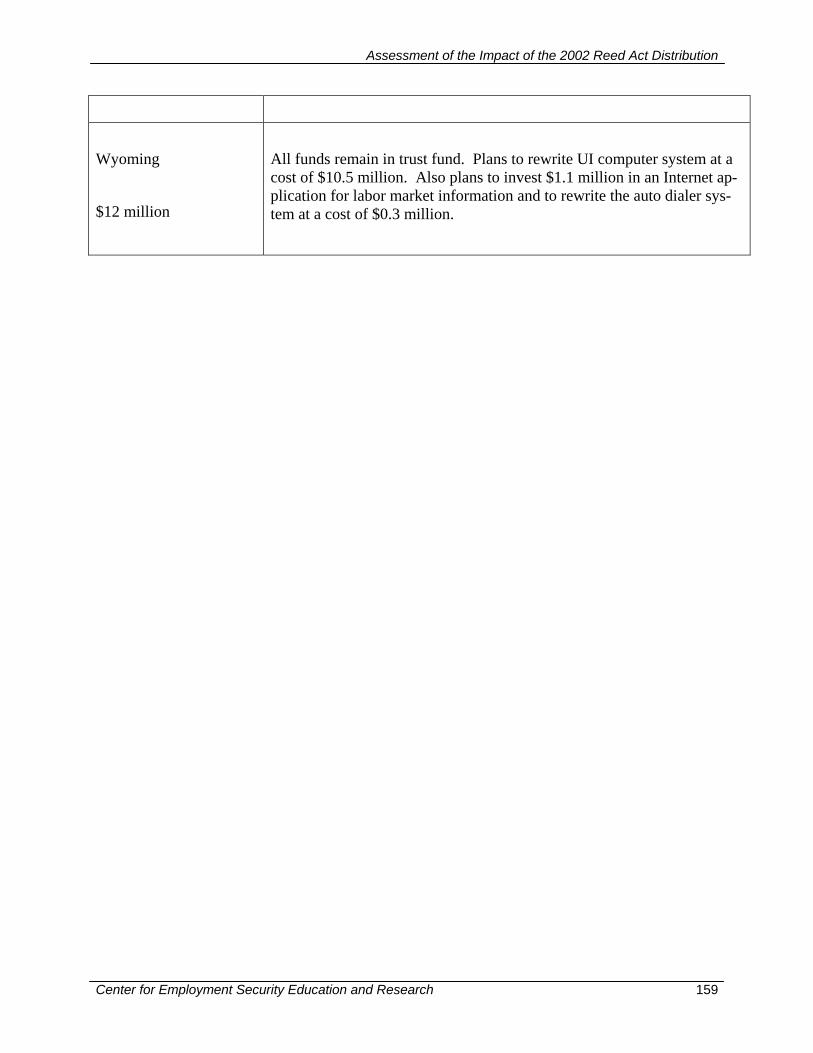
Assessment of the Impact of the 2002 Reed Act Distribution
Center for Employment Security Education and Research 159
Wyoming
$12 million
All funds remain in trust fund. Plans to rewrite UI computer system at a cost of $10.5 million. Also plans to invest $1.1 million in an Internet ap-plication for labor market information and to rewrite the auto dialer sys-tem at a cost of $0.3 million.
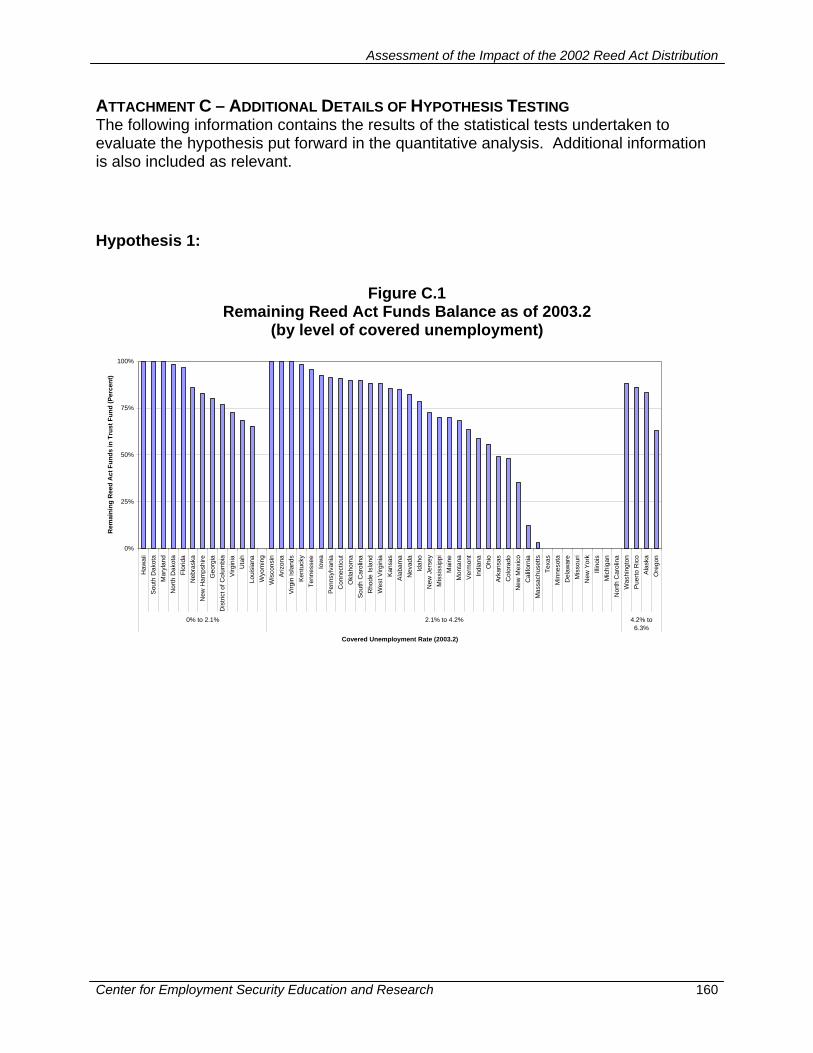
Assessment of the Impact of the 2002 Reed Act Distribution
Center for Employment Security Education and Research 160
ATTACHMENT C – ADDITIONAL DETAILS OF HYPOTHESIS TESTING The following information contains the results of the statistical tests undertaken to evaluate the hypothesis put forward in the quantitative analysis. Additional information is also included as relevant. Hypothesis 1:
Figure C.1 Remaining Reed Act Funds Balance as of 2003.2
(by level of covered unemployment)
0%
25%
50%
75%
100%
Haw
aii
Sout
h D
akot
a M
aryl
and
Nor
th D
akot
a Fl
orid
a N
ebra
ska
New
Ham
pshi
re
Geo
rgia
D
istri
ct o
f Col
umbi
a Vi
rgin
ia
Uta
h Lo
uisi
ana
Wyo
min
g W
isco
nsin
Ar
izon
a Vi
rgin
Isla
nds
Kent
ucky
Te
nnes
see
Iow
a Pe
nnsy
lvan
ia
Con
nect
icut
O
klah
oma
Sout
h C
arol
ina
Rho
de Is
land
W
est V
irgin
ia
Kans
as
Alab
ama
Nev
ada
Idah
o N
ew J
erse
y M
issi
ssip
pi
Mai
ne
Mon
tana
Ve
rmon
t In
dian
a O
hio
Arka
nsas
C
olor
ado
New
Mex
ico
Cal
iforn
ia
Mas
sach
uset
ts
Texa
s M
inne
sota
D
elaw
are
Mis
sour
i N
ew Y
ork
Illin
ois
Mic
higa
n N
orth
Car
olin
a W
ashi
ngto
n Pu
erto
Ric
o Al
aska
O
rego
n
0% to 2.1% 2.1% to 4.2% 4.2% to6.3%
Covered Unemployment Rate (2003.2)
Rem
aini
ng R
eed
Act
Fun
ds in
Tru
st F
und
(Per
cent
)
Assessment of the Impact of the 2002 Reed Act Distribution
Center for Employment Security Education and Research 161
Hypothesis 1 Statistical Tests
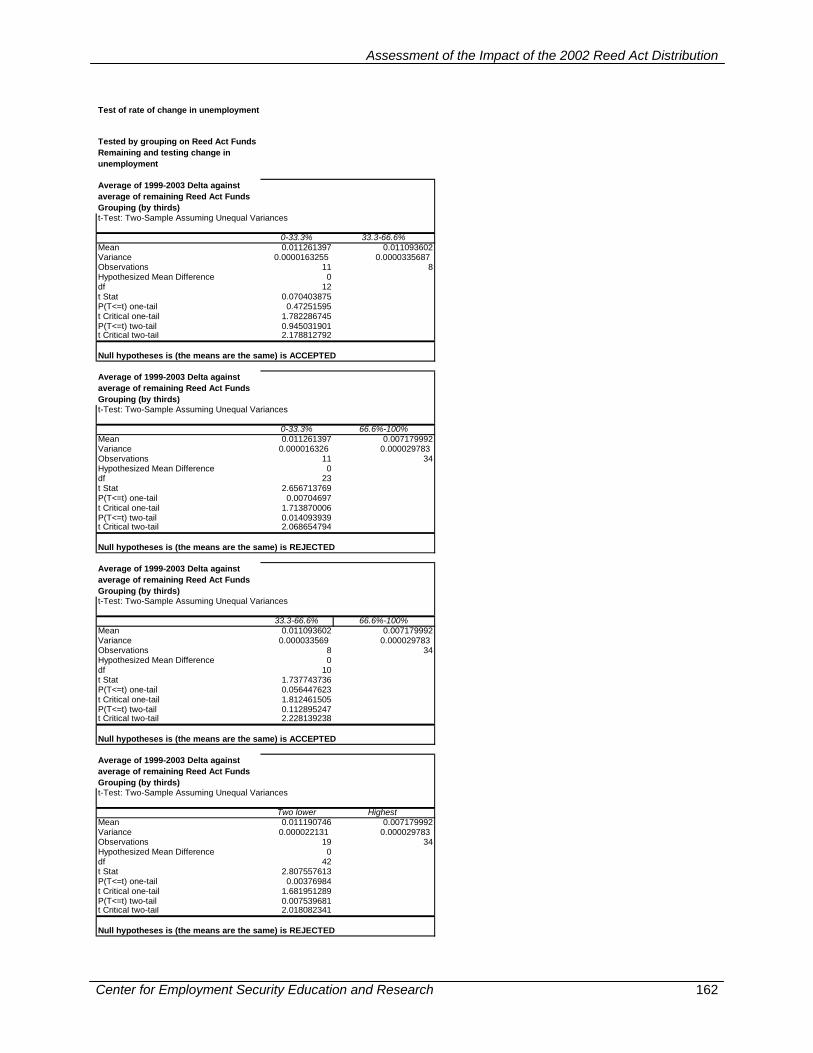
Assessment of the Impact of the 2002 Reed Act Distribution
Center for Employment Security Education and Research 162
Test of rate of change in unemployment
Tested by grouping on Reed Act Funds Remaining and testing change in unemployment
Average of 1999-2003 Delta against average of remaining Reed Act Funds Grouping (by thirds)t-Test: Two-Sample Assuming Unequal Variances
0-33.3% 33.3-66.6%Mean 0.011261397 0.011093602Variance 0.0000163255 0.0000335687 Observations 11 8Hypothesized Mean Difference 0df 12t Stat 0.070403875P(T<=t) one-tail 0.47251595t Critical one-tail 1.782286745P(T<=t) two-tail 0.945031901t Critical two-tail 2.178812792
Null hypotheses is (the means are the same) is ACCEPTED
Average of 1999-2003 Delta against average of remaining Reed Act Funds Grouping (by thirds)t-Test: Two-Sample Assuming Unequal Variances
0-33.3% 66.6%-100%Mean 0.011261397 0.007179992Variance 0.000016326 0.000029783 Observations 11 34Hypothesized Mean Difference 0df 23t Stat 2.656713769P(T<=t) one-tail 0.00704697t Critical one-tail 1.713870006P(T<=t) two-tail 0.014093939t Critical two-tail 2.068654794
Null hypotheses is (the means are the same) is REJECTED
Average of 1999-2003 Delta against average of remaining Reed Act Funds Grouping (by thirds)t-Test: Two-Sample Assuming Unequal Variances
33.3-66.6% 66.6%-100%Mean 0.011093602 0.007179992Variance 0.000033569 0.000029783 Observations 8 34Hypothesized Mean Difference 0df 10t Stat 1.737743736P(T<=t) one-tail 0.056447623t Critical one-tail 1.812461505P(T<=t) two-tail 0.112895247t Critical two-tail 2.228139238
Null hypotheses is (the means are the same) is ACCEPTED
Average of 1999-2003 Delta against average of remaining Reed Act Funds Grouping (by thirds)t-Test: Two-Sample Assuming Unequal Variances
Two lower Highest Mean 0.011190746 0.007179992Variance 0.000022131 0.000029783 Observations 19 34Hypothesized Mean Difference 0df 42t Stat 2.807557613P(T<=t) one-tail 0.00376984t Critical one-tail 1.681951289P(T<=t) two-tail 0.007539681t Critical two-tail 2.018082341
Null hypotheses is (the means are the same) is REJECTED
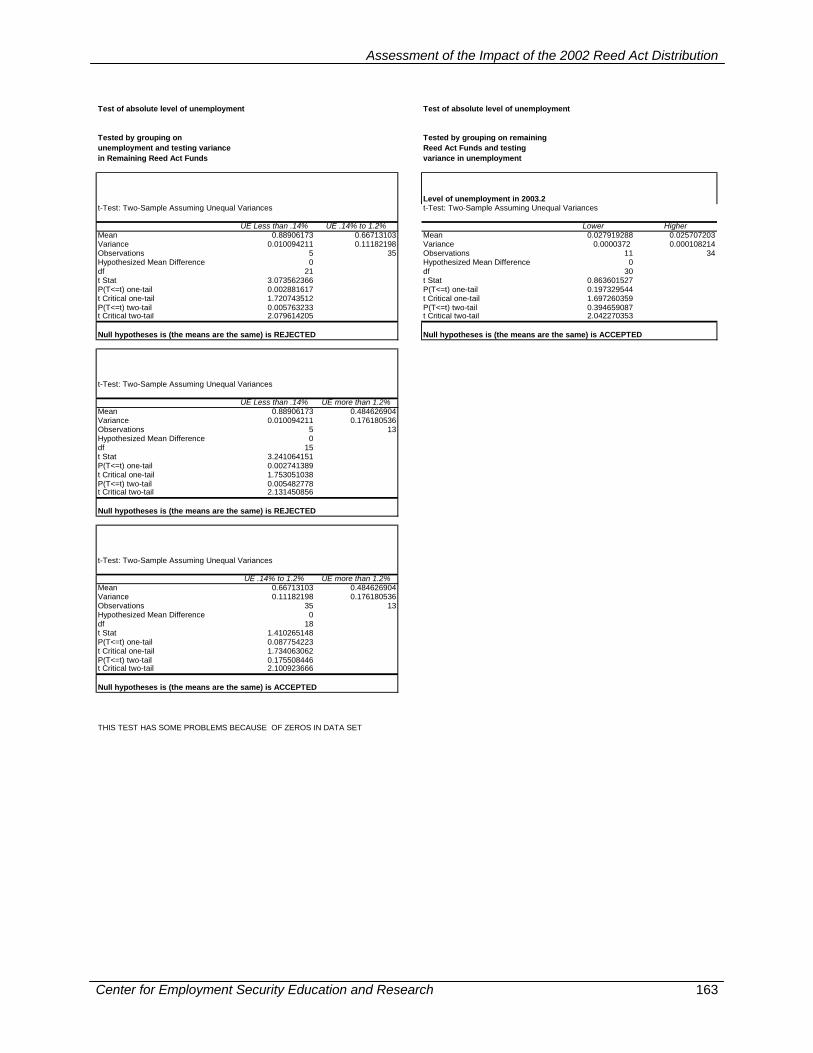
Assessment of the Impact of the 2002 Reed Act Distribution
Center for Employment Security Education and Research 163
Test of absolute level of unemployment Test of absolute level of unemployment
Tested by grouping on unemployment and testing variance in Remaining Reed Act Funds
Tested by grouping on remaining Reed Act Funds and testing variance in unemployment
Level of unemployment in 2003.2t-Test: Two-Sample Assuming Unequal Variances t-Test: Two-Sample Assuming Unequal Variances
UE Less than .14% UE .14% to 1.2% Lower HigherMean 0.88906173 0.66713103 Mean 0.027919288 0.025707203Variance 0.010094211 0.11182198 Variance 0.0000372 0.000108214Observations 5 35 Observations 11 34Hypothesized Mean Difference 0 Hypothesized Mean Difference 0df 21 df 30t Stat 3.073562366 t Stat 0.863601527P(T<=t) one-tail 0.002881617 P(T<=t) one-tail 0.197329544t Critical one-tail 1.720743512 t Critical one-tail 1.697260359P(T<=t) two-tail 0.005763233 P(T<=t) two-tail 0.394659087t Critical two-tail 2.079614205 t Critical two-tail 2.042270353
Null hypotheses is (the means are the same) is REJECTED Null hypotheses is (the means are the same) is ACCEPTED
t-Test: Two-Sample Assuming Unequal Variances
UE Less than .14% UE more than 1.2%Mean 0.88906173 0.484626904Variance 0.010094211 0.176180536Observations 5 13Hypothesized Mean Difference 0df 15t Stat 3.241064151P(T<=t) one-tail 0.002741389t Critical one-tail 1.753051038P(T<=t) two-tail 0.005482778t Critical two-tail 2.131450856
Null hypotheses is (the means are the same) is REJECTED
t-Test: Two-Sample Assuming Unequal Variances
UE .14% to 1.2% UE more than 1.2%Mean 0.66713103 0.484626904Variance 0.11182198 0.176180536Observations 35 13Hypothesized Mean Difference 0df 18t Stat 1.410265148P(T<=t) one-tail 0.087754223t Critical one-tail 1.734063062P(T<=t) two-tail 0.175508446t Critical two-tail 2.100923666
Null hypotheses is (the means are the same) is ACCEPTED
THIS TEST HAS SOME PROBLEMS BECAUSE OF ZEROS IN DATA SET
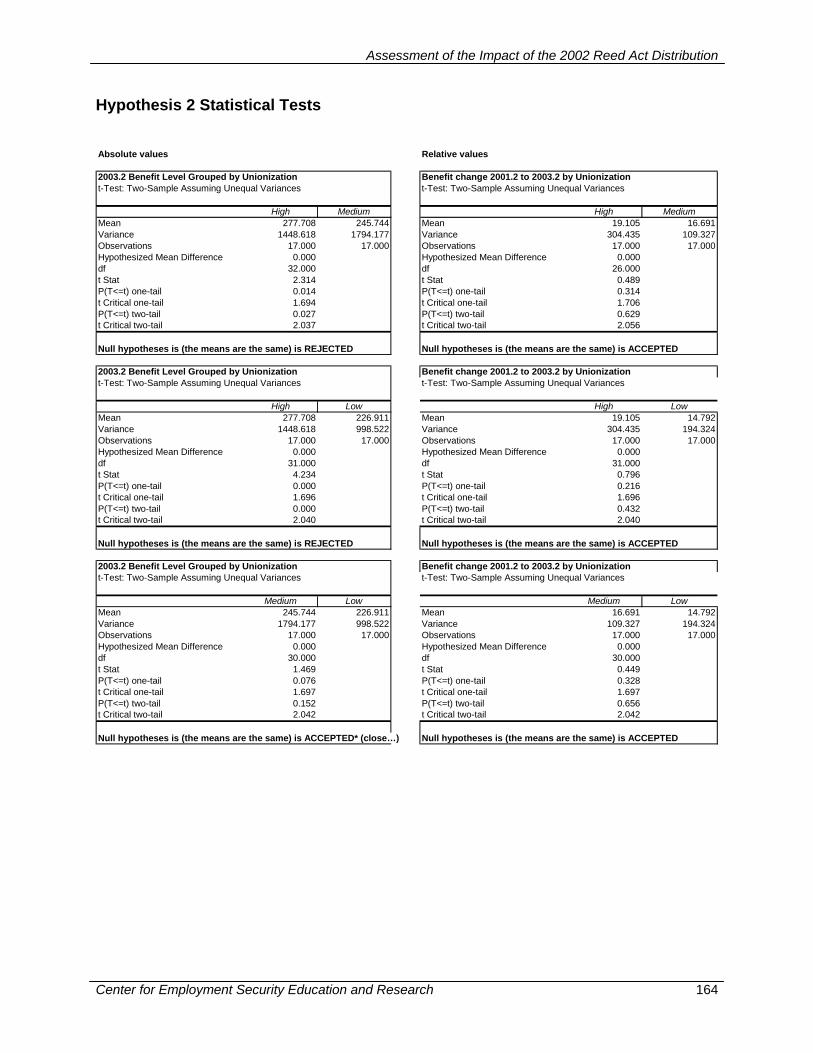
Assessment of the Impact of the 2002 Reed Act Distribution
Center for Employment Security Education and Research 164
Hypothesis 2 Statistical Tests Absolute values Relative values
2003.2 Benefit Level Grouped by Unionization Benefit change 2001.2 to 2003.2 by Unionizationt-Test: Two-Sample Assuming Unequal Variances t-Test: Two-Sample Assuming Unequal Variances
High Medium High MediumMean 277.708 245.744 Mean 19.105 16.691Variance 1448.618 1794.177 Variance 304.435 109.327Observations 17.000 17.000 Observations 17.000 17.000Hypothesized Mean Difference 0.000 Hypothesized Mean Difference 0.000df 32.000 df 26.000t Stat 2.314 t Stat 0.489P(T<=t) one-tail 0.014 P(T<=t) one-tail 0.314t Critical one-tail 1.694 t Critical one-tail 1.706P(T<=t) two-tail 0.027 P(T<=t) two-tail 0.629t Critical two-tail 2.037 t Critical two-tail 2.056
Null hypotheses is (the means are the same) is REJECTED Null hypotheses is (the means are the same) is ACCEPTED
2003.2 Benefit Level Grouped by Unionization Benefit change 2001.2 to 2003.2 by Unionizationt-Test: Two-Sample Assuming Unequal Variances t-Test: Two-Sample Assuming Unequal Variances
High Low High LowMean 277.708 226.911 Mean 19.105 14.792Variance 1448.618 998.522 Variance 304.435 194.324Observations 17.000 17.000 Observations 17.000 17.000Hypothesized Mean Difference 0.000 Hypothesized Mean Difference 0.000df 31.000 df 31.000t Stat 4.234 t Stat 0.796P(T<=t) one-tail 0.000 P(T<=t) one-tail 0.216t Critical one-tail 1.696 t Critical one-tail 1.696P(T<=t) two-tail 0.000 P(T<=t) two-tail 0.432t Critical two-tail 2.040 t Critical two-tail 2.040
Null hypotheses is (the means are the same) is REJECTED Null hypotheses is (the means are the same) is ACCEPTED
2003.2 Benefit Level Grouped by Unionization Benefit change 2001.2 to 2003.2 by Unionizationt-Test: Two-Sample Assuming Unequal Variances t-Test: Two-Sample Assuming Unequal Variances
Medium Low Medium LowMean 245.744 226.911 Mean 16.691 14.792Variance 1794.177 998.522 Variance 109.327 194.324Observations 17.000 17.000 Observations 17.000 17.000Hypothesized Mean Difference 0.000 Hypothesized Mean Difference 0.000df 30.000 df 30.000t Stat 1.469 t Stat 0.449P(T<=t) one-tail 0.076 P(T<=t) one-tail 0.328t Critical one-tail 1.697 t Critical one-tail 1.697P(T<=t) two-tail 0.152 P(T<=t) two-tail 0.656t Critical two-tail 2.042 t Critical two-tail 2.042
Null hypotheses is (the means are the same) is ACCEPTED* (close…) Null hypotheses is (the means are the same) is ACCEPTED
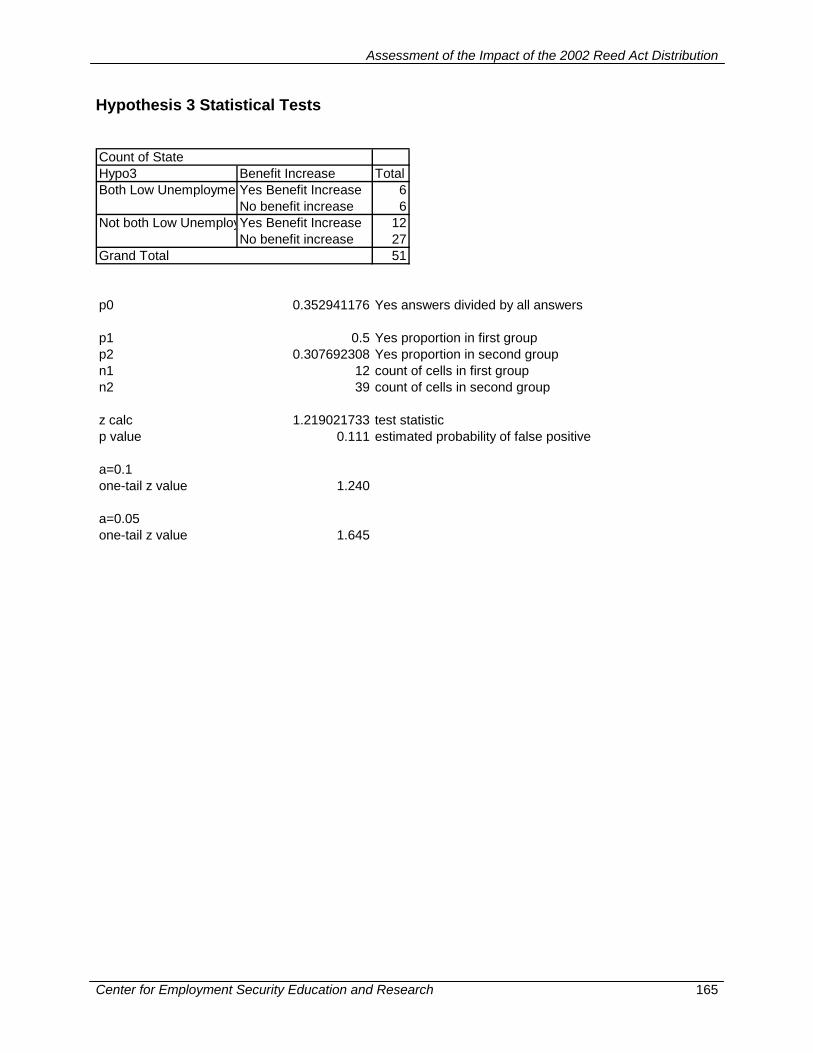
Assessment of the Impact of the 2002 Reed Act Distribution
Center for Employment Security Education and Research 165
Hypothesis 3 Statistical Tests
Count of StateHypo3 Benefit Increase TotalBoth Low Unemployme Yes Benefit Increase 6
No benefit increase 6Not both Low UnemployYes Benefit Increase 12
No benefit increase 27Grand Total 51
p0 0.352941176 Yes answers divided by all answers
p1 0.5 Yes proportion in first groupp2 0.307692308 Yes proportion in second groupn1 12 count of cells in first groupn2 39 count of cells in second group
z calc 1.219021733 test statisticp value 0.111 estimated probability of false positive
a=0.1one-tail z value 1.240
a=0.05one-tail z value 1.645
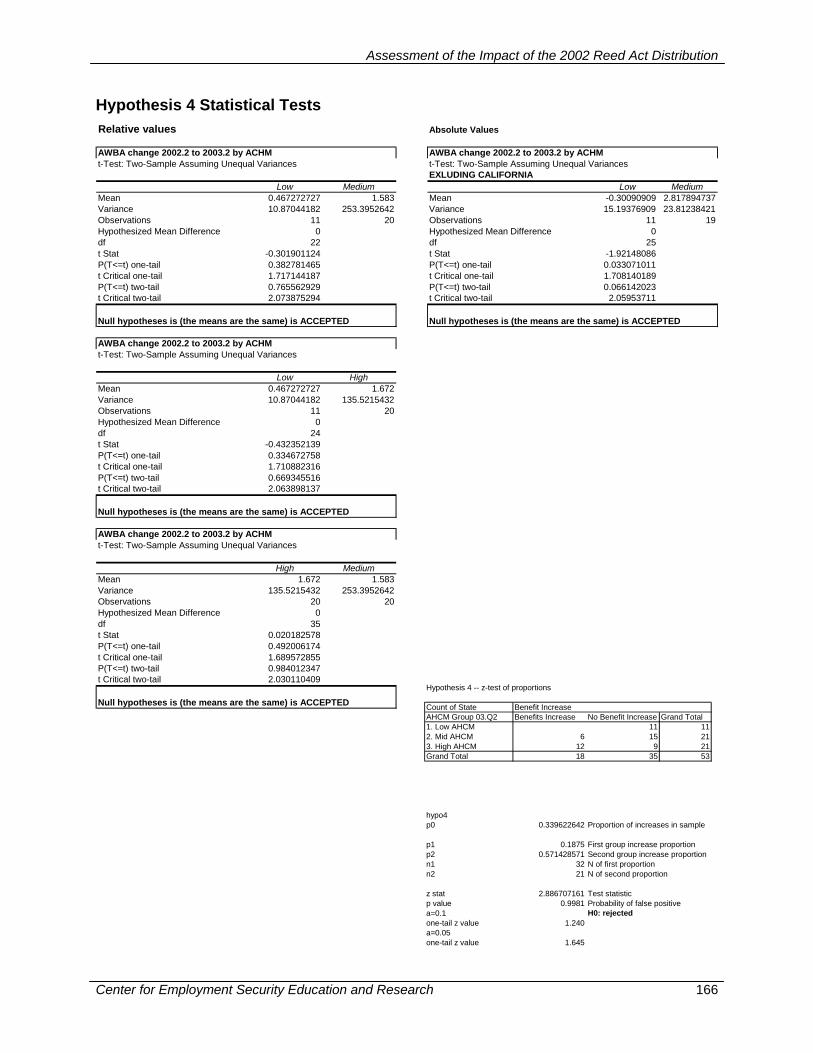
Assessment of the Impact of the 2002 Reed Act Distribution
Center for Employment Security Education and Research 166
Hypothesis 4 Statistical Tests Relative values Absolute Values
AWBA change 2002.2 to 2003.2 by ACHM AWBA change 2002.2 to 2003.2 by ACHMt-Test: Two-Sample Assuming Unequal Variances t-Test: Two-Sample Assuming Unequal Variances
EXLUDING CALIFORNIALow Medium Low Medium
Mean 0.467272727 1.583 Mean -0.30090909 2.817894737Variance 10.87044182 253.3952642 Variance 15.19376909 23.81238421Observations 11 20 Observations 11 19Hypothesized Mean Difference 0 Hypothesized Mean Difference 0df 22 df 25t Stat -0.301901124 t Stat -1.92148086P(T<=t) one-tail 0.382781465 P(T<=t) one-tail 0.033071011t Critical one-tail 1.717144187 t Critical one-tail 1.708140189P(T<=t) two-tail 0.765562929 P(T<=t) two-tail 0.066142023t Critical two-tail 2.073875294 t Critical two-tail 2.05953711
Null hypotheses is (the means are the same) is ACCEPTED Null hypotheses is (the means are the same) is ACCEPTED
AWBA change 2002.2 to 2003.2 by ACHMt-Test: Two-Sample Assuming Unequal Variances
Low HighMean 0.467272727 1.672Variance 10.87044182 135.5215432Observations 11 20Hypothesized Mean Difference 0df 24t Stat -0.432352139P(T<=t) one-tail 0.334672758t Critical one-tail 1.710882316P(T<=t) two-tail 0.669345516t Critical two-tail 2.063898137
Null hypotheses is (the means are the same) is ACCEPTED
AWBA change 2002.2 to 2003.2 by ACHMt-Test: Two-Sample Assuming Unequal Variances
High MediumMean 1.672 1.583Variance 135.5215432 253.3952642Observations 20 20Hypothesized Mean Difference 0df 35t Stat 0.020182578P(T<=t) one-tail 0.492006174t Critical one-tail 1.689572855P(T<=t) two-tail 0.984012347t Critical two-tail 2.030110409
Null hypotheses is (the means are the same) is ACCEPTED
Hypothesis 4 -- z-test of proportions
Count of State Benefit IncreaseAHCM Group 03.Q2 Benefits Increase No Benefit Increase Grand Total1. Low AHCM 11 112. Mid AHCM 6 15 213. High AHCM 12 9 21Grand Total 18 35 53
hypo4p0 0.339622642 Proportion of increases in sample
p1 0.1875 First group increase proportionp2 0.571428571 Second group increase proportionn1 32 N of first proportionn2 21 N of second proportion
z stat 2.886707161 Test statisticp value 0.9981 Probability of false positivea=0.1 H0: rejectedone-tail z value 1.240a=0.05one-tail z value 1.645
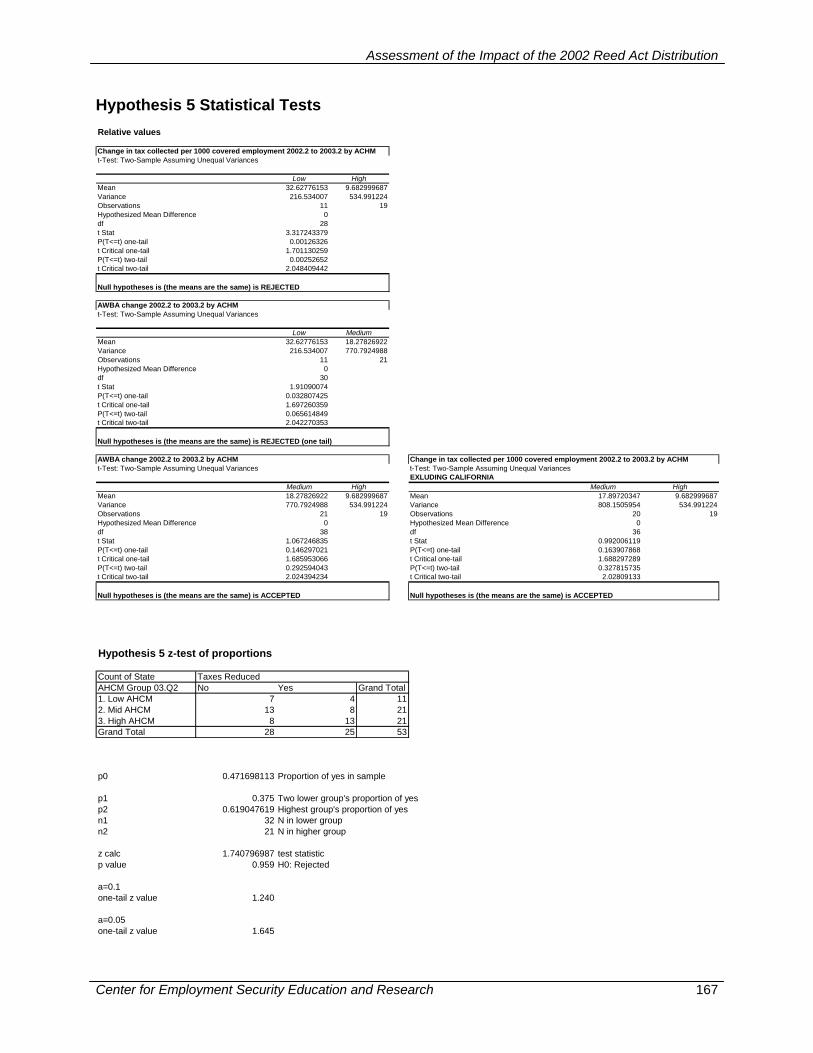
Assessment of the Impact of the 2002 Reed Act Distribution
Center for Employment Security Education and Research 167
Hypothesis 5 Statistical Tests
Relative values
Change in tax collected per 1000 covered employment 2002.2 to 2003.2 by ACHMt-Test: Two-Sample Assuming Unequal Variances
Low HighMean 32.62776153 9.682999687Variance 216.534007 534.991224Observations 11 19Hypothesized Mean Difference 0df 28t Stat 3.317243379P(T<=t) one-tail 0.00126326t Critical one-tail 1.701130259P(T<=t) two-tail 0.00252652t Critical two-tail 2.048409442
Null hypotheses is (the means are the same) is REJECTED
AWBA change 2002.2 to 2003.2 by ACHMt-Test: Two-Sample Assuming Unequal Variances
Low MediumMean 32.62776153 18.27826922Variance 216.534007 770.7924988Observations 11 21Hypothesized Mean Difference 0df 30t Stat 1.91090074P(T<=t) one-tail 0.032807425t Critical one-tail 1.697260359P(T<=t) two-tail 0.065614849t Critical two-tail 2.042270353
Null hypotheses is (the means are the same) is REJECTED (one tail)
AWBA change 2002.2 to 2003.2 by ACHM Change in tax collected per 1000 covered employment 2002.2 to 2003.2 by ACHMt-Test: Two-Sample Assuming Unequal Variances t-Test: Two-Sample Assuming Unequal Variances
EXLUDING CALIFORNIAMedium High Medium High
Mean 18.27826922 9.682999687 Mean 17.89720347 9.682999687Variance 770.7924988 534.991224 Variance 808.1505954 534.991224Observations 21 19 Observations 20 19Hypothesized Mean Difference 0 Hypothesized Mean Difference 0df 38 df 36t Stat 1.067246835 t Stat 0.992006119P(T<=t) one-tail 0.146297021 P(T<=t) one-tail 0.163907868t Critical one-tail 1.685953066 t Critical one-tail 1.688297289P(T<=t) two-tail 0.292594043 P(T<=t) two-tail 0.327815735t Critical two-tail 2.024394234 t Critical two-tail 2.02809133
Null hypotheses is (the means are the same) is ACCEPTED Null hypotheses is (the means are the same) is ACCEPTED
Hypothesis 5 z-test of proportions
Count of State Taxes ReducedAHCM Group 03.Q2 No Yes Grand Total1. Low AHCM 7 4 112. Mid AHCM 13 8 213. High AHCM 8 13 21Grand Total 28 25 53
p0 0.471698113 Proportion of yes in sample
p1 0.375 Two lower group's proportion of yesp2 0.619047619 Highest group's proportion of yesn1 32 N in lower groupn2 21 N in higher group
z calc 1.740796987 test statisticp value 0.959 H0: Rejected
a=0.1one-tail z value 1.240
a=0.05one-tail z value 1.645
Assessment of the Impact of the 2002 Reed Act Distribution
Center for Employment Security Education and Research 168
ATTACHMENT D – QUALITATIVE STUDY INTERVIEW GUIDE
REED ACT STUDY – CASE ANALYSIS INTERVIEW GUIDE
The information presented below is based on Booz Allen’s analysis of publicly available infor-mation and will be verified with [state name] state representatives as a part of the Reed Act case study. Background [text inserted here for each state with summary of publicly available/known use of Reed Act funds.]
I. Process Considerations 1. How did the state use its Reed Act funds? How much of the funds have been appropriated
and how will the remaining funds be used?
2. Describe the process by which the proposals for spending the Reed Act funds were gener-ated. Were they generated by the state administrator or the governor’s office?
3. What were the steps taken to educate stakeholders/ policy makers about Reed Act funding?
4. How useful were the Reed Act funds for stimulating the state economy?
5. Did the Reed Act distribution contribute to solvency and was there a decision not to spend the Reed Act funds until the annual tax adjustment?
6. The Reed Act funds are restricted to certain uses. What are other areas you would like to improve/invest in that are outside the scope of the Reed Act distribution?
7. If your state had not received the Reed Act distribution, how would the 2003 tax rates have compared to 2002?
8. Are your 2003 tax rates lower than they would have been otherwise? If yes, by how much? How much lower ($) are your UI taxes? Were the lower tax rates a result of an automatic change or a legislated change?
Assessment of the Impact of the 2002 Reed Act Distribution
Center for Employment Security Education and Research 169
Uses of the Reed Act Funds
II. Investment in Employment Services (ES) 9. Did the state use its Reed Act funds to invest in its employment services (ES)? If so, how
much was spent on ES? 10. What types of investments in ES were made? What are the expected benefits of these in-
vestments?
11. Why did the state decide to invest in ES as opposed to other uses?
12. What amount of the state’s distribution was used to substitute for state supplemental funds that were then reallocated to programs other than ES?
13. Did the State use Reed Act funds to invest in the Employment Service Labor Exchange Sys-tem?
14. If ‘yes’ to question #13, how much was utilized and on which ES activities e.g. basic labor exchange services, core services for the One-Stop delivery system etc?
15. Did the State provide supplemental dollars to fund any activities in the ES Labor Exchange System?
16. If ‘yes’ to question #15, what was the amount and for which activities? 17. Were there any additional funds that were utilized or proposed for use to support the ES La-
bor Exchange System? 18. What tools and/or resources were developed to educate stakeholders about the use of Reed
Act funds for the Employment Service Labor Exchange? (include appropriate Departmental guidance)
III. UI Administration 19. Did the state use its Reed Act funds to invest/improve its UI administration? If so, how much
was spent on it?
20. What type of investments/improvements were made?
21. Why did the state decide to invest/improve its UI administration as opposed to other uses?
22. What amount of the state’s distribution was used to substitute for state supplemental funds that were then reallocated to programs other than UI?
IV. Benefit Expansion/Extension/Enhancement
23. What dollar amount of the state’s distribution was used to expand, extend or enhance bene-fits? Does the state have any plans to expand benefits by instituting an alternate base period?
24. Does the state provide benefits to part-time workers?
25. The Reed Act distribution is a “one-time” distribution – how was the issue that a one-time funding can be adequate to fund eligibility and benefit expansions addressed? Is the benefit extension/expansion/enhancement a sunset provision? If not, how will the out-years be funded?
Assessment of the Impact of the 2002 Reed Act Distribution
Center for Employment Security Education and Research 170
V. Stakeholders 26. Were stakeholders active in communicating their interest in policy formulation regarding the
use of the Reed Act funds? If yes, who were they? (Please provide name, affiliation and tele-phone number)
27. Does the state have a UI advisory council? If yes, who are the members of this council?
28. What was the role if any, of the advisory council in the policy formulation regarding the Reed Act funds?
VI. Other 29. Does your state plan to propose spending Reed Act funds next year?
30. What were the lessons learned regarding the Reed Act distribution and its implications?
Contact Information _________________________________________________________
Phone Number _________________________________________________________ E-Mail _________________________________________________________
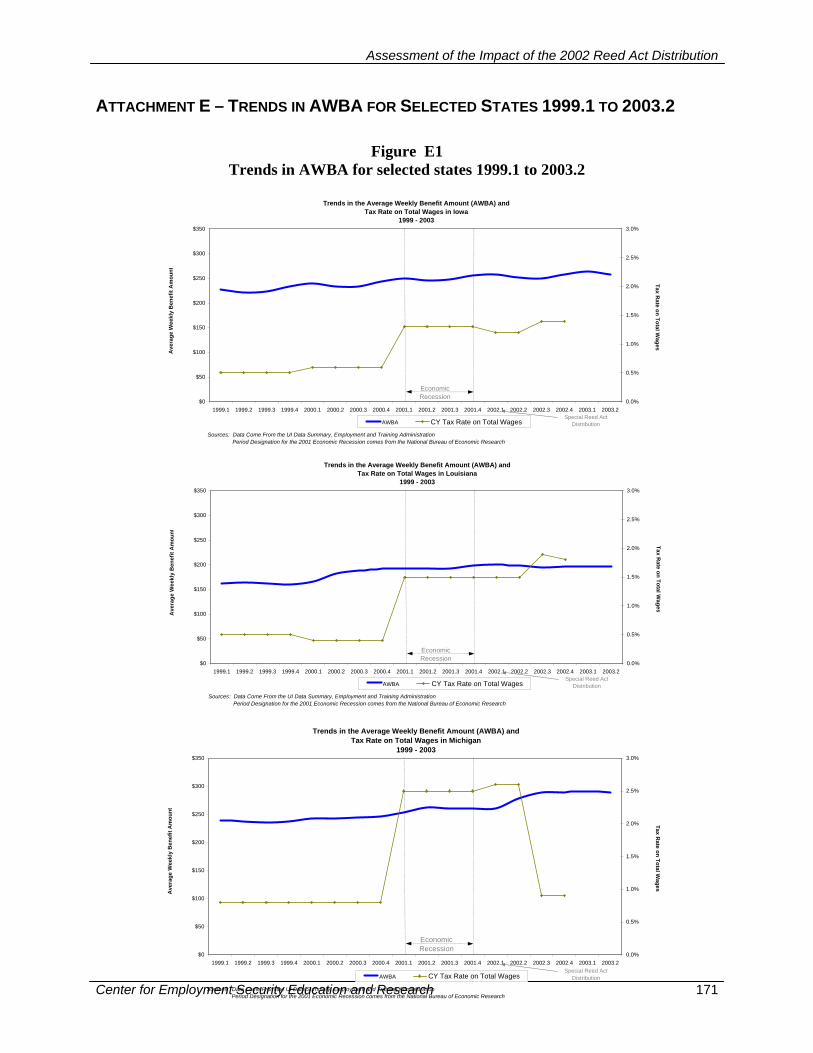
Assessment of the Impact of the 2002 Reed Act Distribution
Center for Employment Security Education and Research 171
ATTACHMENT E – TRENDS IN AWBA FOR SELECTED STATES 1999.1 TO 2003.2
Figure E1 Trends in AWBA for selected states 1999.1 to 2003.2
Trends in the Average Weekly Benefit Amount (AWBA) and Tax Rate on Total Wages in Iowa
1999 - 2003
$0
$50
$100
$150
$200
$250
$300
$350
1999.1 1999.2 1999.3 1999.4 2000.1 2000.2 2000.3 2000.4 2001.1 2001.2 2001.3 2001.4 2002.1 2002.2 2002.3 2002.4 2003.1 2003.20.0%
0.5%
1.0%
1.5%
2.0%
2.5%
3.0%
AWBA CY Tax Rate on Total Wages
Tax Rate on Total W
ages
Special Reed Act Distribution
EconomicRecession
Sources: Data Come From the UI Data Summary, Employment and Training Administration Period Designation for the 2001 Economic Recession comes from the National Bureau of Economic Research
Ave
rage
Wee
kly
Ben
efit
Am
ount
Trends in the Average Weekly Benefit Amount (AWBA) and Tax Rate on Total Wages in Louisiana
1999 - 2003
$0
$50
$100
$150
$200
$250
$300
$350
1999.1 1999.2 1999.3 1999.4 2000.1 2000.2 2000.3 2000.4 2001.1 2001.2 2001.3 2001.4 2002.1 2002.2 2002.3 2002.4 2003.1 2003.20.0%
0.5%
1.0%
1.5%
2.0%
2.5%
3.0%
AWBA CY Tax Rate on Total Wages
Tax Rate on Total W
ages
Special Reed Act Distribution
EconomicRecession
Sources: Data Come From the UI Data Summary, Employment and Training Administration Period Designation for the 2001 Economic Recession comes from the National Bureau of Economic Research
Ave
rage
Wee
kly
Ben
efit
Am
ount
Trends in the Average Weekly Benefit Amount (AWBA) and Tax Rate on Total Wages in Michigan
1999 - 2003
$0
$50
$100
$150
$200
$250
$300
$350
1999.1 1999.2 1999.3 1999.4 2000.1 2000.2 2000.3 2000.4 2001.1 2001.2 2001.3 2001.4 2002.1 2002.2 2002.3 2002.4 2003.1 2003.20.0%
0.5%
1.0%
1.5%
2.0%
2.5%
3.0%
AWBA CY Tax Rate on Total Wages
Tax Rate on Total W
ages
Special Reed Act Distribution
EconomicRecession
Sources: Data Come From the UI Data Summary, Employment and Training Administration Period Designation for the 2001 Economic Recession comes from the National Bureau of Economic Research
Ave
rage
Wee
kly
Ben
efit
Am
ount
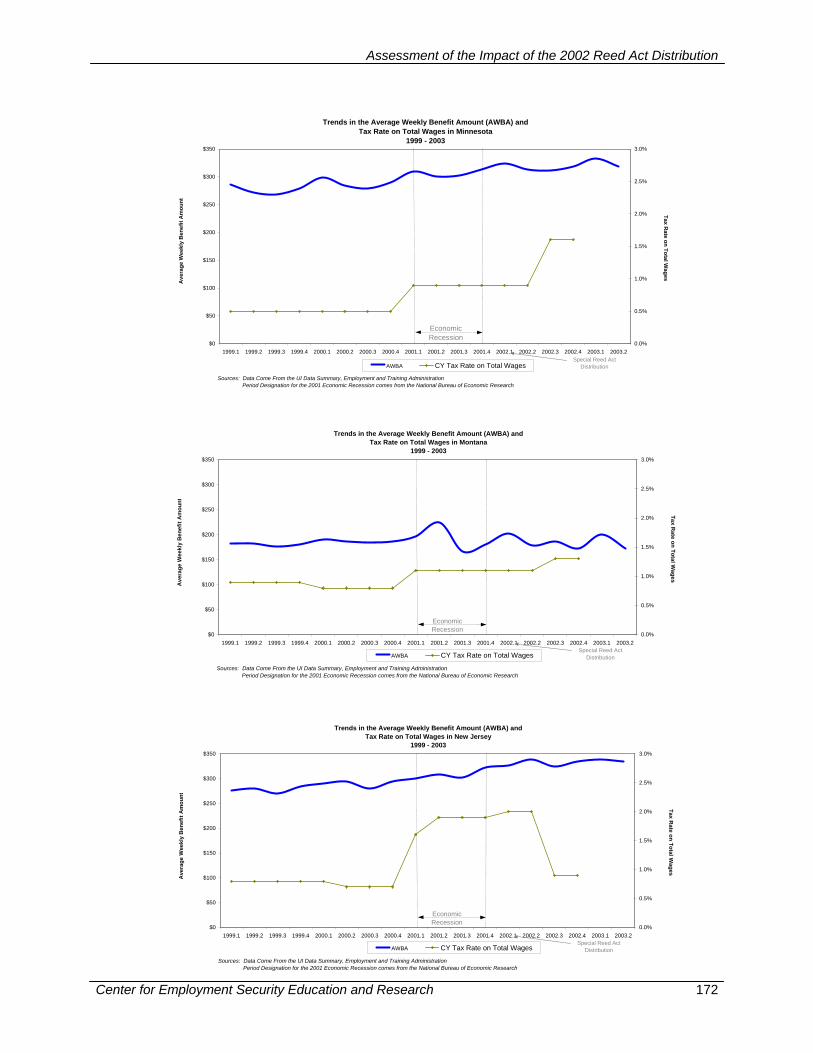
Assessment of the Impact of the 2002 Reed Act Distribution
Center for Employment Security Education and Research 172
Trends in the Average Weekly Benefit Amount (AWBA) and Tax Rate on Total Wages in Montana
1999 - 2003
$0
$50
$100
$150
$200
$250
$300
$350
1999.1 1999.2 1999.3 1999.4 2000.1 2000.2 2000.3 2000.4 2001.1 2001.2 2001.3 2001.4 2002.1 2002.2 2002.3 2002.4 2003.1 2003.20.0%
0.5%
1.0%
1.5%
2.0%
2.5%
3.0%
AWBA CY Tax Rate on Total Wages
Tax Rate on Total W
ages
Special Reed Act Distribution
EconomicRecession
Sources: Data Come From the UI Data Summary, Employment and Training Administration Period Designation for the 2001 Economic Recession comes from the National Bureau of Economic Research
Ave
rage
Wee
kly
Ben
efit
Am
ount
Trends in the Average Weekly Benefit Amount (AWBA) and Tax Rate on Total Wages in New Jersey
1999 - 2003
$0
$50
$100
$150
$200
$250
$300
$350
1999.1 1999.2 1999.3 1999.4 2000.1 2000.2 2000.3 2000.4 2001.1 2001.2 2001.3 2001.4 2002.1 2002.2 2002.3 2002.4 2003.1 2003.20.0%
0.5%
1.0%
1.5%
2.0%
2.5%
3.0%
AWBA CY Tax Rate on Total Wages
Tax Rate on Total W
ages
Special Reed Act Distribution
EconomicRecession
Sources: Data Come From the UI Data Summary, Employment and Training Administration Period Designation for the 2001 Economic Recession comes from the National Bureau of Economic Research
Ave
rage
Wee
kly
Ben
efit
Am
ount
Trends in the Average Weekly Benefit Amount (AWBA) and Tax Rate on Total Wages in Minnesota
1999 - 2003
$0
$50
$100
$150
$200
$250
$300
$350
1999.1 1999.2 1999.3 1999.4 2000.1 2000.2 2000.3 2000.4 2001.1 2001.2 2001.3 2001.4 2002.1 2002.2 2002.3 2002.4 2003.1 2003.20.0%
0.5%
1.0%
1.5%
2.0%
2.5%
3.0%
AWBA CY Tax Rate on Total Wages
Tax Rate on Total W
ages
Special Reed Act Distribution
EconomicRecession
Sources: Data Come From the UI Data Summary, Employment and Training Administration Period Designation for the 2001 Economic Recession comes from the National Bureau of Economic Research
Ave
rage
Wee
kly
Ben
efit
Am
ount
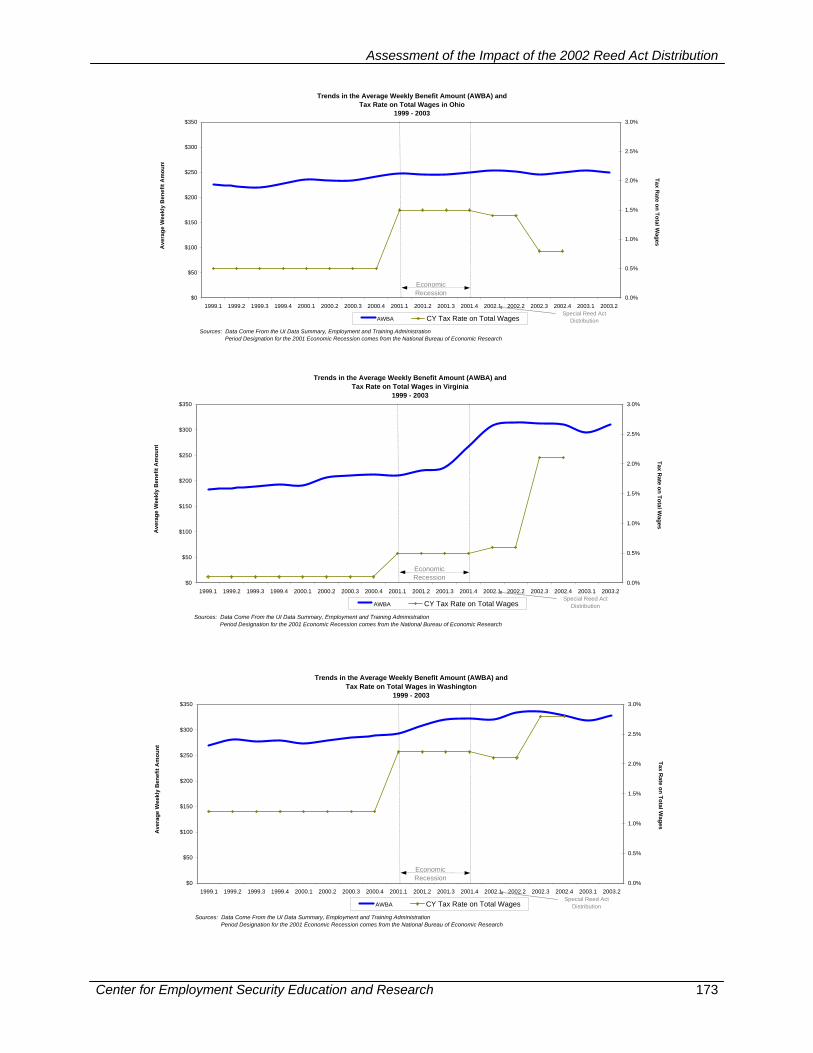
Assessment of the Impact of the 2002 Reed Act Distribution
Center for Employment Security Education and Research 173
Trends in the Average Weekly Benefit Amount (AWBA) and Tax Rate on Total Wages in Ohio
1999 - 2003
$0
$50
$100
$150
$200
$250
$300
$350
1999.1 1999.2 1999.3 1999.4 2000.1 2000.2 2000.3 2000.4 2001.1 2001.2 2001.3 2001.4 2002.1 2002.2 2002.3 2002.4 2003.1 2003.20.0%
0.5%
1.0%
1.5%
2.0%
2.5%
3.0%
AWBA CY Tax Rate on Total Wages
Tax Rate on Total W
ages
Special Reed Act Distribution
EconomicRecession
Sources: Data Come From the UI Data Summary, Employment and Training Administration Period Designation for the 2001 Economic Recession comes from the National Bureau of Economic Research
Ave
rage
Wee
kly
Ben
efit
Am
ount
Trends in the Average Weekly Benefit Amount (AWBA) and Tax Rate on Total Wages in Virginia
1999 - 2003
$0
$50
$100
$150
$200
$250
$300
$350
1999.1 1999.2 1999.3 1999.4 2000.1 2000.2 2000.3 2000.4 2001.1 2001.2 2001.3 2001.4 2002.1 2002.2 2002.3 2002.4 2003.1 2003.20.0%
0.5%
1.0%
1.5%
2.0%
2.5%
3.0%
AWBA CY Tax Rate on Total Wages
Tax Rate on Total W
ages
Special Reed Act Distribution
EconomicRecession
Sources: Data Come From the UI Data Summary, Employment and Training Administration Period Designation for the 2001 Economic Recession comes from the National Bureau of Economic Research
Ave
rage
Wee
kly
Ben
efit
Am
ount
Trends in the Average Weekly Benefit Amount (AWBA) and Tax Rate on Total Wages in Washington
1999 - 2003
$0
$50
$100
$150
$200
$250
$300
$350
1999.1 1999.2 1999.3 1999.4 2000.1 2000.2 2000.3 2000.4 2001.1 2001.2 2001.3 2001.4 2002.1 2002.2 2002.3 2002.4 2003.1 2003.20.0%
0.5%
1.0%
1.5%
2.0%
2.5%
3.0%
AWBA CY Tax Rate on Total Wages
Tax Rate on Total W
ages
Special Reed Act Distribution
EconomicRecession
Sources: Data Come From the UI Data Summary, Employment and Training Administration Period Designation for the 2001 Economic Recession comes from the National Bureau of Economic Research
Ave
rage
Wee
kly
Ben
efit
Am
ount

Assessment of the Impact of the 2002 Reed Act Distribution
Center for Employment Security Education and Research 174