referral for proposed action ranger 3 deeps … · referral for proposed action project title:...
TRANSCRIPT
REFERRAL FOR PROPOSED ACTION
RANGER 3 DEEPS UNDERGROUND MINE
FIGURES 21 – 37
Referral for proposed action Project Title: Ranger 3 Deeps Underground Mine
Date: 16 January 2013 ii
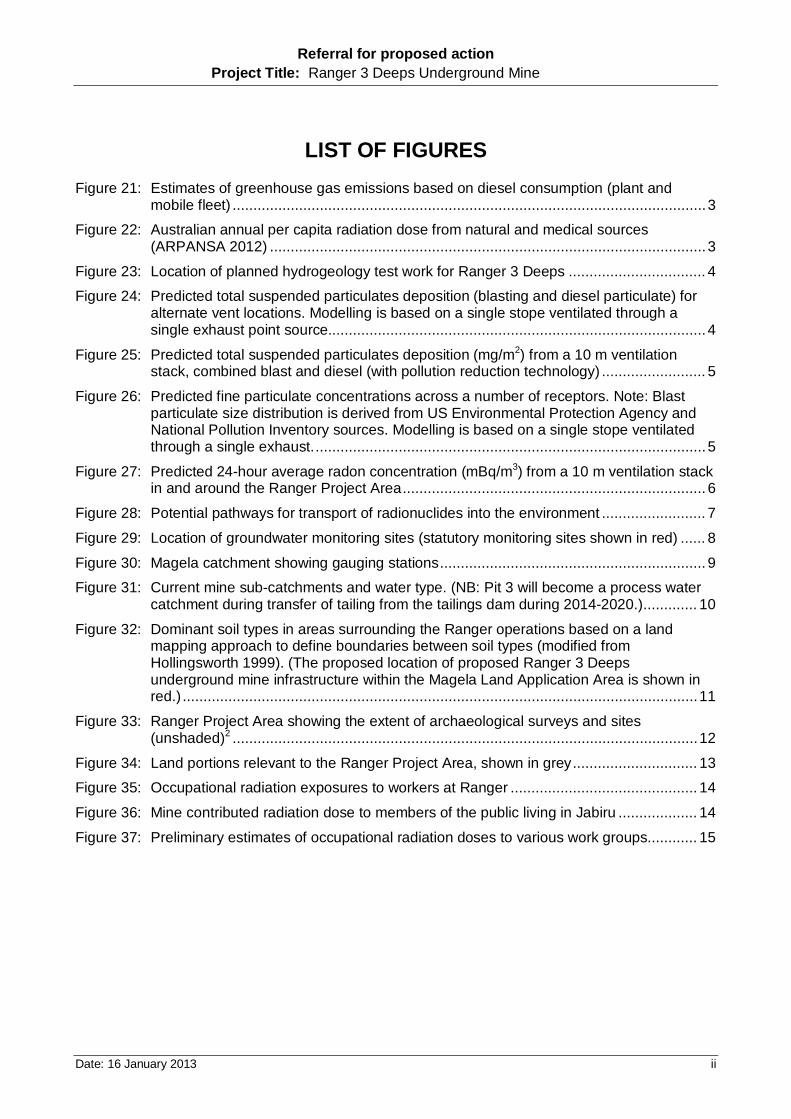
LIST OF FIGURES Figure 21: Estimates of greenhouse gas emissions based on diesel consumption (plant and
mobile fleet) .................................................................................................................. 3
Figure 22: Australian annual per capita radiation dose from natural and medical sources (ARPANSA 2012) ......................................................................................................... 3
Figure 23: Location of planned hydrogeology test work for Ranger 3 Deeps ................................. 4
Figure 24: Predicted total suspended particulates deposition (blasting and diesel particulate) for alternate vent locations. Modelling is based on a single stope ventilated through a single exhaust point source........................................................................................... 4
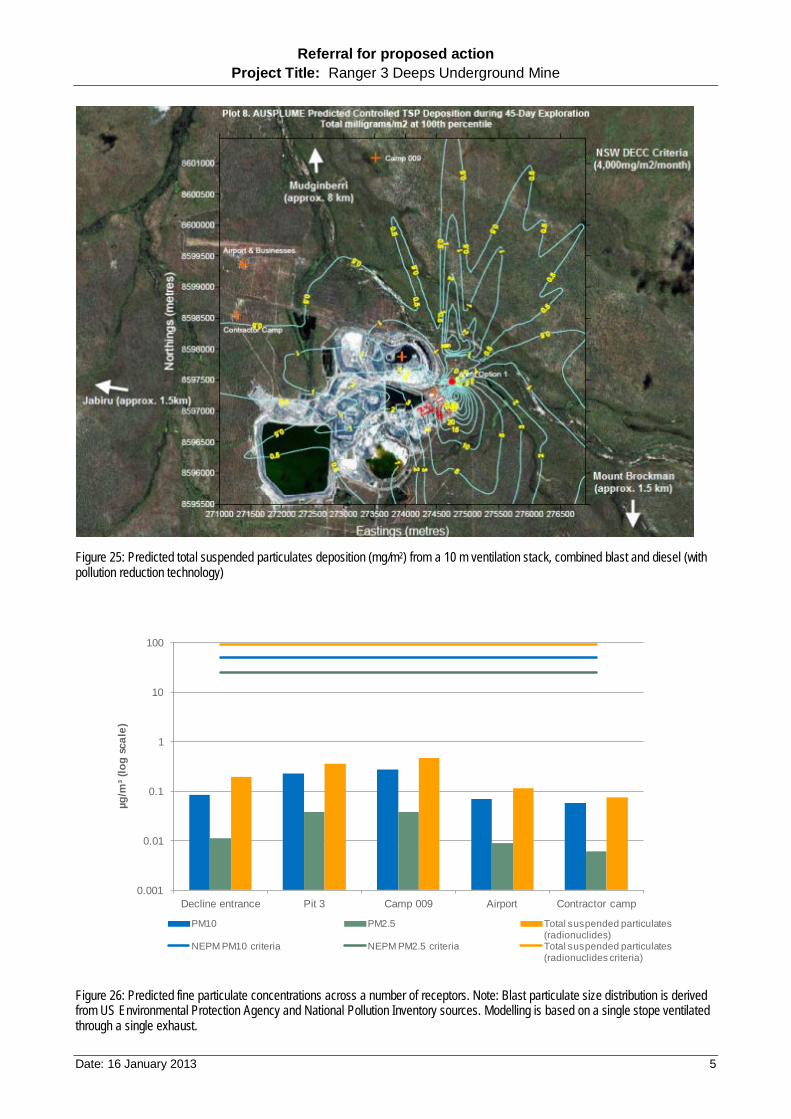
Figure 25: Predicted total suspended particulates deposition (mg/m2) from a 10 m ventilation stack, combined blast and diesel (with pollution reduction technology) ......................... 5
Figure 26: Predicted fine particulate concentrations across a number of receptors. Note: Blast particulate size distribution is derived from US Environmental Protection Agency and National Pollution Inventory sources. Modelling is based on a single stope ventilated through a single exhaust. .............................................................................................. 5
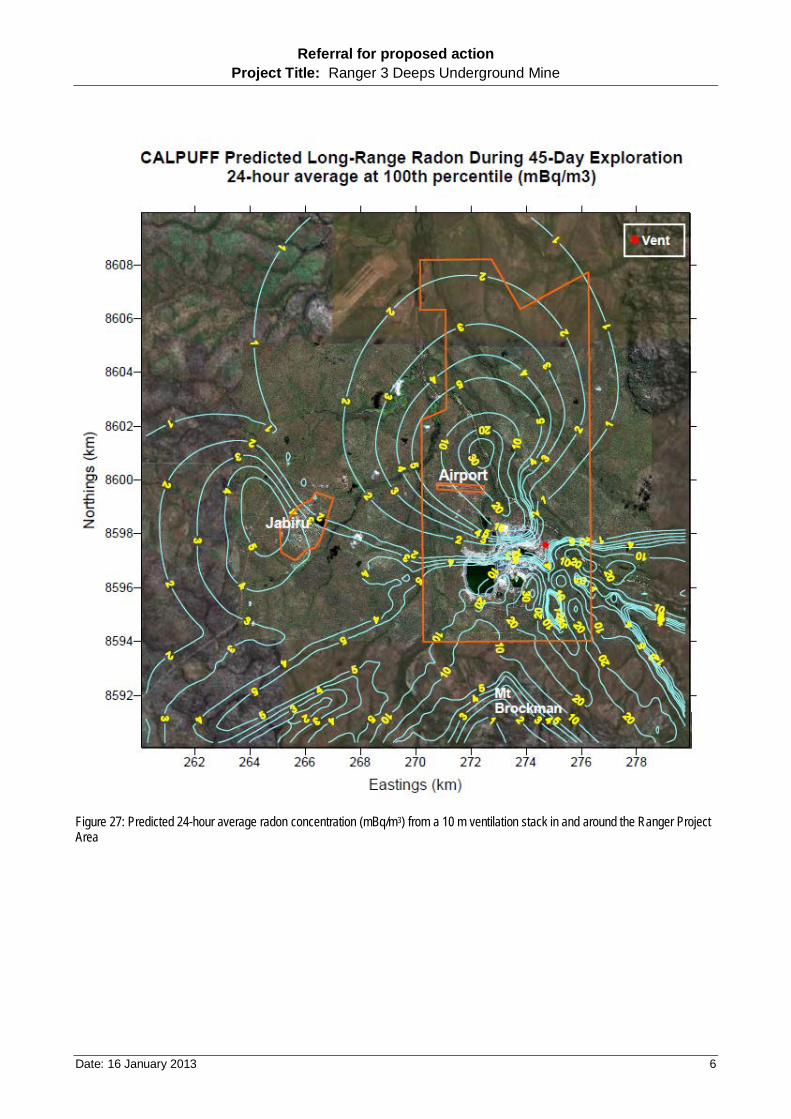
Figure 27: Predicted 24-hour average radon concentration (mBq/m3) from a 10 m ventilation stack in and around the Ranger Project Area ......................................................................... 6
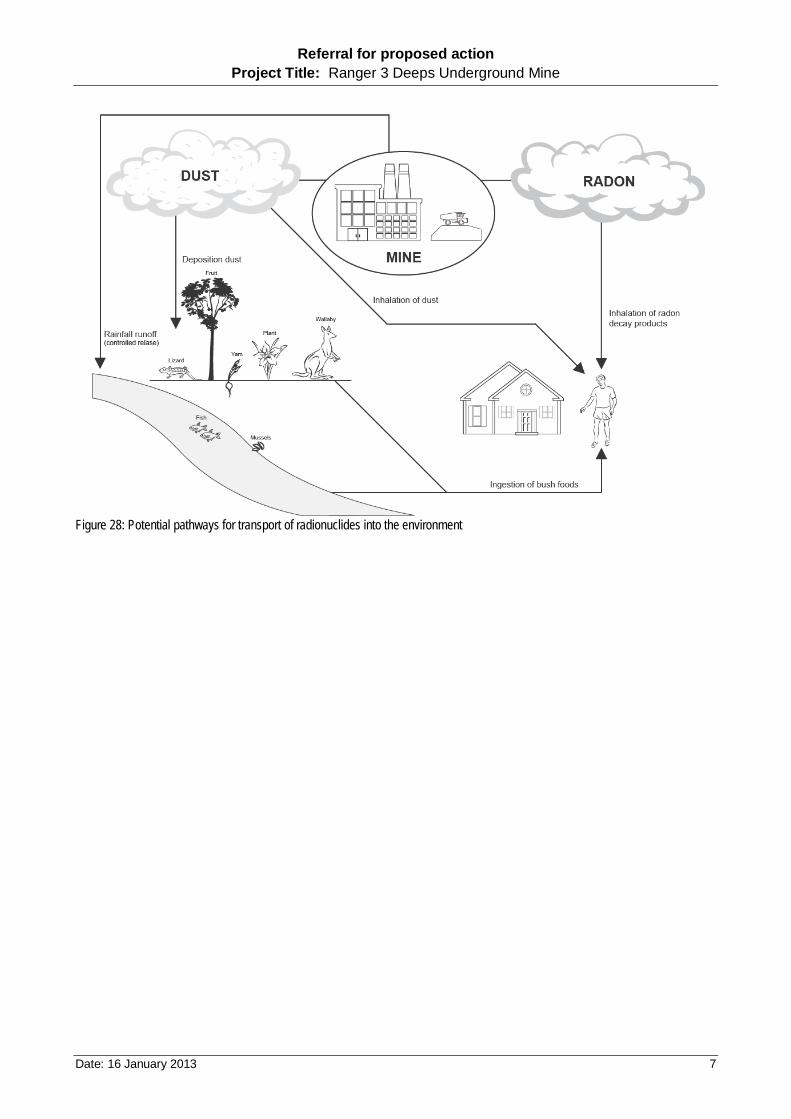
Figure 28: Potential pathways for transport of radionuclides into the environment ......................... 7
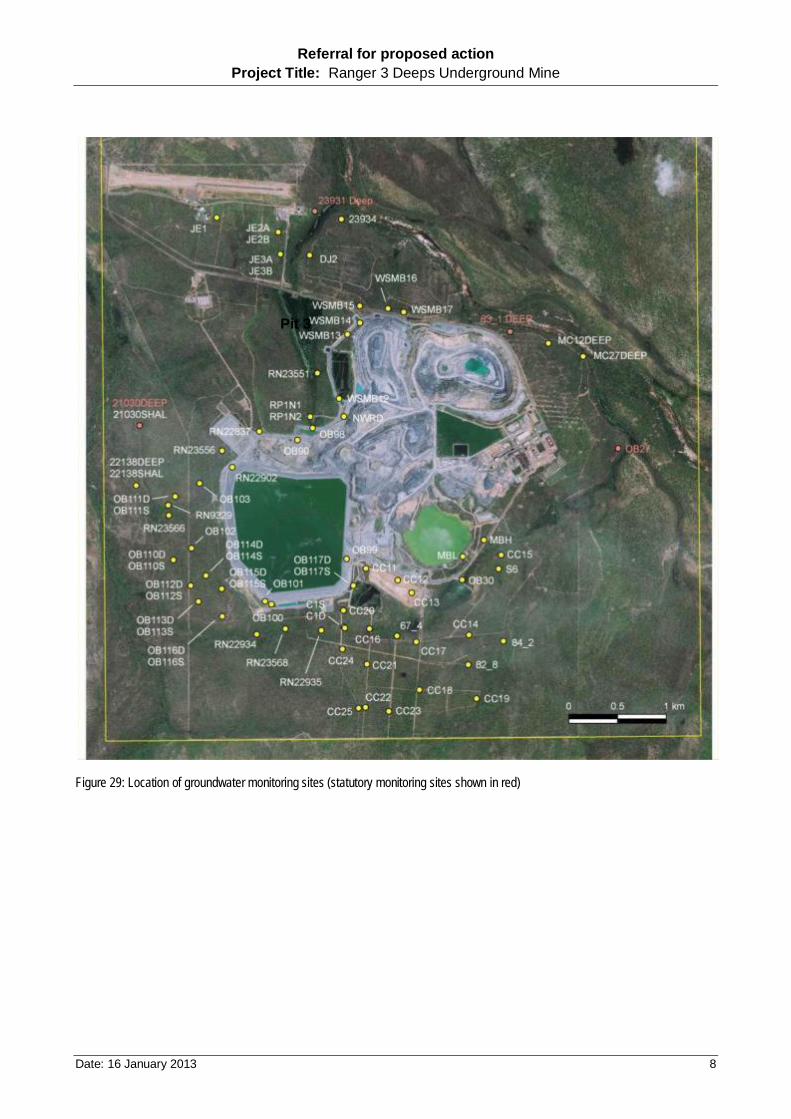
Figure 29: Location of groundwater monitoring sites (statutory monitoring sites shown in red) ...... 8
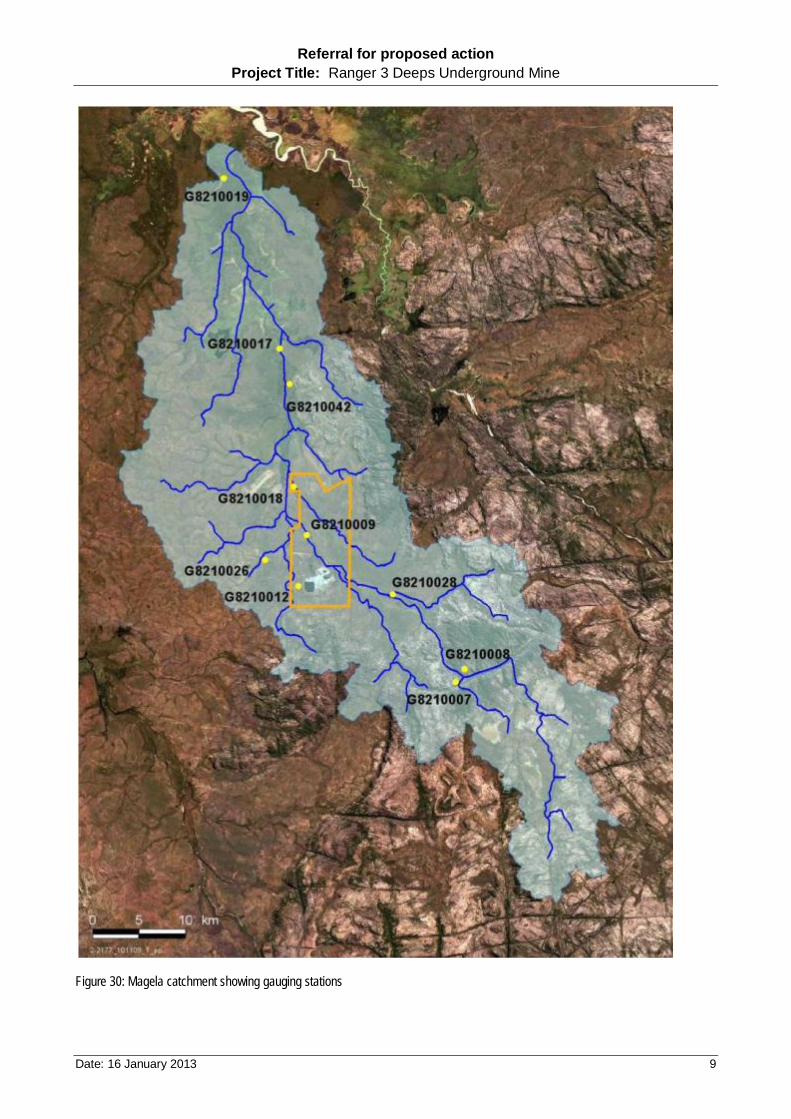
Figure 30: Magela catchment showing gauging stations ................................................................ 9
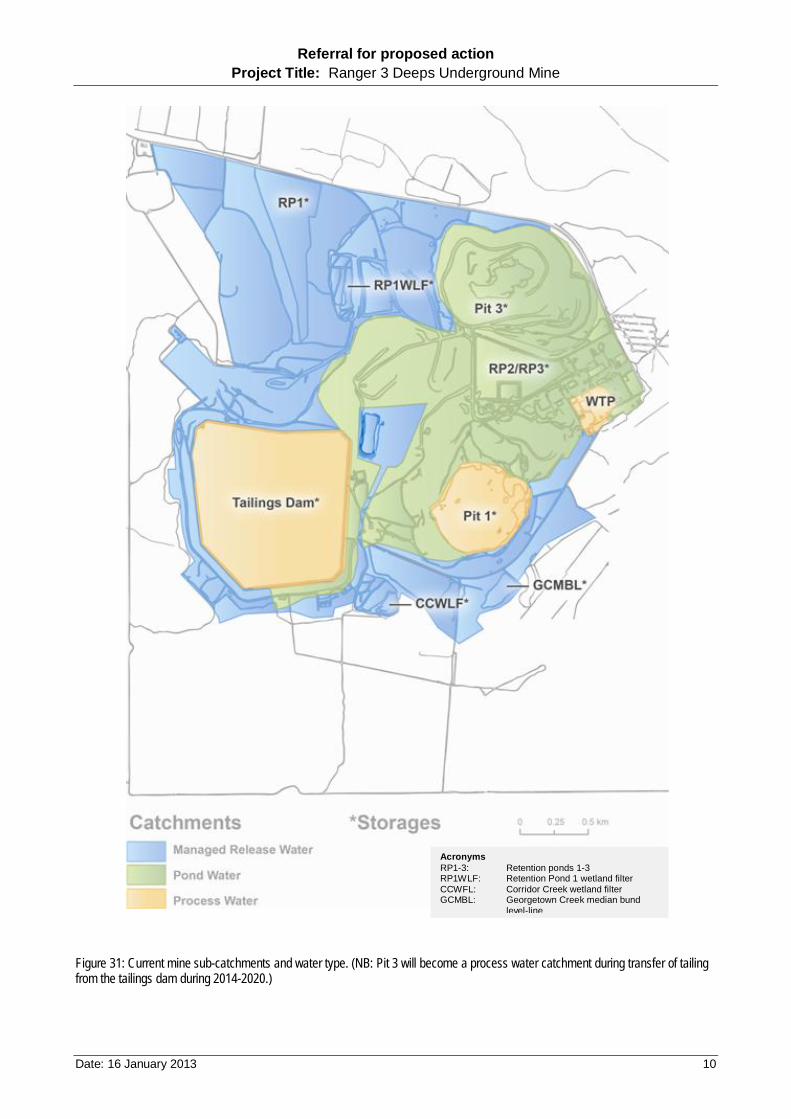
Figure 31: Current mine sub-catchments and water type. (NB: Pit 3 will become a process water catchment during transfer of tailing from the tailings dam during 2014-2020.) ............. 10
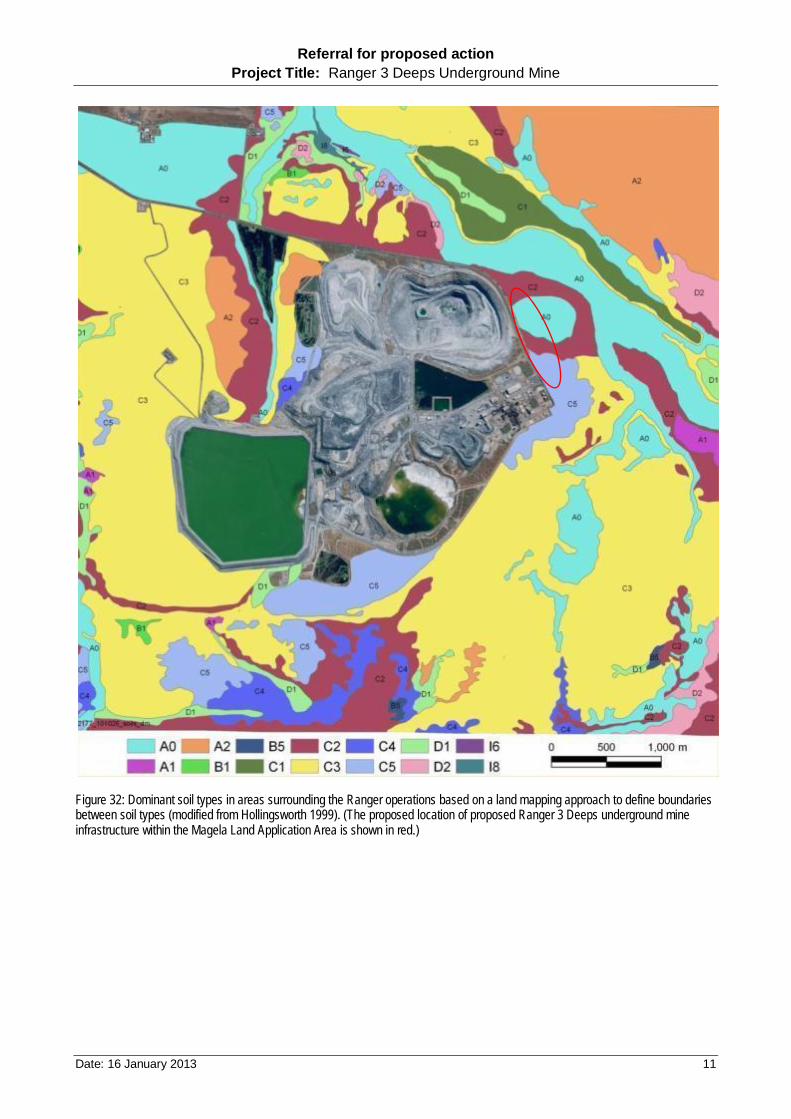
Figure 32: Dominant soil types in areas surrounding the Ranger operations based on a land mapping approach to define boundaries between soil types (modified from Hollingsworth 1999). (The proposed location of proposed Ranger 3 Deeps underground mine infrastructure within the Magela Land Application Area is shown in red.) ............................................................................................................................ 11
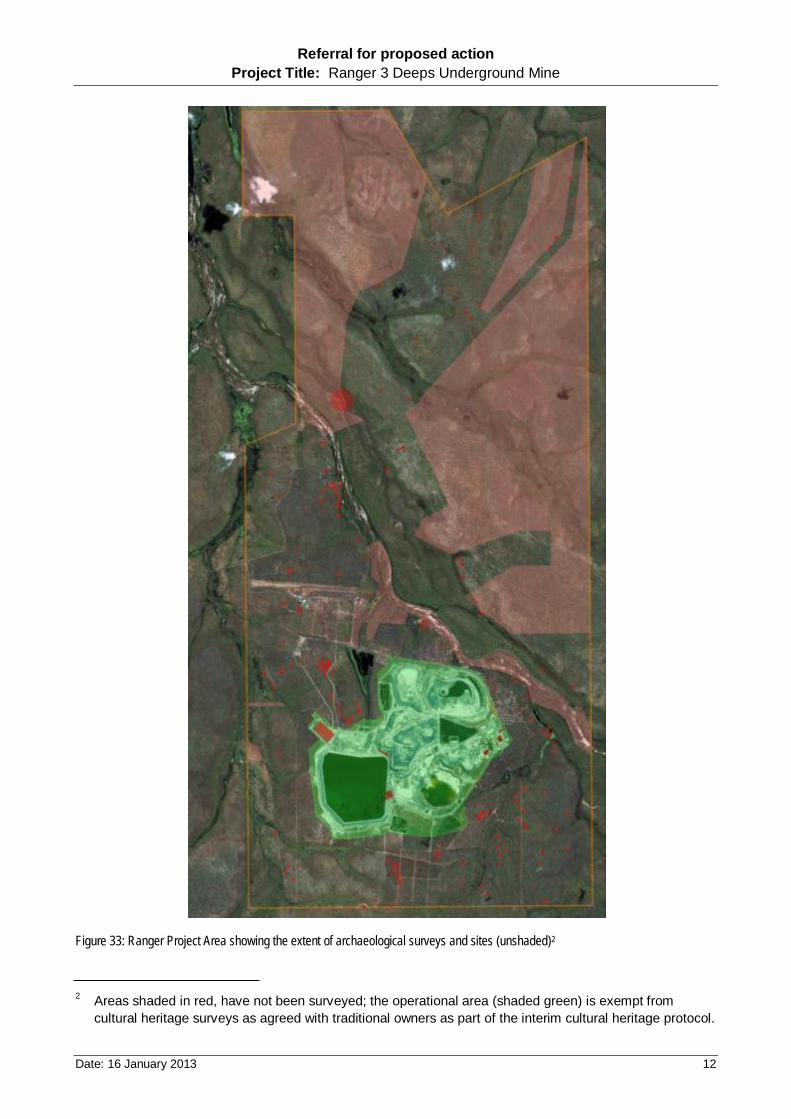
Figure 33: Ranger Project Area showing the extent of archaeological surveys and sites (unshaded)2 ................................................................................................................ 12
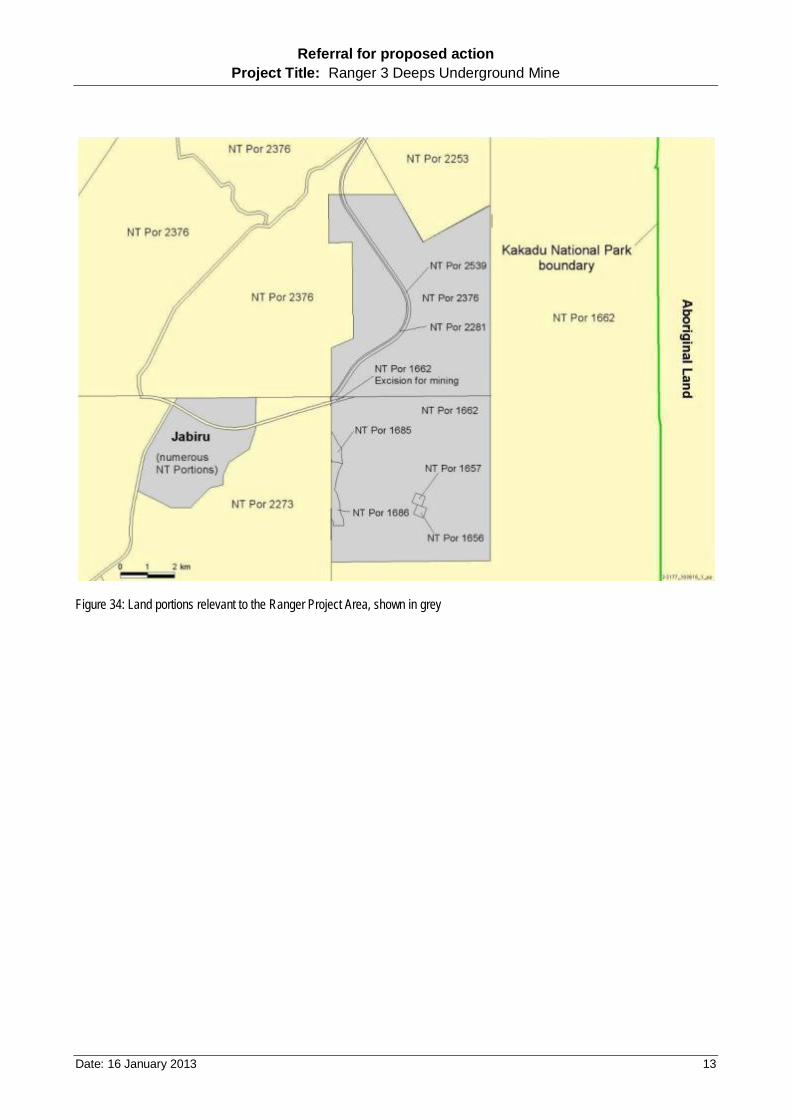
Figure 34: Land portions relevant to the Ranger Project Area, shown in grey .............................. 13
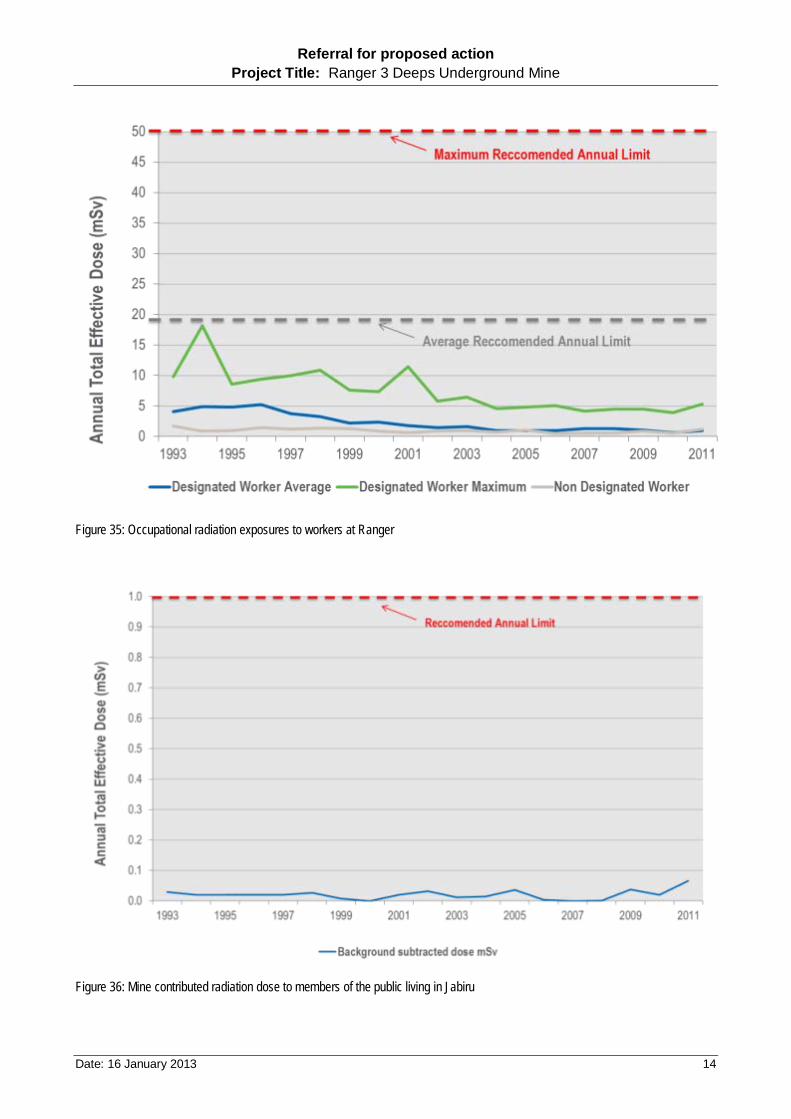
Figure 35: Occupational radiation exposures to workers at Ranger ............................................. 14
Figure 36: Mine contributed radiation dose to members of the public living in Jabiru ................... 14
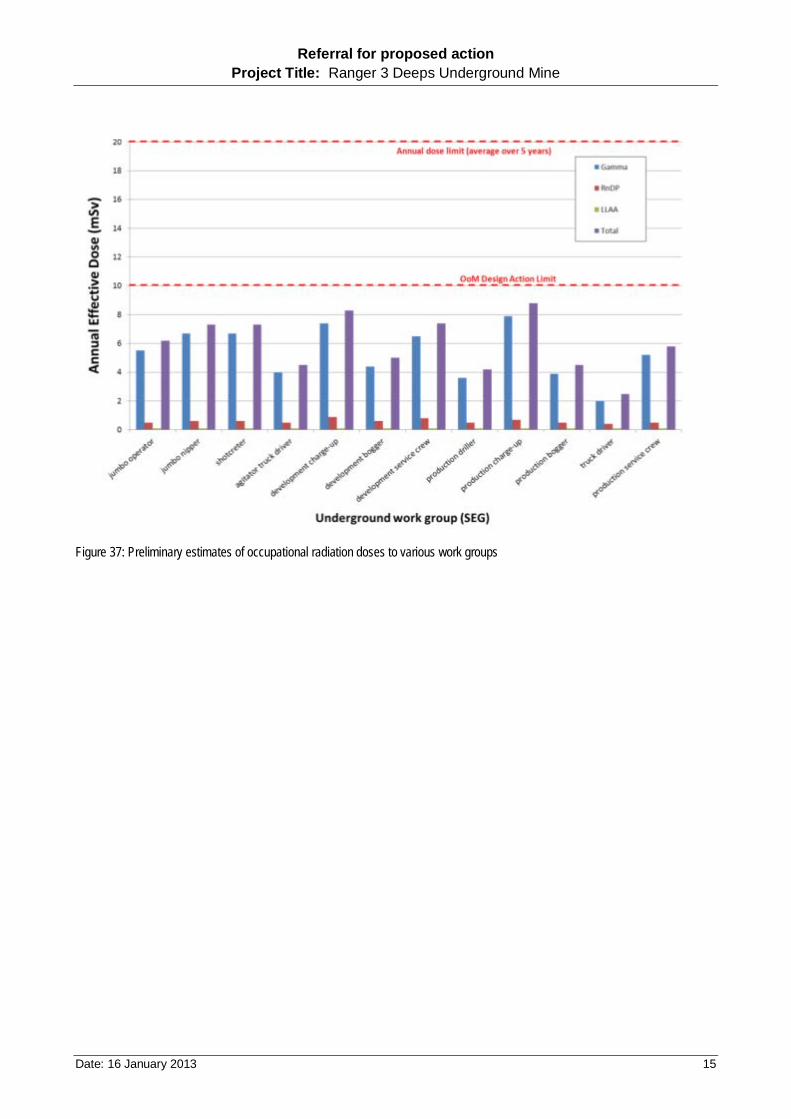
Figure 37: Preliminary estimates of occupational radiation doses to various work groups............ 15
Referral for proposed action Project Title: Ranger 3 Deeps Underground Mine
Date: 16 January 2013 3
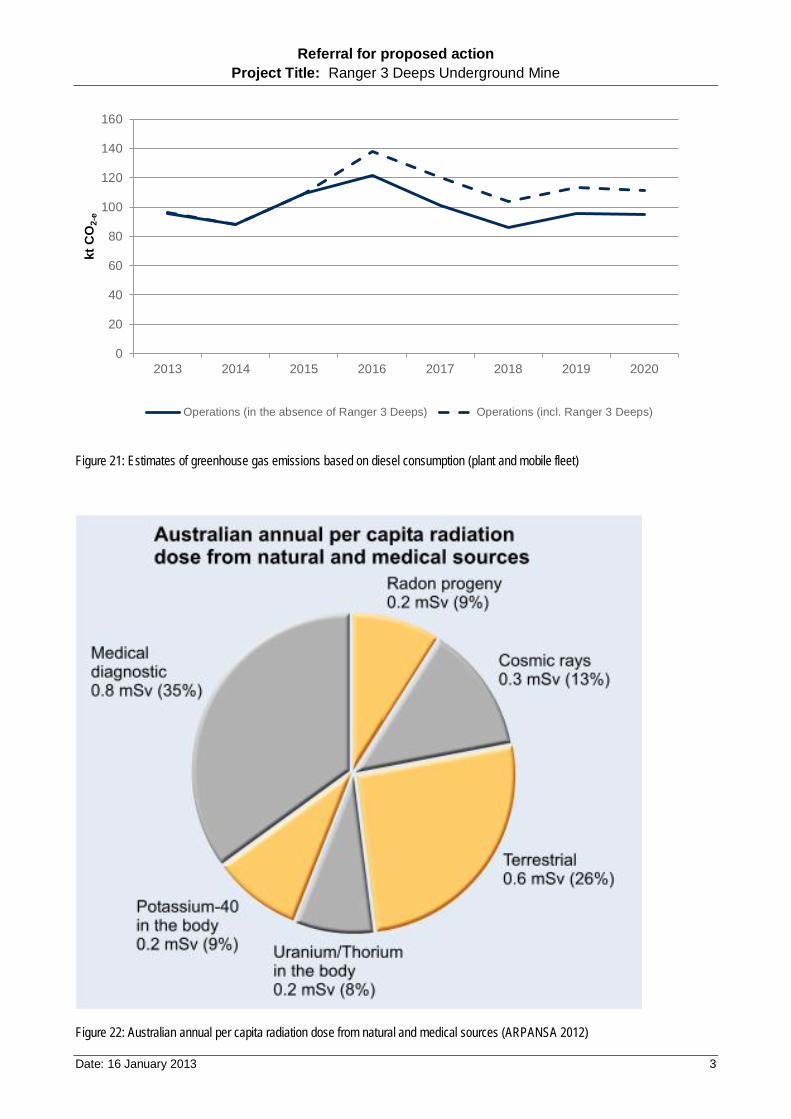
Figure 21: Estimates of greenhouse gas emissions based on diesel consumption (plant and mobile fleet)
Figure 22: Australian annual per capita radiation dose from natural and medical sources (ARPANSA 2012)
0
20
40
60
80
100
120
140
160
2013 2014 2015 2016 2017 2018 2019 2020
kt C
O2-
e
Operations (in the absence of Ranger 3 Deeps) Operations (incl. Ranger 3 Deeps)
Referral for proposed action Project Title: Ranger 3 Deeps Underground Mine
Date: 16 January 2013 4
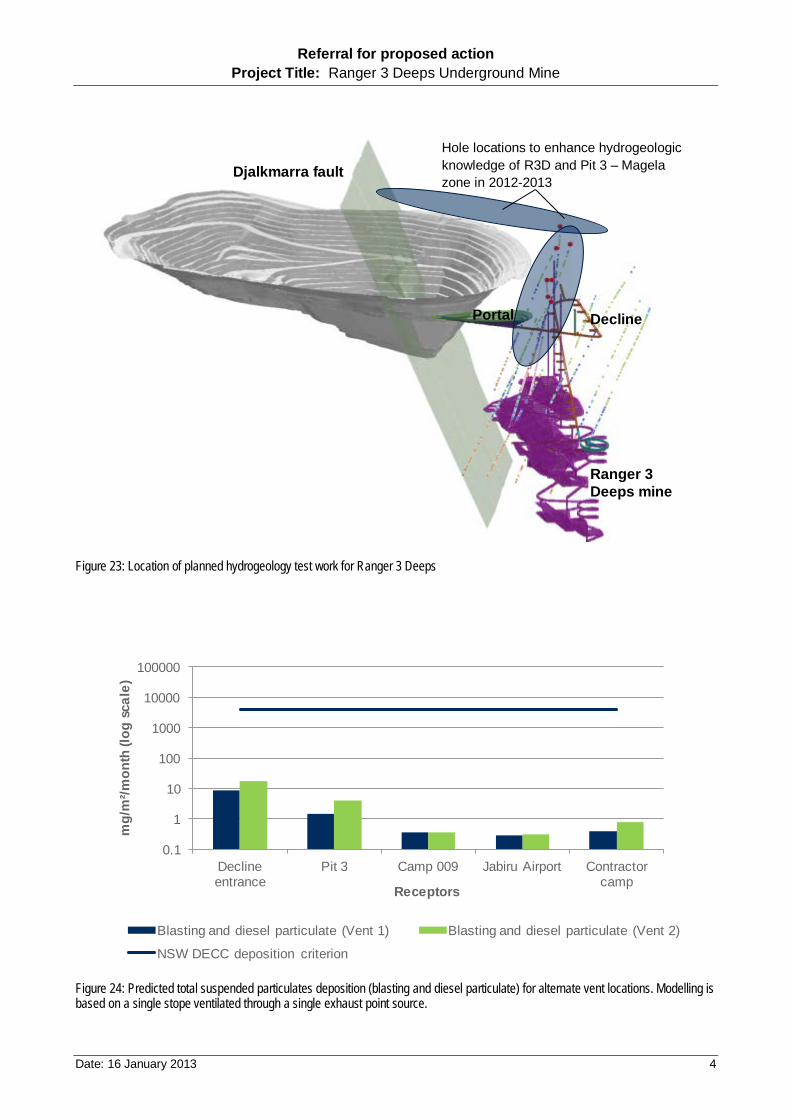
Figure 23: Location of planned hydrogeology test work for Ranger 3 Deeps
Figure 24: Predicted total suspended particulates deposition (blasting and diesel particulate) for alternate vent locations. Modelling is based on a single stope ventilated through a single exhaust point source.
0.1
1
10
100
1000
10000
100000
Decline entrance
Pit 3 Camp 009 Jabiru Airport Contractor camp
mg/
m²/m
onth
(log
sca
le)
Receptors
Blasting and diesel particulate (Vent 1) Blasting and diesel particulate (Vent 2)
NSW DECC deposition criterion
Decline
Ranger 3 Deeps mine
Hole locations to enhance hydrogeologic knowledge of R3D and Pit 3 – Magela zone in 2012-2013
Djalkmarra fault
Portal
Referral for proposed action Project Title: Ranger 3 Deeps Underground Mine
Date: 16 January 2013 5
Figure 25: Predicted total suspended particulates deposition (mg/m2) from a 10 m ventilation stack, combined blast and diesel (with pollution reduction technology)
Figure 26: Predicted fine particulate concentrations across a number of receptors. Note: Blast particulate size distribution is derived from US Environmental Protection Agency and National Pollution Inventory sources. Modelling is based on a single stope ventilated through a single exhaust.
0.001
0.01
0.1
1
10
100
Decline entrance Pit 3 Camp 009 Airport Contractor camp
µg/m
³ (lo
g sc
ale)
PM10 PM2.5 Total suspended particulates (radionuclides)
NEPM PM10 criteria NEPM PM2.5 criteria Total suspended particulates (radionuclides criteria)
Referral for proposed action Project Title: Ranger 3 Deeps Underground Mine
Date: 16 January 2013 6
Figure 27: Predicted 24-hour average radon concentration (mBq/m3) from a 10 m ventilation stack in and around the Ranger Project Area
Referral for proposed action Project Title: Ranger 3 Deeps Underground Mine
Date: 16 January 2013 7
Figure 28: Potential pathways for transport of radionuclides into the environment
Portal
Referral for proposed action Project Title: Ranger 3 Deeps Underground Mine
Date: 16 January 2013 8
Figure 29: Location of groundwater monitoring sites (statutory monitoring sites shown in red)
Pit 3
Referral for proposed action Project Title: Ranger 3 Deeps Underground Mine
Date: 16 January 2013 9
Figure 30: Magela catchment showing gauging stations
Referral for proposed action Project Title: Ranger 3 Deeps Underground Mine
Date: 16 January 2013 10
Figure 31: Current mine sub-catchments and water type. (NB: Pit 3 will become a process water catchment during transfer of tailing from the tailings dam during 2014-2020.)
Acronyms RP1-3: Retention ponds 1-3 RP1WLF: Retention Pond 1 wetland filter CCWFL: Corridor Creek wetland filter GCMBL: Georgetown Creek median bund
level-line
Referral for proposed action Project Title: Ranger 3 Deeps Underground Mine
Date: 16 January 2013 11
Figure 32: Dominant soil types in areas surrounding the Ranger operations based on a land mapping approach to define boundaries between soil types (modified from Hollingsworth 1999). (The proposed location of proposed Ranger 3 Deeps underground mine infrastructure within the Magela Land Application Area is shown in red.)
Referral for proposed action Project Title: Ranger 3 Deeps Underground Mine
Date: 16 January 2013 12
Figure 33: Ranger Project Area showing the extent of archaeological surveys and sites (unshaded)2
2 Areas shaded in red, have not been surveyed; the operational area (shaded green) is exempt from cultural heritage surveys as agreed with traditional owners as part of the interim cultural heritage protocol.
Referral for proposed action Project Title: Ranger 3 Deeps Underground Mine
Date: 16 January 2013 13
Figure 34: Land portions relevant to the Ranger Project Area, shown in grey
Referral for proposed action Project Title: Ranger 3 Deeps Underground Mine
Date: 16 January 2013 14
Figure 35: Occupational radiation exposures to workers at Ranger
Figure 36: Mine contributed radiation dose to members of the public living in Jabiru
Referral for proposed action Project Title: Ranger 3 Deeps Underground Mine
Date: 16 January 2013 15
Figure 37: Preliminary estimates of occupational radiation doses to various work groups