refinement of protein structures using a combination of
TRANSCRIPT

addenda and errata
Acta Cryst. (2020). D76, 85–86 https://doi.org/10.1107/S2059798319016383 85
Received 4 September 2019
Accepted 4 December 2019
Keywords: refinement of protein structures;
quantum-mechanical calculations; neutrons;
corrigendum.
Refinement of protein structures using acombination of quantum-mechanical calculationswith neutron and X-ray crystallographic data.Corrigendum
Octav Caldararu,a Francesco Manzoni,a,b Esko Oksanen,b,c Derek T. Loganb and
Ulf Rydea*
aDivision of Theoretical Chemistry, Lund University, Chemical Centre, PO Box 124, SE-221 00, Lund, Sweden,bDepartment of Biochemistry and Structural Biology, Lund University, Chemical Centre, PO Box 124, SE-221 00, Lund,
Sweden, and cEuropean Spallation Source ESS ERIC, PO Box 176, SE-221 00, Lund, Sweden. *Correspondence e-mail:
Corrections are published for the article by Caldararu et al. [(2019), Acta Cryst.
D75, 368–380].
In our previous article, Refinement of protein structures using a
combination of quantum-mechanical calculations with neutron
and X-ray crystallographic data (Caldararu, Manzoni et al.,
2019), there was a small technical error in calculating the
nuclear scattering-length density maps for Fig. 11 and Table 4.
Joint X-ray–neutron quantum refinement of lytic poly-
saccharide monooxygenase (LPMO) was conducted even
though the unit-cell parameters of the X-ray crystal and of the
neutron crystal are not exactly equal. The quantum refinement
calculations were performed in the X-ray unit cell, but the
nuclear density maps in Fig. 11 were calculated in the neutron
unit cell. We report below the corrected figure (Fig. 1), with
nuclear density maps calculated in the X-ray unit cell. The
RSZD (real-space difference-density Z) values used in weight
determination for the LPMO quantum refinement in the
original article were also calculated from the maps in the
wrong unit cell. A corrected table with the maximum absolute
RSZD of the residues of the active site is shown below (Table
1). It can be seen that the absolute values of the RSZD scores
have changed somewhat (by up to 1.2), but the variation with
the X-ray and neutron weight factors, wN and wX, does not
change much. All RSZD scores are almost constant for wN =
wX = 1–10, whereas RSZD increases if the weights are further
decreased. Therefore, the selection of wN = wX = 1 as proper
weights is still in accordance with the RSZD values estimated
from maps calculated in the correct unit cell.
In the corrected version of the figure, there is no positive
difference density at the deprotonated N-terminus at the 3.0�level. However, there is still positive difference density around
the N-terminus at the 2.8� level as can be seen in the corrected
Fig. 1(b). This level is still well above the noise level of the
nuclear density maps in that area (�2.3�). Although the maps
without the D2 atom at the N-terminus look more similar to
the ones reported by Bacik et al. (Bacik et al., 2017), the
structures with two deuterium atoms still fit better to the
neutron data. Thus, our conclusions about the use of quantum
ISSN 2059-7983
# 2020 International Union of Crystallography

refinement in elucidating protonation states in metallo-
enzymes do not change.
Most importantly, the correction in no way affects the
combined quantum mechanical and joint X-ray–neutron
refinement method, which was presented in the article. The
LPMO quantum refinement was included only as a second
application of the method, taken from another publication
(Caldararu, Oksanen et al., 2019a), for which a more detailed
correction has already been submitted (Caldararu, Oksanen et
al., 2019b).
References
Bacik, J.-P., Mekasha, S., Forsberg, Z., Kovalevsky, A. Y., Vaaje-Kolstad, G., Eijsink, V. G. H., Nix, J. C., Coates, L., Cuneo, M. J.,Unkefer, J. & Chen, J. C. (2017). Biochemistry, 56, 2529–2532.
Caldararu, O., Manzoni, F., Oksanen, E., Logan, D. T. & Ryde, U.(2019). Acta Cryst. D75, 368–380.
Caldararu, O., Oksanen, E., Ryde, U. & Hedegard, E. D. (2019a).Chem. Sci. 10, 576–586.
Caldararu, O., Oksanen, E., Ryde, U. & Hedegard, E. D. (2019b).Chem. Sci. 10, 8262–8263.
addenda and errata
86 Caldararu et al. � Refinement of protein structures Acta Cryst. (2020). D76, 85–86
Figure 1Structure and nuclear density maps of the active site of LPMO in subunit B after QM refinement. (a) The N-terminus in the protonated –ND2 form and(b) the N-terminus in the deprotonated ND– form. The 2m|Fo|�D|Fc| nuclear density at 1.0� is shown as a grey grid and m|Fo|�D|Fc| nuclear differencedensity is shown at 2.8� (green grid) and �2.8� (red grid). This is a corrected version of Fig. 11 from Caldararu, Manzoni et al. (2019).
Table 1Maximum absolute RSZD values of the residues in the QM system in the QM refinement of subunit A of the LPMO structure obtained with differentweights of the experimental data (wN and wX).
This is a corrected version of Table 4 from Caldararu, Manzoni et al. (2019). Note that wX/wN = 1 in all refinements.
wN 0.001 0.01 0.1 1 2 3 4 5 6 7 8 9 10
wX 0.001 0.01 0.1 1 2 3 4 5 6 7 8 9 10
Cu 0.4 0.4 0.4 0.4 0.4 0.4 0.4 0.4 0.4 0.4 0.4 0.4 0.4Peroxide 0.3 0.3 0.1 0.1 0.1 0.0 0.0 0.0 0.0 0.0 0.0 0.0 0.0His32 1.7 1.5 0.9 0.4 0.4 0.4 0.4 0.4 0.4 0.4 0.4 0.4 0.4His109 1.0 1.0 0.8 0.7 0.7 0.7 0.7 0.7 0.7 0.7 0.7 0.7 0.7Phe164 1.4 1.4 1.4 1.4 1.4 1.4 1.4 1.4 1.4 1.4 1.4 1.4 1.4Wat301 1.7 1.7 1.8 1.7 1.7 1.7 1.7 1.7 1.7 1.7 1.7 1.7 1.7Sum 6.5 6.3 5.5 4.7 4.7 4.6 4.6 4.6 4.6 4.6 4.6 4.6 4.6

research papers
368 https://doi.org/10.1107/S205979831900175X Acta Cryst. (2019). D75, 368–380
Received 17 October 2018
Accepted 30 January 2019
Edited by F. Meilleur, Oak Ridge National
Laboratory, USA, and North Carolina State
University, USA
This article is dedicated to the memory of
Francesco Manzoni, who died from a heart
attack on 12 March 2017 at the age of 27.
Keywords: refinement; neutron crystallography;
hydrogen atoms; quantum chemistry; galectin-3;
lytic polysaccharide monooxygenase; quantum
refinement.
Supporting information: this article has
supporting information at journals.iucr.org/d
Refinement of protein structures using acombination of quantum-mechanical calculationswith neutron and X-ray crystallographic data
Octav Caldararu,a Francesco Manzoni,a,b Esko Oksanen,b,c Derek T. Loganb and
Ulf Rydea*
aDepartment of Theoretical Chemistry, Lund University, Chemical Centre, PO Box 124, SE-221 00 Lund, Sweden,bDepartment of Biochemistry and Structural Biology, Centre for Molecular Protein Science, Lund University, Chemical
Centre, PO Box 124, SE-221 00 Lund, Sweden, and cInstruments Division, European Spallation Source ESS ERIC,
PO Box 176, SE-221 00 Lund, Sweden. *Correspondence e-mail: [email protected]
Neutron crystallography is a powerful method to determine the positions of H
atoms in macromolecular structures. However, it is sometimes hard to judge
what would constitute a chemically reasonable model, and the geometry of H
atoms depends more on the surroundings (for example the formation of
hydrogen bonds) than heavy atoms, so that the empirical geometry information
for the H atoms used to supplement the experimental data is often less accurate.
These problems may be reduced by using quantum-mechanical calculations.
A method has therefore been developed to combine quantum-mechanical
calculations with joint crystallographic refinement against X-ray and neutron
data. A first validation of this method is provided by re-refining the structure of
the galectin-3 carbohydrate-recognition domain in complex with lactose. The
geometry is improved, in particular for water molecules, for which the method
leads to better-resolved hydrogen-bonding interactions. The method has also
been applied to the active copper site of lytic polysaccharide monooxygenase
and shows that the protonation state of the amino-terminal histidine residue can
be determined.
1. Introduction
The majority of structural information about biological
macromolecules is obtained from X-ray crystallography. An
important limitation of X-ray crystallography is that H atoms
can only rarely be visualized in the electron-density maps,
as the scattering by just one electron is too weak. Neutron
crystallography (Blakeley, 2009) is a method that is able to
complement the information from X-ray crystallography
because neutrons are scattered by the nuclei. Moreover,
deuterium, the heavier isotope of hydrogen, scatters neutrons
comparably to carbon or nitrogen (Sears, 1986). Consequently,
neutron structures can help to determine the positions of H
atoms, describe the geometry of hydrogen bonds, determine
the protonation and tautomeric states of ligands and pinpoint
the function of water molecules. However, as the inclusion of
H atoms in the model increases the number of parameters to
be refined and neutron structures are typically at a rather low
resolution, neutron data alone are typically not sufficient to
define all of the atomic positions. Therefore, refinement
protocols have been introduced that combine X-ray and
neutron data into a single target function, against which the
coordinates are refined (Coppens, 1967; Orpen et al., 1978;
Wlodawer, 1980; Wlodawer & Hendrickson, 1982; Adams et
al., 2009; Afonine et al., 2010; Wlodawer & Sjolin, 1982; Fisher
et al., 2007).
ISSN 2059-7983

At the resolutions typical for macromolecular structures,
the quality and information content of the refined structural
model critically depends on prior chemical knowledge about
the system, such as the amino-acid sequence and a set of
chemical restraints (Cruickshank, 1999). In practice, the latter
information, in the form of a molecular-mechanics (MM) or
statistical force field, is used to restrain the bond lengths,
angles and dihedrals in refinement, as well as to ensure proper
chirality and to avoid sterical clashes. For the non-H atoms in
amino acids and other standard constituents of proteins, these
values are well known from a large number of high-resolution
crystal structures and are available in the refinement software
(Engh & Huber, 1991). However, this is not the case for many
non-protein groups, such as metal sites, substrates and inhi-
bitors (Ryde et al., 2002; Nilsson et al., 2003; Zheng, Reimers et
al., 2017; Borbulevych et al., 2016). Moreover, the geometrical
information available for bonds involving H atoms is less
reliable than for heavier atoms, even for protein components,
not to mention non-protein compounds.
The restraints used in crystallographic refinement provide
quite a crude description of the molecular system, as they are
based on an average over many structures. The chemical
environment may influence the bond lengths and angles, for
example by electrostatic and induction effects, in ways that are
not captured by typical restraints. The ideal geometry of
hydrogen-containing bonds is particularly sensitive to the local
chemical environment, which makes an averaging approach
less attractive with hydrogen.
To address these issues in X-ray crystallography, we have
previously developed a method to locally replace the MM
restraints in the refinement by more accurate quantum-
mechanical (QM) calculations: the quantum-refinement
approach (Ryde et al., 2002; Ryde & Nilsson, 2003; Ryde, 2007;
Genoni et al., 2018). It is in principle a standard crystallo-
graphic refinement in which the MM restraints are replaced by
more accurate QM calculations for a small part of the protein
of particular interest, such as an active site. From a compu-
tational chemistry viewpoint, it can be seen as a combined
QM/MM calculation restrained by the crystallographic raw
data. We showed that crystal structures can be locally improved
using such a method, the protonation states of metal-bound
water molecules can be determined and the photoreduction of
metal sites can be identified (Nilsson & Ryde, 2004; Soder-
hjelm & Ryde, 2006; Rulısek & Ryde, 2006; Ryde & Nilsson,
2003). The approach has been implemented in several soft-
ware programs by other groups (Yu et al., 2005; Hsiao et al.,
2010). In particular, Merz and Westerhoff have developed
methods to combine X-ray crystallographic refinement with
linear-scaling semi-empirical calculations of the whole protein
and have shown that protonation states and ligand-binding
conformations can be determined (Borbulevych et al., 2014,
2016; Reynolds, 2014; Yu et al., 2005). The Q|R project also
aims at refining macromolecular structures using QM methods
(Zheng, Moriarty et al., 2017; Zheng, Reimers et al., 2017).
In this paper, we extend the quantum-refinement approach
to neutron data, as well as combined X-ray and neutron
refinement. The method is implemented in the freely available
nCNS software (Adams et al., 2009). As test cases, we apply
the method to the refinement of the ligand-binding site of the
carbohydrate-recognition domain of galectin-3 with a bound
lactose molecule (Manzoni et al., 2018) and to the active
copper site of lytic polysaccharide monooxygenase (LPMO).
Galectin-3 is a mammalian �-galactoside-binding protein
involved in glycoprotein trafficking, signalling, cell adhesion,
angiogenesis, macrophage activation and apoptosis (Leffler et
al., 2002; MacKinnon et al., 2008; Delacour et al., 2009; Liu &
Rabinovich, 2010; Grigorian & Demetriou, 2010; Johannes et
al., 2018). It has been implicated in inflammation, immunity,
cancer development and metastasis (Rabinovich et al., 2007).
LPMO is a metalloenzyme that is capable of inserting a
single O atom into the glycosidic C—H bond in poly-
saccharides (Vaaje-Kolstad et al., 2010). This boosts
polysaccharide decomposition, which could lead to a more
energy-efficient production of biofuel from abundant poly-
saccharides such as cellulose (Harris et al., 2014). LPMOs
contain a copper ion coordinated by two histidine residues.
One of the histidine residues coordinates bidentately to both
the N-terminus and the imidazole side chain (Quinlan et al.,
2011).
We show that the combined QM/neutron/X-ray refinement
works properly and gives rise to improved structures and to an
easier interpretation of ambiguous data.
2. Methods
2.1. Galectin-3
Neutron data were collected to a resolution of 1.7 A from a
1.8 mm3 crystal of perdeuterated carbohydrate-recognition
domain of galectin-3 (galectin-3C) complexed with nondeut-
erated lactose using the LADI-III instrument at Institut Laue–
Langevin, Grenoble, France (Blakeley et al., 2010). X-ray data
were collected to 1.0 A resolution from the same crystal on
beamline I911-3 at the MAX-II synchrotron, Lund, Sweden.
Full details of data collection and processing have been
presented in a previous article (Manzoni et al., 2016). In that
article, the neutron data set used here was referred to as
‘lactose-2’ and was 87.1% complete to 1.7 A resolution (66.5%
from 1.8 to 1.7 A). The X-ray data are 99% complete to 1.0 A
resolution. However, in all refinements in this paper the X-ray
data were truncated at 1.7 A resolution. This was mainly
performed because the program used for refinement, nCNS
(see below), cannot refine anisotropic B factors. However, it
also reflects a more common scenario than that which prevails
for galectin-3C, namely that the X-ray and neutron diffraction
limits are more similar. Furthermore, high-resolution X-ray
data contain information on hydrogen positions that is
potentially contradictory to the neutron data, as the peaks in
the electron density are displaced towards the centre of the
bond to the heavy atom, resulting in shorter bond lengths. A
scenario with much higher resolution X-ray data was tested for
LPMO. The finally published galectin-3C–lactose structure
(Manzoni et al., 2018), deposited in the PDB as entry 6eym,
was refined against a more complete neutron data set (96%
research papers
Acta Cryst. (2019). D75, 368–380 Caldararu et al. � Refinement with QM and neutron and X-ray data 369
complete to 1.7 A resolution) with higher multiplicity that was
obtained by merging the data from two crystals (Manzoni et
al., 2016).
The starting structure for refinement was the 0.86 A reso-
lution X-ray structure of galectin-3 in complex with lactose
with the water molecules removed (Saraboji et al., 2012). The
structure was first refined against the X-ray data using
REFMAC5 (Murshudov et al., 2011). Water molecules were
added manually when visible at 1.7 A resolution. Geometric
restraints for the lactose molecule were generated in
phenix.elbow. Joint X-ray/neutron refinement was then
performed using phenix.refine (Afonine et al., 2012). All
calculations were performed on one core of an Intel Xeon
E5-2650 processor at the LUNARC Aurora cluster at Lund
University.
Upon the convergence of conventional joint refinement,
the final structure was refined for 50 steps with the neutron
crystallography patch of the Crystallography and NMR System
(Brunger et al., 1998) software (nCNS; Adams et al., 2009)
before QM refinement. We used the standard nCNS MM
force field for all atoms (protein-allhdg_d.param and
dod.param). The atom types and parameters used for lactose
are presented in Supplementary Tables S2 and S3 (however,
the lactose parameters will not affect the QM-refined results
because they cancel exactly, as will be discussed below). After
QM refinement, bulk-solvent correction and B-factor refine-
ment were performed in PHENIX. Real-space difference
density Z-scores (RSZDs) were calculated for selected struc-
tures with the EDSTATS module (Tickle, 2012) of the CCP4
software suite (Winn et al., 2011).
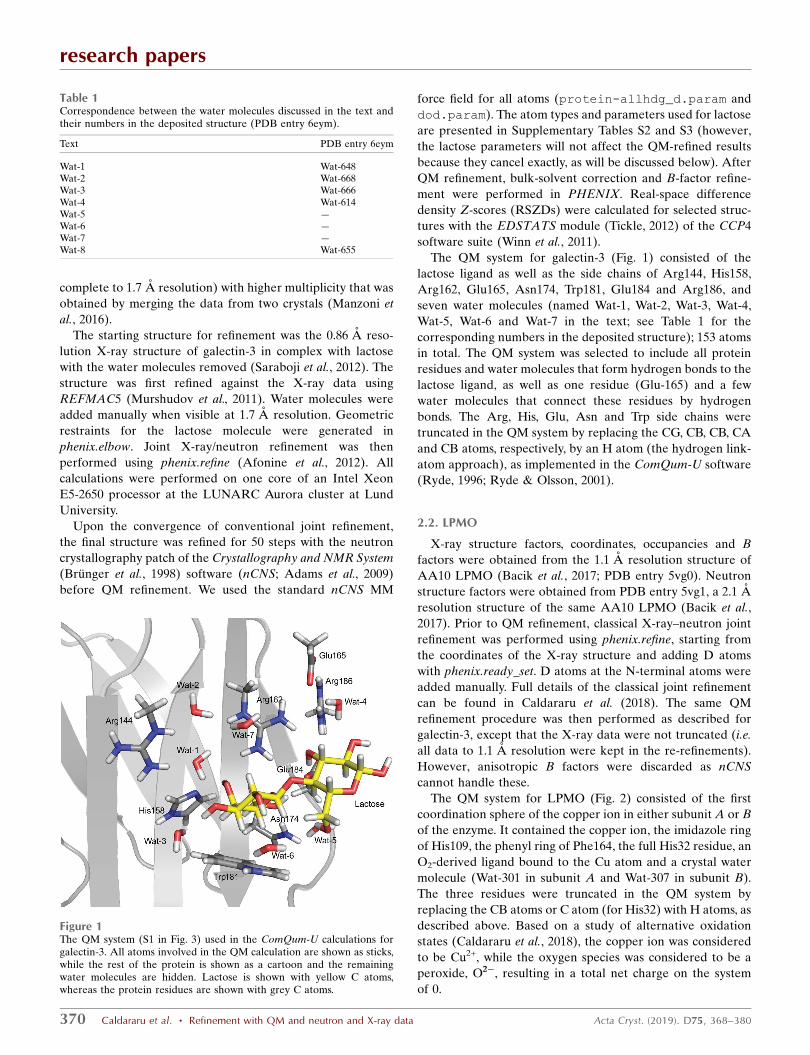
The QM system for galectin-3 (Fig. 1) consisted of the
lactose ligand as well as the side chains of Arg144, His158,
Arg162, Glu165, Asn174, Trp181, Glu184 and Arg186, and
seven water molecules (named Wat-1, Wat-2, Wat-3, Wat-4,
Wat-5, Wat-6 and Wat-7 in the text; see Table 1 for the
corresponding numbers in the deposited structure); 153 atoms
in total. The QM system was selected to include all protein
residues and water molecules that form hydrogen bonds to the
lactose ligand, as well as one residue (Glu-165) and a few
water molecules that connect these residues by hydrogen
bonds. The Arg, His, Glu, Asn and Trp side chains were
truncated in the QM system by replacing the CG, CB, CB, CA
and CB atoms, respectively, by an H atom (the hydrogen link-
atom approach), as implemented in the ComQum-U software
(Ryde, 1996; Ryde & Olsson, 2001).
2.2. LPMO
X-ray structure factors, coordinates, occupancies and B
factors were obtained from the 1.1 A resolution structure of
AA10 LPMO (Bacik et al., 2017; PDB entry 5vg0). Neutron
structure factors were obtained from PDB entry 5vg1, a 2.1 A
resolution structure of the same AA10 LPMO (Bacik et al.,
2017). Prior to QM refinement, classical X-ray–neutron joint
refinement was performed using phenix.refine, starting from
the coordinates of the X-ray structure and adding D atoms
with phenix.ready_set. D atoms at the N-terminal atoms were
added manually. Full details of the classical joint refinement
can be found in Caldararu et al. (2018). The same QM
refinement procedure was then performed as described for
galectin-3, except that the X-ray data were not truncated (i.e.
all data to 1.1 A resolution were kept in the re-refinements).
However, anisotropic B factors were discarded as nCNS
cannot handle these.
The QM system for LPMO (Fig. 2) consisted of the first
coordination sphere of the copper ion in either subunit A or B
of the enzyme. It contained the copper ion, the imidazole ring
of His109, the phenyl ring of Phe164, the full His32 residue, an
O2-derived ligand bound to the Cu atom and a crystal water
molecule (Wat-301 in subunit A and Wat-307 in subunit B).
The three residues were truncated in the QM system by
replacing the CB atoms or C atom (for His32) with H atoms, as
described above. Based on a study of alternative oxidation
states (Caldararu et al., 2018), the copper ion was considered
to be Cu2+, while the oxygen species was considered to be a
peroxide, O22�, resulting in a total net charge on the system
of 0.
research papers
370 Caldararu et al. � Refinement with QM and neutron and X-ray data Acta Cryst. (2019). D75, 368–380
Figure 1The QM system (S1 in Fig. 3) used in the ComQum-U calculations forgalectin-3. All atoms involved in the QM calculation are shown as sticks,while the rest of the protein is shown as a cartoon and the remainingwater molecules are hidden. Lactose is shown with yellow C atoms,whereas the protein residues are shown with grey C atoms.
Table 1Correspondence between the water molecules discussed in the text andtheir numbers in the deposited structure (PDB entry 6eym).
Text PDB entry 6eym
Wat-1 Wat-648Wat-2 Wat-668Wat-3 Wat-666Wat-4 Wat-614Wat-5 —Wat-6 —Wat-7 —Wat-8 Wat-655

2.3. QM calculations
The QM calculations were carried out using TURBO-
MOLE 7.0 (Furche et al., 2014). The TPSS (Tao et al., 2003)
density functional theory (DFT) method and the def2-SV(P)
basis set (Schafer et al., 1992) were used. Dispersion effects
were included with the empirical DFT-D3 approach (Grimme
et al., 2010). This approach gives reasonable geometries for
both biochemical and bioinorganic systems (Neese, 2006; Sure
& Grimme, 2015; Antony et al., 2015) and have been used in
many applications in our group (Ryde, 2016).
3. Result and discussion
3.1. Implementation
The added value of QM calculations for crystallographic
structure determination is to make the model consistent with
both the crystallographic data and the QM energy function,
avoiding the less accurate MM potential, and hence provide a
chemically more reasonable model. QM is introduced for a
small but interesting part of the structure in the QM/MM
approach. Therefore, we introduce QM calculations only in
the final steps of the structure-determination process, typically
after a standard structure refinement. This will not affect
the overall structure radically, but will provide better local
geometries, help in resolving ambiguous interpretations of the
density maps and support conclusions about unusual geome-
tries.
We decided to implement the combined QM and neutron
crystallographic refinement in the nCNS software (Adams et
al., 2009) for several reasons. Firstly, nCNS is freely available
software, providing implementation of both neutron and
joint neutron and X-ray refinement. Secondly, our previous
quantum-refinement method was implemented in the CNS
software (Brunger et al., 1998), which made the extension to
neutron crystallography straightforward. Thirdly, CNS was
originally developed from the CHARMM MM software
(Brooks et al., 2009), meaning that it consists of an open
symbolic language with existing implementation of MM force
fields, as well as facile access to and manipulation of energies
and forces, again strongly simplifying the implementation.
Crystallographic refinement is in principle a global pseudo-
energy minimization using an energy function of the form
Ecryst ¼ wXEX-ray þ wNEneutron þ EMM12; ð1Þ
where EMM12 is an MM (or another empirical or statistical)
energy function of the entire model (the meaning of the ‘12’
subscript will be apparent below when the total system is
divided into two parts), whereas EX-ray and Eneutron describe
how closely the current model reproduces the experimental
X-ray and neutron data, respectively. The latter could, in
principle, be the crystallographic R factors, but typically more
sophisticated maximum-likelihood refinement target functions
are employed (Pannu & Read, 1996; Adams et al., 1997). The
two weight factors wX and wN are needed because EMM12 is
typically in energy units, whereas the other two terms are plain
numbers. They determine the relative weights of the three
(pseudo-)energy terms so that, for example, setting wX = 0
implies that a pure neutron crystallographic refinement is
performed. Ideal values of the weight factors can be obtained
by optimization of the Rfree factor, but this is tedious for the
joint energy function and therefore they are typically deter-
mined so that the three energy terms have a similar magnitude
in a short MD simulation (Brunger & Rice, 1997; Brunger et
al., 1989; Adams et al., 1997).
QM calculations can be introduced into this energy function
by simply replacing EMM12 with a standard QM/MM energy
function (Ryde, 2016). In this, QM is employed for a restricted,
but interesting, part of the protein, called system 1 or the QM
system. MM is employed for the remaining atoms in the
considered model, called system 2 (and therefore the entire
system will be called 12, as in EMM12). Within the subtractive
QM/MM approach (Cao & Ryde, 2018), this is obtained in the
following way:
EQM=MM ¼ EQM1 þ wMMðEMM12 � EMM1Þ: ð2Þ
Here, EQM1 is the QM energy of system 1 and EMM1 is the
MM energy of the same system. The latter ensures that no
energy terms are double-counted by cancelling the MM terms
of the QM system in EMM12 (therefore, the results will not
depend on the MM parameters employed for the QM system).
wMM is a scale factor, which is needed because the statistics-
based force field in CNS (Engh & Huber, 1991) typically gives
energies that are approximately three times larger than an
energy-based force field (Ryde et al., 2002). Therefore, wMM
was always set to 1/3. In standard QM/MM with energy-based
force fields, wMM = 1 and is therefore normally omitted (Ryde,
2016).
Replacing EMM12 in (1) with EQM/MM in (2) gives the final
combined energy function:
EComQum-U ¼ wXEX-ray þ wNEneutron þ EQM1
þ wMMðEMM12 � EMM1Þ: ð3Þ
Forces were obtained from this energy function by using
analytical differentiation and employing the chain rule for the
hydrogen link-atoms (Ryde, 1996; Ryde & Olsson, 2001).
research papers
Acta Cryst. (2019). D75, 368–380 Caldararu et al. � Refinement with QM and neutron and X-ray data 371
Figure 2The QM system (S1 in Fig. 3) used in the ComQum-U calculations forLPMO.

The flow chart of the ComQum-U program is shown in
Fig. 3. It is implemented using the nCNS xn_minimize.inp
and xn_bindividual.inp files, with some simple modifi-
cations to write out crystallographic energies and forces. This
ensures that all normal crystallographic manipulations and
calculations are performed, for example bulk-solvent correc-
tions and calculations of R factors. Moreover, it was necessary
to read in and write out coordinates with a higher precision
than standard PDB files to avoid convergence problems (Ryde
et al., 2002). For calculation of the crystallographic energies
and forces the number of minimization steps was set to zero,
whereas in the relaxation step it was set to one. The maximum-
likelihood refinement target using amplitudes was employed.
A simple CNS script was also employed to calculate the EMM1
energy term. The whole quantum-refinement procedure is
driven by a Linux shell script, which is based on the
TURBOMOLE geometry-optimization script jobex (Furche
et al., 2014). Relaxation of the QM system is performed by
the relax program in TURBOMOLE, employing a Broyden–
Fletcher–Goldfarb–Shanno quasi-Newton approach. Geometry
optimizations were continued until the energy change
between two iterations was less than 2.6 J mol�1 (10–6 arbi-
trary units) and the maximum norm of the Cartesian gradients
was below 10–3 arbitrary units. A further description of the
procedure can be found at http://signe.teokem.lu.se/~ulf/
Methods/comqum_u.html, and the interface can be provided
by the authors upon request (but note that nCNS and
TURBOMOLE need to be installed separately and that a
licence for TURBOMOLE is required). A typical re-refine-
ment of the galectin-3 test system required around 150 QM
energy and gradient calculations, which took about 5 h on a
single processor, whereas re-refinement of the smaller LPMO
test system required only around 90 QM energy and gradient
calculations, which took about 2 h on a single processor.
Standard crystallographic refinement is performed without
any electrostatic MM term. For X-ray data this is natural
because the positions of the H atoms are normally unknown
and the electrostatics of hydrogen bonds strongly depend on
the hydrogen positions. For neutron structures, the positions
of most (but typically not all) H (D) atoms are known, but
the refinement is still traditionally performed without any
electrostatics. To make the results compatible with the data
obtained with standard refinement, we decided to exclude
electrostatics from the calculations. However, it should be
noted that electrostatics can easily be included in the energy
function using MM atomic charges in EMM12 and a point-
charge model of the protein in EQM1. The effect of electro-
statics will be evaluated in a future study. Finally, it should be
noted that QM calculations naturally involve electrostatics
and the positions of all H atoms within the QM system need to
be included.
3.2. Performance on galectin-3
The performance of the ComQum-U program was exam-
ined by re-refining a preliminary, unpublished 1.7 A resolution
neutron structure of lactose bound to the perdeuterated
carbohydrate-recognition domain of galectin-3. The structure
was originally refined jointly against X-ray and neutron data
from the same crystal to 1.7 A resolution using phenix.refine
(Afonine et al., 2012) and was briefly re-refined with nCNS
(Adams et al., 2009) before running the quantum refinement.
We included the lactose ligand, eight nearby amino-acid side
chains and seven water molecules in the QM system, as shown
in Fig. 1 (a total of 153 atoms).
We first checked that the program worked properly by
refining the structure with varying values of the weight factors
wX and wN in (1)–(3) from 0 to 10. By setting wX = wN = 0,
we essentially obtain a QM/MM structure of the active site,
although with the CNS MM force field and without any
electrostatics. This gives a rather poor structure in terms of the
crystallographic R factors (0.25/0.23, 0.21/0.19; these four
values are Rfree/R first for the neutron data and then for the
X-ray data).
Next, we performed refinements with 8 � 8 different values
of the weight factors wX and wN (0, 0.01, 0.03, 0.1, 0.3, 1, 3 and
10). The resulting R values are shown in Fig. 4 and Supple-
mentary Table S1. It can be seen that the best R value for the
neutron data (0.214) was obtained for the largest wN = 10, as
expected. It increased slightly when wX was increased. Like-
wise, the best R value for the X-ray data (0.179) was obtained
for the largest wX = 10. However, the best values of Rfree for
both the neutron and X-ray data (0.233 and 0.207, respec-
tively) are obtained at intermediate values at around wN = 1
and wX = 3. This shows that the refinement function works
properly and that optimum values of the two weight factors
can be obtained by optimizing the two Rfree values, although
the surfaces are quite flat. Performing an additional bulk-
solvent correction and B-factor refinement in PHENIX
decreased the Rfree values to 0.179 for the X-ray data and 0.215
for the neutron data (Table 2), which is comparable to the
value of 0.211 obtained from phenix.refine alone.
In Fig. 5, we compare structures refined without QM, as well
as with QM with the optimum weights wN = 1 and wX = 3. It
can be seen that the largest movements are observed for the D
atoms, in particular those of water molecules, whereas the
heavy atoms typically remain at the same positions.
For example, one of the largest changes is observed for the
weakly bound water molecule 5, which shows quite unusual
research papers
372 Caldararu et al. � Refinement with QM and neutron and X-ray data Acta Cryst. (2019). D75, 368–380
Figure 3Flow chart of the ComQum-U program. S1 and S2 denotes systems 1 and2. Steps in bold constitute the actual ComQum-U interface. Steps in italicsare performed by the crystallographic refinement program (nCNS),whereas those that are underlined are run by the QM program. The wholeprocedure is driven by a Linux shell script.

hydrogen bonds in the original structure, with one D atom
directed towards the side-chain DB atom of Trp181 (2.26 A)
and the other D atom pointing towards the solvent (Fig. 6a). In
the QM-refined structure, this water molecule rotates by 90�
so that the deuterons are directed towards the O6 atom of
lactose (2.39 A) and one of the OE atoms of Glu184 (2.39 A).
In both cases, the water molecule also receives a hydrogen
bond from the DO60 atom of lactose (2.11 and 2.27 A,
respectively).
Wat-6 is also weakly bound and shows large changes in the
positions of the D atoms (Fig. 6b). In the original structure
it does not form any hydrogen bonds. Instead, one of the
deuterons is only 2.48 A from DE1 of Trp181, in a seemingly
unfavourable interaction. In the QM-refined structures Wat-6
rotates so that it donates a hydrogen bond to O60 of lactose. In
both cases, it also receives a hydrogen bond from the DO2
atom of lactose, but this interaction is also significantly
improved in the QM-refined structure, with a D–O distance of
1.80 A compared with 2.06 A.
Wat-7 also shows a rather large reorganization (Fig. 6c). In
the original structure one of the D atoms points towards the D
atom of another water molecule (Wat-2, 1.69 A). In the QM-
refined structure this D atom instead points towards lactose
(but without forming any particular hydrogen bond) so that
the O atom can receive a strong hydrogen bond from Wat-2
(D–O distance of 1.72 A).
Finally, Wat-4 also experiences a reorganization of the
hydrogen-bond network (Fig. 6d). In the original structure one
of the D atoms points towards the solution. However, in the
QM-refined structure it instead forms a strong hydrogen bond
to the OE2 atom of Glu-165 (1.84 A). In both cases the other
D atom forms a hydrogen bond to O20 of lactose, although it is
shortened by 0.1 A in the QM/MM structure (from 1.99 to
1.86 A). Thereby, it bridges the interaction between Glu-165
and the ligand.
In the ligand, the DO10 atom shows the largest movement,
with an �100� change in the DO10—O10—C10—C20 dihedral
angle (Fig. 5). This is probably to relieve a short contact
research papers
Acta Cryst. (2019). D75, 368–380 Caldararu et al. � Refinement with QM and neutron and X-ray data 373
Figure 4The dependence of the R factors on the weight factors wN and wX in the refinement of galectin-3 (see equation 3): (a) RN
free, (b) RN, (c) RXfree and (d) RX.
The raw data are given in Supplementary Table S1.

between DO10 and DO20 (2.05 A). However, in neither the
original structure nor in the QM-refined structure does DO10
form any hydrogen bond to the surroundings (it is solvent-
exposed, but there are no visible water molecules close to it).
The movement of DO20 is negligible.
The other atoms in both the ligand and the protein show
only smaller adjustments within the same local minimum,
typically to improve hydrogen-bond interactions. For example,
DO4 in lactose moves by 0.70 A to shorten the hydrogen-bond
distance to NE2 of His158 from 2.16 to 1.68 A (Fig. 5). The
largest movement of a protein atom is that of DH12 of
Arg144, which moves to improve the hydrogen bond to a
water molecule (Wat-1) from 1.77 to 1.62 A, as shown in
Fig. 6(e). On average, the protein atoms in the QM system
move by only 0.06–0.17 A, again with the largest movement
for Arg144.
If we instead compare the best QM-refined structure with a
pure QM/MM structure, obtained with wN = wX = 0, much
larger movements are observed, as can be seen in Fig. 7. In
fact, the median movement of the atoms in the QM system is
0.5 A, compared with 0.1 A for the QM-refined structure. For
most residues this represents a slight change (rotation or tilt)
in the orientation of the amino-acid side chains. However,
several water molecules move by up to 1.8 A and several
lactose atoms also move significantly (up to 1.7 A for O10 and
DO10). This larger movement of course reflects that lactose
and water are not as restrained by the surrounding structure as
the amino-acid side chains, which are kept in place by the
backbone atoms (which were kept fixed in the optimization).
However, as can be seen from the figure, the water molecules
move away from the electron and neutron densities, illus-
trating the advantage of the joint QM refinement. The
discrepancy between the QM/MM and experimental data is
caused by the fact that the latter include dynamics and
entropy, as well as the averaged effects of the surrounding
solvent, but also disorder in the crystal.
Next, we studied the deposited neutron structure of lactose
bound to galectin 3 (PDB entry 6eym), which has a higher
completeness of the neutron data and was previously joint-
refined in PHENIX 1.12. Compared with the preliminary
structure, the deposited structure contains fewer water mole-
cules around the lactose molecule (Fig. 8). Interestingly, three
of the four water molecules (Wat-5, Wat-6 and Wat-7) that
showed large reorganization after quantum refinement are
absent in the more conservatively interpreted deposited
structure, suggesting that these water molecules were not well
ordered in the original structure. Nuclear difference density
for these waters can be seen in PDB entry 6eym at low contour
levels. Moreover, Wat-4 in the deposited structure is in the
orientation suggested by quantum refinement of the first
structure, proving that QM refinement of the preliminary
structure found the correct orientation of this water molecule.
We also performed quantum refinement of the deposited
structure, including only five water molecules in the QM
system: Wat-1, Wat-2, Wat-3, Wat-4 and Wat-8 (see Table 1 for
the corresponding water numbers in the deposited structure,
PDB entry 6eym). Wat-8, which was not present in the preli-
minary structure, forms hydrogen bonds to Wat-3 and lies
close to Trp181. The lactose molecule also shows a different
orientation of two D atoms, DO4 and DO20. Strikingly, in the
deposited structure the DO4 atom is close to the position in
the quantum refinement of the preliminary structure. No
protein residues show any significant reorientation between
the two structures.
The joint QM refinement of the deposited structure, using
the optimized weights from the previous QM refinement,
wN = 1 and wX = 3, gave an Rfree of 0.211 for the neutron data
and 0.156 for the X-ray data (after bulk-solvent correction and
B-factor refinement in PHENIX). However, with these
weights several atoms move out of the nuclear density after
quantum refinement, for example Wat-1, Wat-2 and the ligand
DO2 atom (Fig. 9a). Therefore, we performed two sets of
weight searches starting from two relative weights: wX/wN = 3,
which were the weights used in the preliminary structure, and
wX/wN = 1 as used in Manzoni et al. (2018). We used a linear
research papers
374 Caldararu et al. � Refinement with QM and neutron and X-ray data Acta Cryst. (2019). D75, 368–380
Table 2Structure quality of the two galectin-3 structures before and after QMrefinement, with wN = 1 and wX = 3 for the preliminary structure andwN = 7 and wX = 7 for the deposited structure.
Rwork and Rfree were calculated in nCNS. Geometry statistics were calculatedwith MolProbity.
Preliminary Deposited
Before After Before After
Rwork (X-ray) 0.181 0.179 0.189 0.189Rfree (X-ray) 0.208 0.207 0.195 0.195Rwork (neutron) 0.221 0.216 0.219 0.218Rfree (neutron) 0.238 0.233 0.221 0.221R.m.s.d., bonds (A) 0.021 0.022 0.011 0.018R.m.s.d., angles (�) 1.9 1.9 1.7 1.7Ramachandran favoured (%) 98.5 98.5 97.1 98.5Ramachandran allowed (%) 3.3 1.5 2.9 1.5Ramachandran outliers (%) 0.0 0.0 0.0 0.0Rotamer outliers (%) 0.8 0.8 0.0 0.0All-atom clashscore 4.87 3.10 4.00 1.77
Figure 5Structure before (green) and after (C atoms in yellow) QM refinement ofthe preliminary galectin-3 structure with wN = 1 and wX = 3. Proteinresidues are hidden for clarity (they basically do not move).

research papers
Acta Cryst. (2019). D75, 368–380 Caldararu et al. � Refinement with QM and neutron and X-ray data 375
Figure 6Significant movement of four water molecules and one protein residue in the QM refinement of the preliminary neutron structure of galectin-3: Wat-5(a), Wat-6 (b), Wat-7 (c), Wat-4 (d) and Arg144 (e). Atoms are shown in green before and red/white after QM refinement. The nuclear 2m|Fo| � D|Fc|density is shown in light blue at 1.0� and in dark blue at 0.7� (for the less well ordered water molecules Wat-5 and Wat-6).
search from wN = wX = 1 to wN = wX = 10 and from wN = 1 and
wX = 3 to wN = 10 and wX = 30, respectively. In order to
compare the quality of the resulting structures, we calculated
the maximum absolute RSZD values of lactose and water
molecules from the neutron maps, which measure the local
accuracy of the model, being sensitive to local discrepancies.
As can be seen in Table 3, the structure obtained from QM
refinement with wN = wX = 7 fits the crystallographic data best,
with the RSZDs of Wat-1 and the lactose molecule being over
one unit lower than in QM refinements using lower weights.
However, other weights can be used to obtain structures
of similar quality, for example structures obtained with wN =
wX = 6 or wN = 5 and wX = 15 give rise to similar RSZD values
of the residues in the quantum system. The Rfree values of the
resulting structures do not change compared with those
obtained from the QM refinement with wN = 1 and wX = 3

(0.213 and 0.159; Table 2). For the higher values of the two
weights the improvement in the RSZD scores is small and for
weights of higher than 10 convergence problems appeared in
the QM calculations.
Fig. 9(b) shows a comparison between the original depos-
ited structure and the QM-refined structure with wN = wX = 7
(virtually identical results were also obtained with wN = 5 and
wX = 15). As in the QM refinement of the preliminary struc-
ture, the largest movements are observed for D atoms,
although to a smaller degree, as the neutron data are of higher
quality than in the preliminary structure. The water molecules
still change their orientation to form more favourable
research papers
376 Caldararu et al. � Refinement with QM and neutron and X-ray data Acta Cryst. (2019). D75, 368–380
Figure 7Positions of lactose and the water molecules in QM/MM structuresoptimized without (wX = wN = 0, green) or with restraints to thecrystallographic data (wN = 1, wX = 3). The 2m|Fo| � D|Fc| electrondensity at 1.0� is shown as a blue grid and the nuclear 2m|Fo| � D|Fc|density at 1.0� is shown as a violet surface.
Figure 8Overlay of the deposited galectin-3 structure (PDB entry 6eym, blue;Manzoni et al., 2018) and the preliminary structure before (green) andafter (yellow) QM refinement. Protein residues are hidden for clarity.
Figure 9Overlay of the deposited galectin-3 structure before (blue) and after QMrefinement with (a) wX = 3 and wN = 1 (C atoms in magenta) and (b) wX =wN = 7 (C atoms in orange). The nuclear 2m|Fo| � D|Fc| density at 0.8� isshown in blue. Protein residues are hidden for clarity.
Table 3Maximum absolute RSZD of the lactose molecule and of the five watermolecules included in the QM refinement of the deposited galectin-3structure obtained with different weights of the experimental data (wN
and wX).
Note that wX/wN = 1 (left part of table) or 3 (right part).
wN 1 2 3 4 5 6 7 8 9 10 1 2 5 10
wX 1 2 3 4 5 6 7 8 9 10 3 6 15 30
Lactose 0.6 0.8 0.8 0.4 0.3 0.3 0.2 0.8 0.2 2.8 1.5 1.6 0.2 0.2Wat-1 1.5 1.5 1.2 0.6 0.4 0.1 0.0 1.6 0.1 0.1 1.4 1.1 0.1 0.1Wat-2 0.9 0.9 0.9 0.6 0.8 0.7 0.7 0.9 0.9 1.0 1.0 0.9 1.0 1.4Wat-3 1.2 0.8 0.8 0.9 0.8 0.8 0.8 0.9 0.8 0.7 0.9 1.0 0.9 0.8Wat-4 1.9 1.6 1.5 1.3 1.1 0.9 0.8 1.6 0.6 0.6 1.1 0.9 0.6 0.5Wat-8 0.8 0.8 0.8 0.6 0.6 0.8 0.9 0.7 1.1 1.1 0.5 0.5 0.9 0.9Sum 6.9 6.4 6.0 4.4 4.0 3.6 3.4 6.5 3.7 6.3 6.4 6.0 3.7 3.9

hydrogen bonds, suggesting that QM refinement can also
improve structures of high quality.
One such movement is observed for Wat-2. The QM
refinement orients its O atom to form a hydrogen bond to
Arg-144 (Fig. 10a), as in the QM refinement of the preliminary
structure. The new water molecule introduced into the QM
system (Wat-8) also rotates slightly so that one D atom now
points towards solution.
In the ligand, several D atoms show small adjustments to
form more favourable hydrogen bonds: DO3 to Wat-3, DO4 to
His158 and DO30 to Glu184. The QM refinement is particu-
larly important for the conformation of the DO4 atom, as the
nuclear density does not permit an unambiguous assignment
of its position (Fig. 10b). DO2 shows the largest movement,
but it does not form a hydrogen bond, as the water molecule
that it was hydrogen-bonded to in the preliminary structure
(Wat-6) is not present in the deposited structure. The protein
atoms do not show any significant changes in their position, as
in the first QM refinement.
To check that the QM refinement had not deteriorated the
protein structure, validation statistics were calculated with
MolProbity for the final structures (wN = 1 and wX = 3 for the
preliminary structure and wN = wX = 7 for the deposited
structure). As can be seen in Table 2, the structures show the
same quality as before QM refinement, whereas the R/Rfree
values show a small improvement when compared with the
R/Rfree values obtained from the standard re-refinement
performed in nCNS.
Finally, we checked that the results are not sensitive to the
starting coordinates by randomly modifying the coordinates
by up to 0.1 A (using phenix.pdbtools) in the QM system and
reperforming the QM refinement. This led to the same
optimum structure (r.m.s.d. difference of the QM system of
0.05 A). Therefore, the water movements reported in this
article are outside the statistical uncertainty of the results.
3.3. Application to lytic polysaccharide monooxygenase(LPMO)
The primary use of quantum refinement is for systems for
which the standard chemical restraints can be expected to be
poor (for example metal sites or nonstandard ligands or
inhibitors) or where standard refinement gives ambiguous
results. To illustrate such a typical application, we have also
tested the method on the neutron structure of a copper-
containing metalloenzyme, LPMO. In a recent study, Bacik
and coworkers suggested that in subunit B of the enzyme the
terminal N atom, which coordinates the Cu atom, is partially
deprotonated (Bacik et al., 2017). This was supported by the
presence of an asymmetric nuclear difference-density peak
around the N-terminal atom. However, the interpretation is
rather ambiguous, as the model was only refined against
neutron data at 2.1 A resolution and the N-terminal deuterons
were not modelled explicitly in the structure. Therefore, in
order to discern whether a protonated or deprotonated
N-terminus fits the data better, we performed joint QM
refinement against both X-ray and neutron data. This is
suitable as the space groups and unit-cell parameters of both
the X-ray and neutron crystals are nearly identical.
To determine the optimum weights, we performed a similar
linear search to that performed for the deposited galectin
structure. We kept the relative weight factors with wX/wN = 1
(which are the default in phenix.refine) and increased them
stepwise from wX = 1 to wX = 10. We then compared the
RSZD scores of the residues in the quantum system (including
the Cu atom and the peroxide molecule). All calculations were
performed on subunit A, as this showed no ambiguity in the
protonation of the N-terminus. As can be seen in Table 4,
different weights did not change the fit of the structure to the
data, with all RSZD scores being almost identical for the
various weights. This is not completely surprising, as the QM
system is quite rigid and the data quality is worse than for the
galectin structure. However, if the weights are further
decreased (wN = wX = 0.1 or smaller) the RSZD increases
significantly, showing that the structure becomes too biased
towards QM.
research papers
Acta Cryst. (2019). D75, 368–380 Caldararu et al. � Refinement with QM and neutron and X-ray data 377
Figure 10Movement of water molecule Wat2 (a) and of the DO4 atom in thelactose molecule (b) in order to form more favourable hydrogen bondsafter QM refinement of the deposited structure with wX = wN = 7. Thenuclear 2m|Fo| � D|Fc| density at 1.0� is shown in blue.

Therefore, we selected wN = wX = 1 (which gave the lowest
RSZD scores and will not bias the structure towards either
the QM or the crystallographic data) and performed a QM
refinement with subunit B in the quantum system. We
compared the results of using two different models, one with
the N-terminus protonated (i.e. modelled as –ND2) and the
other deprotonated (i.e. modelled as –ND–). Fig. 11 clearly
shows a positive difference density close to the N-terminus in
the deprotonated model (green grid in the centre of Fig. 11b),
indicating that modelling the N-terminus as a protonated
–ND2 group is a better interpretation of the joint neutron and
X-ray data. A more in-depth discussion of these calculations
and their implication for the biological function of the enzyme
has been published elsewhere (Caldararu et al., 2018).
The refinement statistics for the final QM-refined structure
are shown in Table 5. As for the galectin structure, the overall
structure of the protein keeps its integrity and the R/Rfree
values are slightly improved compared with those calculated
with nCNS before the QM refinement.
4. Conclusions
In this study, we have implemented the combination of joint
neutron and X-ray crystallographic refinement with QM/MM
calculations. We have combined the freely available nCNS
software (Adams et al., 2009) with the QM software
TURBOMOLE (Furche et al., 2014). We have applied the
method to a recent neutron structure of lactose bound to the
carbohydrate-recognition domain of galectin-3 (Manzoni et
al., 2018), and to the active site of LPMO (Caldararu et al.,
2018). We show that the method behaves properly and that we
can use the two weight factors wN and wX to bias the structure
towards the neutron data, the X-ray data or the QM structure.
We can obtain an ideal compromise between the QM and the
crystallographic methods by monitoring the RSZD values of
residues in the QM system (see Tables 3 and 4), whereas
optimizing the crystallographic
Rfree values seems to give less
reliable results.
The approach allows us to
identify and remove problems in
the corresponding structure opti-
mized with conventional methods
without the use of QM. In parti-
cular, the description of the
hydrogen-bonding pattern is
improved, with a level of detail
and confidence that is not
possible with standard refine-
ment. For the solvent-accessible
binding site in galectin-3, it is
primarily the solvent molecules
and the D atoms of the ligand
that are improved by QM refine-
ment. In several cases, the
hydrogen-bonding pattern was
modified to avoid steric clashes or
to improve the hydrogen-bond
strengths. For LPMO, we show
research papers
378 Caldararu et al. � Refinement with QM and neutron and X-ray data Acta Cryst. (2019). D75, 368–380
Figure 11Structure and nuclear density maps of the active site of LPMO in subunit B after QM refinement. (a) TheN-terminus in the protonated –ND2 form and (b) the N-terminus in the deprotonated ND– form. The2m|Fo|�D|Fc| nuclear density at 1.0� is shown as a blue grid and m|Fo|�D|Fc| nuclear difference density isshown at 3.0� (green grid) and �3.0� (red grid).
Table 5Structure quality of the LPMO structure before and after QM refinementwith the active site in subunit B with two deuterons on the N-terminus asthe QM system.
Rwork and Rfree were calculated in nCNS. Geometry statistics were calculatedwith MolProbity.
Before After
Rwork (X-ray) 0.161 0.150Rfree (X-ray) 0.164 0.153Rwork (neutron) 0.243 0.237Rfree (neutron) 0.248 0.244R.m.s.d., bonds (A) 0.009 0.008R.m.s.d., angles (�) 0.9 0.9Ramachandran favoured (%) 98.5 99.2Ramachandran allowed (%) 1.5 0.8Ramachandran outliers (%) 0.0 0.0Rotamer outliers (%) 0.0 0.0All-atom clashscore 1.82 2.93
Table 4Maximum absolute RSZD of the residues in the QM system in the QMrefinement of subunit A of the LPMO structure obtained with differentweights of the experimental data (wN and wX).
Note that wX/wN = 1 in all refinements.
wN 0.001 0.01 0.1 1 2 3 4 5 6 7 8 9 10
wX 0.001 0.01 0.1 1 2 3 4 5 6 7 8 9 10
Copper 1.2 1.2 1.2 1.2 1.2 1.3 1.2 1.2 1.2 1.2 1.2 1.2 1.2Peroxide 0.1 0.1 0.1 0.1 0.1 0.1 0.1 0.1 0.1 0.1 0.1 0.1 0.1His32 2.5 2.4 2.1 0.7 0.7 0.7 0.7 0.8 0.8 0.8 0.8 0.8 0.8His109 1.0 1.0 0.9 0.2 0.2 0.2 0.3 0.3 0.3 0.3 0.3 0.3 0.3Phe164 0.5 0.5 0.5 0.5 0.5 0.5 0.5 0.5 0.5 0.5 0.5 0.5 0.5Wat-301 0.9 0.9 0.9 0.9 0.9 0.9 0.9 0.9 0.9 0.9 0.9 0.9 0.9Sum 6.2 6.1 5.7 3.6 3.6 3.7 3.7 3.8 3.8 3.8 3.8 3.8 3.8

that the method can be used to determine the protonation
states of interesting residues by comparing the structures
refined in the different states. Of course, the improvements are
most important when the experimental data are poorer, as the
QM refinements of the preliminary structures of galectin-3
and of LPMO showed.
There is no significant difference in either the R values or
the density maps between the normal and QM-refined struc-
tures, which means that both models essentially fit the crys-
tallographic data equally well. However, the QM-refined
models include more sophisticated chemical information and
hence allow more confidence in drawing functional or
mechanistic conclusions from the structure.
Naturally, this improvement comes with an additional cost.
The QM refinements took around 5 h each, whereas standard
neutron/X-ray refinement takes only a few minutes (both on a
single processor). On the other hand, the QM system was
quite large for the solvent-exposed site of galectin-3 (153
atoms). However, the method is intended to be used primarily
at the end of the refinement procedure and only for sites of
particular interest, as shown in the application to LPMO.
Moreover, some hours of calculation are not much compared
with the time required to grow the large crystals that are
needed for neutron crystallography or even with the data-
collection time.
A limitation of the present QM refinement approach is that
it can only model a single conformation of the atoms in the
QM system. This means that if a D atom or a water molecule
may form several different hydrogen bonds of similar stability,
the QM refinement will probably converge to one of these,
typically that favoured by enthalpic factors and by the QM
hydrogen-bond energy, unless the density maps show that the
D atom is clearly in between. Naturally, this problem can be
solved by simply using two separate QM calculations, one for
each conformation, but this would double the computational
cost and give an exponential increase in the number of QM
systems if there is more than one alternative conformation.
A related problem is that the QM-refined structures will be
biased towards the formation of hydrogen bonds within the
QM system. The reason for this is that there are no electro-
static interactions with the MM surroundings in the current
implementation (following the convention of neutron and
X-ray crystallography). The user needs to remember this
problem when interpreting the structures. Technically, it is
trivial to turn on the electrostatics in the calculations.
However, this would introduce several conceptual problems.
Firstly, the calculations will no longer be directly comparable
with standard refinement, making the comparison more
complicated. Secondly, all D atoms are not unambiguously
discernible in the neutron structure. However, the electro-
statics strongly depend on the position of these atoms, at least
the polar D atoms. This makes it necessary to guess the
positions of all D atoms. This can in principle be performed
with standard MM software. However, it means that the final
structure will be a mixture of observed and speculated atomic
positions. Thirdly, alternative conformations will again be a
problem, because the QM atoms can only interact with one set
of charges. For these reasons, we have decided to not include
electrostatics in this first version of the QM refinement
procedure.
Acknowledgements
The computations were performed on computer resources
provided by the Swedish National Infrastructure for
Computing (SNIC) at LUNARC at Lund University.
Funding information
This investigation has been supported by grants from the
Swedish Research Council (projects 2014-5540 and 2018-
05003), from the Knut and Alice Wallenberg Foundation
(KAW 2013.0022), the Royal Physiographic Society in Lund,
from the European Spallation Source ERIC and from
eSSENCE: the e-science collaboration.
References
Adams, P. D., Mustyakimov, M., Afonine, P. V. & Langan, P. (2009).Acta Cryst. D65, 567–573.
Adams, P. D., Pannu, N. S., Read, R. J. & Brunger, A. T. (1997). Proc.Natl Acad. Sci. USA, 94, 5018–5023.
Afonine, P. V., Grosse-Kunstleve, R. W., Echols, N., Headd, J. J.,Moriarty, N. W., Mustyakimov, M., Terwilliger, T. C., Urzhumtsev,A., Zwart, P. H. & Adams, P. D. (2012). Acta Cryst. D68, 352–367.
Afonine, P. V., Mustyakimov, M., Grosse-Kunstleve, R. W., Moriarty,N. W., Langan, P. & Adams, P. D. (2010). Acta Cryst. D66, 1153–1163.
Antony, J., Sure, R. & Grimme, S. (2015). Chem. Commun. 51, 1764–1774.
Bacik, J.-P., Mekasha, S., Forsberg, Z., Kovalevsky, A. Y., Vaaje-Kolstad, G., Eijsink, V. G. H., Nix, J. C., Coates, L., Cuneo, M. J.,Unkefer, J. & Chen, J. C.-H. (2017). Biochemistry, 56, 2529–2532.
Blakeley, M. P. (2009). Crystallogr. Rev. 15, 157–218.Blakeley, M. P., Teixeira, S. C. M., Petit-Haertlein, I., Hazemann, I.,
Mitschler, A., Haertlein, M., Howard, E. & Podjarny, A. D. (2010).Acta Cryst. D66, 1198–1205.
Borbulevych, O., Martin, R. I., Tickle, I. J. & Westerhoff, L. M. (2016).Acta Cryst. D72, 586–598.
Borbulevych, O. Y., Plumley, J. A., Martin, R. I., Merz, K. M. &Westerhoff, L. M. (2014). Acta Cryst. D70, 1233–1247.
Brooks, B. R., Brooks, C. L., MacKerell, A. D., Nilsson, L., Petrella,R. J., Roux, B., Won, Y., Archontis, G., Bartels, C., Boresch, S.,Caflisch, A., Caves, L., Cui, Q., Dinner, A. R., Feig, M., Fischer, S.,Gao, J., Hodoscek, M., Im, W., Kuczera, K., Lazaridis, T., Ma, J.,Ovchinnikov, V., Paci, E., Pastor, R. W., Post, C. B., Pu, J. Z.,Schaefer, M., Tidor, B., Venable, R. M., Woodcock, H. L., Wu, X.,Yang, W., York, D. M. & Karplus, M. (2009). J. Comput. Chem. 30,1545–1614.
Brunger, A. T., Adams, P. D., Clore, G. M., DeLano, W. L., Gros, P.,Grosse-Kunstleve, R. W., Jiang, J.-S., Kuszewski, J., Nilges, M.,Pannu, N. S., Read, R. J., Rice, L. M., Simonson, T. & Warren, G. L.(1998). Acta Cryst. D54, 905–921.
Brunger, A. T., Karplus, M. & Petsko, G. A. (1989). Acta Cryst. A45,50–61.
Brunger, A. T. & Rice, L. M. (1997). Methods Enzymol. 277, 243–269.Caldararu, O., Oksanen, E., Ryde, U. & Hedegard, E. D. (2018).
Chem. Sci. 10, 576–586.Cao, L. & Ryde, U. (2018). Front. Chem. 6, 89.Coppens, P. (1967). Science, 158, 1577–1579.Cruickshank, D. W. J. (1999). Acta Cryst. D55, 583–601.Delacour, D., Koch, A. & Jacob, R. (2009). Traffic, 10, 1405–1413.Engh, R. A. & Huber, R. (1991). Acta Cryst. A47, 392–400.
research papers
Acta Cryst. (2019). D75, 368–380 Caldararu et al. � Refinement with QM and neutron and X-ray data 379

Fisher, S. Z., Anderson, S., Henning, R., Moffat, K., Langan, P.,Thiyagarajan, P. & Schultz, A. J. (2007). Acta Cryst. D63, 1178–1184.
Furche, F., Ahlrichs, R., Hattig, C., Klopper, W., Sierka, M. &Weigend, F. (2014). WIREs Comput. Mol. Sci. 4, 91–100.
Genoni, A., Bucinsky, L., Claiser, N., Contreras-Garcıa, J., Dittrich,B., Dominiak, P. M., Espinosa, E., Gatti, C., Giannozzi, P., Gillet,J.-M., Jayatilaka, D., Macchi, P., Madsen, A. Ø., Massa, L., Matta,C. F., Merz, K. M. Jr, Nakashima, P. N. H., Ott, H., Ryde, U.,Schwarz, K., Sierka, M. & Grabowsky, S. (2018). Chem. Eur. J. 24,10881–10905.
Grigorian, A. & Demetriou, M. (2010). Methods Enzymol. 480, 245–266.
Grimme, S., Antony, J., Ehrlich, S. & Krieg, H. (2010). J. Chem. Phys.132, 154104.
Harris, P. V., Xu, F., Kreel, N. E., Kang, C. & Fukuyama, S. (2014).Curr. Opin. Chem. Biol. 19, 162–170.
Hsiao, Y., Sanchez-Garcia, E., Doerr, M. & Thiel, W. (2010). J. Phys.Chem. B, 114, 15413–15423.
Johannes, L., Jacob, R. & Leffler, H. (2018). J. Cell Sci. 131, jcs208884.Leffler, H., Carlsson, S., Hedlund, M., Qian, Y. & Poirier, F. (2002).
Glycoconj. J. 19, 433–440.Liu, F.-T. & Rabinovich, G. A. (2010). Ann. N. Y. Acad. Sci. 1183,
158–182.MacKinnon, A. C., Farnworth, S. L., Hodkinson, P. S., Henderson, N.
C., Atkinson, K. M., Leffler, H., Nilsson, U. J., Haslett, C., Forbes,S. J. & Sethi, T. (2008). J. Immunol. 180, 2650–2658.
Manzoni, F., Saraboji, K., Sprenger, J., Kumar, R., Noresson, A.-L.,Nilsson, U. J., Leffler, H., Fisher, S. Z., Schrader, T. E., Ostermann,A., Coates, L., Blakeley, M. P., Oksanen, E. & Logan, D. T. (2016).Acta Cryst. D72, 1194–1202.
Manzoni, F., Wallerstein, J., Schrader, T. E., Ostermann, A., Coates,L., Akke, M., Blakeley, M. P., Oksanen, E. & Logan, D. T. (2018). J.Med. Chem. 61, 4412–4420.
Murshudov, G. N., Skubak, P., Lebedev, A. A., Pannu, N. S., Steiner,R. A., Nicholls, R. A., Winn, M. D., Long, F. & Vagin, A. A. (2011).Acta Cryst. D67, 355–367.
Neese, F. (2006). J. Biol. Inorg. Chem. 11, 702–711.Nilsson, K., Lecerof, D., Sigfridsson, E. & Ryde, U. (2003). Acta Cryst.
D59, 274–289.Nilsson, K. & Ryde, U. (2004). J. Inorg. Biochem. 98, 1539–1546.Orpen, A. G., Pippard, D., Sheldrick, G. M. & Rouse, K. D. (1978).
Acta Cryst. B34, 2466–2472.Pannu, N. S. & Read, R. J. (1996). Acta Cryst. A52, 659–668.Quinlan, R. J., Sweeney, M. D., Lo Leggio, L., Otten, H., Poulsen,
J. N., Johansen, K. S., Krogh, K. B. R. M., Jørgensen, C. I., Tovborg,M., Anthonsen, A., Tryfona, T., Walter, C. P., Dupree, P., Xu, F.,
Davies, G. J. & Walton, P. H. (2011). Proc. Natl Acad. Sci. USA, 108,15079–15084.
Rabinovich, G. A., Liu, F.-T., Hirashima, M. & Anderson, A. (2007).Scand. J. Immunol. 66, 143–158.
Reynolds, C. H. (2014). ACS Med. Chem. Lett. 5, 727–729.Rulısek, L. & Ryde, U. (2006). J. Phys. Chem. B, 110, 11511–
11518.Ryde, U. (1996). J. Comput. Aided Mol. Des. 10, 153–164.Ryde, U. (2007). Dalton Trans., pp. 607–625.Ryde, U. (2016). Methods Enzymol. 577, 119–158.Ryde, U. & Nilsson, K. (2003). J. Am. Chem. Soc. 125, 14232–
14233.Ryde, U., Olsen, L. & Nilsson, K. (2002). J. Comput. Chem. 23, 1058–
1070.Ryde, U. & Olsson, M. H. M. (2001). Int. J. Quantum Chem. 81, 335–
347.Saraboji, K., Hakansson, M., Genheden, S., Diehl, C., Qvist, J.,
Weininger, U., Nilsson, U. J., Leffler, H., Ryde, U., Akke, M. &Logan, D. T. (2012). Biochemistry, 51, 296–306.
Schafer, A., Horn, H. & Ahlrichs, R. (1992). J. Chem. Phys. 97, 2571–2577.
Sears, V. F. (1986). Methods Exp. Phys. 23A, 521–550.Soderhjelm, P. & Ryde, U. (2006). J. Mol. Struct. Theochem, 770, 199–
219.Sure, R. & Grimme, S. (2015). J. Chem. Theory Comput. 11, 3785–
3801.Tao, J., Perdew, J. P., Staroverov, V. N. & Scuseria, G. E. (2003). Phys.
Rev. Lett. 91, 146401.Tickle, I. J. (2012). Acta Cryst. D68, 454–467.Vaaje-Kolstad, G., Westereng, B., Horn, S. J., Liu, Z., Zhai, H., Sørlie,
M. & Eijsink, V. G. H. (2010). Science, 330, 219–222.Winn, M. D., Ballard, C. C., Cowtan, K. D., Dodson, E. J., Emsley, P.,
Evans, P. R., Keegan, R. M., Krissinel, E. B., Leslie, A. G. W.,McCoy, A., McNicholas, S. J., Murshudov, G. N., Pannu, N. S.,Potterton, E. A., Powell, H. R., Read, R. J., Vagin, A. & Wilson,K. S. (2011). Acta Cryst. D67, 235–242.
Wlodawer, A. (1980). Acta Cryst. B36, 1826–1831.Wlodawer, A. & Hendrickson, W. A. (1982). Acta Cryst. A38, 239–
247.Wlodawer, A. & Sjolin, L. (1982). Proc. Natl Acad. Sci. USA, 79,
1418–1422.Yu, N., Yennawar, H. P. & Merz, K. M. (2005). Acta Cryst. D61, 322–
332.Zheng, M., Moriarty, N. W., Xu, Y., Reimers, J. R., Afonine, P. V. &
Waller, M. P. (2017). Acta Cryst. D73, 1020–1028.Zheng, M., Reimers, J. R., Waller, M. P. & Afonine, P. V. (2017). Acta
Cryst. D73, 45–52.
research papers
380 Caldararu et al. � Refinement with QM and neutron and X-ray data Acta Cryst. (2019). D75, 368–380