region 9 board of education student performance data chris
TRANSCRIPT

Student Performance DataRegion 9 Board of Education
October 16, 2018
Gina M. Pin, Ed.D., Assistant Superintendent / Head of SchoolJennifer Desmarais, Assistant PrincipalJulie McTague, Assistant PrincipalPatti Roszko, Administrator for Student ServicesMichael Santangeli, Athletics AdministratorPaula Panos, Director of School CounselingJT Schemm, Department Chair STEMAngela Staron, Department Chair HUMANITIESDave DeAngelo, Department Chair SPEC EDChris Angell, Director of Digital Learning
1

2
Social Interactions
Academic Performance
Emotional Wellness
Community
Communication
Complexity

2017-2018 School Focus
3
We value student voice. We will increase student involvement in the processes of the classroom, the school, and the community.
We wish to build community partnerships. We will engage parents, colleagues and the community in dialogues that will educate, motivate, and inspire school to home and school to community connections.
We will continue to offer a rigorous academic environment being mindful of the social and emotional needs of our students and staff. We will seek evidence that our curriculum, programs, and initiatives are aligned with articulated standards that increase access and participation.

Social Emotional Growth
● Attendance Records from Advisory and Activity Confirm 100% Student Participation
● Chronic absenteeism experienced a 10% decline
● Partnership with Yale Center for Emotional Intelligence
● Chat and Chew Student Forums● School Climate Committee
Representation4

Social Emotional Growth
● Freshman and senior parent coffee meet and greets
● PIP- Personal Improvement Plan supported 25 students
● Freshman advisories introduced to Emotional Intelligence Anchor Tools
● Parents introduced to Emotional Intelligence Anchor Tools
5

Social Emotional Growth cont.
● Youth Mental Health First Aid@100 students trained
● Three community trainings for adults in Youth Mental Health First Aid
● A Day in the Life of Barlow● College 101 ● Best Buddies Chapter formed
6

Student Discipline Data Two-Year Comparison
7

9
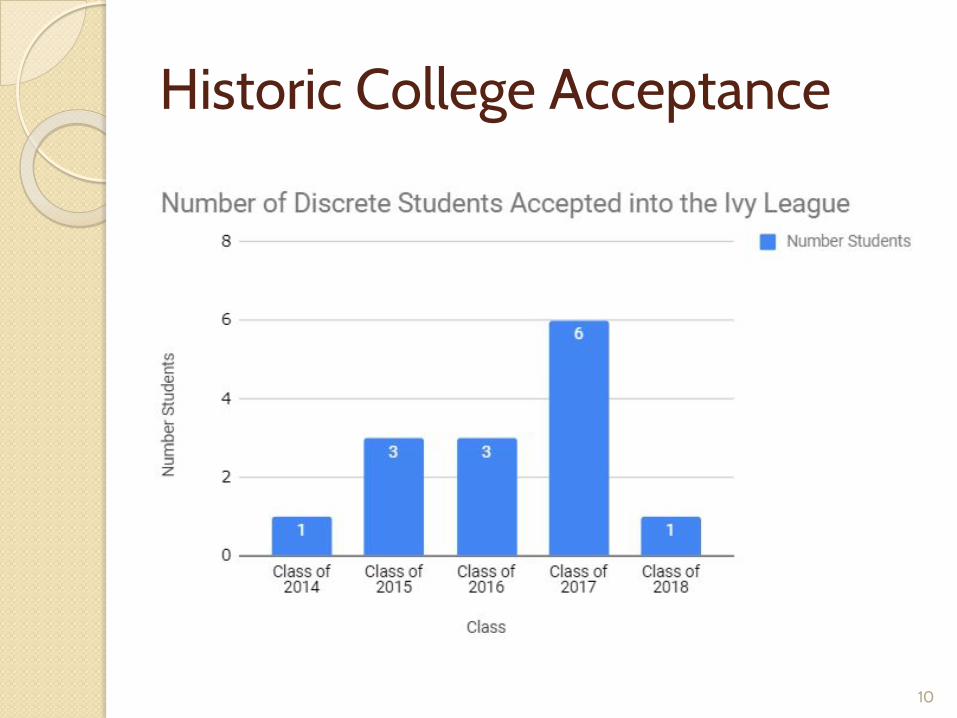
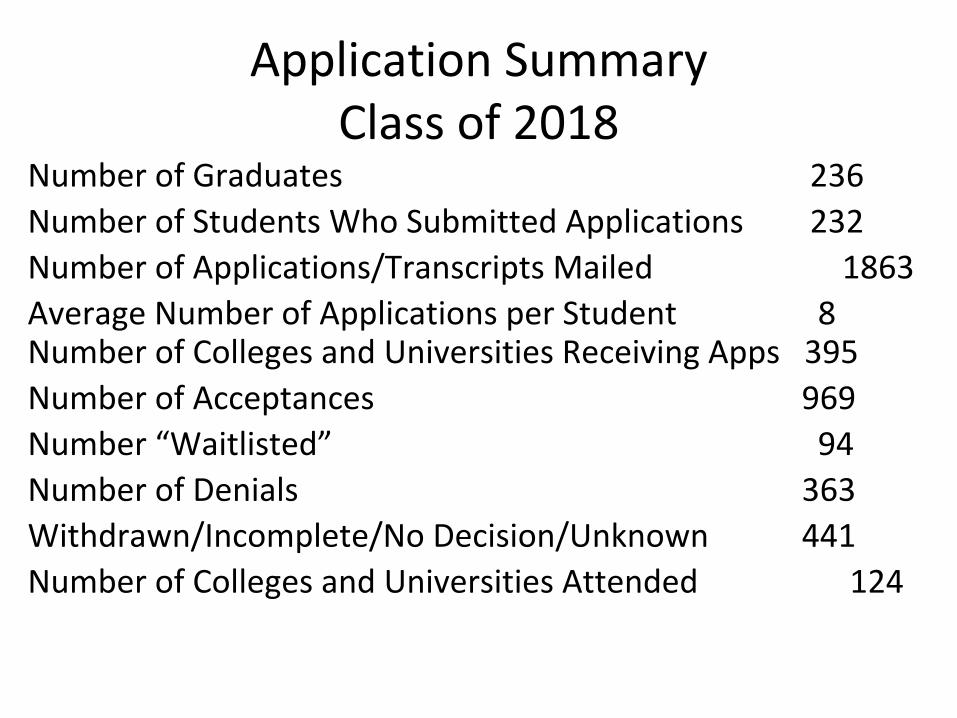
Historic College Acceptance
10

Historic College Acceptance(Most Competitive based on Barron's 2017 Rating)
11

Trend of unique athletes
12

Athletic Participation Data
13

14

PSAT/SAT Student Performance Data Used to be: But now is:
15
Comparisons of separate cohorts
Distant and Mysterious
Limited in usefulness to the Classroom Teacher
Tool to project progress forward within same cohort
Connected and Transparent
Relevant to Curriculum and Embraced by Teachers

Theory of action regarding data
Standardized assessments, when aligned with articulated curriculum, will provide student performance data that will yield increased access and equity for all learners.
Data informs and guides intervention and enrichment.
16

Assessment Schedule 2018-2019 School Year to Graduation
17
8/9 PSAT
8/9 PSAT
10 PSAT
11 PSAT / NMSQT
11 CT SAT
11th & 12th ACT / AP /
SAT
Class of 2019 (12th grade)
-- -- 10/2016 10/2017 4/2018 2017-2019 and TBD
Class of 2020 (11th grade)
-- -- 10/2017 *10/2018 *3/2019 2018-2020 and TBD
Class of 2021 (10th grade)
-- 4/2018 *10/2018 *10/2019 *3/2020 2019-2021and TBD
Class of 2022 (9th grade)
4/2018 *3/2019 *10/2019 *10/2020 *3/2021 2020-2022and TBD
Class of 2023 (8th grade)
*4/2019 *3/2020 *10/2020 *10/2021 *3/2022 2021-2023 and TBD
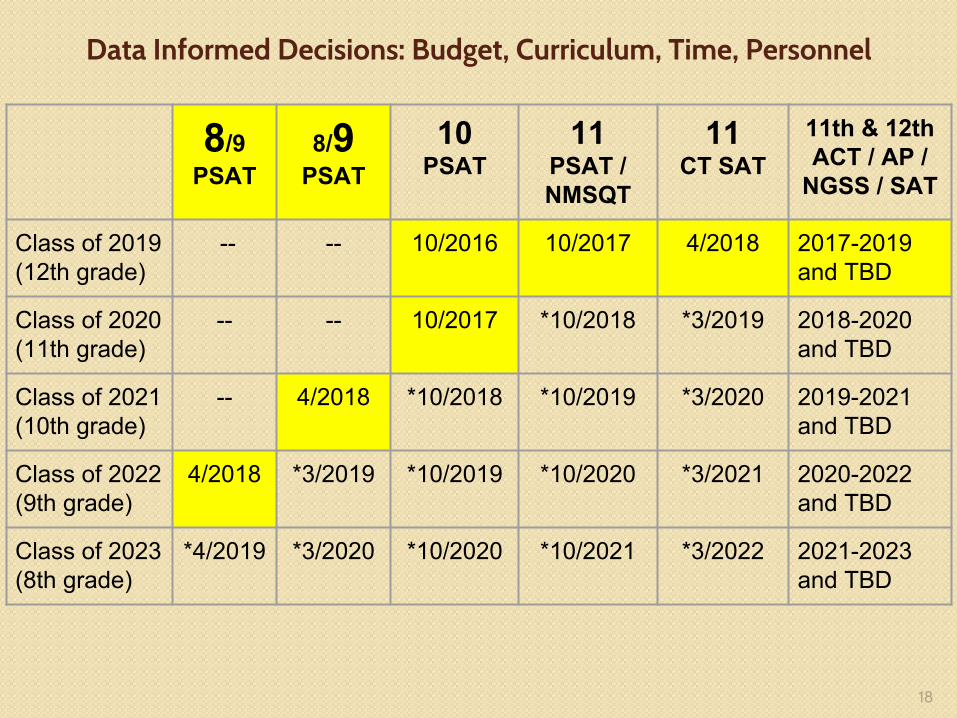
Data Informed Decisions: Budget, Curriculum, Time, Personnel
18
8/9 PSAT
8/9 PSAT
10 PSAT
11 PSAT / NMSQT
11 CT SAT
11th & 12th ACT / AP /
NGSS / SAT
Class of 2019 (12th grade)
-- -- 10/2016 10/2017 4/2018 2017-2019 and TBD
Class of 2020 (11th grade)
-- -- 10/2017 *10/2018 *3/2019 2018-2020 and TBD
Class of 2021 (10th grade)
-- 4/2018 *10/2018 *10/2019 *3/2020 2019-2021and TBD
Class of 2022 (9th grade)
4/2018 *3/2019 *10/2019 *10/2020 *3/2021 2020-2022and TBD
Class of 2023 (8th grade)
*4/2019 *3/2020 *10/2020 *10/2021 *3/2022 2021-2023 and TBD

PSAT/NMSQTPreliminary SAT /
National Merit Scholarship Qualifying Test➢ Feedback on strengths and weaknesses of skills➢ Qualification for scholarship programs
➢ Insight in which AP courses a student may be ready to take➢ Administered in-school to every Barlow 10th and 11th grade student➢ Grade 10 – encouraged to take the exam without much/any prep. The score
report received provides detailed feedback.➢ Grade 11 – encouraged to look carefully at feedback report from their grade
10 test performance. Grade 11 scores are used for National Merit Scholarship Qualifying.
➢ New online tools allow educators to view data○ in aggregate to inform curriculum
○ view skills of specific learners to plan intervention and enrichment
19

10 Year - PSAT/NMSQTOut of 1.5 million juniors taking the exam, 34,000 were commended
Class of Commended Students
Semi-Finalist
2019 6 1
2018 7 1
2017 12 0
2016 8 1
2015 5 0
2014 14 1
2013 14 1
2012 13 3
2011 6 0
2010 8 2
2009 13 6
20

21PSAT Class of 2019 as Juniors

PSAT Class of 2020 as sophomores22

Class of 2019 DRG A (alphabetized) Growth as a Cohort Across Assessments
23
Town gr 10 ERW
gr 10 Math
gr 11 ERW
gr 11Math
SAT ERW
SAT Math
Darien 533 539 600 598 626 631
New Canaan 577 553 580 579 610 617
Region 9 534 515 569 546 590 580
Ridgefield 564 529 593 570 616 611
Weston 550 543 598 587 617 615
Westport 583 573 596 588 616 609
Wilton 558 525 601 587 617 598
Data Source: College Board (SAT data inclusive: August 2017 through July 2018)

Class of 2019 DRG A (alphabetized) Growth as a Cohort Across Assessments
24
Town gr 10 ERW
gr 10 Math
gr 11 ERW
gr 11Math
SAT ERW
SAT Math
ERW gain
Math gain
Darien 533 539 +67 +59 +26 +33 +93 +92
New Canaan 577 553 +3 +26 +30 +38 +33 +64
Region 9 534 515 +35 +31 +21 +34 +56 +65
Ridgefield 564 529 +29 +41 +23 +41 +52 +82
Weston 550 543 +48 +44 +41 +28 +89 +72
Westport 583 573 +13 +15 +20 +21 +33 +36
Wilton 558 525 +43 +62 +16 +11 +59 +73
Data Source: College Board (SAT data inclusive: August 2017 through July 2018)

CT School Day SAT(April, 2018)
Data from: EdSightCT.gov and also K12 College Board Reports
25

CT SAT April, 2018(Class of 2019)
● Free of charge, in-school assessment for students in grade 11● Math and ERW (Evidence Based Reading and Writing)● State
◦ Participation Rate: 95.3%◦ 62.4% met or exceeded achievement standards in English
language arts (ELA)◦ 40.3% met or exceeded achievement in mathematics
● Barlow◦ Participation Rate: 96.5%◦ 86% met or exceeded achievement standards in English
language arts (ELA)◦ 71.9% met or exceeded achievement standards in Math
26

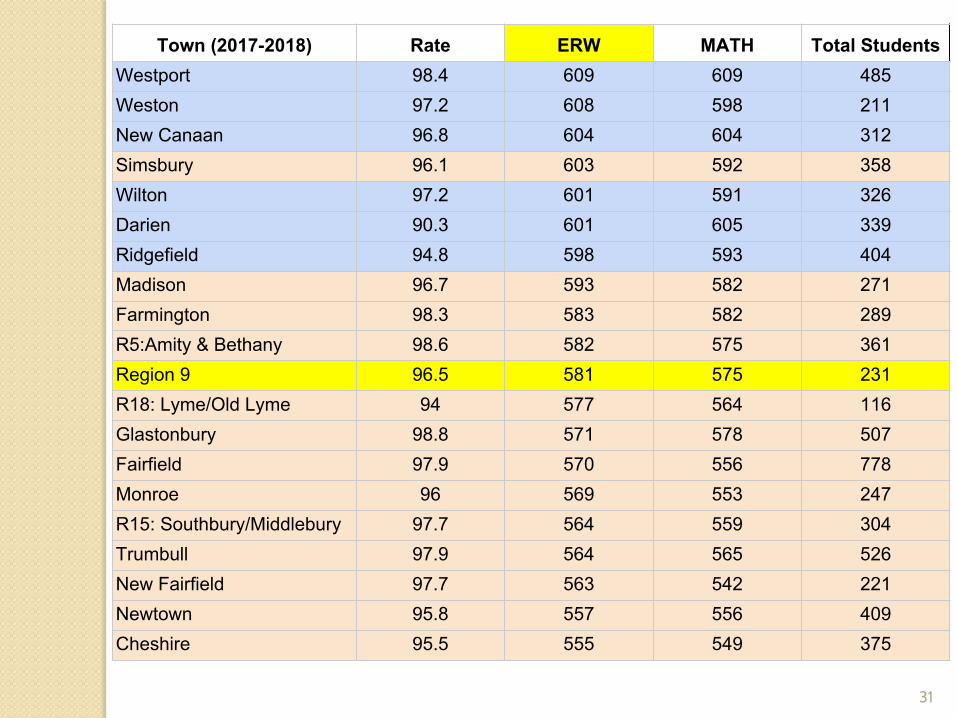
CT SAT historical lookThe purpose of the following slides is to view the performance of Region 9 on the CT SAT for the past three years as compared to DRG A schools as well as selected DRG B schools.
DRG A in BlueDRG B in Pink
DRG B schools selected for comparison represent one or more:● size● location● socio-economic status
27

28
TOWN 2017-2018 Rate ERW MATH Total StudentsWestport 98.4 609 609 485Darien 90.3 601 605 339New Canaan 96.8 604 604 312Weston 97.2 608 598 211Ridgefield 94.8 598 593 404Simsbury 96.1 603 592 358Wilton 97.2 601 591 326Madison 96.7 593 582 271Farmington 98.3 583 582 289Glastonbury 98.8 571 578 507Region 9 96.5 581 575 231Region 5- Amity 98.6 582 575 361Trumbull 97.9 564 565 526R18: Lyme/Old Lyme 94 577 564 116R15: Southbury /Middlebury 97.7 564 559 304Fairfield 97.9 570 556 778Newtown 95.8 557 556 409Monroe 96 569 553 247Cheshire 95.5 555 549 375New Fairfield 97.7 563 542 221

29
Town 2016-2017 Rate ERW MATH Total StudentsDarien 95.9 627 633 339Weston 98 626 613 204New Canaan 97.1 615 612 310Westport 98.9 616 609 464Wilton 97.6 620 607 331R15: Southbury/Middlebury 95.2 613 600 420Ridgefield 95.2 613 600 420Simsbury 98.8 614 597 333Glastonbury 98 584 595 490Madison 98 597 580 296Region 9 94.1 592 578 238Newtown 97.6 580 578 420Region 5- Amity 99.7 588 578 356Farmington 99 586 577 290R18: Lyme/Old Lyme 95.8 596 569 118Trumbull 99.3 578 569 561Cheshire 96.4 573 563 388Monroe 97 570 563 302Fairfield 97.6 579 558 778New Fairfield 98.1 552 513 207

30
Town 2015-2016 Rate ERW MATH Total StudentsDarien 94.3 619 626 331New Canaan 97.3 607 609 328Ridgefield 96.3 608 604 434Westport 98.6 598 599 439Wilton 97.6 604 596 336Simsbury 98.4 588 588 367Weston 95.7 585 582 207Glastonbury 97.6 570 581 495Madison 97.7 597 578 303Region 9 96 587 573 274Farmington 95.8 576 568 313R5:Amity & Bethany 97.7 577 563 352Newtown 95 577 562 424Cheshire 95.7 567 562 391Fairfield 96.9 572 557 736Trumbull 99.4 557 557 498Monroe 96.8 562 552 279R15: Southbury/Middlebury 97.8 564 550 314R18: Lyme/Old Lyme 99.2 567 543 120New Fairfield 100 564 523 227
31
Town (2017-2018) Rate ERW MATH Total StudentsWestport 98.4 609 609 485Weston 97.2 608 598 211New Canaan 96.8 604 604 312Simsbury 96.1 603 592 358Wilton 97.2 601 591 326Darien 90.3 601 605 339Ridgefield 94.8 598 593 404Madison 96.7 593 582 271Farmington 98.3 583 582 289R5:Amity & Bethany 98.6 582 575 361Region 9 96.5 581 575 231R18: Lyme/Old Lyme 94 577 564 116Glastonbury 98.8 571 578 507Fairfield 97.9 570 556 778Monroe 96 569 553 247R15: Southbury/Middlebury 97.7 564 559 304Trumbull 97.9 564 565 526New Fairfield 97.7 563 542 221Newtown 95.8 557 556 409Cheshire 95.5 555 549 375

32
Town 2016-2017 Rate ERW MATH Total StudentsDarien 95.9 627 633 339Weston 98 626 613 204Wilton 97.6 620 607 331Westport 98.9 616 609 464New Canaan 97.1 615 612 310Simsbury 98.8 614 597 333R15:Southbury/Middlebury 95.2 613 600 420Ridgefield 95.2 613 600 420Madison 98 597 580 296R18: Lyme/Old Lyme 95.8 596 569 118Region 9 94.1 592 578 238R5:Amity & Bethany 99.7 588 578 356Farmington 99 586 577 290Glastonbury 98 584 595 490Newtown 97.6 580 578 420Fairfield 97.6 579 558 778Trumbull 99.3 578 569 561Cheshire 96.4 573 563 388Monroe 97 570 563 302New Fairfield 98.1 552 513 207

33
Town 2015-2016 Rate ERW MATH Total StudentsDarien 94.3 619 626 331Ridgefield 96.3 608 604 434New Canaan 97.3 607 609 328Wilton 97.6 604 596 336Westport 98.6 598 599 439Madison 97.7 597 578 303Simsbury 98.4 588 588 367Region 9 96 587 573 274Weston 95.7 585 582 207Newtown 95 577 562 424R5:Amity & Bethany 97.7 577 563 352Farmington 95.8 576 568 313Fairfield 96.9 572 557 736Glastonbury 97.6 570 581 495R18: Lyme/Old Lyme 99.2 567 543 120Cheshire 95.7 567 562 391New Fairfield 100 564 523 227R15:Southbury/Middlebury 97.8 564 550 314Monroe 96.8 562 552 279Trumbull 99.4 557 557 498

34
Town 2017-2018 Rate ERW MATH Total StudentsGlastonbury 98.8 571 578 507R5:Amity & Bethany 98.6 582 575 361Westport 98.4 609 609 485Farmington 98.3 583 582 289Trumbull 97.9 564 565 526Fairfield 97.9 570 556 778R15: Southbury/Middlebury 97.7 564 559 304New Fairfield 97.7 563 542 221Weston 97.2 608 598 211Wilton 97.2 601 591 326New Canaan 96.8 604 604 312Madison 96.7 593 582 271Region 9 96.5 581 575 231Simsbury 96.1 603 592 358Monroe 96 569 553 247Newtown 95.8 557 556 409Cheshire 95.5 555 549 375Ridgefield 94.8 598 593 404R18: Lyme/Old Lyme 94 577 564 116Darien 90.3 601 605 339
Participation Rate for CT SAT 2017-2018

35
Testing Year Town Rate ERW Math Total Students2015 Darien 94.3 619 626 3312016 Darien 95.9 627 633 3392017 Darien 90.3 601 605 3392015 New Canaan 97.3 607 609 328
2016 New Canaan 97.1 615 612 3102017 New Canaan 96.8 604 604 3122015 Region 9 96 587 573 2742016 Region 9 94.1 592 578 2382017 Region 9 96.5 581 575 2312015 Ridgefield 96.3 608 604 4342016 Ridgefield 95.2 613 600 4202017 Ridgefield 94.8 598 593 4042015 Weston 95.7 585 582 2072016 Weston 98 626 613 2042017 Weston 97.2 608 598 2112015 Westport 98.6 598 599 4392016 Westport 98.9 616 609 4642017 Westport 98.4 609 609 4852017 Wilton 97.2 601 591 3262015 Wilton 97.6 604 596 3362016 Wilton 97.6 620 607 331

36
2018 CT SAT ERW across the State - JBHS placed 15th in State
NOTE PARTICIPATION % AND LEVEL % Across DRG AData Source: EdSight.ct.gov

37
2018 CT SAT Math across the State - JBHS placed 14th in State
NOTE PARTICIPATION % AND LEVEL % Across DRG AData Source: EdSight.ct.gov

CT SAT 2018- BENCHMARK ERW
38

39
CT SAT 2018-BENCHMARK MATH

Scores of students need to strengthen ERW and Math
40

Scores of students need to strengthen ERW and Math
41

CT SAT Breakdown Class 2019
42
ERW Score Range
# Juniors taking test
Percentage of test takers Average Score
300-800 215 100% 581
400-800 207 96% 590
500-800 173 80% 615
600-800 105 49% 656
700-800 21 10% 723
Math Score Range
# Juniors taking test
Percentage of test takers Average Score
300-800 215 100% 575
400-800 209 97% 583
500-800 176 82% 606
600-800 85 40% 671
700-800 29 13% 736

CT SAT - Barlow DistributionClass of 2019 (215 test takers)
43
2018 CT SAT range for most and highly competitive schools Data Source: CollegeBoard
40% Most or Highly competitive colleges
66% Very competitive colleges
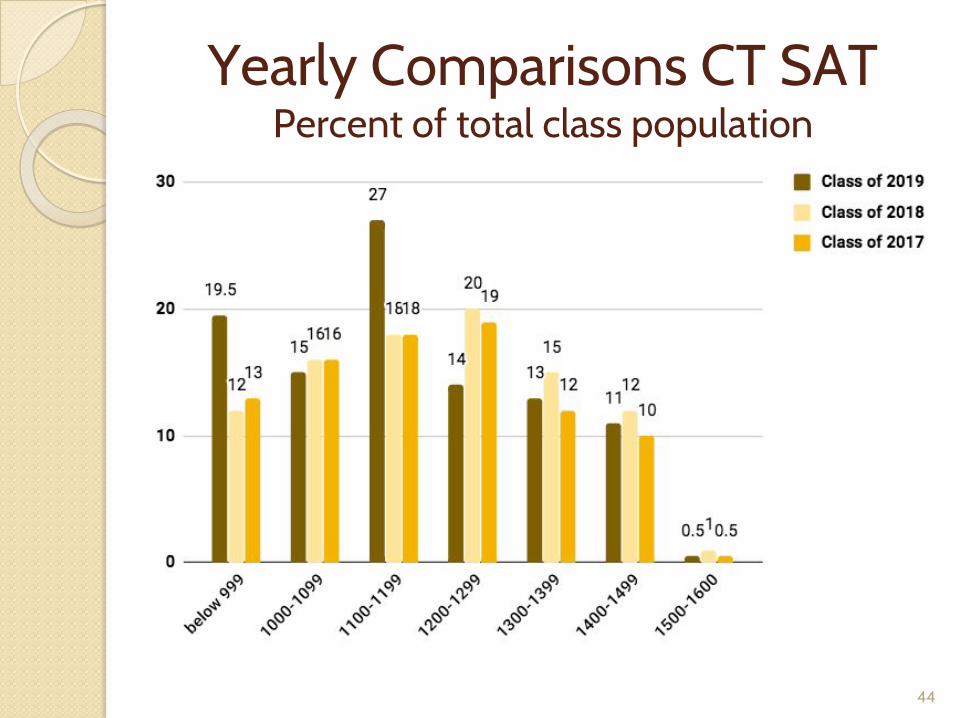
Yearly Comparisons CT SATPercent of total class population
44
Advanced Placement Data
45
Data from: AP Central, College Board, and JBHS PowerSchool

Advanced Placement (AP) May 2018 and % growth of 3+ exams over 5 year period
46
Town # of Testers
# of Exams taken
# Exams with score
3, 4, 5
# of APs offered
*incl online
% Growth 3+ Exams over
5 years
Weston 303 756 652 24 37%
Darien 421 928 855 28 23%
New Canaan 453 1,064 952 30 23%
Region #9 252 509 433 21 17%
Westport 579 1,297 1,198 31 4%
Wilton 348 738 665 23 -6%
Ridgefield 506 1,153 1,016 24 -13%

47

Historical View of Barlow AP Scores
48
2018
2017
2016

49
AP Enrollment
Increase / Decrease
2017 to 2018
2015 Enroll 2016 Enroll 2017 Enroll 2018 Enroll
Biology 68 66 58 66
Calc AB 40 42 27 38
Calc BC 8 7 15 17
Chem 19 19 19 0
Comp Gov. -- 18 14 12
Comput Sci Princ -- -- 23 45
Eng (11) Lang 45 39 30 43
English (12) Lit 11 15 12 15
Enviro Science -- -- 50 47
French 21 22 15 17
Music Theory 7 9 14 7
Physics 1 33 36 35 43
Psychology 86 84 67 86
Spanish 22 17 11 9
Statistics 49 32 35 31
Studio Art 2-D 7 15 13 10
Studio Art 3-D 5 2 1 3
Studio Art Draw 1 3 1 2
US History 14 15 10 13
TOTAL ENROLL 450 459 478 504

50
AP Performance
Increase / Decrease
2017 to 2018
2015 Average 2016 Average 2017 Average 2018 Average
3.16 3.08 3.172 3.47 Biology
3.63 3.48 3.481 2.789 Calc AB
4.38 5 4.8 4.529 Calc BC
3.37 3.47 4 Chem
-- 3.83 4.143 3.917 Comp Gov.
-- -- 3.87 4.178Comput Sci Princ
4.18 4.26 4.1 4.14 Eng (11) Lang
4.46 4.2 4 4.133 English (12) Lit
-- -- 3.52 3.489 Enviro Science
3.14 3.41 3.267 2.824 French
2.86 3.67 3.143 3.429 Music Theory
2.94 3.25 3.286 2.93 Physics 1
3.64 4.01 4.09 4.07 Psychology
4.14 4.29 4.545 4.22 Spanish
3.41 3.66 3.515 3.613 Statistics
3.43 3.6 2.923 3.4 Studio Art 2-D
3 3.5 2 4 Studio Art 3-D
3 4 3 5 Studio Art Draw
4.71 4.4 3.8 3.846 US History

51
ENROLLMENT (2017 TO 2018) PERFORMANCE (2017 TO 2018)
Biology Biology
Calc AB Calc AB
Calc BC Calc BC
Comp Gov. Comp Gov.
Comput Sci Princ Comput Sci Princ
Eng (11) Lang Eng (11) Lang
English (12) Lit English (12) Lit
Enviro Science Enviro Science
French French
Music Theory Music Theory
Physics 1 Physics 1
Psychology Psychology
Spanish Spanish
Statistics Statistics
Studio Art 2-D Studio Art 2-D
Studio Art 3-D Studio Art 3-D
Studio Art Draw Studio Art Draw
US History US History

Data will continue to inform
● Goal Setting● Student Learning Outcomes● Curriculum Updates● Differentiated instruction within a class● All discussions about teaching and
learning● Budgeting requests
52

2018-2019 JBHS Theories of Action
53
If all students experience high-quality, standards-based education, then all students
will demonstrate academic growth and achievement as measured by standardized
assessments (AP, SAT, PSAT, etc.), curriculum-based assessments, and
teacher-created customized learning experiences (Lens, Research Paper, Portfolios,
Synthesis, Lab Experiences, Project-Based Authentic Learning, etc.).

2018-2019 JBHS Theories of Action
54
If all students experience high-quality, standards-based education, then all students
will demonstrate academic growth and achievement as measured by standardized
assessments (AP, SAT, PSAT, etc.), curriculum-based assessments, and teacher-created customized learning experiences (Lens, Research Paper,
Portfolios, Synthesis, Lab Experiences, Project-Based Authentic Learning, etc.).
2018-2019 JBHS Theories of Action
55
If the educational environment is physically, emotionally, and intellectually safe, then all students will demonstrate academic growth
and achievement as measured by standardized data (attendance records, disciplinary actions,
participation rates in extra curriculars, enrollment in higher level classes, college
acceptance data, etc.) and customized measures (school-wide surveys, student focus
groups, student participation in leadership opportunities, etc.).

2018-2019 JBHS Theories of Action
56
If the educational environment is physically, emotionally, and intellectually safe, then all students will demonstrate academic growth
and achievement as measured by standardized data (attendance records, disciplinary actions, participation rates in
extra curriculars, enrollment in higher level classes, college acceptance data, etc.) and
customized measures (school-wide surveys, student focus groups, student participation in
leadership opportunities, etc.).

57

Thinkers
Readers
Solvers

● Logical Thinkers● Close Readers ● Creative Solvers
...across all content areas

Purpose: Aligned and Streamlined
● Standards focus on college and career ready skills
● School accountability
● College admissions entrance exam
Considering Limitations
● Multiple Choice● No Essay● Challenge level● One measure
Systemic Benefits
● Follows student progress by cohort● Provides transparent data at question
level detail● Follows individual student progress
across grades● Guides teaching and learning● Richness of program inclusive of and
beyond multiple choice assessments

Looking Ahead
TeachersStudent Learning ObjectivesCurriculumProfessional Development

Thank youEnd of Presentation
64