regional overview: east asia and the pacific
TRANSCRIPT
Regionaloverview:East Asia and the Pacific
East Asia and the Pacific1 made great progress towards Education For All (EFA). Since 2000, child survival, nutrition and education have improved greatly. The number of primary school-age children who are out of school has declined by 42% since 1999 to less than 7 million in 2012. Despite this evident progress, the region still faces some challenges. Although literacy levels have increased, 74 million adults will still lack basic literacy skills in 2015, of whom 70% will be women. Poor educational quality remains another challenge in many countries, as are persisting geographic, socio-economic and ethnic disparities in education. These inequalities must be redressed as the world is defining a new education agenda and for children, youth and adults to benefit equally from the opportunities education provides, regardless of the circumstances of birth.
In reviewing progress since 2000, this regional overview summarizes findings in response to key questions addressed by the 2015 EFA Global Monitoring Report (GMR): What are the main EFA achievements and failures? Which countries
advanced fastest? Which faced difficulties? Which policy initiatives promoted access of both girls and boys to education and improved its quality, especially for the most disadvantaged groups and areas? Have governments and the international community provided adequate support? The 2015 GMR shows that, despite progress, Education For All remains unfinished business in East Asia and the Pacific. This must been taken into account in the post-2015 agenda.
EFA progress and challenges
Goal 1: Early childhood care and education
Expanding and improving comprehensive early childhood care and education, especially for the most vulnerable and disadvantaged children.
Child mortality and nutrition
■ Between 1990 and 2000, the average level of child mortality in East Asia and the Pacific fell from 48 to 34 deaths per 1,000 live births, and in 2015 will reach 19. But while East Asia is expected to reach the fourth Millennium Development Goal (MDG) of reducing child mortality rate by two-thirds between 1990 and 2015, the Pacific sub-region will still on average be far from it, with the child mortality rate likely to decline only by 38% since 1990 to 25 per 1,000 live births in 2015.
www.unesco.org/publishing
www.efareport.unesco.org
United NationsEducational, Scientific and
Cultural Organization
UNESCO Publishing
The twelfth edition of the EFA Global Monitoring Report – marking the 2015 deadline for the six goals set at the World Education Forum in Dakar, Senegal, in 2000 – provides a considered and comprehensive accounting of global progress. As the international community prepares for a new development and education agenda, this report takes stock of past achievements and reflects on future challenges.
There are many signs of notable advances. The pace towards universal primary education has quickened, gender disparity has been reduced in many countries and governments are increasing their focus on making sure children receive an education of good quality. However, despite these efforts, the world failed to meet its overall commitment to Education for All. Millions of children and adolescents are still out of school, and it is the poorest and most disadvantaged who bear the brunt of this failure to reach the EFA targets.
Education for All 2000–2015: Achievements and Challenges provides a comprehensive assessment of country progress towards the EFA goals and highlights the work that remains. It highlights effective policies and makes recommendations for monitoring and evaluating education targets after 2015. It also provides policy-makers with an authoritative source with which to advocate that education be a cornerstone of the post-2015 global development architecture.
The EFA Global Monitoring Report is an editorially independent, evidence-based publication that serves as an indispensable tool for governments, researchers, education and development specialists, media and students. It has assessed education progress in some 200 countries and territories on an almost annual basis since 2002. This work will continue, throughout the implementation of the post-2015 sustainable development agenda, as the Global Education Monitoring Report.
Education for all 2000-2015:achievements and challenges
52 0EFA GlobalMonitoring Report
United NationsEducational, Scientific and
Cultural Organization
Education for all2000-2015:
achievements and challenges
1
EFA
Glo
bal
Monito
ring R
eport
20
15
United NationsEducational, Scientific and
Cultural Organization
Education
for all 2000-2015:
achievem
ents an
d challen
ges
Educ
atio
n fo
r All
9 789231 000850
One of the major reforms since 2000 is the policy where every child must go to school. This has assisted every person to taste the fruits of education. It may have robbed the farmers of their labour force, but it has given them the seeds for a better life in the future.
– Sonam, teacher in Bhutan
Parents that have faced the hardships of not being able to write letters, use mobile phones or ATMs do all they can to provide their children with an education so they don’t ever become excluded due to illiteracy.
– Omovigho Rani Ebireri, University of Maiduguri, Nigeria
I left because of the things that were happening, with the rebels. They destroyed our school, we couldn’t go any more. They didn’t like the way some of the girls were dressed. They yelled at us, saying that what we were wearing wasn’t good. They broke our school desks, destroyed our school books and our things. School is supposed to be a place where we learn things.
– Sita, student in Nigeria
Every child under 5 has to attend pre-school. Early childhood education is a major priority.
– Martha Isabel Castano, Primary school teacher, Colombia
1_Cover_v13.indd 1-3 3/11/15 8:32 PM
United NationsEducational, Scientific and
Cultural Organization
1. See Table 2 for countries and territories in this EFA region.
2
R E G I O N A L O V E R V I E W E A S T A S I A A N D T H E PA C I F I C E D U C A T I O N F O R A L L G L O B A L M O N I T O R I N G R E P O R T 2 0 1 5 E D U C A T I O N F O R A L L G L O B A L M O N I T O R I N G R E P O R T 2 0 1 5 E A S T A S I A A N D T H E PA C I F I C R E G I O N A L O V E R V I E W
■ Huge differences in child mortality rates currently are found between countries, ranging from less than 3 per 1,000 live births in Japan and Singapore to 61 in Myanmar. All countries with data in the region improved child survival since 2000, and several are likely to reach the fourth MDG. Among them are Cambodia, the Lao People’s Democratic Republic and Timor-Leste in East Asia, and Solomon Islands and Vanuatu in the Pacific.
■ Having a skilled birth attendant present during childbirth is critically important for the survival and health of both mother and child. An alarming degree of disparity in access exists between the poorest and richest women in many countries. In Cambodia, Indonesia and the Philippines, while access to skilled birth attendants is almost universal for the richest women, the skilled attendance rates are much lower for the poorest. Yet, great progress has been achieved between 2000 and 2010. In the Philippines, the attendance rates for the poorest more than doubled; in Cambodia, it rose from 14% to nearly 57%. Cambodia also greatly improved the immunization rate of its poorest children from 29% to 65% over the same period thanks to the 2006–2010 national immunization programmes whose stated goal was to focus on hard-to-reach groups.
■ In East Asia and the Pacific, 11% of children under 5 suffered from moderate or severe stunting, a sign of malnutrition. However, in half of countries with data, more than 32% of children under 5 were malnourished. This suggests that substantial regional variations persist, with the stunting rate ranging from about 10% in China and Tuvalu to more than 44% in the Lao People’s Democratic Republic and Papua New Guinea, and up to 58% in Timor-Leste.
■ In general, most countries have made progress in reducing the percentage of stunted children since the 1990s. For example, Viet Nam has made enormous and consistent progress since 1990 through widespread vitamin A supplementation, universal salt iodization and disease control.
Pre-primary education
■ Since 2000, early childhood education services have expanded considerably. The number of children enrolled in pre-primary schools increased by 45% in the whole East Asia and the Pacific region, from 36 million in 1999 to 53 million in 2012. The increase was even greater in the Pacific, with the number of children enrolled more than doubling from 452,000 to more than 1 million.
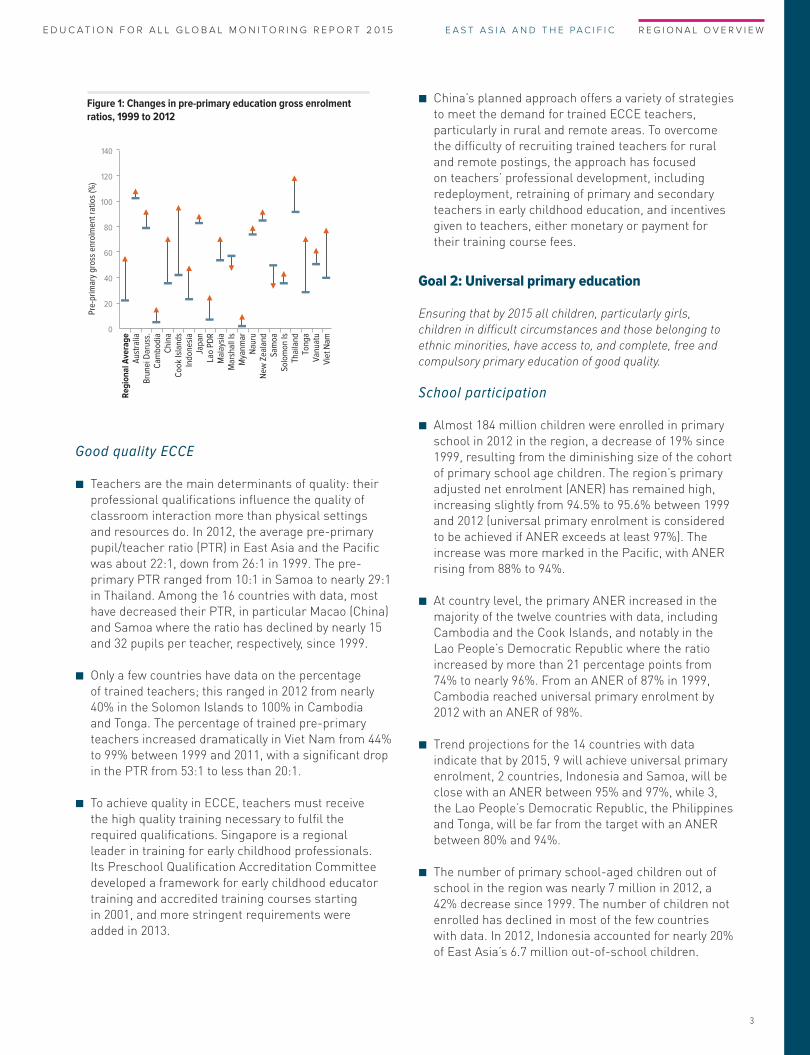
■ Overall, participation in pre-primary enrolment in 2012, as measured by the gross enrolment ratio (GER), was at 68% in the region, ranging from 67% in East Asia to 93% in the Pacific. GERs increased in most countries, notably in China and Viet Nam in East Asia and the Cook Islands and Tonga in the Pacific where the participation level has improved by more than 30 percentage points since 1999. However, pre-primary GERs decreased in the Marshall Islands and Samoa.
■ Participation in pre-primary education varies greatly across countries in the region. Among the 20 countries with data, projections indicate that by 2015, 8 will have a GER of at least 80%, among them Japan and New Zealand in East Asia and the Cook Islands in the Pacific. On the other hand, preschool participation will remain low in countries like Cambodia, the Lao People’s Democratic Republic and Myanmar, with ratios below 30%.
■ Living in a rural area and/or being poor and marginalized reduces a child’s chances of attending pre-primary school. In the Lao People’s Democratic Republic, only15% of rural children aged 36–59 months were attending some form of organized early childhood care and education programmes in 2012, almost a quarter of the rate of urban children (55%). Inequality in attendance due to poverty was even greater, with only 5% of the poorest children attending, as compared to the attendance rate of 73% among children from the richest households.
Private sector involvement
■ Cost is a major reason for low access to ECCE programmes. But private sector provision is high, limiting access to families that can afford it. The share of pre-primary enrolment provided by the private sector was more than 55% or above in 2012 in half the countries reporting data. The private sector was almost the sole provider in Indonesia in East Asia and Samoa and Tonga in the Pacific. The involvement of the private sector in pre-primary education has declined in some countries such as Cambodia, Malaysia, Myanmar and Viet Nam since 1999, but has increased in Australia and the Cook Islands.
■ In some countries, public and private systems run in parallel, not in partnership. In China, urban children take advantage of relatively well-equipped government centres staffed with trained teachers, while many rural communities rely on private kindergartens staffed by untrained teachers.
R E G I O N A L O V E R V I E W E A S T A S I A A N D T H E PA C I F I C E D U C A T I O N F O R A L L G L O B A L M O N I T O R I N G R E P O R T 2 0 1 5 E D U C A T I O N F O R A L L G L O B A L M O N I T O R I N G R E P O R T 2 0 1 5 E A S T A S I A A N D T H E PA C I F I C R E G I O N A L O V E R V I E W
3
Good quality ECCE
■ Teachers are the main determinants of quality: their professional qualifications influence the quality of classroom interaction more than physical settings and resources do. In 2012, the average pre-primary pupil/teacher ratio (PTR) in East Asia and the Pacific was about 22:1, down from 26:1 in 1999. The pre-primary PTR ranged from 10:1 in Samoa to nearly 29:1 in Thailand. Among the 16 countries with data, most have decreased their PTR, in particular Macao (China) and Samoa where the ratio has declined by nearly 15 and 32 pupils per teacher, respectively, since 1999.
■ Only a few countries have data on the percentage of trained teachers; this ranged in 2012 from nearly 40% in the Solomon Islands to 100% in Cambodia and Tonga. The percentage of trained pre-primary teachers increased dramatically in Viet Nam from 44% to 99% between 1999 and 2011, with a significant drop in the PTR from 53:1 to less than 20:1.
■ To achieve quality in ECCE, teachers must receive the high quality training necessary to fulfil the required qualifications. Singapore is a regional leader in training for early childhood professionals. Its Preschool Qualification Accreditation Committee developed a framework for early childhood educator training and accredited training courses starting in 2001, and more stringent requirements were added in 2013.
■ China’s planned approach offers a variety of strategies to meet the demand for trained ECCE teachers, particularly in rural and remote areas. To overcome the difficulty of recruiting trained teachers for rural and remote postings, the approach has focused on teachers’ professional development, including redeployment, retraining of primary and secondary teachers in early childhood education, and incentives given to teachers, either monetary or payment for their training course fees.
Goal 2: Universal primary education
Ensuring that by 2015 all children, particularly girls, children in difficult circumstances and those belonging to ethnic minorities, have access to, and complete, free and compulsory primary education of good quality.
School participation
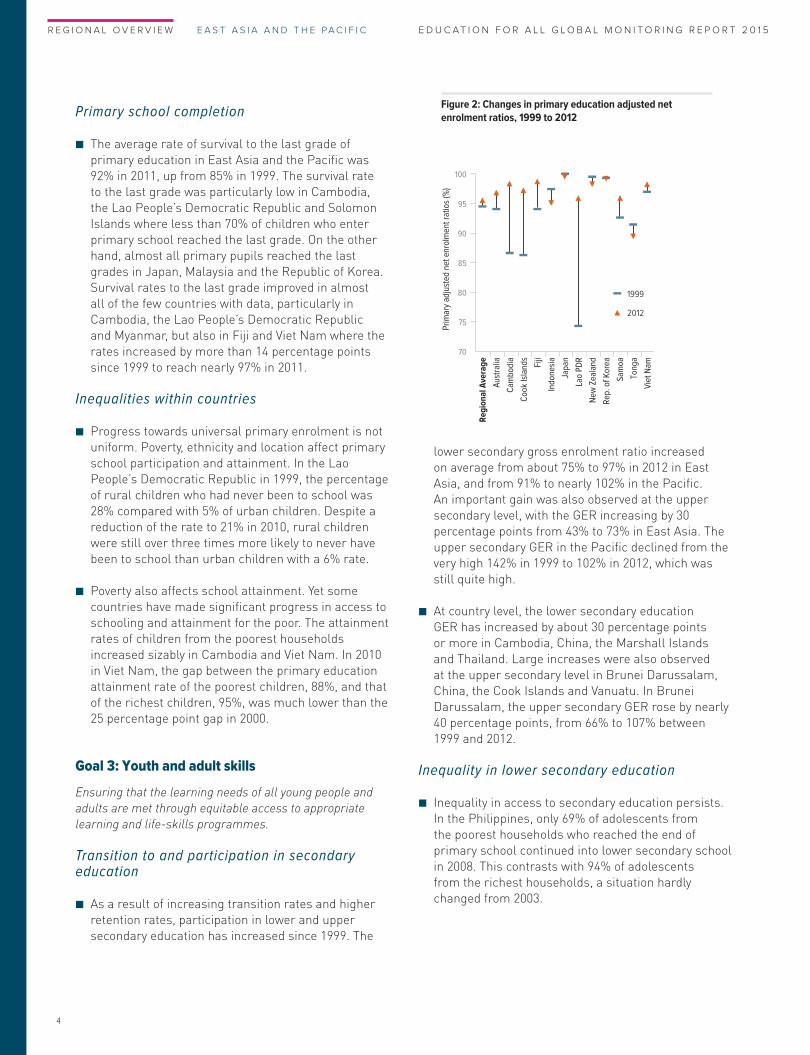
■ Almost 184 million children were enrolled in primary school in 2012 in the region, a decrease of 19% since 1999, resulting from the diminishing size of the cohort of primary school age children. The region’s primary adjusted net enrolment (ANER) has remained high, increasing slightly from 94.5% to 95.6% between 1999 and 2012 (universal primary enrolment is considered to be achieved if ANER exceeds at least 97%). The increase was more marked in the Pacific, with ANER rising from 88% to 94%.
■ At country level, the primary ANER increased in the majority of the twelve countries with data, including Cambodia and the Cook Islands, and notably in the Lao People’s Democratic Republic where the ratio increased by more than 21 percentage points from 74% to nearly 96%. From an ANER of 87% in 1999, Cambodia reached universal primary enrolment by 2012 with an ANER of 98%.
■ Trend projections for the 14 countries with data indicate that by 2015, 9 will achieve universal primary enrolment, 2 countries, Indonesia and Samoa, will be close with an ANER between 95% and 97%, while 3, the Lao People’s Democratic Republic, the Philippines and Tonga, will be far from the target with an ANER between 80% and 94%.
■ The number of primary school-aged children out of school in the region was nearly 7 million in 2012, a 42% decrease since 1999. The number of children not enrolled has declined in most of the few countries with data. In 2012, Indonesia accounted for nearly 20% of East Asia’s 6.7 million out-of-school children.
Figure 1: Changes in pre-primary education gross enrolment ratios, 1999 to 2012
0
20
40
60
80
100
120
140
Reg
ion
al A
vera
ge
Aus
tral
iaB
rune
i Dar
uss.
Cam
bodi
aC
hina
Coo
k Is
land
sIn
done
sia
Japa
nLa
o PD
RM
alay
sia
Mar
shal
l Is
Mya
nmar
Nau
ruN
ew Z
eala
ndSa
moa
Solo
mon
IsTh
aila
ndTo
nga
Van
uatu
Vie
t Nam
Pre-
prim
ary
gros
s en
rolm
ent r
atio
s (%
)
4
R E G I O N A L O V E R V I E W E A S T A S I A A N D T H E PA C I F I C E D U C A T I O N F O R A L L G L O B A L M O N I T O R I N G R E P O R T 2 0 1 5 E D U C A T I O N F O R A L L G L O B A L M O N I T O R I N G R E P O R T 2 0 1 5 E A S T A S I A A N D T H E PA C I F I C R E G I O N A L O V E R V I E W
Primary school completion
■ The average rate of survival to the last grade of primary education in East Asia and the Pacific was 92% in 2011, up from 85% in 1999. The survival rate to the last grade was particularly low in Cambodia, the Lao People’s Democratic Republic and Solomon Islands where less than 70% of children who enter primary school reached the last grade. On the other hand, almost all primary pupils reached the last grades in Japan, Malaysia and the Republic of Korea. Survival rates to the last grade improved in almost all of the few countries with data, particularly in Cambodia, the Lao People’s Democratic Republic and Myanmar, but also in Fiji and Viet Nam where the rates increased by more than 14 percentage points since 1999 to reach nearly 97% in 2011.
Inequalities within countries
■ Progress towards universal primary enrolment is not uniform. Poverty, ethnicity and location affect primary school participation and attainment. In the Lao People’s Democratic Republic in 1999, the percentage of rural children who had never been to school was 28% compared with 5% of urban children. Despite a reduction of the rate to 21% in 2010, rural children were still over three times more likely to never have been to school than urban children with a 6% rate.
■ Poverty also affects school attainment. Yet some countries have made significant progress in access to schooling and attainment for the poor. The attainment rates of children from the poorest households increased sizably in Cambodia and Viet Nam. In 2010 in Viet Nam, the gap between the primary education attainment rate of the poorest children, 88%, and that of the richest children, 95%, was much lower than the 25 percentage point gap in 2000.
Goal 3: Youth and adult skills
Ensuring that the learning needs of all young people and adults are met through equitable access to appropriate learning and life-skills programmes.
Transition to and participation in secondary education
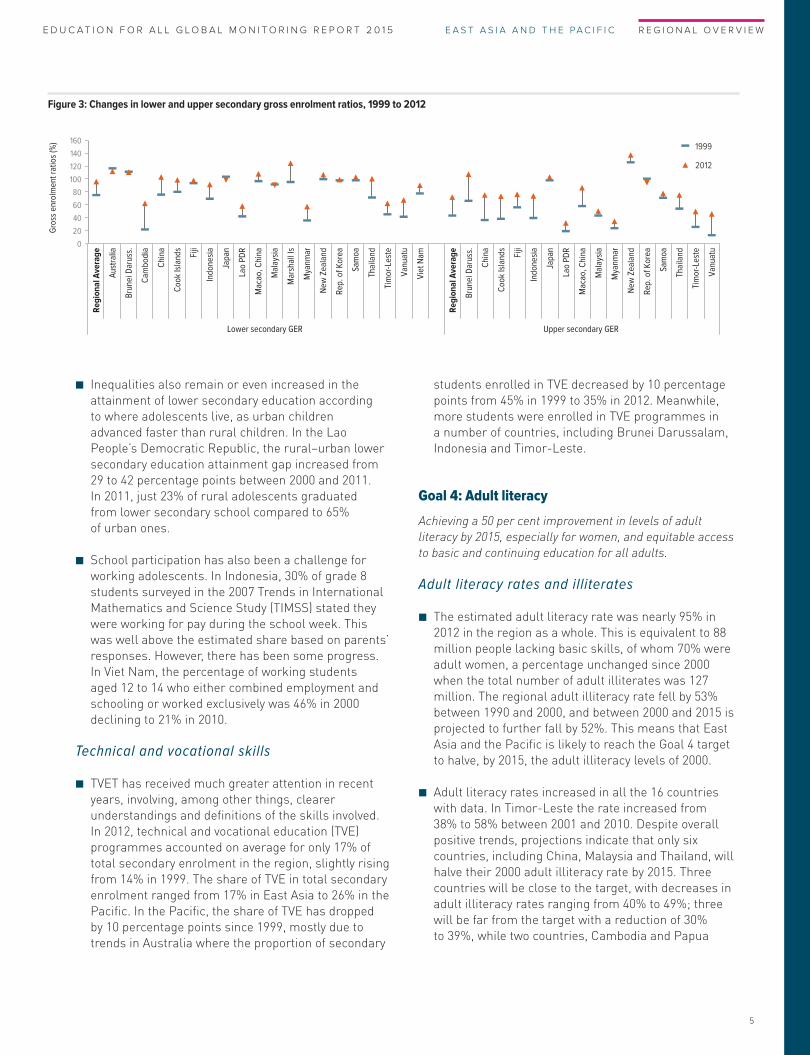
■ As a result of increasing transition rates and higher retention rates, participation in lower and upper secondary education has increased since 1999. The
lower secondary gross enrolment ratio increased on average from about 75% to 97% in 2012 in East Asia, and from 91% to nearly 102% in the Pacific. An important gain was also observed at the upper secondary level, with the GER increasing by 30 percentage points from 43% to 73% in East Asia. The upper secondary GER in the Pacific declined from the very high 142% in 1999 to 102% in 2012, which was still quite high.
■ At country level, the lower secondary education GER has increased by about 30 percentage points or more in Cambodia, China, the Marshall Islands and Thailand. Large increases were also observed at the upper secondary level in Brunei Darussalam, China, the Cook Islands and Vanuatu. In Brunei Darussalam, the upper secondary GER rose by nearly 40 percentage points, from 66% to 107% between 1999 and 2012.
Inequality in lower secondary education
■ Inequality in access to secondary education persists. In the Philippines, only 69% of adolescents from the poorest households who reached the end of primary school continued into lower secondary school in 2008. This contrasts with 94% of adolescents from the richest households, a situation hardly changed from 2003.
Figure 2: Changes in primary education adjusted net enrolment ratios, 1999 to 2012
1999
2012
70
75
80
85
90
95
100
Reg
ion
al A
vera
ge
Aus
tral
ia
Cam
bodi
a
Coo
k Is
land
s
Fiji
Indo
nesi
a
Japa
n
Lao
PDR
New
Zea
land
Rep
. of K
orea
Sam
oa
Tong
a
Vie
t Nam
Prim
ary
adju
sted
net
enr
olm
ent r
atio
s (%
)
R E G I O N A L O V E R V I E W E A S T A S I A A N D T H E PA C I F I C E D U C A T I O N F O R A L L G L O B A L M O N I T O R I N G R E P O R T 2 0 1 5 E D U C A T I O N F O R A L L G L O B A L M O N I T O R I N G R E P O R T 2 0 1 5 E A S T A S I A A N D T H E PA C I F I C R E G I O N A L O V E R V I E W
5
■ Inequalities also remain or even increased in the attainment of lower secondary education according to where adolescents live, as urban children advanced faster than rural children. In the Lao People’s Democratic Republic, the rural–urban lower secondary education attainment gap increased from 29 to 42 percentage points between 2000 and 2011. In 2011, just 23% of rural adolescents graduated from lower secondary school compared to 65% of urban ones.
■ School participation has also been a challenge for working adolescents. In Indonesia, 30% of grade 8 students surveyed in the 2007 Trends in International Mathematics and Science Study (TIMSS) stated they were working for pay during the school week. This was well above the estimated share based on parents’ responses. However, there has been some progress. In Viet Nam, the percentage of working students aged 12 to 14 who either combined employment and schooling or worked exclusively was 46% in 2000 declining to 21% in 2010.
Technical and vocational skills
■ TVET has received much greater attention in recent years, involving, among other things, clearer understandings and definitions of the skills involved. In 2012, technical and vocational education (TVE) programmes accounted on average for only 17% of total secondary enrolment in the region, slightly rising from 14% in 1999. The share of TVE in total secondary enrolment ranged from 17% in East Asia to 26% in the Pacific. In the Pacific, the share of TVE has dropped by 10 percentage points since 1999, mostly due to trends in Australia where the proportion of secondary
students enrolled in TVE decreased by 10 percentage points from 45% in 1999 to 35% in 2012. Meanwhile, more students were enrolled in TVE programmes in a number of countries, including Brunei Darussalam, Indonesia and Timor-Leste.
Goal 4: Adult literacy
Achieving a 50 per cent improvement in levels of adult literacy by 2015, especially for women, and equitable access to basic and continuing education for all adults.
Adult literacy rates and illiterates
■ The estimated adult literacy rate was nearly 95% in 2012 in the region as a whole. This is equivalent to 88 million people lacking basic skills, of whom 70% were adult women, a percentage unchanged since 2000 when the total number of adult illiterates was 127 million. The regional adult illiteracy rate fell by 53% between 1990 and 2000, and between 2000 and 2015 is projected to further fall by 52%. This means that East Asia and the Pacific is likely to reach the Goal 4 target to halve, by 2015, the adult illiteracy levels of 2000.
■ Adult literacy rates increased in all the 16 countries with data. In Timor-Leste the rate increased from 38% to 58% between 2001 and 2010. Despite overall positive trends, projections indicate that only six countries, including China, Malaysia and Thailand, will halve their 2000 adult illiteracy rate by 2015. Three countries will be close to the target, with decreases in adult illiteracy rates ranging from 40% to 49%; three will be far from the target with a reduction of 30% to 39%, while two countries, Cambodia and Papua
Figure 3: Changes in lower and upper secondary gross enrolment ratios, 1999 to 2012
Gro
ss e
nrol
men
t rat
ios
(%)
0
20
40
60
80
100
120
140
160
Reg
ion
al A
vera
ge
Aus
tral
ia
Bru
nei D
arus
s.
Cam
bodi
a
Chi
na
Coo
k Is
land
s
Fiji
Indo
nesi
a
Japa
n
Lao
PDR
Mac
ao, C
hina
Mal
aysi
a
Mar
shal
l Is
Mya
nmar
New
Zea
land
Rep
. of K
orea
Sam
oa
Thai
land
Tim
or-L
este
Van
uatu
Vie
t Nam
Reg
ion
al A
vera
ge
Bru
nei D
arus
s.
Chi
na
Coo
k Is
land
s
Fiji
Indo
nesi
a
Japa
n
Lao
PDR
Mac
ao, C
hina
Mal
aysi
a
Mya
nmar
New
Zea
land
Rep
. of K
orea
Sam
oa
Thai
land
Tim
or-L
este
Van
uatu
Lower secondary GER Upper secondary GER
1999
2012
6
R E G I O N A L O V E R V I E W E A S T A S I A A N D T H E PA C I F I C E D U C A T I O N F O R A L L G L O B A L M O N I T O R I N G R E P O R T 2 0 1 5 E D U C A T I O N F O R A L L G L O B A L M O N I T O R I N G R E P O R T 2 0 1 5 E A S T A S I A A N D T H E PA C I F I C R E G I O N A L O V E R V I E W
New Guinea, will still be very far from the target, having reduced illiteracy by less than 30%. These two countries, together with Timor-Leste, still have adult literacy rates below 80%. Meanwhile, rates above 97% are reported in countries such as Samoa and Tonga.
■ The Dakar Framework made explicit reference for Goal 4 to be reached ‘especially for women’. Gender parity in adult literacy has been achieved or is close in most of the 18 countries with data in the region. However, marked gender disparities persist in countries such as Cambodia and the Lao People’s Democratic Republic where less than 80 adult women are literate for 100 men.
Direct assessment of literacy
■ Countries and international agencies are conducting more sophisticated investigations to gauge not only whether adults are ‘literate’ or ‘illiterate’ but also their level of literacy and the consequences for individuals and societies. Among these more accurate literacy surveys are the ones that form part of the Skills towards Employment and Productivity (STEP) surveys, launched by the World Bank in 13 middle income countries in 2010, and UNESCO’s Literacy Assessment and Monitoring Programme (LAMP) that defines three levels of literacy proficiency.
■ In Viet Nam, the STEP survey showed a relationship between reading proficiency and the amount of reading required by the respondent’s occupation. The average reading proficiency level among urban
workers in reading-intensive jobs in Viet Nam was similar to the levels found in France, Italy and Spain.
Goal 5: Gender parity and equality
Eliminating gender disparities in primary and secondary education by 2005, and achieving gender quality in education by 2015, with a focus on ensuring girls’ full and equal access to and achievement in basic education of good quality.
Gender disparities in primary education
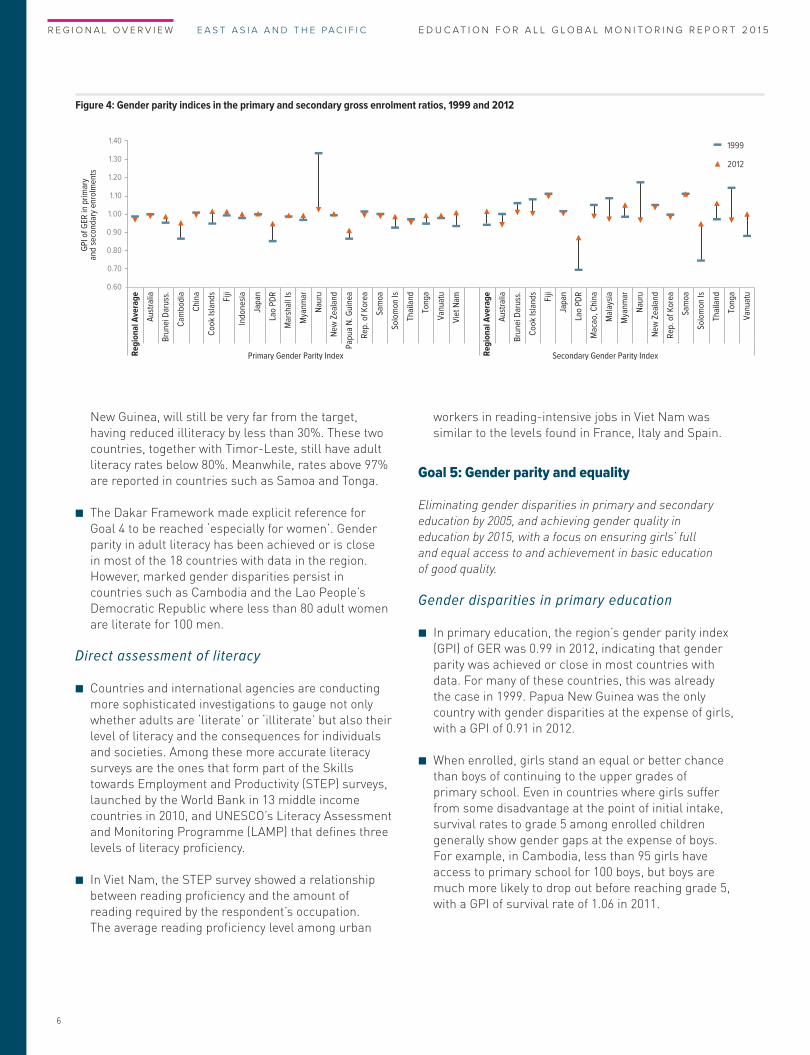
■ In primary education, the region’s gender parity index (GPI) of GER was 0.99 in 2012, indicating that gender parity was achieved or close in most countries with data. For many of these countries, this was already the case in 1999. Papua New Guinea was the only country with gender disparities at the expense of girls, with a GPI of 0.91 in 2012.
■ When enrolled, girls stand an equal or better chance than boys of continuing to the upper grades of primary school. Even in countries where girls suffer from some disadvantage at the point of initial intake, survival rates to grade 5 among enrolled children generally show gender gaps at the expense of boys. For example, in Cambodia, less than 95 girls have access to primary school for 100 boys, but boys are much more likely to drop out before reaching grade 5, with a GPI of survival rate of 1.06 in 2011.
Figure 4: Gender parity indices in the primary and secondary gross enrolment ratios, 1999 and 2012
0.60
0.70
0.80
0.90
1.00
1.10
1.20
1.30
1.40R
egio
nal
Ave
rag
e
Aus
tral
ia
Bru
nei D
arus
s.
Cam
bodi
a
Chi
na
Coo
k Is
land
s
Fiji
Indo
nesi
a
Japa
n
Lao
PDR
Mar
shal
l Is
Mya
nmar
Nau
ru
New
Zea
land
Papu
a N
. Gui
nea
Rep
. of K
orea
Sam
oa
Solo
mon
Is
Thai
land
Tong
a
Van
uatu
Vie
t Nam
Reg
ion
al A
vera
ge
Aus
tral
ia
Bru
nei D
arus
s.
Coo
k Is
land
s
Fiji
Japa
n
Lao
PDR
Mac
ao, C
hina
Mal
aysi
a
Mya
nmar
Nau
ru
New
Zea
land
Rep
. of K
orea
Sam
oa
Solo
mon
Is
Thai
land
Tong
a
Van
uatu
Primary Gender Parity Index Secondary Gender Parity Index
GPI
of G
ER in
prim
ary
and
seco
ndar
y en
rolm
ents
1999
2012
R E G I O N A L O V E R V I E W E A S T A S I A A N D T H E PA C I F I C E D U C A T I O N F O R A L L G L O B A L M O N I T O R I N G R E P O R T 2 0 1 5 E D U C A T I O N F O R A L L G L O B A L M O N I T O R I N G R E P O R T 2 0 1 5 E A S T A S I A A N D T H E PA C I F I C R E G I O N A L O V E R V I E W
7
Inequalities within countries
■ Poverty deepens gender disparities in completing primary education. In countries such as the Lao People’s Democratic Republic, where gender parity in primary attainment has been achieved between the richest girls and boys, the poorest girls still lag far behind the poorest boys. Among the richest children, the proportion of girls who attained full primary education rose from 88 per 100 boys in 2000 to parity in 2010, while among the poorest children it fell from 77 to 70 girls per 100 boys.
Gender disparities in secondary education
■ In secondary education, there has been a general movement towards gender parity in East Asia where the GPI of GER increased from 0.94 in 1999 to 1.01 in 2012. On the other hand, the Pacific sub-region has moved away from parity, as the GPI declined from 0.99 to 0.95. Important gender disparities at the expense of girls were observed in the Lao People’s Democratic Republic (0.87) and Papua New Guinea (0.76) while fewer boys were enrolled in several countries, including Fiji and Samoa, each with a GPI of 1.11 in 2012. Gender disparities in secondary education have been reduced in many countries over the period, either in favour of girls in countries like the Lao People’s Democratic Republic and Solomon Islands, or in favour of boys like in Nauru and Tonga, where parity was achieved or close to achieved by 2012.
■ Projections indicate that of 22 countries with data, only 13 will achieve gender parity in secondary education in 2015; one, Tonga will be close; and 8, including Australia, Kiribati and the Philippines will be far from the target with GPIs between 0.80 and 0.94.
Gender equality
■ Achieving gender equality in education requires not only that girls and boys have an equal chance to participate in education, but also that students benefit from a gender-sensitive learning environment.
■ The proportion of female teachers is typically an indicator of progress towards gender equality. In 2012, the share of female teachers in primary education in the East Asia and the Pacific region was 63%; at the secondary level the figure is close to 51%. Regional averages mask disparities across countries. In Cambodia, the Solomon Islands and Timor-Leste, female teachers accounted for less than half of the primary school teaching staff compared
with 95% in Tonga. Yet in Cambodia and Timor-Leste, the percentage of primary school female teachers increased by almost 10 percentage points, to 49% and 40% respectively in 2012. At the secondary level, the share of female teachers was only around 30% in the Solomon Islands and Timor-Leste; but was up to 85% in Myanmar.
■ The EFA movement provided new impetus for governments to address gender bias in education. But despite attempts to provide greater gender balance, recent studies show gender bias in textbooks remains pervasive in many countries, including some high income countries such as Australia.
■ School-related gender-based violence seriously undermines attempts to achieve gender equality in education. Findings from a recent study of five countries in Asia highlight incidences of sexual violence against both boys and girls. In Viet Nam, 21% of girls and 17% of boys aged 12–17 reported experiencing sexual violence at school. Physical violence, including corporal punishment, also has gendered dimensions. In Indonesia, 27% of boys aged 12–17 reported having been physically punished by a teacher in the previous six months, compared with 9% of girls. In Thailand, research found 56% of lesbian, gay, bisexual and transgender students had reported being bullied in the past month.
■ Learning assessments highlight gender differences in subject performance. Results from the 2012 Programme for International Student Assessment (PISA) show that boys outperform girls in mathematics, while girls increasingly outperform boys in reading by a wider margin. In Thailand, girls perform better than boys in reading and the gaps have increased over time. In Japan, gender disparities in favour of boys in mathematics widened between the initial wave of assessments (2000-06) to the later wave (2009-12).
■ PISA data also reveal girls were underrepresented among the highest achievers in mathematics and science, a possible challenge to their future achievement of equal participation in science, technology, engineering and mathematics occupations.
■ In the few countries with data available in the region, the share of female tertiary students in science ranged from 13% in Macao, China, to almost 74% in Palau in 2012. In the field of engineering/manufacturing and construction, the percentage
8
R E G I O N A L O V E R V I E W S U B - S A H A R A N A F R I C A E D U C A T I O N F O R A L L G L O B A L M O N I T O R I N G R E P O R T 2 0 1 5
ranged from 8% in Palau in 2013 to 45% in Brunei Darussalam and Myanmar in 2012. In the Republic of Korea, the proportion of female computer science graduates fell from around 40% to under 25% of total graduates by 2013.
Goal 6: Quality of education
Improving all aspects of the quality of education and ensuring excellence of all so that recognized and measurable learning outcomes are achieved by all, especially in literacy, numeracy and essential life skills.
Monitoring progress in learning outcomes
■ More and more countries have been carrying out national assessments, which aim to provide countrywide information about learning outcomes according to nationally defined standards. If conducted and analyzed rigorously, national assessments can help national authorities identify effective strategies to improve student knowledge, skills and competences in different subject areas.
■ In East Asia and the Pacific, the percentage of countries that carried out at least one national assessment between 2000 and 2013 was 67%, as compared with only 17% between 1990 and 1999. National assessments are predominantly curriculum-based and subject-oriented, unlike some international assessments (PISA), which focus on cross-curricular knowledge, skills or competencies.
■ In addition to the growing use of national assessments, countries have increasingly joined cross-national comparisons of student achievement such as PISA, TIMSS and PIRLS. The resulting data from these international assessments, which were carried out in some East Asian countries – Indonesia, Japan, Malaysia, the Republic of Korea and Thailand – allow the assessment of organizational, curricular and family-background components of students’ academic proficiency, and of overall national progress, including in terms of inequality. PISA participation has also helped build national capacity for using data through the drafting of national reports, analysis of results and assessment of a wider range of skills.
Investing in teachers
■ The total number of primary school teachers in East Asia and the Pacific increased slightly by 4% since 1999 to 9.6 million in 2012. The regional average
primary pupil/teacher ratio declined from 24:1 in 1999 to 19:1 in 2012. PTRs declined in the vast majority of the twenty countries with data, particularly in Timor-Leste and Macao, China. In Timor-Leste, the average number of pupils per teacher almost halved from nearly 62:1 to 31:1 between 2001 and 2011. Samoa and the Solomon Islands are among the few countries that experienced an increase of their PTR, by 6 and nearly 5 pupils per teacher respectively to 24:1 and 30:1. In 2012, PTRs varied across countries in the region, ranging from less than 11:1 in Brunei Darussalam to nearly 46:1 in Cambodia, where teacher shortages remain despite some improvement in recruitment since 2001 when their PTR was 53:1.
■ Among the very few countries with data, the lack of trained primary school teachers is an issue. In the Solomon Islands, only 54% of teachers were trained according to national standards in 2012. On the other hand, all teachers were trained in Cambodia, Fiji, Myanmar and Viet Nam. In Myanmar and Viet Nam, the percentage of trained teachers increased by wide margins from 60% and 78% respectively in 1999 to almost 100% in 2012, which led to a significant improvement in the ratio of pupils to trained teacher from 51:1 to 28:1 in Myanmar and from 39:1 to 19:1 in Viet Nam.
Teaching and learning materials
■ Education policies regarding ICT in the early 2000s called for establishing computer laboratories in schools, acquiring equipment, and providing teacher training and support. In high income countries, this trend is reflected in the improving ratio of students to computers. Between 2000 and 2009, the learner/computer ratio in schools attended by 15-year-olds dropped in Japan. However, in developing countries in East Asia and the Pacific, computer resources remain greatly overstretched, especially in primary schools. In the Philippines, over 100 learners share a single computer at the primary level. Wide disparities also exist within countries. In China, the primary learner/computer ratio in rural areas is 29:1, twice that in urban areas.
Instructional time
■ International agencies and reports have recommended that primary schools operate between 850 and 1,000 hours per year, or about 200 days, assuming a five-day school week. Instructional time has been shown to enhance learners’ exposure to

E D U C A T I O N F O R A L L G L O B A L M O N I T O R I N G R E P O R T 2 0 1 5 S U B - S A H A R A N A F R I C A R E G I O N A L O V E R V I E W
9
Box 1: Examples of policies implemented over the past 15 years to:
INCREASE ACCESS
f Mandating attendance and
reducing cost:
� Pre-primary education: Governments
have taken a variety of actions to
expand pre-primary education,
including laws to mandate
participation. The Philippines mandated
one year of compulsory pre-primary
education in 2012; Myanmar did this in
recent years too. Financial incentives
for enrolment can also help. In rural
China, an experimental programme
provided families with a tuition
waiver and a cash transfer that was
conditional on an attendance rate of
80% or more. Children in participating
families were 20% more likely to
attend pre-primary school than non-
participants.
� Primary education: Cash transfer
programmes to vulnerable households
have been used in many countries
to meet demand for education and
increase access to and participation in
school. A cash transfer pilot programme
in 2008 in the Philippines was
quickly expanded to reach 3 million
households, equal to over 60% of the
poorest households, by mid-2012.
EXTENDING EDUCATIONAL OPPORTUNITIES
f Children with disabilities: Children
with disabilities have a higher risk of
education exclusion. Viet Nam has shown
a prolonged, profound commitment
to inclusive education by gradually
developing adequately resourced, large-
scale programmes, including strategies
for curriculum reform and teacher training.
Rural and urban pilot projects in the early
1990s offered relatively cost-effective
teacher training and technical assistance
for inclusion. While having a disability is
still linked significantly to poverty and
reduced education outcomes in Viet Nam,
the success of the pilot programmes
helped policy-makers see new possibilities
for disability-related inclusion, and
encouraged the adoption of new laws and
policies. However, a persistent challenge
to policy implementation has been a lack
of clarity over the interpretation of and
strategies for inclusive education.
f Migrant children and youth: At the
time of the Dakar Forum, rural migrants
faced severe challenges due to China’s
household registration system (hukou), but
the country has taken steps to promote
their schooling in recent years. A 2006
amendment to the 1986 Compulsory
Education Law stated that local
governments should provide education
to migrant children. Like urban-born
students, an overwhelming majority of
rural migrant children now attend urban
public schools with sufficient facilities and
manageable class sizes.
PROMOTE GENDER EQUALITY
f Reducing costs of schooling:
Scholarships and stipends can help girls
continue their education. In Cambodia,
scholarships for girls to make the
transition from primary to secondary
school, conditional on regular attendance
and grade progression, helped increase
girls’ enrolment by between 22 and 32
percentage points.
f Reducing distance to school: Girls’
enrolment and attendance are particularly
sensitive to distances to school. In China,
where fewer girls than boys complete
a secondary education, a recent study
of 102 rural communities in 7 provinces
found that the presence of a local primary
school increased girls’ lower secondary
attainment by 17 percentage points. But a
policy to merge rural primary schools has
reduced the numbers of rural schools from
440,000 in 2000 to 253,000 in 2008,
which may negatively impact attainment
levels.
knowledge and result in significant learning gains. In the late 2000s, countries in East Asia and the Pacific mandated 800 hours of instructional time per year in the early primary grades, increasing to 908 hours in grade 8.
■ However, the official time planned for instruction does not necessarily reflect the actual time. Teacher absenteeism takes a toll on student learning by reducing the number of hours that children are actually taught. For example, one-third of pupils in the Philippines reported problems with teachers’ late arrival, absenteeism and skipping class.
Government policies and actions to accelerate progress towards EFA goals since 2000
Various policy approaches have been designed and implemented over the 15 past years to expand quality ECCE programmes, increase equitable access to education, improve school completion and education quality, and promote gender equality in education. Box 1 indicates some of the policies and strategies that governments in East Asia and the Pacific have put in place to tackle the twin challenges of equity and quality.
10
R E G I O N A L O V E R V I E W E A S T A S I A A N D T H E PA C I F I C E D U C A T I O N F O R A L L G L O B A L M O N I T O R I N G R E P O R T 2 0 1 5 E D U C A T I O N F O R A L L G L O B A L M O N I T O R I N G R E P O R T 2 0 1 5 E A S T A S I A A N D T H E PA C I F I C R E G I O N A L O V E R V I E W
f Integrating gender-sensitive training
into teacher training: Some governments
have made efforts to include gender
training in formal teacher education
policy and programmes. In Indonesia,
gender-sensitive training was introduced
as a strategy to improve the quality of
education. Papua New Guinea’s 2009–
2014 Gender Equity Strategic Plan calls
for gender equity to inform all pre-service
and in-service teacher training.
IMPROVE QUALITY
f Deploying teachers equitably: Over
the past decade, governments have
tried to address challenges to teacher
deployment in various ways, including
centralized deployment; incentives
such as housing, financial benefits
and accelerated promotion; and local
recruitment. In the Republic of Korea,
teachers in disadvantaged schools
benefit from incentives such as additional
stipends, smaller class sizes, less teaching
time, the chance to choose their next
school after teaching in a difficult area,
and greater promotion opportunities.
Improved data and transparent
management can help in implementing
teacher deployment policies. Since
2003, the Rainbow Spectrum initiative
in the Philippines has used a system of
colour coding linked to pupil/teacher
ratios to make disparity more visible:
blue signals districts with ratios below
25:1, red indicates a ratio over 50:1, and
black signals a dire teacher shortage. The
initiative has raised awareness of teacher
deployment issues by making information
more readily available and easily
understandable. Between 2009 and 2011,
over 60% of new teacher allocation went
to black and red areas.
f Improving the status of the teaching
profession: Some countries have taken
steps to raise the status of the teaching
profession. In Indonesia, under the 2005
Teacher Law, teachers are required
to acquire a four year degree and be
certified. Teachers who obtain certification
then receive a professional allowance that
doubles their salaries. Between 2006 and
2011, the percentage of primary teachers
with a four year degree increased by
176%. The fivefold increase in enrolment
in university education programmes,
from 200,000 in 2005 to 1 million in
2010, suggests that certification and
higher income might have increased the
attractiveness of the profession.
In several East Asian countries, induction
programmes have been introduced
to help new teachers cope with the
practicalities of teaching, managing
groups and adjusting to the school
environment. Most programmes provide
classroom release time for new teachers
to participate in induction activities and
allow for the training of mentor teachers.
In Singapore, new primary teachers
attend formal induction programmes at
both the national and the school level
and receive guidance from experienced
mentors or senior teachers during their
first two years.
f Decentralization of education
governance: The decentralization of
education governance has become more
common since 2000. Most countries
have transferred responsibility away from
central governments. The transfer has
taken various forms, including assigning
tasks to lower levels within ministries,
devolving decision-making to elected
representatives at subnational levels, and
investing authority and responsibility in
schools and communities. In Cambodia,
China, Indonesia, the Philippines and
Thailand, national or subnational
governments set lower secondary
curriculum content, instructional time and
teacher salaries, and allocate resources to
schools, but leave the choice of teaching
methods and support activities for
students to schools.
Financing Education for All
Mobilize strong national and international political commitment for education for all, develop national action plans and enhance significantly investment in education.
Domestic expenditure on education
■ In 2012, half of countries with data in East Asia and the Pacific spent less than 3.4% of their GNP on education, the lowest median of all EFA regions. The percentage ranges from only 0.8% in Myanmar to nearly 8% or more in New Zealand and the Solomon Islands.
■ The share of national income devoted to education increased between 1999 and 2012 in the majority of the 16 countries with data, with increases by nearly 2 percentage points in Cambodia and the Lao People’s
Democratic Republic where the share in 2012 was, however, still below 3%. The percentage of GNP spent on education declined in several countries, including in Brunei Darussalam where it dropped from 4.9% to 2% between 1999 and 2010.
■ In much of the region economic growth over 1999-2012 averaged 4.5% per annum and was outpaced by growth in public expenditure on education that averaged 5.4% per year. In fact in 9 of the 13 East Asia and Pacific countries with data, increases in public spending on education exceeded economic growth.
■ In 2012, the median share of total government expenditure on education was 17.5% with a wide variation across countries. The percentage of government budget on education ranged from 4% in Myanmar to 31% in Thailand. While education is not a priority in many national budgets in the region, progress is noted. In most of the 15 countries
R E G I O N A L O V E R V I E W E A S T A S I A A N D T H E PA C I F I C E D U C A T I O N F O R A L L G L O B A L M O N I T O R I N G R E P O R T 2 0 1 5 E D U C A T I O N F O R A L L G L O B A L M O N I T O R I N G R E P O R T 2 0 1 5 E A S T A S I A A N D T H E PA C I F I C R E G I O N A L O V E R V I E W
11
with data, the share of government expenditure on education has improved since 1999, particularly in Thailand where it increased from 21% to 31%, but also in Indonesia where it grew from 11% to 18%.
■ The allocation of education expenditure is not equitable. Primary education is a priority in many countries in the region, accounting for more than 35% of the total education expenditure in 2012 in half of the countries with data. The median share of pre-primary education was just 2%.
International development assistance
■ Levels of aid to basic education for the East Asia and Pacific region increased from US$249 million to US$664 million over the decade. Annual growth rates of aid disbursements to basic education averaged 10% per year between 2002 and 2012.
■ Aid provision was once the preserve of OECD donors, but this has changed since Dakar, with emerging donors formalizing development cooperation through the creation of aid agencies. China recently published a white paper on foreign assistance indicating that between 2010 and 2012, it funded the education sector by constructing and maintaining school buildings, training teachers and offering almost 77,000 scholarships for foreign students to study in China. Foreign scholarships are estimated to have more than tripled from US$119 million in 2009 to US$416 million in 2012. Chinese aid for vocational training totalled US$68 million in 2012.
12
R E G I O N A L O V E R V I E W E A S T A S I A A N D T H E PA C I F I C E D U C A T I O N F O R A L L G L O B A L M O N I T O R I N G R E P O R T 2 0 1 5 E D U C A T I O N F O R A L L G L O B A L M O N I T O R I N G R E P O R T 2 0 1 5 E A S T A S I A A N D T H E PA C I F I C R E G I O N A L O V E R V I E W
Abbreviations
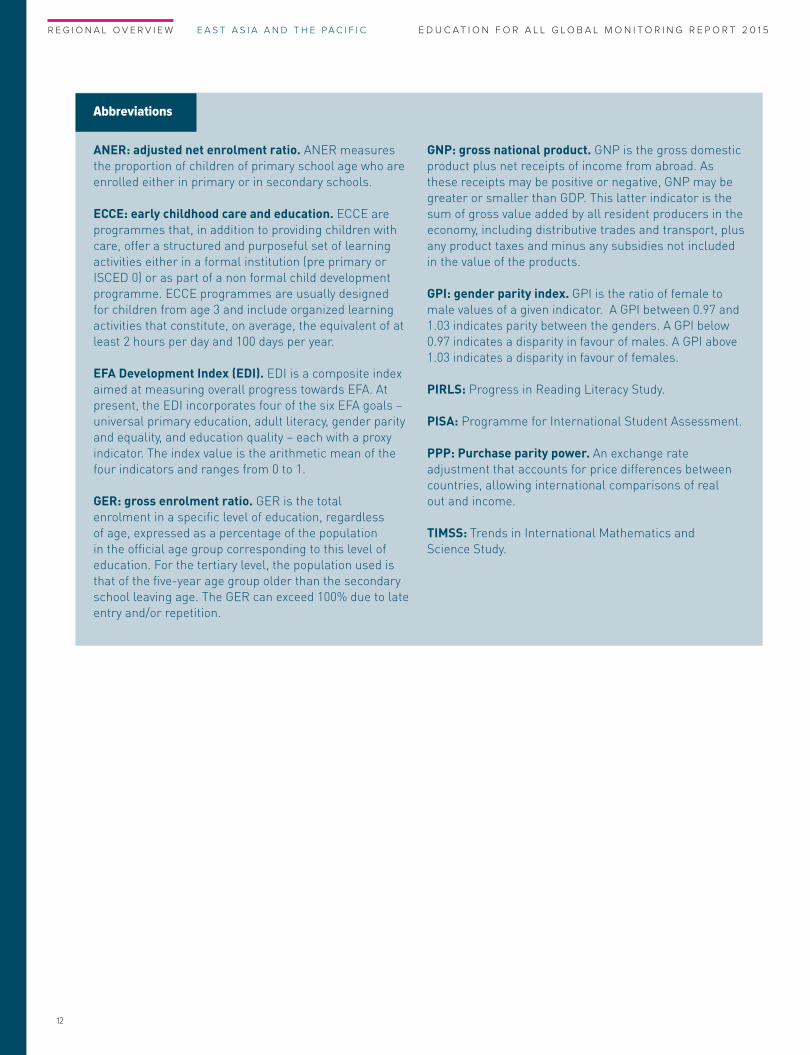
ANER: adjusted net enrolment ratio. ANER measures the proportion of children of primary school age who are enrolled either in primary or in secondary schools.
ECCE: early childhood care and education. ECCE are programmes that, in addition to providing children with care, offer a structured and purposeful set of learning activities either in a formal institution (pre primary or ISCED 0) or as part of a non formal child development programme. ECCE programmes are usually designed for children from age 3 and include organized learning activities that constitute, on average, the equivalent of at least 2 hours per day and 100 days per year.
EFA Development Index (EDI). EDI is a composite index aimed at measuring overall progress towards EFA. At present, the EDI incorporates four of the six EFA goals – universal primary education, adult literacy, gender parity and equality, and education quality – each with a proxy indicator. The index value is the arithmetic mean of the four indicators and ranges from 0 to 1.
GER: gross enrolment ratio. GER is the total enrolment in a specific level of education, regardless of age, expressed as a percentage of the population in the official age group corresponding to this level of education. For the tertiary level, the population used is that of the five-year age group older than the secondary school leaving age. The GER can exceed 100% due to late entry and/or repetition.
GNP: gross national product. GNP is the gross domestic product plus net receipts of income from abroad. As these receipts may be positive or negative, GNP may be greater or smaller than GDP. This latter indicator is the sum of gross value added by all resident producers in the economy, including distributive trades and transport, plus any product taxes and minus any subsidies not included in the value of the products.
GPI: gender parity index. GPI is the ratio of female to male values of a given indicator. A GPI between 0.97 and 1.03 indicates parity between the genders. A GPI below 0.97 indicates a disparity in favour of males. A GPI above 1.03 indicates a disparity in favour of females.
PIRLS: Progress in Reading Literacy Study.
PISA: Programme for International Student Assessment.
PPP: Purchase parity power. An exchange rate adjustment that accounts for price differences between countries, allowing international comparisons of real out and income.
TIMSS: Trends in International Mathematics and Science Study.
R E G I O N A L O V E R V I E W E A S T A S I A A N D T H E PA C I F I C E D U C A T I O N F O R A L L G L O B A L M O N I T O R I N G R E P O R T 2 0 1 5 E D U C A T I O N F O R A L L G L O B A L M O N I T O R I N G R E P O R T 2 0 1 5 E A S T A S I A A N D T H E PA C I F I C R E G I O N A L O V E R V I E W
13
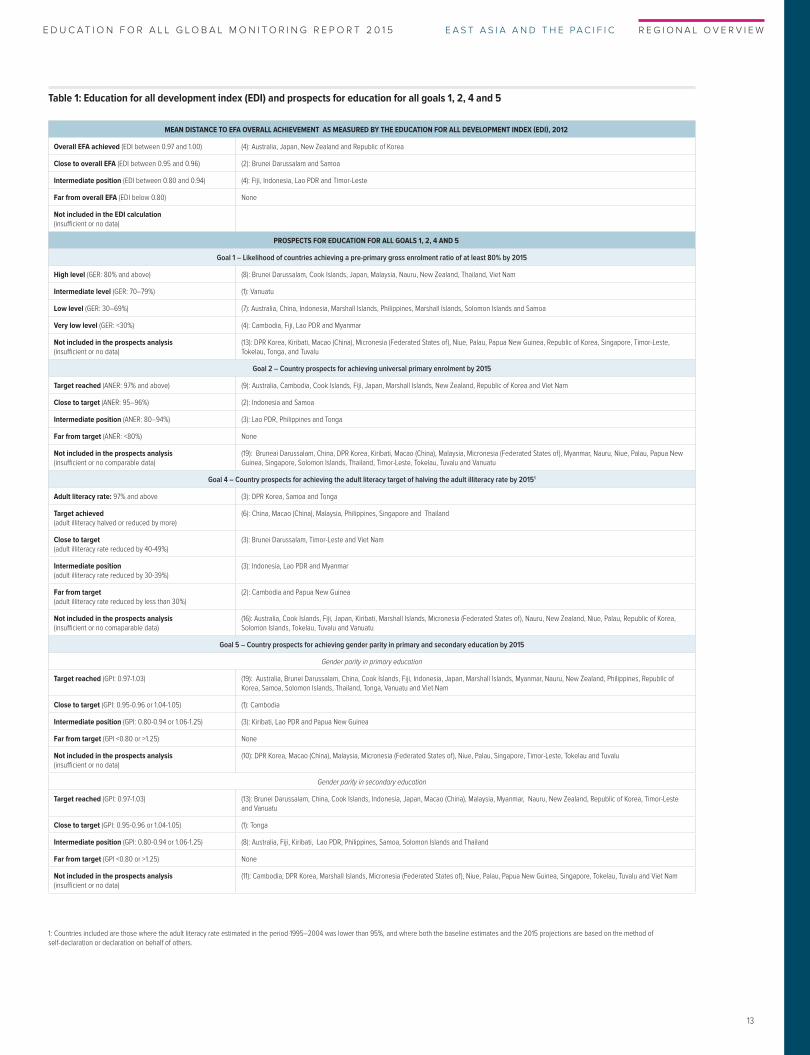
Table 1: Education for all development index (EDI) and prospects for education for all goals 1, 2, 4 and 5
MEAN DISTANCE TO EFA OVERALL ACHIEVEMENT AS MEASURED BY THE EDUCATION FOR ALL DEVELOPMENT INDEX (EDI), 2012
Overall EFA achieved (EDI between 0.97 and 1.00) (4): Australia, Japan, New Zealand and Republic of Korea
Close to overall EFA (EDI between 0.95 and 0.96) (2): Brunei Darussalam and Samoa
Intermediate position (EDI between 0.80 and 0.94) (4): Fiji, Indonesia, Lao PDR and Timor-Leste
Far from overall EFA (EDI below 0.80) None
Not included in the EDI calculation (insufficient or no data)
PROSPECTS FOR EDUCATION FOR ALL GOALS 1, 2, 4 AND 5
Goal 1 – Likelihood of countries achieving a pre-primary gross enrolment ratio of at least 80% by 2015
High level (GER: 80% and above) (8): Brunei Darussalam, Cook Islands, Japan, Malaysia, Nauru, New Zealand, Thailand, Viet Nam
Intermediate level (GER: 70–79%) (1): Vanuatu
Low level (GER: 30–69%) (7): Australia, China, Indonesia, Marshall Islands, Philippines, Marshall Islands, Solomon Islands and Samoa
Very low level (GER: <30%) (4): Cambodia, Fiji, Lao PDR and Myanmar
Not included in the prospects analysis (insufficient or no data)
(13): DPR Korea, Kiribati, Macao (China), Micronesia (Federated States of), Niue, Palau, Papua New Guinea, Republic of Korea, Singapore, Timor-Leste, Tokelau, Tonga, and Tuvalu
Goal 2 – Country prospects for achieving universal primary enrolment by 2015
Target reached (ANER: 97% and above) (9): Australia, Cambodia, Cook Islands, Fiji, Japan, Marshall Islands, New Zealand, Republic of Korea and Viet Nam
Close to target (ANER: 95–96%) (2): Indonesia and Samoa
Intermediate position (ANER: 80–94%) (3): Lao PDR, Philippines and Tonga
Far from target (ANER: <80%) None
Not included in the prospects analysis (insufficient or no comparable data)
(19): Bruneai Darussalam, China, DPR Korea, Kiribati, Macao (China), Malaysia, Micronesia (Federated States of), Myanmar, Nauru, Niue, Palau, Papua New Guinea, Singapore, Solomon Islands, Thailand, Timor-Leste, Tokelau, Tuvalu and Vanuatu
Goal 4 – Country prospects for achieving the adult literacy target of halving the adult illiteracy rate by 20151
Adult literacy rate: 97% and above (3): DPR Korea, Samoa and Tonga
Target achieved (adult illiteracy halved or reduced by more)
(6): China, Macao (China), Malaysia, Philippines, Singapore and Thailand
Close to target (adult illiteracy rate reduced by 40-49%)
(3): Brunei Darussalam, Timor-Leste and Viet Nam
Intermediate position (adult illiteracy rate reduced by 30-39%)
(3): Indonesia, Lao PDR and Myanmar
Far from target (adult illiteracy rate reduced by less than 30%)
(2): Cambodia and Papua New Guinea
Not included in the prospects analysis (insufficient or no comaparable data)
(16): Australia, Cook Islands, Fiji, Japan, Kiribati, Marshall Islands, Micronesia (Federated States of), Nauru, New Zealand, Niue, Palau, Republic of Korea, Solomon Islands, Tokelau, Tuvalu and Vanuatu
Goal 5 – Country prospects for achieving gender parity in primary and secondary education by 2015
Gender parity in primary education
Target reached (GPI: 0.97-1.03) (19): Australia, Brunei Darussalam, China, Cook Islands, Fiji, Indonesia, Japan, Marshall Islands, Myanmar, Nauru, New Zealand, Philippines, Republic of Korea, Samoa, Solomon Islands, Thailand, Tonga, Vanuatu and Viet Nam
Close to target (GPI: 0.95-0.96 or 1.04-1.05) (1): Cambodia
Intermediate position (GPI: 0.80-0.94 or 1.06-1.25) (3): Kiribati, Lao PDR and Papua New Guinea
Far from target (GPI <0.80 or >1.25) None
Not included in the prospects analysis (insufficient or no data)
(10): DPR Korea, Macao (China), Malaysia, Micronesia (Federated States of), Niue, Palau, Singapore, Timor-Leste, Tokelau and Tuvalu
Gender parity in secondary education
Target reached (GPI: 0.97-1.03) (13): Brunei Darussalam, China, Cook Islands, Indonesia, Japan, Macao (China), Malaysia, Myanmar, Nauru, New Zealand, Republic of Korea, Timor-Leste and Vanuatu
Close to target (GPI: 0.95-0.96 or 1.04-1.05) (1): Tonga
Intermediate position (GPI: 0.80-0.94 or 1.06-1.25) (8): Australia, Fiji, Kiribati, Lao PDR, Philippines, Samoa, Solomon Islands and Thailand
Far from target (GPI <0.80 or >1.25) None
Not included in the prospects analysis (insufficient or no data)
(11): Cambodia, DPR Korea, Marshall Islands, Micronesia (Federated States of), Niue, Palau, Papua New Guinea, Singapore, Tokelau, Tuvalu and Viet Nam
1: Countries included are those where the adult literacy rate estimated in the period 1995–2004 was lower than 95%, and where both the baseline estimates and the 2015 projections are based on the method of self-declaration or declaration on behalf of others.
14
R E G I O N A L O V E R V I E W E A S T A S I A A N D T H E PA C I F I C E D U C A T I O N F O R A L L G L O B A L M O N I T O R I N G R E P O R T 2 0 1 5 E D U C A T I O N F O R A L L G L O B A L M O N I T O R I N G R E P O R T 2 0 1 5 E A S T A S I A A N D T H E PA C I F I C R E G I O N A L O V E R V I E W
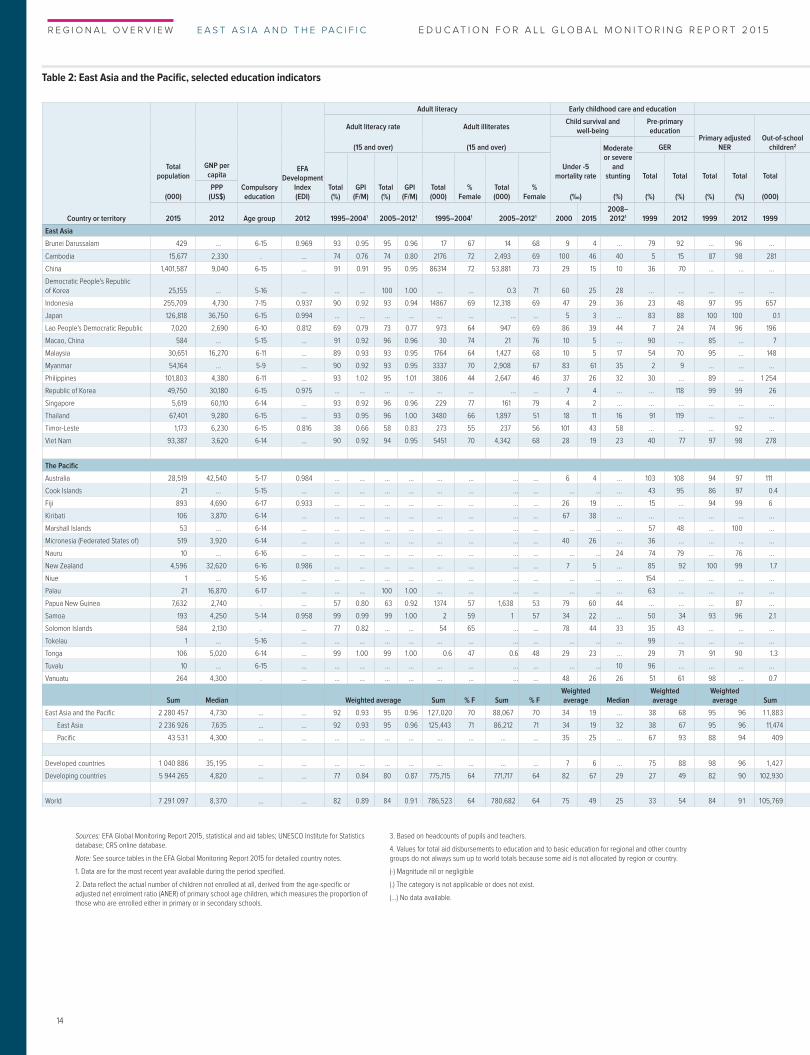
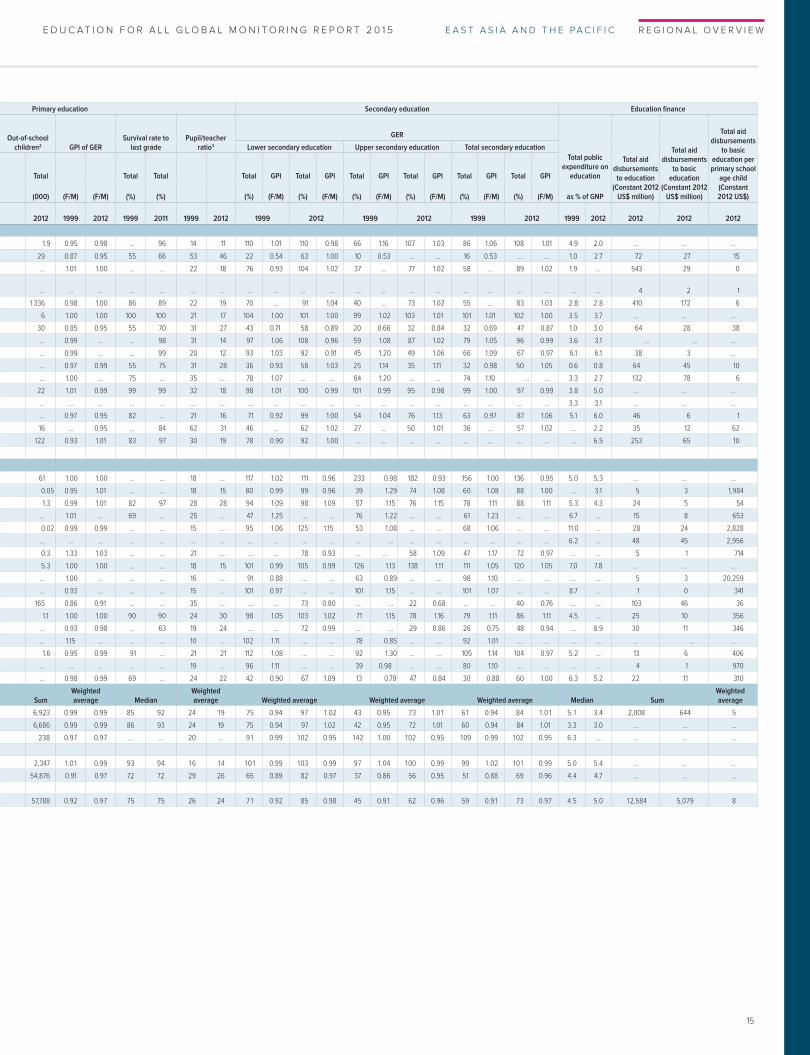
Table 2: East Asia and the Pacific, selected education indicators
Country or territory
Total population
(000)
GNP per capita
Compulsory education
EFA Development
Index (EDI)
Adult literacy Early childhood care and education Primary education Secondary education Education finance
Adult literacy rate
(15 and over)
Adult illiterates
(15 and over)
Child survival and well-being
Pre-primary education
Primary adjusted NER
Out-of-school children2
Out-of-school children2 GPI of GER
Survival rate to last grade
Pupil/teacher ratio3
GER
Total public expenditure on
education
as % of GNP
Total aid disbursements
to education (Constant 2012
US$ million)
Total aid disbursements
to basic education
(Constant 2012 US$ million)
Total aid disbursements
to basic education per primary school
age child (Constant 2012 US$)
Under -5 mortality rate
(‰)
Moderate or severe
and stunting
(%)
GER Lower secondary education Upper secondary education Total secondary education
Total (%)
GPI (F/M)
Total (%)
GPI (F/M)
Total (000)
% Female
Total (000)
% Female
Total
(%)
Total
(%)
Total
(%)
Total
(%)
Total
(000)
Total
(000) (F/M) (F/M)
Total
(%)
Total
(%)
Total
(%)
GPI
(F/M)
Total
(%)
GPI
(F/M)
Total
(%)
GPI
(F/M)
Total
(%)
GPI
(F/M)
Total
(%)
GPI
(F/M)
Total
(%)
GPI
(F/M)PPP
(US$)
2015 2012 Age group 2012 1995–20041 2005–20121 1995–20041 2005–20121 2000 20152008–20121 1999 2012 1999 2012 1999 2012 1999 2012 1999 2011 1999 2012 1999 2012 1999 2012 1999 2012 1999 2012 2012 2012 2012
East Asia
Brunei Darussalam 429 ... 6-15 0.969 93 0.95 95 0.96 17 67 14 68 9 4 ... 79 92 ... 96 ... 1.9 0.95 0.98 ... 96 14 11 110 1.01 110 0.98 66 1.16 107 1.03 86 1.06 108 1.01 4.9 2.0 ... ... ...
Cambodia 15,677 2,330 . … 74 0.76 74 0.80 2176 72 2,493 69 100 46 40 5 15 87 98 281 29 0.87 0.95 55 66 53 46 22 0.54 63 1.00 10 0.53 ... ... 16 0.53 ... ... 1.0 2.7 72 27 15
China 1,401,587 9,040 6-15 … 91 0.91 95 0.95 86314 72 53,881 73 29 15 10 36 70 ... ... ... ... 1.01 1.00 ... ... 22 18 76 0.93 104 1.02 37 ... 77 1.02 58 ... 89 1.02 1.9 ... 543 29 0
Democratic People's Republic of Korea 25,155 ... 5-16 … … … 100 1.00 ... ... 0.3 71 60 25 28 ... ... ... ... ... ... ... ... ... ... ... ... ... ... ... ... ... ... ... ... ... ... ... ... ... ... 4 2 1
Indonesia 255,709 4,730 7-15 0.937 90 0.92 93 0.94 14867 69 12,318 69 47 29 36 23 48 97 95 657 1 336 0.98 1.00 86 89 22 19 70 ... 91 1.04 40 ... 73 1.02 55 ... 83 1.03 2.8 2.8 410 172 6
Japan 126,818 36,750 6-15 0.994 … … … … ... … … … 5 3 ... 83 88 100 100 0.1 6 1.00 1.00 100 100 21 17 104 1.00 101 1.00 99 1.02 103 1.01 101 1.01 102 1.00 3.5 3.7 ... ... ...
Lao People's Democratic Republic 7,020 2,690 6-10 0.812 69 0.79 73 0.77 973 64 947 69 86 39 44 7 24 74 96 196 30 0.85 0.95 55 70 31 27 43 0.71 58 0.89 20 0.66 32 0.84 32 0.69 47 0.87 1.0 3.0 64 28 38
Macao, China 584 ... 5-15 … 91 0.92 96 0.96 30 74 21 76 10 5 ... 90 ... 85 ... 7 ... 0.99 ... ... 98 31 14 97 1.06 108 0.96 59 1.08 87 1.02 79 1.05 96 0.99 3.6 3.1 … … ...
Malaysia 30,651 16,270 6-11 … 89 0.93 93 0.95 1764 64 1,427 68 10 5 17 54 70 95 ... 148 ... 0.99 ... ... 99 20 12 93 1.03 92 0.91 45 1.20 49 1.06 66 1.09 67 0.97 6.1 6.1 38 3 ...
Myanmar 54,164 ... 5-9 … 90 0.92 93 0.95 3337 70 2,908 67 83 61 35 2 9 ... ... ... ... 0.97 0.99 55 75 31 28 36 0.93 58 1.03 25 1.14 35 1.11 32 0.98 50 1.05 0.6 0.8 64 45 10
Philippines 101,803 4,380 6-11 … 93 1.02 95 1.01 3806 44 2,647 46 37 26 32 30 ... 89 ... 1 254 ... 1.00 ... 75 ... 35 ... 78 1.07 ... ... 64 1.20 ... ... 74 1.10 ... ... 3.3 2.7 132 78 6
Republic of Korea 49,750 30,180 6-15 0.975 … … … … ... ... … … 7 4 ... ... 118 99 99 26 22 1.01 0.99 99 99 32 18 98 1.01 100 0.99 101 0.99 95 0.98 99 1.00 97 0.99 3.8 5.0 ... ... ...
Singapore 5,619 60,110 6-14 … 93 0.92 96 0.96 229 77 161 79 4 2 ... ... ... ... ... ... ... ... ... ... ... ... ... ... ... ... ... ... ... ... ... ... ... ... ... 3.3 3.1 ... ... ...
Thailand 67,401 9,280 6-15 … 93 0.95 96 1.00 3480 66 1,897 51 18 11 16 91 119 ... ... ... ... 0.97 0.95 82 ... 21 16 71 0.92 99 1.00 54 1.04 76 1.13 63 0.97 87 1.06 5.1 6.0 46 6 1
Timor-Leste 1,173 6,230 6-15 0.816 38 0.66 58 0.83 273 55 237 56 101 43 58 ... ... ... 92 ... 16 ... 0.95 ... 84 62 31 46 ... 62 1.02 27 ... 50 1.01 36 ... 57 1.02 ... 2.2 35 12 62
Viet Nam 93,387 3,620 6-14 … 90 0.92 94 0.95 5451 70 4,342 68 28 19 23 40 77 97 98 278 122 0.93 1.01 83 97 30 19 78 0.90 92 1.00 ... ... ... ... ... ... ... ... ... 6.5 253 65 10
The Pacific
Australia 28,519 42,540 5-17 0.984 … … … … ... … … … 6 4 ... 103 108 94 97 111 61 1.00 1.00 ... ... 18 ... 117 1.02 111 0.96 233 0.98 182 0.93 156 1.00 136 0.95 5.0 5.3 ... ... ...
Cook Islands 21 ... 5-15 … … … … … ... … … … ... ... ... 43 95 86 97 0.4 0.05 0.95 1.01 ... ... 18 15 80 0.99 99 0.96 39 1.29 74 1.08 60 1.08 88 1.00 ... 3.1 5 3 1,984
Fiji 893 4,690 6-17 0.933 … … … … ... … … … 26 19 ... 15 ... 94 99 6 1.3 0.99 1.01 82 97 28 28 94 1.09 98 1.09 57 1.15 76 1.15 78 1.11 88 1.11 5.3 4.3 24 5 54
Kiribati 106 3,870 6-14 … … … … … ... … … … 67 38 ... ... ... ... ... ... ... 1.01 ... 69 ... 25 ... 47 1.25 ... ... 76 1.22 ... ... 61 1.23 ... ... 6.7 ... 15 8 653
Marshall Islands 53 ... 6-14 … … … … … ... … … … ... ... ... 57 48 ... 100 ... 0.02 0.99 0.99 ... ... 15 ... 95 1.06 125 1.15 53 1.08 ... ... 68 1.06 ... ... 11.0 ... 28 24 2,828
Micronesia (Federated States of) 519 3,920 6-14 … … … … … ... … … … 40 26 ... 36 ... ... ... ... ... ... ... ... ... ... ... ... ... ... ... ... ... ... ... ... ... ... ... 6.2 ... 48 45 2,956
Nauru 10 ... 6-16 … … … … … ... … … … ... ... 24 74 79 ... 76 ... 0.3 1.33 1.03 ... ... 21 ... ... ... 78 0.93 ... ... 58 1.09 47 1.17 72 0.97 ... ... 5 1 714
New Zealand 4,596 32,620 6-16 0.986 … … … … ... … … … 7 5 ... 85 92 100 99 1.7 5.3 1.00 1.00 ... ... 18 15 101 0.99 105 0.99 126 1.13 138 1.11 111 1.05 120 1.05 7.0 7.8 ... ... ...
Niue 1 ... 5-16 … … … … … ... … … … ... ... ... 154 ... ... ... ... ... 1.00 ... ... ... 16 ... 91 0.88 ... ... 63 0.89 ... ... 98 1.10 ... ... ... ... 5 3 20,259
Palau 21 16,870 6-17 … … … 100 1.00 ... … … … ... ... ... 63 ... ... ... ... ... 0.93 ... ... ... 15 ... 101 0.97 ... ... 101 1.15 ... ... 101 1.07 ... ... 8.7 ... 1 0 341
Papua New Guinea 7,632 2,740 . … 57 0.80 63 0.92 1374 57 1,638 53 79 60 44 ... ... ... 87 ... 165 0.86 0.91 ... ... 35 ... ... ... 73 0.80 ... ... 22 0.68 ... ... 40 0.76 ... ... 103 46 36
Samoa 193 4,250 5-14 0.958 99 0.99 99 1.00 2 59 1 57 34 22 ... 50 34 93 96 2.1 1.1 1.00 1.00 90 90 24 30 98 1.05 103 1.02 71 1.15 78 1.16 79 1.11 86 1.11 4.5 ... 25 10 356
Solomon Islands 584 2,130 . … 77 0.82 … … 54 65 … … 78 44 33 35 43 ... ... ... ... 0.93 0.98 ... 63 19 24 ... ... 72 0.99 ... ... 29 0.86 26 0.75 48 0.94 ... 8.9 30 11 346
Tokelau 1 ... 5-16 … … … … … ... ... … … ... ... ... 99 ... ... ... ... ... 1.15 ... ... ... 10 ... 102 1.11 ... ... 78 0.85 ... ... 92 1.01 ... ... ... ... ... … ...
Tonga 106 5,020 6-14 … 99 1.00 99 1.00 0.6 47 0.6 48 29 23 ... 29 71 91 90 1.3 1.6 0.95 0.99 91 ... 21 21 112 1.08 ... ... 92 1.30 ... ... 105 1.14 104 0.97 5.2 ... 13 6 406
Tuvalu 10 ... 6-15 … … … … … ... … … … ... ... 10 96 ... ... ... ... ... ... ... ... ... 19 ... 96 1.11 ... ... 39 0.98 ... ... 80 1.10 ... ... ... ... 4 1 970
Vanuatu 264 4,300 . … … … … … ... … … … 48 26 26 51 61 98 ... 0.7 ... 0.98 0.99 69 ... 24 22 42 0.90 67 1.09 13 0.79 47 0.84 30 0.88 60 1.00 6.3 5.2 22 11 310
Sum Median Weighted average Sum % F Sum % FWeighted average Median
Weighted average
Weighted average Sum Sum
Weighted average Median
Weighted average Weighted average Weighted average Weighted average Median Sum
Weighted average
East Asia and the Pacific 2 280 457 4,730 ... … 92 0.93 95 0.96 127,020 70 88,067 70 34 19 ... 38 68 95 96 11,883 6,923 0.99 0.99 85 92 24 19 75 0.94 97 1.02 43 0.95 73 1.01 61 0.94 84 1.01 5.1 3.4 2,008 644 5
East Asia 2 236 926 7,635 ... … 92 0.93 95 0.96 125,443 71 86,212 71 34 19 32 38 67 95 96 11,474 6,686 0.99 0.99 86 93 24 19 75 0.94 97 1.02 42 0.95 72 1.01 60 0.94 84 1.01 3.3 3.0 … … …
Pacific 43 531 4,300 ... … … … … … … … … … 35 25 ... 67 93 88 94 409 238 0.97 0.97 ... ... 20 ... 91 0.99 102 0.95 142 1.00 102 0.95 109 0.99 102 0.95 6.3 … … … …
Developed countries 1 040 886 35,195 ... … … … … … … … … … 7 6 ... 75 88 98 96 1,427 2,347 1.01 0.99 93 94 16 14 101 0.99 103 0.99 97 1.04 100 0.99 99 1.02 101 0.99 5.0 5.4 … ... ...
Developing countries 5 944 265 4,820 ... … 77 0.84 80 0.87 775,715 64 771,717 64 82 67 29 27 49 82 90 102,930 54,876 0.91 0.97 72 72 29 26 65 0.89 82 0.97 37 0.86 56 0.95 51 0.88 69 0.96 4.4 4.7 … … …
World 7 291 097 8,370 ... … 82 0.89 84 0.91 786,523 64 780,682 64 75 49 25 33 54 84 91 105,769 57,788 0.92 0.97 75 75 26 24 71 0.92 85 0.98 45 0.91 62 0.96 59 0.91 73 0.97 4.5 5.0 12,584 5,079 8
Sources: EFA Global Monitoring Report 2015, statistical and aid tables; UNESCO Institute for Statistics database; CRS online database.
Note: See source tables in the EFA Global Monitoring Report 2015 for detailed country notes.
1. Data are for the most recent year available during the period specified.
2. Data reflect the actual number of children not enrolled at all, derived from the age-specific or adjusted net enrolment ratio (ANER) of primary school age children, which measures the proportion of those who are enrolled either in primary or in secondary schools.
3. Based on headcounts of pupils and teachers.
4. Values for total aid disbursements to education and to basic education for regional and other country groups do not always sum up to world totals because some aid is not allocated by region or country.
(-) Magnitude nil or negligible
(.) The category is not applicable or does not exist.
(…) No data available.
15
R E G I O N A L O V E R V I E W E A S T A S I A A N D T H E PA C I F I C E D U C A T I O N F O R A L L G L O B A L M O N I T O R I N G R E P O R T 2 0 1 5 E D U C A T I O N F O R A L L G L O B A L M O N I T O R I N G R E P O R T 2 0 1 5 E A S T A S I A A N D T H E PA C I F I C R E G I O N A L O V E R V I E W
Table 2: East Asia and the Pacific, selected education indicators
Country or territory
Total population
(000)
GNP per capita
Compulsory education
EFA Development
Index (EDI)
Adult literacy Early childhood care and education Primary education Secondary education Education finance
Adult literacy rate
(15 and over)
Adult illiterates
(15 and over)
Child survival and well-being
Pre-primary education
Primary adjusted NER
Out-of-school children2
Out-of-school children2 GPI of GER
Survival rate to last grade
Pupil/teacher ratio3
GER
Total public expenditure on
education
as % of GNP
Total aid disbursements
to education (Constant 2012
US$ million)
Total aid disbursements
to basic education
(Constant 2012 US$ million)
Total aid disbursements
to basic education per primary school
age child (Constant 2012 US$)
Under -5 mortality rate
(‰)
Moderate or severe
and stunting
(%)
GER Lower secondary education Upper secondary education Total secondary education
Total (%)
GPI (F/M)
Total (%)
GPI (F/M)
Total (000)
% Female
Total (000)
% Female
Total
(%)
Total
(%)
Total
(%)
Total
(%)
Total
(000)
Total
(000) (F/M) (F/M)
Total
(%)
Total
(%)
Total
(%)
GPI
(F/M)
Total
(%)
GPI
(F/M)
Total
(%)
GPI
(F/M)
Total
(%)
GPI
(F/M)
Total
(%)
GPI
(F/M)
Total
(%)
GPI
(F/M)PPP
(US$)
2015 2012 Age group 2012 1995–20041 2005–20121 1995–20041 2005–20121 2000 20152008–20121 1999 2012 1999 2012 1999 2012 1999 2012 1999 2011 1999 2012 1999 2012 1999 2012 1999 2012 1999 2012 2012 2012 2012
East Asia
Brunei Darussalam 429 ... 6-15 0.969 93 0.95 95 0.96 17 67 14 68 9 4 ... 79 92 ... 96 ... 1.9 0.95 0.98 ... 96 14 11 110 1.01 110 0.98 66 1.16 107 1.03 86 1.06 108 1.01 4.9 2.0 ... ... ...
Cambodia 15,677 2,330 . … 74 0.76 74 0.80 2176 72 2,493 69 100 46 40 5 15 87 98 281 29 0.87 0.95 55 66 53 46 22 0.54 63 1.00 10 0.53 ... ... 16 0.53 ... ... 1.0 2.7 72 27 15
China 1,401,587 9,040 6-15 … 91 0.91 95 0.95 86314 72 53,881 73 29 15 10 36 70 ... ... ... ... 1.01 1.00 ... ... 22 18 76 0.93 104 1.02 37 ... 77 1.02 58 ... 89 1.02 1.9 ... 543 29 0
Democratic People's Republic of Korea 25,155 ... 5-16 … … … 100 1.00 ... ... 0.3 71 60 25 28 ... ... ... ... ... ... ... ... ... ... ... ... ... ... ... ... ... ... ... ... ... ... ... ... ... ... 4 2 1
Indonesia 255,709 4,730 7-15 0.937 90 0.92 93 0.94 14867 69 12,318 69 47 29 36 23 48 97 95 657 1 336 0.98 1.00 86 89 22 19 70 ... 91 1.04 40 ... 73 1.02 55 ... 83 1.03 2.8 2.8 410 172 6
Japan 126,818 36,750 6-15 0.994 … … … … ... … … … 5 3 ... 83 88 100 100 0.1 6 1.00 1.00 100 100 21 17 104 1.00 101 1.00 99 1.02 103 1.01 101 1.01 102 1.00 3.5 3.7 ... ... ...
Lao People's Democratic Republic 7,020 2,690 6-10 0.812 69 0.79 73 0.77 973 64 947 69 86 39 44 7 24 74 96 196 30 0.85 0.95 55 70 31 27 43 0.71 58 0.89 20 0.66 32 0.84 32 0.69 47 0.87 1.0 3.0 64 28 38
Macao, China 584 ... 5-15 … 91 0.92 96 0.96 30 74 21 76 10 5 ... 90 ... 85 ... 7 ... 0.99 ... ... 98 31 14 97 1.06 108 0.96 59 1.08 87 1.02 79 1.05 96 0.99 3.6 3.1 … … ...
Malaysia 30,651 16,270 6-11 … 89 0.93 93 0.95 1764 64 1,427 68 10 5 17 54 70 95 ... 148 ... 0.99 ... ... 99 20 12 93 1.03 92 0.91 45 1.20 49 1.06 66 1.09 67 0.97 6.1 6.1 38 3 ...
Myanmar 54,164 ... 5-9 … 90 0.92 93 0.95 3337 70 2,908 67 83 61 35 2 9 ... ... ... ... 0.97 0.99 55 75 31 28 36 0.93 58 1.03 25 1.14 35 1.11 32 0.98 50 1.05 0.6 0.8 64 45 10
Philippines 101,803 4,380 6-11 … 93 1.02 95 1.01 3806 44 2,647 46 37 26 32 30 ... 89 ... 1 254 ... 1.00 ... 75 ... 35 ... 78 1.07 ... ... 64 1.20 ... ... 74 1.10 ... ... 3.3 2.7 132 78 6
Republic of Korea 49,750 30,180 6-15 0.975 … … … … ... ... … … 7 4 ... ... 118 99 99 26 22 1.01 0.99 99 99 32 18 98 1.01 100 0.99 101 0.99 95 0.98 99 1.00 97 0.99 3.8 5.0 ... ... ...
Singapore 5,619 60,110 6-14 … 93 0.92 96 0.96 229 77 161 79 4 2 ... ... ... ... ... ... ... ... ... ... ... ... ... ... ... ... ... ... ... ... ... ... ... ... ... 3.3 3.1 ... ... ...
Thailand 67,401 9,280 6-15 … 93 0.95 96 1.00 3480 66 1,897 51 18 11 16 91 119 ... ... ... ... 0.97 0.95 82 ... 21 16 71 0.92 99 1.00 54 1.04 76 1.13 63 0.97 87 1.06 5.1 6.0 46 6 1
Timor-Leste 1,173 6,230 6-15 0.816 38 0.66 58 0.83 273 55 237 56 101 43 58 ... ... ... 92 ... 16 ... 0.95 ... 84 62 31 46 ... 62 1.02 27 ... 50 1.01 36 ... 57 1.02 ... 2.2 35 12 62
Viet Nam 93,387 3,620 6-14 … 90 0.92 94 0.95 5451 70 4,342 68 28 19 23 40 77 97 98 278 122 0.93 1.01 83 97 30 19 78 0.90 92 1.00 ... ... ... ... ... ... ... ... ... 6.5 253 65 10
The Pacific
Australia 28,519 42,540 5-17 0.984 … … … … ... … … … 6 4 ... 103 108 94 97 111 61 1.00 1.00 ... ... 18 ... 117 1.02 111 0.96 233 0.98 182 0.93 156 1.00 136 0.95 5.0 5.3 ... ... ...
Cook Islands 21 ... 5-15 … … … … … ... … … … ... ... ... 43 95 86 97 0.4 0.05 0.95 1.01 ... ... 18 15 80 0.99 99 0.96 39 1.29 74 1.08 60 1.08 88 1.00 ... 3.1 5 3 1,984
Fiji 893 4,690 6-17 0.933 … … … … ... … … … 26 19 ... 15 ... 94 99 6 1.3 0.99 1.01 82 97 28 28 94 1.09 98 1.09 57 1.15 76 1.15 78 1.11 88 1.11 5.3 4.3 24 5 54
Kiribati 106 3,870 6-14 … … … … … ... … … … 67 38 ... ... ... ... ... ... ... 1.01 ... 69 ... 25 ... 47 1.25 ... ... 76 1.22 ... ... 61 1.23 ... ... 6.7 ... 15 8 653
Marshall Islands 53 ... 6-14 … … … … … ... … … … ... ... ... 57 48 ... 100 ... 0.02 0.99 0.99 ... ... 15 ... 95 1.06 125 1.15 53 1.08 ... ... 68 1.06 ... ... 11.0 ... 28 24 2,828
Micronesia (Federated States of) 519 3,920 6-14 … … … … … ... … … … 40 26 ... 36 ... ... ... ... ... ... ... ... ... ... ... ... ... ... ... ... ... ... ... ... ... ... ... 6.2 ... 48 45 2,956
Nauru 10 ... 6-16 … … … … … ... … … … ... ... 24 74 79 ... 76 ... 0.3 1.33 1.03 ... ... 21 ... ... ... 78 0.93 ... ... 58 1.09 47 1.17 72 0.97 ... ... 5 1 714
New Zealand 4,596 32,620 6-16 0.986 … … … … ... … … … 7 5 ... 85 92 100 99 1.7 5.3 1.00 1.00 ... ... 18 15 101 0.99 105 0.99 126 1.13 138 1.11 111 1.05 120 1.05 7.0 7.8 ... ... ...
Niue 1 ... 5-16 … … … … … ... … … … ... ... ... 154 ... ... ... ... ... 1.00 ... ... ... 16 ... 91 0.88 ... ... 63 0.89 ... ... 98 1.10 ... ... ... ... 5 3 20,259
Palau 21 16,870 6-17 … … … 100 1.00 ... … … … ... ... ... 63 ... ... ... ... ... 0.93 ... ... ... 15 ... 101 0.97 ... ... 101 1.15 ... ... 101 1.07 ... ... 8.7 ... 1 0 341
Papua New Guinea 7,632 2,740 . … 57 0.80 63 0.92 1374 57 1,638 53 79 60 44 ... ... ... 87 ... 165 0.86 0.91 ... ... 35 ... ... ... 73 0.80 ... ... 22 0.68 ... ... 40 0.76 ... ... 103 46 36
Samoa 193 4,250 5-14 0.958 99 0.99 99 1.00 2 59 1 57 34 22 ... 50 34 93 96 2.1 1.1 1.00 1.00 90 90 24 30 98 1.05 103 1.02 71 1.15 78 1.16 79 1.11 86 1.11 4.5 ... 25 10 356
Solomon Islands 584 2,130 . … 77 0.82 … … 54 65 … … 78 44 33 35 43 ... ... ... ... 0.93 0.98 ... 63 19 24 ... ... 72 0.99 ... ... 29 0.86 26 0.75 48 0.94 ... 8.9 30 11 346
Tokelau 1 ... 5-16 … … … … … ... ... … … ... ... ... 99 ... ... ... ... ... 1.15 ... ... ... 10 ... 102 1.11 ... ... 78 0.85 ... ... 92 1.01 ... ... ... ... ... … ...
Tonga 106 5,020 6-14 … 99 1.00 99 1.00 0.6 47 0.6 48 29 23 ... 29 71 91 90 1.3 1.6 0.95 0.99 91 ... 21 21 112 1.08 ... ... 92 1.30 ... ... 105 1.14 104 0.97 5.2 ... 13 6 406
Tuvalu 10 ... 6-15 … … … … … ... … … … ... ... 10 96 ... ... ... ... ... ... ... ... ... 19 ... 96 1.11 ... ... 39 0.98 ... ... 80 1.10 ... ... ... ... 4 1 970
Vanuatu 264 4,300 . … … … … … ... … … … 48 26 26 51 61 98 ... 0.7 ... 0.98 0.99 69 ... 24 22 42 0.90 67 1.09 13 0.79 47 0.84 30 0.88 60 1.00 6.3 5.2 22 11 310
Sum Median Weighted average Sum % F Sum % FWeighted average Median
Weighted average
Weighted average Sum Sum
Weighted average Median
Weighted average Weighted average Weighted average Weighted average Median Sum
Weighted average
East Asia and the Pacific 2 280 457 4,730 ... … 92 0.93 95 0.96 127,020 70 88,067 70 34 19 ... 38 68 95 96 11,883 6,923 0.99 0.99 85 92 24 19 75 0.94 97 1.02 43 0.95 73 1.01 61 0.94 84 1.01 5.1 3.4 2,008 644 5
East Asia 2 236 926 7,635 ... … 92 0.93 95 0.96 125,443 71 86,212 71 34 19 32 38 67 95 96 11,474 6,686 0.99 0.99 86 93 24 19 75 0.94 97 1.02 42 0.95 72 1.01 60 0.94 84 1.01 3.3 3.0 … … …
Pacific 43 531 4,300 ... … … … … … … … … … 35 25 ... 67 93 88 94 409 238 0.97 0.97 ... ... 20 ... 91 0.99 102 0.95 142 1.00 102 0.95 109 0.99 102 0.95 6.3 … … … …
Developed countries 1 040 886 35,195 ... … … … … … … … … … 7 6 ... 75 88 98 96 1,427 2,347 1.01 0.99 93 94 16 14 101 0.99 103 0.99 97 1.04 100 0.99 99 1.02 101 0.99 5.0 5.4 … ... ...
Developing countries 5 944 265 4,820 ... … 77 0.84 80 0.87 775,715 64 771,717 64 82 67 29 27 49 82 90 102,930 54,876 0.91 0.97 72 72 29 26 65 0.89 82 0.97 37 0.86 56 0.95 51 0.88 69 0.96 4.4 4.7 … … …
World 7 291 097 8,370 ... … 82 0.89 84 0.91 786,523 64 780,682 64 75 49 25 33 54 84 91 105,769 57,788 0.92 0.97 75 75 26 24 71 0.92 85 0.98 45 0.91 62 0.96 59 0.91 73 0.97 4.5 5.0 12,584 5,079 8
e-mail: [email protected].: +33 1 45 68 09 52Fax: +33 1 45 68 56 41
www.efareport.unesco.org
United NationsEducational, Scientific and
Cultural Organization
Regional Overview:East Asia and the Pacific